egr111 project: marshmallow stick spring 2020
TRANSCRIPT

University of Portland - p. 1 of 7 - Project Marshmallow Stick - v10.docx
EGR111 Project: Marshmallow Stick Spring 2020
Problem Statement: Your manager asked your team to recommend a design for a marshmallow stick, and to simulate how heat transfers through the stick.
Graph Measured Temperatures: In order to demonstrate how heat transfers through a bar that is heated on one end, an aluminum bar was heated on one end for 14 minutes using an electric heater and the temperature was measured every two minutes at seven points along the bar using an infrared camera (see Appendix 1 for details). The Excel file alum_bar.xlsx, which is available on the course website, contains the resulting measured temperature data.
Write a MATLAB script file named measuredTemp.m to load the file alum_bar.xlsx into MATLAB and make a graph that shows the measured temperature at each node every 2 minutes (see Figure 1). The MATLAB command xlsread can be used to load in an Excel file (see the help file for details). If the temperature data is in an 8x7 matrix T, then the graph below can be generated using the command “plot(1:7,T)”. Comment the script file to document what it does and include the names of each team member.
Figure 1: Measured Temperatures for Aluminum Bar
1 2 3 4 5 6 7
Position (Node)
20
30
40
50
60
70
80
Tem
pera
ture
(C)
Measured Temp (alum)
t = 0 min
t = 2 min
t = 4 min
t = 6 min
t = 8 min
t = 10 min
t = 12 min
t = 14 min

University of Portland - p. 2 of 7 - Project Marshmallow Stick - v10.docx
Simulating Heat Transfer Previously in the Heat Transfer Lab, we assumed that the bar was held at a constant temperature on both ends, so we only needed a single equation to compute the temperature of the interior nodes. Now we are going to simulate heat transfer when one end of the bar is gradually heated. This situation requires three separate formulas: the temperature at the end-node that is being gradually heated (T1), the temperature at the interior nodes (T2 – T6), and the temperature at the other end-node (T7) (see Figure 2).
T5T1 T2 T3 T4 T7T6 Figure 2: Bar Diagram (Node 1 on the left side is heated)
The inputs to the simulation are shown below (use this order for the inputs to your function). 𝜌𝜌 - density of the material (in kg/m3) (2780 for aluminum) c - specific heat of the material (in J/kgK) (900 for aluminum) k - thermal conductivity of the material (in W/mK) (175 for aluminum) ∆𝑡𝑡 - time step in sec (let’s use 1 sec) D - diameter of bar in m (the aluminum bar diameter is 0.01 m) P - power of heater in W (let’s use 3 W) h - heat transfer coefficient (in W/m^2K) (let’s use 10 for free convection) 𝑇𝑇𝑖𝑖𝑖𝑖𝑖𝑖 - room temp in C or the temperature at the end of an infinitely long bar (let’s use 25 C) L - total length of the bar in m (the aluminum bar length is 0.3 m, which is about 12 inches) nodes - number of nodes (let’s use 7) totalTime - total time of simulation in sec (set to the number of seconds in 14 min) Your function can compute the following values from the inputs: ∆𝑥𝑥 is the distance between the nodes in m A is the cross-sectional area of the rod in m2 (assume a circular cross-section) 𝑇𝑇𝑖𝑖𝑖𝑖 is the temperature (in degrees C) of node i at time-step n. The formula for the end-node that is being heated (Ti for i=1) is given by the following equation:
𝑇𝑇𝑖𝑖𝑖𝑖 = 𝑇𝑇𝑖𝑖𝑖𝑖−1 +2∆𝑡𝑡
𝜌𝜌𝜌𝜌𝜌𝜌∆𝑥𝑥�𝑃𝑃 −
𝑘𝑘𝜌𝜌∆𝑥𝑥
(𝑇𝑇𝑖𝑖𝑖𝑖−1 − 𝑇𝑇𝑖𝑖+1𝑖𝑖−1) −ℎ𝜋𝜋𝜋𝜋∆𝑥𝑥
2�𝑇𝑇𝑖𝑖𝑖𝑖−1 − 𝑇𝑇𝑖𝑖𝑖𝑖𝑖𝑖��
University of Portland - p. 3 of 7 - Project Marshmallow Stick - v10.docx
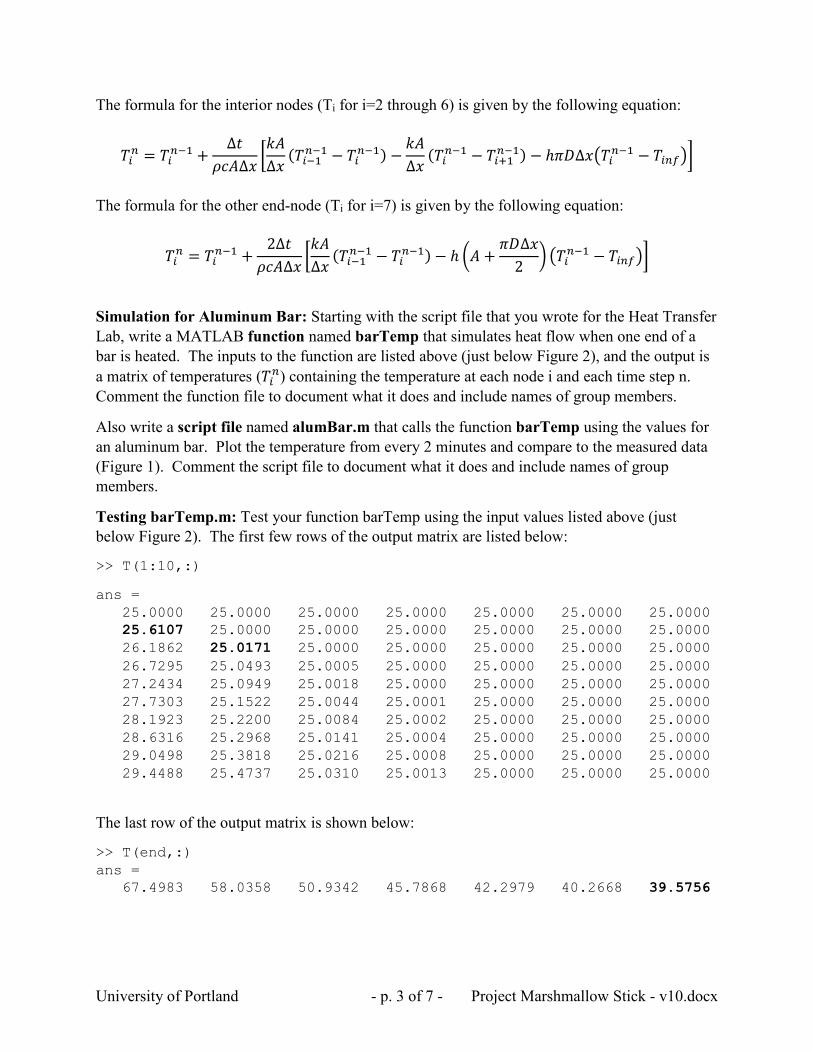
The formula for the interior nodes (Ti for i=2 through 6) is given by the following equation:
𝑇𝑇𝑖𝑖𝑖𝑖 = 𝑇𝑇𝑖𝑖𝑖𝑖−1 +∆𝑡𝑡
𝜌𝜌𝜌𝜌𝜌𝜌∆𝑥𝑥�𝑘𝑘𝜌𝜌∆𝑥𝑥
(𝑇𝑇𝑖𝑖−1𝑖𝑖−1 − 𝑇𝑇𝑖𝑖𝑖𝑖−1) −𝑘𝑘𝜌𝜌∆𝑥𝑥
(𝑇𝑇𝑖𝑖𝑖𝑖−1 − 𝑇𝑇𝑖𝑖+1𝑖𝑖−1) − ℎ𝜋𝜋𝜋𝜋∆𝑥𝑥�𝑇𝑇𝑖𝑖𝑖𝑖−1 − 𝑇𝑇𝑖𝑖𝑖𝑖𝑖𝑖��
The formula for the other end-node (Ti for i=7) is given by the following equation:
𝑇𝑇𝑖𝑖𝑖𝑖 = 𝑇𝑇𝑖𝑖𝑖𝑖−1 +2∆𝑡𝑡
𝜌𝜌𝜌𝜌𝜌𝜌∆𝑥𝑥�𝑘𝑘𝜌𝜌∆𝑥𝑥
(𝑇𝑇𝑖𝑖−1𝑖𝑖−1 − 𝑇𝑇𝑖𝑖𝑖𝑖−1) − ℎ �𝜌𝜌 +𝜋𝜋𝜋𝜋∆𝑥𝑥
2� �𝑇𝑇𝑖𝑖𝑖𝑖−1 − 𝑇𝑇𝑖𝑖𝑖𝑖𝑖𝑖��
Simulation for Aluminum Bar: Starting with the script file that you wrote for the Heat Transfer Lab, write a MATLAB function named barTemp that simulates heat flow when one end of a bar is heated. The inputs to the function are listed above (just below Figure 2), and the output is a matrix of temperatures (𝑇𝑇𝑖𝑖𝑖𝑖) containing the temperature at each node i and each time step n. Comment the function file to document what it does and include names of group members.
Also write a script file named alumBar.m that calls the function barTemp using the values for an aluminum bar. Plot the temperature from every 2 minutes and compare to the measured data (Figure 1). Comment the script file to document what it does and include names of group members.
Testing barTemp.m: Test your function barTemp using the input values listed above (just below Figure 2). The first few rows of the output matrix are listed below:
>> T(1:10,:)
ans = 25.0000 25.0000 25.0000 25.0000 25.0000 25.0000 25.0000 25.6107 25.0000 25.0000 25.0000 25.0000 25.0000 25.0000 26.1862 25.0171 25.0000 25.0000 25.0000 25.0000 25.0000 26.7295 25.0493 25.0005 25.0000 25.0000 25.0000 25.0000 27.2434 25.0949 25.0018 25.0000 25.0000 25.0000 25.0000 27.7303 25.1522 25.0044 25.0001 25.0000 25.0000 25.0000 28.1923 25.2200 25.0084 25.0002 25.0000 25.0000 25.0000 28.6316 25.2968 25.0141 25.0004 25.0000 25.0000 25.0000 29.0498 25.3818 25.0216 25.0008 25.0000 25.0000 25.0000 29.4488 25.4737 25.0310 25.0013 25.0000 25.0000 25.0000
The last row of the output matrix is shown below:
>> T(end,:) ans = 67.4983 58.0358 50.9342 45.7868 42.2979 40.2668 39.5756
University of Portland - p. 4 of 7 - Project Marshmallow Stick - v10.docx
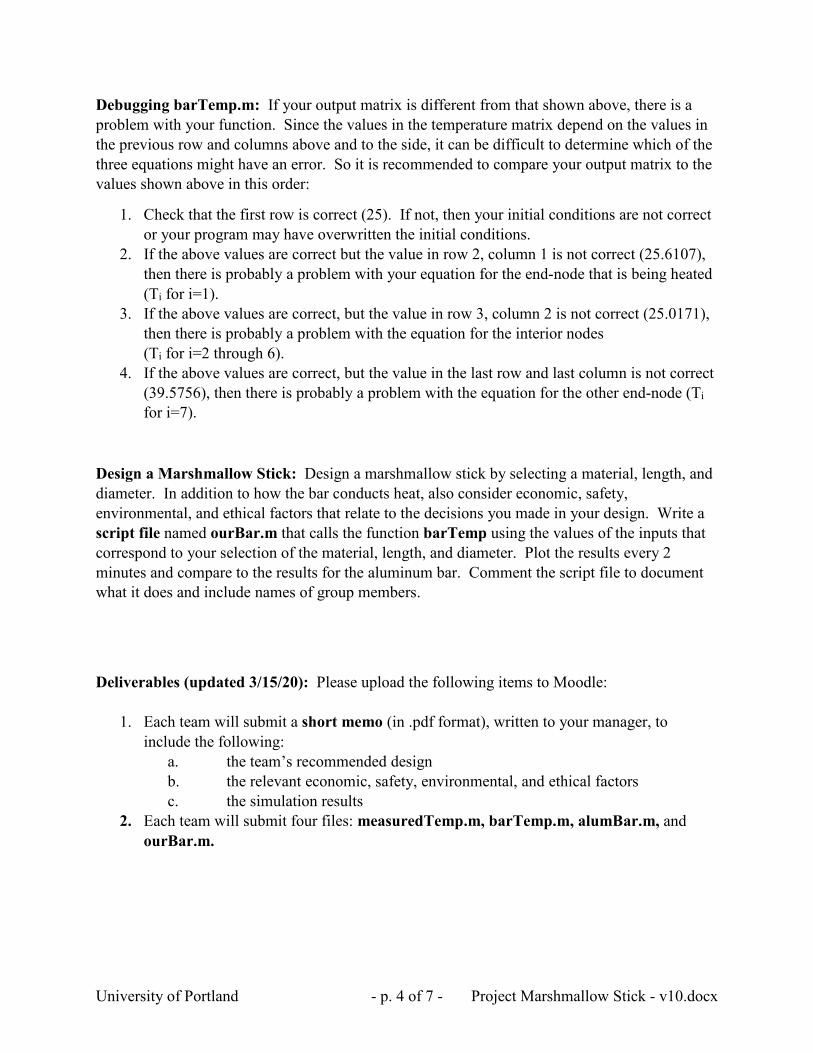
Debugging barTemp.m: If your output matrix is different from that shown above, there is a problem with your function. Since the values in the temperature matrix depend on the values in the previous row and columns above and to the side, it can be difficult to determine which of the three equations might have an error. So it is recommended to compare your output matrix to the values shown above in this order:
1. Check that the first row is correct (25). If not, then your initial conditions are not correct or your program may have overwritten the initial conditions.
2. If the above values are correct but the value in row 2, column 1 is not correct (25.6107), then there is probably a problem with your equation for the end-node that is being heated (Ti for i=1).
3. If the above values are correct, but the value in row 3, column 2 is not correct (25.0171), then there is probably a problem with the equation for the interior nodes (Ti for i=2 through 6).
4. If the above values are correct, but the value in the last row and last column is not correct (39.5756), then there is probably a problem with the equation for the other end-node (Ti for i=7).
Design a Marshmallow Stick: Design a marshmallow stick by selecting a material, length, and diameter. In addition to how the bar conducts heat, also consider economic, safety, environmental, and ethical factors that relate to the decisions you made in your design. Write a script file named ourBar.m that calls the function barTemp using the values of the inputs that correspond to your selection of the material, length, and diameter. Plot the results every 2 minutes and compare to the results for the aluminum bar. Comment the script file to document what it does and include names of group members.
Deliverables (updated 3/15/20): Please upload the following items to Moodle:
1. Each team will submit a short memo (in .pdf format), written to your manager, to include the following:
a. the team’s recommended design b. the relevant economic, safety, environmental, and ethical factors c. the simulation results
2. Each team will submit four files: measuredTemp.m, barTemp.m, alumBar.m, and ourBar.m.

University of Portland - p. 5 of 7 - Project Marshmallow Stick - v10.docx
Appendix 1: Experimental Setup
Small electric heaters were attached to one side of an aluminum bar and a steel bar, and the bars were held above the benchtop by wooden brackets (see Figure 3).
Figure 3: Experimental Setup
One end of each bar was heated and an infrared (IR) camera was used to take an image every 2 minutes. The temperature was then measured at 7 locations along each bar (the bars are 12 inches long (0.3 m) and have a diameter of 0.01 m). The 7 locations are marked T1 through T7 in Figure 3 and are spaced 2 inches apart. The measured temperature values are in the files steel_bar.xlsx and alum_bar.xlsx (which are available on the course website). The bars were painted black to improve the IR image quality.
The IR images are shown in Figures 4 through 11. These images have been rotated so that the heaters are at the bottom of the image, the steel bar is on the left side, and the aluminum bar is on the right side. Low temperatures are shown as blue, mid-range temperatues as red, and high temperatures as yellow (see the color scale on the left hand side of the images).

University of Portland - p. 6 of 7 - Project Marshmallow Stick - v10.docx
Figure 4: IR Image (0 Minutes) Figure 5: IR Image (2 Minutes)
Figure 6: IR Image (4 Minutes) Figure 7: IR Image (6 Minutes)

University of Portland - p. 7 of 7 - Project Marshmallow Stick - v10.docx
Figure 8: IR Image (8 Minutes) Figure 9: IR Image (10 Minutes)
Figure 10: IR Image (12 Minutes) Figure 11: IR Image (14 Minutes)