efficient ambient-air-stable solar cells with 2d–3d ... · *correspondence: prof. henry j....
TRANSCRIPT

In the format provided by the authors and unedited.
Supplementary Information Efficient and ambient-air-stable solar cells with 2D-3D hetero-structured butylammonium-caesium-formamidinium lead halide perovskites Zhiping Wang, Qianqian Lin, Francis P. Chmiel, Nobuya Sakai, Laura M. Herz, Henry J. Snaith* Clarendon Laboratory, Department of Physics, University of Oxford, Parks Road, Oxford, OX1 3PU, United Kingdom *Correspondence: Prof. Henry J. Snaith, [email protected]
Supplementary Figure 1| BA/FA/Cs perovskite precursor films. a, Photographs of BAx(FA0.83Cs0.17)1-xPb(I0.6Br0.4)3 perovskite precursor films (dried at 70C) with different BA concentration. b, Corresponding ultraviolent-visible absorption spectra. The dash lines are guides to the eye. c, Photoluminescence (PL) spectra. The inset shows the normalised PL spectra (note these “precursor” films are not fully crystalized via annealing). We first show that incorporation of the long-chain BA cation into the FA/Cs perovskite system has a strong influence upon the phase formation of the perovskite “precursor” films, i.e. the precursor phase formed after casting, prior to full crystallisation28. In Supplementary Figure 1a, we show photographs of a series of BAx(FA0.83Cs0.17)1-xPb(I0.6Br0.4)3 precursor films on fluorine doped tin oxide (FTO) substrates, after spin-coating the solutions and drying at 70 °C. The films display a gradual darkening in colour, and a shift from yellow to red, with increasing BA
Efficient ambient-air-stable solar cells with 2D–3Dheterostructured butylammonium-caesium-
formamidinium lead halide perovskites
© 2017 Macmillan Publishers Limited, part of Springer Nature. All rights reserved.
SUPPLEMENTARY INFORMATIONVOLUME: 2 | ARTICLE NUMBER: 17135
NATURE ENERGY | DOI: 10.1038/nenergy.2017.135 | www.nature.com/natureenergy 1

concentration, apart from the neat BA (x = 1) film, which displays a light yellow colour. To better understand this colour change phenomenon, we perform ultraviolent-visible (UV-Vis) absorption and photoluminescence (PL) spectroscopy on these pre-crystallised films. As we show in Supplementary Figure 1b, the incorporation of BA appears to enhance the absorption strength, but with the onset remaining approximately constant, until x = 0.5 where we observe a redshift. We further record PL spectra of these precursor films, which we show in Supplementary Figure 1c. The precursor film without any BA substitution is barely emissive. However, a considerable PL peak emerges at around 555 nm, once 3% BA cations are introduced, which continues to increase in strength with additional BA addition. Upon 50% substitution, we observe a significant red shit in the PL spectrum centred on 645nm, consistent with the emergence of a new, lower energy, precursor phase. Notably, this PL emission wavelength is a long way from the expected 720nm emission from the FA0.83Cs0.17Pb(I0.6Br0.4)3 perovskite, consistent with it arising from a precursor phase, rather than the perovskite.
© 2017 Macmillan Publishers Limited, part of Springer Nature. All rights reserved.
NATURE ENERGY | DOI: 10.1038/nenergy.2017.135 | www.nature.com/natureenergy 2
SUPPLEMENTARY INFORMATION
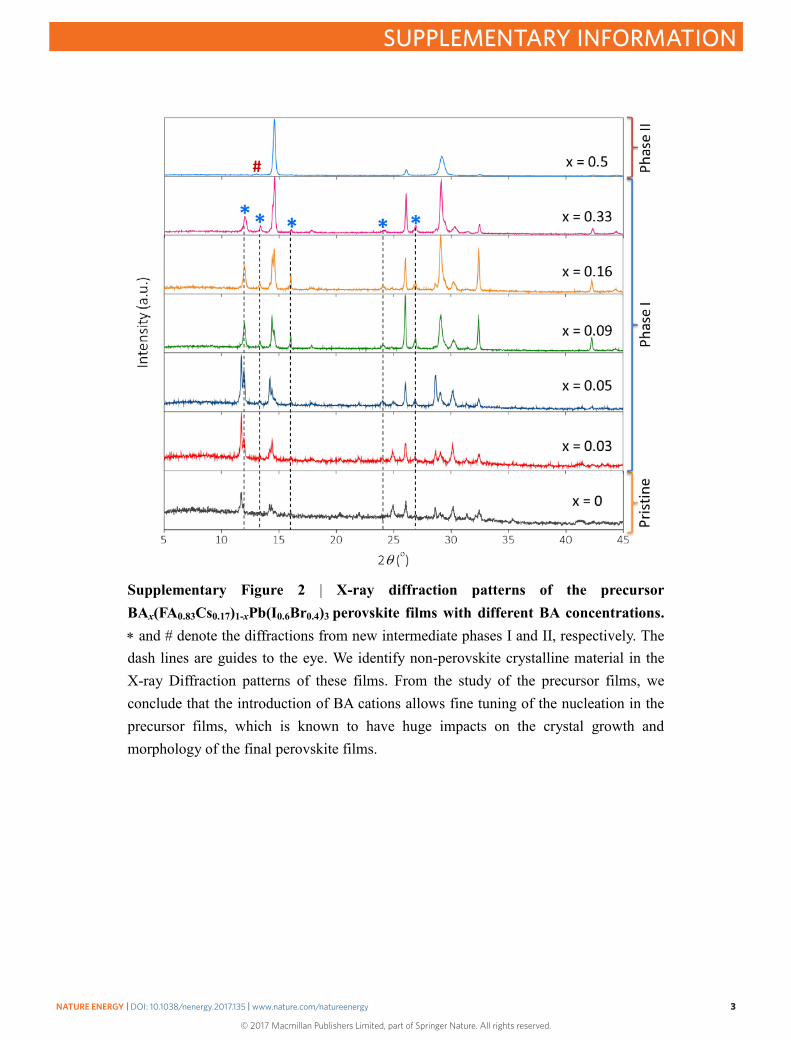
Supplementary Figure 2 | X-ray diffraction patterns of the precursor BAx(FA0.83Cs0.17)1-xPb(I0.6Br0.4)3 perovskite films with different BA concentrations. and # denote the diffractions from new intermediate phases I and II, respectively. The dash lines are guides to the eye. We identify non-perovskite crystalline material in the X-ray Diffraction patterns of these films. From the study of the precursor films, we conclude that the introduction of BA cations allows fine tuning of the nucleation in the precursor films, which is known to have huge impacts on the crystal growth and morphology of the final perovskite films.
© 2017 Macmillan Publishers Limited, part of Springer Nature. All rights reserved.
NATURE ENERGY | DOI: 10.1038/nenergy.2017.135 | www.nature.com/natureenergy 3
SUPPLEMENTARY INFORMATION

Supplementary Figure 3 | X-ray diffraction peak indexing of FA0.83Cs0.17Pb(I0.6Br0.4)3 (x = 0) and BA0.09(FA0.83Cs0.17)0.91Pb(I0.6Br0.4)3 (x = 0.09) perovskite films. denotes the diffractions from new phases. Note that the intensity of the x = 0 film is amplified by 5 times.
© 2017 Macmillan Publishers Limited, part of Springer Nature. All rights reserved.
NATURE ENERGY | DOI: 10.1038/nenergy.2017.135 | www.nature.com/natureenergy 4
SUPPLEMENTARY INFORMATION

Supplementary Figure 4 | Variations of lattice constant. a, Normalized 3D perovskite (100) peak profiles. b, Lattice constant plotted as a function of BA content. We use least-squares refinement of a Lorentzian profile to fit the (100) Bragg reflection of the 3D perovskite.
© 2017 Macmillan Publishers Limited, part of Springer Nature. All rights reserved.
NATURE ENERGY | DOI: 10.1038/nenergy.2017.135 | www.nature.com/natureenergy 5
SUPPLEMENTARY INFORMATION

Supplementary Figure 5 | Performance parameters of BAx(FA0.83Cs0.17)1-xPb(I0.6Br0.4)3 perovskite solar cell devices with different BA concentrations. a, power conversion efficiency (PCE). b, stabilised power output (SPO). Each average (line in the middle of the box) and standard deviation (error bar) was calculated from the solar cell characteristics. The device configuration is FTO/SnO2/doped PCBM/perovskite/spiro-OMeTAD (doped with Li-TFSI and tBP)/Au. The upper and lower error bars represent the maximum and minimum values respectively, and the mid-line in each box represents the median value. The top and the bottom of the box represent the upper quartile (75th percentile) and lower quartile (25th percentile) respectively, and box height represents the interquartile range.
© 2017 Macmillan Publishers Limited, part of Springer Nature. All rights reserved.
NATURE ENERGY | DOI: 10.1038/nenergy.2017.135 | www.nature.com/natureenergy 6
SUPPLEMENTARY INFORMATION

Supplementary Figure 6 | Performance parameters of perovskite solar cell devices using FA0.83Cs0.17Pb(I0.6Br0.4)3 (x = 0) and BA0.09(FA0.83Cs0.17)0.91Pb(I0.6Br0.4)3 (x = 0.09) perovskite active layers. a, Short-circuit current density (Jsc). b, Open-circuit voltage (Voc). c, Fill factor (FF). d, PCE. e, SPO. f, SPO ratio, stands for the ratio between SPO and J-V scanned PCE. The upper and lower error bars represent the maximum and minimum values respectively, and the mid-line in each box represents the median value. The top and the bottom of the box represent the upper quartile (75th percentile) and lower quartile (25th percentile) respectively, and box height represents the interquartile range.
© 2017 Macmillan Publishers Limited, part of Springer Nature. All rights reserved.
NATURE ENERGY | DOI: 10.1038/nenergy.2017.135 | www.nature.com/natureenergy 7
SUPPLEMENTARY INFORMATION

Supplementary Figure 7 | External quantum efficiency (EQE) spectra of wide band gap perovskite devices. EQE spectra of FA0.83Cs0.17Pb(I0.6Br0.4)3 (labelled as x = 0) and BA0.09(FA0.83Cs0.17)0.91Pb(I0.6Br0.4)3 (labelled as x = 0.09) perovskite device measured at short-circuit, along with the expected photocurrent integrated over the AM1.5 solar spectrums of 100 mW cm-2. The specific cells measured here had a Jsc of 18.9 mA cm-2 for both of the x = 0 and 0.09 devices. The integrated EQE is 18.6 mA cm-2 for both devices. This is within 5% difference which is within the accuracy confidence of the measurements.
© 2017 Macmillan Publishers Limited, part of Springer Nature. All rights reserved.
NATURE ENERGY | DOI: 10.1038/nenergy.2017.135 | www.nature.com/natureenergy 8
SUPPLEMENTARY INFORMATION

Supplementary Figure 8 | Performance parameters of perovskite solar cell devices using a BA0.05(FA0.83Cs0.17)0.95Pb(I0.8Br0.2)3 active layer. The histogram bars together with the probability (fitted by normal probability plot) represent the distribution of the device performance.
© 2017 Macmillan Publishers Limited, part of Springer Nature. All rights reserved.
NATURE ENERGY | DOI: 10.1038/nenergy.2017.135 | www.nature.com/natureenergy 9
SUPPLEMENTARY INFORMATION

Supplementary Figure 9 | External quantum efficiency (EQE) spectrum of a BA0.05(FA0.83Cs0.17)0.95Pb(I0.8Br0.2)3 perovskite device measured at short-circuit, along with the expected photocurrent integrated over the AM1.5 solar spectrums of 100 mW cm-2. The specific cell measured here had a Jsc of 22.69 mA cm-2 and the integrated EQE is 21.61 mA cm-2. This is within 5% difference which is within the accuracy confidence of the measurements.
© 2017 Macmillan Publishers Limited, part of Springer Nature. All rights reserved.
NATURE ENERGY | DOI: 10.1038/nenergy.2017.135 | www.nature.com/natureenergy 10
SUPPLEMENTARY INFORMATION

Supplementary Figure 10 | Determination of the Band gap. a, Tauc plot of a wide band gap BA0.09(FA0.83Cs0.17)0.91Pb(I0.6Br0.4)3 film from the UV-Vis spectroscopy to determine Eg under the assumption of a direct band gap1, b, inflection point of EQE graph of a BA0.09(FA0.83Cs0.17)0.91Pb(I0.6Br0.4)3 perovskite solar cell device showing the effective band gap2, c, Tauc plot of a low band gap BA0.05(FA0.83Cs0.17)0.95Pb(I0.8Br0.2)3 film, d, inflection point of EQE graph of a BA0.05(FA0.83Cs0.17)0.95Pb(I0.8Br0.2)3 perovskite solar cell device. We note that the bandgap of the 2D-3D perovskite composite films are dominated by the 3D perovskite crystals, considering the low content of BA. The blue squares in (a) and (c) represent the UV-Vis spectra of the perovskite films and the red lines are the Tauc plot fittings. The blue curves in (c) and (d) are the EQE spectra of perovskite devices and the red lines are the derivative of the EQE spectra, i.e. dEQE/dE.
© 2017 Macmillan Publishers Limited, part of Springer Nature. All rights reserved.
NATURE ENERGY | DOI: 10.1038/nenergy.2017.135 | www.nature.com/natureenergy 11
SUPPLEMENTARY INFORMATION

Supplementary Figure 11 | Devices fabricated in air with a humidity of 46 RH%. a, Bright-field optical microscopy (BF-OM) image of FA0.83Cs0.17Pb(I0.6Br0.4)3 (labelled as x = 0), b, BF-OM image of BA0.09(FA0.83Cs0.17)0.91Pb(I0.6Br0.4)3 (labelled as x = 0.09), c and d, show OM images of x = 0 and x = 0.09 films using transmission mode. The bright field in c represents pinhole formation in the film. The scale bars in the microscopy images are 100 m. e, X-ray diffraction patterns of the films, f, Current-densityvoltage (J-V) characteristics of perovskite devices using x = 0 and x = 0.09 photoactive layers. The power conversion efficiency are 5.9% and 14.3 % for the x = 0 and x = 0.09 devices, respectively. The pristine film processed in humid air shows a discontinuous morphology containing a large amount of pinholes, while the BA/FA/Cs based perovskite film show a pinhole-free morphology and greatly enhanced crystallinity. The BA-based device processed in air shows a champion efficiency of 14.3%
© 2017 Macmillan Publishers Limited, part of Springer Nature. All rights reserved.
NATURE ENERGY | DOI: 10.1038/nenergy.2017.135 | www.nature.com/natureenergy 12
SUPPLEMENTARY INFORMATION

which is 2.5 times larger than the pristine FA/Cs device efficiency of 5.9%. This technique has great potential in a scalable commercial process for fabricating perovskite devices without the requirement for a stringently controlled manufacturing environment.
© 2017 Macmillan Publishers Limited, part of Springer Nature. All rights reserved.
NATURE ENERGY | DOI: 10.1038/nenergy.2017.135 | www.nature.com/natureenergy 13
SUPPLEMENTARY INFORMATION

Supplementary Figure 12 | Stability parameters of non-encapsulated perovskite solar cells using FA0.83Cs0.17Pb(I0.6Br0.4)3 (x = 0) and BA0.09(FA0.83Cs0.17)0.91Pb(I0.6Br0.4)3 (x = 0.09) perovskite active layers. The dashed lines are linear fits to the latter section of the decay. The time to 80% of the post burn-in decay (t80) are shown on the graph (with the t0 efficiency extrapolated back to the y-axis from the linear fit).
© 2017 Macmillan Publishers Limited, part of Springer Nature. All rights reserved.
NATURE ENERGY | DOI: 10.1038/nenergy.2017.135 | www.nature.com/natureenergy 14
SUPPLEMENTARY INFORMATION

Supplementary Figure 13 | Stability parameters of encapsulated perovskite solar cells using FA0.83Cs0.17Pb(I0.6Br0.4)3 (x = 0) and BA0.09(FA0.83Cs0.17)0.91Pb(I0.6Br0.4)3 (x = 0.09) perovskite active layers. The dashed lines are linear fits to the latter section of the decay. The time to 80% of the post burn-in decay (t80) are shown on the graph (with the t0 efficiency extrapolated back to the y-axis from the linear fit).
© 2017 Macmillan Publishers Limited, part of Springer Nature. All rights reserved.
NATURE ENERGY | DOI: 10.1038/nenergy.2017.135 | www.nature.com/natureenergy 15
SUPPLEMENTARY INFORMATION

Supplementary references 1. Kim, Y. et al. Pure Cubic-Phase Hybrid Iodobismuthates AgBi2I7for Thin-Film
Photovoltaics. Angew. Chemie. Int. Ed. 55, 9586–9590 (2016). 2. Emrani, A., Vasekar, P. & Westgate, C. R. Effects of sulfurization temperature
on CZTS thin film solar cell performances. Sol. Energy 98, 335–340 (2013).
© 2017 Macmillan Publishers Limited, part of Springer Nature. All rights reserved.
NATURE ENERGY | DOI: 10.1038/nenergy.2017.135 | www.nature.com/natureenergy 16
SUPPLEMENTARY INFORMATION