effects on anti-aging indicators in middle-aged men … on anti-aging indicators in middle-aged men...
TRANSCRIPT

Ryo Miyazaki,Anti-Aging Medical Research Center Graduate School of Life and Medical Science, Doshisha University
1-3 Tatara Miyakodani, Kyotanabe, Kyoto 610-0321 JAPANTel & Fax: +81-(0)774-65-6382 / Fax: +81-(0)774-65-6394 / E-mail: [email protected]
Anti-Aging Medicine 6 (9) : 83-94, 2009(c) Japanese Society of Anti-Aging Medicine
Original Article
Effects on Anti-Aging Indicators in Middle-Aged Men of An Intervention to Prevent Lifestyle-Related Diseases: Pilot Study Utilizing a Company-Wide Anti-Aging Medical Checkup and Pedometers
83
Objective: To-date, in middle-aged men the collection of data regarding the measurement of a wide range of health indicators, and the mutual relationships among these indicators, has been insufficient. Here, we evaluated from the viewpoint of anti-aging medicine, the effects on various anti-aging indicators in middle-aged men of a long-term intervention to prevent lifestyle-related diseases. Methods: Subjects were 18 male employees (mean age, 54.4 ± 7.4 years; mean body weight 77.5 ± 12.5 kg; mean BMI, 26.1 ± 3.6 kg/m2) of a machine manufacturer located in Kyoto City on whom a company-wide anti-aging medical checkup was performed. On the basis of the medical checkup results, exercise and nutritional instructions were given to the study subjects. In addition, subjects were lent pedometers and encouraged to walk, and the data recording the number of steps taken was collected once every four weeks. Anti-aging related indicators were measured before the study as well as 12 and 24 weeks thereafter. Muscle mass was measured with a body composition measuring device by bioelectrical impedance analysis (Physion MD), higher-brain functions were determined by the Wisconsin card sorting test (WCST), the degree of arteriosclerosis was evaluated by acceleration plethysmography (SDP-100), and bone mineral density was measured by ultrasonography (A-1000).Results: Over the 24-week intervention, of the prescribed instructions, the best compliance was found for walking. Twenty-four weeks after the start of intervention, a significant reduction was noted among the anthropometric parameters of body weight (– 2.7%, p = 0.021), BMI (– 2.7%, p = 0.020), systolic blood pressure (– 7.3%, p = 0.014), and diastolic blood pressure (– 11.7%, p = 0.002), and among the blood biochemistry parameters of LDL-cholesterol (– 9.8%, p = 0.002), IGF-I (– 25.4%, p < 0.001), and insulin (– 20.4%, p = 0.002). Results from muscle mass measurement, acceleration plethysmography, WCST, DHEA and bone mineral density tests did not change. The mean number of steps taken during the period of intervention was 9,592 ± 1,978 steps/day. Analysis for correlation between the mean number of steps and a change from baseline (Δ) in the individual parameters revealed a positive correlation with Δcortisol and ΔLDL-cholesterol, and a negative correlation with ΔHbA1c (p < 0.05). A sub-class analysis provided a significant correlation between Δmuscle mass and the mean number of steps for an 18-week period after excluding the coldest and hottest seasons from the period of intervention. The sub-class analysis by site revealed a positive correlation with Δmuscle mass of trunk (r = 0.63) and Δmuscle mass of thigh (r = 0.55) (p < 0.01). No adverse events were noted.Conclusion: The 24-week intervention significantly improved many of the health indicators studied, indicating the utility of a company-wide anti-aging medical checkup and the use of pedometers. In the future, relationships between changes in the number of steps and changes in anti-aging indicators warrant further investigation to refine the intervention methodology.
Abstract
Ryo Miyazaki 1), Tsutomu Hasegawa 1), Noriko Fujioka 1), Masaaki Iwabayashi 1), Keitaro Nomoto 1), Hozumi Takahashi 1), Umenoi Hamada 1), Hiroshi Ichikawa 1), Kojiro Ishii 2), Yoshikazu Yonei 1)
1) Anti-Aging Medical Research Center, Graduate School of Life and Medical Science, Doshisha University
2) Faculty of Health and Sports Science, Doshisha University
KEY WORDS: visceral fats, blood pressure, walking, pedometer, insulin resistance
Received: Sep. 10, 2009Accepted: Nov. 26, 2009Published online: Dec. 7, 2009
Introduction Lifestyle-related diseases have been increasing steadily in recent years. These diseases are known to occur frequently in middle-aged and elderly persons 1,2). In 2008, the Japanese Ministry of Health, Labor and Welfare (MHLW) therefore started to undertake specific health checkup and special health guidance for those aged ≥ 40 and < 74 years for the purpose of preventing lifestyle-related diseases. Increased visceral fat from overeating and lack of exercise may cause lifestyle-related diseases, with this fat apt to accumulate in middle-aged men, namely those who are in the prime of working life. Usually, they do not experience subjective symptoms while middle-aged and do not develop serious disease until entering advanced age. Prevention of lifestyle-related diseases in middle-aged men is therefore an important focus in anti-aging medicine. Common medical examinations, however, focus on items designated by the special medical checkup and rarely consider anti-aging indicators. Further, no studies investigating effects on muscle mass, bone mineral density, and other health indicators from blood biochemistry including hormones have been reported. Moreover, where any future impaired physical function may manifest is unknown. Aging is roughly divided into healthy aging and unhealthy aging, with some researchers reporting that the aging process varies only slightly among young individuals but varies more greatly among middle-aged and elderly persons 3-5). The collection of data for a wide range of health indicators, and for mutual relationships among such indicators, has so-far been insufficient in middle-aged men. Against this background, the present study was undertaken to evaluate the effects on various anti-aging indicators in middle-aged men of a long-term intervention, which was based on a company-wide anti-aging medical checkup, to prevent lifestyle-related diseases.
Methods Subjects The subjects were 18 male employees of a machine manufacturer (Murata Kikai Co., Ltd. (Kyoto-city, Kyoto)), aged ≥ 40 and ≤ 65 years (mean, 54.4 ± 7.4 years), with a BMI exceeding 23 (mean, 26.1 ± 3.6 kg/m2) who gave written informed consent to participate in the study. Of the 18, 3 men were on medication for type 2 diabetes mellitus, 6 men had borderline type 2 diabetes mellitus, and 9 men had borderline hypertension. Before starting the study, those responsible for selecting the subjects gave a thorough explanation to the subjects regarding the study period, where the study would be undertaken, and the study methods, as well as the expected benefits and potential disadvantages of the study towards the subjects. Each subject decided of his own accord to participate in the study by written informed consent. Further, after giving consent for participation, a subject was allowed to withdraw his consent for any reason without fear of being disadvantaged in any way.
Evaluation of subjective symptoms Subjective symptoms were evaluated by dividing them into two categories, “physical symptoms” and “mental symptoms.” As previously reported 6,7), the Anti-Aging QOL Common Questionnaire (AAQol) was used to rate individual symptoms according to a
84
Lifestyle and Anti-Aging Indicators of Middle-Aged Men
5-grade scale ranging from 1 to 5 points. This Questionnaire was downloaded from the Web site of the Japanese Society of Anti-Aging Medicine (http://www.anti-aging.gr.jp/anti/clinical. html). The Questionnaire was performed eight times in total, once every four weeks, during the intervention. Each time the Questionnaire was performed, with an aim of improving health awareness, each subject was informed of his functional age. Moreover, for the purpose of encouraging subjects to change their behavior, they were informed of their functional age using the anti-aging assessment system 8).
Anthropometry and clinical laboratory tests Anthropometry, physical examination, blood biochemistry and urinalysis were performed a total of three times on Weeks 0, 12 and 24.
Evaluation of aging-related physical functions To evaluate aging-related physical functions, measurement of muscle mass and bone mass, endocrinology, examination for arteriosclerosis, and assessment of higher-brain functions were performed. Muscle mass was determined with a bioelectrical impedance analyzer for muscle mass (Physion MD (Kyoto-city, Kyoto)) 9). Measurements obtained with this analyzer correlate highly with MRI data, with correlation coefficients of 0.940 for the upper extremity, 0.917 for the lower leg, 0.968 for the upper arm, and 0.901 for the thigh 10). The large-scale data regarding the measurement of body fat amount, percentage body fat, lean body mass, water content, muscle mass, bone mass, and muscle mass of the upper arm, forearm, thigh, crus and quadriceps muscle with this analyzer in 10,335 healthy Japanese individuals (4,365 men and 5,970 women) have been reported 11). Higher brain functions were determined by the Wisconsin card sorting test (WCST) 12-15). The degree of arteriosclerosis was evaluated with an acceleration plethysmogram (Dynapulse SDP-100, Fukuda Denshi Co., Ltd (Bunkyo-ku, Tokyo)) 16,17) and the results were expressed as a vascular age 18). Bone mineral density was determined by ultrasonography 19-21) (A-1000, GE Yokogawa Medical Systems, Ltd., (Tachikawa-city, Tokyo)).
Exercise instruction and nutritional instruction These instructions were individually provided to the subjects based on their medical checkup results in Weeks 0 and 24. Specifically, medical laboratory technicians, registered dietitians, and health fitness instructors provided each subject with their individually tailored exercise and nutritional instructions. Exercise instruction was provided by a physical therapist qualified as a health fitness instructor. The therapist checked the data on how much each subject walked and encouraged him to walk more. The therapist also educated the subjects regarding physical and muscle building exercises that they could perform at home. Eight types of exercises were provided in these instructions, namely walking, squats, sit-ups, back-strengthening exercises, push-ups, arm curls, kick back and chest press. An example of the instructed exercise program is shown in Table 1. Nutritional instruction was provided by medical laboratory technicians and registered dietitians, who planned the diets for each subject based on his hematologic data, and provided simple instructions such as the order in which to eat various foods at mealtime.

85
Table 1 Example of an prescribed exercise program
LoadType of exercise
WalkingSquatsSit-upsBack-strengthening exercisesPush-upsArm curlKick backChest press
Thera-Band RedThera-Band RedThera-Band Red
40 minutes10 times×2 sets10 times×2 sets15 times10 times10 times×2 sets10 times×2 sets10 times
≥4 times per week3 times per week3 times per week3 times per week3 times per week3 times per week3 times per week3 times per week
>70%30 ~ 50%30 ~ 50%30 ~ 50%
<30%<30%<30%<30%
Minutes Frequency Compliance
Further, the Anti-Aging Dock was performed on subjects to provide them with a source of motivation. In this Dock, using the Age Management Check system (http://www.amc-s.com/promo/ index.htm, Ginga Kobo, (Nagoya-city, Aichi)), a relative functional age for muscles, blood vessels, nerves, hormones, and bones was calculated based on population information taken for each of these parameters, and each subject was notified of his resultant functional age 3,4,8). This process was intended to help each subject recognize his own weak points related to aging and to encourage him to try to rejuvenate his body, and hence facilitating a change in his behavior. The period of intervention was 24 weeks. During the study period, the subjects were asked to maintain their ordinary daily lives except for those related to the nutritional and exercise instructions given to them. The subjects were also instructed to avoid lack of sleep. The intervention commenced on December 18, 2007 and was completed on September 30, 2008. Each subject was allowed to borrow a pedometer (HJ-710IT, Omron Corporation (Kyoto-city, Kyoto)) as previously reported 22,23). The pedometer automatically recorded the number of steps taken (a maximum of 42 days-worth of data could be retained) and this data was regularly collected once-a-month. This pedometer enabled each subject to check on its display at any time the data recorded for a 7-day period prior to a given day, broken down into parameters such as “number of steps”, “energy consumed”, and “distance walked.” This pedometer also measures the amount of physical exercise undertaken, and accordingly it has been reported as effective in increasing physical exercise 24). Information regarding the number of steps taken was transferred by USB cable to a personal computer and managed with dedicated software (Omron Corporation (Kyoto-city, Kyoto)). The mean number of steps taken for the first week of the intervention was regarded as the data for “the start of the intervention (in Week 0)”.
Ethical considerations The present study was performed after it had obtained the approval of the ethical committee of Doshisha University, in compliance with ethical principles prescribed by the study protocol, the Declaration of Helsinki (modified at the General Assembly in Edinburgh in the year 2000) and the Ethical Guidelines for Epidemiological Research issued by the Ministry of Labour, Health and Welfare and the Ministry of Education, Science and Culture (http://www.mhlw.go.jp/general/seido/kousei/ i-kenkyu/sisin2.html).
Statistical analysis ANOVA was used to compare the measurements from Weeks
0, 12 and 24. Paired t-test was used to compare baseline values obtained prior to study initiation to those obtained in Week 24 . Wilcoxon’s signed rank test was used when data did not show normal distribution or homogeneity. Muscle strength data was not available for two participants prior to study initiation, for three in Week 12, and for one in Week 24 due to participant refusal, and consequently these data were not included in the analysis. One subject was excluded from analysis of the number of steps taken as he used his own pedometer. One subject did not disclose that he had a long-standing history of angina and participated in the study. He developed a myocardial infarction three days after the medical checkup and was hospitalized. This subject was excluded from all analyses. All data was expressed as mean ± standard deviation (SD) and the significance level was set at p < 0.05. Statistical analyses were performed with SPSS for Windows Ver.15.0 (SPSS for Windows Ver.15.0 (SPSS Japan, Shibuya-ku,Tokyo)).
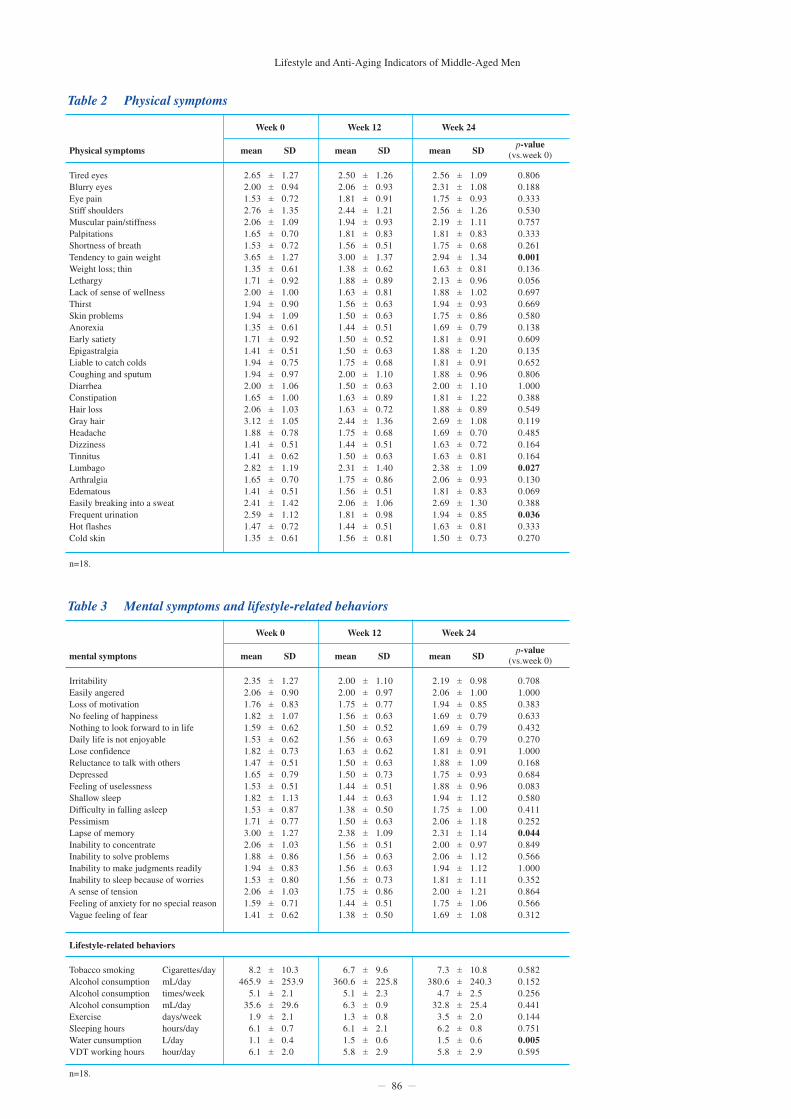
Results Subjective symptoms evaluated by the AAQol Three of the 34 physical symptoms, namely “tendency to gain weight”, “lumbago”, and “frequent urination” (Table 2), and 1 of the 21 mental symptoms, namely “memory lapse”, (Table 3) improved significantly by Week 24. Concerning lifestyle-related behaviors, water consumption increased from 1.05 ± 0.40 L/day to 1.50 ± 0.58 L/day (p = 0.005).
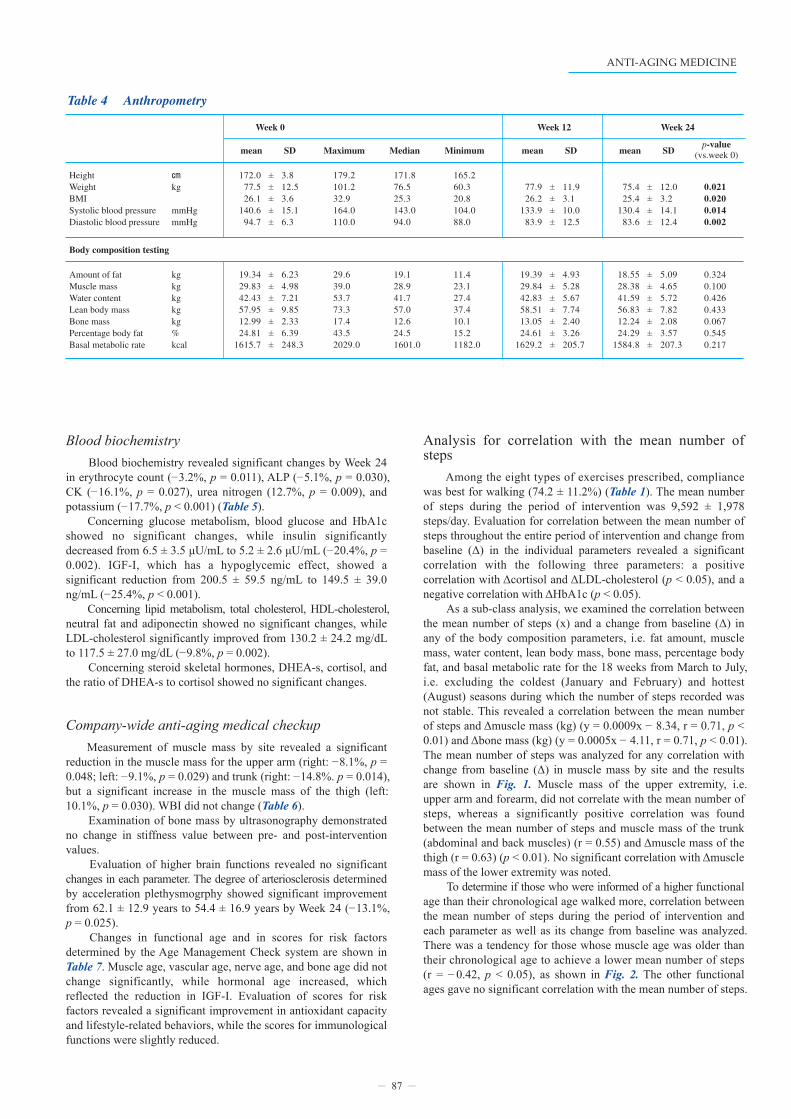
Anthropometry Comparison of pre- and post-intervention data revealed a significant reduction in body weight (from 77.5 ± 12.5 kg to 75.4 ± 12.0 kg (– 2.7%, p = 0.021)) and BMI (from 26.1 ± 3.6 to 25.4 ± 3.2 (– 2.7%, p = 0.020) (Table 4). Systolic blood pressure significantly decreased from 140.6 ± 15.1 mmHg to 130.4 ± 14.1 mmHg (– 7.3%, p = 0.014), as did diastolic blood pressure from 94.7 ± 6.3 mmHg to 83.6 ± 12.4 mmHg (– 11.7%, p = 0.002). Body composition data obtained by bioelectrical impedance analysis indicated no significant changes between pre- and post- intervention data concerning fat amount, muscle mass, water content, lean body mass, bone mass, percentage body fat, and basal metabolic rate.
n=18.
n=18.
Lifestyle and Anti-Aging Indicators of Middle-Aged Men
86
Table 2 Physical symptoms
mean SDPhysical symptoms
Week 0
Tired eyesBlurry eyesEye painStiff shouldersMuscular pain/stiffnessPalpitationsShortness of breathTendency to gain weightWeight loss; thinLethargyLack of sense of wellnessThirstSkin problemsAnorexiaEarly satietyEpigastralgiaLiable to catch coldsCoughing and sputumDiarrheaConstipationHair lossGray hairHeadacheDizzinessTinnitusLumbago ArthralgiaEdematousEasily breaking into a sweatFrequent urinationHot flashesCold skin
2.65 2.00 1.53 2.76 2.06 1.65 1.53 3.65 1.35 1.71 2.00 1.94 1.94 1.35 1.71 1.41 1.94 1.94 2.00 1.65 2.06 3.12 1.88 1.41 1.41 2.82 1.65 1.41 2.41 2.59 1.47 1.35
1.27 0.94 0.72 1.35 1.09 0.70 0.72 1.27 0.61 0.92 1.00 0.90 1.09 0.61 0.92 0.51 0.75 0.97 1.06 1.00 1.03 1.05 0.78 0.51 0.62 1.19 0.70 0.51 1.42 1.12 0.72 0.61
±±±±±±±±±±±±±±±±±±±±±±±±±±±±±±±±
0.806 0.188 0.333 0.530 0.757 0.333 0.261 0.001 0.136 0.056 0.697 0.669 0.580 0.138 0.609 0.135 0.652 0.806 1.000 0.388 0.549 0.119 0.485 0.164 0.164 0.027 0.130 0.069 0.388 0.036 0.333 0.270
n=18.
p-value(vs.week 0)mean SD
Week 12
2.50 2.06 1.81 2.44 1.94 1.81 1.56 3.00 1.38 1.88 1.63 1.56 1.50 1.44 1.50 1.50 1.75 2.00 1.50 1.63 1.63 2.44 1.75 1.44 1.50 2.31 1.75 1.56 2.06 1.81 1.44 1.56
1.26 0.93 0.91 1.21 0.93 0.83 0.51 1.37 0.62 0.89 0.81 0.63 0.63 0.51 0.52 0.63 0.68 1.10 0.63 0.89 0.72 1.36 0.68 0.51 0.63 1.40 0.86 0.51 1.06 0.98 0.51 0.81
±±±±±±±±±±±±±±±±±±±±±±±±±±±±±±±±
mean SD
Week 24
2.56 2.31 1.75 2.56 2.19 1.81 1.75 2.94 1.63 2.13 1.88 1.94 1.75 1.69 1.81 1.88 1.81 1.88 2.00 1.81 1.88 2.69 1.69 1.63 1.63 2.38 2.06 1.81 2.69 1.94 1.63 1.50
1.09 1.08 0.93 1.26 1.11 0.83 0.68 1.34 0.81 0.96 1.02 0.93 0.86 0.79 0.91 1.20 0.91 0.96 1.10 1.22 0.89 1.08 0.70 0.72 0.81 1.09 0.93 0.83 1.30 0.85 0.81 0.73
±±±±±±±±±±±±±±±±±±±±±±±±±±±±±±±±
n=18.
n=18.
Table 3 Mental symptoms and lifestyle-related behaviors
mean SDmental symptons
Week 0
IrritabilityEasily angeredLoss of motivationNo feeling of happinessNothing to look forward to in lifeDaily life is not enjoyableLose confidenceReluctance to talk with othersDepressedFeeling of uselessnessShallow sleepDifficulty in falling asleepPessimismLapse of memoryInability to concentrateInability to solve problemsInability to make judgments readilyInability to sleep because of worriesA sense of tensionFeeling of anxiety for no special reasonVague feeling of fear
Lifestyle-related behaviors
Tobacco smokingAlcohol consumptionAlcohol consumptionAlcohol consumptionExerciseSleeping hoursWater cunsumptionVDT working hours
Cigarettes/daymL/daytimes/weekmL/daydays/weekhours/dayL/dayhour/day
2.35 2.06 1.76 1.82 1.59 1.53 1.82 1.47 1.65 1.53 1.82 1.53 1.71 3.00 2.06 1.88 1.94 1.53 2.06 1.59 1.41
1.27 0.90 0.83 1.07 0.62 0.62 0.73 0.51 0.79 0.51 1.13 0.87 0.77 1.27 1.03 0.86 0.83 0.80 1.03 0.71 0.62
±±±±±±±±±±±±±±±±±±±±±
8.2 465.9
5.1 35.6
1.9 6.1 1.1 6.1
10.3 253.9 2.1 29.6 2.1 0.7 0.4 2.0
±±±±±±±±
0.708 1.000 0.383 0.633 0.432 0.270 1.000 0.168 0.684 0.083 0.580 0.411 0.252 0.044 0.849 0.566 1.000 0.352 0.864 0.566 0.312
p-value(vs.week 0)mean SD
Week 12
2.00 2.00 1.75 1.56 1.50 1.56 1.63 1.50 1.50 1.44 1.44 1.38 1.50 2.38 1.56 1.56 1.56 1.56 1.75 1.44 1.38
1.10 0.97 0.77 0.63 0.52 0.63 0.62 0.63 0.73 0.51 0.63 0.50 0.63 1.09 0.51 0.63 0.63 0.73 0.86 0.51 0.50
±±±±±±±±±±±±±±±±±±±±±
mean SD
Week 24
2.19 2.06 1.94 1.69 1.69 1.69 1.81 1.88 1.75 1.88 1.94 1.75 2.06 2.31 2.00 2.06 1.94 1.81 2.00 1.75 1.69
0.98 1.00 0.85 0.79 0.79 0.79 0.91 1.09 0.93 0.96 1.12 1.00 1.18 1.14 0.97 1.12 1.12 1.11 1.21 1.06 1.08
±±±±±±±±±±±±±±±±±±±±±
0.582 0.152 0.256 0.441 0.144 0.751 0.005 0.595
6.7 360.6
5.1 6.3 1.3 6.1 1.5 5.8
9.6 225.8 2.3 0.9 0.8 2.1 0.6 2.9
±±±±±±±±
7.3 380.6
4.7 32.8
3.5 6.2 1.5 5.8
10.8 240.3 2.5 25.4 2.0 0.8 0.6 2.9
±±±±±±±±
n=18.
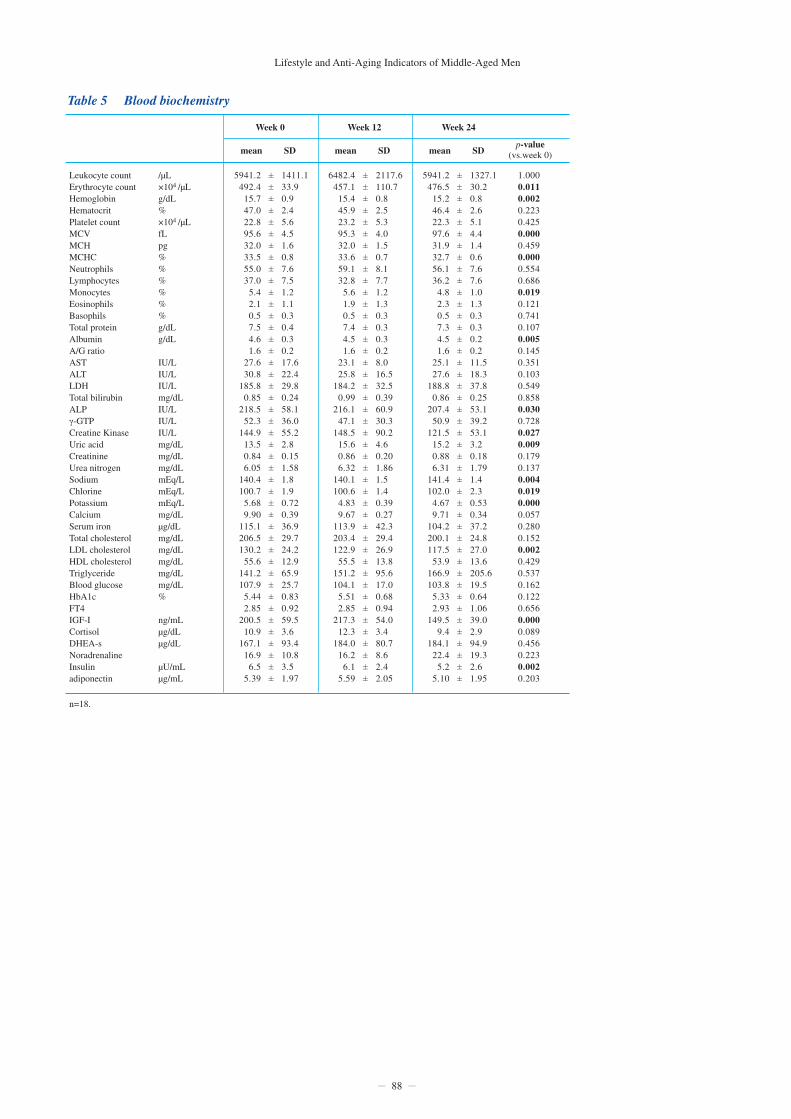
Blood biochemistry Blood biochemistry revealed significant changes by Week 24 in erythrocyte count (– 3.2%, p = 0.011), ALP (– 5.1%, p = 0.030), CK (– 16.1%, p = 0.027), urea nitrogen (12.7%, p = 0.009), and potassium (– 17.7%, p < 0.001) (Table 5). Concerning glucose metabolism, blood glucose and HbA1c showed no significant changes, while insulin significantly decreased from 6.5 ± 3.5 μU/mL to 5.2 ± 2.6 μU/mL (– 20.4%, p = 0.002). IGF-I, which has a hypoglycemic effect, showed a significant reduction from 200.5 ± 59.5 ng/mL to 149.5 ± 39.0 ng/mL (– 25.4%, p < 0.001). Concerning lipid metabolism, total cholesterol, HDL-cholesterol, neutral fat and adiponectin showed no significant changes, while LDL-cholesterol significantly improved from 130.2 ± 24.2 mg/dL to 117.5 ± 27.0 mg/dL (– 9.8%, p = 0.002). Concerning steroid skeletal hormones, DHEA-s, cortisol, and the ratio of DHEA-s to cortisol showed no significant changes.
Company-wide anti-aging medical checkup Measurement of muscle mass by site revealed a significant reduction in the muscle mass for the upper arm (right: – 8.1%, p = 0.048; left: – 9.1%, p = 0.029) and trunk (right: – 14.8%. p = 0.014), but a significant increase in the muscle mass of the thigh (left: 10.1%, p = 0.030). WBI did not change (Table 6). Examination of bone mass by ultrasonography demonstrated no change in stiffness value between pre- and post-intervention values. Evaluation of higher brain functions revealed no significant changes in each parameter. The degree of arteriosclerosis determined by acceleration plethysmogrphy showed significant improvement from 62.1 ± 12.9 years to 54.4 ± 16.9 years by Week 24 (– 13.1%, p = 0.025). Changes in functional age and in scores for risk factors determined by the Age Management Check system are shown in Table 7. Muscle age, vascular age, nerve age, and bone age did not change significantly, while hormonal age increased, which reflected the reduction in IGF-I. Evaluation of scores for risk factors revealed a significant improvement in antioxidant capacity and lifestyle-related behaviors, while the scores for immunological functions were slightly reduced.
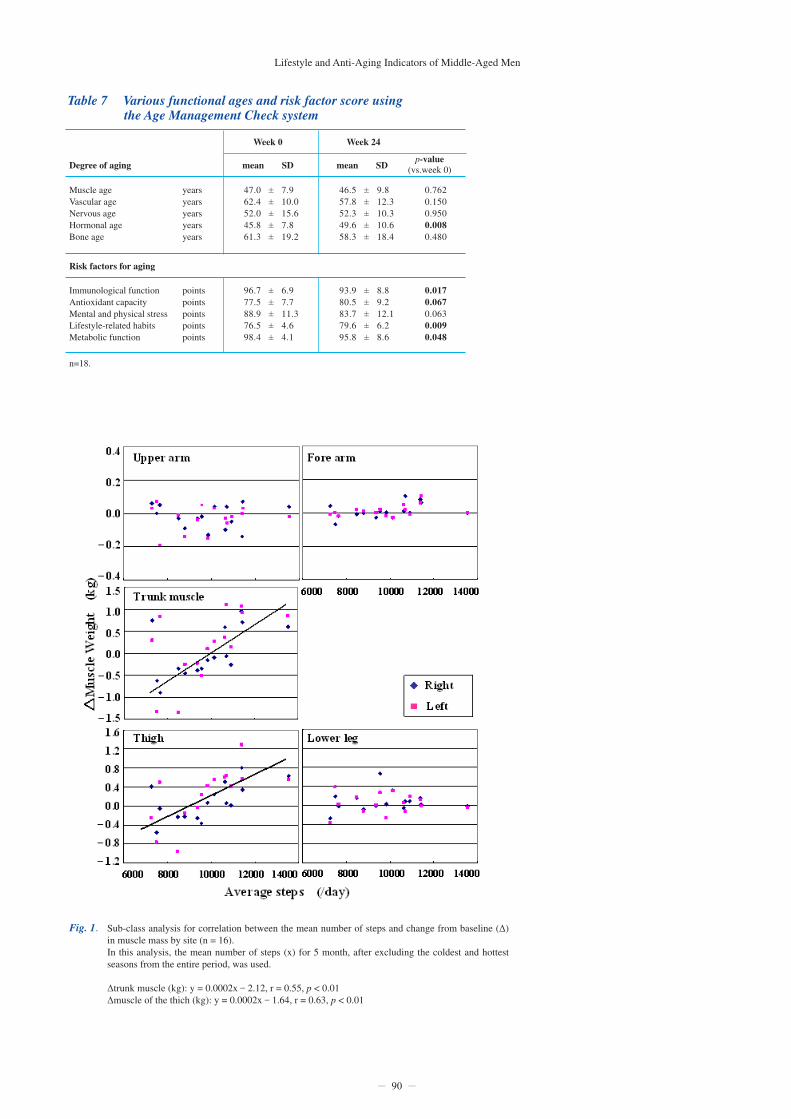
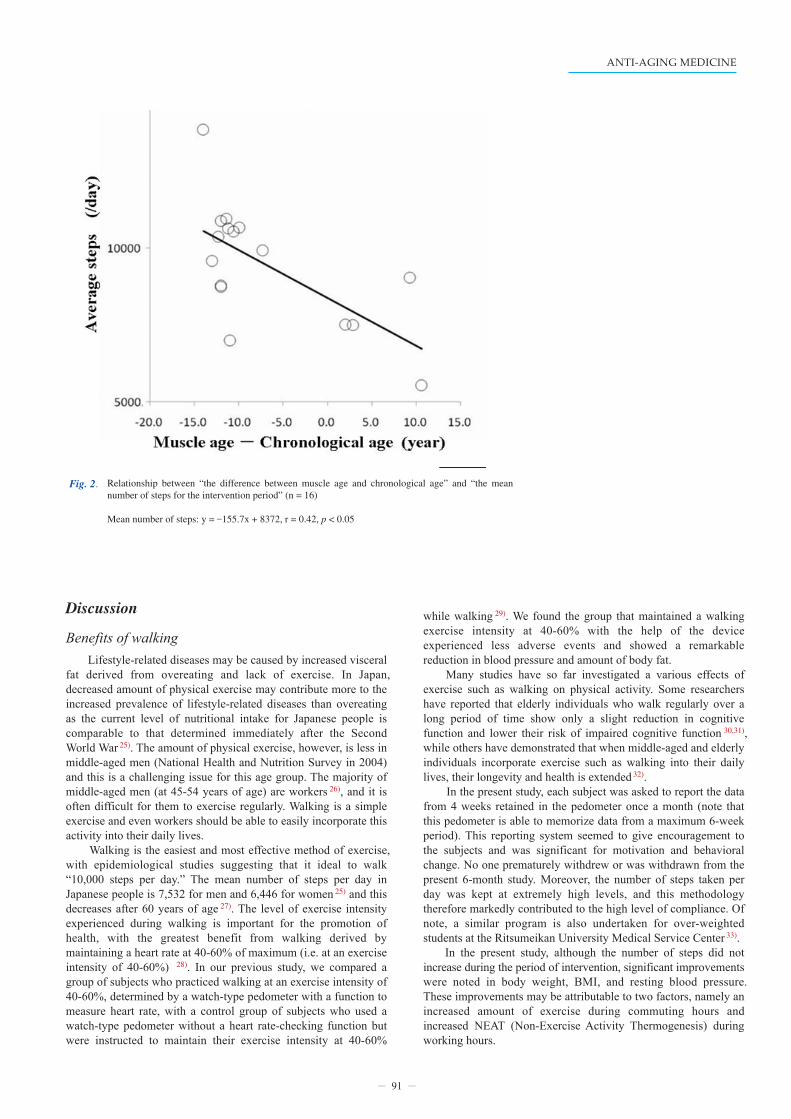
Analysis for correlation with the mean number of steps Among the eight types of exercises prescribed, compliance was best for walking (74.2 ± 11.2%) (Table 1). The mean number of steps during the period of intervention was 9,592 ± 1,978 steps/day. Evaluation for correlation between the mean number of steps throughout the entire period of intervention and change from baseline (Δ) in the individual parameters revealed a significant correlation with the following three parameters: a positive correlation with Δcortisol and ΔLDL-cholesterol (p < 0.05), and a negative correlation with ΔHbA1c (p < 0.05). As a sub-class analysis, we examined the correlation between the mean number of steps (x) and a change from baseline (Δ) in any of the body composition parameters, i.e. fat amount, muscle mass, water content, lean body mass, bone mass, percentage body fat, and basal metabolic rate for the 18 weeks from March to July, i.e. excluding the coldest (January and February) and hottest (August) seasons during which the number of steps recorded was not stable. This revealed a correlation between the mean number of steps and Δmuscle mass (kg) (y = 0.0009x – 8.34, r = 0.71, p < 0.01) and Δbone mass (kg) (y = 0.0005x – 4.11, r = 0.71, p < 0.01). The mean number of steps was analyzed for any correlation with change from baseline (Δ) in muscle mass by site and the results are shown in Fig. 1. Muscle mass of the upper extremity, i.e. upper arm and forearm, did not correlate with the mean number of steps, whereas a significantly positive correlation was found between the mean number of steps and muscle mass of the trunk (abdominal and back muscles) (r = 0.55) and Δmuscle mass of the thigh (r = 0.63) (p < 0.01). No significant correlation with Δmuscle mass of the lower extremity was noted. To determine if those who were informed of a higher functional age than their chronological age walked more, correlation between the mean number of steps during the period of intervention and each parameter as well as its change from baseline was analyzed. There was a tendency for those whose muscle age was older than their chronological age to achieve a lower mean number of steps (r = – 0.42, p < 0.05), as shown in Fig. 2. The other functional ages gave no significant correlation with the mean number of steps.
87
Table 4 Anthropometry
mean SD
Week 0
HeightWeightBMISystolic blood pressureDiastolic blood pressure
㎝
kg
mmHgmmHg
Body composition testing
Amount of fatMuscle massWater contentLean body massBone massPercentage body fatBasal metabolic rate
kgkgkgkgkg%kcal
172.0 77.5 26.1
140.6 94.7
3.8 12.5 3.6 15.1 6.3
±±±±±
0.021 0.020 0.014 0.002
p-value(vs.week 0)Maximum
Week 12
179.2 101.2 32.9 164.0 110.0
Median
171.8 76.5 25.3 143.0 94.0
Minimum
165.2 60.3 20.8 104.0 88.0
mean SD
Week 24
75.4 25.4
130.4 83.6
12.0 3.2 14.1 12.4
±±±±
mean SD
77.9 26.2
133.9 83.9
11.9 3.1 10.0 12.5
±±±±
19.34 29.83 42.43 57.95 12.99 24.81
1615.7
6.23 4.98 7.21 9.85 2.33 6.39 248.3
±±±±±±±
0.324 0.100 0.426 0.433 0.067 0.545 0.217
29.6 39.0 53.7 73.3 17.4 43.5 2029.0
19.1 28.9 41.7 57.0 12.6 24.5 1601.0
11.4 23.1 27.4 37.4 10.1 15.2 1182.0
18.55 28.38 41.59 56.83 12.24 24.29
1584.8
5.09 4.65 5.72 7.82 2.08 3.57 207.3
±±±±±±±
19.39 29.84 42.83 58.51 13.05 24.61
1629.2
4.93 5.28 5.67 7.74 2.40 3.26 205.7
±±±±±±±
Lifestyle and Anti-Aging Indicators of Middle-Aged Men
88
Table 5 Blood biochemistry
mean SD
Week 0
Leukocyte countErythrocyte countHemoglobinHematocritPlatelet countMCVMCHMCHCNeutrophilsLymphocytesMonocytesEosinophilsBasophilsTotal proteinAlbuminA/G ratioASTALTLDHTotal bilirubinALPγ-GTPCreatine KinaseUric acidCreatinineUrea nitrogenSodiumChlorinePotassiumCalciumSerum ironTotal cholesterolLDL cholesterolHDL cholesterolTriglycerideBlood glucoseHbA1cFT4IGF-ICortisolDHEA-sNoradrenalineInsulin adiponectin
/µL×104 /µLg/dL%×104 /µLfLpg%%%%%%g/dLg/dL
IU/LIU/LIU/Lmg/dLIU/LIU/LIU/Lmg/dLmg/dLmg/dLmEq/LmEq/LmEq/Lmg/dLµg/dLmg/dLmg/dLmg/dLmg/dLmg/dL%
ng/mLµg/dLµg/dL
µU/mLµg/mL
5941.2 492.4
15.7 47.0 22.8 95.6 32.0 33.5 55.0 37.0
5.4 2.1 0.5 7.5 4.6 1.6
27.6 30.8
185.8 0.85
218.5 52.3
144.9 13.5 0.84 6.05
140.4 100.7
5.68 9.90
115.1 206.5 130.2
55.6 141.2 107.9
5.44 2.85
200.5 10.9
167.1 16.9
6.5 5.39
1411.1 33.9 0.9 2.4 5.6 4.5 1.6 0.8 7.6 7.5 1.2 1.1 0.3 0.4 0.3 0.2 17.6 22.4 29.8 0.24 58.1 36.0 55.2 2.8 0.15 1.58 1.8 1.9 0.72 0.39 36.9 29.7 24.2 12.9 65.9 25.7 0.83 0.92 59.5 3.6 93.4 10.8 3.5 1.97
±±±±±±±±±±±±±±±±±±±±±±±±±±±±±±±±±±±±±±±±±±±±
1.000 0.011 0.002 0.223 0.425 0.000 0.459 0.000 0.554 0.686 0.019 0.121 0.741 0.107 0.005 0.145 0.351 0.103 0.549 0.858 0.030 0.728 0.027 0.009 0.179 0.137 0.004 0.019 0.000 0.057 0.280 0.152 0.002 0.429 0.537 0.162 0.122 0.656 0.000 0.089 0.456 0.223 0.002 0.203
n=18.
p-value(vs.week 0)mean SD
Week 12
6482.4 457.1
15.4 45.9 23.2 95.3 32.0 33.6 59.1 32.8
5.6 1.9 0.5 7.4 4.5 1.6
23.1 25.8
184.2 0.99
216.1 47.1
148.5 15.6 0.86 6.32
140.1 100.6
4.83 9.67
113.9 203.4 122.9
55.5 151.2 104.1
5.51 2.85
217.3 12.3
184.0 16.2
6.1 5.59
2117.6 110.7 0.8 2.5 5.3 4.0 1.5 0.7 8.1 7.7 1.2 1.3 0.3 0.3 0.3 0.2 8.0 16.5 32.5 0.39 60.9 30.3 90.2 4.6 0.20 1.86 1.5 1.4 0.39 0.27 42.3 29.4 26.9 13.8 95.6 17.0 0.68 0.94 54.0 3.4 80.7 8.6 2.4 2.05
±±±±±±±±±±±±±±±±±±±±±±±±±±±±±±±±±±±±±±±±±±±±
mean SD
Week 24
5941.2 476.5
15.2 46.4 22.3 97.6 31.9 32.7 56.1 36.2
4.8 2.3 0.5 7.3 4.5 1.6
25.1 27.6
188.8 0.86
207.4 50.9
121.5 15.2 0.88 6.31
141.4 102.0
4.67 9.71
104.2 200.1 117.5
53.9 166.9 103.8
5.33 2.93
149.5 9.4
184.1 22.4
5.2 5.10
1327.1 30.2 0.8 2.6 5.1 4.4 1.4 0.6 7.6 7.6 1.0 1.3 0.3 0.3 0.2 0.2 11.5 18.3 37.8 0.25 53.1 39.2 53.1 3.2 0.18 1.79 1.4 2.3 0.53 0.34 37.2 24.8 27.0 13.6 205.6 19.5 0.64 1.06 39.0 2.9 94.9 19.3 2.6 1.95
±±±±±±±±±±±±±±±±±±±±±±±±±±±±±±±±±±±±±±±±±±±±

89
Table 6 Company-wide anti-aging medical checkup
mean SDMuscle mass by site
Week 0
Upper arm RForearm RUpper limb RThigh RLeg RLower limb RTrunk RUpper arm LForearm LUpper limb LThigh LLeg LLower limb LTrunk L
Right-left balance
Upper armForearmUpper limbThighLegLower limbTrunk
%%%%%%%
kgkgkgkgkgkgkgkgkgkgkgkgkgkg
0.87 0.63 1.50 4.85 1.87 6.72 7.13 0.82 0.61 1.43 4.83 1.83 6.66 6.94
0.18 0.11 0.28 0.94 0.33 1.02 1.53 0.20 0.12 0.30 1.24 0.28 1.26 1.36
±±±±±±±±±±±±±±
94.6 96.6 95.3 99.9 98.4 99.4 98.7
10.1 8.1 5.7 16.4 6.0 11.8 17.0
±±±±±±±
0.048 0.195 0.055 0.082 0.095 0.280 0.014 0.029 0.570 0.063 0.436 0.030 0.931 0.124
n=18.CA: categories achieved.NUCA:numbers of response cards used until the first category achieved.TE:total errors.PEM:perserverative errors of Milner.PEN:perserverative errors of Nelson.UE:unique errorsBR:bizarre response.
p-value(vs.week 0)mean SD
Week 12
0.82 0.64 1.47 4.72 1.85 6.57 6.73 0.80 0.62 1.42 4.79 1.83 6.62 7.04
0.16 0.12 0.27 0.87 0.30 1.04 1.33 0.17 0.12 0.29 0.88 0.33 1.11 1.43
±±±±±±±±±±±±±±
mean SD
Week 24
0.80 0.61 1.41 4.44 1.99 6.44 6.08 0.75 0.59 1.34 4.58 2.01 6.60 6.52
0.18 0.10 0.28 0.74 0.36 1.03 1.18 0.18 0.11 0.29 0.67 0.35 0.93 1.10
±±±±±±±±±±±±±±
0.691 0.611 0.966 0.391 0.262 0.242 0.248
97.0 96.2 96.3
101.8 99.2
100.7 96.0
8.8 7.6 5.1 8.4 11.1 4.0 6.8
±±±±±±±
93.7 97.2 95.2
103.5 101.5 102.8
93.1
7.4 6.6 5.6 5.5 8.7 3.7 6.5
±±±±±±±
Vascular function tests
Acceleration plethysmographyCoefficient of acceleration plethysmography
years 60.5
– 7.8
11.5
26.5
±
±
0.025
0.026
52.6
10.5
15.37
35.95
±
±
Bone mineral density tests
UltrasonographyComparison with the younger age groupt-score
Stiffness value%
86.0
82.5 – 1.5
15.0
14.5 1.3
±
±±
0.796
0.785 0.908
86.5
83.0 – 1.5
15.08
14.52 1.26
±
±±
Higher brain function test: WCST
CANUCATEPENPEMUEBRresponse time second
5.3 1.6
12.2 0.6 1.4 0.3 0.4
98.1
0.8 2.3 3.2 1.2 2.0 0.6 0.9 31.5
±±±±±±±±
0.332 0.804 0.585 0.361 0.636 0.188 0.854 0.060
5.1 1.5
11.8 0.4 1.2 0.1 0.5
85.7
1.0 1.9 2.7 0.6 1.3 0.3 0.7 31.3
±±±±±±±±
WBI: RightWBI: Left
0.94 0.94
0.16 0.25
±±
0.229 0.626
0.92 0.90
0.09 0.07
±±
0.88 0.91
0.07 0.07
±±
Muscle age score 54.0 7.1 ± 0.065 54.1 7.0 ± 55.1 7.3 ±
Lifestyle and Anti-Aging Indicators of Middle-Aged Men
90
Table 7 Various functional ages and risk factor score using the Age Management Check system
mean SDDegree of aging
Week 0
Muscle ageVascular ageNervous ageHormonal ageBone age
yearsyearsyearsyearsyears
Risk factors for aging
47.0 62.4 52.0 45.8 61.3
7.9 10.0 15.6 7.8 19.2
±±±±±
0.762 0.150 0.950 0.008 0.480
n=18.
p-value(vs.week 0)mean SD
Week 24
46.5 57.8 52.3 49.6 58.3
9.8 12.3 10.3 10.6 18.4
±±±±±
Immunological functionAntioxidant capacityMental and physical stressLifestyle-related habitsMetabolic function
pointspointspointspointspoints
96.7 77.5 88.9 76.5 98.4
6.9 7.7 11.3 4.6 4.1
±±±±±
0.017 0.067 0.063 0.009 0.048
93.9 80.5 83.7 79.6 95.8
8.8 9.2 12.1 6.2 8.6
±±±±±
Fig. 1. Sub-class analysis for correlation between the mean number of steps and change from baseline (Δ) in muscle mass by site (n = 16). In this analysis, the mean number of steps (x) for 5 month, after excluding the coldest and hottest seasons from the entire period, was used.
Δtrunk muscle (kg): y = 0.0002x – 2.12, r = 0.55, p < 0.01 Δmuscle of the thich (kg): y = 0.0002x – 1.64, r = 0.63, p < 0.01
Discussion Benefits of walking Lifestyle-related diseases may be caused by increased visceral fat derived from overeating and lack of exercise. In Japan, decreased amount of physical exercise may contribute more to the increased prevalence of lifestyle-related diseases than overeating as the current level of nutritional intake for Japanese people is comparable to that determined immediately after the Second World War 25). The amount of physical exercise, however, is less in middle-aged men (National Health and Nutrition Survey in 2004) and this is a challenging issue for this age group. The majority of middle-aged men (at 45-54 years of age) are workers 26), and it is often difficult for them to exercise regularly. Walking is a simple exercise and even workers should be able to easily incorporate this activity into their daily lives. Walking is the easiest and most effective method of exercise, with epidemiological studies suggesting that it ideal to walk “10,000 steps per day.” The mean number of steps per day in Japanese people is 7,532 for men and 6,446 for women 25) and this decreases after 60 years of age 27). The level of exercise intensity experienced during walking is important for the promotion of health, with the greatest benefit from walking derived by maintaining a heart rate at 40-60% of maximum (i.e. at an exercise intensity of 40-60%) 28). In our previous study, we compared a group of subjects who practiced walking at an exercise intensity of 40-60%, determined by a watch-type pedometer with a function to measure heart rate, with a control group of subjects who used a watch-type pedometer without a heart rate-checking function but were instructed to maintain their exercise intensity at 40-60%
while walking 29). We found the group that maintained a walking exercise intensity at 40-60% with the help of the device experienced less adverse events and showed a remarkable reduction in blood pressure and amount of body fat. Many studies have so far investigated a various effects of exercise such as walking on physical activity. Some researchers have reported that elderly individuals who walk regularly over a long period of time show only a slight reduction in cognitive function and lower their risk of impaired cognitive function 30,31), while others have demonstrated that when middle-aged and elderly individuals incorporate exercise such as walking into their daily lives, their longevity and health is extended 32). In the present study, each subject was asked to report the data from 4 weeks retained in the pedometer once a month (note that this pedometer is able to memorize data from a maximum 6-week period). This reporting system seemed to give encouragement to the subjects and was significant for motivation and behavioral change. No one prematurely withdrew or was withdrawn from the present 6-month study. Moreover, the number of steps taken per day was kept at extremely high levels, and this methodology therefore markedly contributed to the high level of compliance. Of note, a similar program is also undertaken for over-weighted students at the Ritsumeikan University Medical Service Center 33). In the present study, although the number of steps did not increase during the period of intervention, significant improvements were noted in body weight, BMI, and resting blood pressure. These improvements may be attributable to two factors, namely an increased amount of exercise during commuting hours and increased NEAT (Non-Exercise Activity Thermogenesis) during working hours.
91
Fig. 2. Relationship between “the difference between muscle age and chronological age” and “the mean number of steps for the intervention period” (n = 16)
Mean number of steps: y = –155.7x + 8372, r = 0.42, p < 0.05
The first factor, namely the amount of exercise during commuting hours, has been investigated by Takada 34). They divided 500 factory workers (429 men and 61 women, mean age 50 yrs) in the Kinki Region into one of the three groups according to their commuting conditions, namely a non-exercise group of either walking- or bicycle-commuting for less than 20 minutes, a slight exercise group of bicycle-commuting for ≥ 20 and < 40 minutes and an exercise group of bicycle-commuting for more than 40 minutes, and followed up these workers for 5 years. They reported that 81% of those who newly developed hypertension, hypercholesterolemia, or diabetes mellitus and 71% of those who newly developed borderline type hyperglycemia over this 5-year period belonged to the non-exercise group. They also found a significant relationship between the number of hours exercising during commuting and the incidence of diseases that are risk factors of ischemic heart disease, and concluded that longer hours exercising during commuting have a more beneficial effect on health. In the present study, systolic and diastolic blood pressure significantly improved after the intervention. The number of study participants with hypertension (according to definition and the diagnostic standard for metabolic syndrome) 35) before intervention was reduced from 18 to 11 after the intervention. As their places of work are close to the station in Kyoto City, many of the subjects in the present study commute from the station to work by foot or bicycle. Although the present study lasted for only 24 weeks, there was an increase in the number of hours of exercise during commuting over the intervention period, and this may have contributed to the significant improvement in blood pressure. Second, the significant improvement noted in body weight and BMI is likely to be related to NEAT. NEAT refers to the calories an individual burns during his/her daily living-physical activity which is not categorized as exercise but is suggested to help prevent obesity 36). Those who are obese tend to sit longer on a daily-mean basis by about 2.5 hours and spend fewer hours walking than those who are lean. They therefore have a tendency towards a lower NEAT. In the present study, body weight, BMI, and blood pressure improved significantly. This may be attributable to our strategy of encouraging subjects to change their behavior through the simple methodology of asking each subject to wear a pedometer and informing him of his functional age, therefore inducing changes in their everyday living, including their eating habits. A survey in Japan revealed that as little as approximately 20% of middle-aged men get into a habit of doing regular exercise 25). Results from the present study indicate however that health management can be practically successful without setting special hours dedicated to exercise. The key issues for successful health management in middle-aged working persons are the total hours of physical activity such as increasing exercise (exercise during commuting hours) and daily activities (NEAT such as standing during work).
Effect on glucose and lipid metabolism The present data of significant decrease of insulin and the negative correlation between ΔHbA1c and the mean number of steps indicates the favorable effect of exercise on glucose metabolism. Concerning to lipid metabolism, LDL-C has significantly decreased, however the positive correlation noted between ΔLDL-C and the mean number of steps. One possible reason is that the dietary intake including the lipid increases with an increase in the amount of physical activity. Recently, LDL particle size is paid to attention 37). As the size becomes larger, the blood vessel event risk is lower. In the cases that an exercise intervention did not affect the LDL-C level, it can improve the
quality by changing the LDL particle size. We should verify this problem in the future.
Relationship with muscle mass and bone mass Several researches in Japan have so far investigated the relationship between walking and muscle mass. In a 12-week study of a combined exercise intervention program placing an importance on balance, muscular strength, and walking (twice weekly for approximately two hours), 12 women aged 65-79 years exercised under this program for 12 weeks and 13.5% improved the muscular strength of their lower extremities. In addition, the other physical abilities determined by a timed ten-meter walking obstacle course, a whole-body response time, or any other relevant parameters improved significantly 38). Another study in which muscle mass was calculated from MRI images in 73 women (mean age, 50.3 ± 5.7 years) reported no statistical significance between the mean number of steps taken during daily living and the cross-sectional area for the psoas major muscle and the deep muscles of back, although muscle mass of the lower extremities was not determined 39). In the present study, no significant change was noted in the muscle mass of the thigh by Week 24, which may be explained by the fact that some of the study subjects walked much more or less than others. It is evident that walking 8000 steps or more will increase muscle mass. Increasing muscle mass of the lower extremities is known to be effective in improving metabolic syndrome 40). In a study where 43 premenopausal healthy women were divided into two groups, a walking-only group and a walking-plus-jumping group, bone mineral density measured one year later was not reduced but rather was maintained at the same level as before in both the groups 41). In another study, 50 postmenopausal women (aged 49-75 years) with osteopenia and osteoporosis were assigned to a walking group (walking 8000 steps/day or more, for more than one hour, at an exercise intensity of 50%, four days per week; 32 women) or a control group (18 women), and comparison of the two groups revealed that in the walking group, urine cross-linked N-terminal telopeptides of type I collagen (NTX), a bone resorption marker, started to decrease by the third month and bone mineral density of the lumbar spine (by DXA method) improved by the twelfth month 42). These results indicate that walking starts to suppress bone resorption relatively early. Thus, regarding effects of exercise on bone, it is generally accepted that amount of exercise amount correlates significantly with bone mass. In a cross-sectional analysis on athletes, the following matters need to be kept in mind: there is a bias in that individuals with good physique tend to be engaged in sports activities; and the fact that vigorous exercise resulting in increased bone mass provides a slight bone mass-increasing effect. Walking or other relevant exercises which stimulate the epiphyses should be proactively encouraged.
Exercise and nutritional instructions based on company-wide anti-aging medical checkup The present study was characterized by the implementation of a company-wide anti-aging medical checkup using the Age Management Check system and by the intervention based on the results of this medical checkup. The Anti-Aging Dock/Medical Checkup is a system that calculates a functional age for a given individual from the previously accumulated Dock data and provides the degree of aging of that individual against the
Lifestyle and Anti-Aging Indicators of Middle-Aged Men
92
Conclusion In the present study, we performed a company-wide anti-aging medical checkup and investigated the effects of an exercise and nutritional intervention on health indicators in middle-aged working men. This study is the first interventional research study utilizing a company-wide anti-aging medical checkup. Although the number of participants in this study was as small none of them prematurely withdrew or were withdrawn from the study and a measure of success was achieved. In addition, improvements in risk factors for vascular events were frequently noted in the anthropometry and blood biochemistry parameters, suggesting the positive effects of the intervention. The higher the muscle age based on the Anti-Aging Dock data, the less number of steps that were taken. The relationships between the amount of physical activity, as represented by the number of steps taken, and each of the relevant parameters warrants future investigation.
Acknowledgement This research was supported by Japan Science and Technology Agency (JST) Comprehensive Support Programs for Creation of Regional Innovation “Research for Promotiong Technological Seeds” in 2008 and 2009.
population in terms of an easy-to-understand indicator, namely “age” 3,4,9). This system therefore evaluates different medical checkup data on the same scale if they satisfy the predetermined requirements for the type of parameter to be measured and the method of measurement, and enables easy comparison between individuals or between populations. In Japan, the MHLW started the specific health checkup in 2008. In a given place of work, the rate of implementation of this specific health checkup will be 100% if it is combined with the conventional regular medical examination on employees 43). This means that the medical checkup data of a certain company provides a trend for that company as a whole. Consequently, the results of this company-wide anti-aging medical checkup facilitate evaluation of the health status of employees for a given company and clearly reflect how that company addresses corporate health issues. These results may therefore be helpful in improving employees’ awareness of health promotion, as well as in reviewing the cost-effectiveness of health promotion-related actions taken by a company. In the present study, as part of the exercise prescription, subjects were lent pedometers, asked to report their data regarding the number of steps taken, and given instructions regarding physical exercises they were able to perform at home. As part of the nutritional prescription, diet or eating-related matters that the subjects needed to pay attention to were explained to them in a simply, easy-to-understand manner. As a result of these instructions, the number of steps was maintained at a high level, while compliance with the other exercises prescribed was low (Table 1). We therefore consider that although the beneficial effects of the present study were derived from instructions regarding both exercise and nutrition, the exercise prescription with provision of pedometers may have been the greatest contributing factor to these beneficial effects. With regard to notifying subjects of their functional age, those informed of an older muscle age subsequently walked less. As a future issue to be addressed, those showing remarkable senility in functional age may need to be more aggressively supported and guided.
93
1)
2)
3)
4)
5)
6)
7)
8)
9)
10)
11)
12)
13)
14)
15)
Saito I: The health management of middle adged workers and “Health Promotion (Kenko) Nippon 21”program: Prevention and treatment of hypertension. Blood Pressure (Ketsuatsu) 9; 539-543: 2002 (in Japanese)Hirose H, Saito I, Seino Y: Significance of adipocytokines and gene polymorphism in the pathogenesis of lifestyle-related diseased in the middle-aged. The report of the Daiwa Securities Health Foundation 31; 72-75: 2008 (in Japanese)Yonei Y, Mizuno Y: The human dock of tomorrow: annual health check-up for anti-aging. Ningen Dock 19; 5-8: 2005Yonei Y: A guide to anti-aging medicine. Keio University Press, Tokyo, 2004 (in Japanese)Yonei Y, Miyazaki R: Physical activity and anti-aging medicine. Nippon Rinsho 67 (Suppl.2); 541-547: 2009 (in Japanese)Yonei Y, Mizuno Y, Togari H, et al: Muscular resistance training using applied pressure and its effects on the promotion of growth hormone secretion. Anti-Aging Medical Research 1; 13-27: 2004Bando H, Yoshioka T, Yonei Y, et al: Investigation of quality of life in athletes from an anti-aging perspective. Primary Care Japan 4; 47-51: 2006Ito H: Anti-aging human dock support system “Aging CheckR”. Modern Physician 26; 605-608: 2006 (in Japanese)
Ishiguro N, Kanehisa H, Miyatani M, et al: A comparison of three bioelectrical impedance analyses for predicting lean body mass in a population with a large difference in muscularity. Eur J Appl Physiol 94; 25-35: 2005Miyatani M, Kanehisa H, Masuo Y, et al: Validity of estimating limb muscle volume by bioelectrical impedance. J Appl Physiol 91; 386-394: 2001Yonei Y, Miwa Y, Hibino S, et al: Japanese anthropometric reference data: special emphasis on bioelectrical impedance analysis of muscle mass. Anti-Aging Medicine 5; 63-72: 2008Igarashi K, Oguni H, Osawa M, et al: Wisconsin card sorting test in children with temporal lobe epilepsy. Brain Dev 24; 174-178: 2002Tsuchiya E, Oki J, Yahara N, et al: Computerized version of the Wisconsin card sorting test in children with high-functioning autistic disorder or attention-deficit/hyperactivity disorder. Brain Dev 27; 233-236: 2005Matsuda N, Yuki T, Akiyama K, et al: Effects of tobacco smoking on frontal lobe function in normal healthy volunteer. Dokkyo Journal of Medical Sciences 32; 81-83: 2005Nakaaki S, Murata Y, Sato J, et al: Reliability and validity of the Japanese version of the Frontal Assessment Battery in patients with the frontal variant of frontotemporal dementia. Psychiatry Clin Neurosci 61; 78-83: 2007
References

Lifestyle and Anti-Aging Indicators of Middle-Aged Men
94
16)
17)
18)
19)
20)
21)
22)
23)
24)
25)
26)
27)
28)
29)
30)
31)
32)
33)
34)
35)
36)
37)
38)
39)
40)
41)
42)
43)
Takada H, Okino K, Niwa Y: An evaluation method for heart rate variability by using acceleration plethysmography. Health Evaluation & Promotion (Sogokenshin) 31; 547-551: 2004Ushiroyama T, Kajimoto Y, Sakuma K, et al: Assessment of chilly sensation in Japanese women with laser doppler fluxmetry and acceleration plethysmogram with respect to peripheral circulation. Bulletin of the Osaka Medical College 51; 76-84: 2005Takazawa K, Kobayashi H, Shindo N, et al: Relationship between radial and central arterial pulse wave and evaluation of central aortic pressure using the radial arterial pulse wave. Hypertens Res 30; 219-228: 2007Higashi A, Ikeda J, Watanabe Y, et al: Cross sectional study of the relationship between bone density to diet and life style using ultrasound bone densitometry. Nippon Koshu Eisei Zasshi 43; 882-893: 1996 (in Japanese)Yoshimi I, Aoyagi K, Okano K, et al: Stiffness index of the calcaneus measured by quantitative ultrasound and menopause among Japanese women: The Hizen-Oshima Study. Tohoku J Exp Med 195; 93-99: 2001Imashuku Y, Takada M, Murata K: Comparisons of bone mass measurements on various skeletal sites including quantitative ultrasonography of the calcaneus for assessing age-related losses, their correlations, and diagnostic agreement using the Japanese and WHO criteria for osteoporosis. Radiat Med 25; 148-154: 2007Nakae S, Chiba H, Ishii K: Effect of the walking step increase by one year intervention using podometers and newletters on the body component, blood pressure and blood rheology in the elderly. Journal of Japan Society for the Study of Obesity 13; 130-136: 2007 (in Japanese)Nakae S, Oshima Y, Ishii K: Accuracy of spring-levered and piezo-electric pedometers in primary school Japanese children. J Physiol Anthropol 27; 233-239: 2008Merom D, Rissel C, Phongsavan P, et al: Promoting walking with pedometers in the community the step-by step trial. Am J Prev Med 32; 290-297: 2007Ministry of Health, Labour and Welfare of Japan. The National Health and Nutrition Survey in Japan, 2004. Web site: http://www.mhlw.go.jp/ houdou/2006/05/h0508-1a.html. (in Japanese)Ministry of Internal Affairs and Communications. The Statistics Bureau and the Director-General for Policy Planning (Statistical Standards). Labour Force Survey 2009. Web site: http://www.stat.go.jp/ data/roudou/report/2007/ft/index.htm. (in Japanese)Shibutani T: Utility of the number of steps walked daily as a health promotion parameter in community-dwelling elderly persons. Nippon Ronen Igakkai Zasshi 44; 726-733; 2007 (in Japanese)Omiya K, Itoh H, Osada N, et al: Impaired heart rate response during incremental exercise in patients with acute myocardial infarction and after coronary artery bypass grafting: evaluation of coefficients with Karvonen’s formula. Jpn Circ J 64; 851-855: 2000
Yonei Y, Takahashi Y, Watanabe M, et al: The effects of walking on quality of life and various symptoms and issues relating to aging. Anti-Aging Medicine 5; 22-29: 2008Weuve J, Kang JH, Manson JE, et al: Physical activity, including walking, and cognitive function in older women. JAMA 292; 1454-1461: 2004Abbott RD, White LR, Ross GW, et al: Walking and dementia in physically capable elderly men. JAMA 292; 1447-1453: 2004Paffenbarger RS, Hyde RT, Wing AL, et al: The association of changes in physical-activity level and other lifestyle characteristics with mortality among men. N Engl J Med 328; 574-576: 1993Katayama Y, Okumura H, Yamashita M, et al: A trial of health instruction to the over-weighted students: Teku Teku porogram. Campus Health 45; 75-80: 2008 (in Japanese)Takada Y. Relation between the workers’physical activity time while commuting and the risk factors for ischemic heart diseases. Journal of Health and Welfare Statistics 51; 29-33: 2004 (in Japanese)Definition and the diagnostic standard for metabolic syndrome—Committee to Evaluate Diagnostic Standards for Metabolic Syndrome. Nippon Naika Gakkai Zasshi 94; 794-809, 2005 (in Japanese)Levine JA, Lanningham-Foster LM, McCrady, et al: Interindividual variation in posture allocation: possible role in human obesity. Science 307; 584-586: 2005Hamada T, Kotani K, Fujiwara S, et al: The UCP2-866 A/A genotype is associated with low density lipoprotein particle sizes in the general population. Med Sci Monit 14; CR107-111: 2008Cao ZB, Maeda A, Shima N, et al: The effect of a 12-week combined exercise intervention program on physical performance and gait kinematics in community-dwelling elderly women. J Physiol Anthropol 26; 325-332: 2007Tanaka S, Domoto T, Oki S, et al: Relationship between physical activity and cross-sectional area of psoas major and postvertebral muscles in middle-age and elderly females. Structure and Function 6; 33-38: 2007 (in Japanese)Miyatake N, Miyachi M, Numata T: Increasing leg strength per body weight is associated with improvements in metabolic syndrome in Japanese men. Anti-Aging Medicine 6; 1-4: 2009Shibata Y, Ohsawa I, Watanabe T, et al: Effects of physical training on bone mineral density and bone metabolism. J Physiol Anthropol Appl Human Sci 22; 203-208: 2003Yamazaki S, Ichimura S, Iwamoto J, et al: Effect of walking exercise on bone metabolism in postmenopausal women with osteopenia/ osteoporosis. J Bone Miner Metab 22; 500-508: 2004Ishikawa T: 【Approach to Obesity】Special health promotion instruction. The Journal of Therapy (Chiryo) 90; 1789-1794: 2008 (in Japanese)