hsn indicators school aged children september, 2008
TRANSCRIPT
HSN IndicatorsHSN IndicatorsHSN IndicatorsHSN Indicators
School Aged ChildrenSchool Aged Children
September, 2008September, 2008
Hmmm…
• Humor helps us to think out of the box. The average child laughs about 400 times per day, the average adult laughs only 15 times per day. What happened to the other 385 laughs?

Survey data – Change!!• 2006 Hillsdale County Prevention
Needs Assessment (PNA)• 2008 Michigan Profile for Healthy
Youth (MiPHY)• Youth Risk Behavior Survey (YRBS)

* New Survey Tool *MiPHY
Michigan Profile for Healthy Youth
• Web-based, anonymous survey offered by MI Department of Education (MDE) and MI Department of Community Health (MDCH).
• Biennially to Grades 7,9, and 11.• Incorporates elements of Youth Risk
Behavior Survey (YRBS). • Free of charge to schools and
communities.• Results available to schools quickly.
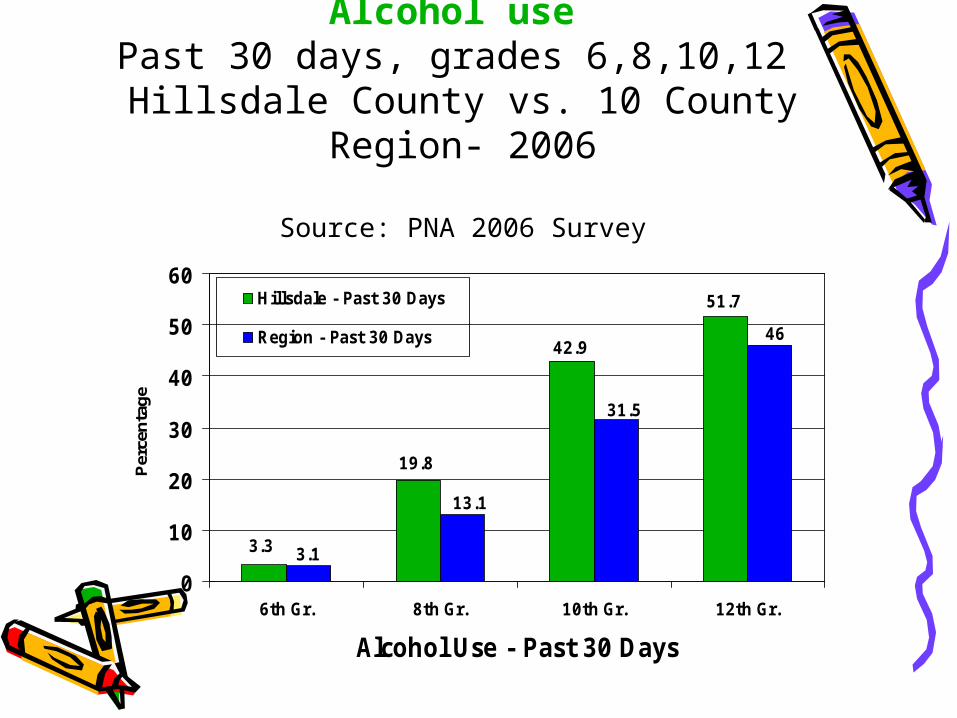
Alcohol use Past 30 days, grades 6,8,10,12
Hillsdale County vs. 10 County Region- 2006
Source: PNA 2006 Survey
51.7
42.9
19.8
3.3
46
31.5
13.1
3.1
0
10
20
30
40
50
60
6th Gr. 8th Gr. 10th Gr. 12th Gr.
Alcohol Use - Past 30 Days
Per
cent
age
Hillsdale - Past 30 Days
Region - Past 30 Days
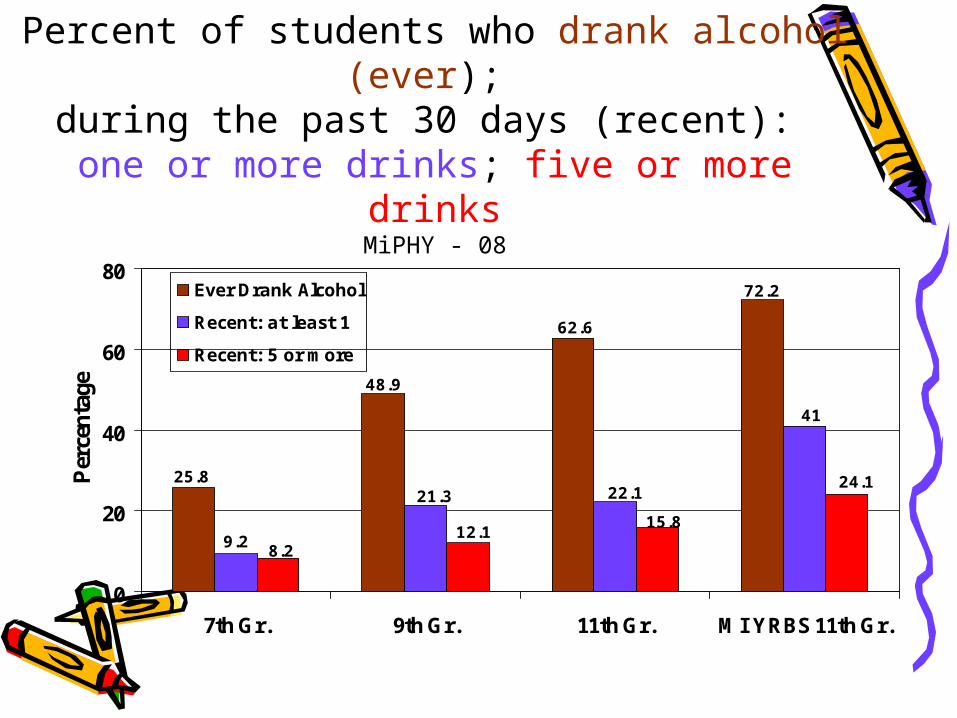
Alcohol Use – Hillsdale Co.Percent of students who drank alcohol
(ever); during the past 30 days (recent):
one or more drinks; five or more drinksMiPHY - 08
72.2
62.6
48.9
25.8
41
22.121.3
9.2
24.1
15.812.1
8.2
0
20
40
60
80
7th Gr. 9th Gr. 11th Gr. MI YRBS 11th Gr.
Per
cen
tage
Ever Drank Alcohol
Recent: at least 1
Recent: 5 or more

Alcohol Use - VehiclePercentage of students who rode in a
car or other vehicle driven by someone who had been drinking alcohol one or more times during the past 30 days
(ever – 7th gr.)MiPHY 2008 (Hillsdale) and Youth Risk Behavior Survey 2007
(MI)
19.621.7
30.925.2
0
10
20
30
40
50
7th Grade (Ever) 9th Grade (30 days) 11th Grade (30 days) MI YRBS 11th Gr.
Rode in Vehicle with Drinker
Perc
enta
ge
Hillsdale
YRBS

Cigarette use Lifetime and Last 30 Days
Hillsdale County Grades 7th, 9th, 11th Source: MiPHY 2008/Youth Risk Behavior Survey (MI) 2007
50.2
17.4
37.1
25.8
11.2
18.8
12.8
4.2
0
20
40
60
7th Gr. 9th Gr. 11th Gr. MI 11th Gr.YRBS
Cigarette Use - Past 30 Days
Per
cen
tage
Hillsdale-Lifetime Hillsdale-Last 30 DaysMI-LifetimeMI-Last 30 Days
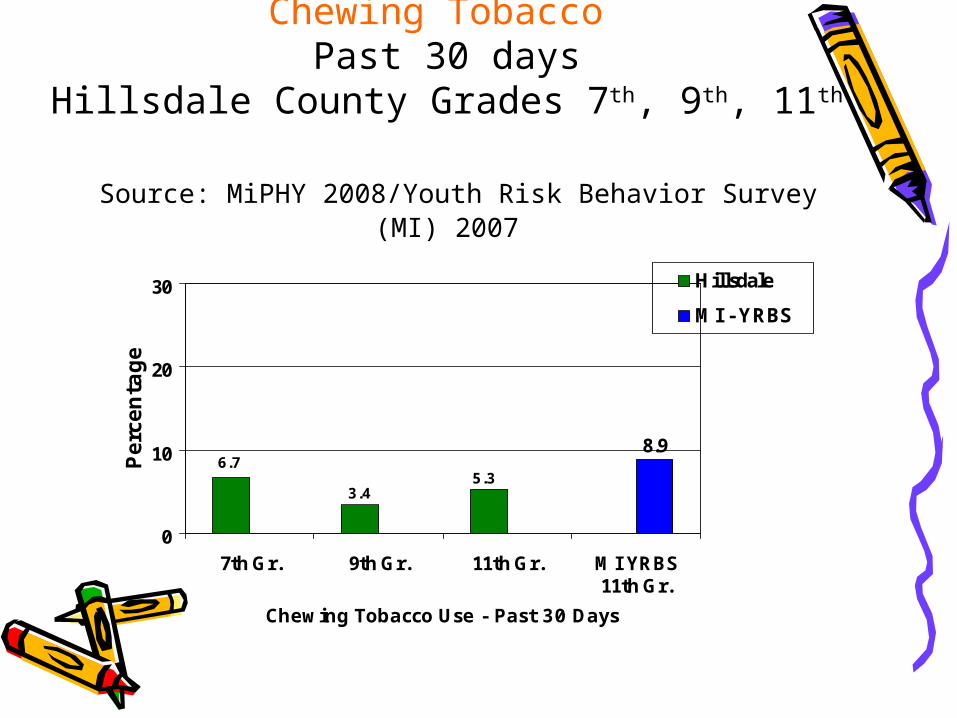
Chewing Tobacco Past 30 days
Hillsdale County Grades 7th, 9th, 11th Source: MiPHY 2008/Youth Risk Behavior Survey (MI) 2007
8.9
5.33.4
6.7
0
10
20
30
7th Gr. 9th Gr. 11th Gr. MI YRBS11th Gr.
Chewing Tobacco Use - Past 30 Days
Per
centa
ge
Hillsdale
MI - YRBS

Marijuana use Past 30 days - grades 6,8,10,12
Hillsdale County vs. 10 County Region -2006
Source: PNA 2006 Survey
19.7
14.8
5
0
18.2
13.3
4.8
0.60
10
20
30
6th Gr. 8th Gr. 10th Gr. 12th Gr.
Marijuana Use - Past 30 Days
Per
centa
ge
Hillsdale
Region

Marijuana use Lifetime and Last 30 Days
Hillsdale County – Grades 7th,9th,11th MiPHY 2008/ Youth Risk Behavior Survey (MI) 2007
35.8
20.4
3.6
17
10
1.5
37.6
20.1
0
10
20
30
40
50
7th Gr. 9th Gr. 11th Gr. MI YRBS11th Gr.
Marijuana - Lifetime and Past 30 Days
Perc
enta
ge
Hillsdale - Ever
Hillsdale - 30 days
MI - Ever
MI - 30 days

Perceived Risk of UsePercentage of Students who reported
regular use of cigarettes, alcohol and marijuana to be a moderate or great
risk MiPHY - 2008
86.6
64.971.6
0
20
40
60
80
100
Moderate or Great Risk with regular use
Perc
enta
ge
Cigarette
Alcohol
Marijuana
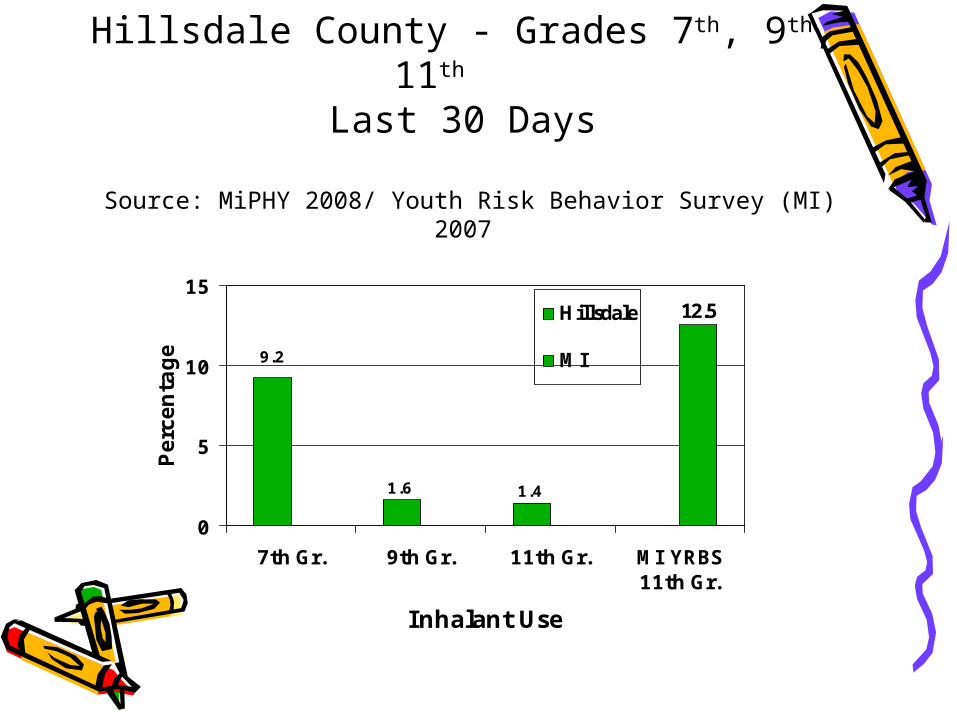
Inhalant use Hillsdale County - Grades 7th, 9th, 11th
Last 30 Days
Source: MiPHY 2008/ Youth Risk Behavior Survey (MI) 2007
12.5
1.41.6
9.2
0
5
10
15
7th Gr. 9th Gr. 11th Gr. MI YRBS11th Gr.
Inhalant Use
Per
centa
ge
Hillsdale
MI

Methamphetamine UsePast 30 days - Grades 6th, 8th, 10th, 12th
Hillsdale County Source: PNA 2006 Survey
2.3
0.5
00
0.60.20.1
00
1
2
3
4
5
6th Gr. 8th Gr. 10th Gr. 12th Gr.
Meth Use
Perc
enta
ge
Hillsdale
Region

Prescription Drug Use Past 30 days - grades 6,8,10,12
Hillsdale County vs. 10 County Region -2006
Source: PNA 2006 Survey
6.36
1.2
0
5.8
4.3
1.5
0.4
0
5
10
6th Gr. 8th Gr. 10th Gr. 12th Gr.
Prescription Drug Use - Past 30 Days
Perc
enta
ge
Hillsdale
Region

Sexual Behavior
Sexual Behavior
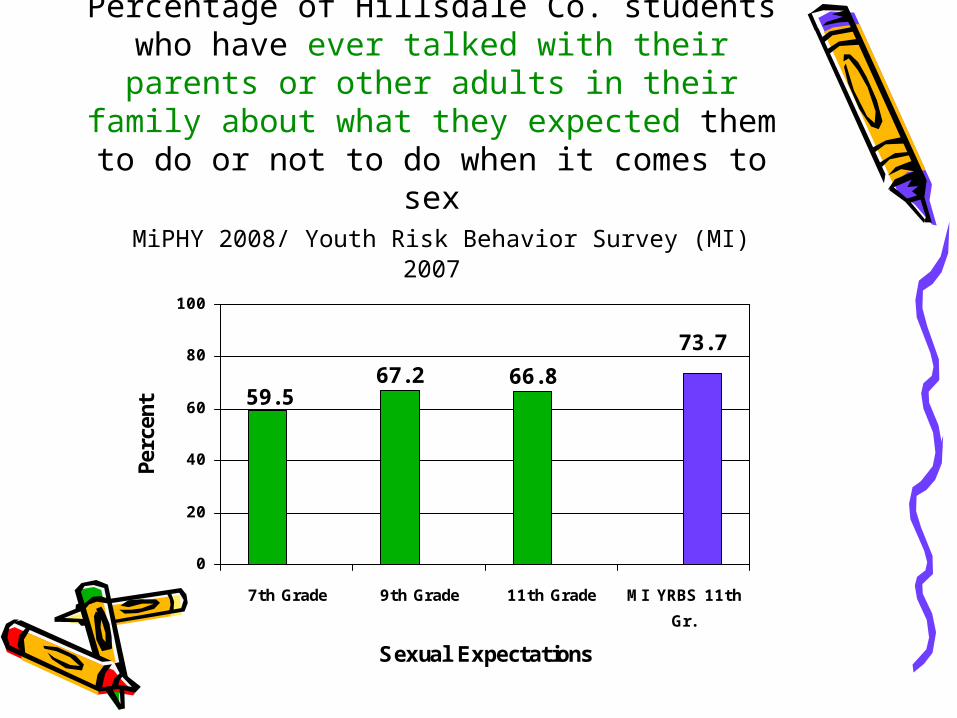
Percentage of Hillsdale Co. students who have ever talked with their parents or
other adults in their family about what they expected them to do or not to do when it
comes to sex MiPHY 2008/ Youth Risk Behavior Survey (MI) 2007
66.867.259.5
73.7
0
20
40
60
80
100
7th Grade 9th Grade 11th Grade MI YRBS 11th
Gr.
Sexual Expectations
Perc
ent
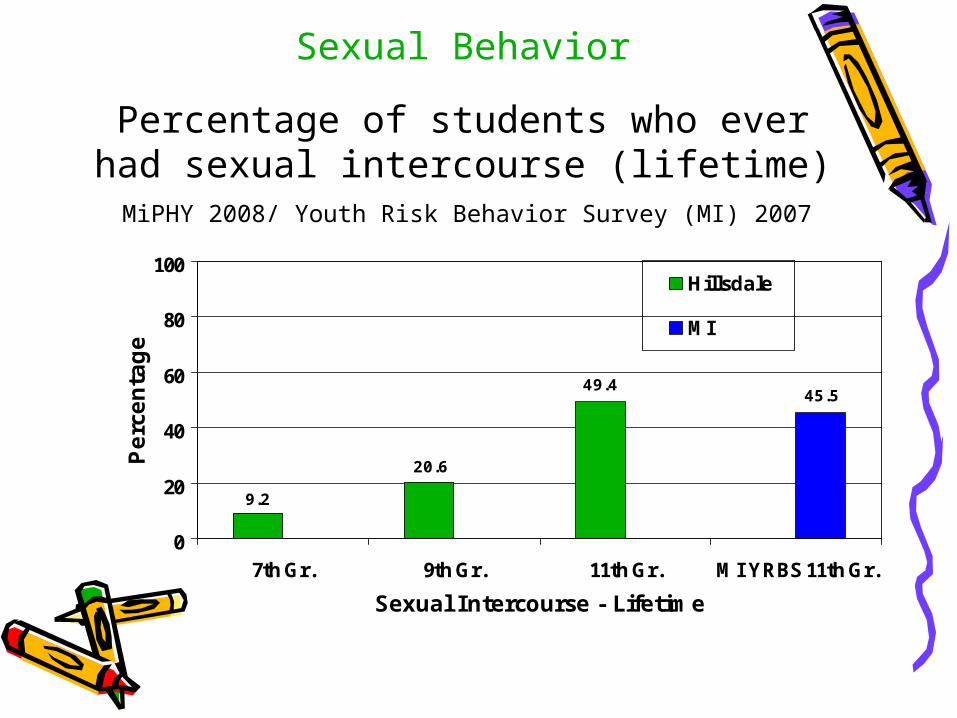
Sexual Behavior
Percentage of students who ever had sexual intercourse (lifetime)
MiPHY 2008/ Youth Risk Behavior Survey (MI) 2007
49.4
20.6
9.2
45.5
0
20
40
60
80
100
7th Gr. 9th Gr. 11th Gr. MI YRBS 11th Gr.
Sexual Intercourse - Lifetime
Perc
enta
ge
Hillsdale
MI
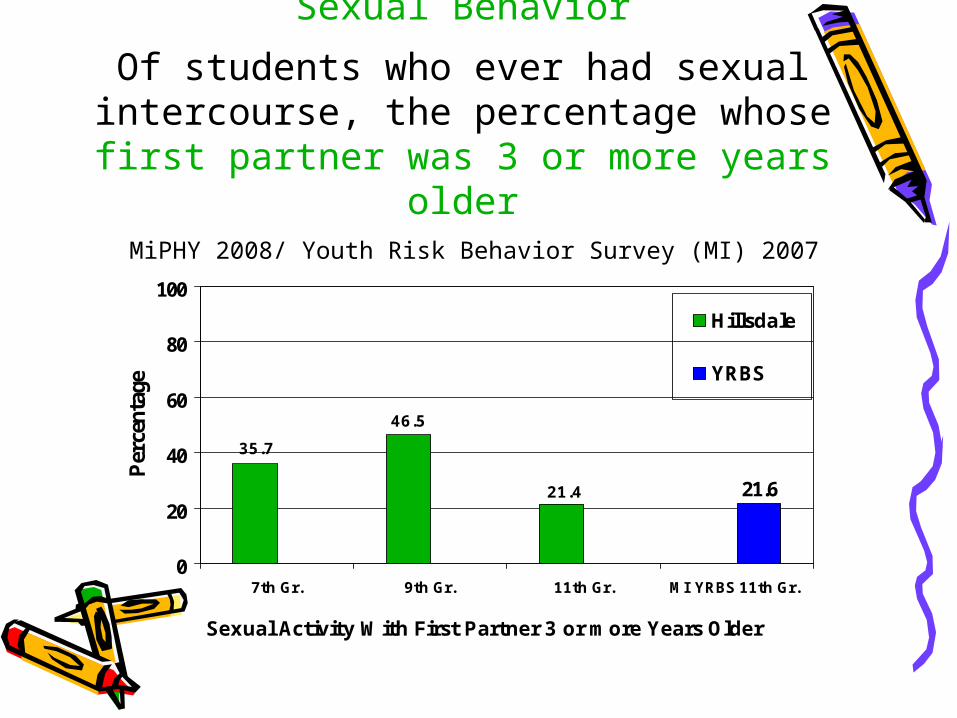
Sexual Behavior
Of students who ever had sexual intercourse, the percentage whose first
partner was 3 or more years older MiPHY 2008/ Youth Risk Behavior Survey (MI) 2007
21.4
46.5
35.7
21.6
0
20
40
60
80
100
7th Gr. 9th Gr. 11th Gr. MI YRBS 11th Gr.
Sexual Activity With First Partner 3 or more Years Older
Per
cent
age
Hillsdale
YRBS

Teen Pregnancy
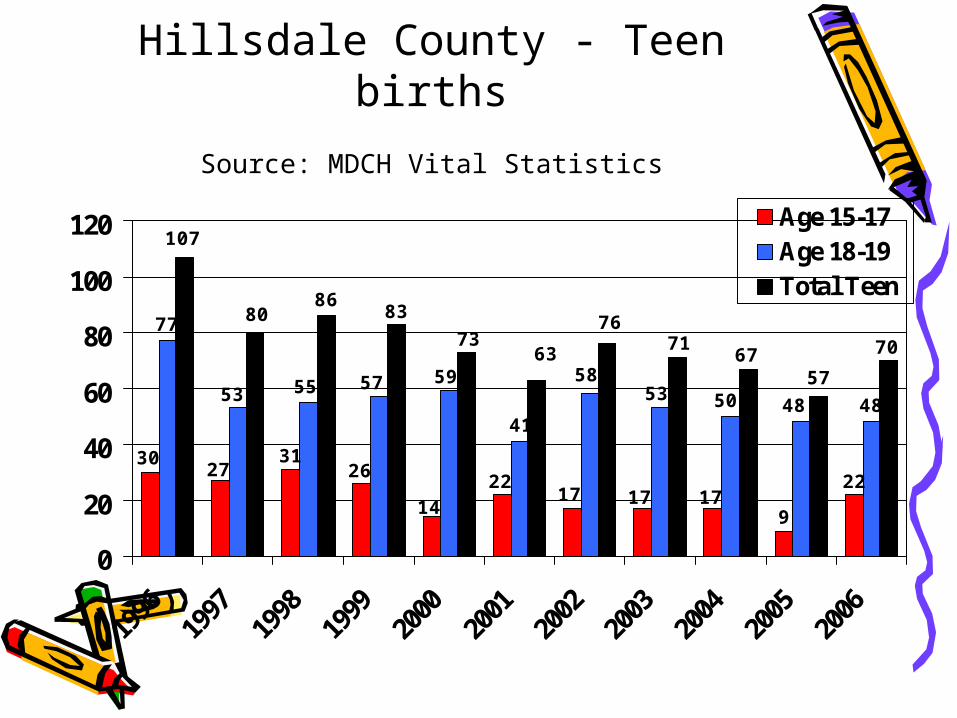
Hillsdale County - Teen births
Source: MDCH Vital Statistics
77
48
22
9171717
2214
2631
2730
48505358
41
59575553
70
5767
7176
6373
8386
80
107
0
20
40
60
80
100
120
1996
1997
1998
1999
2000
2001
2002
2003
2004
2005
2006
Age 15-17Age 18-19Total Teen

Percent of Teen Births Ages 15-19 that are Repeat Births, 2001-2006
Source: MDCH Vital Records and Health Data Development Section
26
20.918.8
11.3
1715.6
0
10
20
30
2001 2002 2003 2004 2005 2006
Perc
ent
HillsdaleBranchMI

Percent Teen Births to Total BirthsHillsdale, Branch Counties and MI
Source: MDCH Vital Statistics
0
5
10
15
20
1994
1996
1998
2000
2002
2004
2006
% T
een B
irth
s to
Tota
l Bir
ths
HillsdaleBranchMI

Abortion rates Hillsdale, Branch and Michigan – 1996-
2006
Source: Michigan Department of Community Health
6.47.1
5.74.7 5
13 12.812.3
11.612.1
12.613.2 13.4
12 11.7 12.111.6
4.74.4 4.965.7
6.5
7.9
0
5
10
15
1996 1998 2000 2002 2004 2006
Rat
e/1,0
00
HillsdaleBranchMI

Abortions by age of motherHillsdale County 2006
Source: Michigan Department of Community Health
Total Abortions 2006
Hillsdale- 47 Branch- 57
0
5
10
15
20
< 20 20- 24 25- 29 30- 34 35- 39 40+
Age of Mother
Num
ber
Hillsdale
Branch
Schools
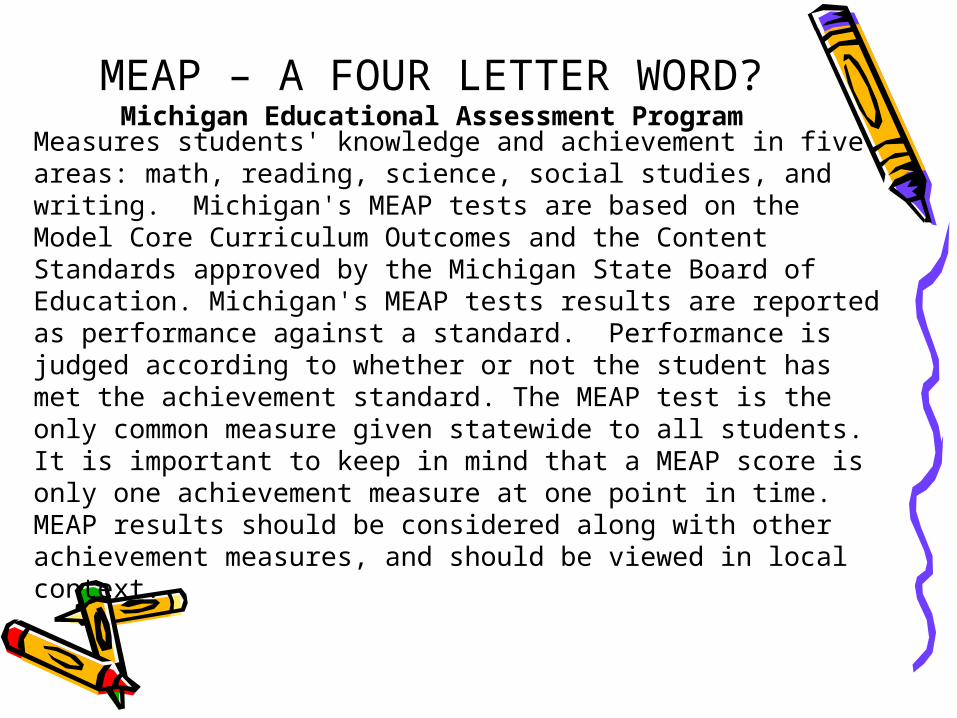
Measures students' knowledge and achievement in five areas: math, reading, science, social studies, and writing. Michigan's MEAP tests are based on the Model Core Curriculum Outcomes and the Content Standards approved by the Michigan State Board of Education. Michigan's MEAP tests results are reported as performance against a standard. Performance is judged according to whether or not the student has met the achievement standard. The MEAP test is the only common measure given statewide to all students. It is important to keep in mind that a MEAP score is only one achievement measure at one point in time. MEAP results should be considered along with other achievement measures, and should be viewed in local context.
MEAP – A FOUR LETTER WORD?Michigan Educational Assessment Program

MEAP Results• Due to changes in the MEAP nearly
every year, trend data is merely impossible. The following data represents a comparison for the MEAP 2007 test results between Hillsdale County and the State. Love it or hate it, the MEAP is standardized across the State and comparing HD to MI is a valid comparison.
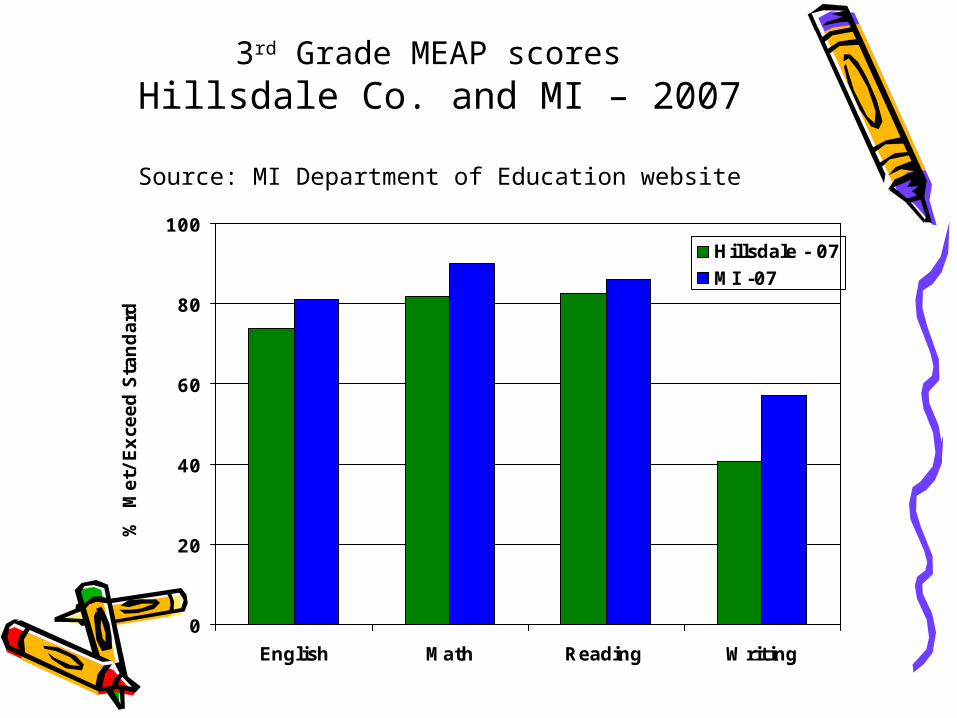
3rd Grade MEAP scores Hillsdale Co. and MI – 2007
Source: MI Department of Education website
0
20
40
60
80
100
English Math Reading Writing
% M
et/E
xce
ed S
tandar
d
Hillsdale - 07MI -07

5th Grade MEAP scores Hillsdale Co. and MI – 2007
Source: MI Department of Education website
0
20
40
60
80
100
English Math Reading Science Writing
% M
et/E
xce
ed S
tandar
d
Hillsdale - 07
MI - 07

7th Grade MEAP scores Hillsdale Co. and MI – 2007
Source: MI Department of Education Website
0
20
40
60
80
100
English Math Reading Writing
% M
et/E
xce
ed S
tandar
d
Hillsdale - 07MI - 07
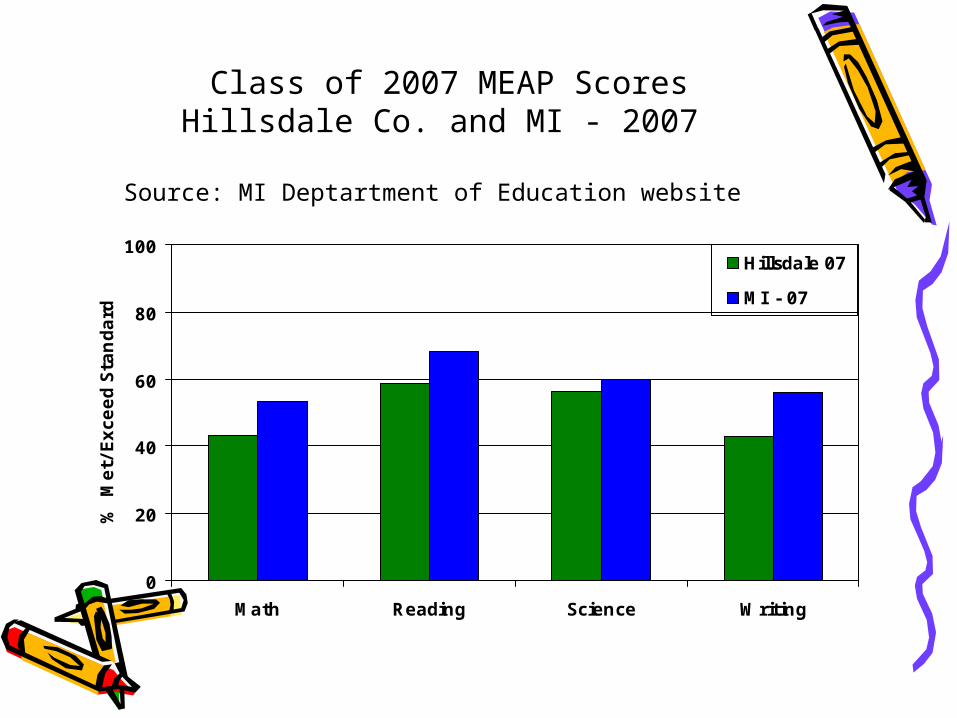
Class of 2007 MEAP ScoresHillsdale Co. and MI - 2007
Source: MI Deptartment of Education website
0
20
40
60
80
100
Math Reading Science Writing
% M
et/
Exce
ed S
tandard
Hillsdale 07
MI - 07

Graduation Rates• The Michigan Department of
Education uses graduation rates to estimate the percentage of grade 9 students who complete and graduate from high school. This is computed by multiplying the 4 retention rates for grades 9-12. Retention rates are the district dropout rate subtracted from 100.

High School Graduation Rates Hillsdale County Districts
Source: Michigan Center for Educational Performance and
Information
0
20
40
60
80
100
2000-01 2001-02 2002-03 2003-04 2004-05 2005-06 2006-07
Camden
Hillsdale
Jonesville
Litchfield
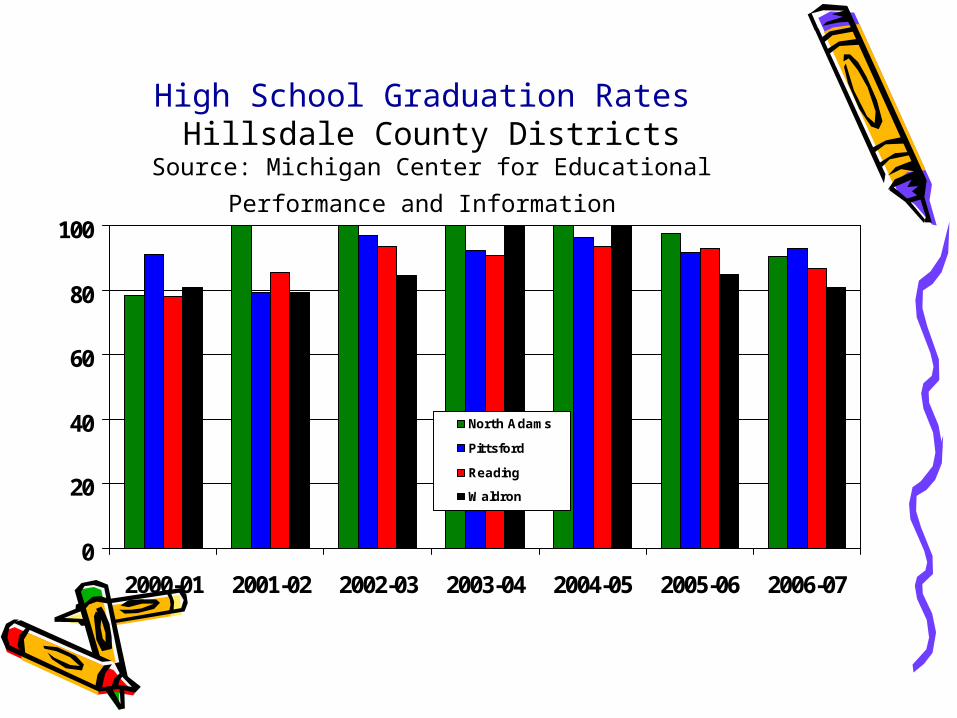
High School Graduation Rates Hillsdale County Districts
Source: Michigan Center for Educational Performance and
Information
0
20
40
60
80
100
2000-01 2001-02 2002-03 2003-04 2004-05 2005-06 2006-07
North Adams
Pittsford
Reading
Waldron

Percent in Special EducationHillsdale, Branch Counties and Michigan
2000-2006/07 School year
Source: Kids Count of Michigan
16.51818.217.717.4
14.413.8
0
5
10
15
20
2000 2001 2002 2003 2004 2005 2006
Perc
ent
HillsdaleBranchMI
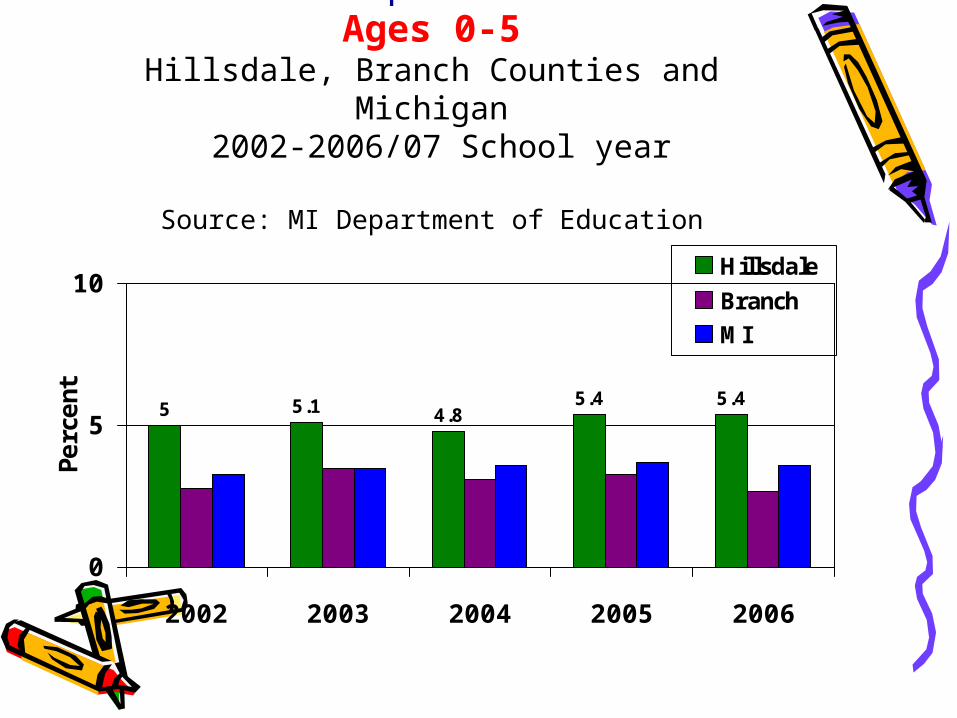
Percent in Special Education Ages 0-5
Hillsdale, Branch Counties and Michigan 2002-2006/07 School year
Source: MI Department of Education
5 5.1 4.85.4 5.4
0
5
10
2002 2003 2004 2005 2006
Perc
ent
Hillsdale
BranchMI

Number of Children Under 18 On SSI
Hillsdale, Branch Counties 2002-2007
Source: Social Security website
140
205201
150176 183
12512812910810297
0
50
100
150
200
250
2002 2003 2004 2005 2006 2007
Num
ber
Under
18 o
n S
SI
HillsdaleBranch
Abuse and neglect
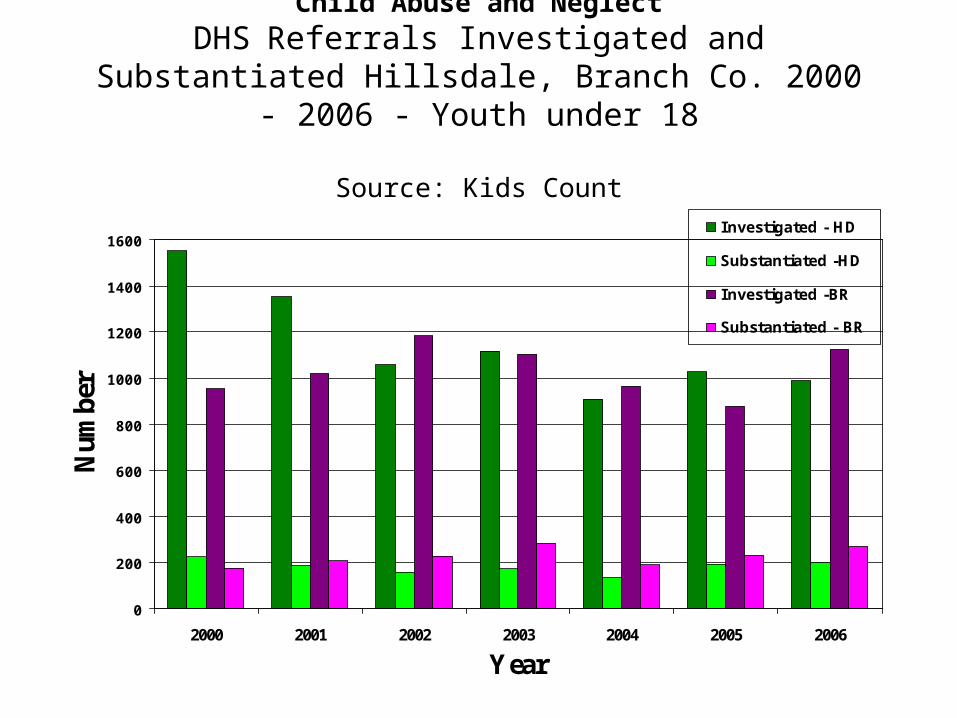
Child Abuse and NeglectDHS Referrals Investigated and Substantiated
Hillsdale, Branch Co. 2000 - 2006 - Youth under 18
Source: Kids Count
0
200
400
600
800
1000
1200
1400
1600
2000 2001 2002 2003 2004 2005 2006
Year
Num
ber
Investigated - HD
Substantiated -HD
Investigated -BR
Substantiated - BR

Child Abuse and NeglectRates Per 1,000 Children - 2000-
2006Kids Count of Michigan
13.211.411 10.4
17.5
15.3 14.7
18.5
16.6
11.411.110.510.411.7
0
5
10
15
20
25
30
2000 2001 2002 2003 2004 2005 2006
Ra
te P
er
1,0
00
Ch
ild
ren
Hillsdale
Branch
MI
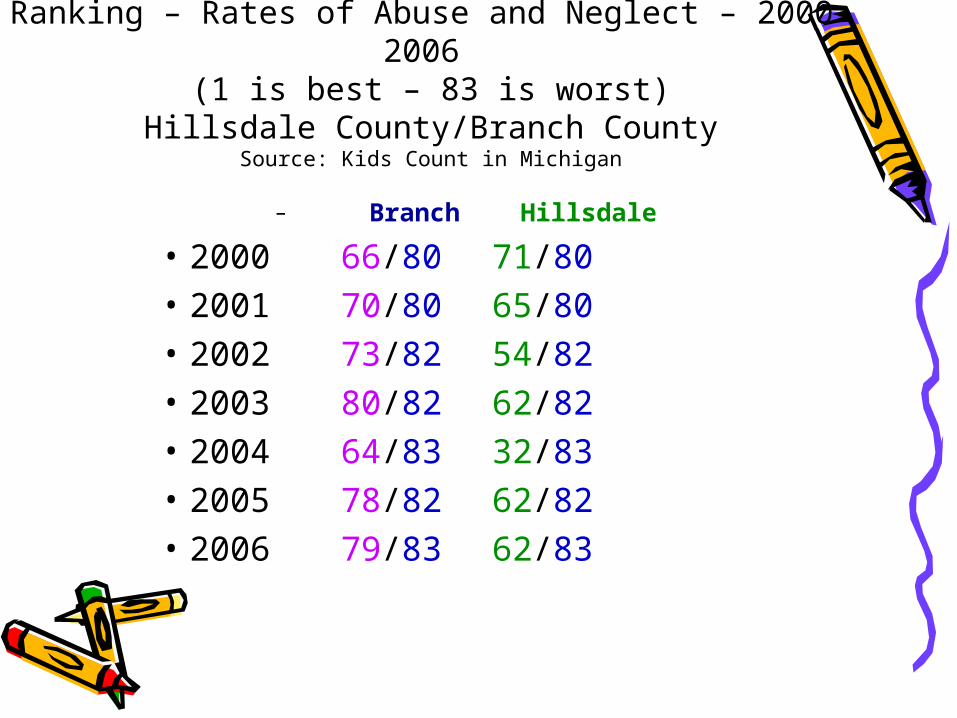
Ranking – Rates of Abuse and Neglect – 2000-2006 (1 is best – 83 is worst)
Hillsdale County/Branch CountySource: Kids Count in Michigan
– Branch Hillsdale
• 2000 66/80 71/80• 2001 70/80 65/80• 2002 73/82 54/82• 2003 80/82 62/82• 2004 64/83 32/83• 2005 78/82 62/82• 2006 79/83 62/83

DHS Foster Care - Youth under 182002-2007 quarterly averages
Hillsdale, Branch Co.
Source: DHS Web site/DHS reports
42
34
20
44
5448
42
3329
5666
55
0
20
40
60
80
100
2002 2003 2004 2005 2006 2007*
Calendar Year (* - 2007 - 3 qtrs.)
Num
ber
Hillsdale Avg.
Branch Avg.
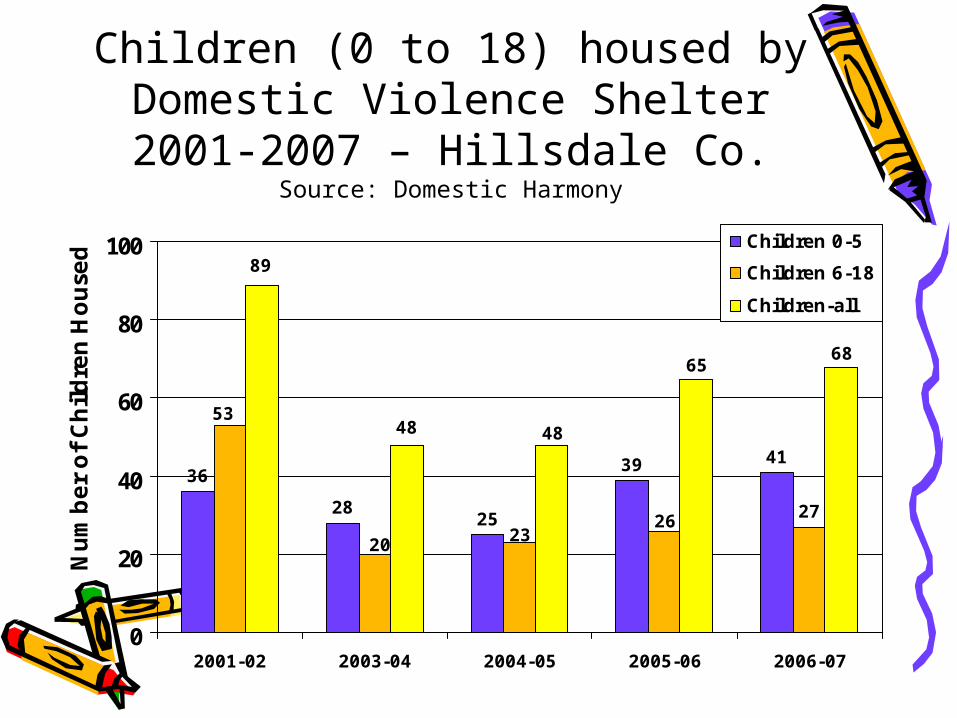
Children (0 to 18) housed by Domestic Violence Shelter2001-2007 – Hillsdale Co.
Source: Domestic Harmony
36
2825
39 41
27262320
53
6865
4848
89
0
20
40
60
80
100
2001-02 2003-04 2004-05 2005-06 2006-07
Num
ber
of Childre
n H
ouse
d Children 0-5
Children 6-18
Children-all

Resident nights provided for children
(0 to 18) by Domestic Violence Shelter, 2001-2007 – Hillsdale Co.
Source: Domestic Harmony
1388
1066
807 797 819
1187
0
500
1000
1500
2001-02 2002-03 2003-04 2004-05 2005-06 2006-07
Num
ber
Res
iden
t N
ights
Children 0-18

Juvenile Court(some basics)
• Step 1- Preliminary hearing – screen out cases not needing to go before Juvenile court judge (first time offenders, minor offenses). These minors are included in the number of juveniles under the jurisdiction of the court.
• Step 2 -Adjudication – case goes before judge. Status determined. Investigation activated to determine course of action.
• Step 3 - Disposition – Judge decides course of action (sentence) for juvenile offender/family.

Total Minors under Court Jurisdiction Hillsdale Co. 1998-2007
Source: Hillsdale County Juvenile Court
243
346
170177183
180
747
580
367
438
9076
32242642
140
201232
190
0
200
400
600
800
1998 1999 2000 2001 2002 2003 2004 2005 2006 2007
Num
ber
under
Court
Juri
sdic
tion Delinquency
Child Protection
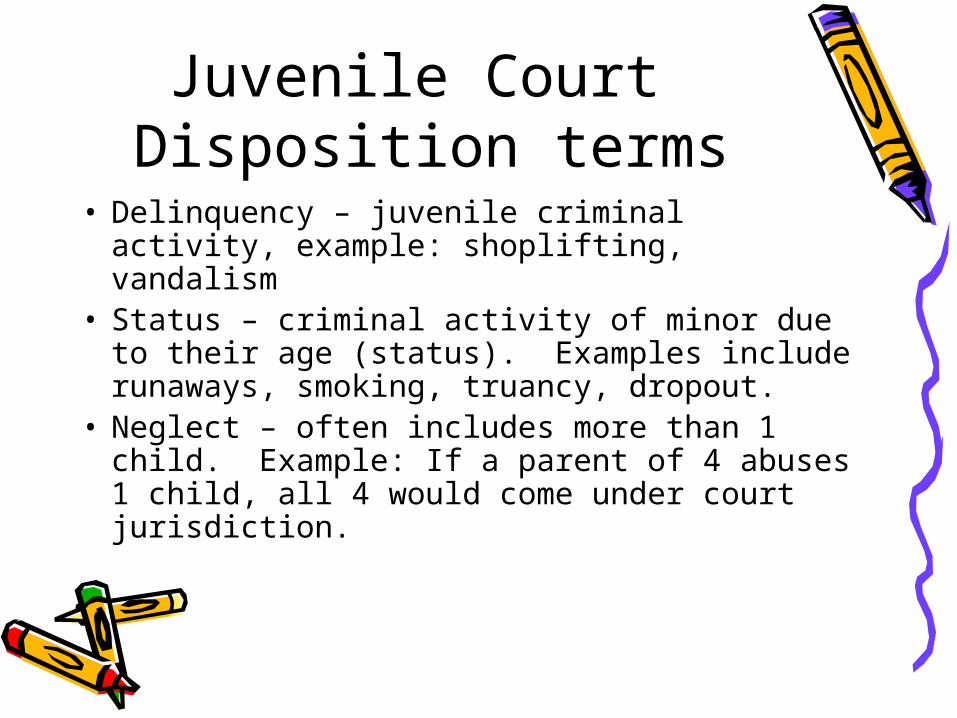
Juvenile Court Disposition terms
• Delinquency – juvenile criminal activity, example: shoplifting, vandalism
• Status – criminal activity of minor due to their age (status). Examples include runaways, smoking, truancy, dropout.
• Neglect – often includes more than 1 child. Example: If a parent of 4 abuses 1 child, all 4 would come under court jurisdiction.

Juvenile Court petitions disposed Hillsdale Co. 2000-2007
Source: Hillsdale County Juvenile Court
38
273281
209
309
460
300
368356
87
173
39685865
83
34312018
5827 21 150
100
200
300
400
500
2000 2001 2002 2003 2004 2005 2006 2007
Num
ber
of Peti
tions
Dis
pose
d DelinquencyStatusNeglect

Jackson/Hillsdale Mental Health Diagnoses for Children
Source: LifeWays CMH
Children 0 - 17
0.00%
5.00%
10.00%
15.00%
20.00%
25.00%
30.00%
35.00%
40.00%
45.00%
2005 2006 2007 2008
Conduct/ODD
Adjustment Disorders
Attention Deficit Disorder
Major Depressive Disorder
Bipolar Disorders
Anxiety/OCD/PTSD Disorders
* Data represents top 6 diagnoses types, not entire data set.
Moral CompassStudents in grades 7,9,11
Hillsdale County
Source: MiPHY 2008

“Not okay to take something without asking as long as you get away with
it”Source: MiPHY 2008
0
20
40
60
80
100
7th Gr 9th Gr 11th Gr Gender
Num
ber
of Stu
dents
Who A
gre
e
Total
Male
Female
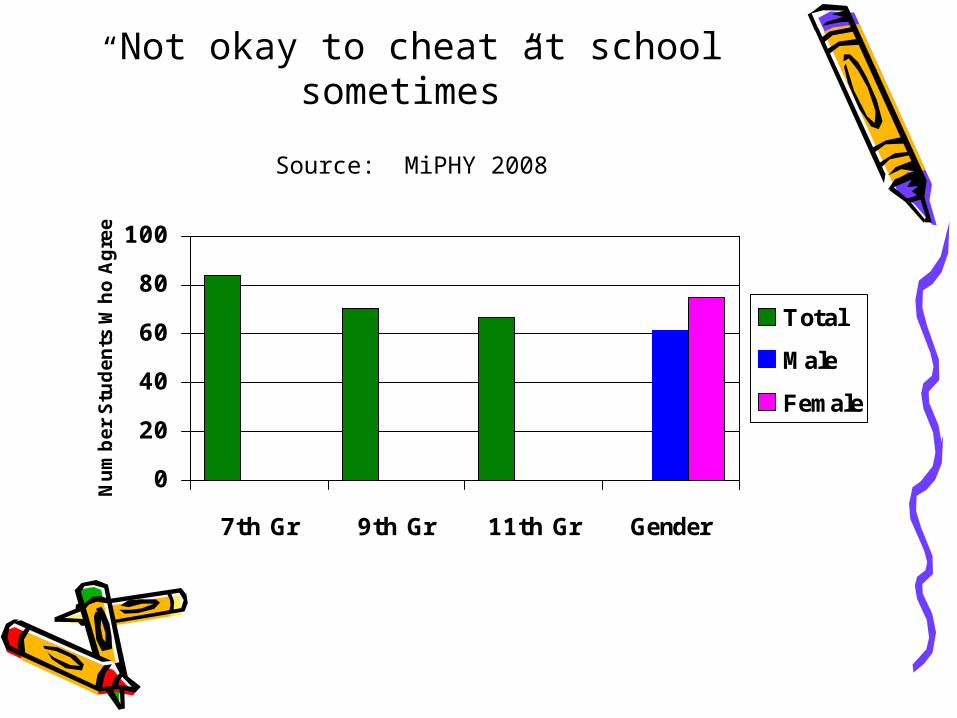
“Not okay to cheat at school sometimes”
Source: MiPHY 2008
0
20
40
60
80
100
7th Gr 9th Gr 11th Gr Gender
Num
ber
Stu
den
ts W
ho A
gre
e
Total
Male
Female

“Not all right to beat up people if they start the fight”
Source: MiPHY 2008
0
20
40
60
80
100
7th Gr 9th Gr 11th Gr Gender
Num
ber
of Stu
dents
Who A
gre
e
Total
Male
Female

Economics – show me the money !!

Children receiving free or reduced lunchesPercent of Total - Hillsdale, Branch Co. and MI Source: MI Dept. of Ed. Web site/MI Center for Educational Performance
31
37.5
32
35
41
47.244.9
43.4
40.8
32
36 37.138.1
20
30
40
50
2000-01 2001-02 2004-05 2005-06 2006-7 2007-8
Per
cen
tage
HillsdaleBR %MI %

Percentage of children living in poverty ages 5-17
Hillsdale, Branch and Michigan percentsSource: Kids Count
0
5
10
15
20
2000 2002 2003 2004
Hillsdale
Branch
MI
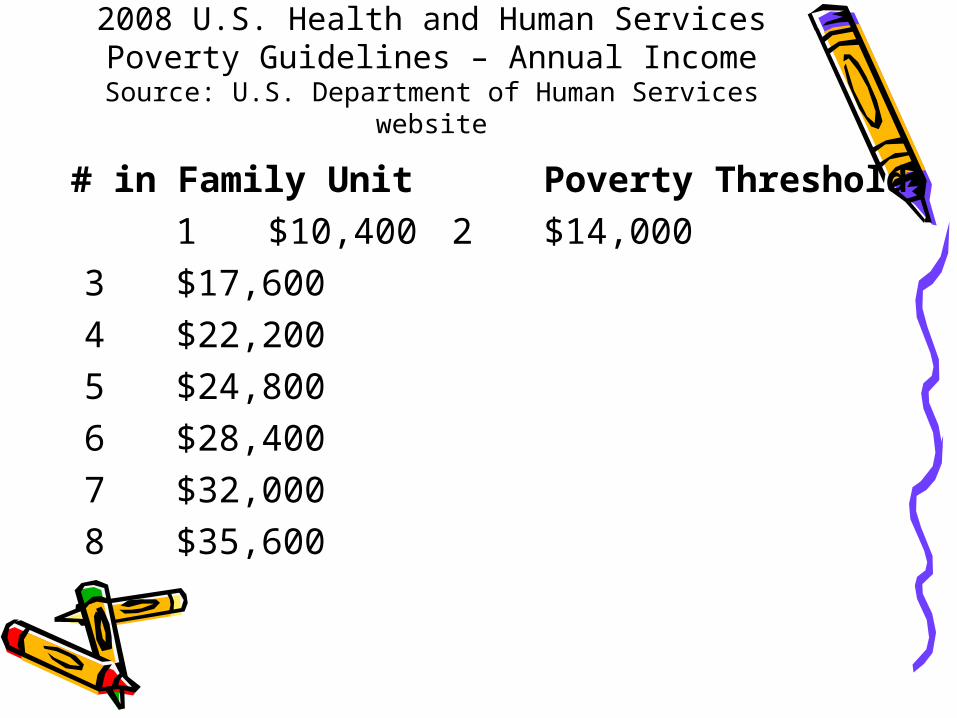
2008 U.S. Health and Human Services Poverty Guidelines – Annual Income
Source: U.S. Department of Human Services website
# in Family Unit Poverty Threshold
1 $10,4002 $14,000
3 $17,6004 $22,2005 $24,8006 $28,4007 $32,0008 $35,600
Wisdom?• When I was a boy of fourteen, my
father was so ignorant I could hardly stand to have the old man around. But when I got to be twenty-one, I was astonished at how much the old man had learned in seven years.
Mark
Twain

Oh to do it all again
If I had my child to raise over again
I'd build self-esteem first and the house later
I'd finger paint more and point the finger less
I would do less correcting and more connecting
I'd take my eyes off my watch and watch with my eyes
I would care to know less and know to care more
I'd take more hikes and fly more kites
I'd stop playing serious and seriously play
I would run through more fields and gaze at more stars
I'd do more hugging and less tugging
I'd see the oak tree in the acorn more often
I would be firm less often and affirm much more
I'd model less about the love of power
And more about the power of love.
Diane Loomans