effects of succession planning on organisation …
TRANSCRIPT
EFFECTS OF SUCCESSION PLANNING ON ORGANISATION PERFORMANCE
AMONG NON-GOVERNMENTAL ORGANISATIONS’ IN KENYA
ONYANGO JOSEPH ODHIAMBO
Thesis Presented to the Institute of Graduate Studies in Partial Fulfillment of the
Requirement for the Award of Doctor of Philosophy Degree in Business Administration
Kabarak University
September 2015

ii
DECLARATION
I hereby declare that this research project is my original work and has not been submitted to
any of the University or College for purposes of examination or academic award. Any
information given is my entire work and all the relevant sources are quoted and
acknowledged accordingly
Sign………………………………………………………… Date…………………………
Students: Onyango Joseph Odhiambo GDB/M/1334/09/11

iii
RECOMMENDATION
The research thesis titled “Effects of Succession Planning on Organisation Performance
among Non-governmental Organisations in Kenya” is prepared by Onyango Joseph
Odhiambo. We have reviewed this research thesis and it has been submitted with our
approval as the University supervisors.
Sign…………………………..…………………………. Date …………………………
Prof. Lily Njanja
Associate Professor of Business Management and Policy
St Paul’s University
Sign………………………………………………………. Date …………………………
Dr Charles Zakayo
Senior Lecturer, School of Business
Kabarak University

iv
COPY RIGHT
This thesis is original work of Onyango Joseph Odhiambo. No part or whole of the document can be
supplied, reproduced or copied, both in electronic and material form without the permission of the
author
ACKNOWLEDGEMENTS
My gratitude to almighty God for the grace and blessing that has enabled me to undertake
doctoral studies at the School of Business of Kabarak University. I am deeply indebted to my
supervisors, Prof. Lilly Njanja and Dr. Charles Zakayo, for their excellent guidance and
support without whose help this project would not have been a success.
I wish to thank my academic referees: Prof. William Ogara, Prof. Fredrick Mvumbu, and Dr.
Japhet Ndhlovu for their continuous guidance and counseling. I also wish to thank my
professional referees: Mr. James Nyamosi, Mr. Denis Juma and Mr. Isaac Otolo for their
exemplary coaching and mentorship support.
For the technical and logistical support, I wish to thank my research assistants; Philip Masibu
and Peter Gitau. I also wish to thank Dr Stella Muhanji, Mr Philip Ragama Lawrence
Mwaniki, Christopher Maronga and Victor Musau for providing statistical insight and
constructive critique as subject matters experts. Titus Waita for proof reading the document.
Over and above I wish to thank my family, friends and colleagues collectively for their
support and encouragement.

vi
DEDICATION
This project is dedicated to my lovely wife Sheilla Mideva and our wonderful daughter
Jasmine Hawi.

vii
ABSTRACT
Succession planning is a critical tool for guaranteeing organisational growth and continuity.
Employees in an organisation always choose to move on to other career opportunities, retire
or leave for many other reasons. This is a challenge to the organisations’ ability in ensuring
continuity of their needed right workforce. This study assessed the effects of succession
planning practices on organisational performance among Non-Governmental Organisations’
(NGOs) in Kenya. The specific objectives were to: identify the scope of succession planning
practices, establish the extent to which succession planning influences stakeholder’s
outcomes, explore the role of succession planning on internal business process and determine
the extent to which succession planning contributes to the growth of NGOs in Kenya.
Relevant literatures were reviewed in order to develop a theoretical and conceptual
framework, assist in fine-tuning the statement problem, establish the gap for the study and
guide in the development of survey questionnaire. The research adopted descriptive and
quantitative research designs. The targeted population of the study was 1172 NGOs based in
Nairobi and the sample for the study was (n=270). The primary data was collected using a
questionnaire. Descriptive analysis was carried out on categorical data. Inferential analysis
was conducted with the use of non-parametric tests. Secondary data was collected through
review of relevant literatures. Findings revealed that majority of the organisations (n=270)
had about 10 employees on average characterized low levels of succession planning practice.
The practice of succession planning among NGOs indicated that; less than half of these
organisations had written succession planning policies (39%) and only (18%) indicated that
they identify potential successors. Overall, the model summary resulted to 42.2% of
organisation performance as being explained by the combined effect of strategic HRM,
succession characteristics and periodic assessment that constituted the depended variable of
succession planning without moderating variable. The combined effect of strategic HRM,
succession characteristics and periodic assessment that is succession planning on
organisation performance whine moderating effect of years of establishment and total staff
establishment applied changed to 44.7%. This implied that there is a significant effect of
moderation effect of years of establishment and size of staff establishment on succession
planning and organisation performance.
Keywords: Succession planning, Organisation performance, Non-Governmental
Organisations, Stakeholder outcomes, internal business processes and institutional growth.
TABLE OF CONTENTS
DECLARATION .................................................................................................................................................. II
RECOMMENDATION ....................................................................................................................................... III
COPY RIGHT...................................................................................................................................................... IV
ACKNOWLEDGEMENTS .................................................................................................................................. V
DEDICATION ..................................................................................................................................................... VI
ABSTRACT....................................................................................................................................................... VII
TABLE OF CONTENTS .................................................................................................................................. VIII
LIST OF TABLES ................................................................................................................................................ X
LIST OF FIGURES .......................................................................................................................................... XIV
ACRONYMS ..................................................................................................................................................... XV
CHAPTER ONE: ................................................................................................................................................... 1
INTRODUCTION ................................................................................................................................................. 1
1.1 Background of the Study ............................................................................................. 1
1.2 Statement of the Problem ............................................................................................. 5
1.3 General Objective ........................................................................................................ 6
1.4 Specific Objectives ...................................................................................................... 6
1.5 Research Question ....................................................................................................... 6
1.6 Hypothesis ................................................................................................................... 6
1.7 Significance of the Study ............................................................................................. 7
1.8 Scope of the Study ....................................................................................................... 8
1.9 Limitation and Delimitation ........................................................................................ 8
1.10 Definition of Terms ................................................................................................... 8
CHAPTER TWO: ................................................................................................................................................ 10
LITERATURE REVIEW .................................................................................................................................... 10
2.1 Introduction ................................................................................................................ 10
2.2 Succession Planning .................................................................................................. 10
2.2 Theoretical Perspective .............................................................................................. 11
2.3 Brief Historical Development of Succession Planning in Management.................... 12
2.4 Succession Planning Models ..................................................................................... 14
2.5 Succession Planning Process and Approach .............................................................. 21
2.6 Significance of Succession Planning ......................................................................... 24
2.7 Organisation Performance: An Overview.................................................................. 26
2.8 Empirical Review ...................................................................................................... 34
2.9 The conceptual framework ........................................................................................ 38
ix
2.10 The Gap in the Study ............................................................................................... 39
CHAPTER THREE: ............................................................................................................................................ 40
RESEARCH METHODOLOGY ......................................................................................................................... 40
3.1 Introduction ................................................................................................................ 40
3.2 Research Design ........................................................................................................ 40
3.3 Targeted Population ................................................................................................... 41
3.4 Sampling Procedure ................................................................................................... 41
3.5 Data and Instruments of Data Collection ................................................................... 43
3.6 Ethical Consideration ................................................................................................. 45
3.7 Data Analysis and Presentation ................................................................................. 45
CHAPTER FOUR ................................................................................................................................................ 50
ANALYSIS AND DISCUSSIONS OF THE FINDINGS ................................................................................... 50
4.1 Introduction ................................................................................................................ 50
4.2 Background Information ............................................................................................ 52
4.3. Descriptive Analysis and Discussions of Findings of main Variables ..................... 56
4.4 Succession Planning Practices among Non-Governmental Organisations’ .............. 72
4.5 Succession planning and stakeholders outcomes ....................................................... 81
4.6 Succession planning and internal business processes ................................................ 91
4.7 Succession planning and institutional growth ........................................................... 99
4.8 Overall combined effect of succession planning on organisation performance ...... 106
CHAPTER FIVE ............................................................................................................................................... 110
SUMMARY, CONCLUSIONS AND RECOMMENDATIONS ...................................................................... 110
5.1 Introduction .............................................................................................................. 110
5.2 Summary .................................................................................................................. 110
5.3 Conclusion ............................................................................................................... 117
5.4 Recommendations .................................................................................................... 118
5.5 Suggestions for further studies ................................................................................ 119
REFERENCES .................................................................................................................................................. 121
APPENDICES ................................................................................................................................................... 132
APPENDIX I: QUESTIONNAIRE ............................................................................................................... 132
APPENDIX 2: FACTOR LOADING ............................................................................................................ 138
APPENDIX 3: JOURNAL PUBLICATIONS ............................................................................................... 159
x
LIST OF TABLES
Table 1: Best in Class PACE Model ....................................................................................... 18
Table 2: Stratified Sampling Schedule .................................................................................... 43
Table 3: One-Sample Kolmogorov-Smirnov Test .................................................................. 51
Table 4: Summary Analysis of Variables for Inferential Statistics......................................... 52
Table 5: Summary of Background Information ...................................................................... 52
Table 6: Organisation’s Staff Establishment and Tenure of Existence ................................... 53
Table 7: Annual Budget and Level of Staff Establishment .................................................... 54
Table 8: Annual budget and level of staff establishment ........................................................ 55
Table 9: Strategic Human Resource Programs ....................................................................... 56
Table 10: Chi- Square Test for Strategic HRM Programs ...................................................... 58
Table 11: Linkage to Strategic Plans ...................................................................................... 59
Table 12: Top Management Support....................................................................................... 60
Table 13: Total Employee Involvement .................................................................................. 61
Table 14: Periodic Assessment ............................................................................................... 64
Table 15: Stakeholders Outcome ............................................................................................ 66
Table 16: Internal Business Process ........................................................................................ 69
Table 17: Institutional Growth ............................................................................................... 71
Table 18: Years of organisation existence and potential successors being identified ............ 73
Table 19: Chi-Square test on years of existence and written succession plan policy ............. 74
Table 20: Organisation Existence and Written Succession Plan Policy ................................. 75
Table 21: Chi- square test on Organisation existence and written succession plan policy ..... 76
Table 22: Organisation existence and the scope of succession planning involvement ........... 77
Table 23: Organisation existence and the scope of succession planning involvement ........... 78
Table 24: Organisation existence and type of succession planning ........................................ 79
Table 25: Chi-Square test on type of succession planning and years of existence ................. 80
Table 26: Correlation matrix for succession planning and stakeholder’s outcomes ............... 81
Table 27: Model Summary of Succession Planning and Stakeholders Outcomes.................. 82
Table 28: Analysis of Variance for Succession Planning and Stakeholders Outcomes ......... 83
Table 29: Regression Analysis of Succession Planning and Stakeholders Outcomes ............ 83
Table 30: Model Summary of Strategic Planning and stakeholders outcomes ....................... 84

xi
Table 31: Analysis of variance on strategic HRM programs and stakeholders outcome ....... 85
Table 32: Coefficients of strategic HRM programs and stakeholders outcomes .................... 85
Table 33: Model summary of Succession Characteristics and Stakeholders Outcomes ......... 86
Table 34: Analysis of Variance on Succession Characteristics and Stakeholders Outcomes . 87
Table 35: Coefficient’s of Succession Characteristics and stakeholders Outcomes ............... 88
Table 36: Model Summary Analysis of Periodic Assessment and Stakeholders Outcomes .. 89
Table 37: Analysis of Variance of Periodic Assessment and Stakeholders Outcome ............ 89
Table 38: Coefficients of Periodic Assessment and Stakeholders Outcomes ......................... 90
Table 39: Correlation Matrix for Internal Business Process ................................................... 91
Table 40: Model Summary of Succession planning and Internal Business Process ............... 92
Table 41: Analysis of Variance of Succession planning and Internal Business Process ........ 92
Table 42: Coefficients of Succession planning and Internal Business Process ...................... 93
Table 43: Model Summary of Strategic HRM and Internal Business Process ....................... 93
Table 44: Analysis of Variance: Strategic HRM programs and Internal Business Process.... 94
Table 45: Coefficient for strategic HRM Programs and Internal Business Process ............... 95
Table 46: Model summary of succession characteristics and internal business process ........ 96
Table 47: Analysis of Variance on Succession Characteristics and stakeholder outcome ..... 96
Table 48: Coefficients of succession characteristics and internal business process ............... 97
Table 49: Model Summary of Periodic Assessment and Internal Business Processes ........... 97
Table 50: Analysis of Variance for Periodic Assessment and Internal Business Process ...... 98
Table 51: Coefficients of periodic assessment and internal business process ........................ 98
Table 52: Correlation Matrix for Institutional Growth ........................................................... 99
Table 53: Model Summary of Succession Planning and Institutional Growth ..................... 100
Table 54: Analysis of Variance for Succession Planning and Institutional Growth ............. 100
Table 55: The Coefficients of Succession Planning and Institutional Growth ..................... 101
Table 56: Model Summary of Strategic HRM programs and Institutional Growth ............. 101
Table 57: Analysis of Variance of Strategic HRM programs and Institutional Growth ....... 102
Table 58: Correlations for Strategic HRM Programs and Institutional Growth ................... 102
Table 59: Summary Analysis of Succession Characteristics and Institutional Growth ........ 103
Table 60: Analysis of Variance for Succession Characteristics and Institutional Growth ... 104
Table 61: The Coefficients for Succession Characteristics and Institutional Growth .......... 104
Table 62: Model Summary Analysis for Periodic Assessment and Institutional Growth .... 105
xii
Table 63: Analysis of Variance for Periodic Assessment and Institutional Growth............. 105
Table 64: Coefficients for Periodic Assessment and Institutional Growth ........................... 106
Table 65: Regression Analysis on Succession Planning and Organizational Performance. . 107
Table 66: Model Summary of combined effect on organisation performance ..................... 107
Table 67: Analysis of Variance on the combined effect of succession planning .................. 108
Table 68: Coefficients on the combined effect of succession planning variables ................ 109
Table A1: Correlation Matrix................................................................................................ 138
Table A2: Sampling Adequacy for Strategic HRM Programs .............................................. 139
Table A3: Communalities for Strategic HRM Programs Indicators ..................................... 139
Table A4: Component Matrix for Strategic HRM Programs ................................................ 140
Table A5: Total Variance Explained for Strategic HRM Programs ..................................... 141
Table B1: Correlation Matrix for Succession Planning Characteristic ................................. 142
Table B2: Sample Adequacy for Succession Characteristics ............................................... 143
Table B3: Communalities for Succession Planning Characteristics ..................................... 143
Table B4: Components Matrix for Succession Planning Characteristics ............................. 144
Table B5: Total Variance Explained for Succession Characteristics .................................... 145
Table C1: Correlation Matrix for Periodic Assessment ........................................................ 146
Table C2: Sampling Adequacy for Periodic Assessment ..................................................... 147
Table C3: Communalities for Periodic Assessment.............................................................. 147
Table C4: Component Matrix for Periodic Assessment ....................................................... 148
Table C5: Total Variance Explained for Periodic Assessment ............................................. 148
Table D1: Correlation Matrix for Stakeholder’s Outcomes .................................................. 149
Table D2: Sampling Adequacy for Stakeholder’s Outcomes ............................................... 150
Table D3: Communalities for Stakeholder’s Outcomes ....................................................... 150
Table D4: Component Matrix for Stakeholder’s Outcomes ................................................. 151
Table D5: Total Variance Explained for Stakeholders Outcomes ........................................ 151
Table E1: Correlation Matrix for Internal Business Process ................................................ 152
Table E2: Sampling Adequacy for Internal Business Process .............................................. 153
Table E3: Communalities for Internal Business Process ...................................................... 153
Table E4: Components Matrix for Internal Business Process .............................................. 154
Table E5: Total Variance Explained for Internal Business Process ..................................... 154
Table F1: Correlation Matrix for Institutional Growth ......................................................... 156
xiii
Table F2: Sampling Adequacy for Internal Institutional Growth ......................................... 157
Table F3: Communalities for Institutional Growth ............................................................... 157
Table F4: Component Matrix for Institutional Growth ........................................................ 158
Table F5: Total variance explained for institutional growth ................................................. 158
LIST OF FIGURES
Figure 1: Seven - Pointed Star Model for Systematic Planning.............................................. 15
Figure 2: Balanced Scorecard Framework .............................................................................. 32
Figure 3: Conceptual Framework ........................................................................................... 38
Figure 4: Data analysis and presentation flow chart ............................................................... 48
Figure 5: Norman P-P plot of regression standard residual .................................................... 50

ACRONYMS
ALNAP Active Learning Network for Accountability and Performance
CEO Chief Executive Officer
CI Confidence Interval
Chi Chi-Square
Coef Coefficient of correlation
BSC Balanced Scorecard
GoK Government of Kenya
HIV/AIDs Human Immuno Virus and Acquired Immune Deficiency Syndrome
HR Human Resources
HRM Human Resource Management
IT Information Technology
KPMG Klynveld Peat Marwick Group
NGO Non-Governmental Organisations
NPOs Not-for Profit Organisation
Obs Observations
OP Organisational Performance
PACE Pressures, Actions, Capabilities, and Enablers
PO Profit Organisations
SEM Structured Equation Model
SP Succession Planning
SPSS Statistical Package for Social Sciences
SS Sum of Squares
USA United States of America

CHAPTER ONE:
INTRODUCTION
1.1 Background of the Study
This chapter introduces the background to the study on succession planning, organisation
performance and non-governmental organisations’ (NGOs) in general. It presents the problem
statement, the research objectives, the research questions, the hypothesis, the significance of
the study, the scope as well as limitations to the study.
1.1.1 Succession Planning
Succession planning is described as the means through which organisations prepare for and
replace managers and employees to ensure that there is continuity of the needed workforce in
the organisation. According to Rothwell (2001), people in the organisation always choose to
move on to other career opportunities, retire or leave for many other reasons. Succession
planning is, therefore, a critical tool for guaranteeing organisational growth and continuity. It
eliminates substantial gaps in institutional memory, institutional knowledge and leadership
through strategic placement of key personnel needed in the organisation. Whether public or
private, the organisation’s survival is based on its ability to bring on board and sustain high
quality workforce over a period of time. Many organisations are currently facing mounting
pressureto ensure their sustainability, flexibility, and responsiveness to the increasing
uncertainty and limitations in the economic world.Ultimately, increased turbulence in the
employment environment, characterized by organisational restructuring, funding uncertainties
and increasing program complexities have substantial effects on the ways organisations
respond to workforce replacement (Caudron, 1999).
At a global level, succession planning is receiving more attention not only as a concern for the
management of human resources, but also as an institutional strategic management
component for ensuring performance and growth. In one of the recent surveys by Rothwell
(2010), top corporate companies revealed that the main reasons for having succession
2
planning programs are attributed to the challenge of maintaining a pool of potential
successors. However, at a local level, Kenya’s Vision 2030 has recognized that the country’s
main potential lies on its people. Indeed, the Kenya’s Vision 2030 has identified strategic
management of human resources as a key foundation for national socio-economic
transformation. Kenya as country, intends to create a globally competitive and adaptive
human capital base to meet the requirements for its economy that is rapidly industrializing
(Government of Kenya, 2007). Against this background, it is evident that specific strategic
management aspects such as Succession planning are beginning to gain importance and
significance. Succession planning, therefore, is an important way of identifying an
employee’s current and potential skills that can be developed to help the organisation
accelerate and maintain its performance in the future. In this sense then, succession planning
provides organisations with systematic processes for; identifying, developing and promoting
the growth of high potential employees in the succession pipeline (Leibman, Bruer, and Maki,
1996).
1.1.2 Organisation Performance
In the field of business and management, both research and practice have registered an
increasing concern of linking strategic management of the organisation’s resources to its
performance. Organisation performance has been gaining importance in the NGO sector as a
framework that can be adopted in improving management of organisations (Bendell, 2006).
Organisational factors influencing high performance of NGOs have in the past been attributed
to issues such as: goal setting, long-term decisions, organisation structure, task structure,
communication and span of control. Assessment of NGO performance, therefore, is not an
end in itself, rather it is one of the many sources that the organisation employs in order to
learn how to effect and manage change that can be integrated as a process of Organisational
awareness to increase accountability, institutional development, and continuous self-
improvement (Active Learning Network for Accountability and Performance- ALNAP,
2006).
3
In general, the concept of organisational performance is based on the idea that, an
organisation is a voluntary association of productive assets that include human, physical, and
capital resources for the purpose of achieving shared objectives (Barney, 2002); given the
fact that human capital in the organisation is an integral resource contributing to effective
performance. It is therefore imperative to assess performance based on strategic alignment of
available human resources of the Organisation. In this perspective, Rothwell (2001) describes
succession planning’s main objectives as follows; to improve job filling for key positions
through broader candidate search, active development of long-term successors through
ensuring their career progress, and ensuring that they get the range of work experience they
need for the future to encourage a culture of progression.
1.1.3 The Non-Governmental Organisations
The origins and legitimacy of the term Non-Governmental Organisations (NGO) are multiple.
The United Nations (UN) charter first used the term NGO in one of its clauses in 1947 (Markay,
1998). Global history of NGOs dates back as far after World War II with the initiation of the
relief and development programs. Prior to the 1980’s, the entire voluntary NGO sector
remained generally unknown in most parts of Africa (Escobar, 1997). Through this historical
evolution, NGOs came into being mainly to fill the gap after the realization that the
government alone was unable to bring about development. The NGO’s existence has,
therefore, been broadly described in terms of social and welfare reform everywhere in the
world. Poverty as the main subject of intervention has been perceived to be impeding peoples’
access to opportunities such as good health, education, justice, good nutrition, safe water, and
clean environment among others that NGOs seek to provide to the populace (Kirongo &
Abdalla, 2009).
In Kenya, the NGOs Co-ordination Act of 1990 defined an NGO as a private voluntary
grouping of individuals. It further explained that it is an association operated not for profit or
other commercial purposes but which is organized nationally or internationally to operate
solely for the benefit of the public at large. The scope of NGOs operations have, thus, been
identified in areas such as health, agriculture, education, industry and supply of amenities,
advocacy on good governance and other related services. According to NGO Coordination
4
board (2009), Kenyan NGOs are categorized based on their scope of operation as either
National or International. National NGOs are those that operate within Kenya whereas,
International NGOs operate beyond the national boundaries. By and large, NGOs are also
categorized by the sectors in which they operate. Such categories include: welfare, water,
youth, gender, environment, HIV/AIDS, agriculture, disability, refugees, health, population,
relief, governance, children, micro-finance, informal sector, information and education (Rick,
2002).
In Kenya, recent developments in the NGO sector are marked by the enactment of Non-
Governmental Organisations’ Act 2012. The main objective of this Act is to encourage and
support NGOs in their contribution to national development. This is to ensure that NGOs
maintain high standards in their internal governance, practice transparency and accountability.
Above all, the Act seeks to establish the authority of Non-governmental Organisations as a
corporate body with perpetual succession (GoK, 2012). However, with such legal
requirements in an era of stiff competition, characterized by mobility of professionals, it will
be necessary to identify and develop leaders from within the organisation to empower and
enhance continuity.
The need to develop succession plans as strategy for sustaining NGOs therefore becomes
critical. This is due to the fact that many of the organisations indicate that they are having a
formal succession plan. However, the depth and effectiveness of these plans are yet to be
determined since most of the organisations continue to select their leaders through crisis
management. According to GoK (2007), vision 2030 takes cognisance of this and points to
the fact that Kenya’s ability to fully benefit from its existing human capital has been
hampered by inadequate management and planning. The vision 2030 of the country further
notes with great concern and precision that, this mismatch between demand and supply needs
to be corrected. Consequently, the rapidly growing economy of this country has started
showing human resource constraints, particularly in the private sector, thus hampering sector
performance. As such, Rothwell, (2001) noted that succession planning and management
should support strategic planning and strategic thinking of the organisation. This provides an

5
essential starting point for management of employee development programs in support of
continuous organisation performance.
1.2 Statement of the Problem
Every organisation needs a process of anticipating and making provisions for the movement
of people into, within and out of the organisation. Non-governmental organisations (NGOs)
constantly face challenges not only associated with evolving social, political and economic
environment, but also with respect to rapid changing demographics of their workforce. NGOs
Co-ordination Board (2009) recent report on National validation survey of NGOs in Kenya
mentioned the desperate nature of the sector in terms of access to human capital that is
increasingly threatening their existence in terms of their ability to retain the qualified
workforce. This major concern is also pointed out in The Kenyan Human Resource
Development Sector Report for the period 2011/12-2013/14 as one key area that Kenya as a
country needs to consider. The NGO Act enacted in May 2012 in its main objective requires
Non-governmental Organisations to maintain high standards in their internal governance so as
to operate as corporate bodies with perpetual succession (GoK, 2012). The situation of
increased mobility of staff makes most NGO’s risk losing experienced and skilled work force,
lose institutional memory and organisation identity in the long run.
The performance of NGOs as a major stakeholder in development is notably worrying as
depicted in the previous declarations on aid effectiveness for Africa in Paris 2005, Accra 2008
and Bussan 2011. The last decade has, however, seen a radical criticism of foreign aid that is
underpinned in the performance of NGOs. A fact that has been argued out on that foreign aid
can only raise growth in a good policy environment together with sustained good leadership;
in terms of management and governance as mentioned in a case study for aid effectiveness in
Kenya (Mwega, 2010). However, the literature available points out that there is some level of
succession planning in private and public organisation. Yet, none has demonstrated any
documented empirical evidence on succession planning as practiced among Non-
Governmental organisation in relation to organisation performance in the south of Sub-Sahara
and Kenya in particular. This study therefore, intended to examine succession planning as
6
practiced by NGOs and establish the relationship between succession planning and
organisation performance among Non-governmental organisations in Kenya.
1.3 General Objective
The general objective of this study was to establish the effects of succession planning on
organisation performance among non-governmental organisation in Kenya.
1.4 Specific Objectives
i. To examine the practices succession planning adopted among the Non-Governmental
Organisations’ in Kenya.
ii. To establish the extent to which succession planning influences stakeholder’s
outcomes for Non-Governmental Organisations’ in Kenya.
iii. To explore the role of succession planning on internal business process among Non-
Governmental Organisations’ in Kenya.
iv. To determine the extent to which succession planning contributes to the growth of
Non-Governmental Organisations’ in Kenya.
1.5 Research Question
i. What succession planning practices exist among the Non-Governmental Organisations
in Kenya?
1.6 Hypothesis
i. H01Succession planning has no significant influence on stakeholder’s outcomes for
Non-Governmental Organisations’ in Kenya.
ii. H02 Succession planning has no significant role on the internal business process of
Non-Governmental Organisations’ in Kenya.
iii. H03 Succession planning has no significant contribution to the growth of Non-
Governmental Organisations’ in Kenya.
iv. H04 Succession planning has no significant effect on the overall organisation
performance of Non- Governmental Organisation in Kenya.
7
1.7 Significance of the Study
Kenya is realizing a robust growth in the number of Non-Governmental organisations in the
private sector. According to the NGO Coordination Board (2009), the sector has been
growing at an average rate of 400 Organisations per year since 2001. The originality of this
study is based on the lack of evidence on empirical studies that directly examine practices of
succession planning among the local NGOs in Kenya. Despite this, Succession planning has
been a major concern in other parts of the world in both the private and public sectors across
the globe. Hence, in this study effort was made to assess the practice of Succession planning
and its impact on organisational performance as practiced among NGO’s in Kenya.
The new legislation of NGO Act 2012 indeed requires development of policies to ensure its
relevance and implementation. The findings of this study may be useful to policy developers
of NGOs in Kenya about succession planning. This will be of importance in improving the
quality of succession planning practices within the organisations. As an immediate outcome
of this study, the findings will particularly be useful to academicians and researchers working
on the field of succession planning in general and NGOs in particular. The Kenya National
Coordination of NGOs, NGOs board members/trustees and senior management of NGOs may
find this study to be of importance as it will generate evidence based information that can be
referred to by management and governance of the Organisation. Furthermore, the same
findings may act as an important aid to Organisation Development and Management
Consultants as they will get insights on how to improve their own practice of implementing
succession planning processes. Since most of the NGOs are dependent on funding, donors can
gain awareness from the findings of this study on how to support the local NGOs through
capacity building initiatives in developing effective Succession plans to enhance continuous
Organisation performance.

8
1.8 Scope of the Study
The NGO Coordination Board of Kenya data base indicates that the country has 6004
registered NGOs. According to Orodho and Kombo (2002) selection of research site is
essential for any study as it influences the usefulness of the information produced. The study
site was the NGOs based Nairobi County. In its scope the study encompassed 1172 NGOs
registered with National NGO’s Coordination Board of Kenya that are based in Nairobi.
1.9 Limitation and Delimitation
This study was limited in terms of geographical coverage, that is, NGOs based in Nairobi.
Fortunately, most of the NGOs in Kenya are concentrated in Nairobi. This is due to the fact
that Nairobi is the capital city with centralisation of most services and facilities and majority
of NGOs headquarters are established in Nairobi. To ensure proper presentation, a cross-
sectional research design was used on targeted population to allow representation of all NGOs
sampled to ensure all sectors of NGO operation are represented. This enhanced the extent to
which study findings could be generalized beyond the sample used in the study (Burns and
Grove, 2001). The other limitation encountered was the unwillingness and cooperation of the
organisation to provide relevant information in time. This aspect stretched the time to collect
data. However, the researcher made contacts with the organisation by sending email and
automating the questionnaire for ease of response, made telephone calls and contracted
research assistant to physically visit the organisation to collect the questionnaires in due time.
1.10 Definition of Terms
Succession Planning: Means through which organisations prepare for and replace managers
and employees to ensure that there is continuity of needed workforce in the organisation
(Rothwell, 2001). In this context succession planning is understood to be underpinned on
strategic human resource management practices and strategic positioning of the organisation.
Organisation Performance: Organisational performance is the organisation’s ability to attain
its goals by using resources in an efficient and effective manner to achieve its goals and
objectives (Daft, 2003; Richardo, 2001; Ostroff &Schmitt, 2000). In this study, organisation
9
performance is understood in the context of fulfillment of stakeholder’s expectation,
established and well-structured internal business process, learning and growth exhibited by
the organisation.
NGOs: Means Non-governmental Organisations’ which are registered exclusively under the
NGO Act of Kenya and operating in Kenya (NGO Act, 2012).
INGOs: Means “International Non-Governmental Organisation” with their original
registration being in a country other than Kenya, and operating in Kenya. However, in this
study organisation identified as International NGOs were not involved (NGO Act, 2012).
Stakeholder outcome: This is used to imply the internal and external customer expected
results including goals and objectives to be achieved out of the programs implemented by the
NGOs and donors who are the sponsors, the direct beneficiaries’ primary clients and board of
trusties/directors of those organisations (Active Learning Network for Accountability and
Performance- ALNAP, 2006).
Internal business process: Organisation factors that have an immediate impact on the
business factored in as strategies that include: Innovative processes that create new products
and services, increased customer value management processes, improved operational
excellence for logistics Processes and adherence to regulatory and environmental framework
(Kaplan and Norton, 2001). In this study internal business process encompasses all the
organisational routines that include the processes of administration of employment practices,
monitoring, evaluating, and communicating performance information leading to decision-
making and action-taking by managers for achieving the goals of their organisation.
Growth: Is understood as the extent to which the organisation enhances its learning and
capacity for innovations that is exemplified in the programs, attraction of professional pool,
efficient use of resources, and the budget portfolio among others.
Periodic assessment: Is understood as the methods and tools used to monitor and evaluate
implementation of succession planning (Rothwell, 2001)
CHAPTER TWO:
LITERATURE REVIEW
2.1 Introduction
This chapter presents a review of literature relating to succession planning and organisation
performance. It outlines the theoretical review, concepts and models of succession planning
and an organisation performance. It also summarises empirical review of recent studies and
identifies the gaps in the area of study. The analysis in this chapter identifies variables that are
illustrated as the conceptual framework of the study.
2.2 Succession Planning
Succession planning is defined as a process through which organisation prepares its
employees to take over key positions over a period of time as a long-term strategy. According
to Bain (1995), Succession planning seeks to address fundamental questions relating to: what
happens in the outside world that can have a direct profound influence on the organisation’s
personnel plans that would bring about changes to the quantity and quality of man-power
needed to support the mission and vision of an organisation. As a process, Rothwell (2001)
asserts that, succession planning can help organisations to ensure stability and tenure of their
workforce. For him, it is conceivably best understood as an effort by organisation to designed
continued effective performance of work group by making provision for the development,
replacement and strategic application of key people over time. Consequently, succession
planning and management should support strategic planning and thinking of the organisation,
provide essential management and employee development programs.
Nink & Fogg, 2006 in there development of the concept of Succession planning described it
as a dynamic and ongoing process of systematically identifying, assessing, and developing
leadership talent within the organisation. This depicts assessing, developing and recognizing
key contributors to meet future Organisational strategic and operational needs as fundamental
Organisation function. However, Schmalzried and Fallon (2007) described succession
11
planning as a proactive attempt by the leaders of the organisation to ensure that leadership is
continuous, different positions are filled from within for any departures that may occur. To
achieve outstanding results using succession planning, an organisation such as an NGO ought
to develop an effective and highly focused strategy centered on Organisational future
superiority.
2.2 Theoretical Perspective
The contingency theory was developed based on the principle of outgrowth of systems design.
Galbraith, (1973) based his theory on two fundamental propositions as: there is no one
best(better?) way to organize, and that methods of organizing are never equally effective.
However, this theory is guided by the general orientation hypothesis that: an Organisation
whose internal features best match the demands of its internal and external environments will
achieve the best adaptation (Scott, 2003). As such, it can be deduced that the contingency
theory provides a theoretical framework in line with the requirement of NGOs to adjust to
shifting conditions of their workforce.
Scott (2003), citing Galbraith, (1973) justified that environmental uncertainty affects the
performance of organisation by disturbing the efforts made by the organisation towards
achieving its performance. On the other hand, job ambiguity and the need to have the right
staff for the right job at the right time is a fundamental necessity for an organisation’s success.
Moreover, the quantity and quality of information that decision makers must develop to meet
specific goals relating to its work force or the intended outcome are necessary for organisation
performance. Therefore, this study adopts the contingency theory within the open system
classification to analyze and assess the impact of Succession planning with its contribution to
the level of the organisation performance among NGOs in relation to their characteristics and
strategies the organisations adopt to sustain performance.
Succession planning is in the realm of leadership development, strategic management and
human resource management. Path-goal theory and its contribution on the development of the
concept of leadership are considered to be of relative importance. Huddleston (1999) in his
analysis had concluded that current systems for developing future leaders have been
12
characterized by efforts to address leadership capacity across board. This concerns the
relationships between formally appointed superiors and subordinates in their day-to-day
functioning within any given organisation structure. However, research indicates that the
initial version of the theory asserted that the motivational function of the leader consists of
increasing personal payoffs to subordinate for attainment of work-goals. This makes the path
to these payoffs easier to travel by clarifying it, reducing roadblocks and pitfalls, and
increasing the opportunities for personal satisfaction in the long run (House, 1971).
Nevertheless, this still formed the theoretical basis of the development of contemporary
management theories that have demonstrated that employee satisfaction is the greatest
motivating factor, considered as highly desirable and relevant as it pertains to the recruitment
and retention of employees.
Contingency theory taken into consideration for development of theoretical background is
relevant in integrating Succession planning and Organisation performance. In addition, it
also factors the four important ideas of contingency theory. First, that there is no universal or
one best way to manage people and their intentions. Secondly, the design of an organisation
and its subsystems must ‘fit’ within the environment both internal and external. Thirdly, the
effective Organisations not only have a proper ‘fit’ with the environment but also between its
subsystems. It is also important to take note of other needs of an organisation. However, an
organisation is better satisfied when it is properly designed and employs a management style
that is appropriate to both the tasks undertaken and the nature of the work group (Weill, Olson
and Marorethe, 1989).
2.3 Brief Historical Development of Succession Planning in Management
Succession planning as it is known today has a long history that can be traced back to more
than six decades supported by historical documentations from various sectors across the
world. Shadi and Noor, (2011) traced the historical development of Succession planning to
the works of Grusky in 1960 published in the Journal titled “Administrative succession in
formal organisations and social forces”. Prior studies done in the 1960’s focused on vicious-
circle theory that described the event of succession planning as disruptive to the organisation
and the relationships among the members of the organisations and called for changes in
13
policies and practices on ad-hoc basis. However, between 1970’s and 1980’s, the concept of
succession planning was depicted to be characterized by definition of the terms such as
manpower planning and plans in relation to the gross requirement to plan with the existing
workforce. Around this time, Rhodes and Walker (1984) asserted that organisation’s design
structure, management style, size and the organisation’s growth rate are key factors affecting
management workforce.
From 1990’s most organisations had started to figure out the requirements for succession
planning and implementation of effective succession planning programme that fit their own
organisations. The concept then becomes prominent and a subject of interest in management.
The list of proposal and recommendations on what ideal succession planning should entail to
dominate the field of management in the 90’s. Some of which include: visible support from
the Chief Executive Officers and top management; ownership by line managers and supported
by staff; simple and tailored to unique organisational needs; flexible and linked with the
strategic business plan; inclusive of human resources management processes and integrated
with other human resource policy systems with emphasis on accountability and follow-up
(Sajac, 1995).
Recent developments since the year 2000 in the areas of succession planning are characterized
by linking succession planning to human resource outcomes and strategic management
outcomes. According to Lynn, (2001), key elements of the succession concepts emerged in
the last decade are identified by: succession contingencies such as industry, organisational
characteristics, and selector variables, causes for CEO departure, CEO roles, and candidate
issues. Succession event such as process, candidate choice issues, organisational
effectiveness, stakeholder issues, and evaluation outcomes are gaining prominence. Over and
above, the post 21st century is also dominated by Rothwell, (2001) a seven point star model
that has been reviewed and improved with a focus on the process.
In the last 10 years, succession planning has been characterized by emphasis on leadership
development as attributed to succession planning. Key to this era Groves, (2008) tried to
demonstrate that organisations effectively integrate leadership development and succession
planning systems as the best integrated approach. Based on the numerous theories, the last 5
14
years has been characterized by strategies for implementing succession plans other than
formulating the concept. Cheryl, (2009) case can be underscored as an example in this area
with focus on key strategies for implementing deliberate and systemic succession plans for
performance-minded organisation. The global turmoil in the labor environment has also been
attributed to the development of succession planning models as witnessed in the recent past.
In this area of focus, model developed by Aberdeen group in 2007 and subsequent review in
2010 has incorporated such variables like: pressure, action, capabilities and enablers
integrating components of succession planning (Aberdeen group, 2007; 2010)
2.4 Succession Planning Models
The concept of succession planning has evolved over the years. In assessing the effect of
succession planning on the organisation performance among the NGOs, the need to
benchmark on models of succession planning in order to expose the theoretical background of
succession planning as envisioned from best practice surfaces. Specifically, two models have
been taken into consideration: they include: the seven pointed star Model for systematic
succession planning and management as developed by Rothwell and the best in class
Pressure, Action, Capabilities and Enablers (PACE) model developed by the Aberdeen Group
2.4.1 The Seven-Pointed Star Model
The seven-pointed star model is a famous model of succession planning developed by
Rothwell (2001) to achieve the systematic succession planning and management. The seven
steps in this model as developed by Rothwell are as follows: to make the commitment, assess
the present work/people requirements, appraise individual performance, assess the future
work/people requirements, assess individual potential, close the development gap, and
evaluate the succession planning and management program. The Seven point star model is
illustrated in the figure below.

15
Figure 1: Seven - Pointed Star Model for Systematic Planning
Source: Adapted from (Rothwell, 2001)
According to Rothwell (2001), the first step for systematic succession planning and
management is for the organisations to make the commitment. In this step the organisation’s
decision makers should: assess problems and practices, demonstrate the need for the program,
determine the organisation’s exact succession planning and management program
requirements, link the program directly to organisational and human resource strategic plans,
benchmark practices in other organisationsand clarify the roles of different groups in the
program. Key critical steps for execution of this design plan include: formulation of the
program mission statement with policies and procedures as a guide and communication of the
action plan possibly through meetings, and finally train those involved in the program. Heinen
and O’Neill, (2004) as well, affirmed this by defining the initial dimensions of succession
planning by including the initial step in succession planning as identifying the purpose as
strategic planning and development of the targeted high potential pool.
The second phase in the model is the analysis of present work/ people requirements in key
positions. It is only through the assessment that potential candidates can be prepared for
advancement in a way that is solidly grounded on work requirements. However, (Heinen and

16
O’Neill 2004) pointed out that assessment need to focus on all capabilities and skills
requirements for performance and leadership development. In this regard, Rothwell’s (2005)
suggested that, decision makers should clarify where key leadership positions exist in the
organisation and should apply one or more approaches to determining work or competency
requirements that justify talent needs.
This assessment then leads to the third step to appraise individual performance that is
evaluation of individuals’ present performance on their jobs. This is critical because most of
succession planning programs assume that, incumbents must be performing way above board
their present jobs in order to qualify for advancement in the carrier pipeline. This step
therefore, provides a platform for the organisation to establish an inventory of talent. Karien
(2011) affirms this point by approving the fact that talent reviews are key to effective
Succession management since it provides answers to the talent questions brought about by the
gaps identified. However, organisation talent reviews for succession planning should be
executed within the context of a talent management strategy and career development plans, as
a rigorous competency-based assessment of employees. This necessitated the identification of
high-potential employees and future leaders, and to determine bench strength at a particular
level that links well with the seven point model.
The fourth step takes into consideration assessing future work and people requirements.
Rothwell, Jackson, Knight, and Lindholm, (2005), categorically pointed out that, future-
orientated process should not be confused with past or present–oriented employee
performance appraisal. This step focuses on work or competency and skills requirements in
key leadership positions in the future life of the organisation. This serves as the basis for
assessing future work requirements and competencies. In that way, future leaders may be
prepared to cope with the changing requirements, mobility and organisational strategic
objectives. In this respect, (Holinsworth, 2004) further suggested that an organisation should
always build consensus on data for identifying high potential competency ratings and adopt
individualized development process.

17
The fifth step, which is assessing the future individual potential for the workforce, is closely
related to the fourth step as it seeks to find out how best individuals are prepared for
advancement within the pipeline, the talents possessed, and how well those talents match up
to future work requirements against current skills gaps. Bersin and Associates (2009)
considered this and further indicated that, best practice approach needs to highlight the
alignment of employees’ capabilities and career aspirations with the organisations’ business
strategy and talent required to support the implementation of their strategies. As a result, this
contributes to succession management approach that enables best-practice within the
organisations to avoid costly mistakes in hiring, developing or promoting the wrong employee
for a critical position as well as improving the talent bench.
The sixth step focuses on how to close the developmental gap already identified and how the
organisation can meet its Succession planning and management needs by developing people
internally within the pipeline or using other means to meet Succession needs. As such
therefore, the organisation should establish a continuing program for leadership development
to cultivate future leaders internally other than sourcing externally. The Corporate Leadership
Council (2008) took cognisance of this attributes, that the process component to
comprehensive leadership needs assessment of candidates at various levels. This entails the
identification of the leadership positions that will be included in the Succession planning
program, establishing leadership criteria for identifying potential successors, as well as the
identification of roles with high departure risk for mitigation of loss of high flyers.
The seventh step leads to the concretisation of the succession planning programs based on the
decisions by management. The core of this step is evaluating the Succession planning
program for improvements on a continuous evaluation process to assess its effectiveness. The
results of evaluation should, in turn, be used to make strategic continuous program
improvements and to maintain a commitment to systematic succession planning and
management program within the organisation (Rothwell, 2005). The seven steps can closely
be tied in together with the forth rule of Succession planning as stipulated by Conger and
Fulmer (2003) in their five “rules” for Succession management. Rule four, on regular
measurement of progress, helps in moving away from the replacement mind-set of Succession

18
planning and can be attributed to the seventh step, which is evaluating the succession planning
program. Ideally, all the seven steps identified by Rothwell are all important. However,
through a comprehensive analysis, this level can be reduced to three important components
that can account for successful succession planning. These are: design, implementation and
sustenance of the succession plan through practice.
2.4.2 Best in Class PACE Model
The best in class model also referred to as PACE (Pressures, Actions, Capabilities, and
Enablers) was developed by the Aberdeen Group as a consolidation of corporate behaviors in
specific business processes. Aberdeen group (2007) identified and defined the four terms
coming up with a framework as illustrated in the table below.
Table 1: Best in Class PACE Model
Pressures Actions Capabilities Enablers
Insufficient
management
bench strength (
In terms of
Numbers of
candidates )
Establish a
“development” culture/
mindset within the
organisation
Improve the companies
bench strength ( In
terms of Numbers of
Candidates ) At Key
Positions
Identify High potential
candidates.
Gain Support and buy-in from
Senior Management
Standardized approach to
employee evaluation and
development.
Identify the positions where
succession planning is needed.
Define Skills and/ or Knowledge
required for each position.
Define attributes and/or behavior
required for each position.
Define succession planning
metrics.
Align succession planning with
the overall company strategy
Performance management
tools
Multi- rater Assessment
Assessment/testing tools
for skills and /or
Knowledge
Skills gap analysis or
competency variance
tools
Competency model
Libraries
Tools that automate
visibility into the
organisation charts
Source: Aberdeen Group (2007)
The first component of the model is pressure that refers to external forces that impact an
organisation’s market position, competitiveness, or business operations that the organisation
19
must respond to. This pressure is the driving force for Succession planning that causes the
loss of key leaders to retirement, prevent the loss of high potential talent to competitors, and
strengthen the pipeline in terms of quantity and quality of successors. As a result, the Best-in-
Class leading strategy is to first respond to these pressures to establish awareness and develop
the culture / mindset within the organisation so as to improve the company's bench strength at
key positions (Aberdeen Group, 2007).
The second strategic component that depicts actions takes into consideration how the
organisation responds to industry pressures. This standardisation process as an action point is
critical for creating consistency within the organisation as strength. This not only negates
potential employee dissatisfaction that results from misaligned expectations, but also reduces
errors in employee development plans and successor identification to improve employee
retention rate as well as develop carrier. In addition, (Ibarra, 2004) contribution in the
development of succession planning concept pointed out that organisational leaders need;
excellent performance in their organisation preserved, if not enhanced, important leadership
positions identified, strengthen individual advancement and have the right leaders prepared
for the right positions at the needed time may be lost out in the process. As such Best-in-
Class, takes cognisance of the standardized approach of employee evaluation and
development to help establish and reinforce a development culture or mindset within the
Organisation.
According to Jayson and Martins (2008) who provided a critical analysis of the PACE model
of Aberdeen group, capabilities and enablers provide essential pillars for succession planning
strategy that produce top results to include the proper mix of process, organisational
knowledge, technology, and performance measurement as the key functionality of solutions
required to support the organisation’s operations. To this end then, Best-in-Class
Organisations considers experienced and high performing employees to provide guidance to
newer workers and high potential workers. The Aberdeen group believes that this not only
aids in instilling the best-practice methodology, but also helps younger workers connect and
build relationships with people they should emulate within their organisation.

20
This study has sought to adopt Rothwells’ seven point star model and also consider the
Aberdeen group best in class model. However, it is also imperative to take note of Groves
(2008) assertion on presenting a best practice model for optimal development of the
leadership pipeline as a practical recommendation for organisations. He contended that best
practice organisations effectively integrate leadership development plans and talent
management plans to develop succession planning systems by fully utilizing managerial
personnel in developing the organisation’s mentor network, identifying and codifying high
potential employees, developing high potentials through project-based learning experiences to
establishing a flexible and fluid succession planning process.
In terms of process therefore, irrespective of whatever model to be used, the basic steps of
Succession planning are found to be similar. This is in line with the Rubin, Powers, and Illia
(2007), assertion that there are only six basic steps that are core to succession planning:
Establishing knowledge, skills and abilities needed at each leadership level, identifying a pool
of qualified candidates for various leadership roles, assessing candidates for respective
leadership positions, implementing individual development plans, selecting leadership
replacements as positions become available and implementing leadership transition.
2.4.4 Organisation Performance: Maturity Model
Determining how effective NGOs are and assessing their performance is a difficult question
that is generally left unasked and unanswered by the organisation and scholars as well.
Latham and Vinyard (2005) therefore, indicated that the path to excellent performance
consisted of the competencies of strategic leadership, execution excellence, organisational
learning and growth. In further analysis, they pointed out that, systems are required for the
purposeful alignment and integration of the individual processes.
In the development of maturity model, the duo’s recommendation consisted of four
dimensions that include; approach, deployment, learning, and integration (Latham & Vinyard,
2005). In this proposed study, Succession planning is described as an essential operational
factor in relation to variables for the assessment of performance given characteristics and
strategies of NGOs. Therefore, one of the primary purposes in examining indicators of NGOs
21
high performance based on the strategic leadership development through effective Succession
planning is to provide basic guidelines and encourage managers of NGOs to follow the
guidelines. To this end, organisations need a strong sense of direction to bring coherence to
the many strategic and operating decisions that managers at all levels are constantly called
upon to make (Crossan, Fry & Killing, 2005).
2.5 Succession Planning Process and Approach
Drawing from the two models adopted for this study, it can be deduced that the succession
planning process includes three main components. This understanding can be attributed to
(Conger & Fulmer, 2003) the five “rules” for succession management:. The principal rule one
focuses on development and is built upon the principle that succession management must be a
flexible system oriented towards developmental activities. This forms the fundamental rule
on which the other four are built. The second rule focuses on key players that are termed as
the rule on linchpin positions or bench mark positions. This rule is underpinned on jobs that
are essential to the long-term health of the organisation. Rule three is to make Succession
management transparent and eliminate secrecy; hence the role played by communication is
considered very essential. Rule four is regular measurement of progress, moving away from
the replacement mind-set of Succession planning that takes into consideration implementation
and finally rule five is to keep it flexible.
The above mentioned rules proposed by (Conger & Fulmer, 2003) ideally capture general
cross-cutting issues in succession planning. However, for purposes of implementation
strategy, there is a need to translate the forces driving the Succession planning within the
organisations into reality with a possible actual execution. Ibarra (2004) ultimately, suggested
a four phased approach to ensure that, indeed Succession planning fosters total people
management as dynamic component of an organisation’s desire to build a performance
culture. However, Aquila (2007) states that Succession planning is now more complex than
15 years back and recommended 7 key best practices for succession planning implementation
that included: a deployment of a process that links succession planning and firm’s overall
business strategy, continuous identification of future leaders, development plans for future
22
leaders, measure results for success, by keeping it simple and aligning with organisation’
overall strategic objective and gaining support from top management.
2.5.1 Identifying the Scope of Succession Plan
In terms of process, the first component is selection of a candidate based on previous
experience and background and formation of talent pool (Rothwell, 2010). This is also
supported by (Dessler, 2005) being in agreement with the fact that the process of succession
planning in general demands three steps that include: Firstly, identifying and analyzing the
necessary key jobs; secondly, creating and assessing candidates; and thirdly, selecting the
right individuals who will fill up the key positions and stating the program over the lifetime of
the organisations. By this, each key position has alternative potential successors and each
talent has multiple potential promotion paths (Byham et al., 2002). This step also concedes
with (Ibarra, 2004) phase one approach in Succession planning. For Ibarra, phase 1 entails
establishing the Scope of succession planning. This includes reviewing the organisation’s
strategic plan, Analyzing attrition data and retirement projections, determining external
factors and defining parameters of Succession planning.
As depicted in the evolution of succession planning, the trend has been expanding to cover all
the positions not just top managerial positions. This is attributed to the findings and
conclusions by Garmen and Glaw (2004) on the realisation that companies are now
considering lower-level employees for better and higher profitability. In case of excluding the
entire organisation, it is paramount to identify critical positions which are essential for the
organisation, department, division, work unitor team to achieve the necessary work results
(Ibarra, 2005). This resonates well with what is termed as linchpin position (Conger &
Fulmer, 2003).
However, beyond identifying what skill sets and knowledge bases are required for key
positions, it is crucial that, the succession plan provides a method or plan for providing
employees with the opportunity for professional career development. After selecting the
identified talents, the role of development of successor as a second component of succession
planning becomes imperative. Identifying development plan and follow–up is a mandatory
23
part of process is an important component that propels succession planning (Rothwell, 2010).
However, despite the follow up process, Patton and Pratt (2002) insisted that the plan ought to
be tailored to the individual needs and interests of successor. To this end, Groves (2008)
suggested the best development methods which include; 360–degree feedback, executive
coaching, mentoring, networking, job assignments and action learning forms comprehensive
management program.
2.5.2 Introduction and Implementation of Succession Plan
The component of succession planning process under this category can be summarised within
the domains of change management and process management. This includes function and
sub–processes like strategic view of succession planning, management commitment,
implementation considerations, etc. This forms the creation Succession plan as a process.
According to Ibarra, (2004), this is the phase 2 and it entails; identifying job functions,
staffing levels needed and related KSAs (Knowledge, Skills and Abilities), determining
availability of staff, conducting skills gap analysis and establishing priorities for development
of required skills. Based on the above a workforce plan is created with strategies and
measures of Succession planning.
Succession planning provides the organisation with ready access to required human resource
both quantitatively and qualitatively developed from within. With such a plan, the
organisation is able to determine promotion opportunities and developmental needs of
candidates and build management commitment (Christie, 2005). This then leads to the phase
of implementation of the succession plan that includes components like, communicating
succession planning process, adoption of implementation strategies and tactics for developing
employees as depicted in phase 3 of (Ibarra, 2004) but the problem is that, while companies
may have Succession plans in place, they may fall out of sync with what the company needs
to grow or expand into new markets. Therefore, it is very vital to link Succession plan to
business strategy to obtain the kind of people with the needed set of skills for the future.
However, (Karaevil & Hall, 2003) contended that, this linkage has not been achieved in real
world even in organisations with best Succession planning. Management commitment like
any other organisational–wide program is critical for successful implementation of succession

24
planning. Without this support, succession planning is not executable even if designed well
(Diamond, 2006). Awareness and communication is another issue in process management of
succession planning. It seems that, the best state for both organisation and individual is that
the issue raised and discussed is openly based on a transparent posted process (Greer &
Virick, 2008).
2.5.3 Continuous Evaluation and Process Review
Continuous evaluation is important in management process. Appropriate criteria for SP
program include a number of successors for a key position; percentage of vacancies filled
internally, average number of successors for a key position, number of key positions that have
one or two developed candidates, satisfaction of successors, and rate of change in Succession
pool (Greer & Virick, 2008). However, Covel (2007) felt that different approaches can be
adopted for Succession planning depending on the prevailing situation. Hence, for those
organisations that are under pressure due to existing gaps, he suggested that they might be
forced to institute an emergency remedial measures, which for (Covel, 2007) constitute:
hiring a competent consultant to provide a coaching on leadership transition, creating a crash
training program to attract potential candidates, and conducting a personality survey to
evaluate strengths and weaknesses of its employees to identify a potential leader. It is
therefore imperative that, the Succession planning is constantly monitored, evaluated and
improved from time to time. Hence the organisation monitors progress and makes necessary
interventions by evaluating the implementation and revising the plan based on lessons learned
and new Succession planning issues (Ibarra, 2004).
2.6 Significance of Succession Planning
According to Behn, Relay and Yang (2005), succession planning is a very important exercise
for all kinds of organisations. Although with the evolution and diversification of the concept,
many organisations have started to adopt formalized planning procedures. Through this
development, it also appears that succession planning is starting to gain prominence in large
affluent private businesses (Schmalzried & Fallon, 2007). Above all, according to Rothwell
(2005), apart from other human resource management benefits, getting suitable people in the

25
right positions and at the right time is the key to organisational survival. Thus Hutcheson
(2007) asserted that Succession planning is a central event in the life of any organisation
hence; planning for leadership continuity is an important element for an organisation’s
success.
Rothwell et al, (2010) in summing up the benefits of succession planning suggested that
succession planning yields the following: Enables the organisation to assess its talent needs by
establishing competency models or job descriptions, allows leaders to identify and tap in
record time, key people who are available to fill critical work functions; provides avenues for
present and future discussions about talent development, defines career pathways through an
organisation, provides for a higher return on investment from employees.
Apart from the general human resource planning attributed benefits, there are other several
Succession planning benefits for the organisations that have been documented. Amongst them
are that: Succession planning facilitates growth of talent from within the organisation
(Hollington, 2007); it is a tool for talent management in organisations, and it is crucial for
attracting, retaining, and promoting special talents management strategy that helps an
organisation to remain competitive in the market through use of its best people (Alleyne,
2007). Also, succession planning is claimed to increase the confidence of employers,
customers and shareholders. Moreover, according to Huang (1999), Succession planning is
widely believed to help business organisations with in-house re-sourcing strategy to reduce
attrition of the work force caused by job-hopping high-fliers, headhunting and prepare
qualified candidates for appointment to senior management position for the long term human
capital development.
According to Karien (2011), a robust succession planning strategy provides a roadmap for
organisations leadership continuity. Succession planning therefore, guides development
activities of identified successors, serves to anticipate and manage issues of career
progression, ambition and avoids transition problems and premature promotions.
Consequently, this serves as a significant attraction lever for external talent as well as an
effective retention lever for internal talent (Williams, 2010). Shen and Cannella (2003),

26
contend that the presence and effective implementation of succession management strategies
is linked to various outcomes, including senior management exit. As a result, organisations
that are famous for growing from within have a powerful differentiator that becomes part of
their employer brand and employee value proposition.
2.7 Organisation Performance: An Overview
Organisational performance dominates the strategic management literatures that are
mentioned in areas of economics, finance, and accounting. Performance management is one
type of effectiveness indicator that most Organisations benchmark on. Significantly,
organisational performance has been the main general construct of organisational
effectiveness and efficiency.
Organisational performance has suffered from not only a definition problem, but also from a
conceptual problem over time. It has been very important for managers to know which factors
influence an organisation’s performance in order for them to take appropriate steps to initiate
them. However, defining, conceptualizing, and measuring performance have not been an easy
task. According to Javier (2002), performance is equivalent to the famous 3Es (economy,
efficiency, and effectiveness) of a certain program or activity or operations of an organisation.
However, according to Daft (2000), organisational performance is the organisation’s ability to
attain its goals by using resources in an efficient and effective manner. Quite similar to Daft
(2000) and Richardo (2001) where the two defined organisational performance as the ability
of the organisation to achieve its long term goals and objectives. Ostroff and Schmitt (2003)
on the contrary, maintained that performance necessarily entails a discussion of both
effectiveness and efficiency functions of the organisations. Effectiveness refers to the
achievement of objectives that is clearly a goal oriented measure that is opposed to a natural
systems measure based on financial components. Whereas, efficiency refers to the extent to
which resources are utilized to achieve objectives. Balancing these two dimensions therefore,
requires an examination of assumptions regarding the objectives of the organisation in order
to make a meaningful assessment of the extent to which objectives are achieved. This leads to
the question on the relationship between innovation and performance, which (Bowen,

27
Rostami & Steel, 2009) stated that such a relationship has been uncertain over time and the
scope of its measurement has not been settled. Despite this fact, Ostroff and Schmitt (2003)
both had demonstrated that organisations have different goals relating to effectiveness and
efficiency measures depending on their operations. It would therefore seem reasonable that
since different organisations have different goals and objectives with regard to what effective
or efficient means, there should be a dynamic mechanism of measurement that is able to
account for these differences but still attributed to overall performance.
Organisational effectiveness can be described as broader paradigm that captures
organisational performance, but with grounding in organisational theory that interests
alternate performance goals set to be measured. Hall, Jaffe and Trajtenberg (2005), further
distinguish the domains of organisational effectiveness and organisational performance. In
this case, organisational performance encompasses three specific areas of firm outcomes
namely; financial performance, market performance, and shareholder return. Previous
research as such had used financial, market and shareholders returns variables to measure
organisational performance. According to Gimenez (2000), these variables include
profitability, gross profit, return on assets, return on investment, return on equity, return on
sales, revenue growth, market share, stock price, sales progress, export growth, liquidity and
operational efficiency relating to optimal cash flows. Conversely, organisational effectiveness
is attributed to broader and captures organisational performance plus the plethora of internal
performance outcomes normally associated with more efficient or effective operations and
other external measures that relate to considerations that are broader than those simply
associated with economic valuation depicted in the general overview as either by
shareholders, managers or customers and including reputation.
Considering the difference in objectives and goals, the other key components of organisations
performance that have been attributed in this perspective is the appeal for innovation. Wolff,
(2007) stated that firms vary in the amount of inputs they devote to the innovation process.
However, the dedication of more inputs to the innovation process does not guarantee
innovation outcomes, since the process of developing innovation is complex and is
characterized by high risks. Moreover, Rosenbusch, Brinckman, and Bausch (2010), stated
28
that if firms devote substantial resources to the innovation process, but are unable to turn them
into innovative offerings, resources are wasted and firm performance suffers. Over and above,
organisation performance is the most important issue for every organisation, be it for profit or
not for profit
Lee (2005) also noted that there has been inconsistency in the measurement of organisational
performance due to variety of benchmark positions despite the fact that most researchers
measured organisational performance by using quantitative data like Return on Investments
(ROI), return on sales among other accounting financial measure of investments. He
maintained that the definition of performance includes both efficiency-related measures,
which relate to the input/output relationship, and effectiveness related measures, which deal
with issues like business growth and employee satisfaction. Additionally, (Lok & Crawford,
2003) had noted that performance has also been conceptualized using financial and
nonfinancial measures from both objective and perceptual sources of data used. The two
therefore considered objective measures to be secondary source financial measures such as
return on assets, return on investment, and net profit worth.
2.7.1 Organisation Performance in the NGO Sector
Organisation performance measurement is considered to be a multifaceted concept that occurs
at different sectoral levels for industry, corporate and business sectional unit. However, there
is a necessity to target specific factors which contribute to the performance in a manner that
matches context of the organisations with sector factors that can sustain performance over the
long term (McGahan, 2004). According to Department of Public Information (2007), the
above mentioned takes into consideration organisation in the private sector which are not for
profit that include NGOs which are generally not-for profit, voluntary citizens’ groups that are
organized on a local, national, or international level to address issues in support of the public
good.
It is also important to note that NGOs are the recipients of billions of dollars invested in social
transformation. This provides a basis for taking into consideration NGOs’ performance as a
necessary factor to be considered fundamentally to address the question of upwards
29
accountability to the stakeholders such as donors, international aid organisations or foreign
governments supporting developing countries, or others with power over them, and
downwards accountability to those affected by them that include the stakeholders or direct
beneficiaries who are dependent on these organisations (Bendell, 2006). Accountability,
transparency, and effectiveness have been crucial for the stakeholders that NGOs serve as
direct beneficiaries, donors who fund their programs, and host local governments in the recent
past. Organisation performance of NGOs attributed to variety of services and humanitarian
assistance functions that are task-oriented targeting people with a common interest. NGOs
bring citizens’ concerns to governments, monitor policy, program implementation, and
encourage participation of civil society organisations at the community level including
community based organisations (DeMars, 2005).
According to Sandison (2005), most of the work performed by NGOs is difficult to assess
because of qualitative long-term goals and outcomes that are attributed to the overall impact
of the programs. The key components in relation to the assessment of the performance of
NGOs includes; judging the impact of a program such as accountability to stakeholders to
inform funding decisions, improving a program such as ongoing learning and development,
and generating knowledge. The cumulative effect of recognising frequent systemic issues can
increase Organisational knowledge for managers and decision-makers even without assessing
performance in instrumental terms. However, assessments can provide tangible performance
targets theoretically be measured and monitored in practice. However, Espirito (2001) pointed
out that performance is a broad notion that is difficult to measure because of its varied
definition and measurement of issues that affect and are attributed to it. For example,
efficiency, effectiveness, equity, culture, power, and values are concepts that can be related to
performance directly or indirectly (Devero, 2004).
Keating and Knight (2004) asserted that performance of an organisation such as NGO can be
categorized in three broad categories namely individual employees or small groups, the
programs, and the overall organisation. Initially, Brinkerhoff (1991) had viewed performance
as comprising of the four dimensions that are; efficiency, effectiveness, capacity and
sustainability. The subsequent contemporary analysis and development of these three aspects
30
provided by (Espirito 2001) indicated that, the first measurement of effectiveness and
efficiency relates to the costs of inputs, process, and technology deployed. The second
dimension that takes into account capacity relates to generating outputs and the third
dimension incorporates both efficiency and effectiveness, together with capacity, to address
issues of continuitysuch as survivability and responsiveness. The aspects of survivability and
responsiveness call for Succession planning since NGOs, like other organisations, try to
justify what they do and how they do it, particularly to internal stakeholders who are the direct
beneficiaries and external stakeholders who are the sponsors. Increasing the understanding of
NGOs’ performance beyond the narrow mechanistic focus could help in the analysis of
organisational variables considered important to such performance (Ganesh, 2003).
2.7.2 Organisation Performance Measurement: A Balanced Scorecard Approach
The Balanced Scorecard (BSC) developed by Kaplan and Norton (1992) has become a very
popular and useful measurement and strategic tool because it incorporates both interval and
lead performance measures. One of the major assumptions of the BSC as developed was that
it was essentially orientated to profit organisations (PO). Historically, organisations measured
their performance primarily, if not exclusively, with measures derived from financial data. In
the 1990s, a group of researchers and consultants from the Nolan Norton Institute, (the
research arm of the accounting firm KPMG), began to study commonly used organisational
performance measures. Their hypothesis was that organisations were being hindered by these
measurement practices because the focus was too narrow on financials (Zimmerman, 2004).
After more than ten years, the BSC has evolved to become popularly accepted through its
widening prolific literature on best practice developed from experiments and investigations
including business research. As such Figg (2000) reported that many of the world’s leading
organisations claim that balanced scorecard techniques gave them an edge in objectively
quantifying, tracking, and managing business performance. The Balanced Scorecard is a
strategic performance management framework that has been designed to help an organisation
monitor its performance and manage the execution of its business strategy. In its simplest
form the Balanced Scorecard breaks performance monitoring into four interconnected
31
perspectives: Financial, Customer, Internal Processes and Learning and Growth (Kaplan &
Notron, 1996).
A further development of BSC through research and innovation has extended the BSC beyond
a simple strategic tool for measurement of performance. Kaplan and Notron (2001)
maintained that innovative idea tied performance measurements closely to a company’s
strategic plan. In short, it starts with planning; then create a measurement process to gauge
how well the company is executing activities against the plan. By doing this, the measures
graduated from simply providing descriptive data to being the basis for a management tool. In
addition Norton and Russell (2005), further asserted that Balanced Scorecard approach
provides a balance between short-term and long-term objectives; between desired outcomes
and their performance drivers; and between measures for hard objectives and those for soft
objectives (e.g. improvement in customer's satisfaction, increase in employees' readiness) by
organizing objectives and measures into the four perspectives. The framework below
illustrates the cause-and-effect logic as one of the most important elements of best-practice
Balanced Scorecards to manage performance.
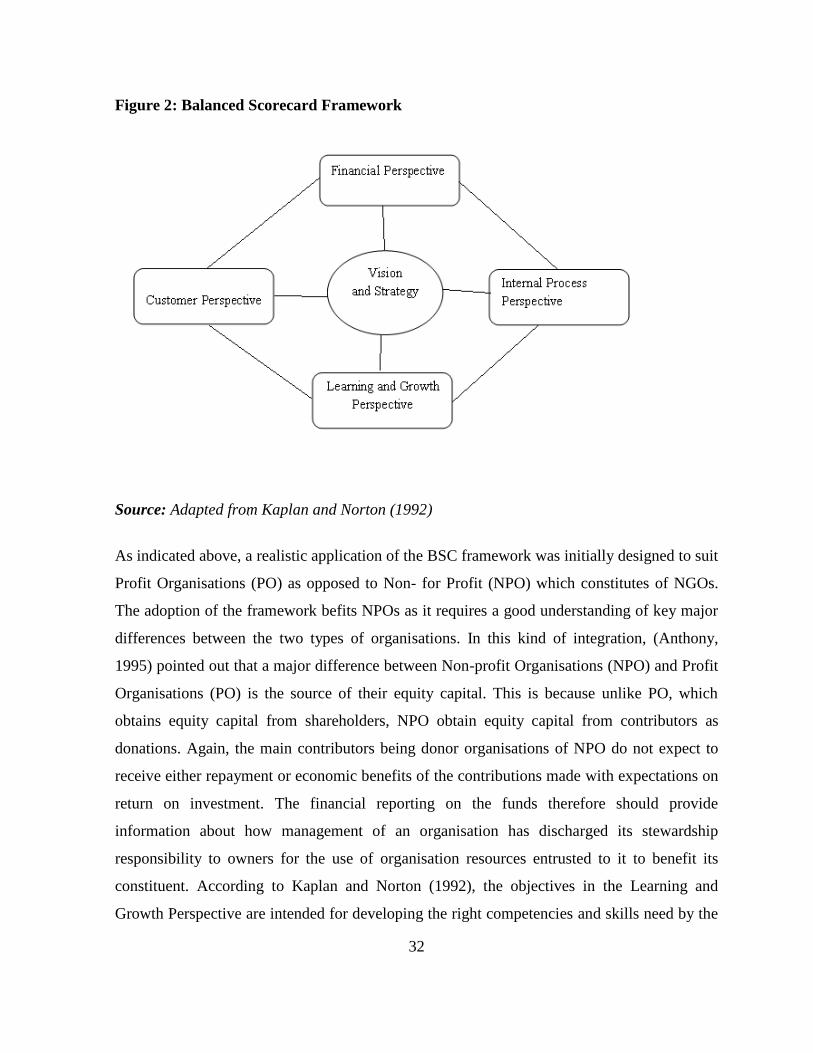
32
Figure 2: Balanced Scorecard Framework
Source: Adapted from Kaplan and Norton (1992)
As indicated above, a realistic application of the BSC framework was initially designed to suit
Profit Organisations (PO) as opposed to Non- for Profit (NPO) which constitutes of NGOs.
The adoption of the framework befits NPOs as it requires a good understanding of key major
differences between the two types of organisations. In this kind of integration, (Anthony,
1995) pointed out that a major difference between Non-profit Organisations (NPO) and Profit
Organisations (PO) is the source of their equity capital. This is because unlike PO, which
obtains equity capital from shareholders, NPO obtain equity capital from contributors as
donations. Again, the main contributors being donor organisations of NPO do not expect to
receive either repayment or economic benefits of the contributions made with expectations on
return on investment. The financial reporting on the funds therefore should provide
information about how management of an organisation has discharged its stewardship
responsibility to owners for the use of organisation resources entrusted to it to benefit its
constituent. According to Kaplan and Norton (1992), the objectives in the Learning and
Growth Perspective are intended for developing the right competencies and skills need by the
33
organisation to discharge its mandate. This further underpins the objectives in the internal
process perspective that ought to deliver high quality business management processes and
operations of NPO programs and projects design. Delivering the customer objectives should
then lead to the achievement of the financial objectives which is shared with the satisfaction
of the various stakeholders based on the outcomes of the programs and projects implemented
with the resourced finances for the benefit of the targeted constituency.
However, on a further development on the concept of this business fad Kaplan and Norton
(2006) noted that after the introduction of Balanced Scorecard approach in 1992, it has
evolved into the centerpiece of a sophisticated system to manage the implementation of target
operating model captured in the strategy. The two further asserted that, the effectiveness of
the approach is derived from two simple capabilities that include: the ability to clearly
describe the strategy, its specific objectives and the ability to link the strategy to the
management system. The net result is the ability to align all the units, processes, and systems
of an organisation with its strategic operating model. On his part to qualify the general
application of BSC, Norton affirms that it can be used to develop proper strategic goals and
their indicators in order to monitor strategy implementation continuously (Norton, 2009)
According to Zimmerman (2004), profit organisation major goal is to satisfy the wants and
needs of customers. The customers are the primary source of revenues that sustains the
operations of these organisations. Therefore, a balanced scorecard can focus simply on
customers. Consequently, the benefits of BSC as a tool of management of performance
beyond the financial outcome can be listed to include: better strategic planning, improved
strategy communication and execution, better management information, improved
performance reporting, better strategic alignment, and better organisational alignment. These
benefits can be directly attributed to the measurement of performance by NPOs.
34
2.7.3 Succession Planning and Organisation Performance
The primary objective of not-for profits (NPOs) performance assessment is to determine how
well an Organisation is fulfilling its mission. If such an assessment is not possible then public
trust in NPOs is bound to be lost. Thus, NPOs must choose performance benchmarks
appropriate to their mission and objective that can be highlighted in the annual report
informing potential donors and others how they are accomplishing their missions (Singh &
Mirchandani, 2006).
Despite this rapid growth in Succession management consultancy service provision, there is a
distinct lack of empirical evidence and academically rigorous research that supports the
generic contentions of a positive relationship between formalized Succession management
practices and organisational performance that has been under consideration (Huang, 2001).
Conger and Fulmer (2003) stated that Succession management systems are effective only
when they respond to users’ needs and when the tools and processes are easy to use and
provide reliable and current information at the foundation of a shift toward Succession
management is a belief that leadership talent directly affects organisational performance.
Consequently Ibarra (2004), pointed out that, effective organisations do not passively wait for
the future to down on them; but they create it each day by investing their time, thoughts, and
planning in order to ensure the continuity of their leadership through the existing talent
supportsuccession planning which, in turn ensures the continued effective performance of
their organisation by establishing a process to develop and replace key staff over time. The
contribution of succession planning into organisation performance can be linked to the need to
identify and develop the best people for key leadership roles that are basic to future
organisational success.
2.8 Empirical Review
Ali, Farashah and Ahmedrasah (2011) recently conducted a study on Succession planning and
its effects on employee career attitudes with Iranian governmental organisations. The study
conducted among 23 Iranian governmental organisations, evaluated effects of succession
planning at organisational level, intervening program on career attitudes as well as at

35
individual level variables. The study further benchmarked on best practices of succession
planning selected from literature and compliance of succession planning system of
organisation to these practices defined as extensiveness of succession planning. The findings
demonstrated that, significant correlation exists between Succession planning’s extensiveness,
career, satisfaction of promotion process and also that the perception of job plateau does not
show correlation with Succession planning extensiveness
Recent research at Stanford University conducted by Saulnier (2010) titled Succession
Management: Positioning Your Organisation’s Leadership for Business Success found that
more than half of all companies cannot immediately name a successor to their Chief
Executive Officer (CEO) should the need arise. The research’s major findings indicated that,
participation dwindles the further one dives into an organisation’s employee ranks. While
better than 50% of research respondents said their companies implement Succession
management processes at the most senior executive levels, fewer than 40% said they included
mid-level managers and skilled professionals in Succession planning initiatives. Furthermore,
only 11% included first-line supervisors.
In addition, other studies in India aimed at measuring the practice of Succession Planning and
its impact on Organisational Performance in IT companies based in Chennai conducted by
(Anjai, 2010) found that, the mean percentage of Succession Planning and Organisational
Performance in IT consultancy firms and the relationship between Succession Planning and
Organisational Performance is found to be positive. The study’s major finding was that; the
overall mean percentage of Succession Planning Performance of IT Consultancy firms
(72.4%) is found to be higher than that of IT Product/ Research firms (70.4%). The
relationship between practice of succession planning and organisational performance was
found to be positive in IT consultancy groups and IT product/research groups. The statistical
results established significant difference in the Succession planning performance between
different experience categories of respondents.
Comparative on whether it is succession planning –or smart talent management (Angela,
2009) sought to identify what Succession planning actually is and the pros and cons of buying
36
in, or building talent in the organisation. In its findings the study identified five key strategies.
These are: aligning succession planning with business strategy, assessing leadership potential
using the 3Cs fit (competence, connection and culture), involve the talent in the planning, and
mixing development that include: experience/coaching/training, and casting a wider net for
Succession (Angela, 2009).
In another study conducted by Beever (2008) exploring why and how Succession planning
can be integrated with other processes, specifically, employee career development, it was
demonstrated that the concept of Succession planning and career development can create an
environment that facilitates on-going learning and continuous development. The concept of
integrating succession planning and career development was the essence of his research. It
further demonstrated positively that, either processes cannot work effectively or efficiently if
they are not integrated.
Tracy and McGraw (2004), conducted a national research study on succession management
practices in Australian organisations. The study focused on assessing the current usage of
Succession management programs in Australian-based organisations, and gain information on
the characteristics and perceived effectiveness of such programs. In this study a sample of 711
human resource management professionals from a range of organisations across the country
participated with a response rate of 59 percent. The study’s major findings revealed that,
Succession management programs were present in less than half of the respondent’s
organisations. Furthermore, these programs were generally less than five years old.
Moreover, the study revealed that the prime imperatives for introducing Succession
management programs were reported as the desire to improve business results, and the need
for new skill requirements in the business. A relationship between the organisation’s size,
industry and type and the likelihood to use Succession management was found. Common
perceptions concerning the characteristics of effective Succession management programs
were also identified and are described in the study that included; high level involvement by
the chief executive officer; senior management support; line management involvement in
37
identifying candidates; developmental assignments as part of the process and; Succession
management linked to business strategies.
Sangmook, (2005) conducted a study to assess individual-level factors and organisational
performance in government organisations in the republic of Korea. The research reviewed
recent efforts on individual-level factors to predict organisational performance. The research
also explored the theoretical model predicting organisational performance with individual-
level variables and further operationalized and tested the model with data from the survey.
The survey data of 1,739 public employees in government agencies analyzed confirmed the
hypothesized relationships in the proposed model that included the individual-level factors,
such as job satisfaction, affective commitment, public service motivation, and organisational
citizenship behavior.
Dodor, Gupta and Bobie, (2010) conducted a study on a framework for governmental
organisations’ balanced scorecard based on the original BSC theoretical framework to
respond to a call of the Governmental Accounting Standard Board (GASB) to develop
relevant and effective performance measures for Governmental Organisation (GO). Based on
the findings, the authors suggested a Governmental Organisation BSC (GO-BSC), with the
components as: financial condition, service efforts accomplishments and constituents’
satisfaction, internal operating efficiency, effectiveness and innovation, learning and growth.
This study demonstrated the universal application of balanced score card as a management
tool that can be applied not only with profit cooperate organisation but also not for profit and
public organisations. Finally, in the area of performance management, a recent study
conducted by (Mojtaba, Safar, Ahmad, Ishfaq, Muhammad, 2011) to assess strategy map
creation using a balanced scorecard model as a case study of central bank of Iran resulted in
developing a strategy map based on the components of Balance Score Card. According to the
results of the study, the strategy mapping was attributed to strategic goals and strategic
measures in customers, internal processes, and learning and growth perspectives were
designed to enhance performance.

38
2.9 The conceptual framework
The figure 3 below represents the conceptual framework
Figure 3: Conceptual Framework
Independent Variable Dependent Variable
Moderating Variable
Source (Researcher, 2014)
The implementation of succession planning leverages on key strategic human resource
management components. These include; employee resourcing, training and development,
performance appraisal, carrier development and total rewards system. The above mentioned
are not complete without being tied together with Succession management characteristics that
include; linking the succession plan to organisations strategic plans, gaining top management
support and total employee involvement for effective implementation, for purposes of
monitoring and evaluation the designed program hence needs period assessment. The above
indicators can then be attributed to the assessment of succession planning program of
organisation. The moderating variables were also identified as; years of establishment of the
organisation and employee establishment in terms of size as key moderating variable in this
study. The dependent variable as organisation’s performance indicators have been identified
Strategic HRM programs (Employee resourcing, Training and Development, Performance Management, career development and Total reward)
Periodic Assessment
(Method of Evaluation)
Succession Characteristics (Linkage to strategic plans, Top Management support, Total Employee involvement)
Succession planning
Organisation Performance
Stakeholder’s outcomes
Internal Business Process
Institutional Growth
Years of establishment Staff Establishment

39
based on balanced scorecard perspectives. However, component of the 3rd Generation
Balanced Scorecard framework fit for non- profitorganisations has been adopted to make
measurement of performance explicit. In this sense, for non-profit like NGOS, these external
stakeholders’ expectations are usually an extensive set of mostly financial perspectives,taken
into consideration as stakeholders’ (donors and communities where projects are implemented)
requirements, expectations and goals. The components adopted for performance
measurements therefore include; stakeholders expected outcomes that accounts for the value
of financial contributions made by sponsors, the internal business process perspective covers
internal operational goals and outlines the key processes necessary to deliver organisations
objectives, growth perspective that covers the intangible drivers of employee competencies,
technology and corporate culture.
2.10 The Gap in the Study
The review of existing literature on succession planning and organisation performance
provided significant theoretical background for inquiries into the topic of Succession planning
and its impact on the organisations’ performance as practiced by local NGOs based in
Nairobi. Most of the available literature on succession planning practices used in this study
are adopted from studies done in some parts of the world such as India, USA, Europe and
Asia and are predominantly from other corporate entities that are profits driven. This
notwithstanding, other studies in the NGO sector in other parts of the world have also
mentioned importance of succession planning. However, currently as it still stands, none of
these studies has purposefully addressed succession planning in the NGO sector in developing
countries and most particularly in Kenya in relation to its impact on organisation
performance. This current proposed study endeavored to fill this gap by ground existing
theoretical models of succession planning through empirical research aiming at documenting
the current practices as adopted by local NGOs that are based in Kenya.

CHAPTER THREE:
RESEARCH METHODOLOGY
3.1 Introduction
This chapter introduced the research methodology used in this study. It described research
design, the targeted population, the sample design, the data, the research instruments,
reliability and validity of the research instrument, the statistical tools that were used for data
analysis and presentation.
3.2 Research Design
According to Kombo and Tromp (2006) research design can be regarded as an arrangement of
conditions aiming at combining the relevance of the main study methodology and research
purpose. This study adopted two types of research design that included: descriptive research
design and quantitative research design.
3.2.1 Quantitative Research Design
According to Couchman and Dawson (1998), quantitative research generates quantifiable
data. It is primarily concerned with observable and measurable phenomena involving people,
events or things, and establishing the strength of the relationship between variables, usually
by statistical tests. The features of this research study are in accordance with the quantitative
research paradigm. This is due to the fact that, quantitative research is normally used for
investigating phenomena that require precise measurement and quantification and tends to be
fairly structured to enhance objectivity. In addition, a quantitative research primarily rests
upon numbers aggregated into statistics, to enable the researcher to interpret obtained data and
reach conclusions (Holliday, 2007).
3.2.2 Descriptive Research Design
The main purpose of descriptive research is to describe the state of affairs on succession
planning and organisation performance as it is perceived and practiced. According to Sekaran
41
(2003), descriptive study is undertaken to ascertain and describe the characteristics of the
variables of interest in a situation. The descriptive research design is used to designate any
research activity in which the investigator gathers data from a portion of a population for the
purpose of examining the characteristics, opinions or intentions of that population with
respect to the subject matter under the study (Punch, 2005). The researcher obtained and
described the views of respondents with regard to the nature of their exposure to succession
planning and perception on organisations performance. A descriptive design was selected
because of its high degree of representativeness and the ease in which a researcher could
obtain the participants’ opinion.
3.3 Targeted Population
Mugenda and Mugenda (2003) defined target population as a complete set of individuals,
cases or objects with the same common observable characteristics. The study population
comprised of 1172 NGOs based in Nairobi that were registered with the National NGO
coordination Board of Kenya and in operation (NGO Coordination Board Database, 2012).
From the population the researcher considered all the sectors of NGOs operating in Kenya
that include: Health, Food and nutrition; Environment, energy and conservation measures;
water and sanitation; research, learning and capacity building; shelter and informal settlement;
population and relief services; programs for disabled persons, children, youth, women, and
religion; social policy, communication and advocacy; community development and economic
empowerment; and education.
3.4 Sampling Procedure
Given that NGOs operation is underpinned on sectors, this study used stratified sampling
technique and applies simple random technique in each stratum. This took into consideration
the fact that, if the population from which the sample is to be drawn does not constitute
homogenous groups, stratified sampling technique is generally applied in order to obtain a
representative sample (Kothari, 2009). The study also adopted proportional allocation in each
of the strata under consideration (Serakan, 2003). The researcher identified the strata
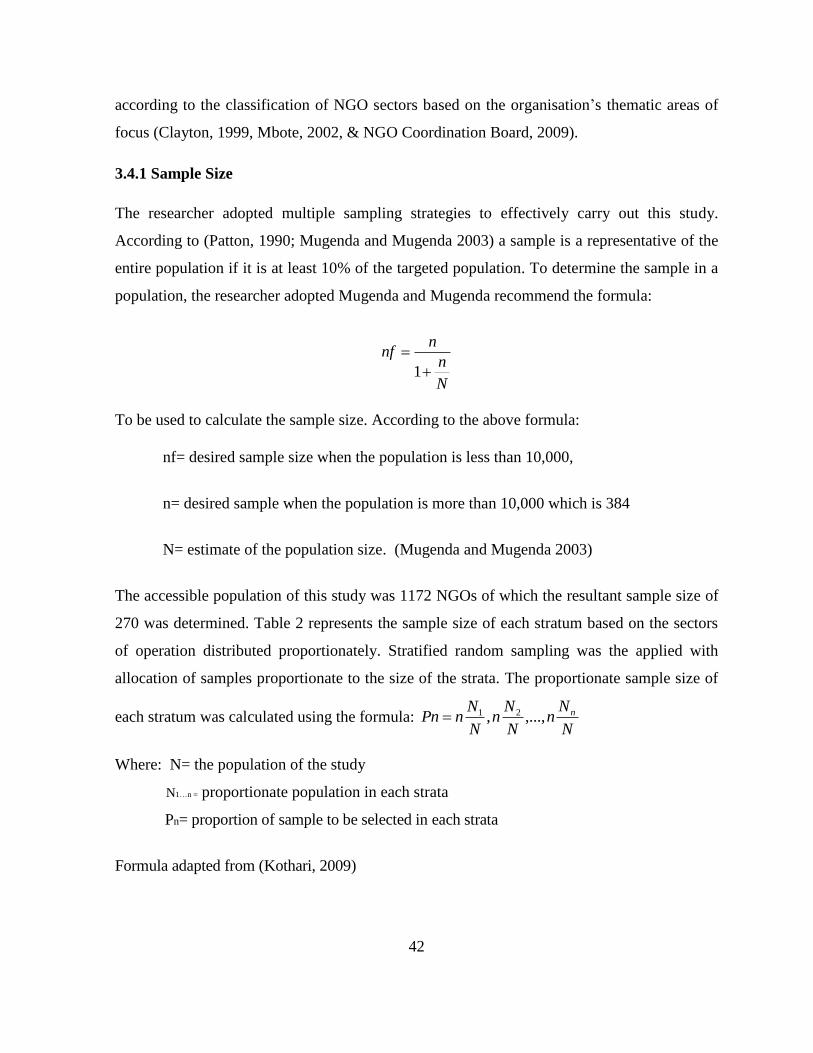
42
according to the classification of NGO sectors based on the organisation’s thematic areas of
focus (Clayton, 1999, Mbote, 2002, & NGO Coordination Board, 2009).
3.4.1 Sample Size
The researcher adopted multiple sampling strategies to effectively carry out this study.
According to (Patton, 1990; Mugenda and Mugenda 2003) a sample is a representative of the
entire population if it is at least 10% of the targeted population. To determine the sample in a
population, the researcher adopted Mugenda and Mugenda recommend the formula:
1
nnf
n
N
To be used to calculate the sample size. According to the above formula:
nf= desired sample size when the population is less than 10,000,
n= desired sample when the population is more than 10,000 which is 384
N= estimate of the population size. (Mugenda and Mugenda 2003)
The accessible population of this study was 1172 NGOs of which the resultant sample size of
270 was determined. Table 2 represents the sample size of each stratum based on the sectors
of operation distributed proportionately. Stratified random sampling was the applied with
allocation of samples proportionate to the size of the strata. The proportionate sample size of
each stratum was calculated using the formula: N
Nn
N
Nn
N
NnPn n,...,, 21
Where: N= the population of the study
N1…n = proportionate population in each strata
Pn= proportion of sample to be selected in each strata
Formula adapted from (Kothari, 2009)

43
Table 2: Stratified Sampling Schedule
Strata Sector N1..n Pn
P1 Health, food and nutrition 156 34 P2 Environment, energy and conservation measures 55 12 P3 Water and Sanitation 16 5 P4 Research, Learning and Capacity Building, 51 15 P5 Shelter and Informal Sector 56 13 P6 Population and Relief Services 77 17 P7 Programs for disabled persons, children, youth, women, religion 213 50 P8 Social policy, Communication and Advocacy 127 29 P9 Community development and Economic Empowerment 312 71 P10 Education. 129 34
Total 1172 270
Source: Researcher, 2013
The sample size for the study was (n=270) NGOs based in Nairobi County. According to
Kothari (2009), the principle of simple random sampling gave every object same possibility to
be chosen as sample study. Based on this principle, the values of Pn in each stratum represented
the number of organisations that were selected based on simple random sampling. This endured
that an unbiased random selection of individuals was realized and represented the entire
population.
3.5 Data and Instruments of Data Collection
The study consolidated both primary and secondary data. Secondary data was collected from
relevant records from the NGOs under study and NGO coordinating board of Kenya. The
main instrument for collecting primary data was a questionnaire. According to Kombo and
Tromp (2006), a questionnaire is a research instrument with various advantages that includes;
information collected from a large sample, confidentiality, time saving and minimized biases
that arise from interview. The questionnaire used in this research is appended in this study as
appendix 1. The researcher wrote a cover letter and attached it to the questionnaire (refer to
Appendix 2), and for some of the respondent this tools were shared via an email link. The
covering letter had information about the nature of the research study and the value of the
respondents’ participation. Each participating organisation filled one questionnaire. The
questionnaires were purposefully filled by senior management staff.

44
3.5.1 Reliability and Validity
Reliability and validity are central issue in all measurement (Neuman, 2003). The study
adopted the use of questionnaire. Hence, the two basic goals in questionnaire design were to
ensure that the questionnaire obtain information relevant to the purposes of the survey and to
collect this information with maximal reliability and validity.
3.5.1.1 Reliability
The main element of reliability is to ascertain the research instruments to be used to bring
about valid findings. The instrument used in this study was not only simply constructed by the
researcher, but was constructed based on the theoretical models already identified by experts
in field of succession planning and organisation performance (Rothwell, 2001; Aberdeen
2007; Kaplan and Norton, 1992) as depicted by the variables on the conceptual framework.
Sekaran (2003), described reliability as a measure that indicates the extent to which the
instruments of study were free from bias. Over and above, Cronbach’s Alpha (α) was used to
determine the internal reliability coefficient. The researcher calculated the Cronbach’s
Coefficient Alpha scores to test the reliability of the questionnaire, with specific reference to
its internal consistency. The piloted questionnaires were subjected to analysis using SPSS to
determine the acceptable alpha (α) value. According to Field (2005), the generally accepted
value for reliability should not be less than 0.7 value of the Alpha (α) to ensure that the
questionnaire is reliable with its items measuring the same underlying construct. The case
summary after the listwise deletion based on all variables in the procedure was found to be
(α= .950) of the 51 items processed. The Cronbach’s Alphas for each of the items was
consistently above (α= 0.70) which indicates that the information gathered with the research
questionnaire was highly reliable.
3.5.1.2 Validity
Validity refers to the degree to which an instrument measures what it is supposed to be
measuring. Piloting of instrument was done to determine its feasibility and validity of the tool.
This was to ensure that content validity is ascertained and that items on the questionnaire
45
represent the entire range of possible items for the study as described in the variables.
Criterion-related validity was also considered through the research design to ensure that the
research tool demonstrated its effectiveness in predicting criterion or indicators of a construct.
Construct validity was also considered by reviewing the study instrument to ensure the
measurement instruments have construct validity aligned to the variables understudy are
easily interpolated in the same manner. To ascertain validity, a pilot study was conducted
among 5 NGOs that are registered with the National Coordination Board but are not part of
the sample. This ensured the effectiveness of the questionnaire by enabling the researcher to
find out whether, the questions were effective in measuring the variables, whether the
wording were clear and that all the questions were being interpreted in the same way by the
respondents.
3.6 Ethical Consideration
At all times during the study the researcher abided to laws and rules that prohibit unethical
behavior in research. In the process of data collection and presentation, adequate care was
taken to acknowledge sources of information and presentation of the ideal data gathered to
avoid faking data and their sources. The researcher avoided all that would incline him to
plagiarism. The researcher particularly protected and respected the trust given by the
respondents. In this regard, the respondents’ confidence and privacy was protected. The
principle of voluntary consent was recognized to ensure that every respondent willingly
participate in the study process. The researcher further committed himself to respect the views
expressed by the respondents. The results were presented and reported in the most open,
objective, accurate and honest manner. The role and intellectual contributions of various
persons involved in this study process have been fully and dully acknowledged. The
researcher adhered to clearance from the Institute of post graduate studies of Kabarak
University and the National council of Science and Technology of Kenya.
3.7 Data Analysis and Presentation
The raw data collected for this study was subjected to analysis, discussed and presented as the
findings. To facilitate this, the collected data was edited and coded. The data was analyzed
46
using SPSS 21.0 for Windows. According to Coakes, Steed and Dzidic (2006) SPSS has the
incredible capabilities of analyzing huge data within seconds and generating unlimited simple
and sophisticated statistical results. The analysis of the data collected was guided with
(Creswell, 1994) definition of descriptive and quantitative designs. Inferential statistical tools
were used to determine the strength of a relationship between variables and to establish the
strength of association between dependent and independent variables. Data analysis,
presentation and discussion were done systematically starting with: descriptive statistics,
inferential statistics through correlations and multiple regressions analysis. In details, the
descriptive statistics analysis of the categorical data was presented in frequency tables with
Chi Square statistic. This was used to compare tallies or counts of categorical responses
between two (or more) independent groups. Analysis of variance (ANOVA) was used to test
whether two or more dependent variable means are equal (i.e., the probability that any
differences in means across several groups are due solely to sampling error). As well, multiple
regression analysis as a statistical process was used to determine the relationship among
various variables.
The main model for statistical analysis was derived from the main objective of the study
which had its variables Organisation performance (OP) denoted by Y as the dependent
variable and succession planning (SP) denoted by X as the independent variable.
The dependent variable Y- OP had the following measurements; Stakeholder’s outcomes,
internal business process and Growth. And, the independent variable for succession planning
(SP) X had, Strategic HRM, succession characteristics and periodic assessment.
The main model for statistical analysis was:
Y ~X1+X2+X3
And was expressed by the equation
Y=β0+ β1 X1+ β2 X2 +β3 X3+ ε
Where: β0 was the intercept giving the mean of Y where the variable X1, X2, X3 does not
significantly contribute to the model

47
β1, β2, β3 gave the proportion of contribution of X1, X2, X3 respectively to the model
ε was the moderator variables as years of establishment and staff establishment
For effective multiple regression analysis three sub models for each objective with sub- sub
model for each variable under the study were developed as follows:
Sub model 1 for analysis of the second objective of the study: H01Succession planning has no
significant influence on stakeholder’s outcomes for Non-Governmental Organisations’ in
Kenya.
Y ~Xa
Y* → S.O
Xa→ S.P
Sub- sub model for sub model 1
Y1 ~Xb
Y1 ~Xc
Y1 ~Xd
Sub model 2 for analysis of the third objective H02 Succession planning has no significant role
on the internal business process of Non-Governmental Organisations’ in Kenya.
Y2 ~Xe
Xe→ SP
Sub- sub model for model 2
Y2 ~Xb
Y2 ~Xc
Where: Y* is Stakeholders outcome ( SO)
Xa is succession planning (SP)
Where: Y1 is Stakeholders Outcome
Xb is Strategic HRM programmes
Xc is Succession Characteristics
Xd is Periodic Assessment
Where: Y2 is Internal Business process ( IBS)
Xe is succession planning (SP)
Where: Y2 is internal business process
Xb is Strategic HRM programmes
Xc is Succession Characteristics
Xd is Periodic Assessment

48
Y2 ~Xd
Sub model 3 for analysis of forth objective H03 Succession planning has no significant
contribution to the growth of Non-Governmental Organisations’ in Kenya.
Y3 ~Xf
Xf→ SP
Sub- sub model for sub model model 3
Y3 ~Xb
Y2 ~Xc
Y2 ~Xd
The figure below represents the analysis flow chat used to develop factor analysis. Factor
loading supporting this flow chart is annexed as appendix 2
Figure 4: Data analysis and presentation flow chart
Described
Multiple
regressions
Regression Factor
Analysis
Correlations
Checked No.
of variables
Reduction
Recognizing
data
Where: Y3 is Institutional Growth ( IG)
Xf is succession planning (SP)
Where: Y2 is Institutional growth
Xb is Strategic HRM programmes
Xc is Succession Characteristics
Xd is Periodic Assessment
49
Source: Researcher, (2014)
The primary data collected were categorical. As such the nature of the data collected was
recognised under “what to do”. Hence analysis of the descriptive data was done through
presentation of the variables of indicators scores as percentages. At this level Chi- Square
tests were conducted and probabilities of the Chi- Squares determined at the level of
“described”. Before performing inferential statistical analysis, the variables were checked at
the level of “how many variables”. At this level reduction was carried out to determine;
colleniarity, communality and variability. From factor analysis on the respective instruments
for the predictors, the new variables were automatically stored in the dataset that was later
used for fitting regression models. Statistic summaries and correlation matrixes were also
developed for each variable under study. The correlation matrix was used to check the pattern
of relationships by scanning the significant values. In this respect, Bartlett’s test for null
hypothesis for the original correlation matrix was established. From factor analysis, the
extracted predicators and outcomes were then used to run multiple regressions. As well,
Hierarchical multiple regressions was used to assess the effects of the moderating variables by
looking for the interaction effects between predicator that was the independent variable
(Succession planning) and outcome that was the dependent variable (Organisation
performance)
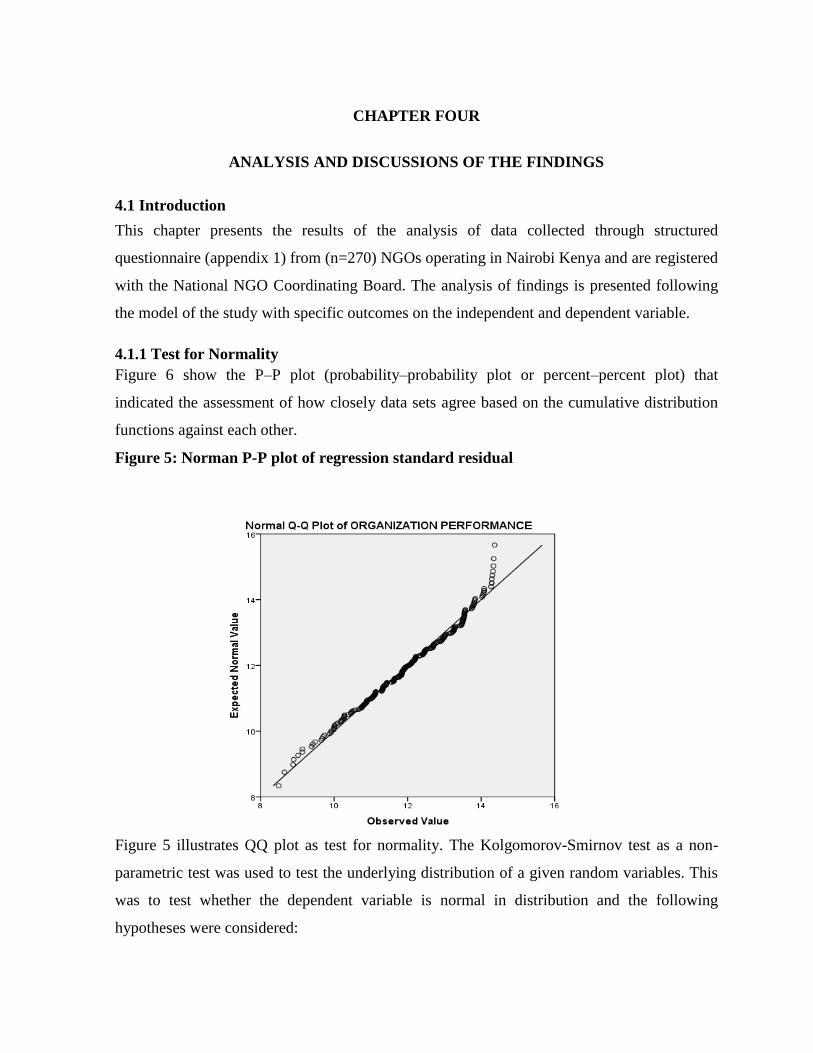
CHAPTER FOUR
ANALYSIS AND DISCUSSIONS OF THE FINDINGS
4.1 Introduction
This chapter presents the results of the analysis of data collected through structured
questionnaire (appendix 1) from (n=270) NGOs operating in Nairobi Kenya and are registered
with the National NGO Coordinating Board. The analysis of findings is presented following
the model of the study with specific outcomes on the independent and dependent variable.
4.1.1 Test for Normality
Figure 6 show the P–P plot (probability–probability plot or percent–percent plot) that
indicated the assessment of how closely data sets agree based on the cumulative distribution
functions against each other.
Figure 5: Norman P-P plot of regression standard residual
Figure 5 illustrates QQ plot as test for normality. The Kolgomorov-Smirnov test as a non-
parametric test was used to test the underlying distribution of a given random variables. This
was to test whether the dependent variable is normal in distribution and the following
hypotheses were considered:
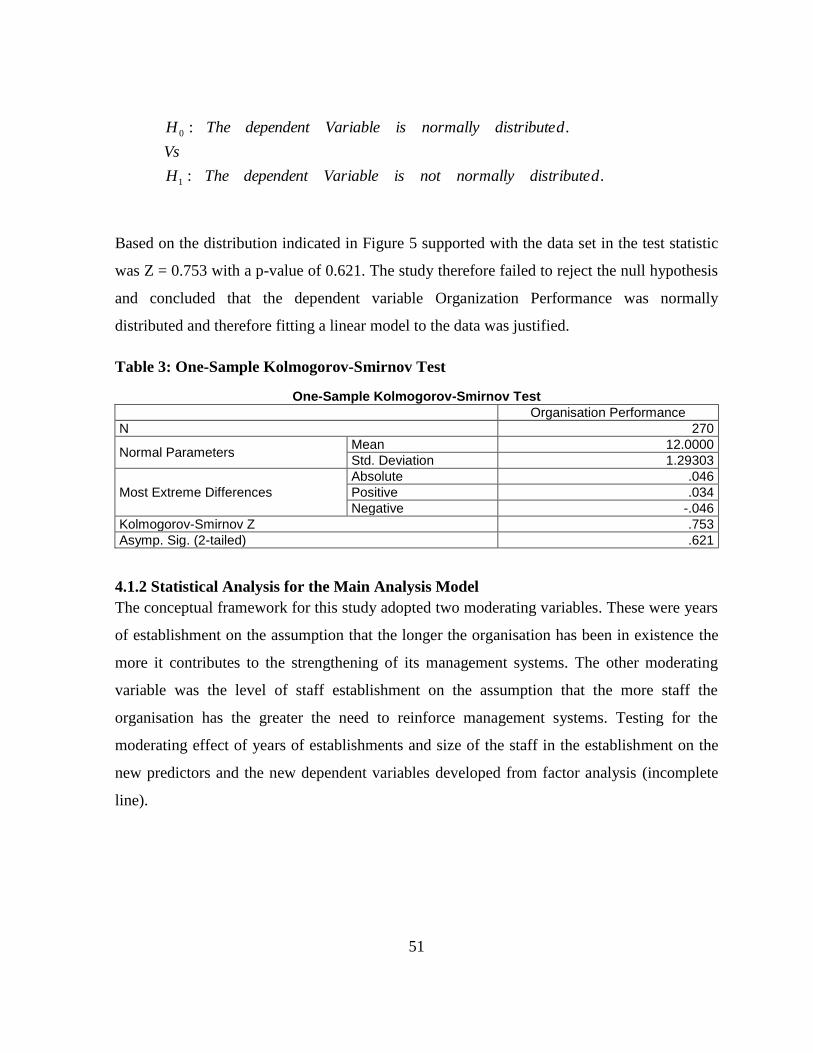
51
.:
.:
1
0
ddistributenormallynotisVariabledependentTheH
Vs
ddistributenormallyisVariabledependentTheH
Based on the distribution indicated in Figure 5 supported with the data set in the test statistic
was Z = 0.753 with a p-value of 0.621. The study therefore failed to reject the null hypothesis
and concluded that the dependent variable Organization Performance was normally
distributed and therefore fitting a linear model to the data was justified.
Table 3: One-Sample Kolmogorov-Smirnov Test
One-Sample Kolmogorov-Smirnov Test
Organisation Performance
N 270
Normal Parameters Mean 12.0000
Std. Deviation 1.29303
Most Extreme Differences
Absolute .046
Positive .034
Negative -.046
Kolmogorov-Smirnov Z .753
Asymp. Sig. (2-tailed) .621
4.1.2 Statistical Analysis for the Main Analysis Model
The conceptual framework for this study adopted two moderating variables. These were years
of establishment on the assumption that the longer the organisation has been in existence the
more it contributes to the strengthening of its management systems. The other moderating
variable was the level of staff establishment on the assumption that the more staff the
organisation has the greater the need to reinforce management systems. Testing for the
moderating effect of years of establishments and size of the staff in the establishment on the
new predictors and the new dependent variables developed from factor analysis (incomplete
line).
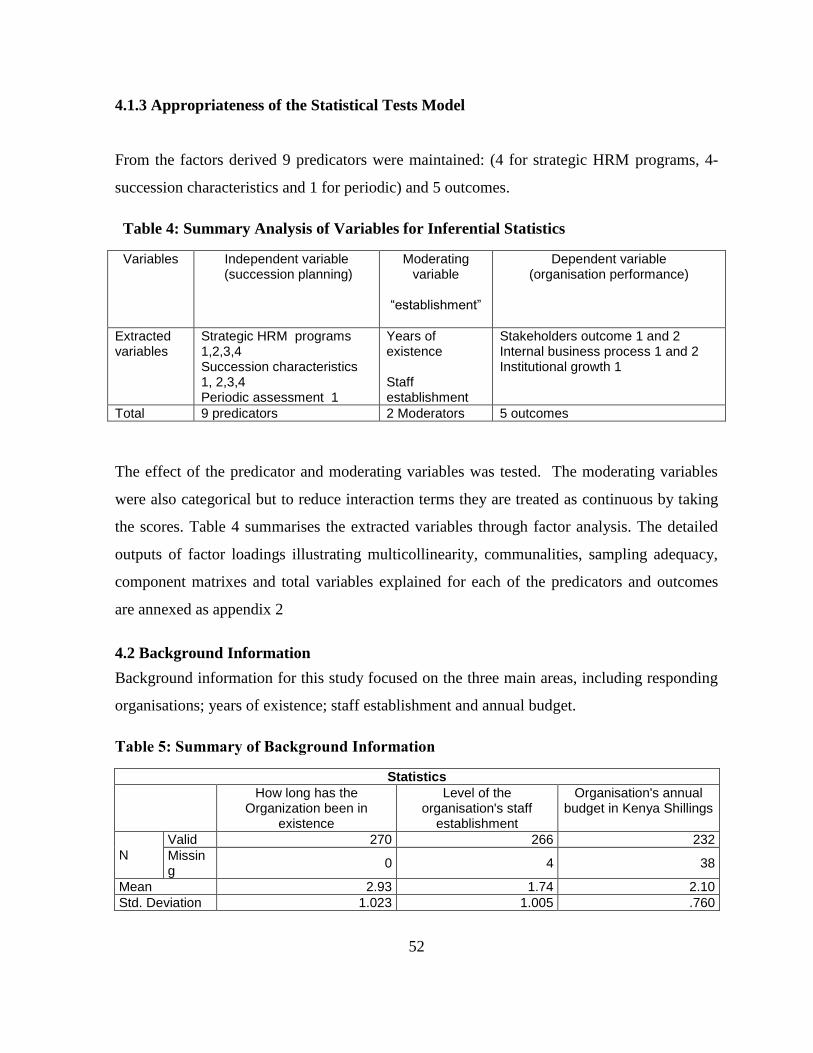
52
4.1.3 Appropriateness of the Statistical Tests Model
From the factors derived 9 predicators were maintained: (4 for strategic HRM programs, 4-
succession characteristics and 1 for periodic) and 5 outcomes.
Table 4: Summary Analysis of Variables for Inferential Statistics
Variables Independent variable (succession planning)
Moderating variable
“establishment”
Dependent variable (organisation performance)
Extracted variables
Strategic HRM programs 1,2,3,4 Succession characteristics 1, 2,3,4 Periodic assessment 1
Years of existence Staff establishment
Stakeholders outcome 1 and 2 Internal business process 1 and 2 Institutional growth 1
Total 9 predicators 2 Moderators 5 outcomes
The effect of the predicator and moderating variables was tested. The moderating variables
were also categorical but to reduce interaction terms they are treated as continuous by taking
the scores. Table 4 summarises the extracted variables through factor analysis. The detailed
outputs of factor loadings illustrating multicollinearity, communalities, sampling adequacy,
component matrixes and total variables explained for each of the predicators and outcomes
are annexed as appendix 2
4.2 Background Information
Background information for this study focused on the three main areas, including responding
organisations; years of existence; staff establishment and annual budget.
Table 5: Summary of Background Information
Statistics
How long has the Organization been in
existence
Level of the organisation's staff
establishment
Organisation's annual budget in Kenya Shillings
N
Valid 270 266 232
Missing
0 4 38
Mean 2.93 1.74 2.10
Std. Deviation 1.023 1.005 .760
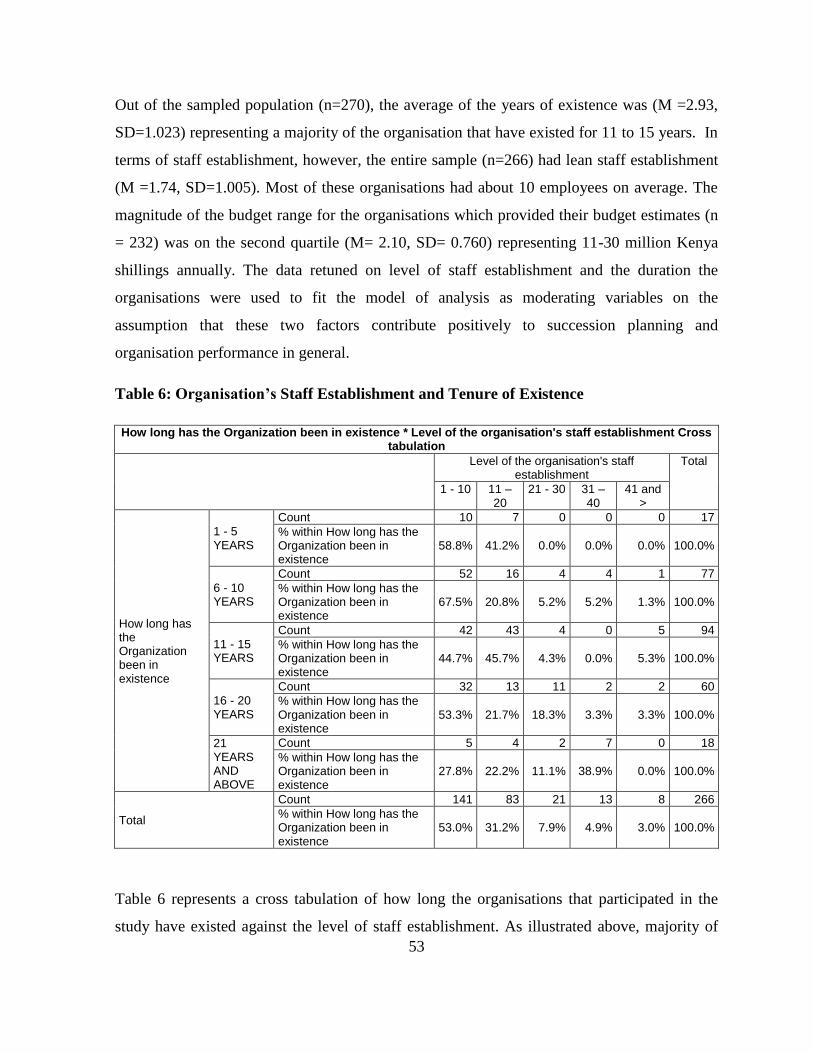
53
Out of the sampled population (n=270), the average of the years of existence was (M =2.93,
SD=1.023) representing a majority of the organisation that have existed for 11 to 15 years. In
terms of staff establishment, however, the entire sample (n=266) had lean staff establishment
(M =1.74, SD=1.005). Most of these organisations had about 10 employees on average. The
magnitude of the budget range for the organisations which provided their budget estimates (n
= 232) was on the second quartile (M= 2.10, SD= 0.760) representing 11-30 million Kenya
shillings annually. The data retuned on level of staff establishment and the duration the
organisations were used to fit the model of analysis as moderating variables on the
assumption that these two factors contribute positively to succession planning and
organisation performance in general.
Table 6: Organisation’s Staff Establishment and Tenure of Existence
How long has the Organization been in existence * Level of the organisation's staff establishment Cross tabulation
Level of the organisation's staff establishment
Total
1 - 10 11 – 20
21 - 30 31 – 40
41 and >
How long has the Organization been in existence
1 - 5 YEARS
Count 10 7 0 0 0 17
% within How long has the Organization been in existence
58.8% 41.2% 0.0% 0.0% 0.0% 100.0%
6 - 10 YEARS
Count 52 16 4 4 1 77
% within How long has the Organization been in existence
67.5% 20.8% 5.2% 5.2% 1.3% 100.0%
11 - 15 YEARS
Count 42 43 4 0 5 94
% within How long has the Organization been in existence
44.7% 45.7% 4.3% 0.0% 5.3% 100.0%
16 - 20 YEARS
Count 32 13 11 2 2 60
% within How long has the Organization been in existence
53.3% 21.7% 18.3% 3.3% 3.3% 100.0%
21 YEARS AND ABOVE
Count 5 4 2 7 0 18
% within How long has the Organization been in existence
27.8% 22.2% 11.1% 38.9% 0.0% 100.0%
Total
Count 141 83 21 13 8 266
% within How long has the Organization been in existence
53.0% 31.2% 7.9% 4.9% 3.0% 100.0%
Table 6 represents a cross tabulation of how long the organisations that participated in the
study have existed against the level of staff establishment. As illustrated above, majority of
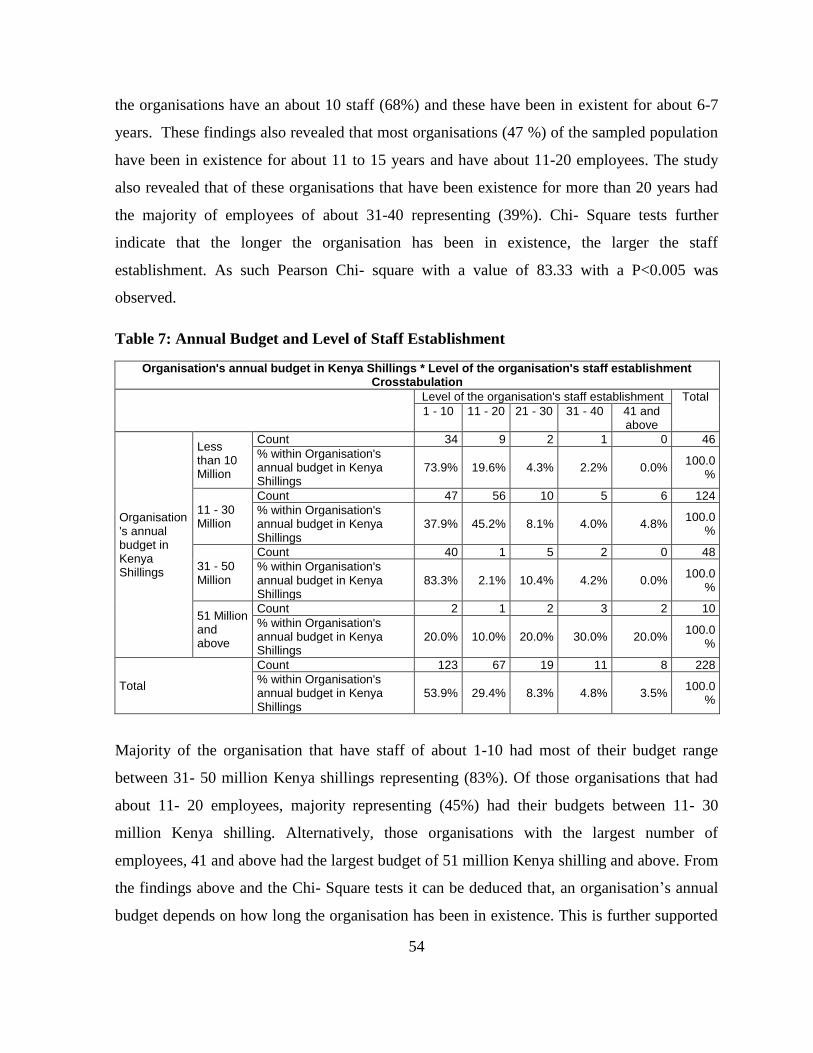
54
the organisations have an about 10 staff (68%) and these have been in existent for about 6-7
years. These findings also revealed that most organisations (47 %) of the sampled population
have been in existence for about 11 to 15 years and have about 11-20 employees. The study
also revealed that of these organisations that have been existence for more than 20 years had
the majority of employees of about 31-40 representing (39%). Chi- Square tests further
indicate that the longer the organisation has been in existence, the larger the staff
establishment. As such Pearson Chi- square with a value of 83.33 with a P<0.005 was
observed.
Table 7: Annual Budget and Level of Staff Establishment
Organisation's annual budget in Kenya Shillings * Level of the organisation's staff establishment Crosstabulation
Level of the organisation's staff establishment Total
1 - 10 11 - 20 21 - 30 31 - 40 41 and above
Organisation's annual budget in Kenya Shillings
Less than 10 Million
Count 34 9 2 1 0 46
% within Organisation's annual budget in Kenya Shillings
73.9% 19.6% 4.3% 2.2% 0.0% 100.0
%
11 - 30 Million
Count 47 56 10 5 6 124
% within Organisation's annual budget in Kenya Shillings
37.9% 45.2% 8.1% 4.0% 4.8% 100.0
%
31 - 50 Million
Count 40 1 5 2 0 48
% within Organisation's annual budget in Kenya Shillings
83.3% 2.1% 10.4% 4.2% 0.0% 100.0
%
51 Million and above
Count 2 1 2 3 2 10
% within Organisation's annual budget in Kenya Shillings
20.0% 10.0% 20.0% 30.0% 20.0% 100.0
%
Total
Count 123 67 19 11 8 228
% within Organisation's annual budget in Kenya Shillings
53.9% 29.4% 8.3% 4.8% 3.5% 100.0
%
Majority of the organisation that have staff of about 1-10 had most of their budget range
between 31- 50 million Kenya shillings representing (83%). Of those organisations that had
about 11- 20 employees, majority representing (45%) had their budgets between 11- 30
million Kenya shilling. Alternatively, those organisations with the largest number of
employees, 41 and above had the largest budget of 51 million Kenya shilling and above. From
the findings above and the Chi- Square tests it can be deduced that, an organisation’s annual
budget depends on how long the organisation has been in existence. This is further supported
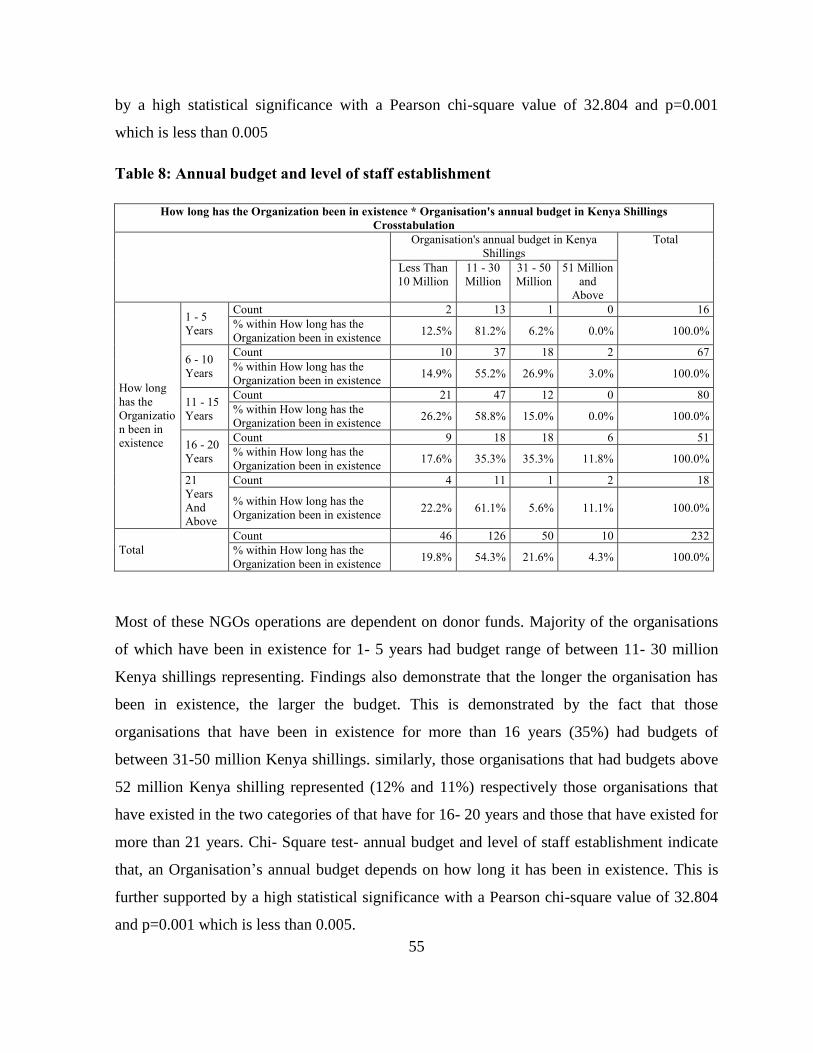
55
by a high statistical significance with a Pearson chi-square value of 32.804 and p=0.001
which is less than 0.005
Table 8: Annual budget and level of staff establishment
Most of these NGOs operations are dependent on donor funds. Majority of the organisations
of which have been in existence for 1- 5 years had budget range of between 11- 30 million
Kenya shillings representing. Findings also demonstrate that the longer the organisation has
been in existence, the larger the budget. This is demonstrated by the fact that those
organisations that have been in existence for more than 16 years (35%) had budgets of
between 31-50 million Kenya shillings. similarly, those organisations that had budgets above
52 million Kenya shilling represented (12% and 11%) respectively those organisations that
have existed in the two categories of that have for 16- 20 years and those that have existed for
more than 21 years. Chi- Square test- annual budget and level of staff establishment indicate
that, an Organisation’s annual budget depends on how long it has been in existence. This is
further supported by a high statistical significance with a Pearson chi-square value of 32.804
and p=0.001 which is less than 0.005.
How long has the Organization been in existence * Organisation's annual budget in Kenya Shillings
Crosstabulation
Organisation's annual budget in Kenya
Shillings
Total
Less Than
10 Million
11 - 30
Million
31 - 50
Million
51 Million
and
Above
How long
has the
Organizatio
n been in
existence
1 - 5
Years
Count 2 13 1 0 16
% within How long has the
Organization been in existence 12.5% 81.2% 6.2% 0.0% 100.0%
6 - 10
Years
Count 10 37 18 2 67
% within How long has the
Organization been in existence 14.9% 55.2% 26.9% 3.0% 100.0%
11 - 15
Years
Count 21 47 12 0 80
% within How long has the
Organization been in existence 26.2% 58.8% 15.0% 0.0% 100.0%
16 - 20
Years
Count 9 18 18 6 51
% within How long has the
Organization been in existence 17.6% 35.3% 35.3% 11.8% 100.0%
21
Years
And
Above
Count 4 11 1 2 18
% within How long has the
Organization been in existence 22.2% 61.1% 5.6% 11.1% 100.0%
Total
Count 46 126 50 10 232
% within How long has the
Organization been in existence 19.8% 54.3% 21.6% 4.3% 100.0%

56
4.3. Descriptive Analysis and Discussions of Findings of main Variables
4.3.1 Strategic Human Resource Programs
Indicators for strategic human resource management that form the basis of succession
planning were identified. These employee resourcing, training and development, performance
appraisal, career development and total rewards, were assessed to establish if effective
succession planning programs share certain common characteristics across organisations that
are employing human resource management strategies. Table 9 summarises the response rate
in percentage.
Table 9: Strategic Human Resource Programs
Strategic HRM programs
Not all important
Not very important
Somewhat important
Important Very important
χ2 P> χ2
Established way of recruitment to forecast future talent needs
7% 10.7% 10% 33.3% 38.9% 119.926 0.000
Established means to compare individual skills to the requirements of a future position performance appraisal
7.4% 25.7% 19.3% 8.9% 38.7% 88.937 0.000
Tied succession planning programme to training programme
9.3% 7.8% 15.6% 33.7% 32.2% 145.467 0.000
Tied succession planning programme to individual career plans
5.3% 14.4% 17.3% 33% 30.3% 112.273 0.000
Established incentives/rewards for identified successors in the succession planning programme.
9.6% 13.0% 14.4% 31.1% 31.9% 123.422 0.000
To a greater extent, the practise among NGO’s affirmed that talent reviews are the key to
effective Succession management, including identified gaps. However, organisation talent
57
reviews for succession planning should be executed within the context of a talent strategy as a
rigorous competency-based assessment of employees, in order to identify high-potential
employees and future leaders, and to determine bench strength at a particular level that links
well with the seven point model. This is not explicitly identified as a practise among NGO’s
as discussed in the review of literature under section 2.4.1 on the seven pointed star model,
(Karien, 2011). With respect to training and development, more than a quarter indicated that it
was very important (30%) and another (33%) indicated as only important’. Rewards and
incentives were recognized as very important with nearly half (40%) and (31%) as only
important. On the contrary, almost a quarter (13.0%) felt that incentives and rewards for
identified successors for succession planning were not very important. The mentioned aspects
of training and development, rewards and incentives are also considered critical in the
analysis of the PACE model of Aberdeen Group. As capabilities and enablers, they provide
essential ingredients of a succession planning strategy that produce top results in maintaining
performance measurement as the key functionality of solutions required to support the
organisation’s enabling business practices (Jayson and Martins, 2008).
These findings synchronises with the increasing interest in tactical succession planning using
talent management. This is considered as key in the development of the concept of Succession
planning as a dynamic and ongoing process of systematically identifying, assessing, and
developing leadership talent (Nink and Fogg, 2006). Performance management was
recognized with half of (50%) who agreed, whereas (23%) disagreed on the same. Almost a
quarter of (21%) strongly agreed while about half (59%) agreed that training and development
is key. Slightly more than half (52%) agreed that its important to integrated rewards systems
to succession planning. However, (21%) disagreed with additional (8%) strongly disagreeing.
As such therefore, talent management remains key as supported by (Dessler, 2005) that, the
process of succession planning general demands three steps that include: Firstly, identifying
and analysing key jobs; secondly, creating and assessing candidates; and thirdly, selecting the
right individuals who will fill up the key positions and stating the program over the lifetime of
the organisations.
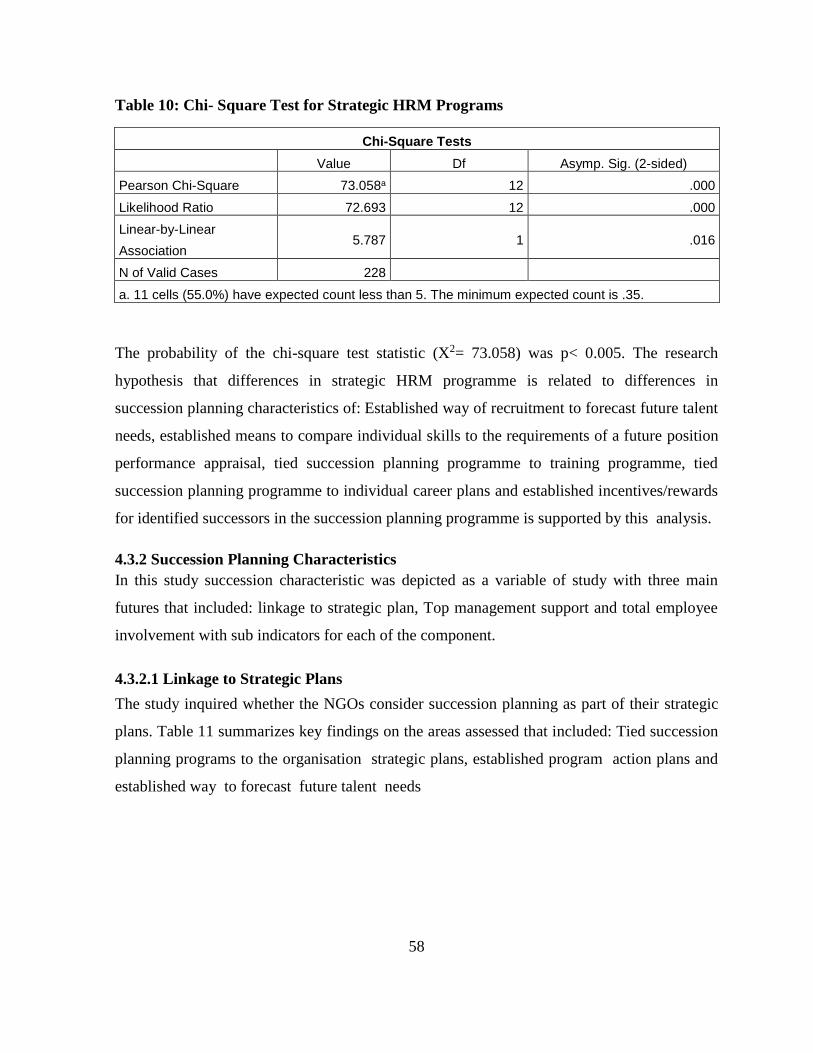
58
Table 10: Chi- Square Test for Strategic HRM Programs
Chi-Square Tests
Value Df Asymp. Sig. (2-sided)
Pearson Chi-Square 73.058a 12 .000
Likelihood Ratio 72.693 12 .000
Linear-by-Linear
Association 5.787 1 .016
N of Valid Cases 228
a. 11 cells (55.0%) have expected count less than 5. The minimum expected count is .35.
The probability of the chi-square test statistic (X2= 73.058) was p< 0.005. The research
hypothesis that differences in strategic HRM programme is related to differences in
succession planning characteristics of: Established way of recruitment to forecast future talent
needs, established means to compare individual skills to the requirements of a future position
performance appraisal, tied succession planning programme to training programme, tied
succession planning programme to individual career plans and established incentives/rewards
for identified successors in the succession planning programme is supported by this analysis.
4.3.2 Succession Planning Characteristics
In this study succession characteristic was depicted as a variable of study with three main
futures that included: linkage to strategic plan, Top management support and total employee
involvement with sub indicators for each of the component.
4.3.2.1 Linkage to Strategic Plans
The study inquired whether the NGOs consider succession planning as part of their strategic
plans. Table 11 summarizes key findings on the areas assessed that included: Tied succession
planning programs to the organisation strategic plans, established program action plans and
established way to forecast future talent needs
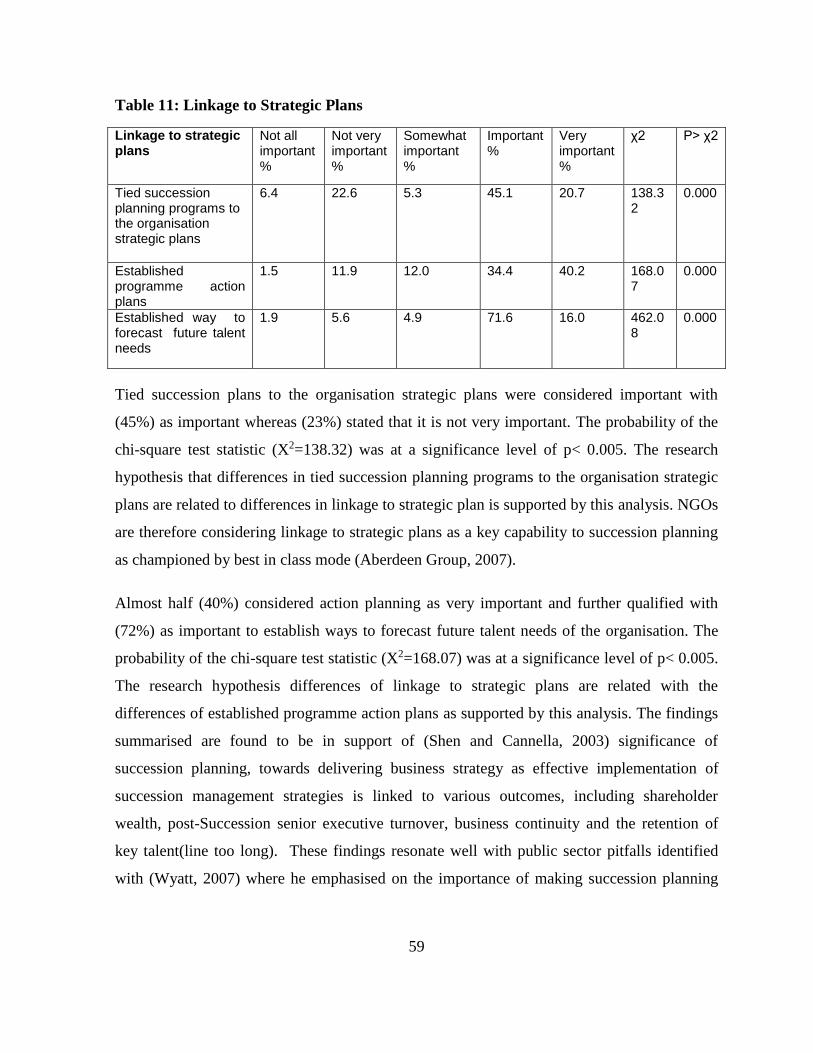
59
Table 11: Linkage to Strategic Plans
Linkage to strategic plans
Not all important %
Not very important %
Somewhat important %
Important %
Very important %
χ2 P> χ2
Tied succession planning programs to the organisation strategic plans
6.4 22.6 5.3 45.1 20.7 138.32
0.000
Established programme action plans
1.5 11.9 12.0 34.4 40.2 168.07
0.000
Established way to forecast future talent needs
1.9 5.6 4.9 71.6 16.0 462.08
0.000
Tied succession plans to the organisation strategic plans were considered important with
(45%) as important whereas (23%) stated that it is not very important. The probability of the
chi-square test statistic (X2=138.32) was at a significance level of p< 0.005. The research
hypothesis that differences in tied succession planning programs to the organisation strategic
plans are related to differences in linkage to strategic plan is supported by this analysis. NGOs
are therefore considering linkage to strategic plans as a key capability to succession planning
as championed by best in class mode (Aberdeen Group, 2007).
Almost half (40%) considered action planning as very important and further qualified with
(72%) as important to establish ways to forecast future talent needs of the organisation. The
probability of the chi-square test statistic (X2=168.07) was at a significance level of p< 0.005.
The research hypothesis differences of linkage to strategic plans are related with the
differences of established programme action plans as supported by this analysis. The findings
summarised are found to be in support of (Shen and Cannella, 2003) significance of
succession planning, towards delivering business strategy as effective implementation of
succession management strategies is linked to various outcomes, including shareholder
wealth, post-Succession senior executive turnover, business continuity and the retention of
key talent(line too long). These findings resonate well with public sector pitfalls identified
with (Wyatt, 2007) where he emphasised on the importance of making succession planning
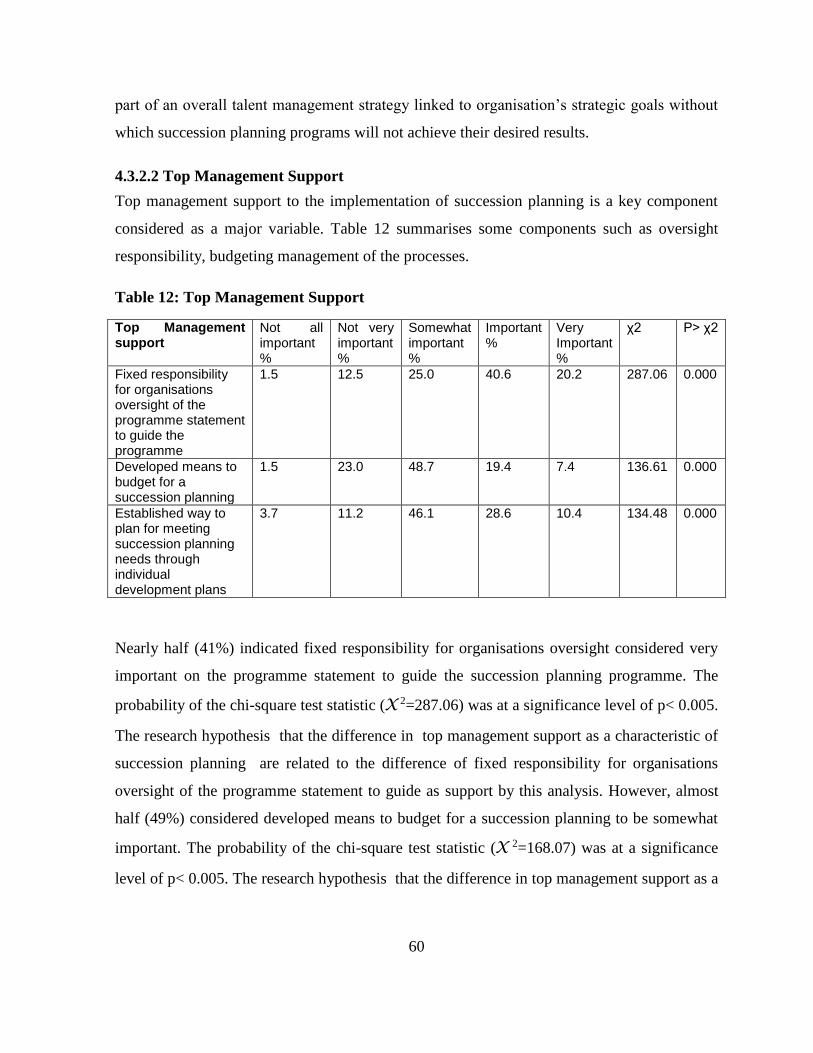
60
part of an overall talent management strategy linked to organisation’s strategic goals without
which succession planning programs will not achieve their desired results.
4.3.2.2 Top Management Support
Top management support to the implementation of succession planning is a key component
considered as a major variable. Table 12 summarises some components such as oversight
responsibility, budgeting management of the processes.
Table 12: Top Management Support
Top Management support
Not all important %
Not very important %
Somewhat important %
Important %
Very Important %
χ2 P> χ2
Fixed responsibility for organisations oversight of the programme statement to guide the programme
1.5 12.5 25.0 40.6 20.2 287.06 0.000
Developed means to budget for a succession planning
1.5 23.0 48.7 19.4 7.4 136.61 0.000
Established way to plan for meeting succession planning needs through individual development plans
3.7
11.2 46.1 28.6 10.4 134.48 0.000
Nearly half (41%) indicated fixed responsibility for organisations oversight considered very
important on the programme statement to guide the succession planning programme. The
probability of the chi-square test statistic (X 2=287.06) was at a significance level of p< 0.005.
The research hypothesis that the difference in top management support as a characteristic of
succession planning are related to the difference of fixed responsibility for organisations
oversight of the programme statement to guide as support by this analysis. However, almost
half (49%) considered developed means to budget for a succession planning to be somewhat
important. The probability of the chi-square test statistic (X 2=168.07) was at a significance
level of p< 0.005. The research hypothesis that the difference in top management support as a
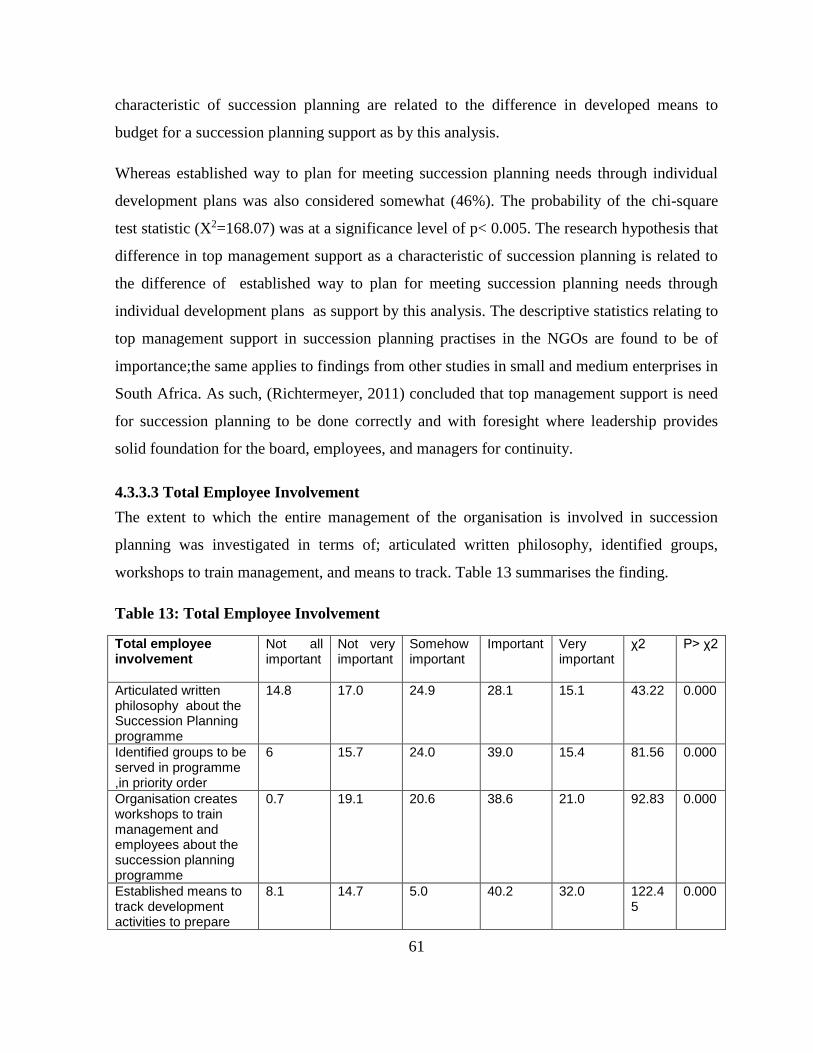
61
characteristic of succession planning are related to the difference in developed means to
budget for a succession planning support as by this analysis.
Whereas established way to plan for meeting succession planning needs through individual
development plans was also considered somewhat (46%). The probability of the chi-square
test statistic (X2=168.07) was at a significance level of p< 0.005. The research hypothesis that
difference in top management support as a characteristic of succession planning is related to
the difference of established way to plan for meeting succession planning needs through
individual development plans as support by this analysis. The descriptive statistics relating to
top management support in succession planning practises in the NGOs are found to be of
importance;the same applies to findings from other studies in small and medium enterprises in
South Africa. As such, (Richtermeyer, 2011) concluded that top management support is need
for succession planning to be done correctly and with foresight where leadership provides
solid foundation for the board, employees, and managers for continuity.
4.3.3.3 Total Employee Involvement
The extent to which the entire management of the organisation is involved in succession
planning was investigated in terms of; articulated written philosophy, identified groups,
workshops to train management, and means to track. Table 13 summarises the finding.
Table 13: Total Employee Involvement
Total employee involvement
Not all important
Not very important
Somehow important
Important Very important
χ2 P> χ2
Articulated written philosophy about the Succession Planning programme
14.8 17.0 24.9 28.1 15.1 43.22 0.000
Identified groups to be served in programme ,in priority order
6 15.7 24.0 39.0 15.4 81.56 0.000
Organisation creates workshops to train management and employees about the succession planning programme
0.7 19.1 20.6 38.6 21.0 92.83 0.000
Established means to track development activities to prepare
8.1 14.7 5.0 40.2 32.0 122.45
0.000

62
successors for eventual advancements
NGO’s (N=246) had a mixed opinion on whether articulated written philosophy about the
Succession Planning programme was of importance. More than a quarter (28%) indicated this
is an important aspect, whereas (25%) indicated that this is of slight importance. A
considerable percentage of (15%) felt that this is not important at all. The probability of the
chi-square test statistic (X 2= 43.02) was at a significance level of p< 0.005. The research
hypothesis that the difference in top management support as a characteristic of succession
planning are related to the difference of articulated written philosophy about the Succession
Planning programs supported with this analysis that shows statistically significant association.
However, top leadership support is considered key to best practise.The first step for
systematic succession planning and management is for the organisations to make the
commitment. In this step the organisation’s decision makers are expected to: Assess problems
and practices, demonstrate the need for the program, determine the organisation’s exact
succession planning and management program requirements, link the program directly to
organisational and human resource strategic plans, benchmark practices in other
organisations, clarify the roles of different groups in the program (Rothwell, 2001).
On the other hand, identified groups to be served in the programme, in priority order was
considered as important with nearly half (39%) and subsequent 15.4% very important. The
probability of the chi-square test statistic (X 2= 92.83) was at a significance level of p< 0.005.
The research hypothesis that the difference in total employee involvement are related to the
difference in identified groups to be served in programme in priority order as justified by this
analysis show statistically significant association.
Whether the organisation creates workshops to train management and employees about the
succession planning programme that was rated 38.6% as important whereas 19.1% indicated
that this is not important. Aspects of training in this case related to whether the organisations
had tried succession plans to training programme. The probability of the chi-square test
statistics? (X 2= 92.83) was at a significance level of p< 0.005. The research hypothesis that
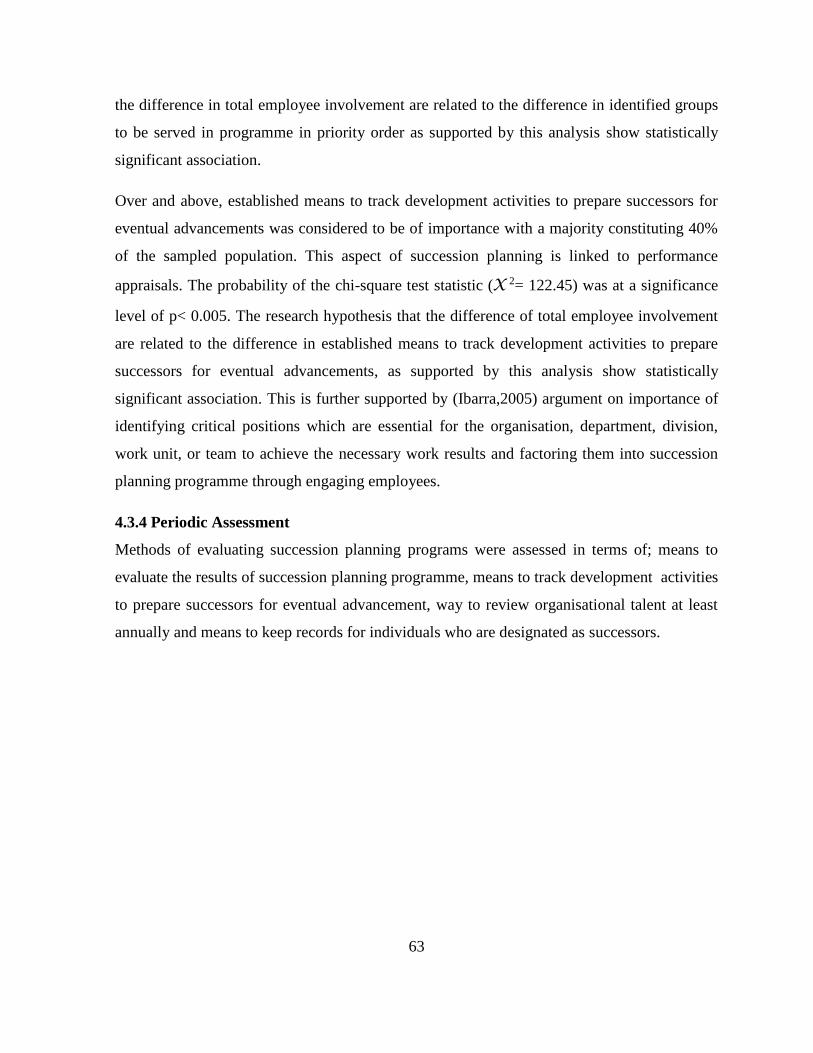
63
the difference in total employee involvement are related to the difference in identified groups
to be served in programme in priority order as supported by this analysis show statistically
significant association.
Over and above, established means to track development activities to prepare successors for
eventual advancements was considered to be of importance with a majority constituting 40%
of the sampled population. This aspect of succession planning is linked to performance
appraisals. The probability of the chi-square test statistic (X 2= 122.45) was at a significance
level of p< 0.005. The research hypothesis that the difference of total employee involvement
are related to the difference in established means to track development activities to prepare
successors for eventual advancements, as supported by this analysis show statistically
significant association. This is further supported by (Ibarra,2005) argument on importance of
identifying critical positions which are essential for the organisation, department, division,
work unit, or team to achieve the necessary work results and factoring them into succession
planning programme through engaging employees.
4.3.4 Periodic Assessment
Methods of evaluating succession planning programs were assessed in terms of; means to
evaluate the results of succession planning programme, means to track development activities
to prepare successors for eventual advancement, way to review organisational talent at least
annually and means to keep records for individuals who are designated as successors.
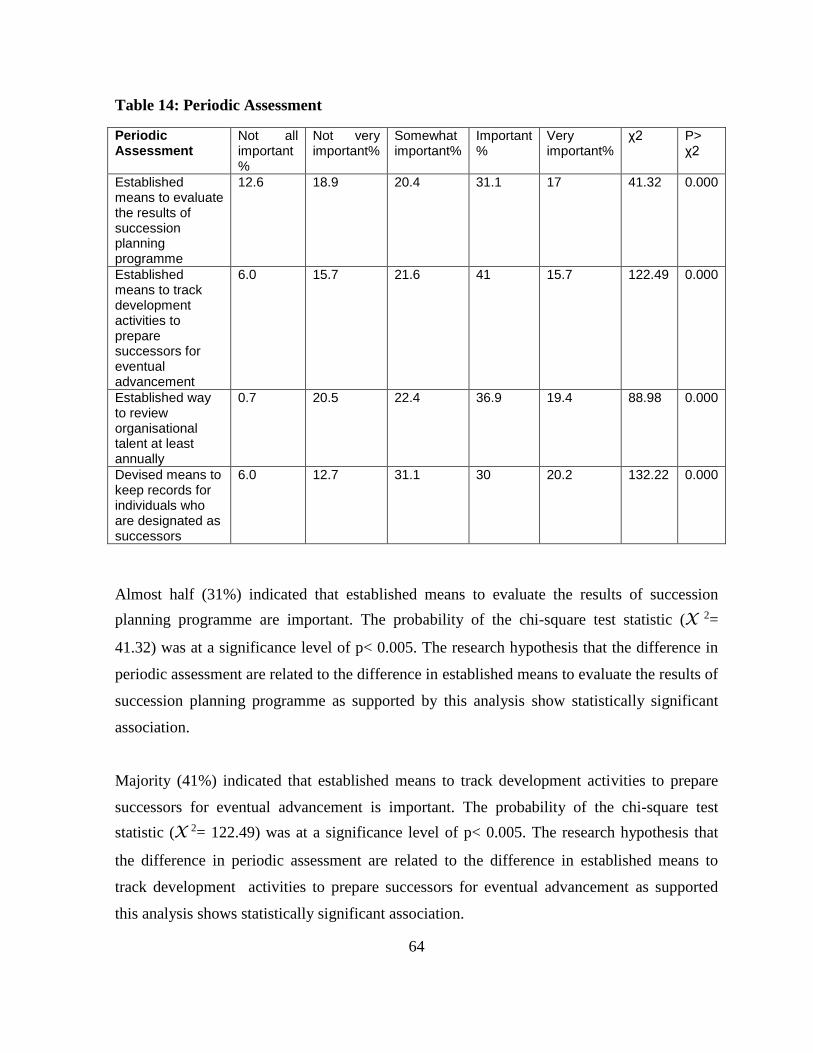
64
Table 14: Periodic Assessment
Periodic Assessment
Not all important %
Not very important%
Somewhat important%
Important %
Very important%
χ2 P> χ2
Established means to evaluate the results of succession planning programme
12.6 18.9 20.4 31.1 17 41.32 0.000
Established means to track development activities to prepare successors for eventual advancement
6.0 15.7 21.6 41 15.7 122.49 0.000
Established way to review organisational talent at least annually
0.7 20.5 22.4 36.9 19.4 88.98 0.000
Devised means to keep records for individuals who are designated as successors
6.0 12.7 31.1 30 20.2 132.22 0.000
Almost half (31%) indicated that established means to evaluate the results of succession
planning programme are important. The probability of the chi-square test statistic (X 2=
41.32) was at a significance level of p< 0.005. The research hypothesis that the difference in
periodic assessment are related to the difference in established means to evaluate the results of
succession planning programme as supported by this analysis show statistically significant
association.
Majority (41%) indicated that established means to track development activities to prepare
successors for eventual advancement is important. The probability of the chi-square test
statistic (X 2= 122.49) was at a significance level of p< 0.005. The research hypothesis that
the difference in periodic assessment are related to the difference in established means to
track development activities to prepare successors for eventual advancement as supported
this analysis shows statistically significant association.
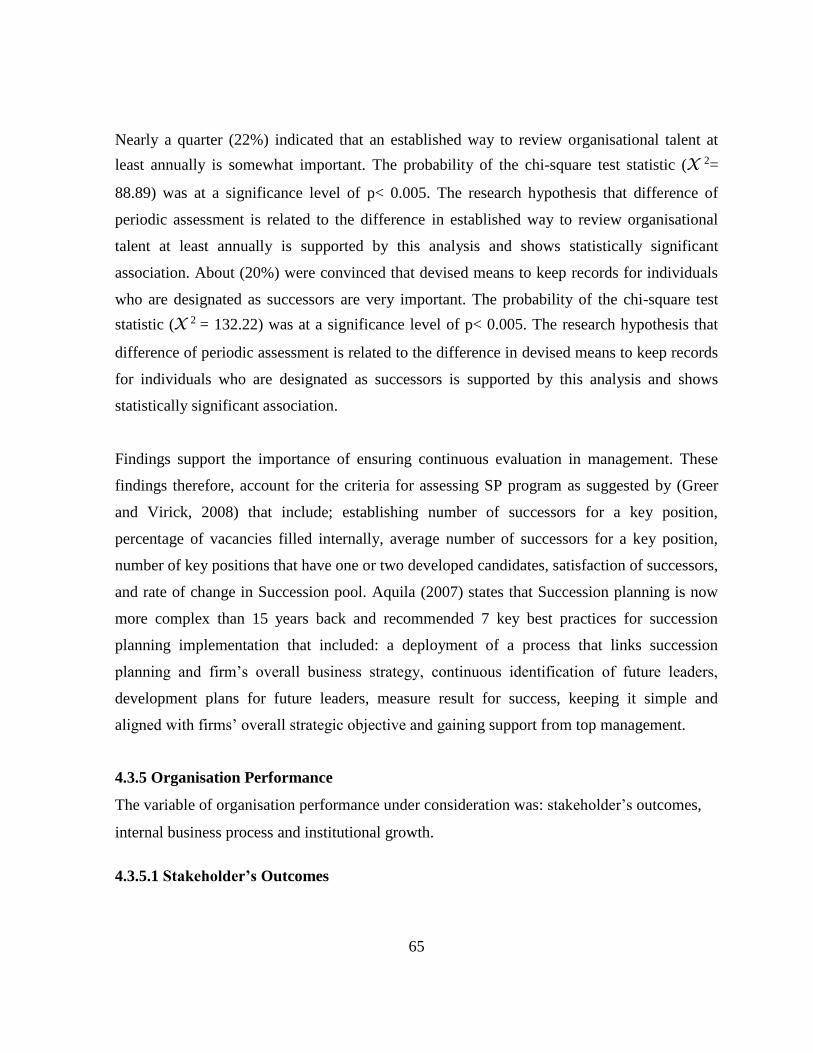
65
Nearly a quarter (22%) indicated that an established way to review organisational talent at
least annually is somewhat important. The probability of the chi-square test statistic (X 2=
88.89) was at a significance level of p< 0.005. The research hypothesis that difference of
periodic assessment is related to the difference in established way to review organisational
talent at least annually is supported by this analysis and shows statistically significant
association. About (20%) were convinced that devised means to keep records for individuals
who are designated as successors are very important. The probability of the chi-square test
statistic (X 2 = 132.22) was at a significance level of p< 0.005. The research hypothesis that
difference of periodic assessment is related to the difference in devised means to keep records
for individuals who are designated as successors is supported by this analysis and shows
statistically significant association.
Findings support the importance of ensuring continuous evaluation in management. These
findings therefore, account for the criteria for assessing SP program as suggested by (Greer
and Virick, 2008) that include; establishing number of successors for a key position,
percentage of vacancies filled internally, average number of successors for a key position,
number of key positions that have one or two developed candidates, satisfaction of successors,
and rate of change in Succession pool. Aquila (2007) states that Succession planning is now
more complex than 15 years back and recommended 7 key best practices for succession
planning implementation that included: a deployment of a process that links succession
planning and firm’s overall business strategy, continuous identification of future leaders,
development plans for future leaders, measure result for success, keeping it simple and
aligned with firms’ overall strategic objective and gaining support from top management.
4.3.5 Organisation Performance
The variable of organisation performance under consideration was: stakeholder’s outcomes,
internal business process and institutional growth.
4.3.5.1 Stakeholder’s Outcomes

66
Stakeholders outcome as an indicators of organisation performance was integrated as a
component of not forprofit financial measure. Indicators for this included a measure on the
stented to which the organisation; Keep up-to-date with advances about what works (does not
work) to improve performance in our field, whether employees have high level of
understanding of the organisation’s strategic orientation, whether their stakeholders (Donors
and beneficiaries) consider their work relevant, whether communities are taking ownership of
the projects and programs they implement and whether financial and narrative reports clearly
indicate activity outcome of the activities implemented by these NGOs.
Table 15: Stakeholders Outcome
Stakeholders outcome
Not all important %
Not very important%
Somewhat important %
Important %
Very important%
χ2 P> χ2
Keep up-to-date with advances about what works (does not work) to improve performance in our field
7.0 11.1 9.6 33.3 38.9 120.04 0.000
Employees have high level of understanding of organisations strategic orientation
7.4 25.7 19.7 8.6 38.7 90.02 0.000
Our stakeholders consider our work relevant.
9.3 7.4 15.9 33.0 33.0 146.27 0.000
Communities are taking ownership of the projects and programs we implement
5.3 14.4 17.0 33.0 37.3 112.27 0.000
Financial and narrative reports clearly indicate activity outcome
9.6 12.6 14.8 31.5 31.5 123.64 0.000
Nearly half (39%) of the organisations (n=270) indicate that they keep up-to-date with
advances in knowledge about what works (and what does not work) to improve performance
in their field as very important. The probability of the chi-square test statistic (X 2= 120.04)
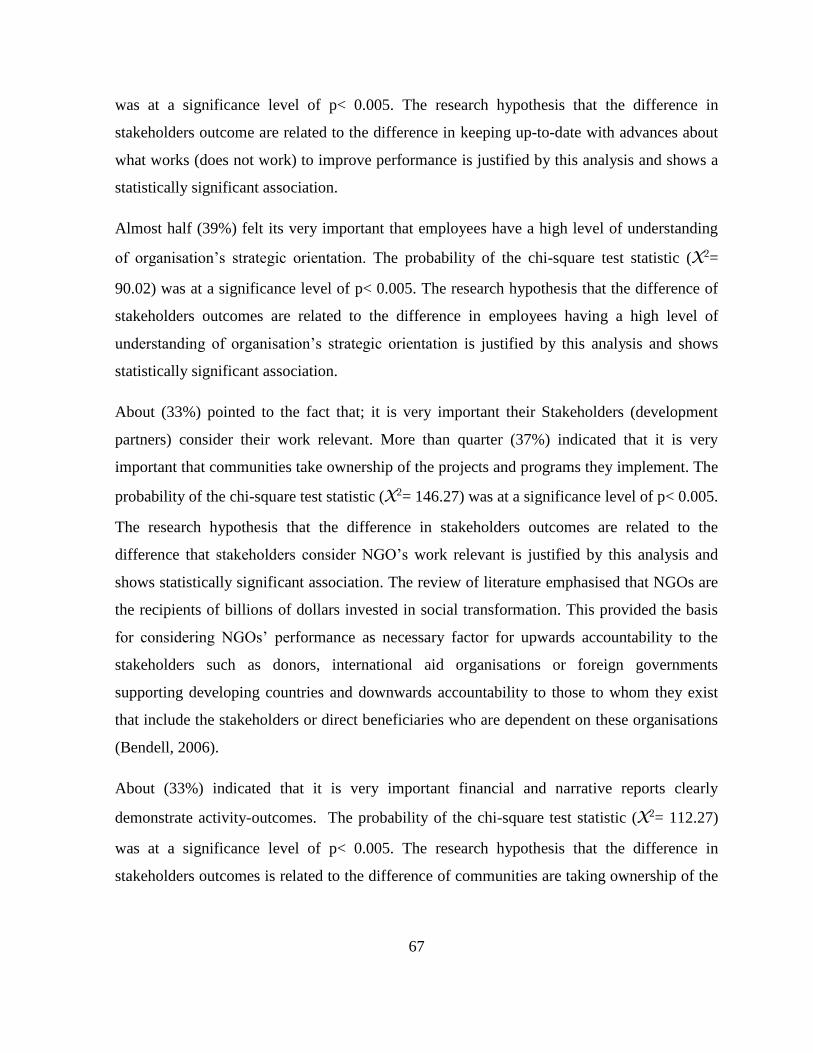
67
was at a significance level of p< 0.005. The research hypothesis that the difference in
stakeholders outcome are related to the difference in keeping up-to-date with advances about
what works (does not work) to improve performance is justified by this analysis and shows a
statistically significant association.
Almost half (39%) felt its very important that employees have a high level of understanding
of organisation’s strategic orientation. The probability of the chi-square test statistic (X2=
90.02) was at a significance level of p< 0.005. The research hypothesis that the difference of
stakeholders outcomes are related to the difference in employees having a high level of
understanding of organisation’s strategic orientation is justified by this analysis and shows
statistically significant association.
About (33%) pointed to the fact that; it is very important their Stakeholders (development
partners) consider their work relevant. More than quarter (37%) indicated that it is very
important that communities take ownership of the projects and programs they implement. The
probability of the chi-square test statistic (X2= 146.27) was at a significance level of p< 0.005.
The research hypothesis that the difference in stakeholders outcomes are related to the
difference that stakeholders consider NGO’s work relevant is justified by this analysis and
shows statistically significant association. The review of literature emphasised that NGOs are
the recipients of billions of dollars invested in social transformation. This provided the basis
for considering NGOs’ performance as necessary factor for upwards accountability to the
stakeholders such as donors, international aid organisations or foreign governments
supporting developing countries and downwards accountability to those to whom they exist
that include the stakeholders or direct beneficiaries who are dependent on these organisations
(Bendell, 2006).
About (33%) indicated that it is very important financial and narrative reports clearly
demonstrate activity-outcomes. The probability of the chi-square test statistic (X2= 112.27)
was at a significance level of p< 0.005. The research hypothesis that the difference in
stakeholders outcomes is related to the difference of communities are taking ownership of the

68
projects and programs they implement is justified by this analysis and shows statistically
significant association.
In relation to the already existing literatures, the above findings point to the fact that general
conceptualisation of organisational performance especially NGOs is relative. This is viewed
in line with analysis of these three dimensions provided by (Espirito 2001) as, effectiveness
and efficiency relating to the costs of inputs, process, and technology, capacity that relates to
generating outputs and issues of continuation such as survivability and responsiveness as
NGOs, like other organisations, try to justify what they do and how they do it(too long). The
indicators of succession planning practices considered under this category focused on whether
the NGOs: have a written succession plan policy, organization are potential successors
identified for key position and scope of succession planning involvement and type of
succession planning that exists in the sampled NGO.
4.3.5.2 Internal Business Process
Internal business process provides a measure on the extent to which the organisation keeps at
breast with the implementation of its defined policies and procedures. Attributes applied to
NGOs included: whether the NGOs constantly emphasize and introduce managerial
innovations, work hard to ensure that they apply the best performance tools and techniques
that are relevant to the field in which they operate and often assess departments’ needs by
forecasting future staffing requirements to determine work competency requirements with
regards to succession planning
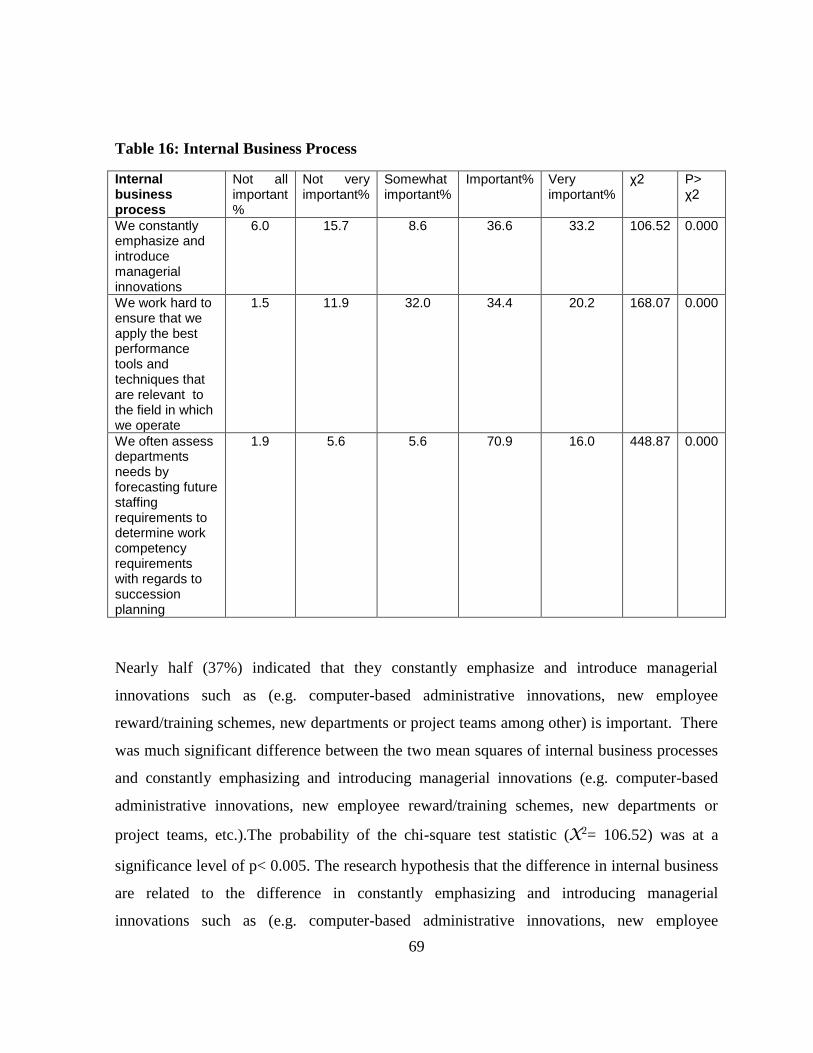
69
Table 16: Internal Business Process
Internal business process
Not all important %
Not very important%
Somewhat important%
Important% Very important%
χ2 P> χ2
We constantly emphasize and introduce managerial innovations
6.0 15.7 8.6 36.6 33.2 106.52 0.000
We work hard to ensure that we apply the best performance tools and techniques that are relevant to the field in which we operate
1.5 11.9 32.0 34.4 20.2 168.07 0.000
We often assess departments needs by forecasting future staffing requirements to determine work competency requirements with regards to succession planning
1.9 5.6 5.6 70.9 16.0 448.87 0.000
Nearly half (37%) indicated that they constantly emphasize and introduce managerial
innovations such as (e.g. computer-based administrative innovations, new employee
reward/training schemes, new departments or project teams among other) is important. There
was much significant difference between the two mean squares of internal business processes
and constantly emphasizing and introducing managerial innovations (e.g. computer-based
administrative innovations, new employee reward/training schemes, new departments or
project teams, etc.).The probability of the chi-square test statistic (X2= 106.52) was at a
significance level of p< 0.005. The research hypothesis that the difference in internal business
are related to the difference in constantly emphasizing and introducing managerial
innovations such as (e.g. computer-based administrative innovations, new employee
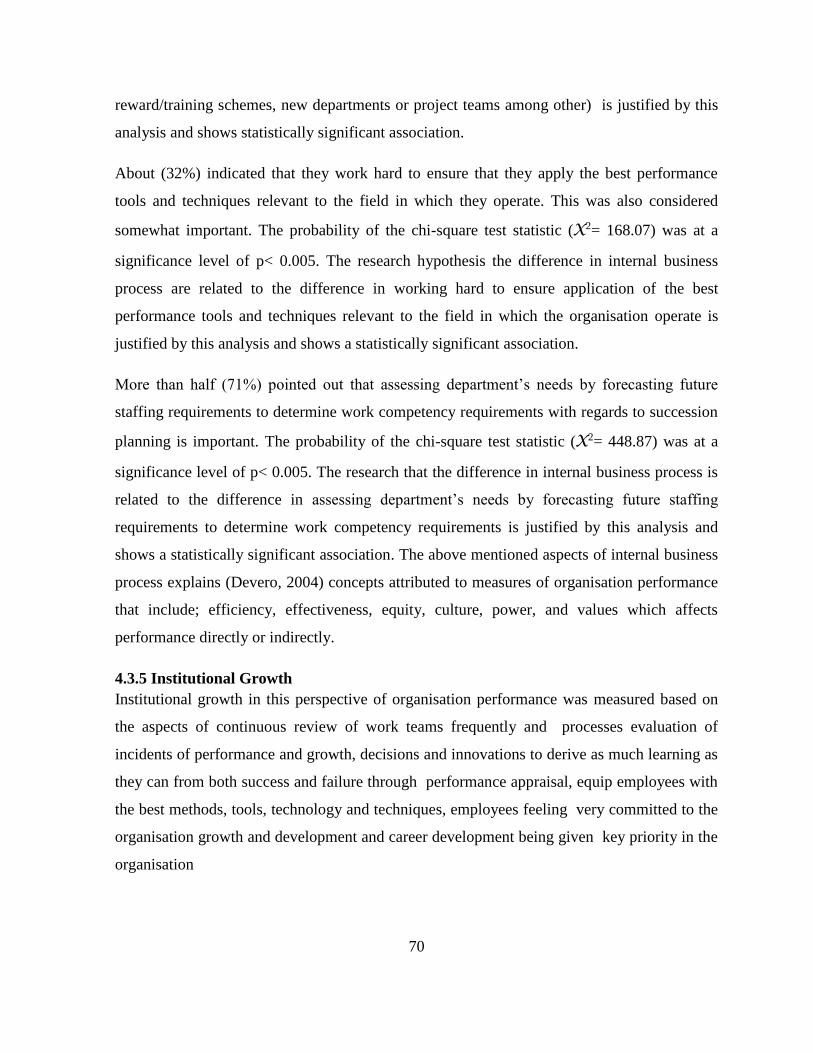
70
reward/training schemes, new departments or project teams among other) is justified by this
analysis and shows statistically significant association.
About (32%) indicated that they work hard to ensure that they apply the best performance
tools and techniques relevant to the field in which they operate. This was also considered
somewhat important. The probability of the chi-square test statistic (X2= 168.07) was at a
significance level of p< 0.005. The research hypothesis the difference in internal business
process are related to the difference in working hard to ensure application of the best
performance tools and techniques relevant to the field in which the organisation operate is
justified by this analysis and shows a statistically significant association.
More than half (71%) pointed out that assessing department’s needs by forecasting future
staffing requirements to determine work competency requirements with regards to succession
planning is important. The probability of the chi-square test statistic (X2= 448.87) was at a
significance level of p< 0.005. The research that the difference in internal business process is
related to the difference in assessing department’s needs by forecasting future staffing
requirements to determine work competency requirements is justified by this analysis and
shows a statistically significant association. The above mentioned aspects of internal business
process explains (Devero, 2004) concepts attributed to measures of organisation performance
that include; efficiency, effectiveness, equity, culture, power, and values which affects
performance directly or indirectly.
4.3.5 Institutional Growth
Institutional growth in this perspective of organisation performance was measured based on
the aspects of continuous review of work teams frequently and processes evaluation of
incidents of performance and growth, decisions and innovations to derive as much learning as
they can from both success and failure through performance appraisal, equip employees with
the best methods, tools, technology and techniques, employees feeling very committed to the
organisation growth and development and career development being given key priority in the
organisation
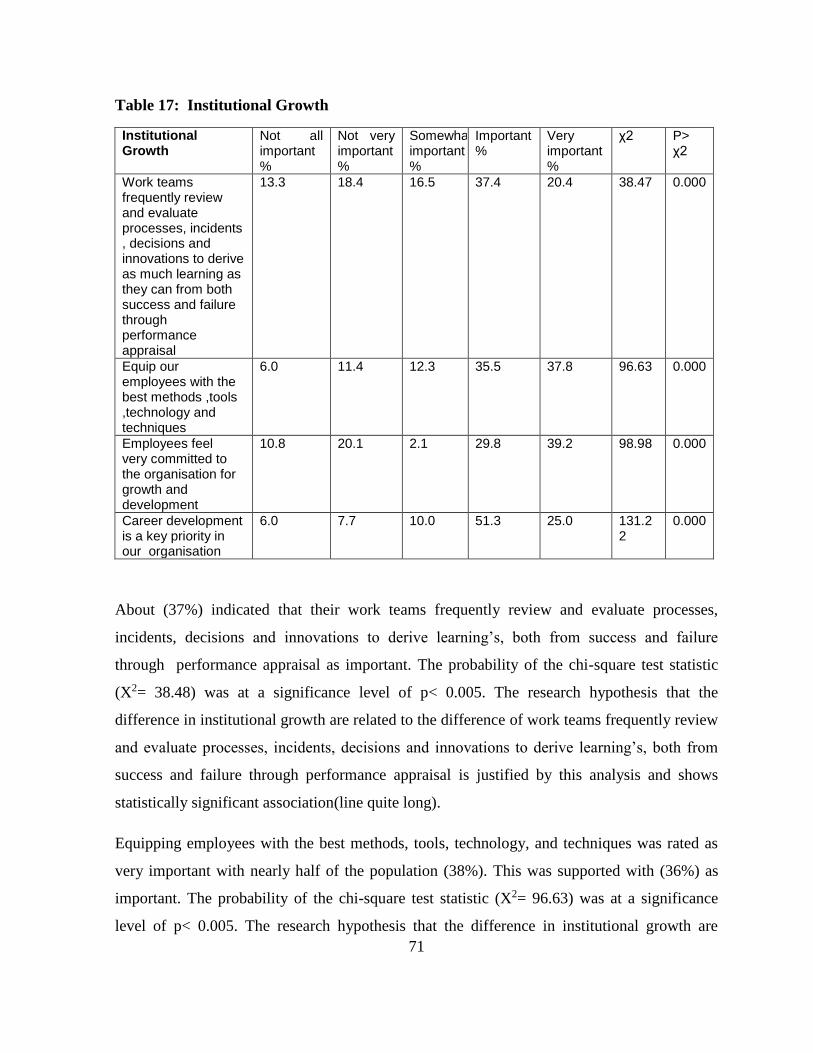
71
Table 17: Institutional Growth
Institutional Growth
Not all important %
Not very important %
Somewhat important %
Important%
Very important%
χ2 P> χ2
Work teams frequently review and evaluate processes, incidents , decisions and innovations to derive as much learning as they can from both success and failure through performance appraisal
13.3 18.4 16.5 37.4 20.4 38.47 0.000
Equip our employees with the best methods ,tools ,technology and techniques
6.0 11.4 12.3 35.5 37.8 96.63 0.000
Employees feel very committed to the organisation for growth and development
10.8 20.1 2.1 29.8 39.2 98.98 0.000
Career development is a key priority in our organisation
6.0 7.7 10.0 51.3 25.0 131.22
0.000
About (37%) indicated that their work teams frequently review and evaluate processes,
incidents, decisions and innovations to derive learning’s, both from success and failure
through performance appraisal as important. The probability of the chi-square test statistic
(X2= 38.48) was at a significance level of p< 0.005. The research hypothesis that the
difference in institutional growth are related to the difference of work teams frequently review
and evaluate processes, incidents, decisions and innovations to derive learning’s, both from
success and failure through performance appraisal is justified by this analysis and shows
statistically significant association(line quite long).
Equipping employees with the best methods, tools, technology, and techniques was rated as
very important with nearly half of the population (38%). This was supported with (36%) as
important. The probability of the chi-square test statistic (X2= 96.63) was at a significance
level of p< 0.005. The research hypothesis that the difference in institutional growth are
72
related to the difference in equipping employees with the best methods, tools, technology, and
techniques is justified by this analysis and shows statistically significant association.
About (40%) were convinced that their employees feel very committed to the organisation for
growth and development. However, about (11%) felt that this was not important at all to
them. The probability of the chi-square test statistic (X2= 98.98) was at a significance level of
p< 0.005. The research hypothesis that the difference in institutional growth is related to the
difference in employees feeling very committed to the organisation for growth and
development is justified by this analysis and shows statistically significant association.
Career development being priority in an organisation was considered important (51%). Less
than 10% considered this not important. The probability of the chi-square test statistic (X2=
131.22) was at a significance level of p< 0.005. The research hypothesis that the difference in
institutional growth are related to the difference in established ways to review organisational
talent at least annually is justified by this analysis and shows statistically significant
association.
4.4 Succession Planning Practices among Non-Governmental Organisations’
The survey assessed whether these NGOs have a written succession plan or policy, potential
successor’s identified for key positions, the scope of succession planning involvement and the
type of succession planning.
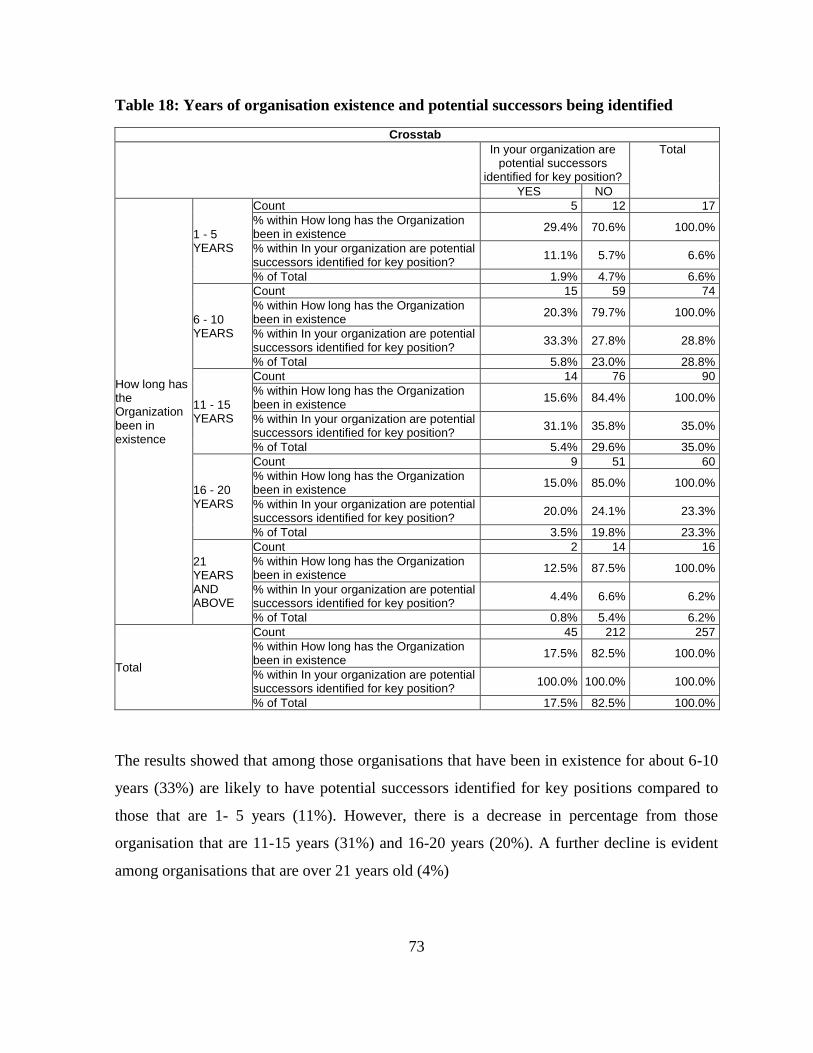
73
Table 18: Years of organisation existence and potential successors being identified
Crosstab
In your organization are potential successors
identified for key position?
Total
YES NO
How long has the Organization been in existence
1 - 5 YEARS
Count 5 12 17
% within How long has the Organization been in existence
29.4% 70.6% 100.0%
% within In your organization are potential successors identified for key position?
11.1% 5.7% 6.6%
% of Total 1.9% 4.7% 6.6%
6 - 10 YEARS
Count 15 59 74
% within How long has the Organization been in existence
20.3% 79.7% 100.0%
% within In your organization are potential successors identified for key position?
33.3% 27.8% 28.8%
% of Total 5.8% 23.0% 28.8%
11 - 15 YEARS
Count 14 76 90
% within How long has the Organization been in existence
15.6% 84.4% 100.0%
% within In your organization are potential successors identified for key position?
31.1% 35.8% 35.0%
% of Total 5.4% 29.6% 35.0%
16 - 20 YEARS
Count 9 51 60
% within How long has the Organization been in existence
15.0% 85.0% 100.0%
% within In your organization are potential successors identified for key position?
20.0% 24.1% 23.3%
% of Total 3.5% 19.8% 23.3%
21 YEARS AND ABOVE
Count 2 14 16
% within How long has the Organization been in existence
12.5% 87.5% 100.0%
% within In your organization are potential successors identified for key position?
4.4% 6.6% 6.2%
% of Total 0.8% 5.4% 6.2%
Total
Count 45 212 257
% within How long has the Organization been in existence
17.5% 82.5% 100.0%
% within In your organization are potential successors identified for key position?
100.0% 100.0% 100.0%
% of Total 17.5% 82.5% 100.0%
The results showed that among those organisations that have been in existence for about 6-10
years (33%) are likely to have potential successors identified for key positions compared to
those that are 1- 5 years (11%). However, there is a decrease in percentage from those
organisation that are 11-15 years (31%) and 16-20 years (20%). A further decline is evident
among organisations that are over 21 years old (4%)

74
Table 19: Chi-Square test on years of existence and written succession plan policy
Chi-Square Tests
Value Df Asymp. Sig. (2-sided)
Pearson Chi-Square 2.835a 4 .586
Likelihood Ratio 2.643 4 .619
Linear-by-Linear Association
2.202 1 .138
N of Valid Cases 257
a. 2 cells (20.0%) have expected count less than 5. The minimum expected count is 2.80.
In this table of Chi- Square test, the results indicates that 2 cell (20%) have expected count
less than 5 and the minimum expected count is 2.80. The sample size requirement for the Chi-
Square test of independence is not satisfied. The Chi- Square test of independence of the
relationship between how long the organisation has been in existence and how the potential
successors are identified shows test statistic (X 2= 2.835) at a significance level of p=0.586
that is greater than alpha level of significance of 0.05. The null hypothesis potential
successors would be identified are not independent of the difference of the years of
organisation existence. We therefore accept the null hypothesis and conclude that there is no
relationship between the means of identifying potential successors and the number of years
the organisation has been in existence.
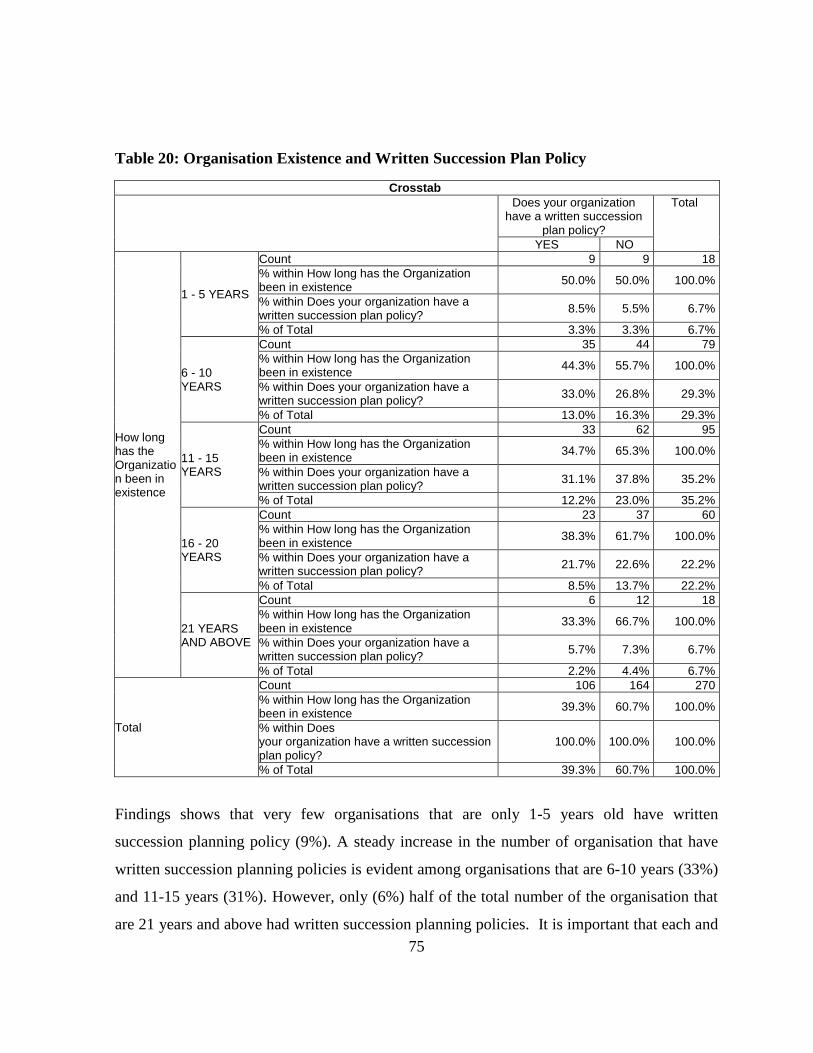
75
Table 20: Organisation Existence and Written Succession Plan Policy
Crosstab
Does your organization have a written succession
plan policy?
Total
YES NO
How long has the Organization been in existence
1 - 5 YEARS
Count 9 9 18
% within How long has the Organization been in existence
50.0% 50.0% 100.0%
% within Does your organization have a written succession plan policy?
8.5% 5.5% 6.7%
% of Total 3.3% 3.3% 6.7%
6 - 10 YEARS
Count 35 44 79
% within How long has the Organization been in existence
44.3% 55.7% 100.0%
% within Does your organization have a written succession plan policy?
33.0% 26.8% 29.3%
% of Total 13.0% 16.3% 29.3%
11 - 15 YEARS
Count 33 62 95
% within How long has the Organization been in existence
34.7% 65.3% 100.0%
% within Does your organization have a written succession plan policy?
31.1% 37.8% 35.2%
% of Total 12.2% 23.0% 35.2%
16 - 20 YEARS
Count 23 37 60
% within How long has the Organization been in existence
38.3% 61.7% 100.0%
% within Does your organization have a written succession plan policy?
21.7% 22.6% 22.2%
% of Total 8.5% 13.7% 22.2%
21 YEARS AND ABOVE
Count 6 12 18
% within How long has the Organization been in existence
33.3% 66.7% 100.0%
% within Does your organization have a written succession plan policy?
5.7% 7.3% 6.7%
% of Total 2.2% 4.4% 6.7%
Total
Count 106 164 270
% within How long has the Organization been in existence
39.3% 60.7% 100.0%
% within Does your organization have a written succession plan policy?
100.0% 100.0% 100.0%
% of Total 39.3% 60.7% 100.0%
Findings shows that very few organisations that are only 1-5 years old have written
succession planning policy (9%). A steady increase in the number of organisation that have
written succession planning policies is evident among organisations that are 6-10 years (33%)
and 11-15 years (31%). However, only (6%) half of the total number of the organisation that
are 21 years and above had written succession planning policies. It is important that each and
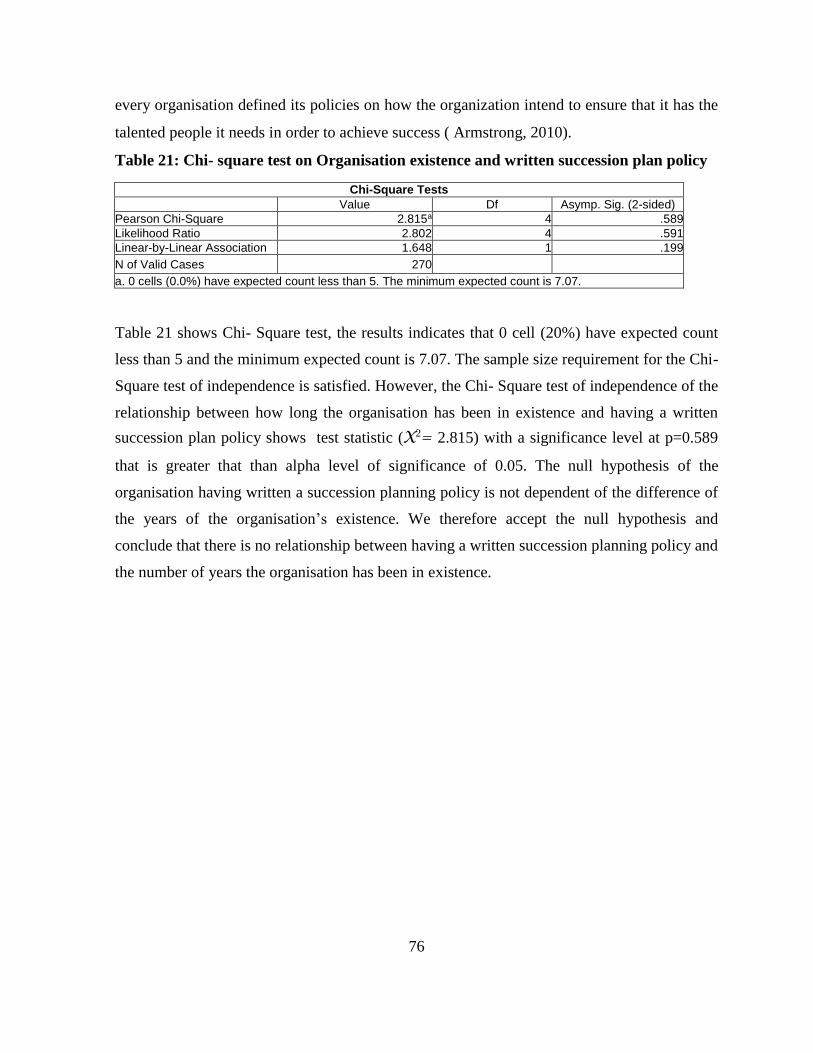
76
every organisation defined its policies on how the organization intend to ensure that it has the
talented people it needs in order to achieve success ( Armstrong, 2010).
Table 21: Chi- square test on Organisation existence and written succession plan policy
Chi-Square Tests
Value Df Asymp. Sig. (2-sided)
Pearson Chi-Square 2.815a 4 .589
Likelihood Ratio 2.802 4 .591
Linear-by-Linear Association 1.648 1 .199
N of Valid Cases 270 a. 0 cells (0.0%) have expected count less than 5. The minimum expected count is 7.07.
Table 21 shows Chi- Square test, the results indicates that 0 cell (20%) have expected count
less than 5 and the minimum expected count is 7.07. The sample size requirement for the Chi-
Square test of independence is satisfied. However, the Chi- Square test of independence of the
relationship between how long the organisation has been in existence and having a written
succession plan policy shows test statistic (X2= 2.815) with a significance level at p=0.589
that is greater that than alpha level of significance of 0.05. The null hypothesis of the
organisation having written a succession planning policy is not dependent of the difference of
the years of the organisation’s existence. We therefore accept the null hypothesis and
conclude that there is no relationship between having a written succession planning policy and
the number of years the organisation has been in existence.

77
Table 22: Organisation existence and the scope of succession planning involvement
Crosstab
What is the scope of succession planning involvement in your organization
Total
Only top management
line managers staff
All employees
How long has the Organization been in existence
1 - 5 Yrs
Count 16 2 0 18
% within How long has the Organization been in existence
88.9% 11.1% 0.0% 100.0
%
% within What is the scope of succession planning involvement in your organization
7.8% 3.8% 0.0% 6.7%
% of Total 5.9% 0.7% 0.0% 6.7%
6 - 10 Yrs
Count 70 9 0 79
% within How long has the Organization been in existence
88.6% 11.4% 0.0% 100.0
%
% within What is the scope of succession planning involvement in your organization
34.1% 17.3% 0.0% 29.4%
% of Total 26.0% 3.3% 0.0% 29.4%
11 - 15 Yrs
Count 54 33 7 94
% within How long has the Organization been in existence
57.4% 35.1% 7.4% 100.0
%
% within What is the scope of succession planning involvement in your organization
26.3% 63.5% 58.3% 34.9%
% of Total 20.1% 12.3% 2.6% 34.9%
16 - 20 Yrs
Count 50 5 5 60
% within How long has the Organization been in existence
83.3% 8.3% 8.3% 100.0
%
% within What is the scope of succession planning involvement in your organization
24.4% 9.6% 41.7% 22.3%
% of Total 18.6% 1.9% 1.9% 22.3%
21 Years and above
Count 15 3 0 18
% within How long has the Organization been in existence
83.3% 16.7% 0.0% 100.0
%
% within What is the scope of succession planning involvement in your organization
7.3% 5.8% 0.0% 6.7%
% of Total 5.6% 1.1% 0.0% 6.7%
Total
Count 205 52 12 269
% within How long has the Organization been in existence
76.2% 19.3% 4.5% 100.0
%
% within What is the scope of succession planning involvement in your organization
100.0% 100.0% 100.0% 100.0
%
% of Total 76.2% 19.3% 4.5% 100.0
%

78
Succession planning involvement was considered fewer than three main categories. This was
based on level of management from the top, line manager and all employees. As shown in the
data above, majority of the organisations that involve top management in succession planning
representing (34%) were of 6-10 years of existence. This exceeded the organisations that are
1-5 years old (8%). However, under this organisations’ cartegorisation , its evident that those
which were over 21 years old represented (6%). Again, the organisations that are 11-15 years
old involved most of the line management staff in succession planning (64%). This was
closely followed by the organisations that are about 6-10 years old with only (18%). The
results also showed that (58%) of the organisations that are 11-15 years old involve all
employees in their succession planning process. This was closely followed by (42%) of the
organisations that are16-20 years old. However, none of the organisations that are 1-5 years
old involved all employees in succession planning (0%).
Table 23: Organisation existence and the scope of succession planning involvement
Chi-Square Tests
Value Df Asymp. Sig. (2-sided)
Pearson Chi-Square 34.987a 8 .000
Likelihood Ratio 38.895 8 .000
Linear-by-Linear Association 2.678 1 .102
N of Valid Cases 269 a. 7 cells (46.7%) have expected count less than 5. The minimum expected count is .80.
In this Chi- Square test table, the results indicate that 7 cell (47%) have an expected count of
less than 5 and the minimum expected count is .80. The sample size requirement for the Chi-
Square test of independence is not satisfied. The Chi- Square test of independence of the
relationship between how long the organisation has been in existence and how the potential
successors are identified shows test statistic (X2= 34.987) at a significance level of p=0.000
that is less than alpha level of significance of 0.05. The null hypothesis level of succession
planning scope of involvement is dependent on the difference of the years of organisation
existence. We therefore reject the null hypothesis and conclude that there is a relationship
between level of succession planning scope of involvement and the number of years the
organisation has been in existence.
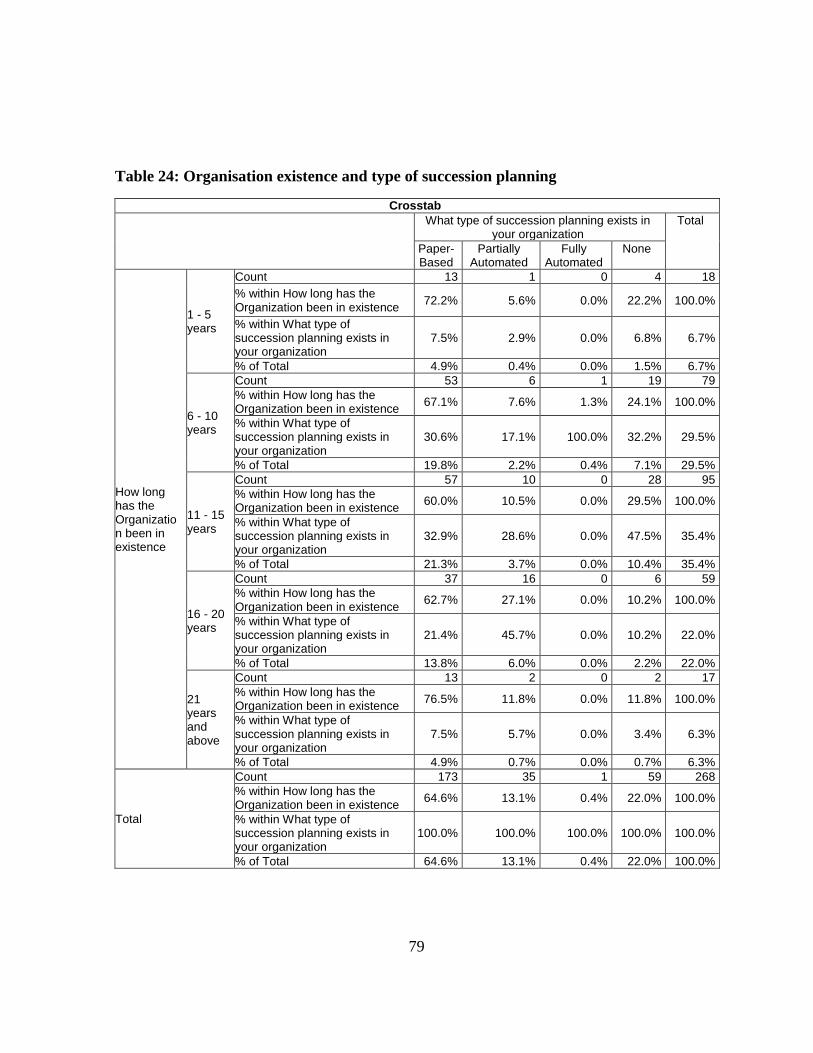
79
Table 24: Organisation existence and type of succession planning
Crosstab
What type of succession planning exists in your organization
Total
Paper-Based
Partially Automated
Fully Automated
None
How long has the Organization been in existence
1 - 5 years
Count 13 1 0 4 18
% within How long has the Organization been in existence
72.2% 5.6% 0.0% 22.2% 100.0%
% within What type of succession planning exists in your organization
7.5% 2.9% 0.0% 6.8% 6.7%
% of Total 4.9% 0.4% 0.0% 1.5% 6.7%
6 - 10 years
Count 53 6 1 19 79
% within How long has the Organization been in existence
67.1% 7.6% 1.3% 24.1% 100.0%
% within What type of succession planning exists in your organization
30.6% 17.1% 100.0% 32.2% 29.5%
% of Total 19.8% 2.2% 0.4% 7.1% 29.5%
11 - 15 years
Count 57 10 0 28 95
% within How long has the Organization been in existence
60.0% 10.5% 0.0% 29.5% 100.0%
% within What type of succession planning exists in your organization
32.9% 28.6% 0.0% 47.5% 35.4%
% of Total 21.3% 3.7% 0.0% 10.4% 35.4%
16 - 20 years
Count 37 16 0 6 59
% within How long has the Organization been in existence
62.7% 27.1% 0.0% 10.2% 100.0%
% within What type of succession planning exists in your organization
21.4% 45.7% 0.0% 10.2% 22.0%
% of Total 13.8% 6.0% 0.0% 2.2% 22.0%
21 years and above
Count 13 2 0 2 17
% within How long has the Organization been in existence
76.5% 11.8% 0.0% 11.8% 100.0%
% within What type of succession planning exists in your organization
7.5% 5.7% 0.0% 3.4% 6.3%
% of Total 4.9% 0.7% 0.0% 0.7% 6.3%
Total
Count 173 35 1 59 268
% within How long has the Organization been in existence
64.6% 13.1% 0.4% 22.0% 100.0%
% within What type of succession planning exists in your organization
100.0% 100.0% 100.0% 100.0% 100.0%
% of Total 64.6% 13.1% 0.4% 22.0% 100.0%
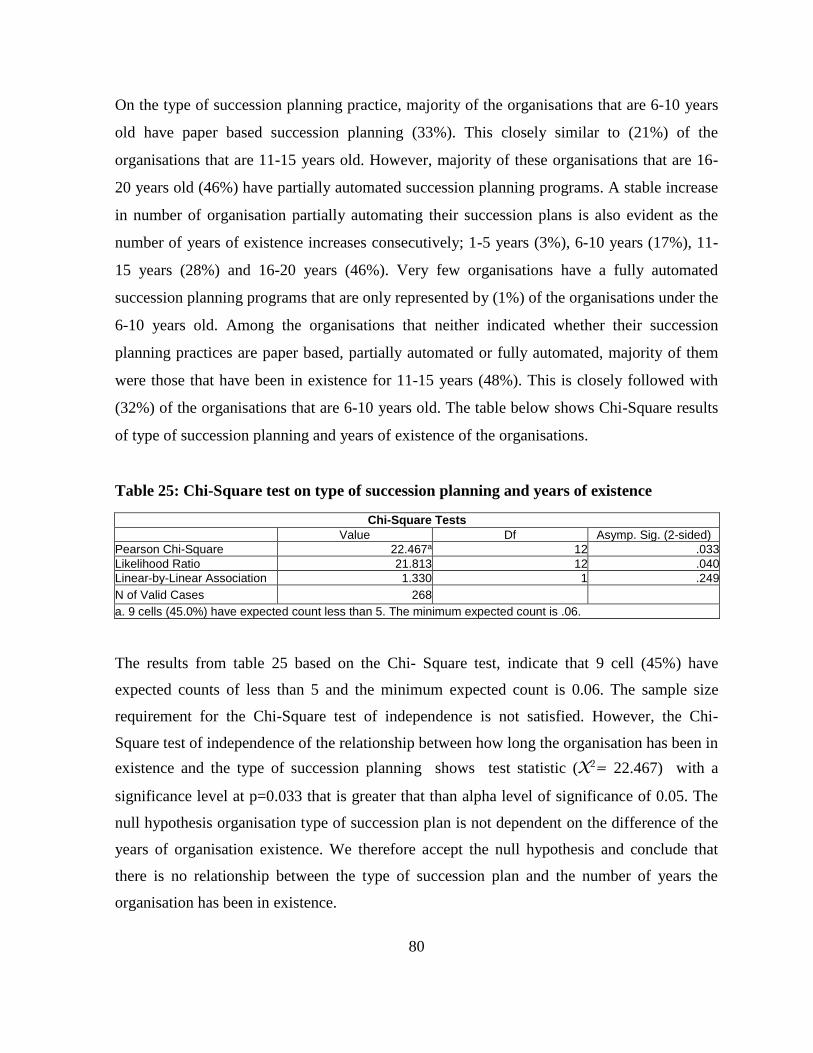
80
On the type of succession planning practice, majority of the organisations that are 6-10 years
old have paper based succession planning (33%). This closely similar to (21%) of the
organisations that are 11-15 years old. However, majority of these organisations that are 16-
20 years old (46%) have partially automated succession planning programs. A stable increase
in number of organisation partially automating their succession plans is also evident as the
number of years of existence increases consecutively; 1-5 years (3%), 6-10 years (17%), 11-
15 years (28%) and 16-20 years (46%). Very few organisations have a fully automated
succession planning programs that are only represented by (1%) of the organisations under the
6-10 years old. Among the organisations that neither indicated whether their succession
planning practices are paper based, partially automated or fully automated, majority of them
were those that have been in existence for 11-15 years (48%). This is closely followed with
(32%) of the organisations that are 6-10 years old. The table below shows Chi-Square results
of type of succession planning and years of existence of the organisations.
Table 25: Chi-Square test on type of succession planning and years of existence
Chi-Square Tests
Value Df Asymp. Sig. (2-sided)
Pearson Chi-Square 22.467a 12 .033
Likelihood Ratio 21.813 12 .040
Linear-by-Linear Association 1.330 1 .249
N of Valid Cases 268 a. 9 cells (45.0%) have expected count less than 5. The minimum expected count is .06.
The results from table 25 based on the Chi- Square test, indicate that 9 cell (45%) have
expected counts of less than 5 and the minimum expected count is 0.06. The sample size
requirement for the Chi-Square test of independence is not satisfied. However, the Chi-
Square test of independence of the relationship between how long the organisation has been in
existence and the type of succession planning shows test statistic (X2= 22.467) with a
significance level at p=0.033 that is greater that than alpha level of significance of 0.05. The
null hypothesis organisation type of succession plan is not dependent on the difference of the
years of organisation existence. We therefore accept the null hypothesis and conclude that
there is no relationship between the type of succession plan and the number of years the
organisation has been in existence.
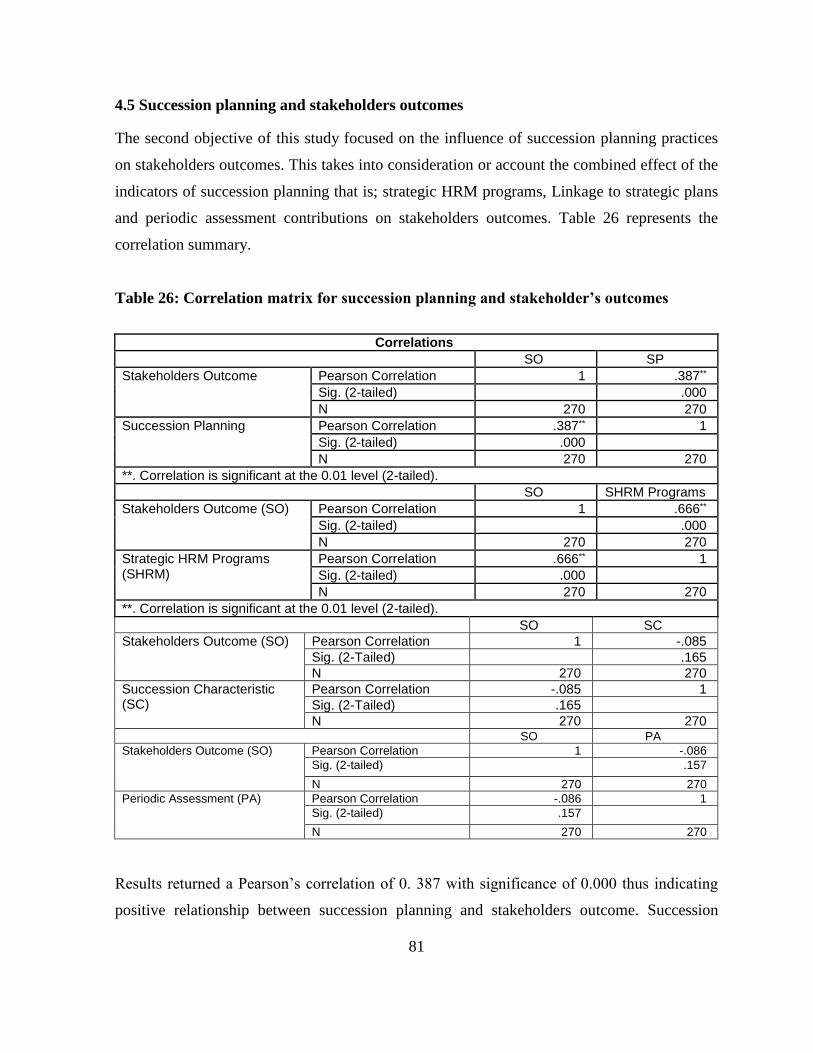
81
4.5 Succession planning and stakeholders outcomes
The second objective of this study focused on the influence of succession planning practices
on stakeholders outcomes. This takes into consideration or account the combined effect of the
indicators of succession planning that is; strategic HRM programs, Linkage to strategic plans
and periodic assessment contributions on stakeholders outcomes. Table 26 represents the
correlation summary.
Table 26: Correlation matrix for succession planning and stakeholder’s outcomes
Correlations
SO SP
Stakeholders Outcome Pearson Correlation 1 .387**
Sig. (2-tailed) .000
N 270 270
Succession Planning Pearson Correlation .387** 1
Sig. (2-tailed) .000
N 270 270
**. Correlation is significant at the 0.01 level (2-tailed).
SO SHRM Programs
Stakeholders Outcome (SO) Pearson Correlation 1 .666**
Sig. (2-tailed) .000
N 270 270
Strategic HRM Programs (SHRM)
Pearson Correlation .666** 1
Sig. (2-tailed) .000
N 270 270
**. Correlation is significant at the 0.01 level (2-tailed).
SO SC
Stakeholders Outcome (SO) Pearson Correlation 1 -.085
Sig. (2-Tailed) .165
N 270 270
Succession Characteristic (SC)
Pearson Correlation -.085 1
Sig. (2-Tailed) .165
N 270 270 SO PA
Stakeholders Outcome (SO) Pearson Correlation 1 -.086
Sig. (2-tailed) .157
N 270 270
Periodic Assessment (PA) Pearson Correlation -.086 1
Sig. (2-tailed) .157 N 270 270
Results returned a Pearson’s correlation of 0. 387 with significance of 0.000 thus indicating
positive relationship between succession planning and stakeholders outcome. Succession
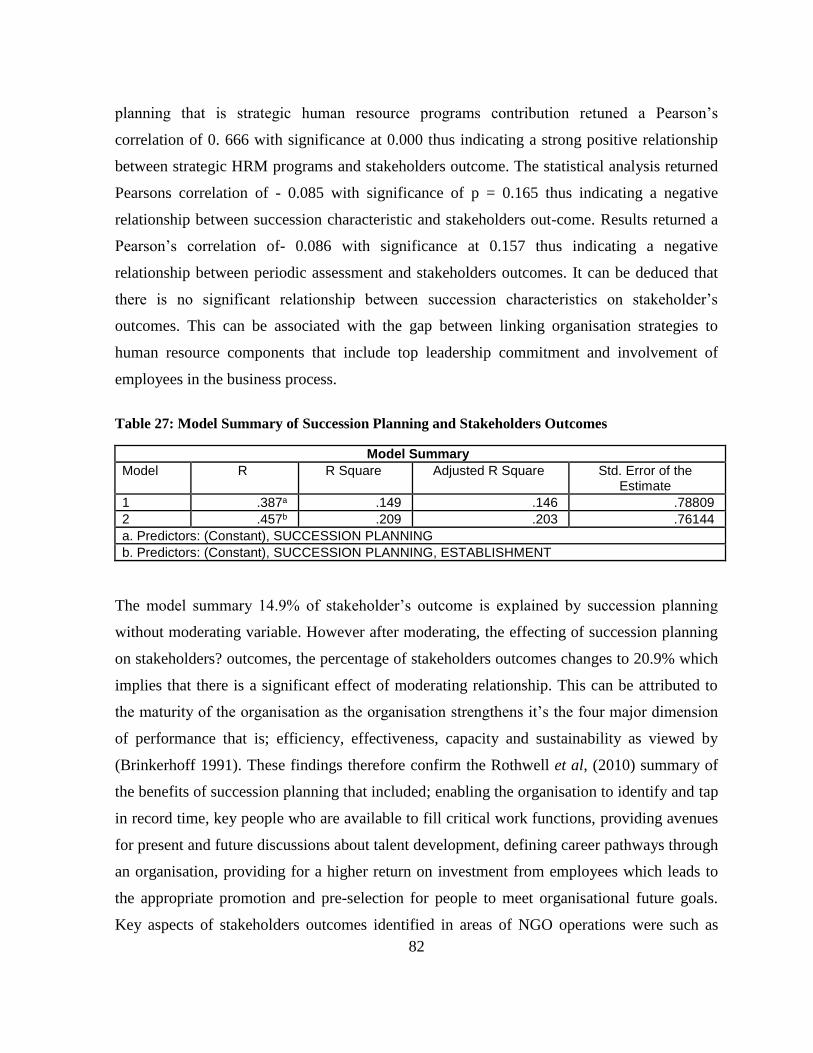
82
planning that is strategic human resource programs contribution retuned a Pearson’s
correlation of 0. 666 with significance at 0.000 thus indicating a strong positive relationship
between strategic HRM programs and stakeholders outcome. The statistical analysis returned
Pearsons correlation of - 0.085 with significance of p = 0.165 thus indicating a negative
relationship between succession characteristic and stakeholders out-come. Results returned a
Pearson’s correlation of- 0.086 with significance at 0.157 thus indicating a negative
relationship between periodic assessment and stakeholders outcomes. It can be deduced that
there is no significant relationship between succession characteristics on stakeholder’s
outcomes. This can be associated with the gap between linking organisation strategies to
human resource components that include top leadership commitment and involvement of
employees in the business process.
Table 27: Model Summary of Succession Planning and Stakeholders Outcomes
Model Summary
Model R R Square Adjusted R Square Std. Error of the Estimate
1 .387a .149 .146 .78809
2 .457b .209 .203 .76144
a. Predictors: (Constant), SUCCESSION PLANNING
b. Predictors: (Constant), SUCCESSION PLANNING, ESTABLISHMENT
The model summary 14.9% of stakeholder’s outcome is explained by succession planning
without moderating variable. However after moderating, the effecting of succession planning
on stakeholders? outcomes, the percentage of stakeholders outcomes changes to 20.9% which
implies that there is a significant effect of moderating relationship. This can be attributed to
the maturity of the organisation as the organisation strengthens it’s the four major dimension
of performance that is; efficiency, effectiveness, capacity and sustainability as viewed by
(Brinkerhoff 1991). These findings therefore confirm the Rothwell et al, (2010) summary of
the benefits of succession planning that included; enabling the organisation to identify and tap
in record time, key people who are available to fill critical work functions, providing avenues
for present and future discussions about talent development, defining career pathways through
an organisation, providing for a higher return on investment from employees which leads to
the appropriate promotion and pre-selection for people to meet organisational future goals.
Key aspects of stakeholders outcomes identified in areas of NGO operations were such as
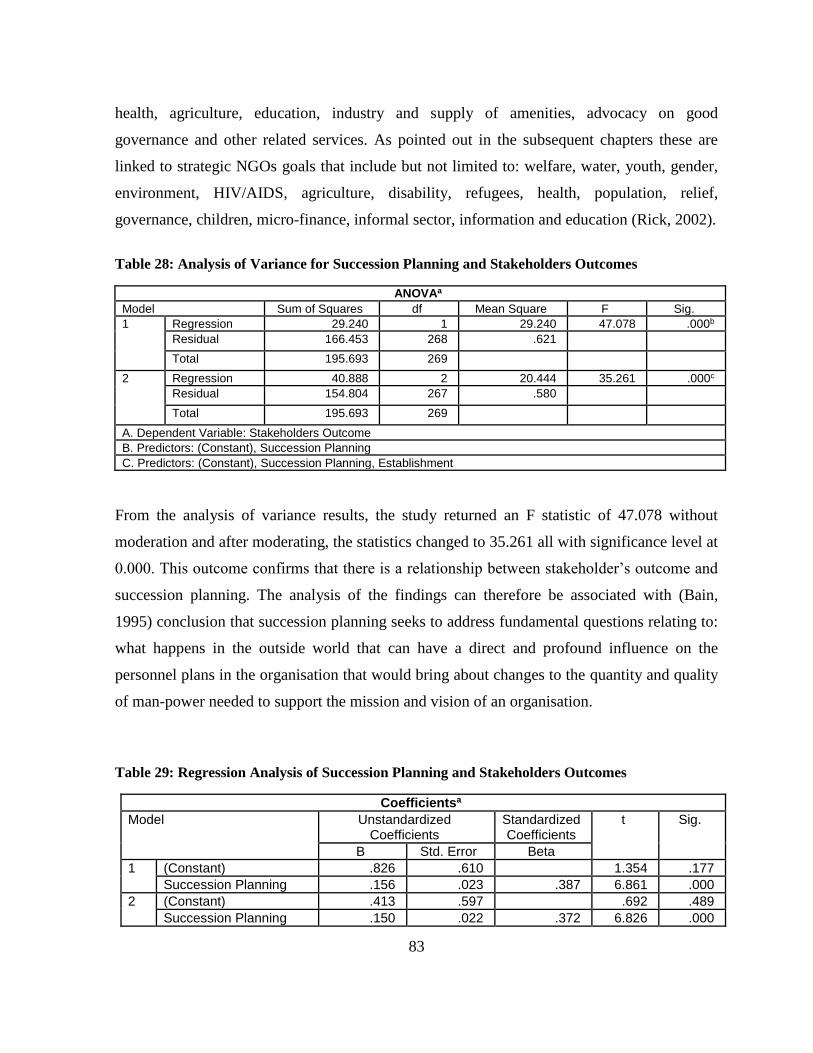
83
health, agriculture, education, industry and supply of amenities, advocacy on good
governance and other related services. As pointed out in the subsequent chapters these are
linked to strategic NGOs goals that include but not limited to: welfare, water, youth, gender,
environment, HIV/AIDS, agriculture, disability, refugees, health, population, relief,
governance, children, micro-finance, informal sector, information and education (Rick, 2002).
Table 28: Analysis of Variance for Succession Planning and Stakeholders Outcomes
ANOVAa
Model Sum of Squares df Mean Square F Sig.
1 Regression 29.240 1 29.240 47.078 .000b
Residual 166.453 268 .621 Total 195.693 269
2 Regression 40.888 2 20.444 35.261 .000c
Residual 154.804 267 .580 Total 195.693 269
A. Dependent Variable: Stakeholders Outcome
B. Predictors: (Constant), Succession Planning
C. Predictors: (Constant), Succession Planning, Establishment
From the analysis of variance results, the study returned an F statistic of 47.078 without
moderation and after moderating, the statistics changed to 35.261 all with significance level at
0.000. This outcome confirms that there is a relationship between stakeholder’s outcome and
succession planning. The analysis of the findings can therefore be associated with (Bain,
1995) conclusion that succession planning seeks to address fundamental questions relating to:
what happens in the outside world that can have a direct and profound influence on the
personnel plans in the organisation that would bring about changes to the quantity and quality
of man-power needed to support the mission and vision of an organisation.
Table 29: Regression Analysis of Succession Planning and Stakeholders Outcomes
Coefficientsa
Model Unstandardized Coefficients
Standardized Coefficients
t Sig.
B Std. Error Beta
1 (Constant) .826 .610 1.354 .177
Succession Planning .156 .023 .387 6.861 .000
2 (Constant) .413 .597 .692 .489
Succession Planning .150 .022 .372 6.826 .000
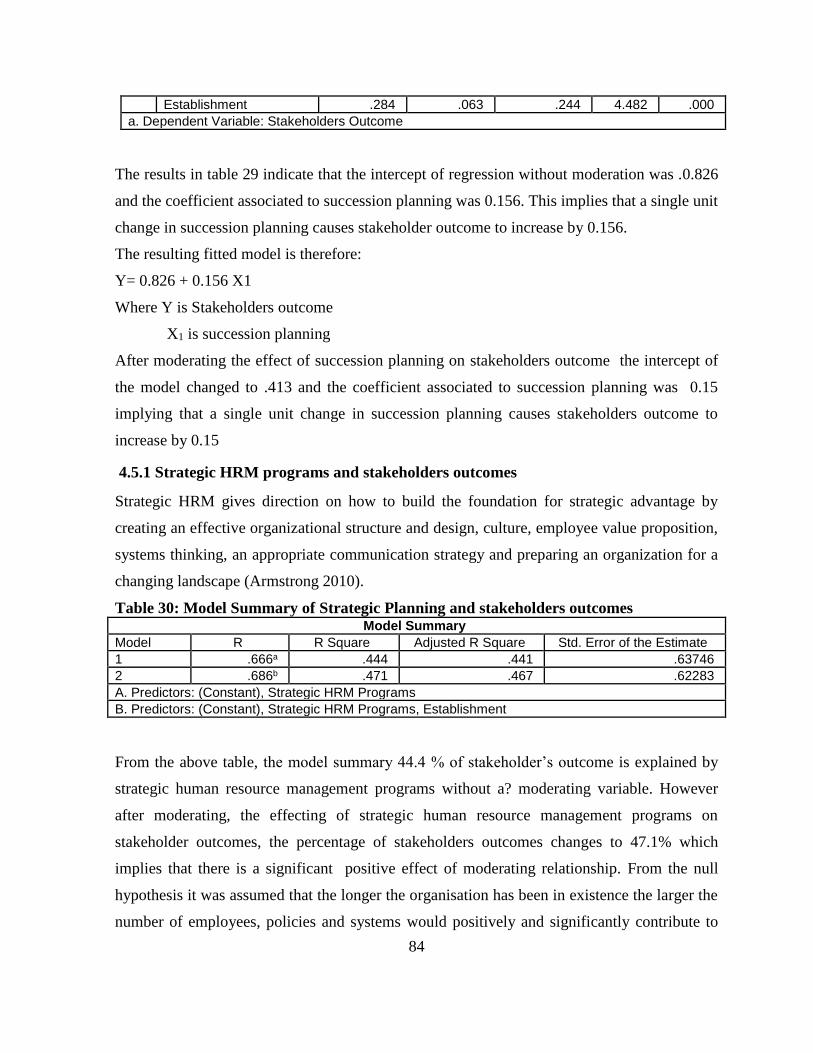
84
Establishment .284 .063 .244 4.482 .000
a. Dependent Variable: Stakeholders Outcome
The results in table 29 indicate that the intercept of regression without moderation was .0.826
and the coefficient associated to succession planning was 0.156. This implies that a single unit
change in succession planning causes stakeholder outcome to increase by 0.156.
The resulting fitted model is therefore:
Y= 0.826 + 0.156 X1
Where Y is Stakeholders outcome
X1 is succession planning
After moderating the effect of succession planning on stakeholders outcome the intercept of
the model changed to .413 and the coefficient associated to succession planning was 0.15
implying that a single unit change in succession planning causes stakeholders outcome to
increase by 0.15
4.5.1 Strategic HRM programs and stakeholders outcomes
Strategic HRM gives direction on how to build the foundation for strategic advantage by
creating an effective organizational structure and design, culture, employee value proposition,
systems thinking, an appropriate communication strategy and preparing an organization for a
changing landscape (Armstrong 2010).
Table 30: Model Summary of Strategic Planning and stakeholders outcomes Model Summary
Model R R Square Adjusted R Square Std. Error of the Estimate
1 .666a .444 .441 .63746
2 .686b .471 .467 .62283
A. Predictors: (Constant), Strategic HRM Programs
B. Predictors: (Constant), Strategic HRM Programs, Establishment
From the above table, the model summary 44.4 % of stakeholder’s outcome is explained by
strategic human resource management programs without a? moderating variable. However
after moderating, the effecting of strategic human resource management programs on
stakeholder outcomes, the percentage of stakeholders outcomes changes to 47.1% which
implies that there is a significant positive effect of moderating relationship. From the null
hypothesis it was assumed that the longer the organisation has been in existence the larger the
number of employees, policies and systems would positively and significantly contribute to

85
the effect of strategic human resource programs on the organisation’s performance. In this
study therefore, the HRM programs were consolidated and explained through the human
resource cycle (an adaptation which is illustrated in the conceptual and theoretical
framework), which consists of generic processes or functions that are performed in all
organisations.(maintain a uniform spelling) These are: employee resourcing and selection that
matches available human resources to jobs; appraisal (performance management); rewards
(the reward system as one of the managerial tools for driving organizational performance);
Training and development that is developing high-quality employees.
Table 31: Analysis of variance on strategic HRM programs and stakeholders outcome ANOVAa
Model Sum of Squares df Mean Square F Sig.
1 Regression 86.790 1 86.790 213.582 .000b
Residual 108.903 268 .406
Total 195.693 269
2 Regression 92.119 2 46.059 118.735 .000c
Residual 103.574 267 .388
Total 195.693 269
A. Dependent Variable: Stakeholders Outcome
B. Predictors: (Constant), Strategic HRM Programs
C. Predictors: (Constant), Strategic HRM Programs, Establishment
From the analysis of variance results, the study returned an F statistic of 213.582 without
moderation and after moderating, the statistics changed to 118.735 all with significance level
at 0.000. This outcome confirms that there is a relationship between strategic HRM programs
and stakeholders outcome. This positive outcomes can be attributed to the fact that HRM is
always considered as central for senior-management-driven strategic activity, which is
developed, owned and delivered by management as a whole to promote the interests of the
organisation that they serve and as such in line with ensuring the delivery of stakeholders
outcomes as championed by (Purcell, Kinnie, Hutchinson, Rayton, and Swart, 2003).
Table 32: Coefficients of strategic HRM programs and stakeholders outcomes Coefficientsa
Model Unstandardized Coefficients Standardized Coefficients
T Sig.
B Std. Error Beta
1 (Constant) 1.586 .237 6.700 .000
STRATEGIC HRM PROGRAMS
.389 .027 .666 14.614 .000
2 (Constant) 1.331 .241 5.515 .000

86
STRATEGIC HRM PROGRAMS
.374 .026 .640 14.202 .000
ESTABLISHMENT .194 .052 .167 3.706 .000
a. Dependent Variable: STAKEHOLDERS OUTCOME
Table 32 shows that the intercept of regression without moderation was 1.586 and the
coefficient associated to strategic HRM programs was 0. 389. This implies that a single unit
change in strategic HRM programs causes stakeholders outcome to increase by 0.389. The
resulting fitted model is therefore:
Y= 1.586 + 0.389 Xb
Where Y is Stakeholders outcome
Xb is strategic HRM programs
After moderating the effect of strategic HRM programs on stakeholders outcome the intercept
of the model changed to 1.331 and the coefficient associated to succession planning was
0.374 implying that a single unit change in succession planning causes stakeholders outcome
to increase by 0.374. From the above analysis it can be deduced that the best fit approach
effective succession planning should emphasize the importance of ensuring that HR strategies
are appropriate to the circumstances of the organization, including its culture, operational
processes and external environment. HR strategies have to take account of the particular
needs of both the organization and its people.
4.5.2 Succession characteristics and stakeholders outcomes
Succession characteristics as the second main future of succession planning included: top
management support, total employee involvement and linkage to strategic plans.
Table 33: Model summary of Succession Characteristics and Stakeholders Outcomes
Model Summary
Model R R Square Adjusted R Square Std. Error of the Estimate
1 .085a .007 .003 .85144
2 .280b .078 .072 .82184
a. Predictors: (Constant), SUCCESSION CHARACTERISTIC
b. Predictors: (Constant), SUCCESSION CHARACTERISTIC, ESTABLISHMENT

87
From the model summary 0.7 % of stakeholder’s outcome is explained by succession
characteristics without moderating variable. However, after moderating effecting of
succession characteristic on stakeholder outcomes, the percentage of stakeholders outcomes
changes to 7.8% which implies that there is minimal effect on the moderated relationship.
These minimal results bring about the felt need to develop a more positive, succession
planning culture, which is more inclusive and linked to the strategies of the organisations.
Other succession planning imperatives associated with changes in the philosophies of the
organization in such areas as gaining commitment, mutuality, communications, involvement,
devolution and teamwork are considered as important components of increasing stakeholder’s
outcomes
Table 34: Analysis of Variance on Succession Characteristics and Stakeholders
Outcomes
ANOVAa
Model Sum of Squares df Mean Square F Sig.
1 Regression 1.405 1 1.405 1.938 .165b
Residual 194.288 268 .725
Total 195.693 269
2 Regression 15.353 2 7.677 11.366 .000c
Residual 180.339 267 .675
Total 195.693 269
a. Dependent Variable: Stakeholders Outcome
b. Predictors: (Constant), Succession Characteristic
c. Predictors: (Constant), Succession Characteristic, Establishment
From the analysis of variance results, the study returned an F statistic of 1.938 without
moderation and after moderating, the statistics changed to 11.366 with significance levels also
changing from 0.165 to 0.000. This outcome confirms that there is a minimal relationship
between stakeholder’s outcome and succession characteristics.
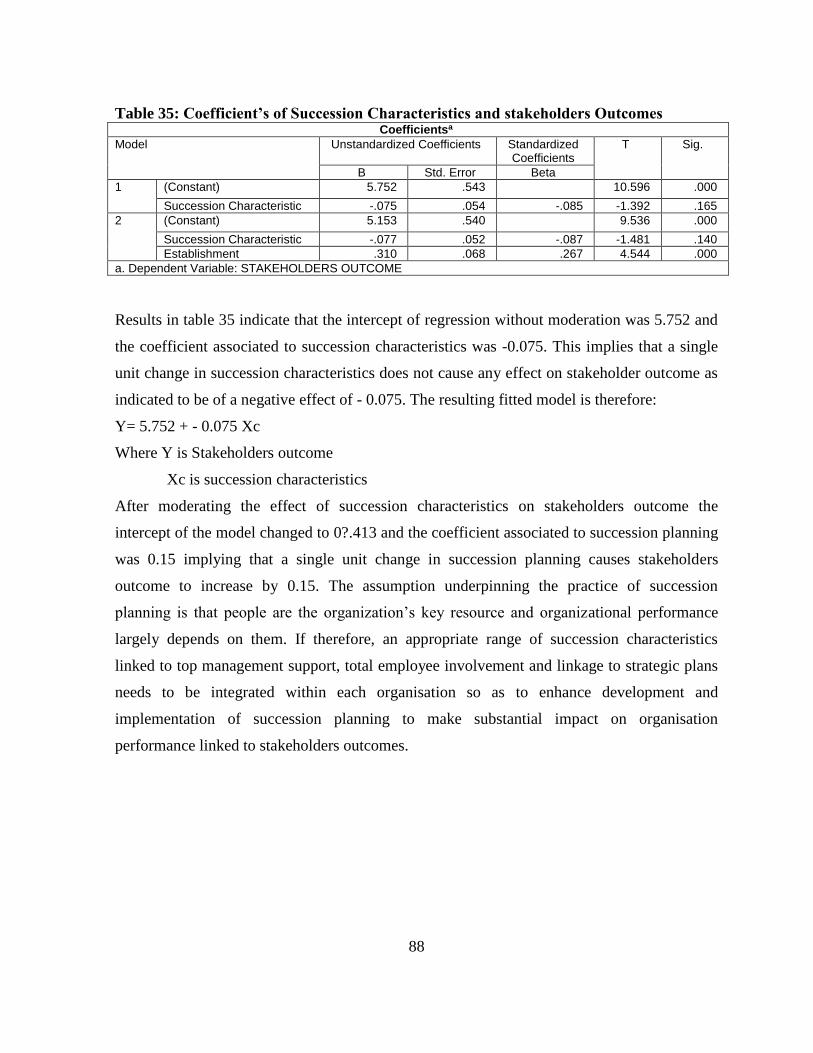
88
Table 35: Coefficient’s of Succession Characteristics and stakeholders Outcomes Coefficientsa
Model Unstandardized Coefficients Standardized Coefficients
T Sig.
B Std. Error Beta
1 (Constant) 5.752 .543 10.596 .000
Succession Characteristic -.075 .054 -.085 -1.392 .165
2 (Constant) 5.153 .540 9.536 .000
Succession Characteristic -.077 .052 -.087 -1.481 .140
Establishment .310 .068 .267 4.544 .000
a. Dependent Variable: STAKEHOLDERS OUTCOME
Results in table 35 indicate that the intercept of regression without moderation was 5.752 and
the coefficient associated to succession characteristics was -0.075. This implies that a single
unit change in succession characteristics does not cause any effect on stakeholder outcome as
indicated to be of a negative effect of - 0.075. The resulting fitted model is therefore:
Y= 5.752 + - 0.075 Xc
Where Y is Stakeholders outcome
Xc is succession characteristics
After moderating the effect of succession characteristics on stakeholders outcome the
intercept of the model changed to 0?.413 and the coefficient associated to succession planning
was 0.15 implying that a single unit change in succession planning causes stakeholders
outcome to increase by 0.15. The assumption underpinning the practice of succession
planning is that people are the organization’s key resource and organizational performance
largely depends on them. If therefore, an appropriate range of succession characteristics
linked to top management support, total employee involvement and linkage to strategic plans
needs to be integrated within each organisation so as to enhance development and
implementation of succession planning to make substantial impact on organisation
performance linked to stakeholders outcomes.
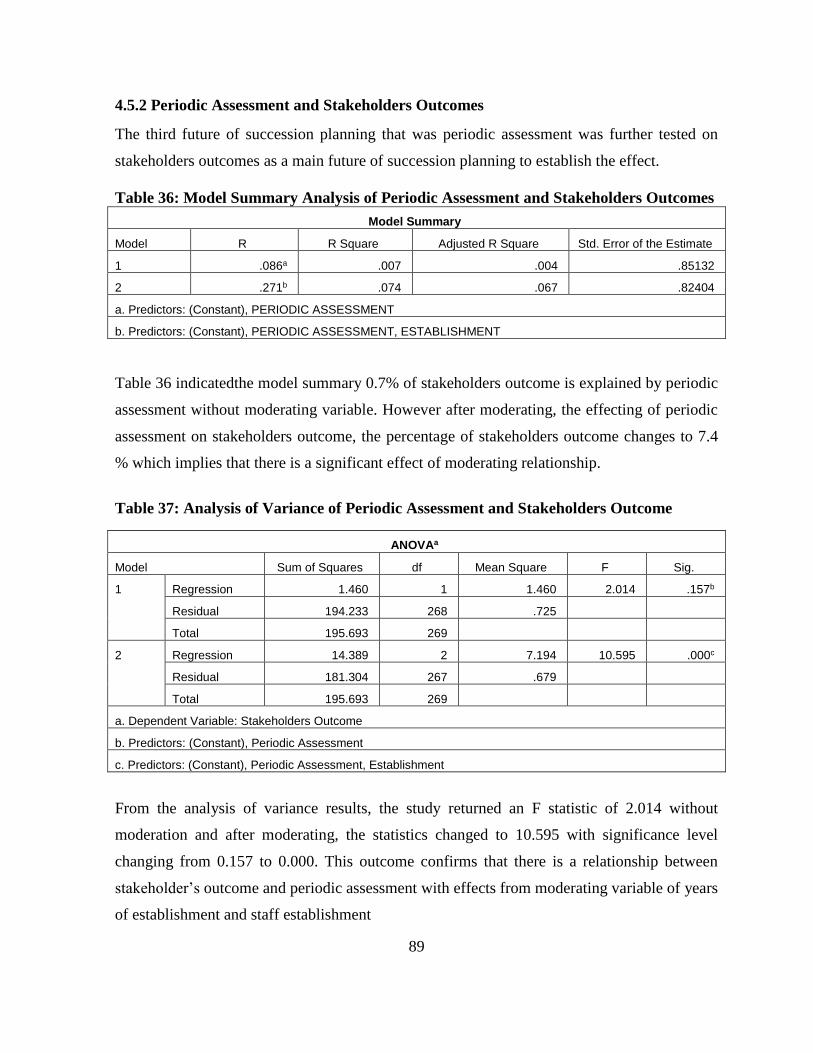
89
4.5.2 Periodic Assessment and Stakeholders Outcomes
The third future of succession planning that was periodic assessment was further tested on
stakeholders outcomes as a main future of succession planning to establish the effect.
Table 36: Model Summary Analysis of Periodic Assessment and Stakeholders Outcomes
Model Summary
Model R R Square Adjusted R Square Std. Error of the Estimate
1 .086a .007 .004 .85132
2 .271b .074 .067 .82404
a. Predictors: (Constant), PERIODIC ASSESSMENT
b. Predictors: (Constant), PERIODIC ASSESSMENT, ESTABLISHMENT
Table 36 indicatedthe model summary 0.7% of stakeholders outcome is explained by periodic
assessment without moderating variable. However after moderating, the effecting of periodic
assessment on stakeholders outcome, the percentage of stakeholders outcome changes to 7.4
% which implies that there is a significant effect of moderating relationship.
Table 37: Analysis of Variance of Periodic Assessment and Stakeholders Outcome
ANOVAa
Model Sum of Squares df Mean Square F Sig.
1 Regression 1.460 1 1.460 2.014 .157b
Residual 194.233 268 .725
Total 195.693 269
2 Regression 14.389 2 7.194 10.595 .000c
Residual 181.304 267 .679
Total 195.693 269
a. Dependent Variable: Stakeholders Outcome
b. Predictors: (Constant), Periodic Assessment
c. Predictors: (Constant), Periodic Assessment, Establishment
From the analysis of variance results, the study returned an F statistic of 2.014 without
moderation and after moderating, the statistics changed to 10.595 with significance level
changing from 0.157 to 0.000. This outcome confirms that there is a relationship between
stakeholder’s outcome and periodic assessment with effects from moderating variable of years
of establishment and staff establishment
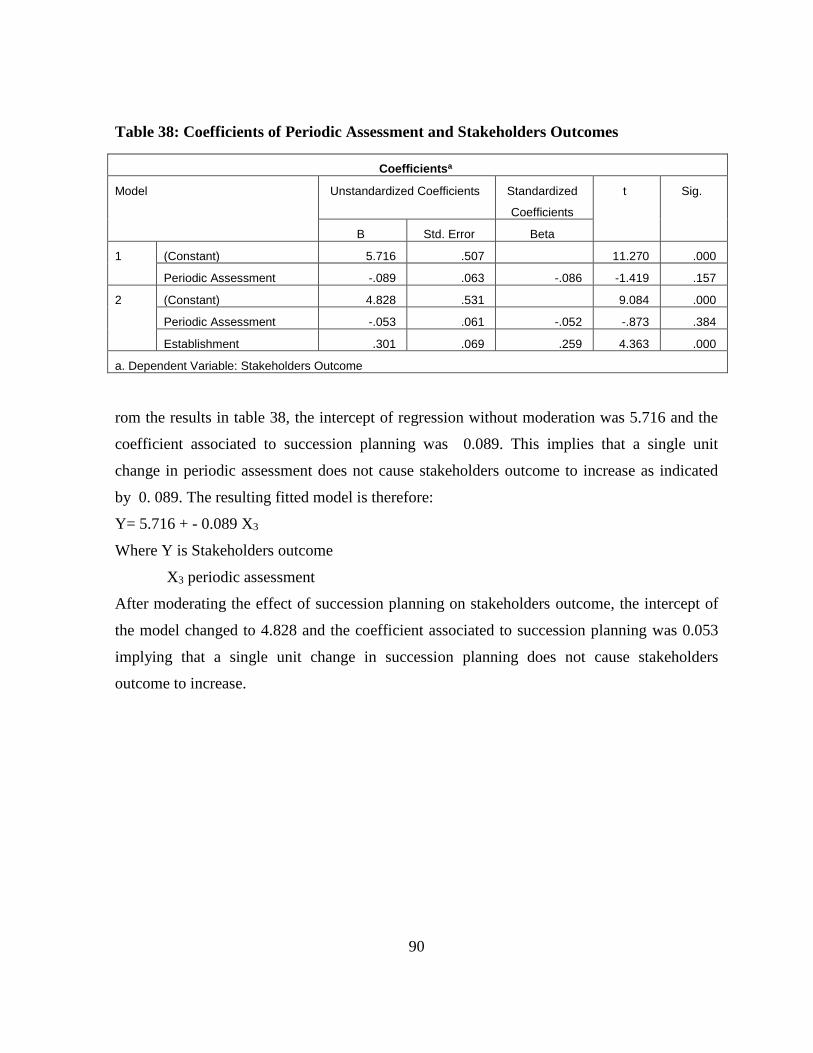
90
Table 38: Coefficients of Periodic Assessment and Stakeholders Outcomes
Coefficientsa
Model Unstandardized Coefficients Standardized
Coefficients
t Sig.
B Std. Error Beta
1 (Constant) 5.716 .507 11.270 .000
Periodic Assessment -.089 .063 -.086 -1.419 .157
2 (Constant) 4.828 .531 9.084 .000
Periodic Assessment -.053 .061 -.052 -.873 .384
Establishment .301 .069 .259 4.363 .000
a. Dependent Variable: Stakeholders Outcome
rom the results in table 38, the intercept of regression without moderation was 5.716 and the
coefficient associated to succession planning was 0.089. This implies that a single unit
change in periodic assessment does not cause stakeholders outcome to increase as indicated
by 0. 089. The resulting fitted model is therefore:
Y= 5.716 + - 0.089 X3
Where Y is Stakeholders outcome
X3 periodic assessment
After moderating the effect of succession planning on stakeholders outcome, the intercept of
the model changed to 4.828 and the coefficient associated to succession planning was 0.053
implying that a single unit change in succession planning does not cause stakeholders
outcome to increase.
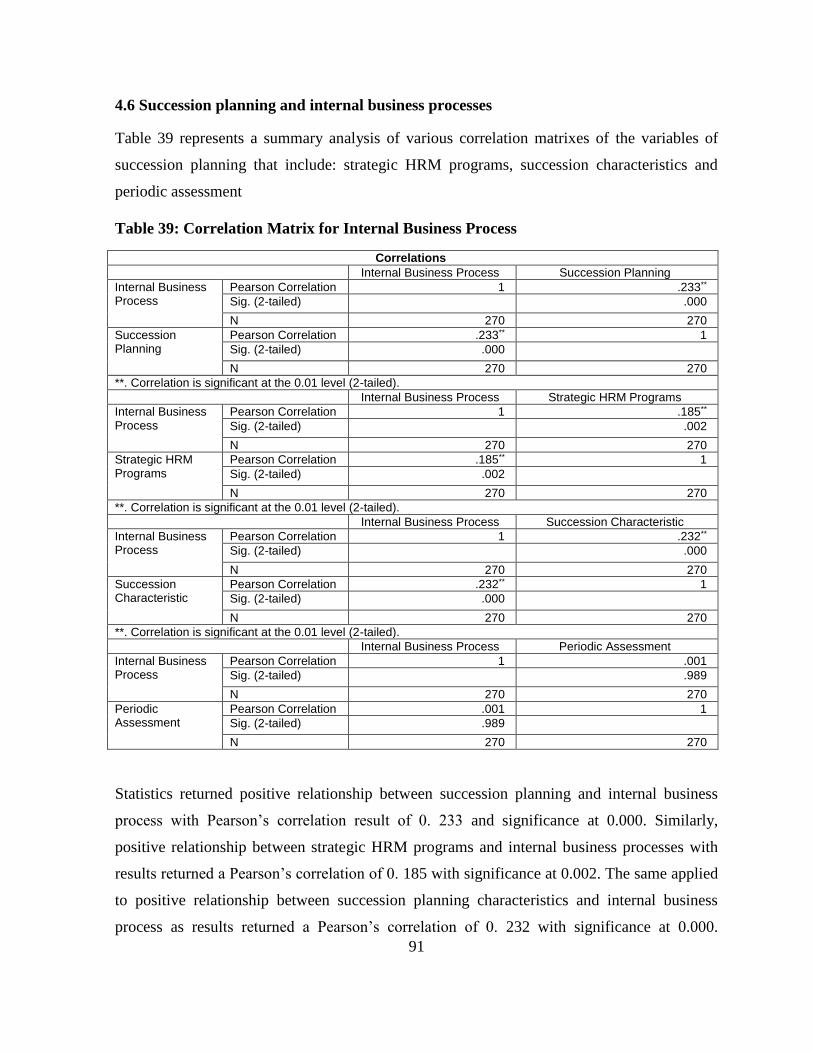
91
4.6 Succession planning and internal business processes
Table 39 represents a summary analysis of various correlation matrixes of the variables of
succession planning that include: strategic HRM programs, succession characteristics and
periodic assessment
Table 39: Correlation Matrix for Internal Business Process
Correlations
Internal Business Process Succession Planning
Internal Business Process
Pearson Correlation 1 .233**
Sig. (2-tailed) .000
N 270 270
Succession Planning
Pearson Correlation .233** 1
Sig. (2-tailed) .000 N 270 270
**. Correlation is significant at the 0.01 level (2-tailed).
Internal Business Process Strategic HRM Programs
Internal Business Process
Pearson Correlation 1 .185**
Sig. (2-tailed) .002
N 270 270
Strategic HRM Programs
Pearson Correlation .185** 1
Sig. (2-tailed) .002 N 270 270
**. Correlation is significant at the 0.01 level (2-tailed).
Internal Business Process Succession Characteristic
Internal Business Process
Pearson Correlation 1 .232**
Sig. (2-tailed) .000
N 270 270
Succession Characteristic
Pearson Correlation .232** 1
Sig. (2-tailed) .000 N 270 270
**. Correlation is significant at the 0.01 level (2-tailed).
Internal Business Process Periodic Assessment
Internal Business Process
Pearson Correlation 1 .001
Sig. (2-tailed) .989
N 270 270
Periodic Assessment
Pearson Correlation .001 1
Sig. (2-tailed) .989 N 270 270
Statistics returned positive relationship between succession planning and internal business
process with Pearson’s correlation result of 0. 233 and significance at 0.000. Similarly,
positive relationship between strategic HRM programs and internal business processes with
results returned a Pearson’s correlation of 0. 185 with significance at 0.002. The same applied
to positive relationship between succession planning characteristics and internal business
process as results returned a Pearson’s correlation of 0. 232 with significance at 0.000.
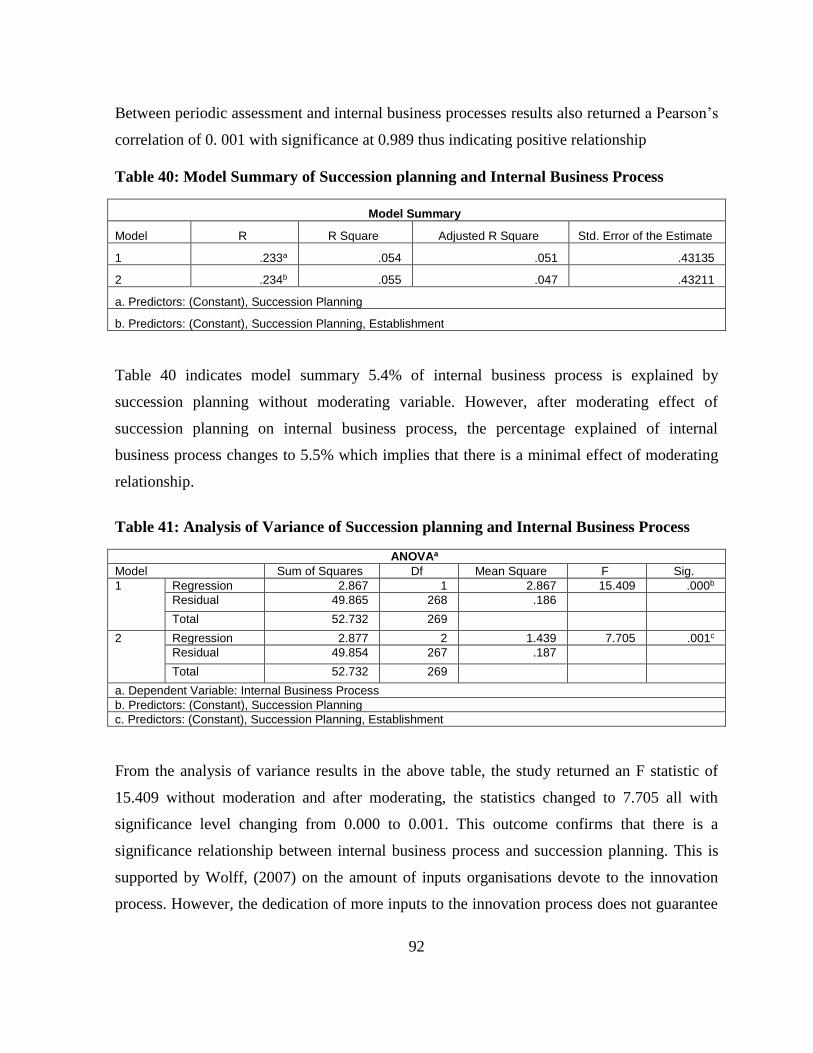
92
Between periodic assessment and internal business processes results also returned a Pearson’s
correlation of 0. 001 with significance at 0.989 thus indicating positive relationship
Table 40: Model Summary of Succession planning and Internal Business Process
Model Summary
Model R R Square Adjusted R Square Std. Error of the Estimate
1 .233a .054 .051 .43135
2 .234b .055 .047 .43211
a. Predictors: (Constant), Succession Planning
b. Predictors: (Constant), Succession Planning, Establishment
Table 40 indicates model summary 5.4% of internal business process is explained by
succession planning without moderating variable. However, after moderating effect of
succession planning on internal business process, the percentage explained of internal
business process changes to 5.5% which implies that there is a minimal effect of moderating
relationship.
Table 41: Analysis of Variance of Succession planning and Internal Business Process
ANOVAa
Model Sum of Squares Df Mean Square F Sig.
1 Regression 2.867 1 2.867 15.409 .000b
Residual 49.865 268 .186 Total 52.732 269
2 Regression 2.877 2 1.439 7.705 .001c
Residual 49.854 267 .187 Total 52.732 269
a. Dependent Variable: Internal Business Process
b. Predictors: (Constant), Succession Planning
c. Predictors: (Constant), Succession Planning, Establishment
From the analysis of variance results in the above table, the study returned an F statistic of
15.409 without moderation and after moderating, the statistics changed to 7.705 all with
significance level changing from 0.000 to 0.001. This outcome confirms that there is a
significance relationship between internal business process and succession planning. This is
supported by Wolff, (2007) on the amount of inputs organisations devote to the innovation
process. However, the dedication of more inputs to the innovation process does not guarantee
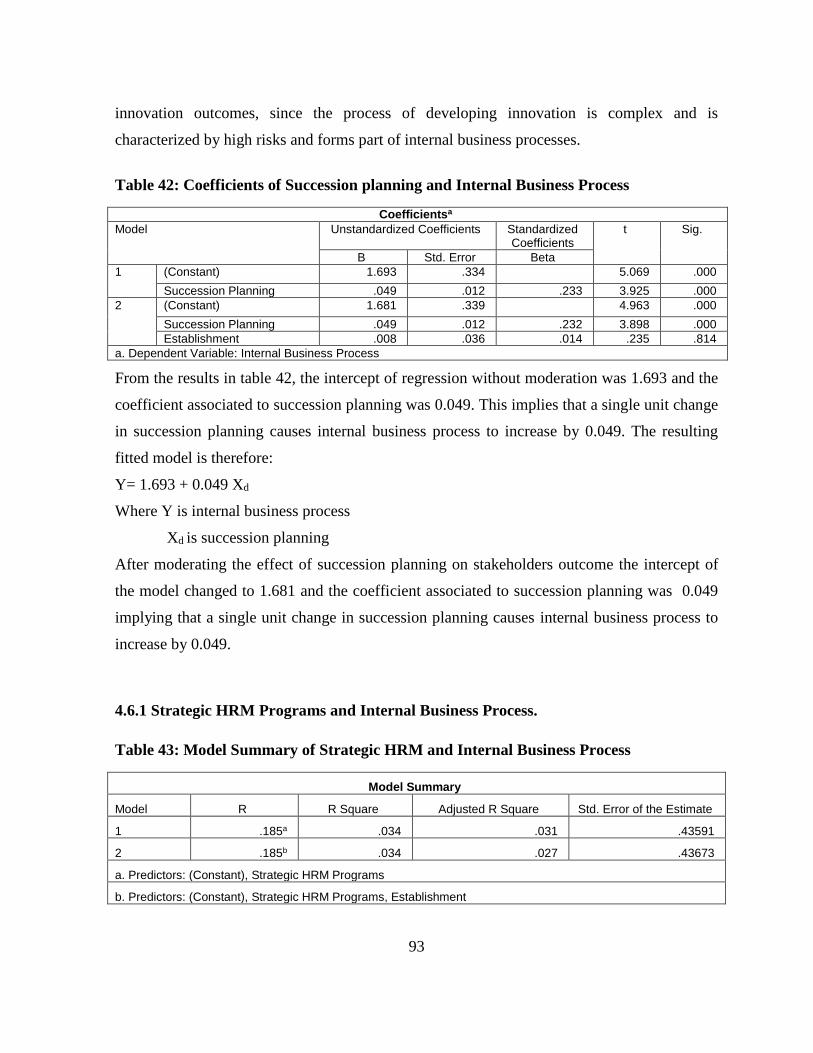
93
innovation outcomes, since the process of developing innovation is complex and is
characterized by high risks and forms part of internal business processes.
Table 42: Coefficients of Succession planning and Internal Business Process
Coefficientsa
Model Unstandardized Coefficients Standardized Coefficients
t Sig.
B Std. Error Beta
1 (Constant) 1.693 .334 5.069 .000
Succession Planning .049 .012 .233 3.925 .000
2 (Constant) 1.681 .339 4.963 .000
Succession Planning .049 .012 .232 3.898 .000
Establishment .008 .036 .014 .235 .814
a. Dependent Variable: Internal Business Process
From the results in table 42, the intercept of regression without moderation was 1.693 and the
coefficient associated to succession planning was 0.049. This implies that a single unit change
in succession planning causes internal business process to increase by 0.049. The resulting
fitted model is therefore:
Y= 1.693 + 0.049 Xd
Where Y is internal business process
Xd is succession planning
After moderating the effect of succession planning on stakeholders outcome the intercept of
the model changed to 1.681 and the coefficient associated to succession planning was 0.049
implying that a single unit change in succession planning causes internal business process to
increase by 0.049.
4.6.1 Strategic HRM Programs and Internal Business Process.
Table 43: Model Summary of Strategic HRM and Internal Business Process
Model Summary
Model R R Square Adjusted R Square Std. Error of the Estimate
1 .185a .034 .031 .43591
2 .185b .034 .027 .43673
a. Predictors: (Constant), Strategic HRM Programs
b. Predictors: (Constant), Strategic HRM Programs, Establishment

94
From the model summary 3.4 % of internal business process is explained by succession
planning without moderating variable. However after moderating, the effecting of strategic
HRM programs on internal business process, the percentage of internal business process does
not change, rather it remained at 3.4 % which implies that there is no effect on moderating
relationship. Despite the fact that this is a minimal percentage, findings did lend strong
support to the argument put forward by Mueller (1996) that the informal organization has a
key role to play in the HRM process such that informal practice and norms of behaviour
interact with formal HR policies support the realization of internal business process.
Table 44: Analysis of Variance: Strategic HRM programs and Internal Business Process
ANOVAa
Model Sum of Squares Df Mean Square F Sig.
1 Regression 1.806 1 1.806 9.504 .002b
Residual 50.926 268 .190
Total 52.732 269
2 Regression 1.806 2 .903 4.734 .010c
Residual 50.926 267 .191
Total 52.732 269
a. Dependent Variable: Internal Business Process
b. Predictors: (Constant), Strategic HRM Programs
c. Predictors: (Constant), Strategic HRM Programs, Establishment
From the analysis of variance results in table 44, the study returned an F statistic of 9.504
without moderation and after moderating, the statistics changed to 4.734 with significance
level also changing from 0.002 to 0.010. This outcome confirms that there is a relationship
between internal business process and strategic HRM. This findings are in support of
(Gratton, 2004) description of an effective organisation as one that achieves its purpose by
meeting the needs of its stakeholders through its business process, matching its resources to
opportunities, adapting flexibly to environmental changes and creating a culture that promotes
commitment, creativity, shared values and mutual trust. The improvement of organizational
effectiveness is an overall objective of strategic HRM, which addresses the organisation-wide
internal process relating to organisational development and transformation, culture
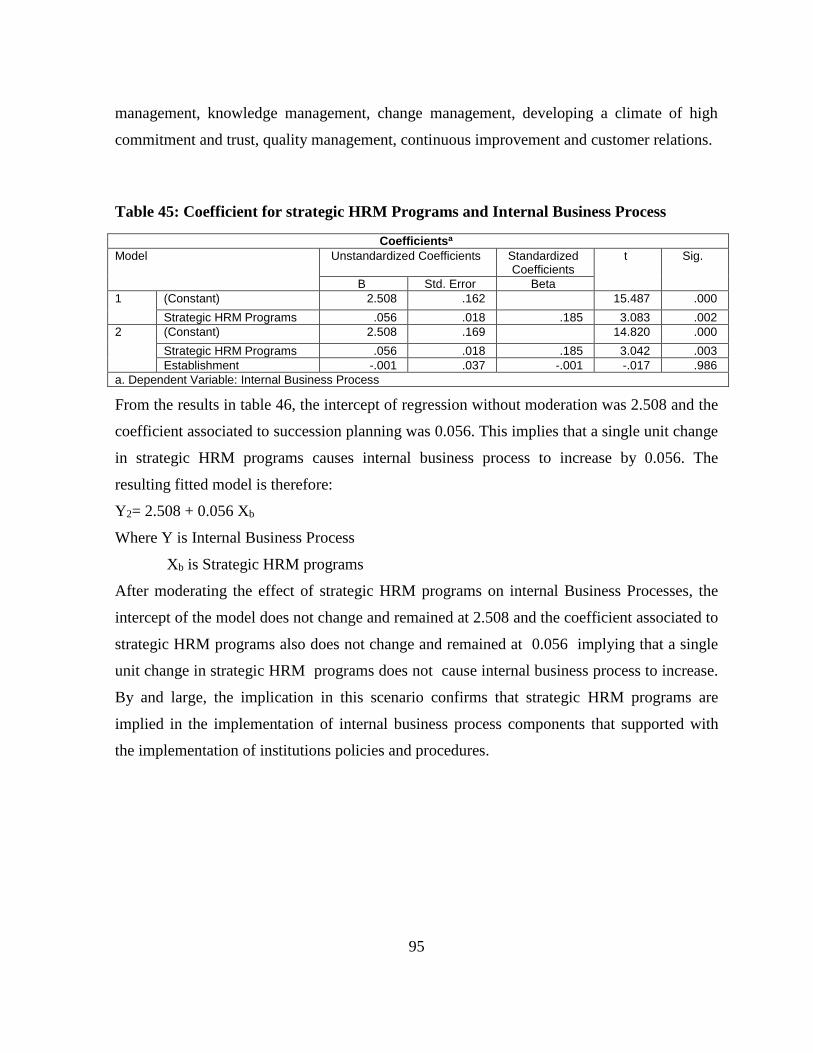
95
management, knowledge management, change management, developing a climate of high
commitment and trust, quality management, continuous improvement and customer relations.
Table 45: Coefficient for strategic HRM Programs and Internal Business Process
Coefficientsa
Model Unstandardized Coefficients Standardized Coefficients
t Sig.
B Std. Error Beta
1 (Constant) 2.508 .162 15.487 .000
Strategic HRM Programs .056 .018 .185 3.083 .002
2 (Constant) 2.508 .169 14.820 .000
Strategic HRM Programs .056 .018 .185 3.042 .003
Establishment -.001 .037 -.001 -.017 .986
a. Dependent Variable: Internal Business Process
From the results in table 46, the intercept of regression without moderation was 2.508 and the
coefficient associated to succession planning was 0.056. This implies that a single unit change
in strategic HRM programs causes internal business process to increase by 0.056. The
resulting fitted model is therefore:
Y2= 2.508 + 0.056 Xb
Where Y is Internal Business Process
Xb is Strategic HRM programs
After moderating the effect of strategic HRM programs on internal Business Processes, the
intercept of the model does not change and remained at 2.508 and the coefficient associated to
strategic HRM programs also does not change and remained at 0.056 implying that a single
unit change in strategic HRM programs does not cause internal business process to increase.
By and large, the implication in this scenario confirms that strategic HRM programs are
implied in the implementation of internal business process components that supported with
the implementation of institutions policies and procedures.
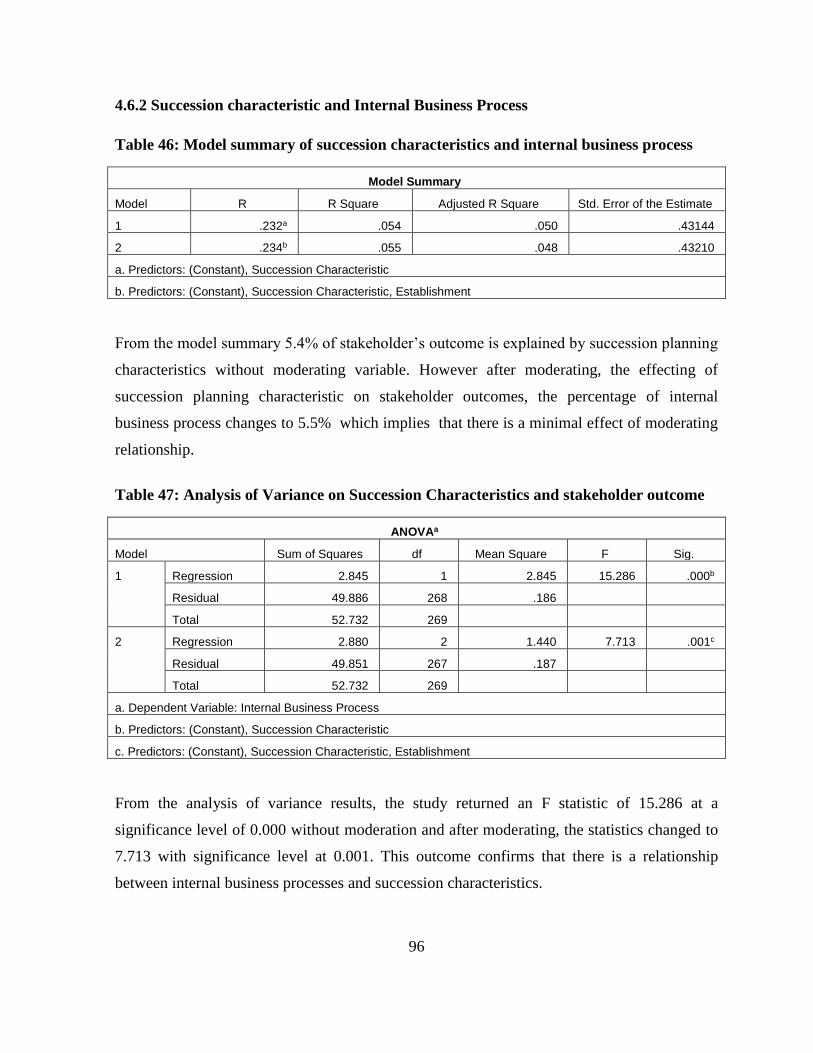
96
4.6.2 Succession characteristic and Internal Business Process
Table 46: Model summary of succession characteristics and internal business process
Model Summary
Model R R Square Adjusted R Square Std. Error of the Estimate
1 .232a .054 .050 .43144
2 .234b .055 .048 .43210
a. Predictors: (Constant), Succession Characteristic
b. Predictors: (Constant), Succession Characteristic, Establishment
From the model summary 5.4% of stakeholder’s outcome is explained by succession planning
characteristics without moderating variable. However after moderating, the effecting of
succession planning characteristic on stakeholder outcomes, the percentage of internal
business process changes to 5.5% which implies that there is a minimal effect of moderating
relationship.
Table 47: Analysis of Variance on Succession Characteristics and stakeholder outcome
ANOVAa
Model Sum of Squares df Mean Square F Sig.
1 Regression 2.845 1 2.845 15.286 .000b
Residual 49.886 268 .186
Total 52.732 269
2 Regression 2.880 2 1.440 7.713 .001c
Residual 49.851 267 .187
Total 52.732 269
a. Dependent Variable: Internal Business Process
b. Predictors: (Constant), Succession Characteristic
c. Predictors: (Constant), Succession Characteristic, Establishment
From the analysis of variance results, the study returned an F statistic of 15.286 at a
significance level of 0.000 without moderation and after moderating, the statistics changed to
7.713 with significance level at 0.001. This outcome confirms that there is a relationship
between internal business processes and succession characteristics.
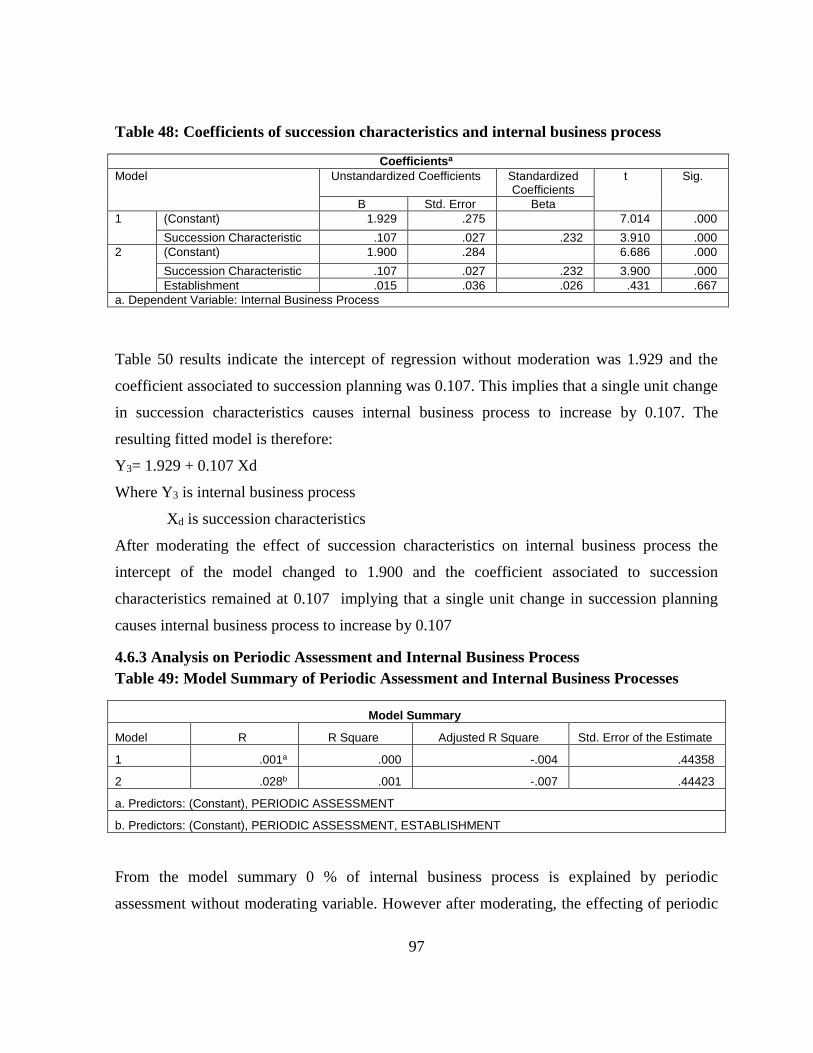
97
Table 48: Coefficients of succession characteristics and internal business process
Coefficientsa
Model Unstandardized Coefficients Standardized Coefficients
t Sig.
B Std. Error Beta
1 (Constant) 1.929 .275 7.014 .000
Succession Characteristic .107 .027 .232 3.910 .000
2 (Constant) 1.900 .284 6.686 .000
Succession Characteristic .107 .027 .232 3.900 .000
Establishment .015 .036 .026 .431 .667
a. Dependent Variable: Internal Business Process
Table 50 results indicate the intercept of regression without moderation was 1.929 and the
coefficient associated to succession planning was 0.107. This implies that a single unit change
in succession characteristics causes internal business process to increase by 0.107. The
resulting fitted model is therefore:
Y3= 1.929 + 0.107 Xd
Where Y3 is internal business process
Xd is succession characteristics
After moderating the effect of succession characteristics on internal business process the
intercept of the model changed to 1.900 and the coefficient associated to succession
characteristics remained at 0.107 implying that a single unit change in succession planning
causes internal business process to increase by 0.107
4.6.3 Analysis on Periodic Assessment and Internal Business Process
Table 49: Model Summary of Periodic Assessment and Internal Business Processes
Model Summary
Model R R Square Adjusted R Square Std. Error of the Estimate
1 .001a .000 -.004 .44358
2 .028b .001 -.007 .44423
a. Predictors: (Constant), PERIODIC ASSESSMENT
b. Predictors: (Constant), PERIODIC ASSESSMENT, ESTABLISHMENT
From the model summary 0 % of internal business process is explained by periodic
assessment without moderating variable. However after moderating, the effecting of periodic
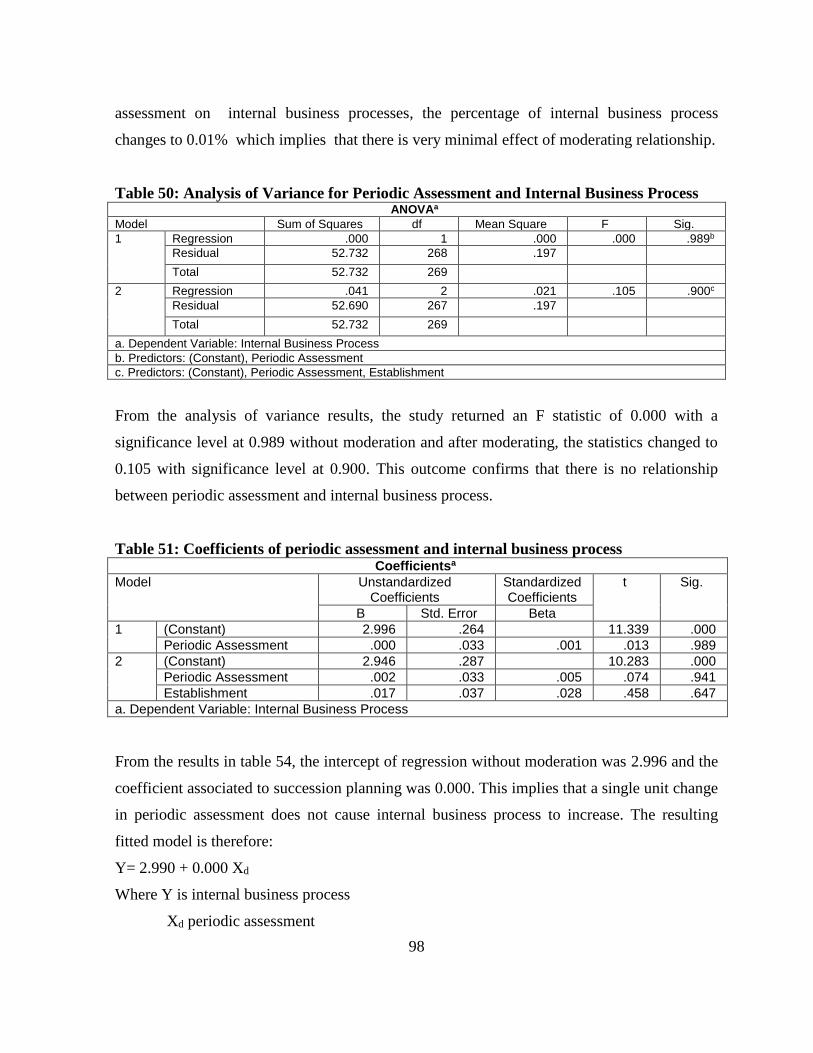
98
assessment on internal business processes, the percentage of internal business process
changes to 0.01% which implies that there is very minimal effect of moderating relationship.
Table 50: Analysis of Variance for Periodic Assessment and Internal Business Process ANOVAa
Model Sum of Squares df Mean Square F Sig.
1 Regression .000 1 .000 .000 .989b
Residual 52.732 268 .197 Total 52.732 269
2 Regression .041 2 .021 .105 .900c
Residual 52.690 267 .197 Total 52.732 269
a. Dependent Variable: Internal Business Process
b. Predictors: (Constant), Periodic Assessment
c. Predictors: (Constant), Periodic Assessment, Establishment
From the analysis of variance results, the study returned an F statistic of 0.000 with a
significance level at 0.989 without moderation and after moderating, the statistics changed to
0.105 with significance level at 0.900. This outcome confirms that there is no relationship
between periodic assessment and internal business process.
Table 51: Coefficients of periodic assessment and internal business process Coefficientsa
Model Unstandardized Coefficients
Standardized Coefficients
t Sig.
B Std. Error Beta
1 (Constant) 2.996 .264 11.339 .000
Periodic Assessment .000 .033 .001 .013 .989
2 (Constant) 2.946 .287 10.283 .000
Periodic Assessment .002 .033 .005 .074 .941
Establishment .017 .037 .028 .458 .647
a. Dependent Variable: Internal Business Process
From the results in table 54, the intercept of regression without moderation was 2.996 and the
coefficient associated to succession planning was 0.000. This implies that a single unit change
in periodic assessment does not cause internal business process to increase. The resulting
fitted model is therefore:
Y= 2.990 + 0.000 Xd
Where Y is internal business process
Xd periodic assessment

99
After moderating the effect of periodic assessment on internal business process the intercept
of the model changed to 2.946 and the coefficient associated to succession planning was
0.002 implying that a single unit change in periodic assessment causes internal business to
increase by 0.002.
4.7 Succession planning and institutional growth
Table 52 represents a summary of correlation matrix of the variables of succession planning
and Institutional growth as a variable of organisation performance
Table 52: Correlation Matrix for Institutional Growth
Correlations
Institutional Growth Succession Planning
Institutional Growth Pearson Correlation 1 .544**
Sig. (2-tailed) .000
N 270 270
Succession Planning Pearson Correlation .544** 1
Sig. (2-tailed) .000 N 270 270
**. Correlation is significant at the 0.01 level (2-tailed).
Institutional Growth Strategic HRM
Programs
Institutional Growth Pearson Correlation 1 -.058
Sig. (2-tailed) .339
N 270 270
Strategic HRM Programs Pearson Correlation -.058 1
Sig. (2-tailed) .339
N 270 270
Institutional Growth Succession Characteristic
Institutional Growth Pearson Correlation 1 .572**
Sig. (2-tailed) .000
N 270 270
Succession Characteristic Pearson Correlation .572** 1
Sig. (2-tailed) .000
N 270 270
**. Correlation is significant at the 0.01 level (2-tailed).
Institutional Growth Periodic Assessment
Institutional Growth Pearson Correlation 1 .830**
Sig. (2-tailed) .000
N 270 270
Periodic Assessment Pearson Correlation .830** 1
Sig. (2-tailed) .000 N 270 270
**. Correlation is significant at the 0.01 level (2-tailed).

100
These Results returned a Pearson’s correlation of 0.544 with significance at 0.000 thus
indicating a positive relationship between succession planning and Institutional growth.
Another positive relationship between succession characteristics and institutional growth was
found as results returned a Pearson’s correlation of 0.572 with significance at 0.000.
However, results returned a Pearson’s correlation of 0.058 with significance at 0.339 thus
indicating a negative relationship between strategic HRM programs and Institutional growth.
Results also returned a Pearson’s correlation of 0.830 with significance at 0.000 thus
indicating positive relationship between periodic assessment and institutional growth.
Table 53: Model Summary of Succession Planning and Institutional Growth
Model Summary
Model R R Square Adjusted R Square Std. Error of the Estimate
1 .544a .296 .293 .60491
2 .545b .297 .291 .60557
a. Predictors: (Constant), Succession Planning
b. Predictors: (Constant), Succession Planning, Establishment
From the model summary 29.6 of Institutional growth is explained by succession planning
without moderating variable. However after moderating, the effecting of succession planning
on Institutional Growth, the percentage of institutional growth explained changes to 29.7%
which implies that there is a slight effect of moderating relationship.
Table 54: Analysis of Variance for Succession Planning and Institutional Growth
ANOVAa
Model Sum of Squares df Mean Square F Sig.
1 Regression 41.148 1 41.148 112.453 .000b
Residual 98.065 268 .366
Total 139.214 269
2 Regression 41.301 2 20.650 56.312 .000c
Residual 97.913 267 .367
Total 139.214 269
a. Dependent Variable: INSTITUTIONAL GROWTH
b. Predictors: (Constant), SUCCESSION PLANNING
c. Predictors: (Constant), SUCCESSION PLANNING, ESTABLISHMENT

101
From the analysis of variance results, the study returned an F statistic of 112.453 without
moderation and after moderating, the statistics changed to 56.312 all with significance level at
0.000. This outcome confirms that there is a relationship between institutional growth and
succession planning.
Table 55: The Coefficients of Succession Planning and Institutional Growth
Coefficientsa
Model Unstandardized Coefficients Standardized
Coefficients
t Sig.
B Std. Error Beta
1 (Constant) -.952 .468 -2.032 .043
Succession Planning .185 .017 .544 10.604 .000
2 (Constant) -.904 .475 -1.906 .058
Succession Planning .185 .017 .546 10.612 .000
Establishment -.032 .050 -.033 -.645 .520
a. Dependent Variable: Institutional Growth
From the results in table 55, the intercept of regression without moderation was 0.952 and the
coefficient associated to succession planning was 0.185. This implies that a single unit change
in succession planning causes institutional growth to increase by 0.185. The resulting fitted
model is therefore:
Y3= -0.952 + 0.185X
Where Y3 is Institutional growth
X is succession planning
After moderating the effect of succession planning on institutional growth, the intercept of the
model changed to 0.904 and the coefficient associated to succession planning was 0.185
implying that a single unit change in succession planning causes institutional growth to
increase by 0.185.
4.7.1 Analysis on Strategic HRM Programs and Institutional Growth.
Table 56: Model Summary of Strategic HRM programs and Institutional Growth
Model Summary
Model R R Square Adjusted R Square Std. Error of the Estimate
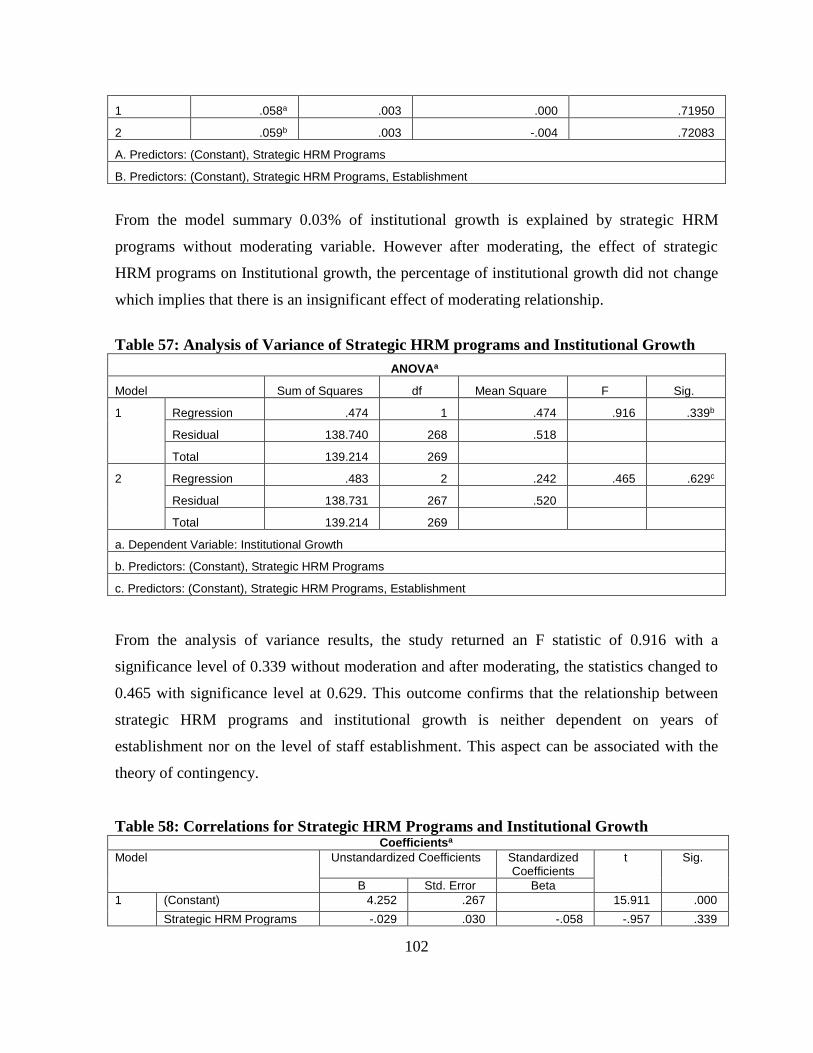
102
1 .058a .003 .000 .71950
2 .059b .003 -.004 .72083
A. Predictors: (Constant), Strategic HRM Programs
B. Predictors: (Constant), Strategic HRM Programs, Establishment
From the model summary 0.03% of institutional growth is explained by strategic HRM
programs without moderating variable. However after moderating, the effect of strategic
HRM programs on Institutional growth, the percentage of institutional growth did not change
which implies that there is an insignificant effect of moderating relationship.
Table 57: Analysis of Variance of Strategic HRM programs and Institutional Growth
ANOVAa
Model Sum of Squares df Mean Square F Sig.
1 Regression .474 1 .474 .916 .339b
Residual 138.740 268 .518
Total 139.214 269
2 Regression .483 2 .242 .465 .629c
Residual 138.731 267 .520
Total 139.214 269
a. Dependent Variable: Institutional Growth
b. Predictors: (Constant), Strategic HRM Programs
c. Predictors: (Constant), Strategic HRM Programs, Establishment
From the analysis of variance results, the study returned an F statistic of 0.916 with a
significance level of 0.339 without moderation and after moderating, the statistics changed to
0.465 with significance level at 0.629. This outcome confirms that the relationship between
strategic HRM programs and institutional growth is neither dependent on years of
establishment nor on the level of staff establishment. This aspect can be associated with the
theory of contingency.
Table 58: Correlations for Strategic HRM Programs and Institutional Growth Coefficientsa
Model Unstandardized Coefficients Standardized Coefficients
t Sig.
B Std. Error Beta
1 (Constant) 4.252 .267 15.911 .000
Strategic HRM Programs -.029 .030 -.058 -.957 .339
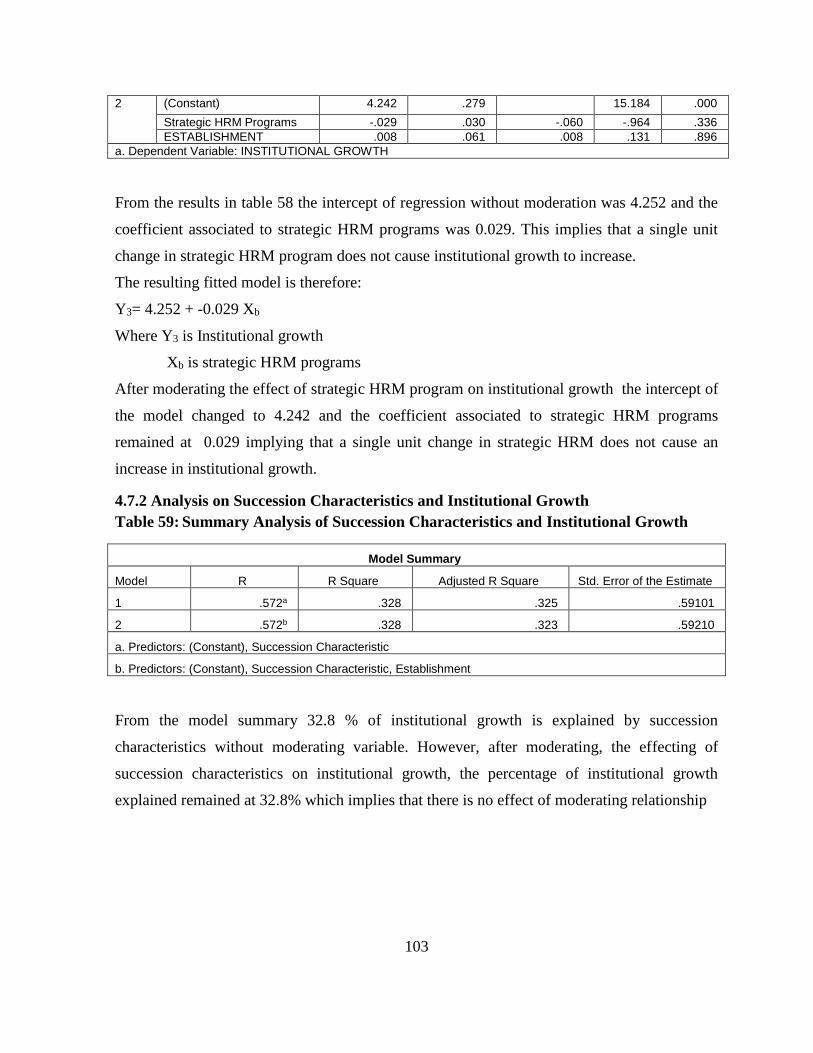
103
2 (Constant) 4.242 .279 15.184 .000
Strategic HRM Programs -.029 .030 -.060 -.964 .336
ESTABLISHMENT .008 .061 .008 .131 .896
a. Dependent Variable: INSTITUTIONAL GROWTH
From the results in table 58 the intercept of regression without moderation was 4.252 and the
coefficient associated to strategic HRM programs was 0.029. This implies that a single unit
change in strategic HRM program does not cause institutional growth to increase.
The resulting fitted model is therefore:
Y3= 4.252 + -0.029 Xb
Where Y3 is Institutional growth
Xb is strategic HRM programs
After moderating the effect of strategic HRM program on institutional growth the intercept of
the model changed to 4.242 and the coefficient associated to strategic HRM programs
remained at 0.029 implying that a single unit change in strategic HRM does not cause an
increase in institutional growth.
4.7.2 Analysis on Succession Characteristics and Institutional Growth
Table 59: Summary Analysis of Succession Characteristics and Institutional Growth
Model Summary
Model R R Square Adjusted R Square Std. Error of the Estimate
1 .572a .328 .325 .59101
2 .572b .328 .323 .59210
a. Predictors: (Constant), Succession Characteristic
b. Predictors: (Constant), Succession Characteristic, Establishment
From the model summary 32.8 % of institutional growth is explained by succession
characteristics without moderating variable. However, after moderating, the effecting of
succession characteristics on institutional growth, the percentage of institutional growth
explained remained at 32.8% which implies that there is no effect of moderating relationship
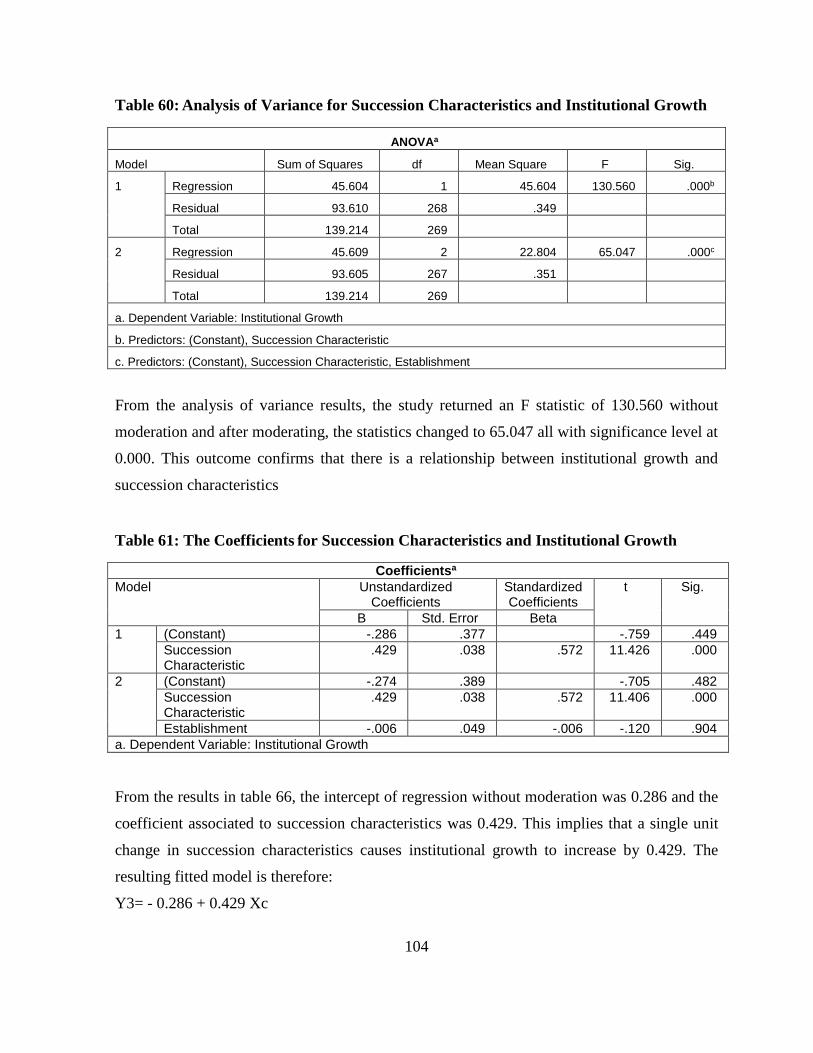
104
Table 60: Analysis of Variance for Succession Characteristics and Institutional Growth
ANOVAa
Model Sum of Squares df Mean Square F Sig.
1 Regression 45.604 1 45.604 130.560 .000b
Residual 93.610 268 .349
Total 139.214 269
2 Regression 45.609 2 22.804 65.047 .000c
Residual 93.605 267 .351
Total 139.214 269
a. Dependent Variable: Institutional Growth
b. Predictors: (Constant), Succession Characteristic
c. Predictors: (Constant), Succession Characteristic, Establishment
From the analysis of variance results, the study returned an F statistic of 130.560 without
moderation and after moderating, the statistics changed to 65.047 all with significance level at
0.000. This outcome confirms that there is a relationship between institutional growth and
succession characteristics
Table 61: The Coefficients for Succession Characteristics and Institutional Growth
Coefficientsa
Model Unstandardized Coefficients
Standardized Coefficients
t Sig.
B Std. Error Beta
1 (Constant) -.286 .377 -.759 .449
Succession Characteristic
.429 .038 .572 11.426 .000
2 (Constant) -.274 .389 -.705 .482
Succession Characteristic
.429 .038 .572 11.406 .000
Establishment -.006 .049 -.006 -.120 .904
a. Dependent Variable: Institutional Growth
From the results in table 66, the intercept of regression without moderation was 0.286 and the
coefficient associated to succession characteristics was 0.429. This implies that a single unit
change in succession characteristics causes institutional growth to increase by 0.429. The
resulting fitted model is therefore:
Y3= - 0.286 + 0.429 Xc
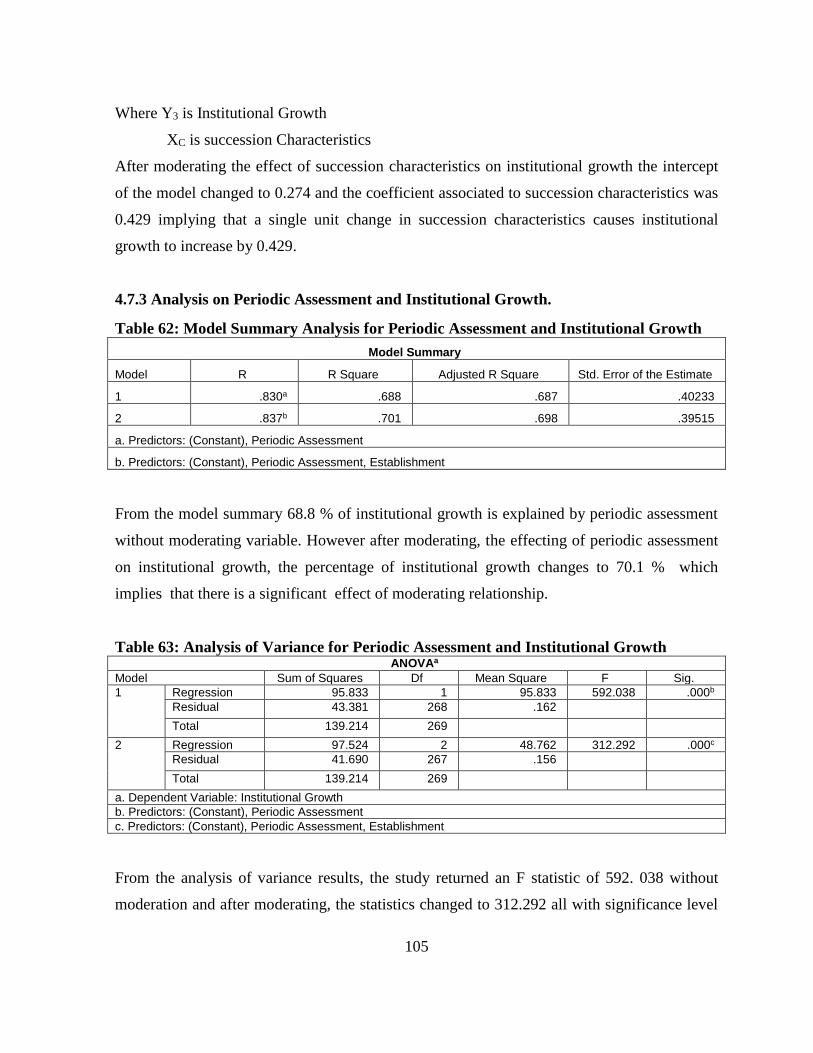
105
Where Y3 is Institutional Growth
XC is succession Characteristics
After moderating the effect of succession characteristics on institutional growth the intercept
of the model changed to 0.274 and the coefficient associated to succession characteristics was
0.429 implying that a single unit change in succession characteristics causes institutional
growth to increase by 0.429.
4.7.3 Analysis on Periodic Assessment and Institutional Growth.
Table 62: Model Summary Analysis for Periodic Assessment and Institutional Growth
Model Summary
Model R R Square Adjusted R Square Std. Error of the Estimate
1 .830a .688 .687 .40233
2 .837b .701 .698 .39515
a. Predictors: (Constant), Periodic Assessment
b. Predictors: (Constant), Periodic Assessment, Establishment
From the model summary 68.8 % of institutional growth is explained by periodic assessment
without moderating variable. However after moderating, the effecting of periodic assessment
on institutional growth, the percentage of institutional growth changes to 70.1 % which
implies that there is a significant effect of moderating relationship.
Table 63: Analysis of Variance for Periodic Assessment and Institutional Growth ANOVAa
Model Sum of Squares Df Mean Square F Sig.
1 Regression 95.833 1 95.833 592.038 .000b
Residual 43.381 268 .162 Total 139.214 269
2 Regression 97.524 2 48.762 312.292 .000c
Residual 41.690 267 .156 Total 139.214 269
a. Dependent Variable: Institutional Growth
b. Predictors: (Constant), Periodic Assessment
c. Predictors: (Constant), Periodic Assessment, Establishment
From the analysis of variance results, the study returned an F statistic of 592. 038 without
moderation and after moderating, the statistics changed to 312.292 all with significance level
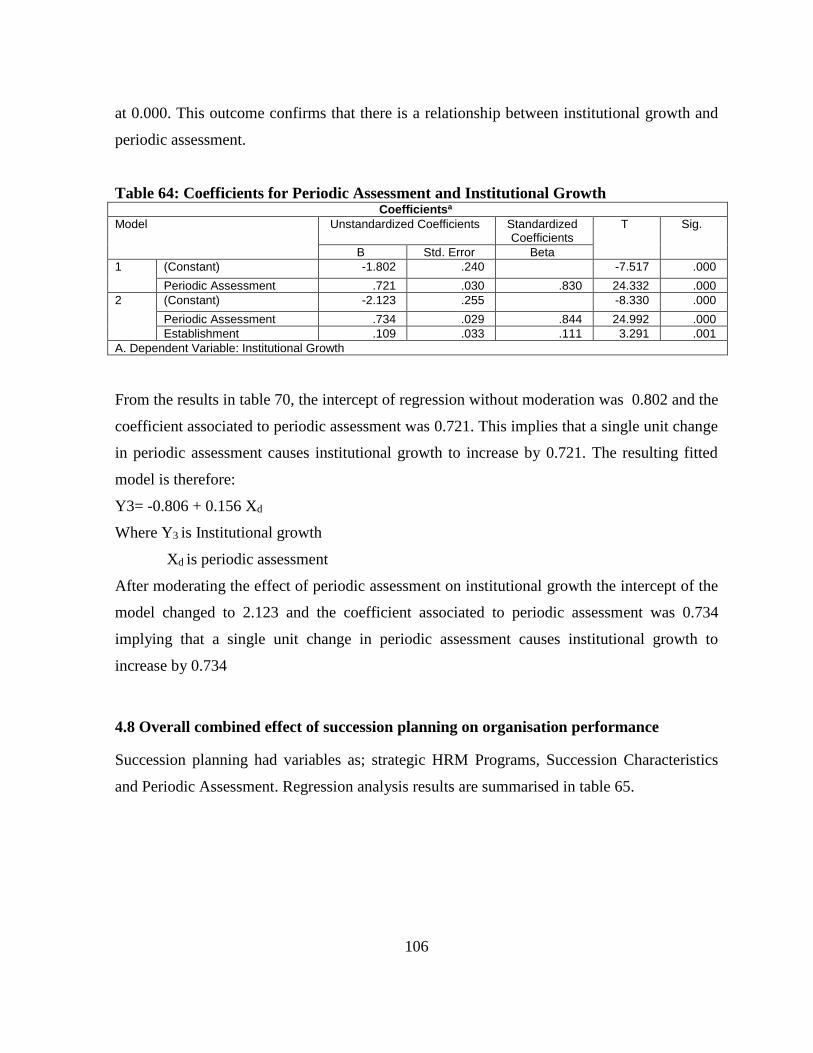
106
at 0.000. This outcome confirms that there is a relationship between institutional growth and
periodic assessment.
Table 64: Coefficients for Periodic Assessment and Institutional Growth Coefficientsa
Model Unstandardized Coefficients Standardized Coefficients
T Sig.
B Std. Error Beta
1 (Constant) -1.802 .240 -7.517 .000
Periodic Assessment .721 .030 .830 24.332 .000
2 (Constant) -2.123 .255 -8.330 .000
Periodic Assessment .734 .029 .844 24.992 .000
Establishment .109 .033 .111 3.291 .001
A. Dependent Variable: Institutional Growth
From the results in table 70, the intercept of regression without moderation was 0.802 and the
coefficient associated to periodic assessment was 0.721. This implies that a single unit change
in periodic assessment causes institutional growth to increase by 0.721. The resulting fitted
model is therefore:
Y3= -0.806 + 0.156 Xd
Where Y3 is Institutional growth
Xd is periodic assessment
After moderating the effect of periodic assessment on institutional growth the intercept of the
model changed to 2.123 and the coefficient associated to periodic assessment was 0.734
implying that a single unit change in periodic assessment causes institutional growth to
increase by 0.734
4.8 Overall combined effect of succession planning on organisation performance
Succession planning had variables as; strategic HRM Programs, Succession Characteristics
and Periodic Assessment. Regression analysis results are summarised in table 65.
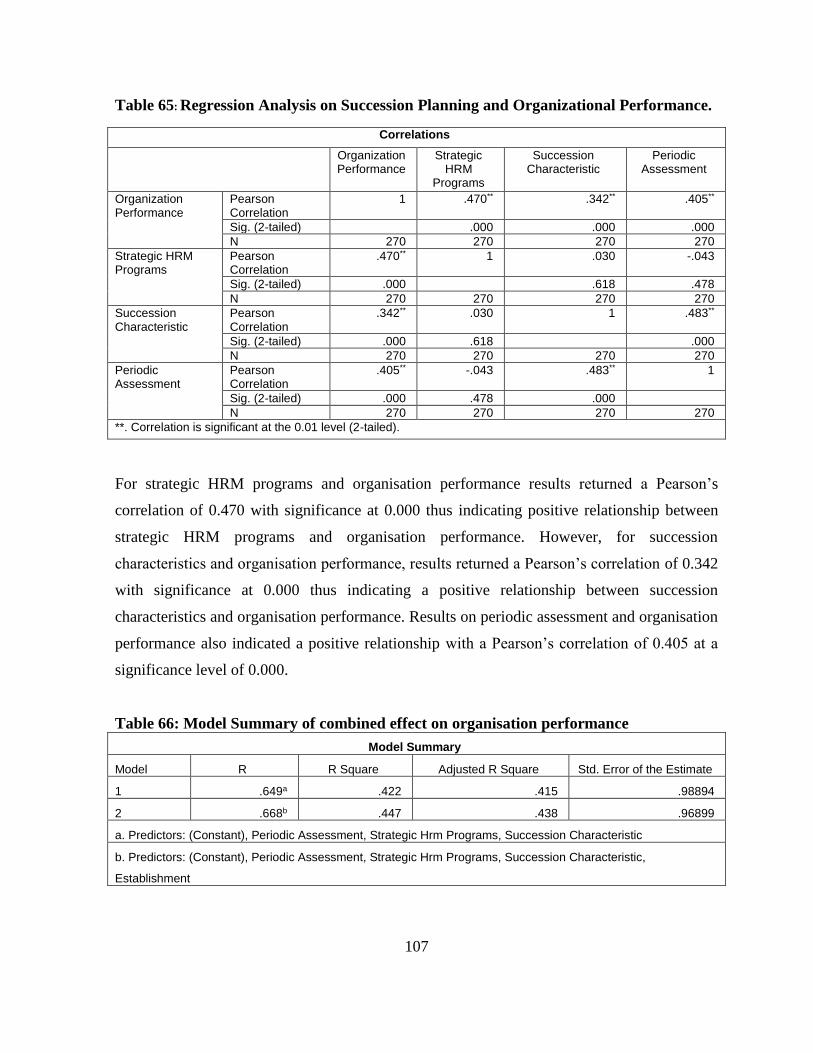
107
Table 65: Regression Analysis on Succession Planning and Organizational Performance.
Correlations
Organization Performance
Strategic HRM
Programs
Succession Characteristic
Periodic Assessment
Organization Performance
Pearson Correlation
1 .470** .342** .405**
Sig. (2-tailed) .000 .000 .000
N 270 270 270 270
Strategic HRM Programs
Pearson Correlation
.470** 1 .030 -.043
Sig. (2-tailed) .000 .618 .478
N 270 270 270 270
Succession Characteristic
Pearson Correlation
.342** .030 1 .483**
Sig. (2-tailed) .000 .618 .000
N 270 270 270 270
Periodic Assessment
Pearson Correlation
.405** -.043 .483** 1
Sig. (2-tailed) .000 .478 .000
N 270 270 270 270
**. Correlation is significant at the 0.01 level (2-tailed).
For strategic HRM programs and organisation performance results returned a Pearson’s
correlation of 0.470 with significance at 0.000 thus indicating positive relationship between
strategic HRM programs and organisation performance. However, for succession
characteristics and organisation performance, results returned a Pearson’s correlation of 0.342
with significance at 0.000 thus indicating a positive relationship between succession
characteristics and organisation performance. Results on periodic assessment and organisation
performance also indicated a positive relationship with a Pearson’s correlation of 0.405 at a
significance level of 0.000.
Table 66: Model Summary of combined effect on organisation performance
Model Summary
Model R R Square Adjusted R Square Std. Error of the Estimate
1 .649a .422 .415 .98894
2 .668b .447 .438 .96899
a. Predictors: (Constant), Periodic Assessment, Strategic Hrm Programs, Succession Characteristic
b. Predictors: (Constant), Periodic Assessment, Strategic Hrm Programs, Succession Characteristic,
Establishment

108
From the model summary 42.2% of organisation performance is explained by the combined
effect of strategic HRM, succession characteristics and periodic assessment without
moderating variable. However after moderating, the combined effect of strategic HRM,
succession characteristics and periodic assessment that is succession planning on organisation
performance changes to 44.7% which implies that there is a significant effect of moderating
relationship.
Table 67: Analysis of Variance on the combined effect of succession planning
ANOVAa
Model Sum of Squares Df Mean Square F Sig.
1 Regression 189.602 3 63.201 64.622 .000b
Residual 260.149 266 .978
Total 449.751 269
2 Regression 200.931 4 50.233 53.499 .000c
Residual 248.820 265 .939
Total 449.751 269
A. Dependent Variable: Organization Performance
B. Predictors: (Constant), Periodic Assessment, Strategic HRM Programs, Succession Characteristic
C. Predictors: (Constant), Periodic Assessment, Strategic HRM Programs, Succession Characteristic,
Establishment
From the analysis of variance results, the study returned an F statistic of 64.622 without
moderation and after moderating, the statistics changed to 53.499 all with significance level at
0.000. This outcome confirms that there is a relationship between organisation performance
and strategic HRM programs, succession characteristics and periodic assessment combined.
This seems to be implying Lee (2005) conclusion that inconsistency in the measurement of
organisational performance are due to a variety of benchmark positions despite the fact that
most researchers measured organisational performance by using quantitative data like Return
on Investments, return on sales among other accounting financial measure of investments.
(break line, too long). NGOs performance includes both efficiency-related measures, which
relate to the input/output relationship, and effectiveness related measures, which deal with
issues like business growth and employee satisfaction.
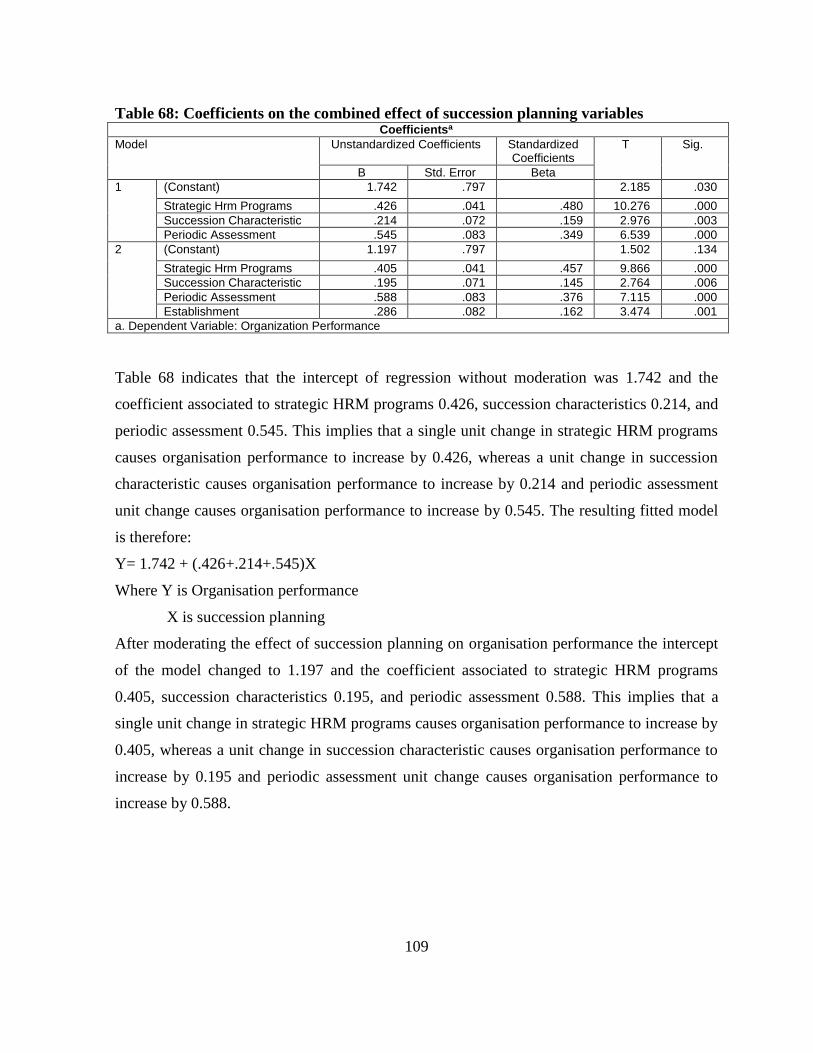
109
Table 68: Coefficients on the combined effect of succession planning variables Coefficientsa
Model Unstandardized Coefficients Standardized Coefficients
T Sig.
B Std. Error Beta
1 (Constant) 1.742 .797 2.185 .030
Strategic Hrm Programs .426 .041 .480 10.276 .000
Succession Characteristic .214 .072 .159 2.976 .003
Periodic Assessment .545 .083 .349 6.539 .000
2 (Constant) 1.197 .797 1.502 .134
Strategic Hrm Programs .405 .041 .457 9.866 .000
Succession Characteristic .195 .071 .145 2.764 .006
Periodic Assessment .588 .083 .376 7.115 .000
Establishment .286 .082 .162 3.474 .001
a. Dependent Variable: Organization Performance
Table 68 indicates that the intercept of regression without moderation was 1.742 and the
coefficient associated to strategic HRM programs 0.426, succession characteristics 0.214, and
periodic assessment 0.545. This implies that a single unit change in strategic HRM programs
causes organisation performance to increase by 0.426, whereas a unit change in succession
characteristic causes organisation performance to increase by 0.214 and periodic assessment
unit change causes organisation performance to increase by 0.545. The resulting fitted model
is therefore:
Y= 1.742 + (.426+.214+.545)X
Where Y is Organisation performance
X is succession planning
After moderating the effect of succession planning on organisation performance the intercept
of the model changed to 1.197 and the coefficient associated to strategic HRM programs
0.405, succession characteristics 0.195, and periodic assessment 0.588. This implies that a
single unit change in strategic HRM programs causes organisation performance to increase by
0.405, whereas a unit change in succession characteristic causes organisation performance to
increase by 0.195 and periodic assessment unit change causes organisation performance to
increase by 0.588.
CHAPTER FIVE
SUMMARY, CONCLUSIONS AND RECOMMENDATIONS
5.1 Introduction
This chapter presents a summary of the analysis and discussion of the empirical findings on
the effects of succession planning practices on organisation performance among Non-
governmental Organisation in Kenya. It also brings to conclusion the objectives of the study
and its recommendations.
5.2 Summary
The summary of the findings is presented following the specific objectives of the study that
included: succession planning practises among NGO’s, extent to which succession planning
practises influence stakeholders outcomes, the role of succession planning on internal
business process and the contribution of succession planning to institutional growth among
NGOs in Kenya.
5.2.1 Summary of Background Information
This study included the participation of (n=270) NGOs operating in Nairobi, Kenya, which
are registered with the National NGO Coordinating Board. Background information for this
study focused on three main areas, including responding organisations; years of existence;
staff establishment and annual budget. Majority of the organisation that participated in this
study have been in existence for 11 to 15 years. Most of these organisations had about 10
employees on average. The budget range for most of the organisations (n=232) was estimated
on the second quartile (M= 2.10, SD= 0.760) representing 11-30 million Kenya shillings
annually. However, majority of the organisations which had been in existence for 1- 5 years
had budget range of between 11- 30 million Kenya shillings.
111
5.2.2 Succession Planning Practices among the Non-Governmental Organisations
The survey assessed whether these NGOs have a written succession plan or policy, potential
successors identified for key positions, the scope of succession planning involvement and the
type of succession planning. The results showed that among those organisations that have
been in existence between for about 6-10 years (33%), there is likelihood of having potential
successors identified for key positions compared to those that are 1- 5 years (11%). The null
hypothesis potential successors would be identified are not independent of the difference of
the years of organisation existence. We therefore accept the null hypothesis and conclude that
there is no relationship between the means of identifying potential successors and the number
of years the organisation has been in existence. The null hypothesis organisation having
written succession planning policy is not dependent of the difference of the years of
organisation existence.
Succession planning involvement was considered in three main categories: This was based on
the level of management from the top, liner manager as well as all employees. The null
hypothesis level of succession planning scope of involvement is dependent on the difference
of years of the organisation’s existence. We therefore reject the null hypothesis and conclude
that there is relationship between the level of succession planning scope of involvement and
the number of years the organisation has been in existence.
On the type of succession planning practice, majority of the organisations that are 6-10 years
old have paper based succession planning (33%). This is closely similar to (21%) of the
organisations that are 11-15 years old. We therefore failed to reject the null hypothesis and
conclude that there is no relationship between the type of succession plan and the number of
years the organisation has been in existence.
5.2.3 Succession planning influences of stakeholder’s outcomes for Non-Governmental
Organisations
Effects of Succession Planning on Stakeholder’s outcome were tested through on multiple
regression analysis of the various variables extracted. These included: Succession planning
112
characteristics and stakeholder outcome, Strategic HRM programs and stakeholder’s
outcomes, succession planning characteristics and stakeholder’s outcomes and, Periodic
assessment and stakeholder outcome.
To establish the extent to which succession planning influences realisation of stakeholders’
expectations for Non-Governmental Organisations’ in Kenya, results returned a Pearson’s
correlation of 0. 387 with significance level of 0.000 thus indicating positive relationship
between succession planning and stakeholders outcome. However, the statistics returned a
negative correlation of 0.085 with significance of p = 0.165 thus indicating a negative
relationship between succession characteristic and stakeholders outcomes
The statistics summary of first outcome indicated a moderate evidence of interaction between
the independent variables succession characteristics and the dependent which is stakeholders
outcome two. As such only (14.9%) of the total variance of stakeholders outcome is
explained. Hence we fail to reject the null hypothesis that; succession planning characteristics
have insignificant effects on stakeholders outcome one. After moderating the effect of
succession planning on stakeholders outcome the intercept of the model, the coefficient
associated to succession planning was 0.15 implying that a single unit change in succession
planning causes stakeholders outcome to increase by 0.15.
Strategic HRM gives direction on how to build the foundation for strategic advantage by
creating an effective organisational structure and design, culture, employee value proposition,
systems thinking, an appropriate communication strategy and preparing an organisation for a
changing landscape (Armstrong, 2010). From the model summary 44.4% of stakeholders
outcome is explained by strategic human resource management programs without moderating
variable. However, after moderating, the effecting of strategic human resource management
programs on stakeholders outcome, the percentage of stakeholders outcomes changes to
47.1% which implies that there is a significant positive effect of moderating relationship.
After moderating the effect of strategic HRM programs on stakeholders outcome, the
intercept of the model, the coefficient associated to succession planning was 0.374 implying
that a single unit change in succession planning causes stakeholders outcome to increase by
0.374.

113
Considering succession planning characteristics and stakeholders outcomes, Correlations
output also indicated a weak evidence of interaction between the independent variables
succession characteristics and the dependent which is stakeholder outcomes. This further
translated to (7.8 %) of the total variance of stakeholders outcome being explained was very
minimal. Hence we fail to reject the null hypothesis that; succession planning characteristics
have no significant effects on stakeholders outcome. These minimal results bring about the
felt need to develop a more positive succession planning culture, which is more inclusive and
linked to the strategies of the organisations. After moderating the effect of succession
characteristics on stakeholders outcome, the intercept of the model changed to 0.413 and the
coefficient associated to succession planning was 0.15 implying that a single unit change in
succession planning causes stakeholders outcome to increase by 0.15. The assumption
underpinning the practice of succession planning is that people are the organization’s key
resource and organisational performance largely depends on them.
Considering periodic assessment and stakeholders outcome, correlation output indicated that
there is no interaction between the independent variables periodic assessment and the
dependent which is stakeholders outcome. This translated to (0.7%) of the total variance of
stakeholders outcome is explained that is very minimal without the moderation. Hence we fail
to reject the null hypothesis that; periodic assessment has no significant effects on
stakeholders outcome. However, after moderating, the effecting of periodic assessment on
stakeholders outcome, the percentage of stakeholders outcome changes to 7.4 % which
implies that there is a significant effect of moderating relationship. After moderating the
effect of succession planning on stakeholders outcome, the intercept of the model, the
coefficient associated to succession planning was 0.053 implying that a single unit change in
succession planning does not cause stakeholders outcome to increase.
By and large it can therefore be deduced that the years of existence and the number of staff
establishments have significant effect on succession planning and equally on the
organisation’s performance.
114
5.2.4 Role of succession planning on internal business process among Non-Governmental
Organisations
The role of Succession Planning practices on internal business process was tested through
multiple regression analysis of the various variables extracted. These included: Strategic
HRM programs and internal business processes, Succession planning characteristics and
internal business process, periodic assessment and internal business process.
The model summary indicated 5.4% of internal business process is explained by succession
planning without moderating variable. Even after moderating effect of succession planning on
internal business process, the percentage explained of internal business process only changes
to 5.5% which implies that there is a minimal effect of moderating relationship. Hence, we
reject the null hypothesis that; succession planning has insignificant role on internal business
process. After moderating the effect of succession planning on stakeholders outcome the
intercept of the model changed to 1.681 and the coefficient associated to succession planning
was 0.049 implying that a single unit change in succession planning causes internal business
process to increase by 0.049.
The statistics summary indicated from correlation output showed that there is evidence of
interaction between the independent variables (strategic HRM programs) and the dependent
which is internal business process. This was explained with (3.4%) of the total variance of
internal business process. Hence we reject the null hypothesis that; strategic HRM programs
have nosignificant effects on internal business process. After moderating the effects of
strategic HRM programs on internal Business Processes the intercept of the model does not
change and remained at 2.508 and the coefficient associated to strategic HRM programs
likewise does not change and remained at 0.056; implying that a single unit change in
strategic HRM programs does not cause internal business process to increase.
A further justification on the role was identified from the statistical summary of the
correlation outputs of the succession characteristic and internal business process. This was
explained with (5.4%) of the total variance of internal business process is explained that is
significant. Hence we reject the null hypothesis that; succession planning characteristics has
115
no significant effects on internal business process. After moderating the effects of succession
characteristics on internal business process the intercept, the coefficient associated to
succession characteristics remained at 0.107 implying that a single unit change in succession
planning causes internal business process to increase by 0.107.
However, statistics summaries further showed that between periodic assessment and internal
business process. This was explained with (0 %) of the total variance of internal business
process is explained that is very minimal. Hence we fail to reject the null hypothesis that;
periodic assessment has no significant effects on internal business process. After moderating
the effects of periodic assessment on internal business process the intercept of the model the
coefficient associated to succession planning was 0.002 implying that a single unit change in
periodic assessment causes internal business to increase by 0.002
5.2.5 Extent to which succession planning contributes to the institutional growth of Non-
Governmental Organisations’
From the model summary 29.6 of Institutional growth is explained by succession planning
without moderating variable. After moderating the effects of succession planning on
institutional growth the intercept, the coefficient associated to succession planning was 0.185
implying that a single unit change in succession planning causes institutional growth to
increase by 0.185.
From the statics summary, the test of independence between strategic HRM programs and
institutional growth show that there is no difference between the means. The correlation
output also indicates that there no interaction between the independent variables (strategic
HRM programs) and the dependent which is institutional growth. This was further explained
with (0.03%) of the total variance of institutional growth explained that is very minimal.
Hence we fail to reject the null hypothesis that; strategic HRM programs have no significant
effects on institutional growth. After moderating the effects of strategic HRM program on
institutional growth the intercept of the model the coefficient associated to strategic HRM
programs remained at – 0.029 implying that a single unit change in strategic HRM does not
causes an increase in institutional growth.
116
However, succession characteristics showed positive outcomes that was explained with
(32.8%) of the total variance of institutional growth is explained significantly. Hence we
reject the null hypothesis that; succession planning characteristics have no significant effects
on institutional growth. After moderating the effects of succession characteristics on
institutional growth the intercept of the model, the coefficient associated to succession
characteristics was 0.429 implying that a single unit change in succession characteristics
causes institutional growth to increase by 0.429
To a greater extent, periodic assessment was found to be contributing most in this perspective.
This was explained by (68.8%) of the total variance in institutional growth is explained that is
very impressive compared to other values of organisation performance variables. We,
therefore reject the null hypothesis that a periodic assessment has no significant effects on
institutional growth. After moderating the effects of periodic assessment on institutional
growth the intercept of the model the coefficient associated to periodic assessment was 0.734
implying that a single unit change in periodic assessment causes institutional growth to
increase by 0.734
5.2.6 Overall Effects of Succession Planning on Organisation Performance of Non-
Governmental Organisations’
Overall, the model summary resulted to 42.2% of organisation performance as being
explained by the combined effects of strategic HRM, succession characteristics and periodic
assessment that constituted the dependent variable of succession planning without moderating
variable. However, after moderating the combined effects of strategic HRM, succession
characteristics and periodic assessment that is succession planning on organisation
performance changes to 44.7% which implies that there is a significant effect of moderating
relationship. Consequently this indicates that the intercept of regression without moderation
was 1.742 and the coefficient associated to strategic HRM programs 0.426, succession
characteristics 0.214, and periodic assessment 0.545. By implication a single unit change in
strategic HRM programs increases organisation performance by 0.426, whereas a unit change
in succession characteristic increases the organisation’s performance by 0.214 and periodic
assessment unit change increases organisation performance by 0.545. After moderating the
effect of succession planning on organisation performance the intercept of the model changed

117
to 1.197 and the coefficient associated to strategic HRM programs 0.405, succession
characteristics 0.195, and periodic assessment 0.588. This implies that a single unit change in
strategic HRM programs increases organisation performance by 0.405, whereas a unit change
in succession characteristic causes organisation performance to increase by 0.195 and periodic
assessment unit change causes organisation performance to increase by 0.588.
5.3 Conclusion
The practice of succession planning in the surveyed NGOs conforms well to the integrated
model and guidelines established. The degree of compliance with the guidelines of the
integrated model varied mainly between important and very important as being practised.
Throughout succession planning characteristics, human resource management programs such
as recruitment, training and development, performance management, talent management and
reward managed are considered very important. Both strategic HRM programs? and
succession planning share development as a means to an end but approach it from different
directions: HRM programs tend to be bottom up (from individual to organisation); succession
planning tends to be top down. From the largest percentage explained that is 47%, it can be
deduced that, Strategic capability is a concept applied in human resource management on the
ability of an organization to develop and implement strategies that will achieve sustained
competitive advantage that is attributed to Organisation performance. This study in the NGO
sector has demonstrated that it is about the capacity to select the most appropriate vision, to
define realistic intentions, to match resources to opportunities and to prepare and implement
strategic plans. From these findings it can be concluded that strategic capability of any
organisation depends on the strategic capabilities of its managers and entire human resource.
Succession planning practices were found not to have significant effects of stakeholders
outcome that is, a component of organisation performance. Keeping up-to-date with advances
on what works (does not work) to improve performance, (something is lacking
here)employees have high level of understanding of organisations strategic orientation,
stakeholders consider organisations work relevant, communities taking ownership of the
projects and programs implemented and financial and narrative reports clearly indicate
activity outcome, are all important aspects of organisation performance that can be promoted
118
with succession planning(revise the entire line, moreover its long). Overall, from these
findings it can be deduced that linking succession plans to strategic plans of the organisation
are very crucial for sustained performance of the organisation.
However, succession planning effects on internal business process was found to be very
important. On the contrary, adopting best practices of internal business process is always
geared towards ensuring that appropriate processes and structures are in place to direct and
manage an organisation’s operations and activities, and to ensure that they function well. The
ultimate goal of good internal business processes as an aspect of organisation performance is
to ensure the effectiveness, credibility and viability of the organisation is maintained.
Institutional growth is a key component of organisation performance. It is the case in this
study that, in deed succession planning contributes positively to institutional growth based on
teamwork where work teams frequently review and evaluate processes, incidents, decisions
and innovations to derive as much learning as they can from both success and failure through
performance appraisal and the promotion committed to the organisation for growth and
development as well as career development within the organisation.
5.4 Recommendations
Succession planning programs help to ensure the continuity of talent needed to preserve
economic growth and organisational viability. Empirical findings have demonstrated that
there are major gaps on the practice of succession planning among the survey NGOs. These
include the need to enshrine succession planning practices by ensuring that: NGOs develop
succession plan policies, identify potential successors for key positions, expand the scope of
their succession planning not only to top management but at all levels. With the advancement
in technology, it is recommended that NGOs fully automate their succession planning
processes for effectiveness and efficiency towards promoting ease of decision making.
For purposes of strengthening organisation systems and processes to ensure organisation
performance through succession planning, it is also recommended that; NGOs need to deploy
strong management on human resources. Critical factors that create value at the end of the day

119
for any organisations and continuous improvement are high-quality value offerings and
services which are embedded in the investment on human capital and retention of the best
possible staff. Hence essential competencies that NGOs need in the future include: building
the successor’s leadership skills, planning the development and retention of key persons,
linking these initiatives to the strategic plans through a proper strategic planning process that
includes leadership transition, and documenting systems and procedures to create efficiencies
and support the effective transfer of knowledge.
5.5 Suggestions for further studies
This study on effects of succession planning on organisation performance was carried out
among NGOs registered by NGOs coordination board that are based in Nairobi City County.
A similar study can be conducted among NGOs in other City Counties such as Kisumu and
Mombasa. The same can be replicate in the largest rural counties such as Kakamega.
During the period of this research it was also noted that The Central Bank of Kenya (the
regulator of the banking industry) in its prudential guidelines 2013 onward, requires the all
commercial and mortgage banks to develop succession plans as a mandatory requirement.
This new recommendation by the regulatory authority of the banking sector is yet to take
roots from 2014 onward. It is suggested that a further research on the practice of succession
planning can be conducted to establish the effects of succession planning on the performance
of commercial banking organisations in Kenya.

120

REFERENCES
Aberdeen Group. (2007). Succession Planning Strategies: The Right People, for the Right
Jobs, at the Right Time. Boston, Massachusetts: Aberdeen Group Inc.
Active Learning Network for Accountability and Performance in Humanitarian Action
(2006, March). Evaluating Humanitarian Action Using the OECD-DAC Criteria: An
ALNAP Guide for Humanitarian Agencies. London: Overseas Development Institute.
Retrieved June 18, 2012.http://www.odi.org.uk/alnap/publications /pdfs/.
Ali, D., Farashah, V. N., & Ahmadreza, S. K. (2011). Succession Planning and Its
Effects on Employee Career Attitudes: Study of Iranian governmental
Organizations. African Journal of Business Management. 5 (9), 3605-3613.
Alleyne, S. (2007). More than Research. Black Enterprise Journal, 38(2), 66-66.
Angela, H. (2009). Succession Planning or Smart Talent Management? Journal of
Industrial and Commercial Training . 41 (1), 3 – 8.
Anjai, N. (2010). Succession Planning and its Impact on Organizational Performance.
Journal of Arts Science and Commerce. 2 (1), 1-2.
Anthony, Robert. N., (1995). The Nonprofit Accounting Mess. Accounting Horizons
Journal. 9 (2), 44-54.
Aquila, A.J. (2007). Key Best Practices for Succession Planning, Practice Resources, Black
Enterprise Journal.21 (16), 1
Bain, N. (1995). Successful Management. London: MacMillan Business.
Barney, J. B. (1995). Advances in Strategic Management: Theory and Practice Reading,
MA: Addison-Wesley Publishing Company.
Barney, J. B. (2002). Gaining and Sustaining Competitive Advantage (2nd Ed.). Upper
Saddle River, NJ: Pearson Education, Inc.
Barry, I, & Gabriel, J. (2006). Business Succession Planning: A Review of the Evidence,
Journal of Small Business and Enterprise Development. 13 (3), 326 – 350.
122
Beever, D.R. (2008). Integrating Succession and Career Development Strategies for
Finance Professionals. (Diss, Canada Royal Roads University, 2008). Dissertation
Abstracts International, Notre reference (ISBN: 978-0-494-44194-7).
Behn, B. K., Riley, R. A., & Yang, Y. (2005). The Value of an Heir Apparent in Succession
Planning. Corporate Governance International Review Journal, 13(2), 168-177.
Bendell, J. (2006). Debating NGO accountability. Geneva, Switzerland: United Nations
Press. Retrieved July 2, 2012 from http://www.un.org/liasion/services/dossier/.
Bersin and Associates (2009). Executive Summary on High Impact Succession
Management. Oakland, CA: Bersin and Associates.
Bowen, F.E., Rostami, M. & Steel, P. (2009). Timing is Everything: A meta-analysis of the
Relationships Between Organizational Performance and Innovation. Journal of
Business Research. 37(1), 48-52.
Brinkerhoff, D.W. (1991). Improving Development Program Performance: Guidelines for
Managers. Journal of International Development. 10(1), 55-69.
Burns, N. & Grove, S.K. (2001) Understanding Research. (2nd Ed). Philadelphia: W.B.
Saunders Company.
Byham, W.C., Smith A.B., & Paese, M.J. (2002). Grow Your Own Leaders: How to
Identify, Develop, and Retain Leadership Talent. New York: Prentice–Hall.
Caudron, S. (1999). The looming Succession crisis. Workforce Journal, 78(9), 72-76.
Cheryl, R. (2009). A New Paradigm: Strategies for Succession Planning. Minneapolis:
Capella University Press.
Christie, S. (2005). Succession Planning: There are No Magic Bullets. Policy & Practice of
Public Human Services. Administrative Science Quarterly. 27(1): 1-16.
Clayton, A. (1999) NGOs and Decentralised Government in Africa. London: INTRAC.
Coakes, S.J., Steed, L., & Dzidic, P. (2006). SPSS version 13.0 for Windows: Analysis
Without Anguish. Australia: John Wiley and Sons Australia Ltd.
123
Conger, J. & Fulmer, R. (2003). Developing your Leadership Pipeline. Harvard Business
Review, 81(12), 76-85.
Corporate Leadership Council (2008). Succession Management: Strategy Development
Guidelines. E-report, Corporate Leadership Council. Retrieved 15 July 2012 from
www.corporateleadership.com/council/.
Couchman, W. & Dawson, J. (1998) Handbook of Qualitative Research. (3rdEd.).
London: Sage.
Covel, S. (2007). Three Ways to Plan for Executive Transitions. Wall Street Journal
Eastern Edition (95): 250.
Creswell, J.W. (1994). Research Design: Qualitative & Quantitative Approaches. London:
SAGE Publications.
Crossan, M. M., Fry, J. N., & Killing, J. P. (2005). Strategic Analysis and Action (6thEd.).
Toronto, Ontario, Canada: Prentice Hall.
Daft, R. L. (2000). Organization Theory and Design. (7thEd.) Thomson U.S.A: South-
Western College Publishing.
DeMars, W. E. (2005). NGOs and Transnational Networks: Wild Cards in World Politics.
London: Pluto Press.
Department of Public Information (DPI) (2007). Department of Public Information: NGO
Section. Retrieved July 2, 2012 from http://www.un.org/dpi/ngosection/ index.asp.
Dessler, G. (2005). Human Resource Management. New Jersey: Upper Saddle River:
Prentice Hall.
Devero, A. (2004). Corporate Values Aren’t Just Wall Posters: They’re Strategic Tools,
Business Ethics Journal. 12 (4), 19-21.
Diamond, A. (2006). Finding success through Succession planning. Management Journal.
50(2), 36–39.
Dodor, J. B. K., Gupta, R. D, & Bobie, D. (2010). A Framework for Governmental
Organizations’ Balanced Scorecard. Mississippi: Jackson State University.
124
Ebrahim, A. (2008). NGOs and Organizational Change. Cambridge: Cambridge University
Press.
Escobar, A. (1997). The Making and Unmaking of the Third World through
Development in the Post Development. London: Zed Books.
Espirito, S. D. (2001). Examining performance variables of nongovernmental
Organizations. Retrieved June 18, 2012 from http://wwwlib.umi.com/pqddpdf/.
Field, P. A. (2005). Discovering Statistics Using SPSS (2nd Ed.). London: Sage.
Figg, J. G. (2000). Balanced Scorecards Receive High Marks. Internal Auditors Journal,
57(2): 16-27.
Galbraith, J. (1973). Designing Complex Organizations. MA: Addison-Wesley.
Ganesh, S. (2003). Organizational Narcissism: Technology, Legitimacy, and Identity in
Indian NGO. Management Communication Quarterly. 16(4), 558–594.
Garman, A.N., & Glawe, J. (2004). Succession Planning. Psychology Journal. 56:119 –128.
Gimenez, F.A.P. (2000). The Benefits of a Coherent Strategy for Innovation and Corporate
Change: Strategy and Innovation Journal. 9 (4), 235-244.
GoK. (2006). Sessional Paper No 1 of 2006 on Non-Governmental Organizations Policy by
Office. Nairobi: GoK Press.
GoK. (2007). Kenya’s Vision 2030: A Globally Competitive and Prosperous Kenya.
Nairobi: GoK press.
GoK. (2011). Achieving Economic Growth through targeted, Effective and Efficient
Public Spending: Human Resource Development Sector Report 2011/12 –
2013/14. Nairobi: GoK press.
GoK. (2012). The Non-Governmental Organizations Act, 2012. Nairobi: GoK Press.
Goldhaber, G.M. (1993). Organizational Communication. (6thEd.) New York: McGraw-Hill.
Gratton, L (2004) The Democratic Enterprise, FT Prentice-Hall, Harlow.
125
Greer, C. R. & Virick, M. (2008). Diverse Succession Planning: Lessons Learned from the
Industry Leaders. Human Resource Management. 47(2), 351 – 367.
Groves, K. S. (2008). Integrating Leadership Development and Succession Planning Best
Practices. Journal of Management Development. 26 (3), 239 - 260.
Hair, J.F., Money, A.H., Samuel P., & Page M., (2007). Research Methods for Business.
England, West Sussex: John Wiley and Sons.
Hall, B., Jaffe, A., & Trajtenberg, M. (2005). Market Value and Patent Citations. Rand
Journal of Economics. 36: 16–38.
Heinen, J. S., & O’Neill, C. (2004). Managing Talent to Maximize Employee
Performance. Employment Relations Today 31(2), 67-82.
Holinsworth, S.R. (2004), Case study: Henrico County, Virginia: Succession management:
A developmental approach. Public Personnel Management, 33(4), 475-486.
Holliday, A. (2007). Doing and Writing Qualitative Research. (2nd Ed.). London: Sage.
Hollington, S. (2007). Have you planned for your replacement? Engineering
Management. 17(1). 17-18.
House, R. J. (1971). Path Goal Theory of Leadership: Lessons, Legacy, and a Reformulate
Theory. Leadership Quarterly. 7(3). 323-352.
Huang, T. (2001), Succession management systems and human resource management
outcomes. International Journal of Manpower. 22(8), 736-47.
Huddleston, M.W., (1999). Profiles in excellence: Conversations with the best of America’s
Career Executive Service. Washington, D.C.: PriceWaterhouseCoopers.
Hutcheson, J. (2007). Why Succession Planning Matters. Online Business Week- Academic
Search Complete Database. Retrieved July 2, 2012 from
http://www.businessweek.com/stories/2007- 07-30/.
Ibarra, P (2005). Succession Planning: An Idea Whose Time has Come. Public Management.
87(1). 18 – 24.
126
Ibarra, P. (2004). Incorporating Succession Planning into Your Organization. Arizona:
Mejorando Group.
Javier, K. (2002). The Affective Implications of Perceived Congruence with Culture
Dimensions during Organizational Transformation. Management Journal. 22 (4):
527-47.
Jayson, S. & Martins, K. (2008). Succession Management: Addressing the Leadership
Challenge. Boston, Massachusetts: Aberdeen Group Inc.
Judge, T. A., Parker, S., Colbert, A. E., Heller, D. & Ilies, R. (2001). Job satisfaction: A
cross-cultural review. In Handbook of Industrial, Work and Organizational
Psychology. London: Sage.
Kaplan, R. S. & Norton D. P. (1992). The Balanced Scorecard: Measures that drive
performance. Harvard Business review (January-February): 71-79.
Kaplan, R. S. & Norton D. P. (1996). Using the Balanced Scorecard as a Strategic
Management System. Harvard Business review (January-February): 75-85.
Kaplan, R. S. & Norton, D. P. (2001). The Strategy Focused Organization. New York:
Harvard Business Press.
Kaplan, R. S. & Norton, D. P., (1995). The Balanced Scorecard. New York: Harvard
Business Press.
Karaevli, A. & Hall, DT (2003). Growing Leaders for Turbulent Times: Is Succession
Planning up to the Challenge? Organization Dynamics. 32: 62 – 79.
Karien, S. (2011), Talent reviews: The Key to Effective Succession Management. Business
Strategy Series. 12 (5), 264 – 271.
Keating, T., & Knight, W. A. (2004). Building Sustainable Peace. Tokyo: United Nations
University Press.
Kim, L., Campbell, M. &Smith, R. (2009). High-Impact Succession Management. Bersin &
Associates: Center For Creative Leadership Industry Study.
127
Kirongo, S. N.&Abdalla B. (2009). The Contribution of Non-State Actors to
Development in Kenya. Nairobi: Development Policy Management Forum (DPMF).
Kombo, D. K. & Tromp D. L. A. (2006). Proposal and Thesis Writing: An Introduction.
Nairobi: Pauline Publications.
Kothari, C. K. (2009). Research Methodology: Methods and Techniques (2nd Ed.). New
Delhi: New Age International Publishers.
Latham, J. & Vinyard, J. (2005). Baldrige User’s Guide: Organization Diagnosis,
Design, and Transformation. New York: Wiley.
Lee, C. D. (2005). Rethinking the Goals of Your Performance-Management System.
Employment Relations Today Journal. 32, (3), 53–60.
Leibman, M., Bruer, R. & Maki, B (1996). Succession Management: The Next Generation
of Succession Planning. Journal of Human Resource Planning.19 (3):16-29.
Lok, P & Crawford, J., (2003). The Effect of Organizational Culture and Leadership
Style on Job Satisfaction and Organizational Commitment A Cross-National
Comparison. Journal of Management Development. 23 (4), 321 – 338.
Lynn, D. B. (2001). Succession Management Strategies in Public Sector Organizations:
Building Leadership Capital. Review of Public Personnel Administration.
21(2): 114-132.
Markay, B. (1998). Non-Governmental Organizations in Development: Search for a New
Vision. Kathmandu: Center for Development and Governance.
Mbote, P. K. (2002). The Operational Environment and Constraints for NGOs in Kenya:
Strategies for Good Policy and Practice. Geneva: International Environmental
House.
McGahan, A. M. (2004). How Industries Evolve: Principles for Achieving and Sustaining
Superior Performance. Boston: Harvard Business School Press.

128
Mojtaba, A., Zafar, A., Ahmad, Z., Ishfaq, N. & Muhammad, M (2011). Balanced
Scorecard: Is it a Spontaneous Performance Measurement Tool? Interdisciplinary
Journal of Contemporary Research in Business. 2 (2), 99-100.
Mugenda, O. M. & Mugenda, A. G. (2003). Research Methods Qualitative and
Quantitative Approaches. Nairobi: ACTS– Graphics Services.
Mwega, F. M. (2010). Volatility and Fragmentation of Foreign Aid: A Case Study of Aid
Effectiveness in Kenya. Washington: World bank- Brookings Institution.
Neuman, W.L. (2003). Social Research Theory Methods: Qualitative and Quantitative
(5th Ed.). New York: Pearson Education Inc.
NGO Coordination Board (2009). National Survey of NGOs Report. Nairobi: NGO
Coordination Board.
Nink, D. & Fogg, J. (2006). Succession Planning: Preparing Future Corrections Leaders
Now. Corrections Today. 68(5), 34-37.
Norton, D. P., (2009), How a management system helps you cope with a recession,
Balanced Scorecard Report. Academy of Management Journal. 11(3), 1-5.
Norton, D.P. & Russell, R.H., (2005). Translate the strategy into Operational Terms:
Balanced Scorecard Report. Academy of Management Journal. 7(3), 1-2.
Orodho, A. J. & Kombo, D. K. (2002) Research Methods. Nairobi: Masola Publishers.
Ostroff, C. and Schmitt, N. (2003). Configurations of organizational effectiveness and
efficiency. Academy of Management Journal, 36(6), 1345-1361.
Patel, L. (2005). The Master Strategist: Power, Purpose and Principle. London: Arrow
Books.
Patton, M. Q. (1990). Qualitative Evaluation and Research Methods (2nd Ed.). Newbury
Park, CA: Sage Publications.
Patton, W.D. & Pratt, C. (2002). Assessing the Training Needs of High Potential Managers.
Person Management. 31: 465 – 484.

129
Popovich, M. G. 1998. Creating High-Performance Government Organizations. San
Francisco, CA: Jossey-Bass.
Punch, K.F. (2005). Introduction to Social Research. (2nd Ed). London: Sage.
Rhodes, D. W. & Walker, J. W. (1984). Management Succession and Development
Planning. Human Resource Planning. 17: 157-173.
Richtermeyer, S. B. (2011). Successful Succession Planning. Human Resource Management
International Digest, 16: 3-5.
Rick, J. (2002). People and Change: Exploring Capacity- Building in NGOs. Oxford:
INTRAC.
Roberts, B. (2002). Matching Talent with Tasks. HR Magazine. 47: 2-4.
Rosenbusch, N., Brinckmann, J. & Bausch, A. (2010). Is Innovation Always Beneficial? A
meta-analysis of the Relationship between Innovation and Performance in
SMEs.Journal of Business Venturing doi:10.1016/j.jbusvent. Retrieved 2012.12.002.
Rothwell, W. (2001). Effective Succession Planning: Ensuring Leadership Continuity and
Building Talent from Within. (2nd Ed).New York: Amacom.
Rothwell, W.J. (2005). Effective Succession Planning: Ensuring Leadership Continuity and
Building Talent Within (3rd ed.). New York: AMACOM.
Rothwell, W.J. (2010). Effective Succession Planning: Ensuring Leadership Continuity and
Building Talent from Within (4th Ed.). New York: American Management
Association.
Rothwell, W.J., Jackson, R.D., Knight, S.C. & Lindholm, J.E. (2005). Career Planning and
Succession Management: Developing your Organizations Talent – for Today and
Tomorrow. Westport, CT: Praeger.
Rothwell, W.J., Jackson, R.D., Knight, S.C., & Lindholm, J.E. (2007). Career Planning and
Succession Management: Developing your Organization. New York: Amacom.
Rubin, D.K., Powers, M.B., & Illia, T. (2007). Succession plans are new priority because
ready or not, the future’s coming. ENR: Engineering News-Record. 259 (12), 26-29.
130
Salkind, N. (2006). Exploring Research (6th Ed.). New Jersey: Pearson Prentice Hall.
Sandison, P. (2005). The Utilization of Evaluations. London: Overseas Development
Institute. Retrieved June 18, 2012 from
http://www.odi.org.uk/alnap/publications/rha2005/rha05_Ch3.pdf.
Sangmook, K. (2005), Individual-Level Factors and Organizational Performance in
Government Organizations. Journal of Public Administration Research and Theory
15(2), 245–261.
Saulnier, D, S. (2010). Succession Management: Positioning Your Organization’s
Leadership for Business Success. Manpower Company from Retrieved June 18, 2012
http://www.right.com/thought-leadership/e-newsletter/pdf.
Schmalzried, H. & Fallon, L.F. (2007). Succession planning for local health department top
executives: Reducing risk to communities. Journal of Community Health.
32(3), 169-180.
Scott, W. R. (2003). Organizations: Rational, Natural, and Open Systems (5th Ed.). Upper
Saddle River, NJ: Prentice-Hall.
Sekaran, U. (2003). Research Methods for Business: A Skill-Building Approach. New
York: John Wiley and Sons, Inc.
Shadi, E. M & Noor, A. M. (2011). Brief Review of Succession Planning and
Management Approach. 3rd International Conference on Advanced Management
Science. IPEDR vol.19. Singapore: IACSIT Press.
Shen, W. & Cannella, A. Jr. (2003). Will Succession planning increase shareholder
wealth? Evidence from investor reactions to relay CEO Successions. Strategic
Management Journal. 24 (2), 191-8.
Singh, J. C. A. & Mirchandani, P. (2006) Performance Measurements for Not-For-Profit
Organizations. The Chartered Accountant Journal 32: 1754-1758.
Tracy, T. & McGraw, P. (2004). Succession management practices in Australian
Organizations. International Journal of Manpower. 25(8), 741 – 758.
131
Weill, P., Olson, T. & Marorethe, H. (1989). An Assessment of the Contingency Theory of
Management Information Systems. Journal of Management Information Systems 6(1),
63.
Williams, C.P. (2010), “Succession planning”, Retrieved 27 May 2012 from
www.topmba.com/emba/choosingemba/Succession-planning.
Wyatt, W. (2007). Effective Succession Planning in the Public Sector. New York: AMACOM
Yin, R. (1994), Case Study Research (2nd Ed.), Califonia: SAGE Publications Ltd,
Zajac, J. (1995). Selection, Succession, Compensation and Firm performance: A Theoretical
Integration and Empirical Analysis. Strategic Management Journal. 11(3), 217-230.
Zimmerman, J. (2004). Using a Balanced Scorecard in a Nonprofit Organization.
Green- Crofton: Creative Direct Response, Inc.

132
APPENDICES
APPENDIX I: QUESTIONNAIRE
Section A: Back ground information
1. How long has your organisation been in existence?
1)1-5 years [ ]
2) 6-10 years [ ]
3) 11-15 years [ ]
4) 16-20 years [ ]
5) 20 years and above [ ]
2. What is the level of your organisation staff establishment?
1)1-10 [ ]
2) 11-20 [ ]
3) 21-30[ ]
4) 30-40 [ ]
5) 40 and above [ ]
3. What is your organisations annual budget in Kenya Shillings?
1).Less than 10 Million [ ]
2) 11 -30 Million [ ]
3) 31 -50 Million [ ]
4) 51-100 Million [ ]
5) 101 Million and above [ ]
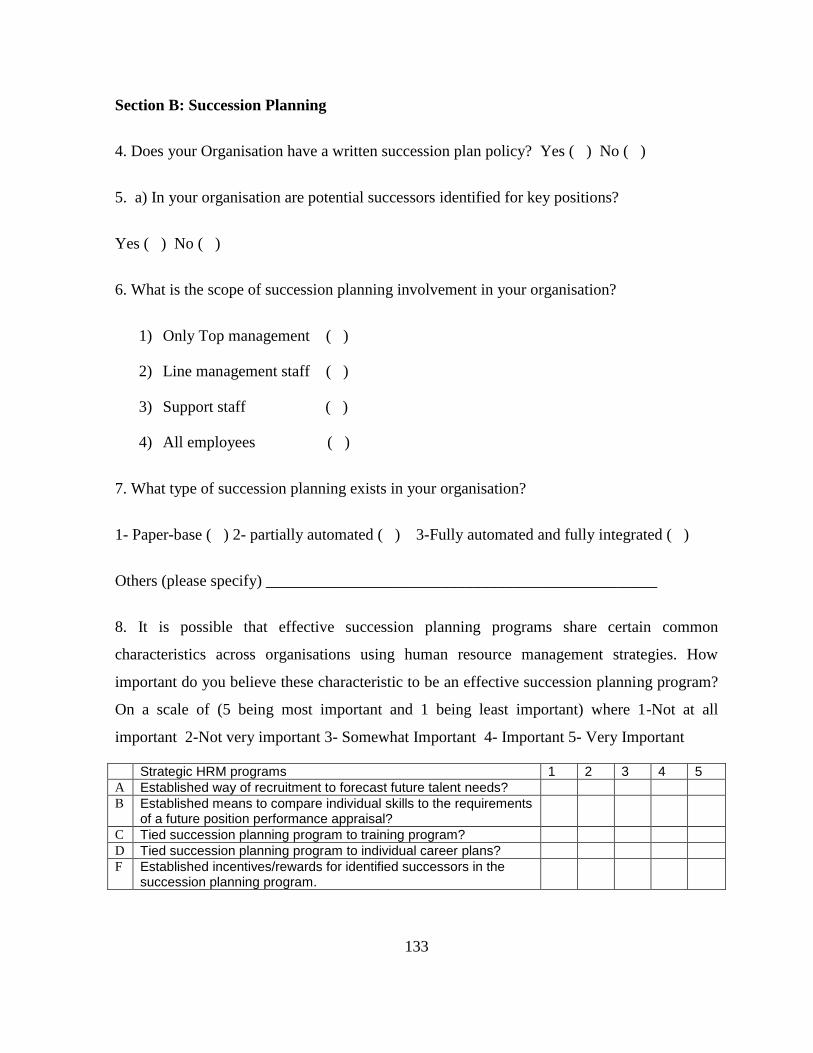
133
Section B: Succession Planning
4. Does your Organisation have a written succession plan policy? Yes ( ) No ( )
5. a) In your organisation are potential successors identified for key positions?
Yes ( ) No ( )
6. What is the scope of succession planning involvement in your organisation?
1) Only Top management ( )
2) Line management staff ( )
3) Support staff ( )
4) All employees ( )
7. What type of succession planning exists in your organisation?
1- Paper-base ( ) 2- partially automated ( ) 3-Fully automated and fully integrated ( )
Others (please specify) _________________________________________________
8. It is possible that effective succession planning programs share certain common
characteristics across organisations using human resource management strategies. How
important do you believe these characteristic to be an effective succession planning program?
On a scale of (5 being most important and 1 being least important) where 1-Not at all
important 2-Not very important 3- Somewhat Important 4- Important 5- Very Important
Strategic HRM programs 1 2 3 4 5
A Established way of recruitment to forecast future talent needs?
B Established means to compare individual skills to the requirements of a future position performance appraisal?
C Tied succession planning program to training program?
D Tied succession planning program to individual career plans?
F Established incentives/rewards for identified successors in the succession planning program.

134
9. Do you believe that in your organisation succession planning is integrated with the
following management processes? Respond to the questions by using this scale of 5- Strongly
agree 4- Agree 3-Neutral 2-Disagree 1- Strongly disagree
Management Processes 5 4 3 2 1
A Talent management
B Performance Management
C Training and Development
D Total Rewards Management
Succession planning characteristics
10. Does your Organisation consult the strategic plan to determine succession planning needs?
Yes [ ] No [ ]
11. It is possible that effective succession planning programs share certain common
characteristics across organisations linked to strategic plans. On a scale of (5 being most
important and 1 being least important). Kindly rate the following sentiments as perceived to
be true from your practice
12. It is possible that effective succession planning programs share certain common
characteristics across organisations linked to top management support. On a scale of 5 being
most important and 1 being least important. Kindly rate the following sentiments as perceived
to be true from your practice. Where: 1-Not at all important 2-Not very important 3-
Somewhat Important 4- Important 5- Very Important
Top management support 1 2 3 4 5
A Fixed responsibility for organisational oversight of the program statement to guide the program
B Developed means to budget for a succession planning program
C Established way to plan for meeting succession planning needs through individual development plans
Linkage to Strategic plans 1 2 3 4 5
A Tied the succession planning program to the organisational strategic plans?
B Established program action plan?
C Established way to forecast future talent needs?
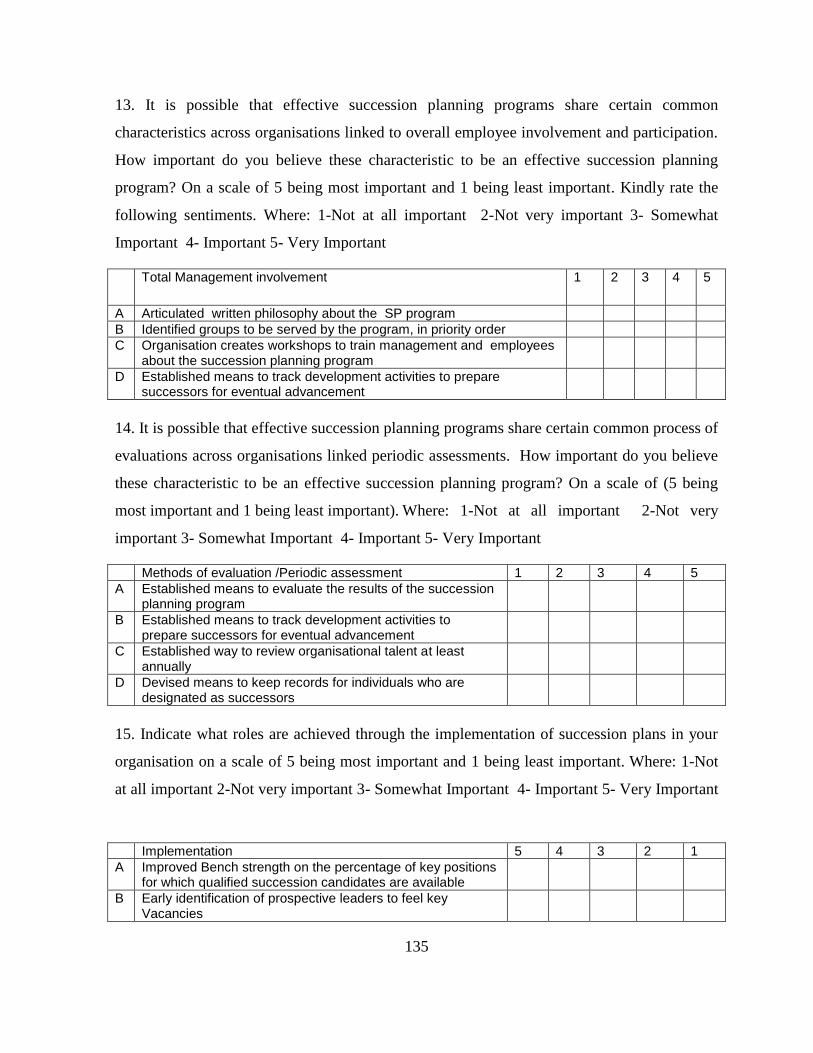
135
13. It is possible that effective succession planning programs share certain common
characteristics across organisations linked to overall employee involvement and participation.
How important do you believe these characteristic to be an effective succession planning
program? On a scale of 5 being most important and 1 being least important. Kindly rate the
following sentiments. Where: 1-Not at all important 2-Not very important 3- Somewhat
Important 4- Important 5- Very Important
Total Management involvement 1 2 3 4 5
A Articulated written philosophy about the SP program
B Identified groups to be served by the program, in priority order
C Organisation creates workshops to train management and employees about the succession planning program
D Established means to track development activities to prepare successors for eventual advancement
14. It is possible that effective succession planning programs share certain common process of
evaluations across organisations linked periodic assessments. How important do you believe
these characteristic to be an effective succession planning program? On a scale of (5 being
most important and 1 being least important). Where: 1-Not at all important 2-Not very
important 3- Somewhat Important 4- Important 5- Very Important
Methods of evaluation /Periodic assessment 1 2 3 4 5
A Established means to evaluate the results of the succession planning program
B Established means to track development activities to prepare successors for eventual advancement
C Established way to review organisational talent at least annually
D Devised means to keep records for individuals who are designated as successors
15. Indicate what roles are achieved through the implementation of succession plans in your
organisation on a scale of 5 being most important and 1 being least important. Where: 1-Not
at all important 2-Not very important 3- Somewhat Important 4- Important 5- Very Important
Implementation 5 4 3 2 1
A Improved Bench strength on the percentage of key positions for which qualified succession candidates are available
B Early identification of prospective leaders to feel key Vacancies

136
C Success rate for new executives in replacement positions
D Employee satisfaction resulting to Lower rate of turnover
Section C: Organisation Performance
16. Record your assessment indication in the space next to the appropriate number on the
five-point scale. How is the following component of performance important to your
Organisation Success On a scale of 5 being most important and 1 being least important.
Kindly rate the following sentiments. Where: 1-Not at all important 2-Not very important 3-
Somewhat Important 4- Important 5- Very Important
Stakeholders Outcome 1 2 3 4 5
A We keep up-to-date with advances in knowledge about what works (and what does not work) to improve performance in our field.
B Employees’ have high level of understanding of organisation’s strategic orientation
C Our Stakeholders ( development partners) consider our work relevant
D Communities are taking ownership of the projects and programs we implement
F Financial and narrative reports clearly indicate activity-outcomes
17. Record your assessment indication in the space next to the appropriate number on the
five-point scale. How is the following component of performance important to your
Organisation Success On a scale of 5 being most important and 1 being least important.
Kindly rate the following sentiments, Where: 1-Not at all important 2-Not very important 3-
Somewhat Important 4- Important 5- Very Important
Internal Process 1 2 3 4 5
A We constantly emphasize and introduce managerial innovations (e.g. computer-based administrative innovations, new employee reward/training schemes, new departments or project teams, etc.)
B We work hard to ensure that we apply the best performance tools and techniques that are relevant to the field in which we operate.
C We often assess department’s needs by forecasting future staffing requirements to determine work competency requirements with regards to succession planning?
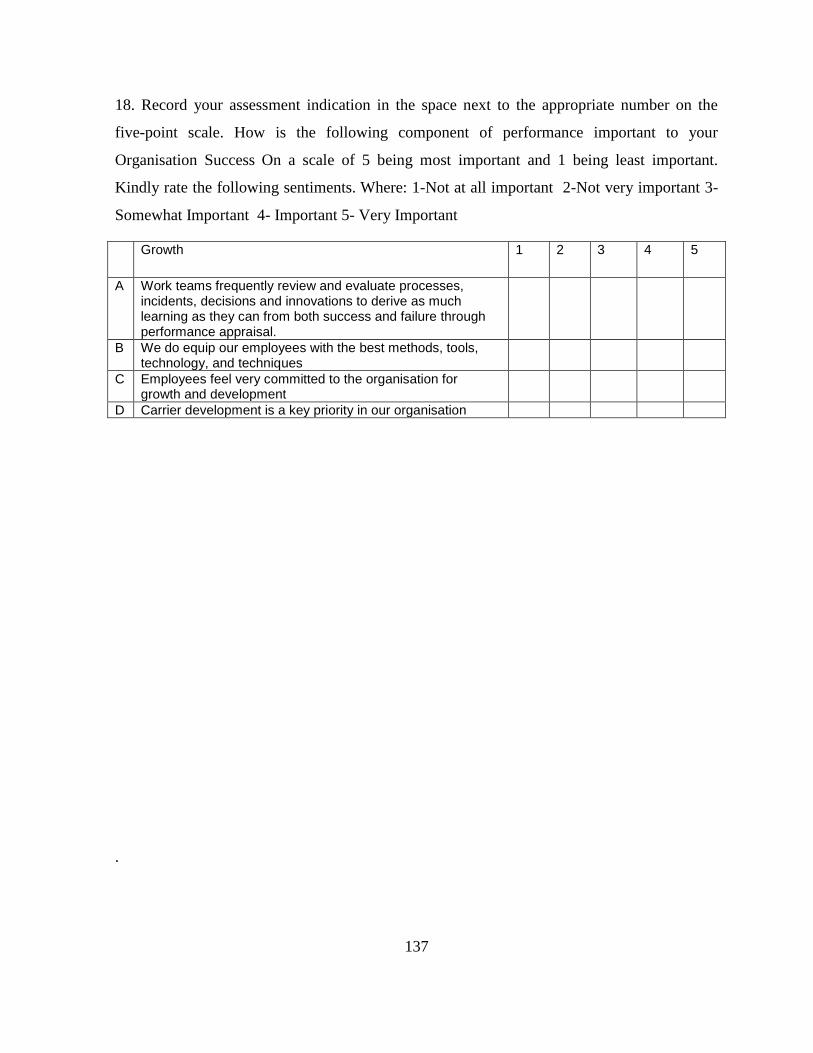
137
18. Record your assessment indication in the space next to the appropriate number on the
five-point scale. How is the following component of performance important to your
Organisation Success On a scale of 5 being most important and 1 being least important.
Kindly rate the following sentiments. Where: 1-Not at all important 2-Not very important 3-
Somewhat Important 4- Important 5- Very Important
Growth 1 2 3 4 5
A Work teams frequently review and evaluate processes, incidents, decisions and innovations to derive as much learning as they can from both success and failure through performance appraisal.
B We do equip our employees with the best methods, tools, technology, and techniques
C Employees feel very committed to the organisation for growth and development
D Carrier development is a key priority in our organisation
.
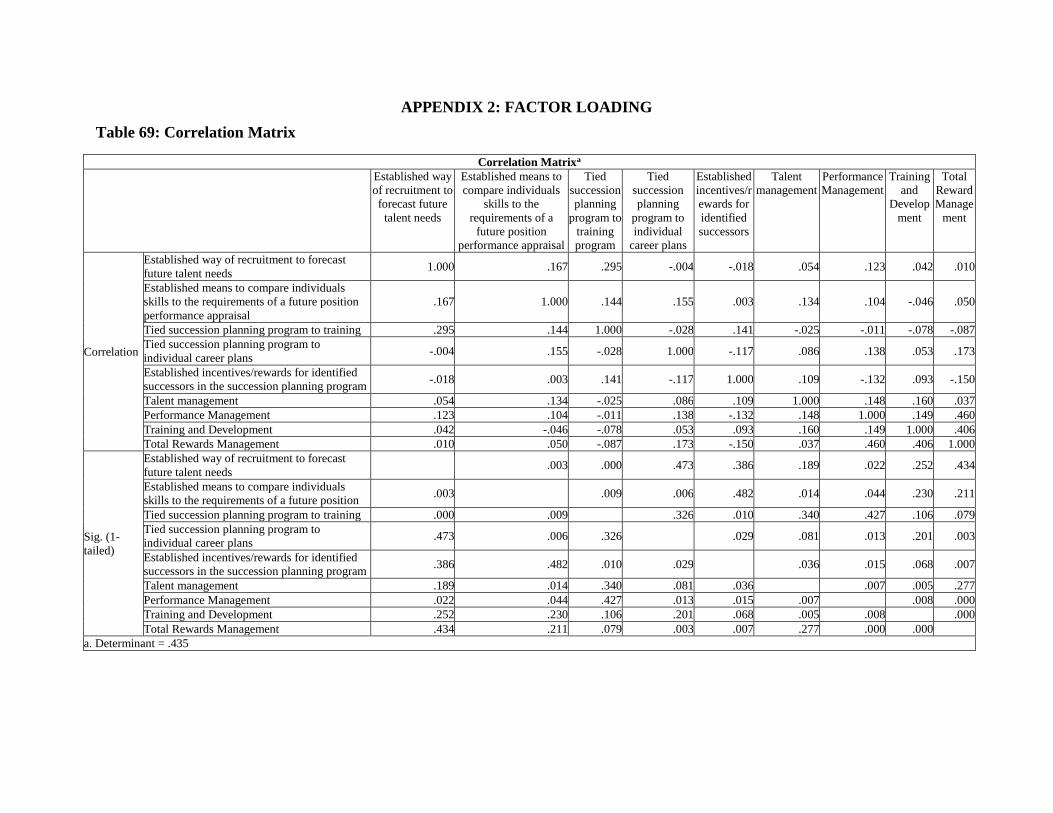
APPENDIX 2: FACTOR LOADING
Table 69: Correlation Matrix
Correlation Matrixa
Established way
of recruitment to
forecast future
talent needs
Established means to
compare individuals
skills to the
requirements of a
future position
performance appraisal
Tied
succession
planning
program to
training
program
Tied
succession
planning
program to
individual
career plans
Established
incentives/r
ewards for
identified
successors
Talent
management
Performance
Management
Training
and
Develop
ment
Total
Reward
Manage
ment
Correlation
Established way of recruitment to forecast
future talent needs 1.000 .167 .295 -.004 -.018 .054 .123 .042 .010
Established means to compare individuals
skills to the requirements of a future position
performance appraisal
.167 1.000 .144 .155 .003 .134 .104 -.046 .050
Tied succession planning program to training .295 .144 1.000 -.028 .141 -.025 -.011 -.078 -.087
Tied succession planning program to
individual career plans -.004 .155 -.028 1.000 -.117 .086 .138 .053 .173
Established incentives/rewards for identified
successors in the succession planning program -.018 .003 .141 -.117 1.000 .109 -.132 .093 -.150
Talent management .054 .134 -.025 .086 .109 1.000 .148 .160 .037
Performance Management .123 .104 -.011 .138 -.132 .148 1.000 .149 .460
Training and Development .042 -.046 -.078 .053 .093 .160 .149 1.000 .406
Total Rewards Management .010 .050 -.087 .173 -.150 .037 .460 .406 1.000
Sig. (1-
tailed)
Established way of recruitment to forecast
future talent needs
.003 .000 .473 .386 .189 .022 .252 .434
Established means to compare individuals
skills to the requirements of a future position .003
.009 .006 .482 .014 .044 .230 .211
Tied succession planning program to training .000 .009 .326 .010 .340 .427 .106 .079
Tied succession planning program to
individual career plans .473 .006 .326
.029 .081 .013 .201 .003
Established incentives/rewards for identified
successors in the succession planning program .386 .482 .010 .029
.036 .015 .068 .007
Talent management .189 .014 .340 .081 .036 .007 .005 .277
Performance Management .022 .044 .427 .013 .015 .007 .008 .000
Training and Development .252 .230 .106 .201 .068 .005 .008 .000
Total Rewards Management .434 .211 .079 .003 .007 .277 .000 .000
a. Determinant = .435

Sampling adequacy for this variable was further measured and is shown in table. As shown in
the table below, the sampling adequacy indicated that KMO=0.539. This is above the
statically required minimum that should be 0.5. The level of significance of these findings
was justified Bartlett’s test of significant (P<0.005) which is what we would hope for.
Table 70: Sampling Adequacy for Strategic HRM Programs
KMO and Bartlett's Test
Kaiser-Meyer-Olkin Measure of Sampling Adequacy. .539
Bartlett's Test of Sphericity
Approx. Chi-Square 205.099
Df 36
Sig. .000
The Principle Component Analysis (PCA) was used for factor extraction on the 9 indicators
of strategic HRM programs variable. The communalities indicate that each question in this
case accounts for roughly 30-40% extra variability over and above the 60-70% of the
variability thats shared amongst all questions.
Table 71: Communalities for Strategic HRM Programs Indicators
Communalities
Initial Extraction
Established way of recruitment to forecast future talent needs 1.000 .621
Established means to compare individuals skills to the
requirements of a future position performance appraisal 1.000 .578
Tied succession planning program to training program 1.000 .628
Tied succession planning program to individual career plans 1.000 .524
Established incentives/rewards for identified successors in the
succession planning program 1.000 .669
Talent management 1.000 .625
Performance Management 1.000 .557
Training and Development 1.000 .670
Total Rewards Management 1.000 .735
Extraction Method: Principal Component Analysis.

140
The proportion of each variable’s variance under strategic HRM is explained by the principal
components as shown in the table below. As indicated in the output four components were extracted
under strategic HRM programs. Composition of these factors is shown as follows.
Table 72: Component Matrix for Strategic HRM Programs
Component Matrixa
Component
1 2 3 4
Established way of recruitment to forecast future talent needs .673
Established means to compare individuals skills to the
requirements of a future position performance appraisal .549 .411
Tied succession planning program to training program .728
Tied succession planning program to individual career plans .410 .494
Established incentives/rewards for identified successors in the
succession planning program .733
Talent management .424 .544
Performance Management .719
Training and Development .557 .550
Total Rewards Management .795
Extraction Method: Principal Component Analysis.
a. 4 components extracted.
The resulting factors that were extracted are presented in the next output as shown in table.
Ultimately, 4 factors were extracted which explain a total of 62.31% variability in the
strategic HRM programs. These four factors will be used in the subsequent regression
modelling.
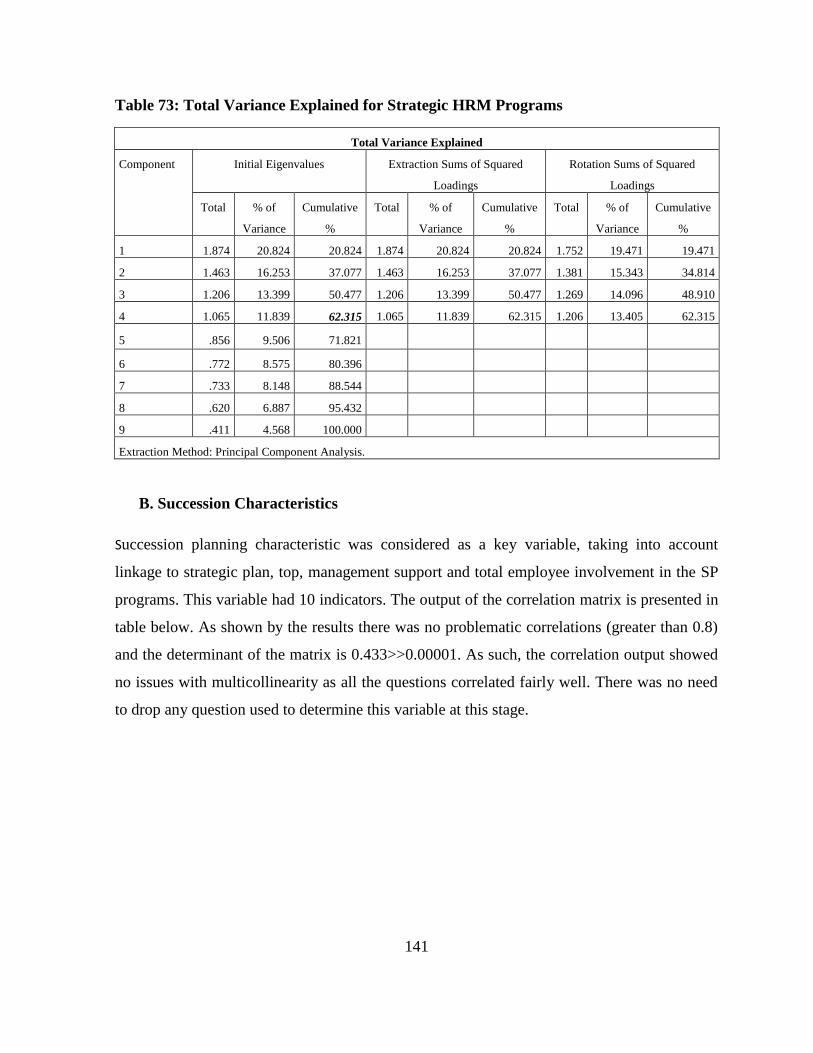
141
Table 73: Total Variance Explained for Strategic HRM Programs
Total Variance Explained
Component Initial Eigenvalues Extraction Sums of Squared
Loadings
Rotation Sums of Squared
Loadings
Total % of
Variance
Cumulative
%
Total % of
Variance
Cumulative
%
Total % of
Variance
Cumulative
%
1 1.874 20.824 20.824 1.874 20.824 20.824 1.752 19.471 19.471
2 1.463 16.253 37.077 1.463 16.253 37.077 1.381 15.343 34.814
3 1.206 13.399 50.477 1.206 13.399 50.477 1.269 14.096 48.910
4 1.065 11.839 62.315 1.065 11.839 62.315 1.206 13.405 62.315
5 .856 9.506 71.821
6 .772 8.575 80.396
7 .733 8.148 88.544
8 .620 6.887 95.432
9 .411 4.568 100.000
Extraction Method: Principal Component Analysis.
B. Succession Characteristics
Succession planning characteristic was considered as a key variable, taking into account
linkage to strategic plan, top, management support and total employee involvement in the SP
programs. This variable had 10 indicators. The output of the correlation matrix is presented in
table below. As shown by the results there was no problematic correlations (greater than 0.8)
and the determinant of the matrix is 0.433>>0.00001. As such, the correlation output showed
no issues with multicollinearity as all the questions correlated fairly well. There was no need
to drop any question used to determine this variable at this stage.
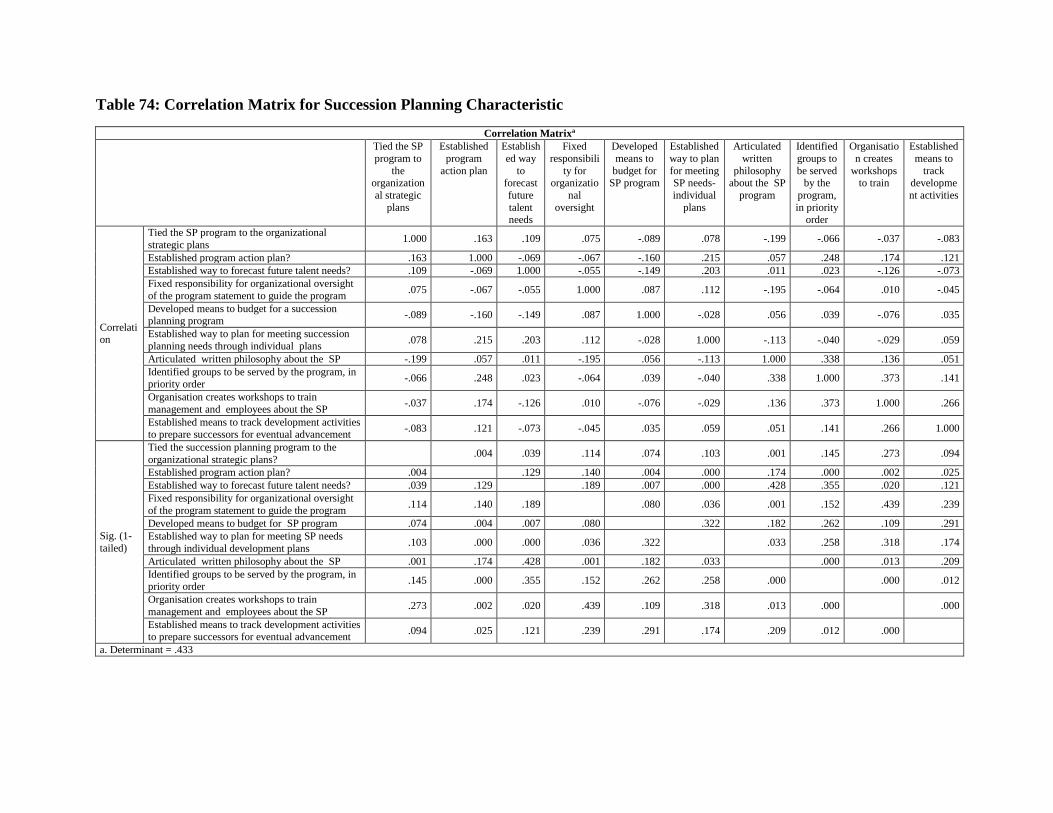
Table 74: Correlation Matrix for Succession Planning Characteristic
Correlation Matrixa
Tied the SP
program to
the organization
al strategic
plans
Established
program
action plan
Establish
ed way
to forecast
future
talent needs
Fixed
responsibili
ty for organizatio
nal
oversight
Developed
means to
budget for SP program
Established
way to plan
for meeting SP needs-
individual
plans
Articulated
written
philosophy about the SP
program
Identified
groups to
be served by the
program,
in priority order
Organisatio
n creates
workshops to train
Established
means to
track developme
nt activities
Correlation
Tied the SP program to the organizational
strategic plans 1.000 .163 .109 .075 -.089 .078 -.199 -.066 -.037 -.083
Established program action plan? .163 1.000 -.069 -.067 -.160 .215 .057 .248 .174 .121
Established way to forecast future talent needs? .109 -.069 1.000 -.055 -.149 .203 .011 .023 -.126 -.073
Fixed responsibility for organizational oversight
of the program statement to guide the program .075 -.067 -.055 1.000 .087 .112 -.195 -.064 .010 -.045
Developed means to budget for a succession planning program
-.089 -.160 -.149 .087 1.000 -.028 .056 .039 -.076 .035
Established way to plan for meeting succession
planning needs through individual plans .078 .215 .203 .112 -.028 1.000 -.113 -.040 -.029 .059
Articulated written philosophy about the SP -.199 .057 .011 -.195 .056 -.113 1.000 .338 .136 .051
Identified groups to be served by the program, in priority order
-.066 .248 .023 -.064 .039 -.040 .338 1.000 .373 .141
Organisation creates workshops to train
management and employees about the SP -.037 .174 -.126 .010 -.076 -.029 .136 .373 1.000 .266
Established means to track development activities to prepare successors for eventual advancement
-.083 .121 -.073 -.045 .035 .059 .051 .141 .266 1.000
Sig. (1-
tailed)
Tied the succession planning program to the
organizational strategic plans?
.004 .039 .114 .074 .103 .001 .145 .273 .094
Established program action plan? .004 .129 .140 .004 .000 .174 .000 .002 .025
Established way to forecast future talent needs? .039 .129 .189 .007 .000 .428 .355 .020 .121
Fixed responsibility for organizational oversight
of the program statement to guide the program .114 .140 .189
.080 .036 .001 .152 .439 .239
Developed means to budget for SP program .074 .004 .007 .080 .322 .182 .262 .109 .291
Established way to plan for meeting SP needs
through individual development plans .103 .000 .000 .036 .322
.033 .258 .318 .174
Articulated written philosophy about the SP .001 .174 .428 .001 .182 .033 .000 .013 .209
Identified groups to be served by the program, in priority order
.145 .000 .355 .152 .262 .258 .000
.000 .012
Organisation creates workshops to train
management and employees about the SP .273 .002 .020 .439 .109 .318 .013 .000
.000
Established means to track development activities to prepare successors for eventual advancement
.094 .025 .121 .239 .291 .174 .209 .012 .000
a. Determinant = .433
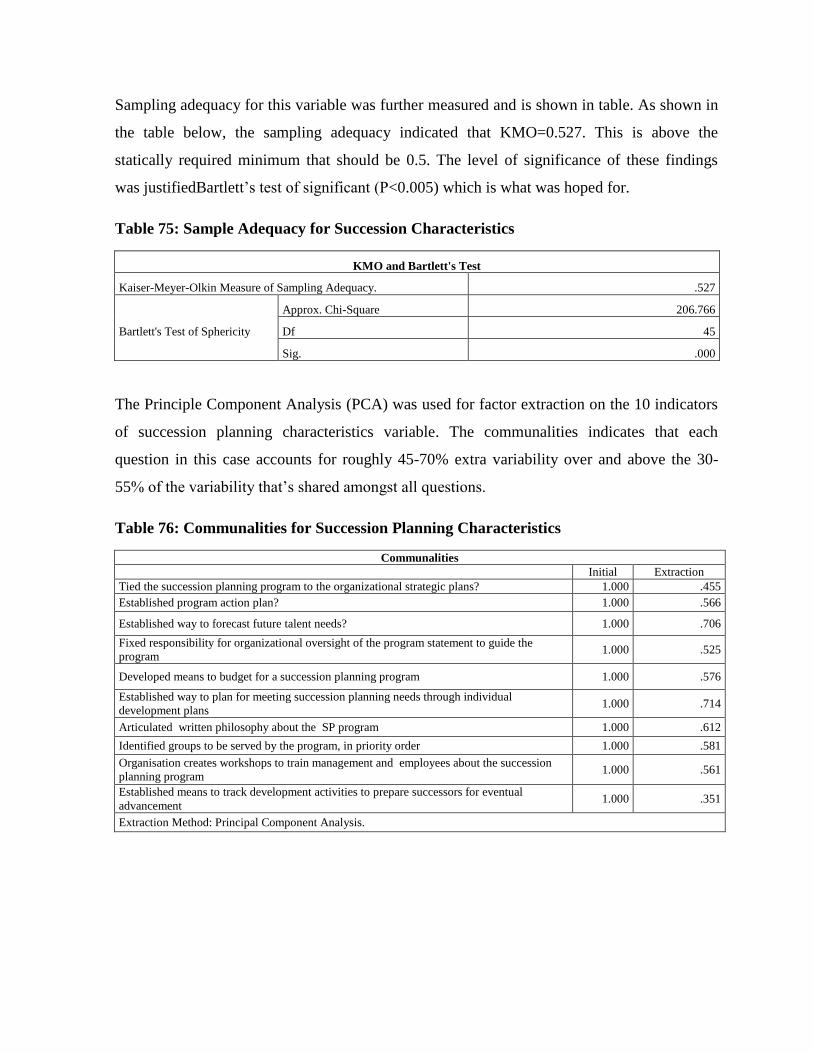
Sampling adequacy for this variable was further measured and is shown in table. As shown in
the table below, the sampling adequacy indicated that KMO=0.527. This is above the
statically required minimum that should be 0.5. The level of significance of these findings
was justifiedBartlett’s test of significant (P<0.005) which is what was hoped for.
Table 75: Sample Adequacy for Succession Characteristics
KMO and Bartlett's Test
Kaiser-Meyer-Olkin Measure of Sampling Adequacy. .527
Bartlett's Test of Sphericity
Approx. Chi-Square 206.766
Df 45
Sig. .000
The Principle Component Analysis (PCA) was used for factor extraction on the 10 indicators
of succession planning characteristics variable. The communalities indicates that each
question in this case accounts for roughly 45-70% extra variability over and above the 30-
55% of the variability that’s shared amongst all questions.
Table 76: Communalities for Succession Planning Characteristics
Communalities
Initial Extraction
Tied the succession planning program to the organizational strategic plans? 1.000 .455
Established program action plan? 1.000 .566
Established way to forecast future talent needs? 1.000 .706
Fixed responsibility for organizational oversight of the program statement to guide the
program 1.000 .525
Developed means to budget for a succession planning program 1.000 .576
Established way to plan for meeting succession planning needs through individual
development plans 1.000 .714
Articulated written philosophy about the SP program 1.000 .612
Identified groups to be served by the program, in priority order 1.000 .581
Organisation creates workshops to train management and employees about the succession
planning program 1.000 .561
Established means to track development activities to prepare successors for eventual
advancement 1.000 .351
Extraction Method: Principal Component Analysis.
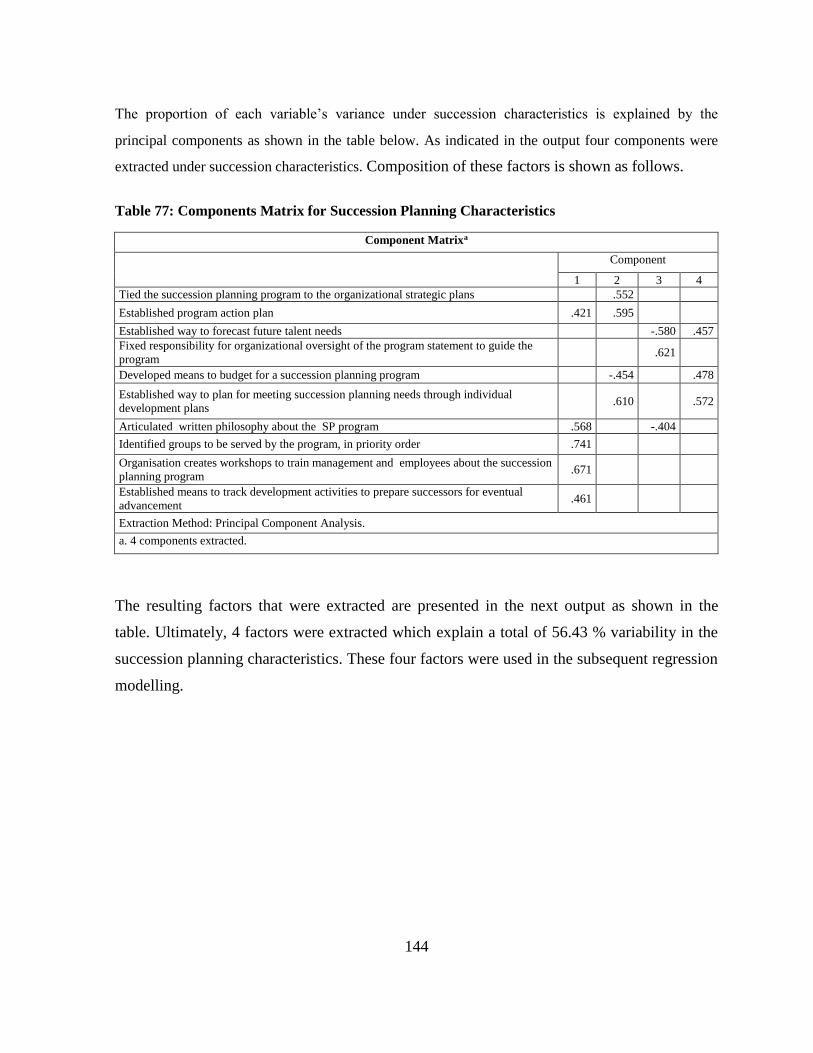
144
The proportion of each variable’s variance under succession characteristics is explained by the
principal components as shown in the table below. As indicated in the output four components were
extracted under succession characteristics. Composition of these factors is shown as follows.
Table 77: Components Matrix for Succession Planning Characteristics
Component Matrixa
Component
1 2 3 4
Tied the succession planning program to the organizational strategic plans .552
Established program action plan .421 .595
Established way to forecast future talent needs -.580 .457
Fixed responsibility for organizational oversight of the program statement to guide the
program .621
Developed means to budget for a succession planning program -.454 .478
Established way to plan for meeting succession planning needs through individual
development plans .610 .572
Articulated written philosophy about the SP program .568 -.404
Identified groups to be served by the program, in priority order .741
Organisation creates workshops to train management and employees about the succession
planning program .671
Established means to track development activities to prepare successors for eventual
advancement .461
Extraction Method: Principal Component Analysis.
a. 4 components extracted.
The resulting factors that were extracted are presented in the next output as shown in the
table. Ultimately, 4 factors were extracted which explain a total of 56.43 % variability in the
succession planning characteristics. These four factors were used in the subsequent regression
modelling.

145
Table 78: Total Variance Explained for Succession Characteristics
Total Variance Explained
Component Initial Eigenvalues Extraction Sums of Squared
Loadings
Rotation Sums of Squared
Loadings
Total % of
Variance
Cumulative
%
Total % of
Variance
Cumulative
%
Total % of
Variance
Cumulative
%
1 1.867 18.666 18.666 1.867 18.666 18.666 1.739 17.392 17.392
2 1.496 14.962 33.628 1.496 14.962 33.628 1.386 13.862 31.254
3 1.234 12.339 45.967 1.234 12.339 45.967 1.300 13.003 44.257
4 1.050 10.496 56.463 1.050 10.496 56.463 1.221 12.206 56.463
5 .959 9.588 66.051
6 .898 8.980 75.031
7 .825 8.252 83.284
8 .634 6.343 89.627
9 .578 5.784 95.411
10 .459 4.589 100.000
Extraction Method: Principal Component Analysis.
C. Periodic Assessment
The third variable of succession planning was periodic assessment as a method of providing
monitoring and evaluation mechanism for implementing succession planning. This variable
had 4 indicators. The output of the correlation matrix is presented in table below. As shown
by the results there was no problematic correlations (greater than 0.8) and the determinant of
the matrix is 0.734>>0.00001. As such, the correlation output showed no issues with
multicollinearity as all the questions correlated fairly well. There was no need to drop any
question used to determine this variable at this stage.
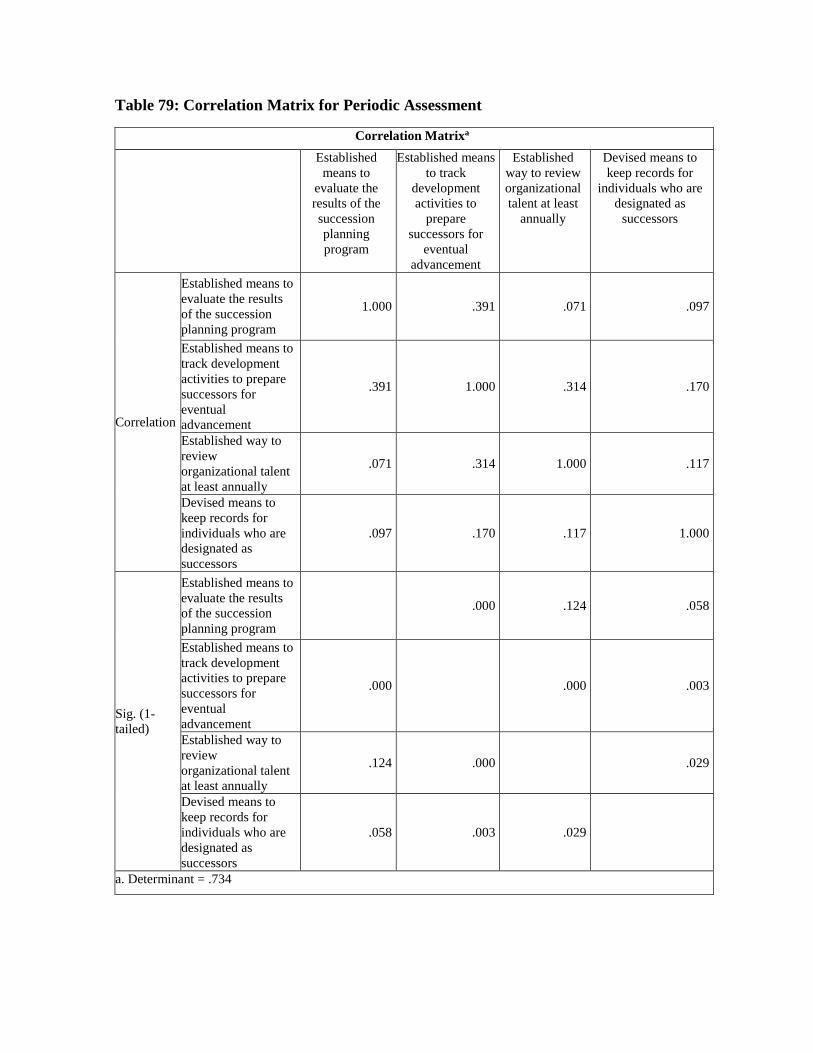
Table 79: Correlation Matrix for Periodic Assessment
Correlation Matrixa
Established
means to
evaluate the
results of the
succession
planning
program
Established means
to track
development
activities to
prepare
successors for
eventual
advancement
Established
way to review
organizational
talent at least
annually
Devised means to
keep records for
individuals who are
designated as
successors
Correlation
Established means to
evaluate the results
of the succession
planning program
1.000 .391 .071 .097
Established means to
track development
activities to prepare
successors for
eventual
advancement
.391 1.000 .314 .170
Established way to
review
organizational talent
at least annually
.071 .314 1.000 .117
Devised means to
keep records for
individuals who are
designated as
successors
.097 .170 .117 1.000
Sig. (1-
tailed)
Established means to
evaluate the results
of the succession
planning program
.000 .124 .058
Established means to
track development
activities to prepare
successors for
eventual
advancement
.000
.000 .003
Established way to
review
organizational talent
at least annually
.124 .000
.029
Devised means to
keep records for
individuals who are
designated as
successors
.058 .003 .029
a. Determinant = .734
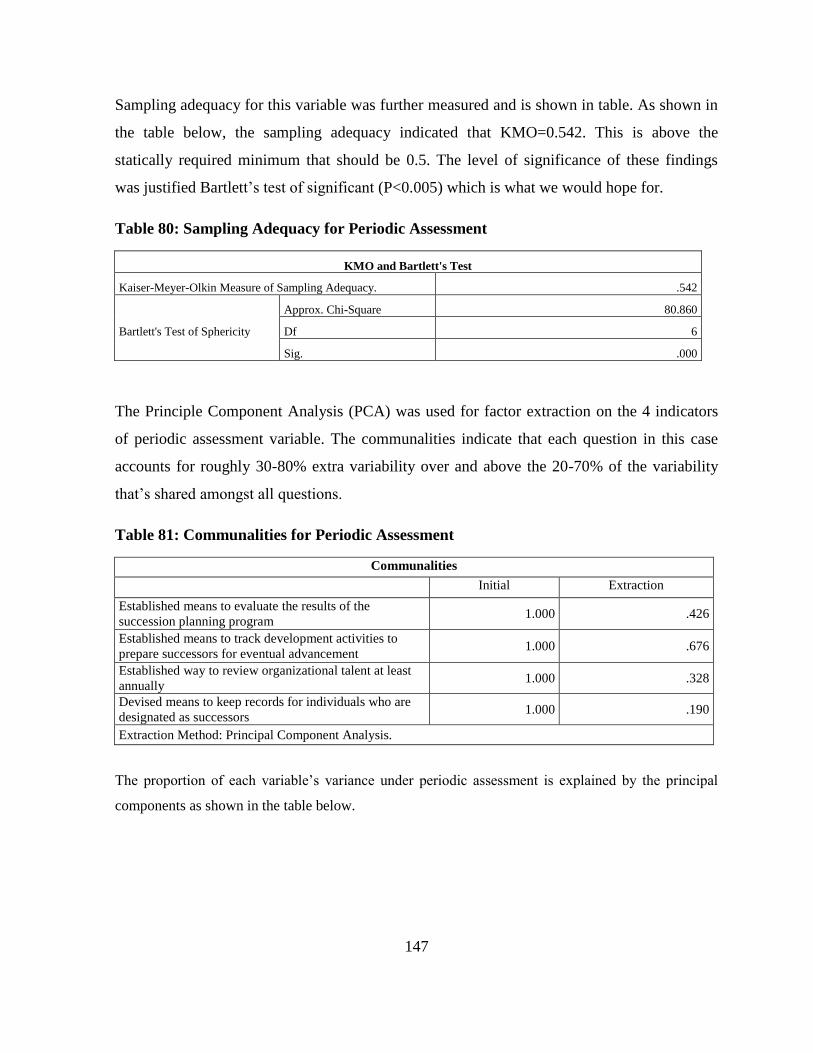
147
Sampling adequacy for this variable was further measured and is shown in table. As shown in
the table below, the sampling adequacy indicated that KMO=0.542. This is above the
statically required minimum that should be 0.5. The level of significance of these findings
was justified Bartlett’s test of significant (P<0.005) which is what we would hope for.
Table 80: Sampling Adequacy for Periodic Assessment
KMO and Bartlett's Test
Kaiser-Meyer-Olkin Measure of Sampling Adequacy. .542
Bartlett's Test of Sphericity
Approx. Chi-Square 80.860
Df 6
Sig. .000
The Principle Component Analysis (PCA) was used for factor extraction on the 4 indicators
of periodic assessment variable. The communalities indicate that each question in this case
accounts for roughly 30-80% extra variability over and above the 20-70% of the variability
that’s shared amongst all questions.
Table 81: Communalities for Periodic Assessment
Communalities
Initial Extraction
Established means to evaluate the results of the
succession planning program 1.000 .426
Established means to track development activities to
prepare successors for eventual advancement 1.000 .676
Established way to review organizational talent at least
annually 1.000 .328
Devised means to keep records for individuals who are
designated as successors 1.000 .190
Extraction Method: Principal Component Analysis.
The proportion of each variable’s variance under periodic assessment is explained by the principal
components as shown in the table below.
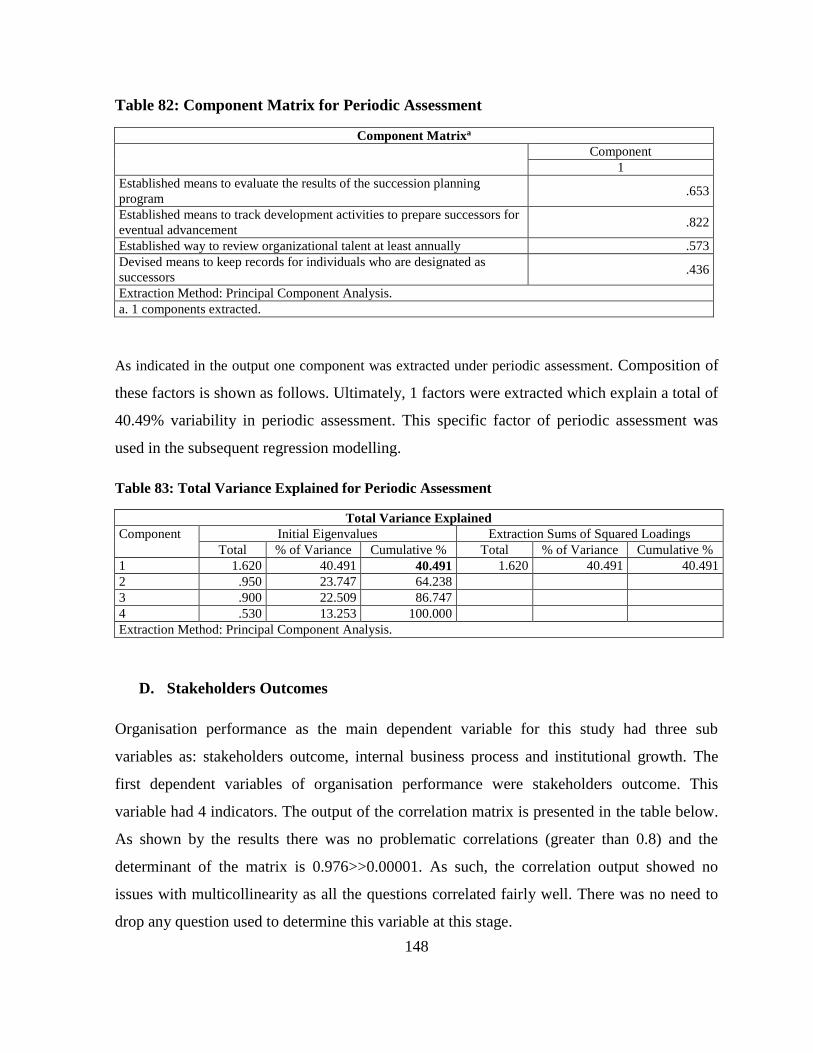
148
Table 82: Component Matrix for Periodic Assessment
Component Matrixa
Component
1
Established means to evaluate the results of the succession planning
program .653
Established means to track development activities to prepare successors for
eventual advancement .822
Established way to review organizational talent at least annually .573
Devised means to keep records for individuals who are designated as
successors .436
Extraction Method: Principal Component Analysis.
a. 1 components extracted.
As indicated in the output one component was extracted under periodic assessment. Composition of
these factors is shown as follows. Ultimately, 1 factors were extracted which explain a total of
40.49% variability in periodic assessment. This specific factor of periodic assessment was
used in the subsequent regression modelling.
Table 83: Total Variance Explained for Periodic Assessment
Total Variance Explained
Component Initial Eigenvalues Extraction Sums of Squared Loadings
Total % of Variance Cumulative % Total % of Variance Cumulative %
1 1.620 40.491 40.491 1.620 40.491 40.491
2 .950 23.747 64.238
3 .900 22.509 86.747
4 .530 13.253 100.000
Extraction Method: Principal Component Analysis.
D. Stakeholders Outcomes
Organisation performance as the main dependent variable for this study had three sub
variables as: stakeholders outcome, internal business process and institutional growth. The
first dependent variables of organisation performance were stakeholders outcome. This
variable had 4 indicators. The output of the correlation matrix is presented in the table below.
As shown by the results there was no problematic correlations (greater than 0.8) and the
determinant of the matrix is 0.976>>0.00001. As such, the correlation output showed no
issues with multicollinearity as all the questions correlated fairly well. There was no need to
drop any question used to determine this variable at this stage.
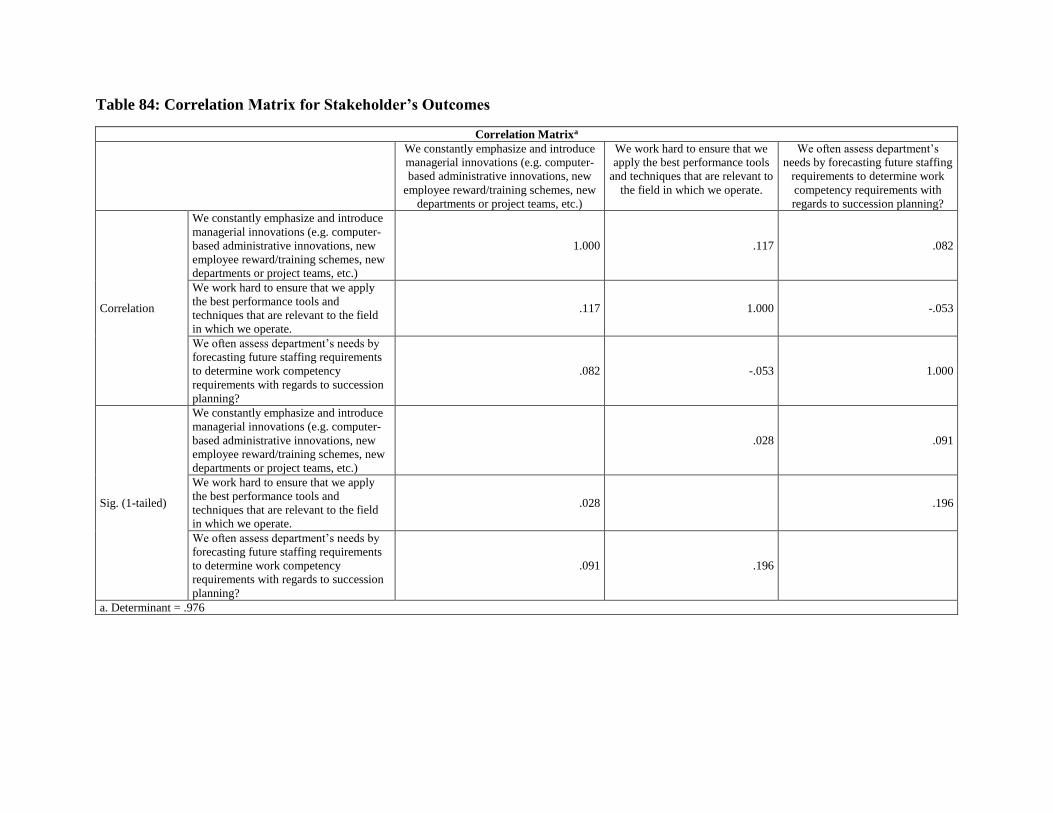
Table 84: Correlation Matrix for Stakeholder’s Outcomes
Correlation Matrixa
We constantly emphasize and introduce
managerial innovations (e.g. computer-
based administrative innovations, new
employee reward/training schemes, new
departments or project teams, etc.)
We work hard to ensure that we
apply the best performance tools
and techniques that are relevant to
the field in which we operate.
We often assess department’s
needs by forecasting future staffing
requirements to determine work
competency requirements with
regards to succession planning?
Correlation
We constantly emphasize and introduce
managerial innovations (e.g. computer-
based administrative innovations, new
employee reward/training schemes, new
departments or project teams, etc.)
1.000 .117 .082
We work hard to ensure that we apply
the best performance tools and
techniques that are relevant to the field
in which we operate.
.117 1.000 -.053
We often assess department’s needs by
forecasting future staffing requirements
to determine work competency
requirements with regards to succession
planning?
.082 -.053 1.000
Sig. (1-tailed)
We constantly emphasize and introduce
managerial innovations (e.g. computer-
based administrative innovations, new
employee reward/training schemes, new
departments or project teams, etc.)
.028 .091
We work hard to ensure that we apply
the best performance tools and
techniques that are relevant to the field
in which we operate.
.028
.196
We often assess department’s needs by
forecasting future staffing requirements
to determine work competency
requirements with regards to succession
planning?
.091 .196
a. Determinant = .976
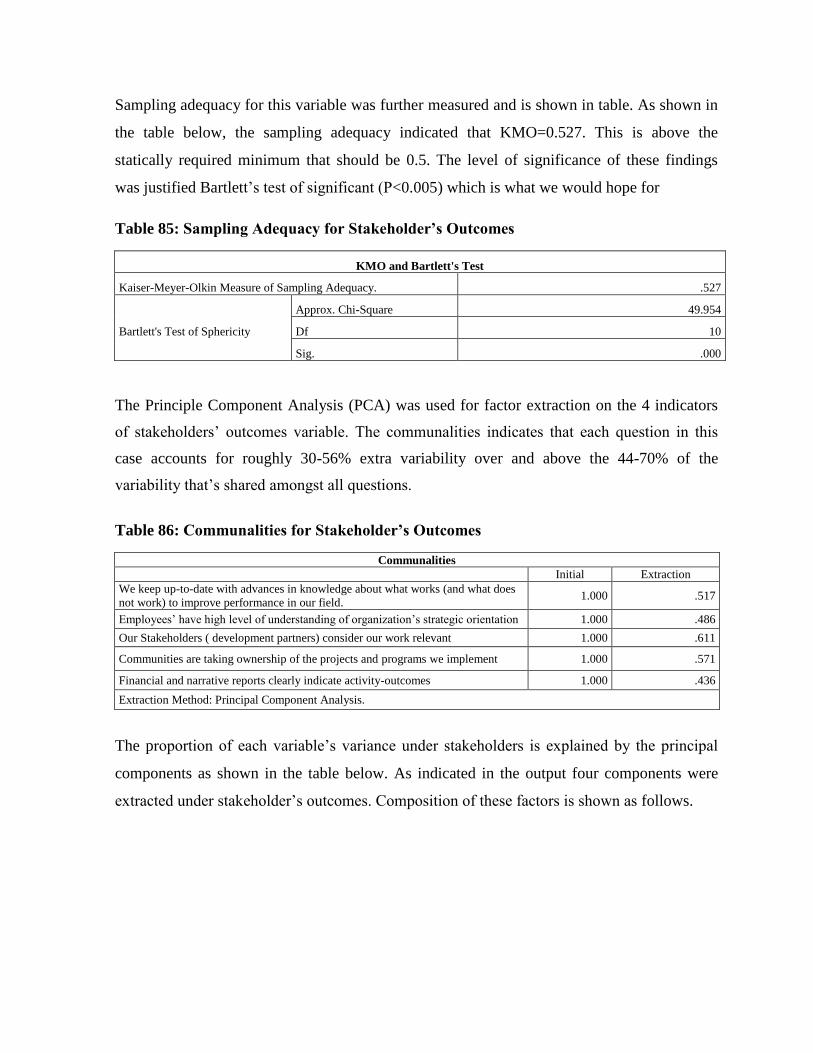
Sampling adequacy for this variable was further measured and is shown in table. As shown in
the table below, the sampling adequacy indicated that KMO=0.527. This is above the
statically required minimum that should be 0.5. The level of significance of these findings
was justified Bartlett’s test of significant (P<0.005) which is what we would hope for
Table 85: Sampling Adequacy for Stakeholder’s Outcomes
KMO and Bartlett's Test
Kaiser-Meyer-Olkin Measure of Sampling Adequacy. .527
Bartlett's Test of Sphericity
Approx. Chi-Square 49.954
Df 10
Sig. .000
The Principle Component Analysis (PCA) was used for factor extraction on the 4 indicators
of stakeholders’ outcomes variable. The communalities indicates that each question in this
case accounts for roughly 30-56% extra variability over and above the 44-70% of the
variability that’s shared amongst all questions.
Table 86: Communalities for Stakeholder’s Outcomes
Communalities
Initial Extraction
We keep up-to-date with advances in knowledge about what works (and what does
not work) to improve performance in our field. 1.000 .517
Employees’ have high level of understanding of organization’s strategic orientation 1.000 .486
Our Stakeholders ( development partners) consider our work relevant 1.000 .611
Communities are taking ownership of the projects and programs we implement 1.000 .571
Financial and narrative reports clearly indicate activity-outcomes 1.000 .436
Extraction Method: Principal Component Analysis.
The proportion of each variable’s variance under stakeholders is explained by the principal
components as shown in the table below. As indicated in the output four components were
extracted under stakeholder’s outcomes. Composition of these factors is shown as follows.

151
Table 87: Component Matrix for Stakeholder’s Outcomes
Component Matrixa
Component
1 2
We keep up-to-date with advances in knowledge about what works
(and what does not work) to improve performance in our field. .719
Employees’ have high level of understanding of organization’s
strategic orientation .569 .402
Our Stakeholders ( development partners) consider our work
relevant .737
Communities are taking ownership of the projects and programs we
implement .749
Financial and narrative reports clearly indicate activity-outcomes -.635
Extraction Method: Principal Component Analysis.
a. 2 components extracted.
The resulting factors that were extracted are presented in the next output as shown in table.
Ultimately, 2 factors were extracted which explain a total of 52.42 % variability in
stakeholders outcomes. These two factors were used in the subsequent regression modelling.
Table 88: Total Variance Explained for Stakeholders Outcomes
Total Variance Explained
Component Initial Eigenvalues Extraction Sums of Squared
Loadings
Rotation Sums of Squared
Loadings
Total % of
Variance
Cumulative
%
Total % of
Variance
Cumulative
%
Total % of
Variance
Cumulative
%
1 1.428 28.558 28.558 1.428 28.558 28.558 1.428 28.558 28.558
2 1.193 23.859 52.417 1.193 23.859 52.417 1.193 23.860 52.417
3 .937 18.750 71.167 4 .776 15.520 86.687 5 .666 13.313 100.000
Extraction Method: Principal Component Analysis.
E. Internal Business Processes
The second variable of organisation performance was internal business processes. This
variable had 4 indicators. The output of the correlation matrix is presented in table E1. As
shown by the results there were problematic correlations with (greater than 0.8) and the
determinant of the matrix is 0.976<<0.00001. As such, the correlation output showed issues
with multicollinearity as all the questions did not correlate fairly well. There was need to drop
question used to determine this variable at this stage.

Table 89: Correlation Matrix for Internal Business Process
Correlation Matrixa
We constantly emphasize and
introduce managerial innovations
(e.g. computer-based
administrative innovations, new
employee reward/training
schemes, new departments or
project teams, etc.)
We work hard to ensure
that we apply the best
performance tools and
techniques that are relevant
to the field in which we
operate.
We often assess department’s
needs by forecasting future
staffing requirements to
determine work competency
requirements with regards to
succession planning?
Correlation
We constantly emphasize and introduce managerial
innovations (e.g. computer-based administrative
innovations, new employee reward/training schemes,
new departments or project teams, etc.)
1.000 .117 .082
We work hard to ensure that we apply the best
performance tools and techniques that are relevant to
the field in which we operate.
.117 1.000 -.053
We often assess department’s needs by forecasting
future staffing requirements to determine work
competency requirements with regards to succession
planning?
.082 -.053 1.000
Sig. (1-tailed)
We constantly emphasize and introduce managerial
innovations (e.g. computer-based administrative
innovations, new employee reward/training schemes,
new departments or project teams, etc.)
.028 .091
We work hard to ensure that we apply the best
performance tools and techniques that are relevant to
the field in which we operate.
.028
.196
We often assess department’s needs by forecasting
future staffing requirements to determine work
competency requirements with regards to succession
planning?
.091 .196
a. Determinant = .976
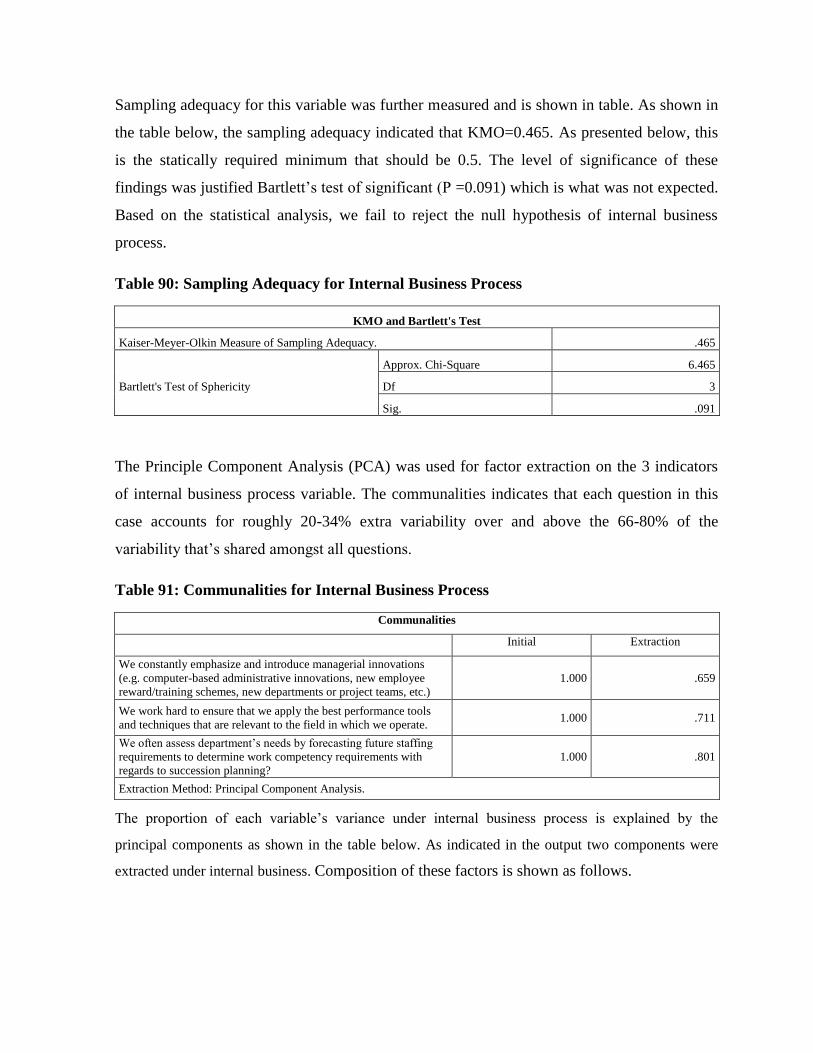
Sampling adequacy for this variable was further measured and is shown in table. As shown in
the table below, the sampling adequacy indicated that KMO=0.465. As presented below, this
is the statically required minimum that should be 0.5. The level of significance of these
findings was justified Bartlett’s test of significant (P =0.091) which is what was not expected.
Based on the statistical analysis, we fail to reject the null hypothesis of internal business
process.
Table 90: Sampling Adequacy for Internal Business Process
KMO and Bartlett's Test
Kaiser-Meyer-Olkin Measure of Sampling Adequacy. .465
Bartlett's Test of Sphericity
Approx. Chi-Square 6.465
Df 3
Sig. .091
The Principle Component Analysis (PCA) was used for factor extraction on the 3 indicators
of internal business process variable. The communalities indicates that each question in this
case accounts for roughly 20-34% extra variability over and above the 66-80% of the
variability that’s shared amongst all questions.
Table 91: Communalities for Internal Business Process
Communalities
Initial Extraction
We constantly emphasize and introduce managerial innovations
(e.g. computer-based administrative innovations, new employee
reward/training schemes, new departments or project teams, etc.)
1.000 .659
We work hard to ensure that we apply the best performance tools
and techniques that are relevant to the field in which we operate. 1.000 .711
We often assess department’s needs by forecasting future staffing
requirements to determine work competency requirements with
regards to succession planning?
1.000 .801
Extraction Method: Principal Component Analysis.
The proportion of each variable’s variance under internal business process is explained by the
principal components as shown in the table below. As indicated in the output two components were
extracted under internal business. Composition of these factors is shown as follows.
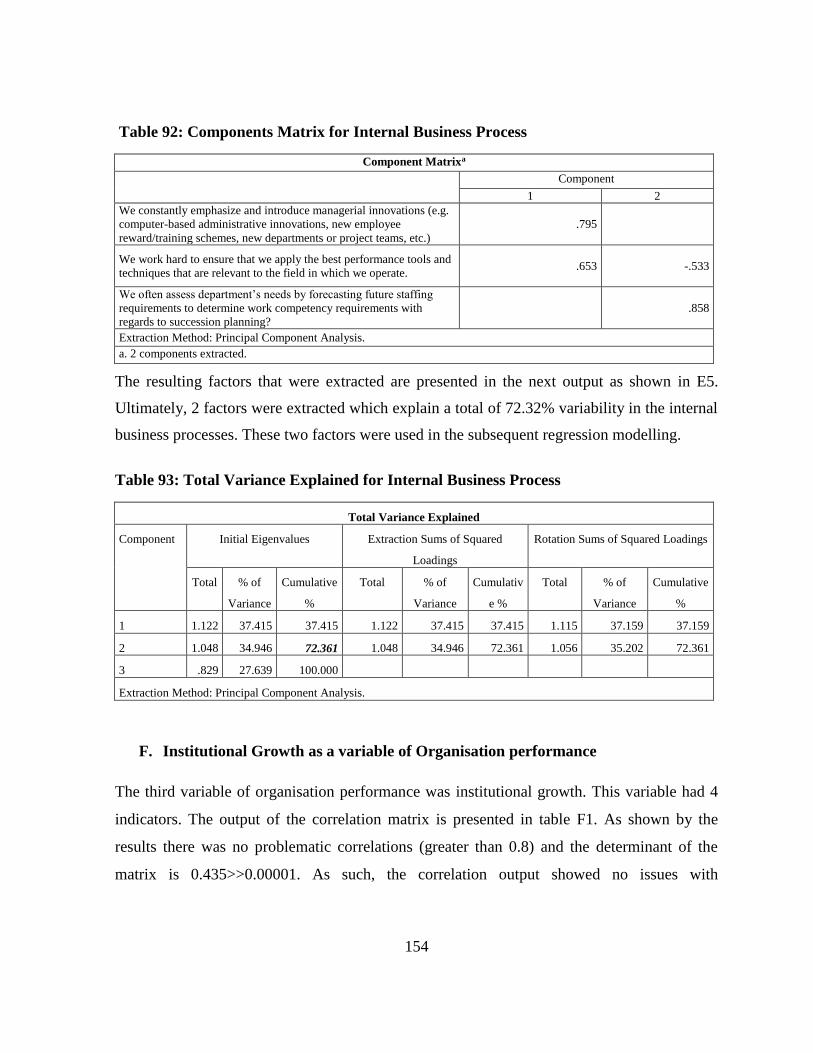
154
Table 92: Components Matrix for Internal Business Process
Component Matrixa
Component
1 2
We constantly emphasize and introduce managerial innovations (e.g.
computer-based administrative innovations, new employee
reward/training schemes, new departments or project teams, etc.)
.795
We work hard to ensure that we apply the best performance tools and
techniques that are relevant to the field in which we operate. .653 -.533
We often assess department’s needs by forecasting future staffing
requirements to determine work competency requirements with
regards to succession planning?
.858
Extraction Method: Principal Component Analysis.
a. 2 components extracted.
The resulting factors that were extracted are presented in the next output as shown in E5.
Ultimately, 2 factors were extracted which explain a total of 72.32% variability in the internal
business processes. These two factors were used in the subsequent regression modelling.
Table 93: Total Variance Explained for Internal Business Process
Total Variance Explained
Component Initial Eigenvalues Extraction Sums of Squared
Loadings
Rotation Sums of Squared Loadings
Total % of
Variance
Cumulative
%
Total % of
Variance
Cumulativ
e %
Total % of
Variance
Cumulative
%
1 1.122 37.415 37.415 1.122 37.415 37.415 1.115 37.159 37.159
2 1.048 34.946 72.361 1.048 34.946 72.361 1.056 35.202 72.361
3 .829 27.639 100.000
Extraction Method: Principal Component Analysis.
F. Institutional Growth as a variable of Organisation performance
The third variable of organisation performance was institutional growth. This variable had 4
indicators. The output of the correlation matrix is presented in table F1. As shown by the
results there was no problematic correlations (greater than 0.8) and the determinant of the
matrix is 0.435>>0.00001. As such, the correlation output showed no issues with

155
multicollinearity as all the questions correlated fairly well. There was no need to drop any
question used to determine this variable at this stage.
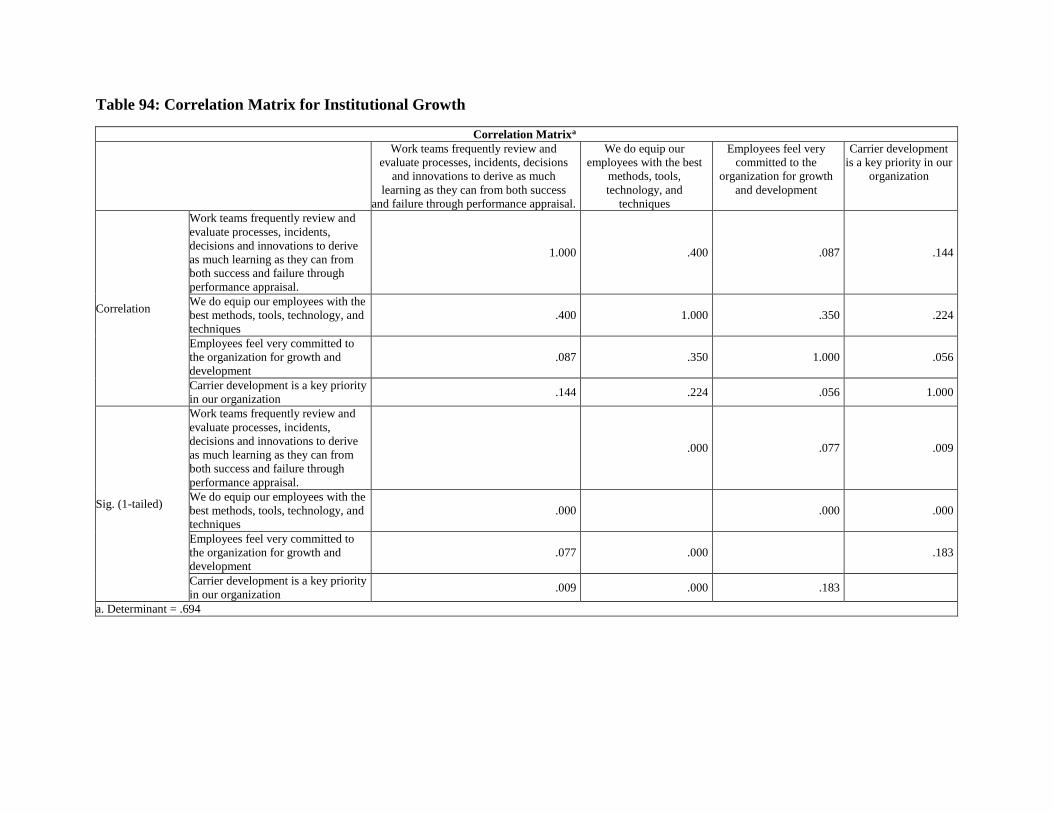
Table 94: Correlation Matrix for Institutional Growth
Correlation Matrixa
Work teams frequently review and
evaluate processes, incidents, decisions
and innovations to derive as much
learning as they can from both success
and failure through performance appraisal.
We do equip our
employees with the best
methods, tools,
technology, and
techniques
Employees feel very
committed to the
organization for growth
and development
Carrier development
is a key priority in our
organization
Correlation
Work teams frequently review and
evaluate processes, incidents,
decisions and innovations to derive
as much learning as they can from
both success and failure through
performance appraisal.
1.000 .400 .087 .144
We do equip our employees with the
best methods, tools, technology, and
techniques
.400 1.000 .350 .224
Employees feel very committed to
the organization for growth and
development
.087 .350 1.000 .056
Carrier development is a key priority
in our organization .144 .224 .056 1.000
Sig. (1-tailed)
Work teams frequently review and
evaluate processes, incidents,
decisions and innovations to derive
as much learning as they can from
both success and failure through
performance appraisal.
.000 .077 .009
We do equip our employees with the
best methods, tools, technology, and
techniques
.000
.000 .000
Employees feel very committed to
the organization for growth and
development
.077 .000
.183
Carrier development is a key priority
in our organization .009 .000 .183
a. Determinant = .694
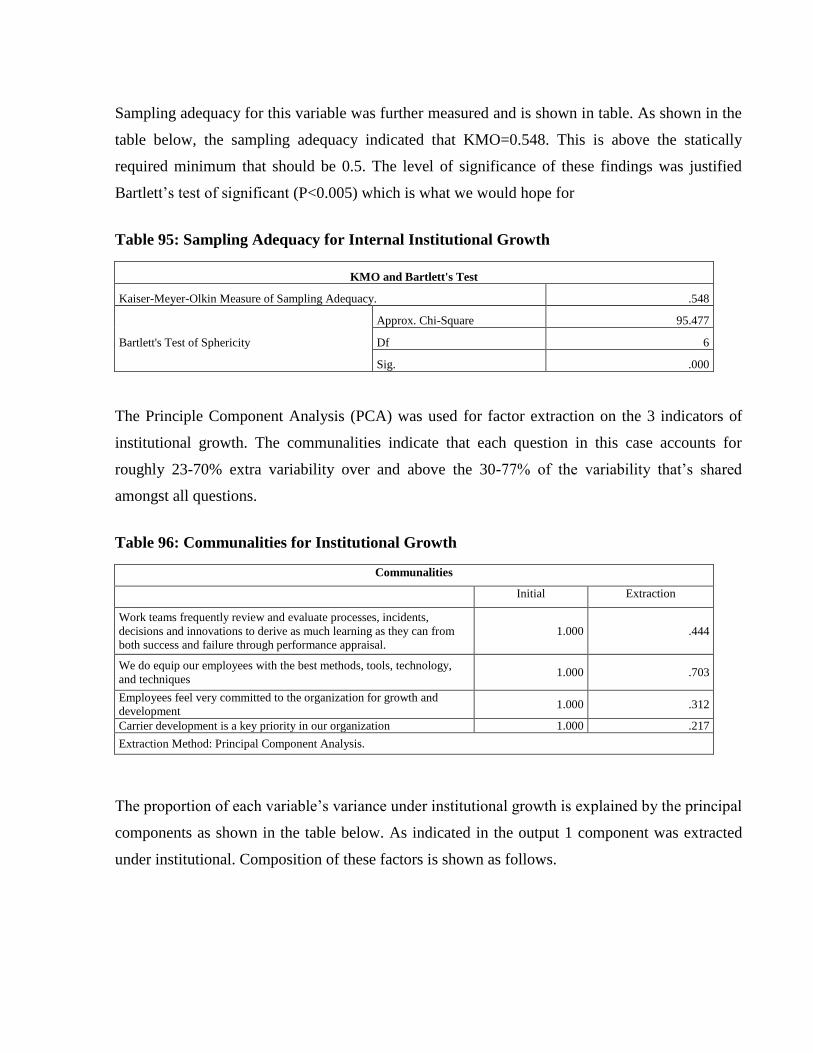
Sampling adequacy for this variable was further measured and is shown in table. As shown in the
table below, the sampling adequacy indicated that KMO=0.548. This is above the statically
required minimum that should be 0.5. The level of significance of these findings was justified
Bartlett’s test of significant (P<0.005) which is what we would hope for
Table 95: Sampling Adequacy for Internal Institutional Growth
KMO and Bartlett's Test
Kaiser-Meyer-Olkin Measure of Sampling Adequacy. .548
Bartlett's Test of Sphericity
Approx. Chi-Square 95.477
Df 6
Sig. .000
The Principle Component Analysis (PCA) was used for factor extraction on the 3 indicators of
institutional growth. The communalities indicate that each question in this case accounts for
roughly 23-70% extra variability over and above the 30-77% of the variability that’s shared
amongst all questions.
Table 96: Communalities for Institutional Growth
Communalities
Initial Extraction
Work teams frequently review and evaluate processes, incidents,
decisions and innovations to derive as much learning as they can from
both success and failure through performance appraisal.
1.000 .444
We do equip our employees with the best methods, tools, technology,
and techniques 1.000 .703
Employees feel very committed to the organization for growth and
development 1.000 .312
Carrier development is a key priority in our organization 1.000 .217
Extraction Method: Principal Component Analysis.
The proportion of each variable’s variance under institutional growth is explained by the principal
components as shown in the table below. As indicated in the output 1 component was extracted
under institutional. Composition of these factors is shown as follows.

158
Table 97: Component Matrix for Institutional Growth
Component Matrixa
Component
1
Work teams frequently review and evaluate processes, incidents, decisions and
innovations to derive as much learning as they can from both success and failure through
performance appraisal.
.667
We do equip our employees with the best methods, tools, technology, and techniques .838
Employees feel very committed to the organization for growth and development .559
Carrier development is a key priority in our organization .466
Extraction Method: Principal Component Analysis.
a. 1 components extracted.
The resulting factors that were extracted are presented in the next output as shown in table.
Ultimately, 1 factors were extracted which explain a total of 41.91% variability in the institutional
growth. These four factors will be used in the subsequent regression modelling
Table 98: Total variance explained for institutional growth
Total Variance Explained
Component Initial Eigenvalues Extraction Sums of Squared Loadings
Total % of Variance Cumulative % Total % of Variance Cumulative %
1 1.676 41.906 41.906 1.676 41.906 41.906
2 .965 24.119 66.025
3 .859 21.480 87.505
4 .500 12.495 100.000
Extraction Method: Principal Component Analysis.

159
APPENDIX 3: JOURNAL PUBLICATIONS
.