effects of operations and innovation strategy fit on
TRANSCRIPT
EFFECTS OF OPERATIONS AND INNOVATION STRATEGY FIT ON
COMPANY PERFORMANCE
by
JAMES EDWARD BROWN
Presented to the Faculty of the Graduate School of
The University of Texas at Arlington in Partial Fulfillment
of the Requirements
for the Degree of
DOCTOR OF PHILOSOPHY
THE UNIVERSITY OF TEXAS AT ARLINGTON
December 2014

ii
Copyright © by James Edward Brown 2014
All Rights Reserved

iii
Acknowledgements
“Every problem has a solution. You may not see the path to your goal, but there
is a path. Like climbing mountains… it's about staying focused on the summit. No one
ever climbs a mountain to get to the middle. You don't focus on the difficulties; you take it
one step at a time knowing you're going to get to the top,” Jim Koch, co-founder and
chairman of the Boston Beer Company.
This PhD program has been a long road filled with disappointments, sadness, but
now finally joy. The list of thanks is long, but first glory and thanks goes to God, for his
continued blessing in school, work, and life. All good things come from God, and through
my faith in Him, I am finally at the end of this journey. God has sent people into my life
that offered encouragement and direction. The first of these is my wife Teri. Without her,
my life would be empty and without direction. She has always been my inspiration, my
rock, my biggest supporter, and she always helped me see the big picture and focus on
our dreams we sent in motion long ago. Many times when I have wanted to quit, she
encouraged me to try one more time to get past whatever roadblock it was that seemed
insurmountable. Her gentle (and sometimes not so gentle) words would get me back on
track and focused on the end goal. Although I tried my best to balance her needs with
school and work, I know that she has not had all of the time and attention that she
deserves. The chores she picked up, the times we didn’t go out, and the vacations we
missed while going through this has left a debt that I hope to one day repay.
I have lost many close to me that I hope are looking down on me and sharing in
my joy at this accomplishment. I miss them all and thank them for their support in this life
and beyond. You are always in my heart and in my prayers.
Finally, I would like to thank all of my professors who directed me and fought for
me behind the scenes. You do not become the longest running PhD student without the

iv
support of many faculty members. Dr. Prater, I will probably never know the amount of
lobbying and covering you did for me to keep me enrolled. Without your help and
encouragement, I would have been out of the program long, long ago. Thank you very
much. Dr. Eakin , Dr. Nerur, and Dr. Frazier thank you for your guidance and
encouragement and help through my dissertation
October 20, 2014

v
Abstract
EFFECTS OF OPERATIONS AND INNOVATION STRATEGY FIT ON
COMPANY PERFORMANCE
James Edward Brown, PhD
The University of Texas at Arlington, 2014
Supervising Professor: Edmund Prater
For a company to survive long-term, it must be able to innovate and develop new
products and services. There are two types of broad innovation classifications:
exploration and exploitation. These two types of innovation require different resources,
have different risks, and have different time horizons for the company to receive the
benefits. Operations strategies impact the type and quantity of resources available. The
concept of fit has been used to match operations strategy and corporate strategy. This
dissertation will extend this concept to the relationship between innovation strategy and
operations strategy.
Building on The Resource Based View and Punctuated Equilibrium, hypotheses
were developed and tested using cluster analysis, ANOVA, and linear regression with
data from companies in the disposable medical device industry. Results were mixed with
some hypotheses not having any support and some hypotheses having very strong
statistical significance. The results suggest there is a minimum threshold of innovation
mix and efficiency and takes the form of an efficiency frontier instead of a narrow band of
fit as hypothesized. Also, the results show that the size of the company affects the
relationship between fit and company performance.

vi
Table of Contents
Acknowledgements ............................................................................................................. iii
Abstract ............................................................................................................................... v
List of Illustrations .............................................................................................................. ix
List of Tables ...................................................................................................................... xi
Chapter 1 Introduction ......................................................................................................... 1
Chapter 2 Literature Review ............................................................................................... 9
2.1 Punctuated Equilibrium ............................................................................................. 9
2.2 Resource Based View and Dynamic Capabilities .................................................. 15
2.3 Efficient/Performance Frontiers .............................................................................. 22
2.4 Corporate Strategy ................................................................................................. 23
2.5 Modes of Innovation ............................................................................................... 23
2.5.1. What is Innovation? ........................................................................................ 23
2.5.2. Exploration ...................................................................................................... 25
2.5.3. Exploitation ..................................................................................................... 27
2.5.4. Ambidexterity .................................................................................................. 28
2.5.5. Necessary and Sufficient Conditions for Innovation ....................................... 33
2.5.6. Summary ........................................................................................................ 34
2.6 Organizational Learning ......................................................................................... 36
2.6.1. Internal Learning............................................................................................. 36
2.6.2. External Learning ........................................................................................... 37
2.7 Operations Strategy ................................................................................................ 38
2.8 Process Management Effects on Innovation .......................................................... 41
2.9 Fit ............................................................................................................................ 46
2.10 Surviving a Changing Environment ...................................................................... 51

vii
2.11 How Networks Help Innovation ............................................................................ 52
Chapter 3 Model ................................................................................................................ 54
Chapter 4 Analysis / Methodology .................................................................................... 62
4.1 Industry and Company Selection ............................................................................ 62
4.2 Data Sources .......................................................................................................... 62
4.3 Variables ................................................................................................................. 64
4.3.1 Innovation ....................................................................................................... 64
4.3.2 Value .............................................................................................................. 65
4.3.3 Resources ...................................................................................................... 66
4.3.4 Efficiency ........................................................................................................ 66
4.3.5 Fit Variables .................................................................................................... 67
4.4 Analysis and Results .............................................................................................. 70
4.4.1 Dataset Review ............................................................................................... 70
4.4.2 Cluster Analysis ............................................................................................... 74
4.4.2.1 Hypotheses Testing ................................................................................. 83
4.4.2.1.1 H1a: µ fit=good > µ fit = bad above; H1b: µ fit=good >
µ fit = bad below ............................................................................................ 84
4.4.2.1.2 H2: The Relationship Between Fit and Performance
Will Be Positively Moderated by a Company’s Resources ............................ 87
4.4.3 Quartiles Analysis ............................................................................................ 88
4.4.3.1 Hypothesis 1 ............................................................................................ 88
4.4.3.2 Hypothesis 2 ............................................................................................ 89
4.4.3.3 Hypothesis 3 ............................................................................................ 91
4.4.4 Regression Analysis ........................................................................................ 92
Chapter 5 Conclusions and Discussion ............................................................................ 95
viii
5.1 H1: Operations and Innovation Strategy Fit Effect on Performance .................... 98
5.2 H2: The Relationship Between Fit and Performance Will Be Positively
Moderated by a Company’s Resources ....................................................................... 99
5.3 H3: Companies with Higher Ambidexterity Will Have Better
Performance ............................................................................................................... 100
Chapter 6 Conclusions and Recommendations ............................................................. 101
6.1 Contributions of this Study .................................................................................... 101
6.2 Limitations of this Study ........................................................................................ 102
6.3 Conclusions .......................................................................................................... 103
6.4 Recommendations for Future Research .............................................................. 104
6.5 Synopsis ............................................................................................................... 105
Chapter 7 Post Hoc Analysis .......................................................................................... 106
References ...................................................................................................................... 112
Biographical Information ................................................................................................. 122

ix
List of Illustrations
Figure 1-1 Innovation Research in Operations .................................................................. 2
Figure 1-2 Strategic Decision Relationship ......................................................................... 6
Figure 2-1 Resource Based View (Grant, R. M., 1991) .................................................... 17
Figure 2-2 Unique Resources Build Competitive Advantage (Grant, R. M., 1991) ......... 22
Figure 2-3 Technology and Customer Competencies (Danneels, 2002) ......................... 40
Figure 2-4 Internal / External Focus (Venkatraman and Camillus, 1984) pg 516............. 48
Figure 3-1 Model of Fit (Stock and Tatikonda, 2008) ....................................................... 55
Figure 3-2 Operations Strategy Model .............................................................................. 56
Figure 3-3 Model for H1 and H2 ...................................................................................... 58
Figure 3-4 Model for H3 ................................................................................................... 61
Figure 4-1 Efficiency vs. Originality ................................................................................... 71
Figure 4-2 Revenue per Company (CUSIP Number) ....................................................... 72
Figure 4-3 Revenue per Year per Company ..................................................................... 72
Figure 4-4 Tobin’s Q per Year ......................................................................................... 73
Figure 4-5 BIC Values ...................................................................................................... 77
Figure 4-6 Cluster Analysis .............................................................................................. 78
Figure 4-7 BIC Values with 0’s Included .......................................................................... 79
Figure 4-8 Clusters with 0’s Included ................................................................................ 79
Figure 4-9 BIC Values without 0’s ..................................................................................... 80
Figure 4-10 Clusters without 0’s ...................................................................................... 80
Figure 4-11 BIC Values with no 0’s or 1’s ........................................................................ 81
Figure 4-12 Clusters with no 0’s or 1’s .............................................................................. 82
Figure 4-13 Theoretical Grouping of Clusters ................................................................... 83
Figure 4-14 Interaction Effects .......................................................................................... 90

x
Figure 5-1 Possible Efficiency Frontier ............................................................................. 99

xi
List of Tables
Table 4-1 Variable Definition ............................................................................................. 69
Table 4-2 Parameters of Covariance Matrix ..................................................................... 76
Table 4-3 Tukey Results for Hypothesis 1 ....................................................................... 85
Table 4-4 Hypotheses H1a and H1b Results .................................................................. 86
Table 4-5 H2 Results ....................................................................................................... 87
Table 4-6 Quartiles for Analysis ........................................................................................ 88
Table 4-7 H1 Using Quartiles ............................................................................................ 89
Table 4-8 H2 Using Quartiles ........................................................................................... 90
Table 4-9 H3 Quartile Results .......................................................................................... 91
Table 4-10 H1 Regression Results .................................................................................. 93
Table 4-11 H2 Regression Results ................................................................................... 94
Table 5-1 Cluster Analysis Results ................................................................................... 95
Table 5-2 Quartile Analysis Results ................................................................................. 96
Table 5-3 Regression Analysis Results ............................................................................ 97
Table 7-1 Independent Variables for Post-Hoc Analysis ............................................... 107
Table 7-2 Stepwise Regression with Revenue per Employee as Response ................. 108
Table 7-3 Stepwise Regression with Tobin’s Q as Response ....................................... 109
Table 7-4 Stepwise Regression with Only Forward Looking Variables ......................... 110

1
Chapter 1
Introduction
Given that innovation, new product development, and entrepreneurship are
critical components of success for companies and the economy as a whole, how does a
company use and integrate these issues in their daily operations in order to succeed?
Innovation and development of new products and services are critical for the company’s
long-term survival (Cash, Earl, and Morison, 2008); for long-term competitiveness,
companies in capitalist economies must have innovation portfolios that build on its
existing technical trajectory offering improved products or opening new markets to their
existing products (Abernathy and Clark, 1985; Eisenhardt and Tabrizi, 1995; Teece and
Pisano, 1994; Tushman and O’Reilly, 1997; Tushman, et. al. 2002; Zander and Kogut,
1995)
The topics of new product development and innovation have traditionally been
researched in the management, marketing, and strategy literature but have not received
as much attention in the operations management literature. A search for several key
word combinations such as innovation, exploration, and exploitation in operations
journals shows the lack of research attention in the top Operations Management journals
(Figure 1-1) with a peak in research in 2007 and 2008 of 14 and 15 articles respectively.
While from a practical perspective the field of Operations Management is where
innovation becomes a viable market offering through conversion of a company’s
resources, it has not given innovation and new product development the attention that
other academic disciplines have provided. The goal of this thesis is to begin to outline
how the decisions made in operations of a company affect the success of the innovation
program.

2
Figure 1-1 Innovation Research in Operations
.
In the business function of operations management, companies have many
operational strategy decisions to make so that the operations strategy aligns with the
overall corporate strategy and the conversion of resources to product and services create
the greatest competitive advantage. Operations strategy decisions fall into two major
categories. One is the “bricks and mortar” decisions and the other is the infrastructure
and organization (Hayes and Wheelwright, 1984). Some examples of bricks and mortar
decisions are determining plant size and location, plant layout, and equipment selections
(Hayes and Wheelwright, 1984). Decisions on the management side include, among
others, vendor relations that are either market based (i.e., transactional or one-off
relationships) or partnerships, quality programs, which process management techniques
to use, product development, and workforce development (Swink, Narasimhan, and Kim,
2005). Traditionally, the primary drivers of these decisions are financial, service levels,
and risk tolerance.
3
As with many functional decisions, the decisions made in operations strategy
directly affect other areas of the organization. Large expenditures on capital equipment
can reduce the flexibility of the company to pursue other opportunities by either tying up
the needed capital or forcing the company to only look at products that can be made
utilizing the current and expensive assets (Christensen, Kaufman, and Shih, 2008).
Research into new product development and innovation suggest that the need
for slack resources (Ahuja and Lahiri, 2006), identification of a market need, and a
perceived shortcoming between the desired performance in the market and actual
performance are primary drivers of the innovation process. Many of the strategies that
are popular in operations management focus on either reducing slack in the systems or
changing how companies interact with the markets, suppliers, and customers. Also of
importance is what happens to the company if there is a radical shift in the market: i.e.
how does the operations strategy decision affect the company’s ability to react to
changes in the competitive environment? Asset specificity, process optimization, and
supplier relationships can set the stage for how the company will react to a market
disruption. For example these decisions affect how fast the company identifies the shift
and the options it has to react to that shift. Many operations strategies are made for
steady state long-term production focusing on reducing variation, costs, and wastes.
Unfortunately the punctuated equilibrium model predicts relative steady state calm
periods where there are minor changes leading up to a radical shift due to a major
change in the environment. In a business view, this relates to incremental improvement
in products and services that continue along a trajectory until a disruptive technology or
business model emerges that dramatically changes the industry (Gersick, 1991).
The innovation literature classifies innovations into three categories These are
classified as exploration and exploitation (March, 1991) or ambidexterity (Duncan, 1976;
4
Tushman and O’Reilly, 1997; O’Reillly and Tushman, 2008). “Exploitation is about
efficiency, increasing productivity, control, certainty, and variance reduction. Exploration
is about search, discovery, autonomy, innovation and embracing variation. Exploitative
innovation is the incremental improvement of current products and services. In the
punctuated equilibrium model, this relates to the equilibrium phase of evolution.
Exploratory innovation is the radical change from existing products and services that is
not closely related to anything currently existing. This disruptive technology is the event
that breaks the industry out of the steady state and causes extinction of existing
organisms as in the punctuated equilibrium model. Ambidexterity is about doing both. In
March’s terms, this is the fundamental tension at the heart of an enterprise’s long-run
survival,” (O'Reilly and Tushman, 2008).
Exploration is the cutting edge, new technologies that are often disruptive and
greatly surpass current products. Exploitative products are often innovated by an
iterative process where new products are based on existing products, but offer different
features or have improvements that allow it to be made more inexpensively or to improve
its quality. Other modes of exploitative research is to apply existing technology in new
fields, new markets, or new applications. Over the long-term, companies need to have
both types of innovation either created in-house or licensed or purchased from another
company. Companies can approach innovation and new product development from two
different strategies. The development can be done in-house with full control of the
company or the company can acquire innovations from outside the company by buying
other company’s patents, acquisitions of external companies and associated product
lines and technology, or by contracting the design and development to a 3rd party design
firm. This dissertation is looking at the concept of fit between operations strategy and
innovation strategy, therefore to test the effects of that fit this dissertation will focus on

5
only the in-house development of innovations. Some firms excel at both types of
innovations, some excel at one or the other, and some do neither well. There has been
much debate on whether the two extremes of innovation, exploration and exploitation, are
mutually exclusive, or if there is a mix that gives the best of both worlds.
For a company to be successful financially in the long term, the decisions made
by management at multiple levels must be aligned to an overarching strategy set forward
by the executive leadership team (ELT). Figure 1-2 shows the flow of strategic decisions
and influences of these decisions on other parts of the firm and demonstrates how
decisions made affect later decisions. The long-term strategic decision of the company
as a whole influences what will be the primary innovation mode. Depending on how well
the strategic fit is between the various drivers (ex. innovation strategy, the resources of
the company, the operations strategy, corporate learning ability, and the match between
operations and innovations) strategy will determine if the company performs better
financially.

6
Figure 1-2 Strategic Decision Relationship
How can operations contribute to the successful development of innovation, new
product development and new entrepreneurial ventures? This dissertation will examine
the existing literature on these subjects from strategic management and operations to
develop a model for operations strategy decisions that will positively affect the innovation
process and ultimately successful financial outcome of the firm. It will be hypothesized
that operations decisions affect the long-term success of a firm’s innovation and that the
decisions of innovation create a path dependency that affects the future success of
innovations.
A review of existing literature on innovation has found several weaknesses in
current understanding of innovation. There is also a surprising lack of research in the
relationship between innovation and operations strategy. The concept of fit between

7
operations and other disciplines such as finance and marketing have been researched,
but few on innovation and operations. One of the main issues found by other
researchers is the lack of longitudinal studies. Gupta, Smith, and Shalley (2006)
identified the lack of longitudinal studies on how companies balance exploitation and
exploration over the long term and if the market conditions and environment dictate the
choice of innovation strategy. Raisch, Birkinshaw, Probst, and Tushman (2009) followed
up the work of Gupta, Smith, and Shalley to examine innovation ambidexterity and still
found a lack of longitudinal studies on ambidexterity success. Menora, Mohan, and
Samsonc (2002) called for more empirical work investigating the development process of
exploration, exploitation, and ambidexterity. Finally, there are still gaps in how
manufacturing and operations strategy affect firm performance over time (Bozarth and
McDermott, 1998; Kathuria and Porth, 2003; Kroes & Ghosh, 2010). This dissertation will
attempt to fill in some of these gaps. First, the contribution of this dissertation to the
operations strategy literature is to lay out how innovation strategies decisions can impact
the success the innovation strategy decisions of the company. This dissertation
proposes a testable construct of innovations-operations fit that seeks to determine if the
alignment between these two strategies affect company performance. In contribution to
the innovation literature, this dissertation looks at over 30 years of data from the
disposable medical device industry to investigate the success of exploration, exploitation,
and ambidexterity over different economic conditions and levels of market uncertainty.
The remainder of the dissertation is structured as follows. Chapter 2 will review
literature from the fields of corporate strategy, innovation, organizational learning, the
Resourced Based View of the firm, opearations strategy, and process management.
Chapter 3 develops the research model based on literature and develop hypotheses.
Chapter 4 presents the methodology and results from the analysis. Chapter 5 discusses

8
the results of the analysis and finally chapter 6 presents recommendations, conclusions
of the analysis, and suggestions for future research.

9
Chapter 2
Literature Review
This dissertation builds on several literature streams. It progresses from a
discussion of the fundamental theory of company and industry structures and strategy
development by presenting the punctuated equilibrium model (that explains why and how
industries and companies change over time) and the resource based view of the firm
(that develops corporate strategy from an inside-out point of view that is a contrast from
Michael Porter’s external orientation of strategy). The literature then focuses on more
tactical implications of corporate strategy, innovation, organizational learning, operations
strategy, and process management using the punctuated equilibrium model and RBV as
a basis of understanding. Finally, the concept of fit is reviewed and how fit can influence
the success of companies in both stable and turbulent environments.
2.1 Punctuated Equilibrium
The Punctuated Equilibrium theory is a model that has its origins in the field of
biology as a challenge to Darwin’s theory of evolution. Darwin’s theory of Natural
Selection describes the changes in an organism as a cumulative effect of minor
incremental changes in species to explain the evolution of species over time. Small
variations and mutations develop in species and if the variation is beneficial, it is
incorporated in future generations. If the mutation is not beneficial, the mutation is not
passed on and the mutation dies in that generation. Eldredge and Gould (1972)
challenged the Darwinian evolution model when they proposed the punctuated
equilibrium model. The punctuated equilibrium model adds another mechanism for
evolution that was not included in Darwinian evolution. While it is possible that the

10
species evolves slowly over time, they added a new effect of radical change occurring in
a short time frame that then allowed natural selection to choose between the older
species or the new upstart. Gersick (1991) further developed the punctuated equilibrium
model by building on work from Kuhn (1970) in philosophy of science, Abernathy and
Utterback (1982) work in industry, Miller and Friesen (1984) focus on organizational
adaptation, and the Nobel Prize winning work on self-organizing and dissipative
structures by Prigogine (1977).
The core of the punctuated equilibrium model is the observation that long periods
of stability (equilibrium) are broken by periods of dramatic upheaval (revolution). Gersick
(1991) describes the characteristics of each phase and how the two phases interact and
what causes the system to stay in one phase or switch over to the other. The key to the
model is the size of change. A system can handle small and intermediate changes with
ease and can sometimes resist the change. This resistance to the change can actually
cause the change to die out due to inertia resisting change. There is a point where the
change cannot be easily absorbed and changes to the system must occur to adapt to the
change.
The punctuated equilibrium model has three concepts that predict how the
system will react to change. These three components are deep structure, equilibrium
periods, and revolutionary periods (Wake, Roth, and Wake, 1983; Gersick, 1991). Deep
Structure is a complex concept that refers to the characteristics of the system that form
the foundation and organization of the system. The deep structure reinforces the system
and early decisions carry the most weight as it creates path dependence as in a decision
tree (Gersick, 1991). During the equilibrium period, the system can make minor changes
without major changes in the deep structure of the system (Wake, Roth, and Wake, 1983;
Gersick, 1991). “If deep structure may be thought of as the design of the playing field

11
and the rules of the game, then equilibrium periods might be compared loosely to a game
in play,” (Gersick, 1991) The deep structure has been described as a “menu of choices
about how they will organize and run themselves,” (Gersick 1991). “While [deep
structure] may or may not be explicit, it can be described by [five facets]: (1) core beliefs
and values regarding the organization, its employees and its environment; (2) products,
markets, technology and competitive timing; (3) the distribution of power; (4) the
organization's structure; and (5) the nature, type and pervasiveness of control systems,”
(Tushman and Romanelli, 1985). In an industry setting, deep structure can take on
various forms like industry standards, labor relations, vendor relations, government
regulations, or shared views of how companies should work. For example, the role of
telephone customer support was long viewed as an expense to be minimized. Industries
found ways to reduce costs by automation, off-shoring, and outsourcing the role. This
was the dominant mindset of many industries until the customer began to stop using
companies with off-shore call centers and switched to companies with United States
based call centers.
The second aspect of the punctuated equilibrium model is the equilibrium period.
This period is the stable state of the system where the rules and deep structures are not
changing and where small incremental changes can be made without fundamental
changes to the deep structure of the system. Industries and companies can absorb
almost any change as long as it is incrementally small enough and over time, these small
changes can add up to a big change for the industry as a whole. Companies can slowly
adjust to changes over time without much pain. The revolutionary period comes about
when a system is faced with a large, rapid change is hard to absorb and creates a
dramatic shift. (Gould, 1989: Gersick, 1991). It is like the metaphor of the frog and boiling
water where a frog will jump out if thrown in a pot of boiling water, but will stay in the pot

12
of cold water that is slowly heated to boiling since the frog will not notice the small
changes over time and adjusts to it.
There must be an externality or switching cost and some uncertainty in the
capabilities of the new technology for punctuated equilibrium to happen (Loch and
Huberman, 1999). A major aspect of the equilibrium phase that comes out of the
punctuated equilibrium model is that of inertia. The stronger the deep structure, the
stronger the inertia. In human systems, the three barriers to radical change are
cognition, motivation, and obligation (Tushman and Romanelli 1985). Cognition is the
ability of a system to detect changes, the mental framework that the system uses to view
the world, and willingness to see the need for change. It can also limit the company’s
ability to see that there are alternative paths for them to follow.
The motivation of a company’s management can cause it to maintain the status
quo and maintain its inertia. People have a natural resistance to change. In business,
these take the form of sunk costs, loss of control, and fear of the unknown and they
contribute to the resistance to change (Gersick, 1991). Sunk costs are when a company
is not willing to abandon a course of action, strategy or project due to the costs, time, and
energy that has been dedicated already to the past decisions. Management might not
want to admit that they made a mistake or that what has been successful for so long is no
longer working. A Harvard Business Review article describes how financial measures
can also lock the company into living in the past. Discounted cash flows (DCF) and Net
Present Value (NPV) are common methods for evaluating new opportunities.
Unfortunately, these methods value current fixed costs and sunk costs in a way that
reduces existing companies’ ability to approve new projects and provides an advantage
to new firms (Christensen, Kaufman, and Shih, 2008). Other sources of inertia due to
motivation are the fear of new and uncertain tasks and change in responsibilities that

13
may affect a person’s power in the organization. Companies can choose to follow old
routines even though they know they are no longer working because they are unwilling to
risk trying a new approach. An error in judgment is the belief that the status quo is a
viable option for future success (Christensen, Kaufman, and Shih, 2008).
The revolutionary period of the punctuated equilibrium model is the time of great
and fundamental changes to the system. The revolutionary period is the phase when the
rules change and the system faces major change (Gersick, 1991) and when the deep
structure of the system is altered. The alteration of the deep structure creates a
disorganized and chaotic state where the rules of the game are changed and each player
is seeking to understand what the new state will be and how to reach that new state with
least pain. Industries stay in static forms (equilibrium) the majority of the time but
suddenly a new technology or company creates a rapid change (punctuation) that cause
companies to adapt or die (Gersick, 1991).
The disruption that can cause a need for a shift from equilibrium state to
revolutionary phase can come from either internal changes or environmental changes.
Some examples of internal changes can be changes in management, changes in
business model, and changes in strategy. Examples of external changes could be
regulatory changes, disruptive technologies, natural disasters, and new entrants to the
market. Although a need for revolutionary change is created, it is not certain that a
revolution would materialize. The inertia of the deep structure can prevent the change
even when the need exists.
During the revolutionary phase, the system and companies feel uneasy and the
new path forward is untested. The true value of the new path cannot be fully understood
until the deep structure is realigned and a new period of equilibrium is entered. This
makes the motivation for getting through the revolutionary phase quickly extremely

14
important, but it is also important take time to understand the choices available and make
decisions that push the organization toward the new paradigm without falling into the old
way of doing things. This often takes advice from people from outside the organization.
Access to trusted outsiders is an important resource to the company and should be
developed during the equilibrium phases so that the company does not panic and take
advice from someone not fully trusted by company.
As change begins to happen in a system, the inertia of the system will resist.
The nucleus of change that is necessary to effect lasting change has to be larger the
more integrated the system is and the better the communication is between various parts
of the system. Systems that are highly interconnected, that have rigid structure, and a
great deal of relationships have larger inertia and resists changes, more than systems
that have a more lax control system and connectivity. Why do revolutions occur at all?
The same deep structure that creates the inertia can also create the revolution. The
mutual interdependence and how the system gets resources from the environment forces
major changes when the system can no longer get resources from the environment and
when the parts (companies) are no longer aligned (Gersick, 1991).
Technology diffusion follows the punctuated equilibrium model for five reasons
presented by Loch and Huberman, (1999). These five reasons are: “1. A radical
innovation creates uncertainty (for producers as well as users), which needs to be
resolved before widespread adoption can occur. 2. The new characteristics of the
technology may destroy existing firm competences, which contributes to inertia within
firms. 3. A new technology may be incompatible technically with other components of
complex systems of which it is a part. 4. It may also upset the balance of cooperations
and interests in the business network that has evolved around the old technology and its
15
complements. 5. Finally, it may encounter resistance in society at large,” (Loch and
Huberman, 1999)
In summary of the punctuated equilibrium model, there exist two phases, which
are the equilibrium phase i.e. steady state, and the revolution phase where the deep
structure is modified. The deep structure is the source of inertia of the equilibrium phase.
The deep structure comes from the predominant system structure, beliefs, norms, and
processes. The stronger the deep structure is, the longer the system will stay in
equilibrium and the stronger the resistance to change or even can cause firms to not see
or accept that there is change going on. Organizations that are able to radically and
quickly change their processes and structures in response to external changes perform
better long term than those who just change incrementally (Miller and Friesen 1982,
1984; Virany, Tushman, and Romanelli 1992; Romanelli and Tushman, 1994).
Punctuated equilibrium is tied to organizational learning that created tensions between
the drive stability and change, (Lant and Mezias, 1992; Romanelli and Tushman, 1994).
2.2 Resource Based View and Dynamic Capabilities
In order for companies to succeed, earn economic rents over the long term, and
produce supernormal returns compared to its competitors, they must be able to perform
better than another company in some area. The Resource Based View (RBV) of the firm
is a theory of the firm that seeks to match the strategy of the organization to its internal
resources (Grant R. M., 1991). The RBV forms the foundation for understanding the how
the company can develop competitive advantages and earn profits. The RBV assumes
firms are profit-maximizing entities directed by bounded rational managers in markets
that are to a reasonable extent predictable and moving towards equilibrium (Bromiley and

16
Papenhausen, 2003; Leiblein, 2003; Kraaijenbrink, Spender, and Groen, 2010; Rugman
and Verbeke, 2002). The RBV links the company’s capabilities with the industry and
market dynamics (Collis and Montgomery, 1995). Grant develops an integrated
framework of capabilities at multiple levels of the company and there are complex
interactions between different strategy levels (Grant R. M., 1991; Kor and Leblebici,
2005; Kraaijenbrink, Spender, and Groen, 2010)
The Resource Based View seeks to explain the competitive advantages of the
company by looking at the resources a company has and how it uses them and that
resources are heterogeneous across companies (Barney, 1991; Grant, 1991; Schroeder,
Bates, and Junttila, 2002; Knott, Bryce, and Posen, 2003; Rugman 2002). Resources
that firms have are different and the differences can persist long-term, despite the
system’s attempt to reach equilibrium (Barney, 1991; Rumelt, 1984; Wernerfelt, 1984;
Chuang, 2004). Prahalad and Hamel (1990) discuss how the core competencies develop
from the knowledge and are enhanced as they are applied inside a company. “The
resource-based model is fundamentally concerned with the internal accumulation of
assets, with asset specificity, and, less directly, with transactions costs” (Peteraf, 1993).
Figure 2-1, below from Grant (1991), shows the input of the firm’s resources and how that
flows into corporate strategy formation. Figure 2-1 also shows that using the RBV,
strategy should be selected based on the resources that the firm has and builds on what
it uniquely has that other firms do not.

17
Figure 2-1 Resource Based View (Grant, R. M., 1991)
While Michael Porter’s work focuses on the industry (external) strategic
orientation, the long term strategy that is more likely to succeed is one that is built upon
what the company does well that provides value in the marketplace and to not focus the
strategy externally (Peteraf M. , 1993; Grant R. M., 1991). Each company has resources
that are acquired over time and is path-dependent. This path-dependency creates value
to the firm as it may be more difficult for another firm to acquire the resources or if
another company must follow the same path, the first company would have a time
advantage.
There are six major categories of resources upon which capabilities are made.
These are classified as financial, physical, human, technological, reputation, and
organizational (Grant R. M., 1991). Financial resources are the availability and cost of

18
capital, tax structure, and leverage of the firm. Physical resources refer to the raw
materials, costs of energy, location, and plant and equipment. Human resources are the
talents and skills inherent in the workforce. This could be access to lower labor costs,
higher education, or specialized employee skills. Technological resources are the
knowledge and equipment that the company has at its disposal. Technological resources
can be patented processes and technology, off the shelf equipment, or a utility resource
such as bandwidth. Reputation is powerful resource that is developed over time and can
have great affect on the ability of a company to gain and apply resources. The reputation
of the firm can provide an advantage in accessing markets, building market share,
gaining favor with government organizations, and can make it easier to acquire
resources, especially human resources. Organizational resources are the management
and operations processes that allow the company to best use recourses and spot
opportunities.
Resources are the building blocks of profitability in a company, but almost any
company can acquire resources. The next step to earning economic rents is developing
the capabilities that are made from resources. It is not necessarily the resources
themselves, but the ability of management to mobilize, organize and integrate the
resources that gives a company a competitive advantage (Grant R. M., 1996)
(Kraaijenbrink and Wijnhoven, 2008) (Kraaijenbrink, Spender, and Groen, 2010).
Capabilities are the organizational routines that combine and coordinate the use of
various resources in the company (Grant R. M., 1991). Six factors affect the ability of a
company to achieve economic rents from its resources and capabilities. These factors
are sustainability, durability, transparency, transferability, inimitability, and appropriability
(Collis and Montgomery, 1995; Grant R. M., 1991).
19
Sustainability is the ability of a company to maintain competitive advantage from
both the sustainability of the resources and the capability and advantage derived from
them. Durability is the characteristic of the resource to degrade or become obsolete over
time. Durability is affected by the rate of change of technology in an industry.
Transparency is how obvious is the source of the competitive advantage and how hard it
would be to obtain all the resources necessary to duplicate the advantage.
Transferability is how easy it is to switch the resource from one firm to another.
Transferability is made up of geographic immobility, imperfect information, firm specific
resources and immobility of capabilities. Inimitability is the degree to which the
knowledge upon which a competitive advantage is tacit or codified and how difficult it is to
recreate the capabilities in-house in another organization. Appropriability is the ability of
a company to earn economic rents on an asset when ownership is in question. An
example is the skills of an employee. Is their skill property of the company or of the
person?
Prahalad and Hamel (1990) discuss how the core competencies develop from
the knowledge and are enhanced as they are applied inside a company. “The resource-
based model is fundamentally concerned with the internal accumulation of assets, with
asset specificity, and, less directly, with transactions costs” (Peteraf, 1993). The
competitive advantages of companies are not static and can change over time (Helfat,
Peteraf 2003). “…a resource with the potential to create competitive advantage must
meet a number of criteria, including value, rarity, imitability and organization. Resources
and capabilities are considered valuable if they allow an organization to exploit
opportunities and counter threats in the business environment,” (McIvor, 2009).
20
Core competencies enable product innovation but can actually impede product
innovation when those core competencies become part of the deep structure of the firm,
(Leonard-Barton, 1992; Danneels, 2002).
While the RBV has many supporters, it does have some detractors and critiques.
In order to succeed long-term, companies must be able to compete in existing and
change to compete in new markets. Dynamic capabilities allow company leaders to
reorganize and mobilize the capabilities in new ways once threats and opportunities are
identified (Teece, 2006; O'Reilly and Tushman, 2008) Competitive advantage and
disadvantage are developed over time and are not constant (Helefat and Peteraf, 2003).
In fact, in order for a resource to have the potential of delivering a competitive advantage,
it must be rare and hard to duplicate or imitate (Barney, 1991).
The company must exploit current capabilities and build new ones (Stieglitz and
Heine, 2007). The RBV is a snap shot in time and does not take into account how the
resources or competitive advantages change over time (Kraaijenbrink, Spender, and
Groen, 2010). RBV as originally proposed is applies as long as the deep structure in an
industry remain relatively fixed. In unpredictable environments, in which new technologies
and/or new markets emerge and the value of resources can drastically change, we need
to go beyond the RBV to explain a firm's sustainable competitive advantage (Barney,
2002; Kraaijenbrink, Spender, and Groen, 2010). The RBV has trouble dealing with
issues that change over time such as boundaries, timing, innovation, and
entrepreneurship (Kraaijenbrink, Spender, and Groen, 2010).
In response to this critique, the idea of dynamic capability was developed.
Dynamic capabilities take the static resources, capabilities, and completive advantages
and add a temporal aspect that allows for their variation over time, (Tushman, Smith,
Wood, Westerman, and O’Reilly, 2002). Adding a dynamic element to the economy and

21
resource allocation allows for entrepreneurs to develop in a classical economic model.
(Arend, 1999; Langlois, 2007; Sarasvathy and Dew, 2005; Teece, 2007; Kraaijenbrink,
Spender, and Groen, 2010).
The static theories of strategy made popular by (Barnett, Greve and Park, 1994;
Porter, 1980; Rumelt, 1984) are being replaced by dynamic theories that focus on the
ability of the firm to change so that it matches its resources and structure to match new
competitive environments (Eisenhardt and Martin, 2000; Helfat, 1999; Lavie, 2006;
Teece, Pisano and Shuen, 1997; Teece, 2006; O'Reilly and Tushman, 2008). Dynamic
capabilities enhance the company’s ability to exploit and explore at the same time
(March, 1991; McGrath, 1999; Tushman, Smith, Wood, Westerman, and O’Reilly, 2002)
The RBV was initially devised as in intra-firm framework, but Dyer and Singh
1998 looked at moving beyond the company and into its network for resources that
contribute to its competitive advantage are sometimes outside the firm’s boundaries.
Previous research suggests that firms occupying central network positions with greater
network ties have superior access to information and, thus, are more likely to increase
the number of their alliances in the future (Gulati, l995a; Mitchell and Singh, 1996; Walker
et al., 1997). When a firm is well positioned in networks, the firm has access to more
reliable information about potential partners because of trusted informants within the
network who may have direct experience with the potential partner (Burt, 1992; Chung,
Singh, and Lee, in press; Granovetter, 1985; Nohria, 1992). An information-rich position
within a network, therefore, provides a firm with additional information about the nature
and degree of accessibility of the complementary resources of potential partners, (Dyer
and Singh, 1988)
Process technologies that lead to cost advantage are results of making existing
technology more efficient and optimized. These are exploitation activities and contribute

22
to the deep structure of the company. Figure 2-2 illustrates how unique resources of a
firm build to create value and competitive advantage in the company, but also illustrates
how those same capabilities make the industry more or less attractive to competitors. It
combines the internal and external aspects of corporate strategy.
Figure 2-2 Unique Resources Build Competitive Advantage (Grant, R. M., 1991)
2.3 Efficient/Performance Frontiers
The Resource Based View of the firm describes imitable resources that can
easily acquired by competitors and cannot be sources of competitive advantage due to
the efficiency of an industry where companies . The Theory of Efficient Frontiers builds
on this concept to describe the current state of the art in an industry and the mixture of
resources that create an optimal curve of performance (Greve, 2003). Companies with
finite resources and some technical situations require tradeoffs between competing

23
variables and situations. These tradeoffs made by companies affect the performance of
the firm and there exists a curve where there is an optimal mixture that creates maximum
performance (Swink M. S., 2006). Companies that are far from the efficient frontier can
improve by many changes to the mixture with high returns, but the closer a company is to
the efficient frontier the more difficult it is for a company to improve its performance
through diminishing returns (Swink M. S., 2006).
2.4 Corporate Strategy
One of the major roles of company executive management is to develop a
strategy that will maximize shareholder value. Executive management makes decisions
on the type of products, price points, service levels etc and how the company will use its
resources to achieve the goals set out. Many tools exist for the executive strategy
development from the industry and environmental factors with early pioneers such as
Porter, Mintzberg, Prahalad and Hamel creating a strong tool kit for managers. This step
has been researched greatly by those in the management strategy field and is outside
the scope of this dissertation. Fort this dissertation, it is assumed that executives have
developed a strategy and is actively moving forward in its implementation.
2.5 Modes of Innovation
2.5.1. What is Innovation?
“Innovation is doing new things that customers ultimately appreciate and value,”
(Cash, Earl, and Morison, 2008). Innovation is one of the most important things a
company can do. Many quotes by respected business authors point this out. “The

24
enterprise that does not innovate, ages and declines. And in a period of rapid change
such as the present, the decline will be fast.” Peter Drucker. “Innovate or die,” Tom
Peters. The importance of innovation in the survival of the company requires the
company to continuously match the company’s structure, organization, technology and
practices to the needs of the market (Pavitt, 2004; Castellacci, Grodal, Mendonca, and
Wibe, 2005). To continue and survive in a changing environment, a firm must be able to
adapt (Eisenhardt and Martin, 2000; Teece, Pisano, and Shuen, 1997; Hoang and
Rothaermel, 2010). Companies must have exploration and exploitation to survive long-
term (Ancona, Goodman, Lawrence, and Tushman, 2001; Benner and Tushman, 2002;
Dougherty, 1992; Eisenhardt and Martin, 2000; Feinberg and Gupta, 2004; Levinthal
andMarch, 1993; March, 1991, 1996, 2006).
Companies have a strategic choice at the time of radical technological change.
This choice has been researched in fields such as management of technology,
organizational learning, and economics (Lee, Lee, and Lee, 2003). The firm must choose
if they are going to exploit their current technology to ensure short-term survival or it can
move to the new technology and hope for better long-term opportunities (Levinthal and
March 1981, Nelson and Winter 1982; Lee, Lee, and Lee, 2003). Once management
decides on the product mix and strategy, the executives must decide how new products
will be developed in the future. RandD and innovation is an important factor in a firm’s
production and product offerings (Knott, Bryce, and Posen, 2003).
In the early formation of innovation theory, innovation was believed to exist on
two opposed forms. March (1991) identified these two categories as Exploration and
Exploitation. These are two distinctly separate ideas and were posed as mutually
exclusive paths for innovation. More recently, research has shown that there is a hybrid
between the Exploiters and Explorers. The group that occupies the middle ground is

25
called ambidextrous organizations (Gupta, Smith, and Shalley, 2006). While there is
some variations in definitions of exploration and exploitation (Nerkar, 2001; Vassolo,
Anand, and Folta, 2004; Vermeulen and Barkema, 2001, Rosenkopf and Nerkar’s, 2001;
Benner and Tushman, 2003), the definitions below will be used for this paper.
Exploitation innovation is focused on efficiency, productivity, and variance reduction while
exploration is about wide search, new discovery, and embracing variation (O'Reilly and
Tushman, 2008). Ambidexterity is about doing both (Duncan, 1976; Tushman and
O’Reilly, 1997; O'Reilly and Tushman, 2008).
Research has identified three main reasons why a company would not be able to
do both effectively at the same time. March, 1991 said that pursuit of one, makes you
naturally do less of the other. Firms that try to do both have to select which to give more
resources to and lack focus (Miller and Friesen, 1986). Finally, it should match its
strategy to the business environment (Galbraith, 1973; Lawrence and Lorsch, 1967;
Kyriakopoulos and Moorman, 2004)
“What is good in the long run is not always good in the short run,” (March, 1991).
While both types of innovation are needed in the long-term, there are competing
demands of each and a company often moves towards exploitation since the positive
feedback is often stronger (Benner and Tushman, 2002; Gupta, Smith and Shalley, 2006;
Henderson and Clark, 1990; Levinthal and March, 1993; March, 2003; O'Reilly and
Tushman, 2008).
2.5.2. Exploration
Exploration is the quest for new knowledge that is not based on pre-existing
knowledge inside the firm or industry. Exploration is the quest for radical, game-
changing, disruptive technologies that change the trajectory of technology development

26
in an industry and opens new product markets (Benner and Tushman, 2003; He and
Wong 2004). Returns from exploration are more uncertain and occur in much later time
periods than exploitation (March, 1991). Radical innovations often require the support of
the whole organization from creation of new assets and technology to new marketing, so
having strategic direction to innovation is critical (Stieglitz and Heine, 2007).
Often called blue-sky or clean sheet research, this research has a large amount
of uncertainty in its success from the point of view of being technically feasible and its
success of these products in the market. Products developed from this research would
become major market disrupters and could make existing products obsolete.
Exploratory innovation is the type of technologies that create the impetus for
punctuated equilibrium to occur. Exploratory research can be classified as high risk, high
reward research (Gupta, Smith, and Shalley, 2006). Many companies and researchers
spend large amounts of money, time, and energy on developing technology that does not
bear fruit in patents or saleable products. Exploratory innovation often requires new
technology competency and marketing, so management structures must be in place to
oversee and integrate (Stieglitz and Heine, 2007; Tushman and Anderson, 1986; O'Reilly
and Tushman, 2008). For companies and researchers involved in this type of product
development and knowledge creation, systems and machinery utilized would have
general application. They are not tailored to a specific method of doing work, but instead
offer flexibility and agility. The type of technology that has multiple applications tends to
be more expensive since it has to provide a wide range of capabilities or alternatively, a
company could spend a large amount on various machinery and technology that can be
utilized in radical research. Exploration creates new competencies that facilitate further
innovation and can result in increased performance in the long-term (Geroski, Machin,

27
and Van Reenen, 1993), but these benefits are often offset by increased risk and delay in
returns (Gupta, Smith, and Shalley, 2006; O'Reilly and Tushman, 2008).
2.5.3. Exploitation
Exploitative innovation refines and extends the existing product’s
price/performance ratio (Dosi, 1982; Rosenkopf and Nerkar, 2001; Tushman, Smith,
Wood, Westerman, and O’Reilly, 2002) Exploitation makes existing products cheaper,
faster and better (Nelson and Winter, 1982; O'Reilly and Tushman, 2008). “Successful
exploitation provides a buffer from the shocks of exploration and entails less risk than
exploration,” (Gatignon, Tushman, Smith, and Anderson, 2002).
Exploitation is the application, refinement, optimization, and improvement of
existing products and knowledge (March 1991). Exploitation continues the existing
trajectory of technology and builds on the existing technology in that industry and
improves existing product market domains (Benner and Tushman, 2003; He and Wong
2004). Exploitation insulates the firm from the shocks of exploration and usually is less
risky than exploration (Gatignon, Tushman, Smith, and Anderson, 2002; Voss,
Sirdeshmukh, and Voss, 2008). Positive local feedback such as profit and market share
tends to cause companies (even ambidextrous ones) to lean toward exploitation (Benner
and Tushman, 2002; Gupta, Smith and Shalley, 2006; Henderson and Clark, 1990;
Levinthal and March, 1993; O'Reilly and Tushman, 2008). This is the steady state of the
punctuated equilibrium model. In operations, this is characterized by efforts by
companies and researchers investing money in creating economies of scale and scope,
optimizing processes and implement best practices, holding kaizen events and six-sigma
projects seeking to reduce variation. Exploitative research is the refinement and
incremental improvement of existing products and technology. This research can

28
increase product capabilities, reduce cost and complexity of existing products, or improve
reliability or manufacturability. This type of research aids in the reduction of production
cost seen in the phenomenon of the learning curve where production and costs decrease
as more units are produced.
2.5.4. Ambidexterity
Established companies must continue to invest in RandD to maintain or increase
its status and competitiveness in the market (Cesaroni, Minin, and Piccaluga, 2005).
Companies must stay up to date on the current state of the art of their industries and
maintain collaborative relationships with partners (Cesaroni, Minin, and Piccaluga, 2005)
The focus on exploitation will eventually lead to technological decline in competitive
markets, (Lee and Ryu, 2002; Lee, Lee, and Lee, 2003). How can a company do both
over the long term since each type of innovation “require different structures, processes,
strategies, and capabilities and culture?” (He and Wong, 2004). Exploration and
exploitation have been presented as mutually exclusive methodologies, but with
weaknesses in each (Raisch, Birkinshaw, Probst, and Tushman, 2009). Many studies
have suggested that the combination of exploration and exploitation is associated with
longer survival (Cottrell and Nault, 2004), better financial performance (Govindarajan and
Trimble, 2005; Markides and Charitou, 2004), and improved learning and innovation
(Adler, et al., 1999; Holmqvist, 2004; Katila and Ahuja, 2002; McGrath, 2001; Rothaermel
and Deeds, 2004; O'Reilly and Tushman, 2008)
While there has been a large debate on if exploitation and exploration can exist
at the same time or if it follows a punctuated equilibrium model that causes a company to
switch from exploit to explore, Tushman and O’Reilly (1996) were first to present a theory
of organizational ambidexterity by building off work by Duncan (1976). They suggest that

29
ambidextrous organization should have better performance and they described how to
structure the RandD functions to allow for ambidextrous innovation (Raisch, Birkinshaw,
Probst, and Tushman, 2009; Tothaermel and Alexandre, 2009). Ambidextrous innovation
is when firms do both exploitative and exploratory research in the same timeframe.
There is still some continued debate at what size of companies is ambidexterity possible.
Being ambidextrous requires both skill sets that are required for exploration and
exploitation. Research has shown that successful ambidextrous companies are larger
due to need for more resources (Gupta, Smith, and Shalley, 2006).
Ambidextrous forms were more effective than other organizational design
choices in creating non-incremental innovations long-term when new non-incremental
products were phased in instead of immediately replaced (Tushman, Smith, Wood,
Westerman, and O’Reilly, 2002). Ambidextrous innovation is more likely when the
markets are highly competitive and unstable (Jansen, Van den Bosch and Volberda,
2005; O'Reilly and Tushman, 2008).
Can exploration and exploitation coexist? Many researchers have debated this
topic. Many researchers cite the vast differences in research methodology, equipment,
and mindset needed for each knowledge creation method are diametrically opposed and
cannot coexist in companies and people, but rather are a binary/either-or scenario where
companies seek to optimize and extract economic rents from the existing technology
(Burgelman, 2002; Benner and Tushman, 2003; Siggelkow and Levinthal, 2003; Gupta,
Smith, and Shalley, 2006; O'Reilly and Tushman, 2008; Andriopoulos and Lewis, 2009;
Groysberg and Lee, 2009; Jansen et al., 2009; Mom et al., 2009; Taylor and Helfat,
2009). The organization configuration needed to follow exploration and exploitation are
very different, but both are needed in a company if it is to succeed both over the short
term and the long term, (O'Reilly and Tushman, 2008). If a company cannot balance

30
both exploration and exploitation, a company can fall into either a “competency trap”
where a company focuses on what it does well and exploits more than it explores or it
can fall into a “failure trap” where the company fails on having a successful outcome of
the exploration process and keeps searching without ever settling on something and
exploitation is non-existent (Leonard-Barton, 1992; March, 2003; Siggelkow and Rivkin,
2006; O'Reilly and Tushman, 2008). Exploitative subunits are organized to be efficient,
while exploratory subunits are organized to experiment and improvise. (Tushman, Smith,
Wood, Westerman, and O’Reilly, 2002). Other researchers believe that both can coexist
within an organization, but depends on the resources available to it. Siggleskow and
Rivkin, (2006) identified that different levels of the organization can follow different forms
of knowledge creation and that organic, decentralized firms often better explorers and
adopted new technologies more quickly. On the other hand, centralized companies
resisted new knowledge and were more prone to exploitation. Siggleskow and Rivkin
created a model that demonstrated that lower level exploitation could actually limit the
overall innovation of the firm. “The firm’s crucial task is to exploit its existing resources
and capabilities while simultaneously developing new corporate assets for future
business opportunities”, (Stieglitz and Heine, 2007).
“Ambidexterity refers to the synchronous pursuit of both exploration and
exploitation via loosely coupled and differentiated subunits or individuals, each of which
specializes in either exploration or exploitation,” (Gupta, Smith, and Shalley, 2006). The
ambidexterity of the firm is not feasible at the group level due to the difference in
expected outcome of tasks in exploration and exploitation, but can exist when the groups
are separated (Gupta, Smith, and Shalley, 2006). Ambidextrous organizations have high
level of differentiation with dedicated management and groups focused on each form of
innovation with reporting structures that go to senior management, low integration and
31
contact between groups, and top management support for both exploration and
exploitation (Tushman, Smith, Wood, Westerman, and O’Reilly, 2002). Ebben and
Johnson (2005) conducted a study of 300 small companies and found they did better
when following a single strategy of either flexibility of efficiency instead of trying to do
both. In support of a punctuated equilibrium model, some research has suggested
following one strategy until it fails and either closing doors or then switching to a new
strategy (Anand and Singh, 1997; Dew, Goldfarb and Sarasvathy, 2006; Knott and
Posen, 2005; O'Reilly and Tushman, 2008). While there is a large amount of research on
ambidextrous organizations, few studies have been done longitudinally to understand the
long-term success of ambidextrous organizations (Raisch, Birkinshaw, Probst, and
Tushman, 2009). Many companies do not have the resources or slack available to
conduct exploration. For these companies, instead of following an ambidextrous
approach, the exploration resources can be gained by alliances, licensing, joint ventures,
and mergers and acquisitions.
The ability for a firm to survive long-term hinges on many different aspects that
have been touched upon so far in this dissertation. The company must be able to spot
opportunities and threats in the environment through boundary spanning activities,
continue to produce new products that customers value through product innovation, have
access to or develop resources and competitive advantages that allow the company to
compete in its current environment, and have the flexibility to adapt operations after
periods of revolution.
The supplier relationships discussed by (Swink, Narasimhan, and Kim, 2005) can
have a big impact on the innovation of a firm. Research has shown that customer and
supplier interaction can enhance the success of new products (Gruner and Homburg,
2000). Boundary spanning activities are important to identifying environmental risks and

32
opportunities. The amount of vertical integration and the amount of cooperation and trust
in the supply chain would impact the knowledge that the firm can get about the
environment. Companies that are more vertically integrated would have fewer
opportunities to interact with suppliers and competitors than a company that is more core
competency and market focused. Contact with suppliers and customers at arm’s length
provides some information on market needs and disruption, however more integration
and trust of the supply chain allows for more learning in the company and improves the
chances that needs for innovation are identified. Once suppliers sign cooperation
agreements and alliances, information on opportunities in the market, opportunities for
improvement, and knowledge sharing will begin to increase. This increase in knowledge
sharing allows for greater sensitivity to inputs in the market. The power and control of the
vertically integrated companies would allow for more exploitative innovation as the
opportunities for the company to implement process management processes over the
whole value chain.
Radical exploration is the incorporation of knowledge from another technical
domain and does not currently exist in the firm. Internal boundary spanning is
incorporating knowledge that exists in other divisions of the same company and external
boundary spanning is using current existing knowledge to blend with that knowledge
acquired from outside sources (Rosenkopf and Nerkar, 2001). Local and internal
boundary spanning contributes to path-dependency where a firm's RandD activity is
closely related to its previous RandD activity (March and Simon, 1958; Nelson and
Winter, 1982; Helfat, 1994; Rosenkopf and Nerkar, 2001).

33
2.5.5. Necessary and Sufficient Conditions for Innovation
Many researchers have looked into what are the inputs required for
innovation. Research by (Nohria and Gulati, 1996; Sharfman, Wolf, Chase, and Tansik,
1988; Voss, Sirdeshmukh, and Voss, 2008) point out that to have innovation, a company
or person must have slack resources to pursue innovation. Slack is one of the primary
necessities for innovation. Slack is resources of time, capital, or capacity that are in
excess of that quantity needed for production of goods and services performed by the
company(Nohria and Gulati, 1996; Sharfman, Wolf, Chase, and Tansik, 1988; Voss,
Sirdeshmukh, and Voss, 2008).. Slack can be measured in percentage of utilization of
machinery, ratio of annual sales to PPE, or days of inventory (Hendricks et al 2009).
There is contradiction on the role that slack plays in exploration innovation.
Some research has shown a positive relationship (Nohria and Gulati, 1996; Singh, 1986;
Kraatz and Zajac, 2001; Voss, Sirdeshmukh, and Voss, 2008) while other research has
shown a negative relationship (Tan and Peng, 2003; Voss, Sirdeshmukh, and Voss,
2008). Slack financial resources can increase exploration due to financial freedom and a
cushion against losses of unsuccessful exploration (Nohria and Gulati, 1996; O’Brien,
2003; Voss, Sirdeshmukh, and Voss, 2008) but the excess financial slack could be a
signal of the company being risk adverse (Levinthal and March, 1993; Voss,
Sirdeshmukh, and Voss, 2008). Slack resources are a necessary, but not sufficient
condition. Slack resources must be met with the identification of a mismatch between
current performance and expected performance or an identification of a current or future
unmet market need.
Identification of market needs occurs during boundary spanning activities of a
company. Boundary spanning occurs whenever there is interaction with customers,
suppliers, or competitors. The boundary spanning activities can be formal and planned

34
such as consumer or marketing research or they can be informal and spontaneous such
as meeting people at conferences, impromptu contact with customers and suppliers, or
even competitors.
Slack in Operations Management is often seen as the enemy of the efficient
resource conversion. Lean manufacturing, JIT, and six sigma are all methodologies that
seek to drive slack out of the system. Proponents of these methodologies push that in
order to maximize the effect or sometimes even the success of implementing these
programs, a corporate culture must shift and the whole organization must become
committed to these philosophies.
If slack is a necessary condition for innovation, and lean, JIT, process
improvement, and six sigma seek to drive slack out, do these philosophies limit
innovation? It would actually depend on which innovation is looked at. Lean, six sigma,
and JIT seek to reduce variability, produce higher quality products with fewer inputs. The
methods utilized to implement each philosophy are very rigorous and investigates every
part, process, and interaction to find ways to improve the current process.
2.5.6. Summary
Companies need both exploration and exploitation in the long-term. Exploitation
following a successful exploration builds on the competencies gained and extracts value
from the exploration (Gupta, Smith, and Shalley, 2006; O'Reilly and Tushman, 2008)
Innovation in highly competitive global markets requires companies to be able to
learn even in the face of technological uncertainty. (Castellacci, Grodal, Mendonca, and
Wibe, 2005). The natural tendency of a company experienced in one technology is to
become fully integrated and either become locked in or to lose sight of new technological

35
opportunities via a competency trap (Levitt and March, 1988) or learning myopia
(Levinthal and March, 1993; Lee, Lee, and Lee, 2003).
It is important to point out that strategy only sets the stage of what the company
wants to do and the necessary competencies need to be developed to develop those
strategies (Rittera and Gemunden, 2004). As more companies use and accept a
technology, its value grows (Shapiro and Varian 1999; Lee, Lee, and Lee, 2003) and this
new technology becomes part of the deep structure of the industry.
The successful development and commercialization of innovative products
depends on three factors (Luca and Atuahene-Gima, 2007). These factors were
identified as “market knowledge (Atuahene-Gima 1995, 2005; Day 1994; Li and
Calantone 1998), cross-functional collaboration (Griffin and Hauser 1996; Kahn and
Mentzer 1998, Song and Parry 1997), and knowledge integration mechanisms
(Madhavan and Grover 1998; Maltz and Kohli 2000; Ruekert and Walker 1987).” (Luca
and Atuahene-Gima, 2007). These factors require separate structures and resources to
allow for innovation. Operations strategy decisions as well as innovation strategy
decisions affect each of these factors.
A broad knowledge base increases the opportunity of a company to identify new
opportunities and recombine their resources to meet that opportunity (Kogut and Zander
1992). However, there is a point where have too wide of a knowledge breadth could limit
the ability of the company to combine knowledge if it is too diverse (Galunic and Rodan
1998; DeLuca and Atuahene-Gima, 2007).

36
2.6 Organizational Learning
2.6.1. Internal Learning
Internal learning is the type of learning that happens inside the company or plant
and builds knowledge that is unique to that company and is an important resource in RBV
literature (Barney, 1991; Teece et al., 1997). Internal Learning includes cross training
employees (Gerwin and Kolodny, 1992) and using employee feedback for process and
product improvement (Hall, 1987). Good internal learning can create an adaptable
organization (Gerwin and Kolodny, 1992).
Further, these practices are routine-changing routines suggestive of the path-
dependent development of manufacturing processes (Nelson and Winter, 1982; March
and Simon, 1958; Nelson and Winter, 1982; Helfat, 1994; Rosenkopf and Nerkar, 2001).
The only real source of sustainable competitive advantage is internal learning
(Prusak,1997; Schroeder, Bates, and Junttila, 2002) and includes “proprietary processes
and equipment,” (Hayes and Wheelwright, 1984). Many operations management
techniques improve the learning of an organization (Giffi, Roth, and Seal, 1990;
Schonberger, 1996; Swink, Narasimhan, and Kim, 2005). The concept of learning curve
is an internal learning methodology and creates and advantage for companies that are
able to move down this curve faster than others (Yelle, 1979). The concept of absorptive
capacity is another internal learning concept where a company’s ability to integrate new
knowledge is related to past RandD (Cohen and Levinthal, 1990; Rosenkopf and Nerkar,
2001).

37
2.6.2. External Learning
External learning for a manufacturing company is accomplished through working
with suppliers and customers to solve product problems (Schroeder, Bates, and Junttila,
2002). This external learning creates a non-imitable resource which is one of the key
aspects of a resource in the RBV (Madhok and Tallman, 1998; Ward et al.,1995). Long-
term relationships with suppliers and customers increase the external learning of a
company (Gerwin, 1993; Schroeder, Bates, and Junttila, 2002). Many aspects of
learning are affected by interaction of the company’s structure, market orientation, and
current competencies of the (Mahoney, 1995; Teece, 2007)). Also, there is a relationship
between the type of learning (single-loop and double-loop learning (Argyris and Schön,
1978; Argyris and Schön, 1978; Lado, Boyd, Wright, and Kroll, 2006) and the type of
innovation (Kraaijenbrink, Spender, and Groen, 2010). Single-loop learning enhances
efficiency and resource exploitation, while double-loop learning enhances innovation and
resource exploration (Kraaijenbrink, Spender, and Groen, 2010).
The type of innovation that the company will follow affects how the organization
learns. Linkages between customers, suppliers, and internal groups will determine how
well the organization can access and utilize knowledge inside the company. Exploration
and exploitation have different requirements on the types of knowledge and rate of
knowledge dissemination. Exploratory research requires more isolation and less linkage
of the innovators to the rest of the company. If knowledge spreads too quickly, the
creativity can be hampered and sub-optimal solutions are accepted without competing
ideas.
Exploitative research requires intimate knowledge with current processes and
products. Innovators learn from people involved the current process and develop
iterative improvement often from direct input of customers and suppliers. This supports

38
the idea that if you do not do your own manufacturing, you lose a large source of
learning.
2.7 Operations Strategy
“Many of the exemplars of superior capabilities in the resource-based literature
such as service excellence, innovation and rapid time-to-market cycles, are closely
related to operations management,” (McIvor, 2009). The study of manufacturing strategy
as separate from corporate strategy began to come into focus in works like Skinner 1978,
Hayes and Wheelwright 1984; Miller and Roth, 1994). Organizations seek to integrate
the overall corporate strategy with the operations of the individual manufacturing facilities
(Swink, Narasimhan, and Kim, 2005). How well this integration is achieved affects the
profitability and long-term success of the firm (Ward and Duray, 2000).
There are two main elements to the operations strategy. First is what it must be
able to do produce a competitive product such as efficiency goals, flexibility, costs and
quality (Skinner, 1978; Giffi et al. 1990; Miller and Roth, 1994). The other is the set of
decisions made to support manufacturing such a plant and equipment choices, vertical
integration, quality procedures, etc. and these choices must match the product strategy
(Hayes and Wheelwright 1984, Wheelwright 1984, Hayes et al. 1988, Hill 1989; Anderson
et al. 1989, Buffa 1984, Cohen and Lee 1985, Fine and Hax 1985, Wheelwright
1978,1984,Hayes and Wheelwright 1984, Schroeder et al. 1986, Skinner 1969, 1978,
1985, Roth et al. 1989, Hill 1989, Roth and Miller 1990, Stobaugh and Telesio 1983,
Swamidass and Newel1 1987; Miller and Roth, 1994)
The pattern of manufacturing choices that a company makes is one element of a
manufacturing strategy (Hayes and Wheelwright 1984, Wheelwright 1984, Hayes et al.
1988, Hill 1989). Hayes and Wheelwright (1984) classify strategic manufacturing
decisions as “bricks and mortar” decisions and infrastructure. "Bricks and mortar"

39
decisions are decisions about facilities, technology, vertical integration, and capacity.
Manufacturing infrastructure decisions relate to topics such as organization, quality
management, workforce policies, and information systems architecture (Miller and Roth,
1994). “Achieving long-term success requires that firms possess not only the operational
capabilities and competencies to compete in existing markets, but also the ability to
recombine and reconfigure assets and organizational structures to adapt to emerging
markets and technologies,” (O'Reilly and Tushman, 2008). Therefore, manufacturing
infrastructure decisions will be the focus of this paper and will be built primarily upon work
done by (Swink, Narasimhan, and Kim, 2005) who looked at different operations
strategies and (Benner and Tushman, 2003) who looked at innovation effects of process
improvements methodologies and developed the research model that will be utilized for
testing hypotheses.
Swink, Narasimhan, and Kim, (2005) focus on five major manufacturing
practices: workforce development, process quality management, just-in-time (JIT) flow,
supplier relationship management, and product-process development. Workforce
development practices are improves workers’ abilities through enhance worker control
over their work and cross training (Giffi, Roth, and Seal, 1990; Schonberger, 1996).
Process quality management practices make use of associated tools to promote the
continuous improvement of process capabilities. Just-in-time flow practices have the
primary goal of eliminating wastes such as unnecessary movement, work-in-process
inventories, and queuing (Sugimori, Kusunoki, Cho, and Uchikawa, 1977). Supplier
relationship management practices move the company from arms length transactions
toward partnerships promote closer involvement with fewer, select suppliers by
establishing long-term relationships, information sharing systems, certification and
training, and joint investments (Kinni, 1997). These partnerships allow for more learning

40
through problem solving with customers and suppliers and have been called external
learning (Schroeder, Bates, and Junttila, 2002). One of the big advantages from a RBV
and competitive advantage point of view is that relationships with customers and
suppliers create tacit knowledge that is not easy to duplicate (Madhok and Tallman,
1998; Ward et al., 1995; Gerwin, 1993; Schroeder, Bates, and Junttila, 2002). Product
process development practices facilitate collaboration between product and process
designers as they seek to make the most effective use of manufacturing technologies
(Swink, Narasimhan, and Kim, 2005). Figure 2-3 from Danneels, 2002, separates the
knowledge necessary for new product development into Technological Competence and
Customer Competence. Both of these knowledge streams are critical to the success of
new products and as discussed previously, these competencies are affected by
operations structure.
Figure 2-3 Technology and Customer Competencies (Danneels, 2002)
Technological * New Customer
Competence Product Competence
* Manufacturing plant and * Knowledge of customer
Equipment needs and processes
* Manufacturing knowhow * Distribution and sales
* Engineering know-how Channel
* Quality assurance tools * Communication channel
* Company/Brand
Reputation

41
2.8 Process Management Effects on Innovation
Abernathy (1978) observed in the automobile industry that a firm’s efficiency and
productivity improvement efforts led to a decline in financial performance and he
proposed that a company’s ability to maintain financial success was related to both the
efficiency improvement as well as innovation, (Abernathy, 1978: 173; Hayes and
Abernathy, 1980) (Teece, Pisano, and Shuen, 1997; Benner and Tushman, 2003). What
Abernathy (1978) saw would be the beginnings of the exploration and exploitation ideas
presented by March (1991). Despite the observations of Abernathy, theory by March,
and countless anecdotal evidence of the potential long-term damage to the firm, process
improvement and process management movements took hold and thrived. On the
manufacturing floor, process management and Japanese production concepts had
success improving efficiency and reducing costs. As the success, support, and
following of these methods grew, governments and customers started contractually
requiring that process management programs be implemented (Harrington and Mathers,
1997; Westphal, Gulati, and Shortell, 1997; Benner and Tushman, 2003). The success
on the factory floor led it to implementation in other areas of the firm (Brown and Duguid,
2000; Sitkin and Stickel, 1996; Benner and Tushman, 2003). Some firms are moving
process management programs into RandD and product development groups. As this
occurs, the “variation-decreasing and efficiency-oriented focus” can degrade the dynamic
capabilities and core competences, (Benner and Tushman, 2003). This relates directly to
the punctuated equilibrium concept of deep structure. As stated previously in this paper,
deep structure is the part of the system that causes companies, people and processes to
follow the norms set by the group and increases the inertia of the firm. The stronger the
deep structures grow, the harder it is to overcome inertia, perceive new threats and

42
opportunities, and change course once issues are identified. The spread of process
management typifies the entrenchment of this deep structure.
Advocates of process management promote process management practices as
“universally beneficial for organizations, spurring continuous innovation that results in
efficiency improvements, cost reductions, improved customer satisfaction, and,
ultimately, higher profits,” (Benner and Tushman, 2003; Hammer and Stanton, 1999;
Harry and Schroeder, 2000; ISO, 1999). Naturally with the focus on the financial benefits
of process management by the advocates of the various methodologies, empirical
research has been limited to assessing the financial performance implications from
process management adoption and the results have been mixed (e.g., Ittner and Larcker,
1997; Powell, 1995; Samson and Terziovski, 1999; Benner and Tushman, 2003).
“Process management entails three main practices: mapping processes,
improving processes, and adhering to the improved processes,” (Benner and Tushman,
2003) and involves both individual work processes and the hand offs between individuals
and functions (Garvin, 1995; Harry and Schroeder, 2000). The programs (especially ISO
programs) demand following the mapped processes so that the organization can gain the
cost and quality improvements and auditing is often part of the program, (Hackman and
Wageman, 1995; Harrington and Mathers, 1997; Mukherjee, Lapré, and Van
Wassenhove, 1998; Cole, 1998; Harrington and Mathers, 1997; Harry and Schroeder,
2000; Benner and Tushman, 2003).
The process management methodologies encourage exploitation along the
current technological trajectory and current customers but the focus on reducing variation
retards exploration and limits response to new customers and markets (Henderson et al.,
1998; Sterman, Repenning, and Kofman, 1997; Benner and Tushman, 2003). Process
management determines resource allocation and which projects get supported,

43
(Christensen and Bower, 1996). The implementation of process management techniques
requires process mapping where tacit knowledge is codified and improvement of the
current process and this deep investigation inspires incremental (exploitation) innovation,
(Winter, 1994; Brown and Duguid, 1991;Repenning, 1999; Anderson et al., 1994; Harry
and Schroeder, 2000; Benner and Tushman, 2003). Process management techniques
also improve internal communication and affect the types of technological changes that
are recognized and addressed, (Henderson and Clark, 1990; Benner and Tushman,
2003). From literature on innovation and learning , the more easily information flows
between members of a firm or network, the faster the search process ends and limits the
variation and experimentation.
Process improvement methodologies are typically carried out at lower levels of
the organization. Employees at lower organizational levels have less access to the
overall strategic plans and have limited boundary-spanning roles since the contacts at
this level would be with current customers and suppliers. Spatial myopia develops where
innovation begins to occur only near the innovator in terms of psychometric distance,
(Levinthal and March, 1993). This is a result of the data available on the processes being
improved are by nature those that are existing processes with existing customers and
suppliers (Benner and Tushman, 2003).
From the literature on exploration discussed earlier, variation and slack are
required for exploration. Process management seeks to limit variation and slack in the
system, (Benner and Tushman, 2003). Also at work are the concepts of temporal
learning myopia and learning traps, (Levinthal and March, 1993). Temporal learning
myopia is the focus on short-term goals and in turn an innovator loses sight of the long-
term goals. Learning traps are self-reinforcing loops where the rapid positive feedback

44
encourages more of the same and in process management that would be exploitative
research.
Boundary spanning activities are important for the company to spot new
opportunities and threats. Process management drives the focus to existing processes
and readily available data and those are related to existing customers. The learning
traps and deep structure of the firm encourage building on successes and may limit the
firm’s willingness to take risk or discount opportunities where the data is not available for
analysis.
The ambidextrous organization is a firm level decision that attempts to create
structure that allows both exploration and exploitation by isolating the exploration RandD
groups from the exploitative current production groups. The ambidextrous organization
literature points to structures that limit the contact and management of both groups and
allows the exploratory group to have variation and slack. Companies that seek to adopt
process improvement methodologies should insulate the exploratory groups from those
that will be improving current processes.
The punctuated equilibrium model explains the two phase that an industry can be
in. The equilibrium phase is where the deep structure is stable and the revolutionary
phase is where the structures are drastically changed. In order to gain competitive
advantages in the equilibrium phase, companies introduce incremental changes to set
them apart from their competitors. Companies build on their successes and refine their
product offerings and technology to meet customer needs more efficiently. Companies in
this phase seek to reduce costs while maintaining or improving customer satisfaction and
service levels.
During the equilibrium phase of the market, customer demands are not varying
dramatically and focus groups with customers get their inputs on current product

45
offerings. Exploitative innovations can move the products and processes along to
provide more value to the customer.
The revolution phase in the punctuated equilibrium model is a phase where the
deep structure of the market is fundamentally changed. Rules that were followed in the
previous equilibrium phase are no longer valid. Structures and processes that were
created to maximize performance in the prior equilibrium period are either ineffective or
impede work now needed. Process management strengthens the deep structure of a
firm and an industry. The deep structure will be very resistant to change and will try to
revert to the previous state, which is no longer feasible. The process management
techniques seek to confine and refine processes and reduce variation. Before the new
end state is settled by the market and new deep structure is established, processes
cannot be formalized else they will continue to have a mismatch between processes and
the needs of the environment.
Product innovation (both exploratory and exploitative) is enhanced by market
knowledge, cross-function collaboration, and knowledge integration (Atuahene-Gima
1995, 2005; Day 1994; Li and Calantone, 1998; Griffin and Hauser 1996 Madhavan and
Grover 1998; Maltz and Kohli 2000; Ruekert and Walker 1987; DeLuca and Atuahene-
Gima, 2007). The ability to recognize opportunities is enabled by having a broad
knowledge base (Kogut and Zander 1992). When the knowledge area is too broad, it can
be difficult to make connections and have the knowledge transferred inside the company
Galunic and Rodan 1998). If the company has a limited knowledge base, the knowledge
can be spread more easily and built upon (DeLuca and Atuahene-Gima, 2007).
The ability for a firm to survive long-term hinges on many different aspects that
have been touched upon so far in this dissertation. The company must be able to spot
opportunities and threats in the environment through boundary spanning activities,

46
continue to produce new products that customers value through product innovation, have
access to or develop resources and competitive advantages that allow the company to
compete in its current environment, and have the flexibility to adapt operations after
periods of revolution.
The supplier relationships discussed by (Swink, Narasimhan, and Kim, 2005) can
have a big impact on the innovation of a firm. Boundary spanning activities are important
to identifying environmental risks and opportunities. The amount of vertical integration
and the amount of cooperation and trust in the supply chain would impact the knowledge
that the firm can get about the environment. Companies that are more vertically
integrated would have fewer opportunities to interact with suppliers and competitors than
a company that is more core competency and market focused. Contact with suppliers
and customers at arm’s length provides some information on market needs and
disruption, however more integration and trust of the supply chain allows for more
learning in the company and improves the chances that needs for innovation are
identified. Once suppliers sign cooperation agreements and alliances, information on
opportunities in the market, opportunities for improvement, and knowledge sharing will
begin to increase. This increase in knowledge sharing allows for greater sensitivity to
inputs in the market. The power and control of the vertically integrated companies would
allow for more exploitative innovation as the opportunities for the company to implement
process management processes over the whole value chain.
2.9 Fit
Fit is a multi-dimensional construct that has received much attention in the
strategy literature (Zajac, Kraatz, and Bresser, 2000). Fit tries to measure how well a
company’s various functions work together to support the overall decisions by upper
47
management and the firm’s interaction with the business environment. Strategic fit is at
the core of strategy implementation and strategic fit typically results in better performance
(Ginsberg and Venkatraman, 1985; Miles and Snow, 1994; Zajac, Kraatz, and Bresser,
2000) but what exactly is fit?
“The strength of the strategic fit is conceptualized as the degree of adherence
for a specific unit of analysis with a multidimensional, ideal profile,” (Smith and Reece,
1999). The concept of fit is in the line of theory such as strategy and organization theory
(Ginsberg and Venkatraman, 1985; Zander and Kogut, 1995).
Two general themes that strategy researchers use to classify their research are
formulation and implementation; formulation looks to align the strategy to external
variables and implementation looks to align the internal variables (Venkatraman and
Camillus, 1984). Examples of external variables are product life cycles and
competitiveness for market opportunities (Chandler, 1962; Hofer, 1975; Hedley, 1977;
Henderson, 1979; Venkatraman and Camillus, 1984). Internal variables are things such
as management systems and structure, and corporate culture (Chandler, 1962; Galbraith
and Nathanson, 1979; King, 1978; Lorange and Vancil, 1977;Schwartz and Davis, 1981;
Stonich, 1982; Venkatraman and Camillus, 1984).

48
Figure 2-4 Internal / External Focus (Venkatraman and Camillus, 1984) pg 516.
Venkatraman and Camillus (1984) (above in Figure 2-4) define the six cells
depending on their internal or external focus and if the fit is from the content of strategy or
the process of developing strategy. Cells 1 and 2 are pure focus on either external or
external variables. Cell 3 is a combination of Cells 1 and 2. Cell 4 looks at strategy
beyond the company and into the firm as part of a network or supply chain. “Cell 5
focuses on the pattern of coordination or interactions among internal elements such as
struc¬ture, size, and technology,” (Venkatraman and Camillus, 1984). Cell 6 is involved
with a holistic view of strategy.
1: Strategy Formulation School 4: Interorganizational Networks School
Theme: Theme:
Aligning strategy with the environmental conditions
Strategy analysis at the "collective" level, emphasizing interdependence of strategies of various organizations vying for resource allocation
Contributing Streams: Contributing Streams:
IO-strategy interface Interorganizational networks
Business policy/strategic management Resource-dependency
Constituency analysis
2: Strategy Implementation School 5: Strategic Choice School
Theme: Theme:
Tailoring administrative and organizational mechanisms in line with strategy
Managerial discretion moderating the "deterministic" view regarding decisions on organizational mechanisms
Contributing Streams: Contributing Streams:
Business Policy Contemporary organization theory
Normative strategy literature Business policy-organization theory interface
3: Integrated Formulation-Implementation School
6: Overarching "Gestalt" School
Theme: Theme:
Strategic management involving both formulation and implementation and covering both organizational and environmental decisions
Broadly configuring organization and environment, emphasizing interdependence but not causation
Contributing Streams: Contributing Streams:
Business policy/strategic management Organizational theory
Markets and hierarchies Business policy / strategic management
Population ecology-based concepts

49
St. John, Cannon and Pouder (2001) looked into the elements of strategy from
the point of view of operations and identified two strategic elements of fit and these were
the fit between production and organizational environment and the fit between
production and strategy of the company (St. John, Cannon, and Pouder, 2001).
Apart from the items that you are looking to fit with strategy, the time frame is
also important to consider to determine if the fit is looked at a single point in time (static)
or changing over time (dynamic) (Venkatraman and Camillus, 1984). The concept of the
dynamic and static fit is similar to the debate in the RBV. In early RBV literature,
resources were treated as static and later developed into dynamic resources. This also
occurs in the fit literature. Zajac, Kraatz, and Bresser (2000) look at the changes of fit
over time based on changes in the environment, the ability of a company to identify
changes, and the reaction to the changes. The authors developed four possibilities for
this dynamic fit. “Beneficial strategic change” is a positive dynamic fit is when a company
identifies the need and changes appropriately. “Insufficient strategic change” is a
negative dynamic misfit is that a company identifies the need to change, but does not
react appropriately. “Beneficial inertia” occurs when a company already has good fit
and external changes do not require changes by the company. Lastly, “excessive
change” is a negative misfit that causes the company to make large changes when they
are not really required (Zajac, Kraatz, and Bresser, 2000).
The fit between the organization’s strategy, structure and operations has been
addressed in literature and the fit between strategy and structure has a positive impact on
a company’s performance (da Silveira, 2005; Devaraj et al., 2004; Tarigan, 2005; Kroes
and Ghosh, 2010). The operations strategy should be aligned with company strategy for
optimal performance (Skinner, 1969; Bozarth and McDermott, 1998; Frohlich and Dixon,
2001; Narasimhan and Carter, 1998; Safizadeh et al., 1996).

50
Poor performers have shown to have poor fit (Skinner, 1969, Hill, 1994; Ward
and Duray, 2000), and lack of strategic alignment is related to lower market share (da
Silveira, 2005; Kroes and Ghosh, 2010) while companies that have alignment between
general managers and manufacturing managers have higher performance Tarigan
(2005). Quality in manufacturing strategy mediates the differentiation strategy (Ward and
Duray, 2000). Performance improvements from strategies are implemented in
manufacturing strategy and there is a relationship between environment, performance
and manufacturing (Miller and Roth, 1994; Hayes and Pisano, 1996; Devaraj et al., 2004;
Ward and Duray, 2000).
Strategic initiatives should drive organizational structure (Donaldson, 1998;
Nadler and Tushman, 1997; Tushman, Smith, Wood, Westerman, and O’Reilly, 2002)
and must fit the environmental conditions (Lawrence and Lorsch, 1967; (Hannan and
Freeman, 1989; Gresov, 1989; Chandler, 1990; Tushman, Smith, Wood, Westerman,
and O’Reilly, 2002). This fit, however, can create inertia (Sorensen, 2002; Tushman and
Romanelli, 1985). When the environment shifts, the company can have difficulties
adapting and could fail via punctuated equilibrium model (Miller, 1994; Romanelli and
Tushman, 1994; Rosenbloom, 2000; Siggelkow, 2001; Tushman, Smith, Wood,
Westerman, and O’Reilly, 2002).

51
2.10 Surviving a Changing Environment
Companies are not closed systems that produce everything that it needs. A
company must interact with its environment. “Organizations depend on environments for
resources—labour, capital, technology, demand for outputs—needed for survival,” (St.
John, Cannon, and Pouder, 2001). There exists a link between strategy and the
environment and manufacturing often has to react to threats and opportunity
(A.R.Cannon and John, 2001). The term environment includes both the macroeconomic
environment and the microeconomic environment of the industry. Companies must
compete for these resources in the open market in various market conditions.
Recessions reduce the demand for products and reduce the availability of capital to a
company. During times of economic growth, there is more competition for materials and
labor. The company’s location also has an impact on the availability of resources and is
an important factor in the environmental analysis.
Porter’s Five Forces (Porter, 1980) model has been a standard method for
analyzing the competitiveness of the industry. The major components of the
environmental analysis are the power relationships between the company and its
suppliers and customers, the threats of new entrants, and threats of substitute products.
Once the environment starts to change either gradually or via punctuated
equilibrium how does a company react? Organizational ecology suggests that most
companies cannot change and will fail from their own momentum (Amburgey, Kelly and
Barnett, 1993; Audia, Locke and Smith, 2000; Hannan and Carroll, 1992; O'Reilly and
Tushman, 2008). Some companies can survive through either ambidexterity or dynamic
capabilities (O'Reilly and Tushman, 2008).
52
A company must be able to spot opportunity and threats and this is accomplished
through scanning and exploration (O'Reilly and Tushman, 2008). The company must be
able to react to these changes by reallocating resources and changing the structure and
operations of the company (Teece, 2006), (O'Reilly and Tushman, 2008). Often,
companies will try to reduce its risk and uncertainty by saving on research costs and
imitate companies within the industry by copying its processes and products which is
labeled as mimetic isomorphism, (Cyert and March, 1963; Haveman, 1993; St. John,
Cannon, and Pouder, 2001).
A company has two types of risk, industry risk and company specific risk
measured by the financial variable β (beta) (Carhart, 1997; Fama and French, 1993). All
companies in an industry faces the same industry risk and it is difficult if not impossible to
insulate itself from the risk except for deciding to compete in a different industry. The
company specific risk is related to the decision it makes and is mostly under the control of
management. The firm β affects the ability to get financing, investment, and
competitiveness of the company. This β ultimately affects a company’s ability to survive
over the long term. The level of exploration-exploitation, operation decisions, and
structure are critical decisions made and all affect the risks of the company.
2.11 How Networks Help Innovation
This dissertation will focus on the individual company in the medical device
industry and the resources available in-house. It cannot be ignored that modern
companies do not act as a lone wolf and are actually part of some supply chain and
network. Competition is no longer firm vs. firm, but now supply chain vs. supply chain
(Ketchen and Hult, 2007). This topic of network aspects will be briefly touched on, but

53
this is for only completeness of research and to act as a jump point for the next stage of
research, which would be to analyze a company’s supply chain and innovation network.
The structure of the network of researchers plays a large role in how exploratory
or exploitive the industry is. Highly innovative industries would have random connectivity
and exploitative industries would have higher connectivity (Lazer and Friedman, 2007).
Isolation of research groups is encouraged for parallel development of technology. The
lower connectivity prevents the rapid spread of knowledge. The slower that innovation
spreads, the better it is for creativity. If knowledge is spread rapidly, the search for
solutions will stop sooner and the chances of a suboptimal solution are increased.
For less established and smaller firms, the network connections it has is more
important that larger firms with more in-house resources (Baum, Calabrese and
Silverman, 2000; Shan, Walker and Kogut, 1994; Stuart, 2000). Companies that are
more innovative cooperate more in the network and have more centrality (Castellacci,
Grodal, Mendonca, and Wibe, 2005). The company’s location in the network determines
the structural holes that it can see (Frankort, 2008; Brass, Galaskiewicz, Greve, and Tsai,
2004).
54
Chapter 3
Model
To highlight the literature review, innovation is a critical component of the
economic and company success. Innovation is loosely defined as “doing new things that
customers ultimately appreciate and value,” (Cash, Earl, and Morison, 2008). From early
work of March (1991), innovation was broken into two major categories called Exploration
and Exploitation. March believed these are two distinctly separate ideas and were
mutually exclusive paths for innovation. Exploration is the quest for new knowledge that
is not based on pre-existing knowledge available inside the firm or industry and this
knowledge results in radical, game-changing, disruptive technologies that change the
trajectory of technology development in an industry and opens new product markets
(Benner and Tushman, 2003; He and Wong 2004).
Exploitation is the application, refinement, optimization, and improvement of
existing products and knowledge (March 1991) and continues the existing trajectory of
(Benner and Tushman, 2003; He and Wong 2004). Through research and anecdotal
evidence, some companies do appear to do both at the same time. A new concept of
ambidexterity was devised to describe the existence of the two mutually exclusive
innovation types occurring in the same company. Ambidexterity can occur through either
asynchronous models where the company does one and then switches to the other or it
can structurally modify its research so that the company can have both occurring at the
same time, but in different parts of the company (Gupta, Smith, and Shalley, 2006).
Operations management is important because in our area is where resources are
turned into products and services. Operations strategy balances efficiency, flexibility,
capital budgeting, and risk. The study of manufacturing strategy as separate from
corporate strategy began to come into focus in works like Skinner 1978, Hayes and
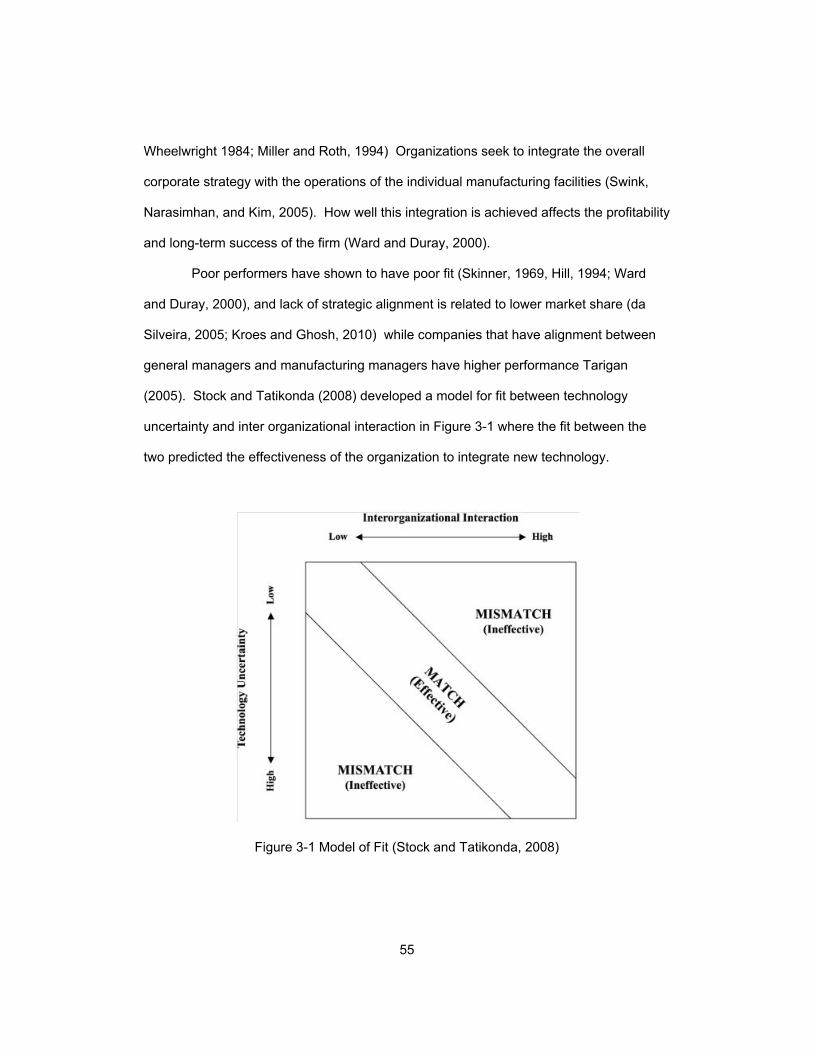
55
Wheelwright 1984; Miller and Roth, 1994) Organizations seek to integrate the overall
corporate strategy with the operations of the individual manufacturing facilities (Swink,
Narasimhan, and Kim, 2005). How well this integration is achieved affects the profitability
and long-term success of the firm (Ward and Duray, 2000).
Poor performers have shown to have poor fit (Skinner, 1969, Hill, 1994; Ward
and Duray, 2000), and lack of strategic alignment is related to lower market share (da
Silveira, 2005; Kroes and Ghosh, 2010) while companies that have alignment between
general managers and manufacturing managers have higher performance Tarigan
(2005). Stock and Tatikonda (2008) developed a model for fit between technology
uncertainty and inter organizational interaction in Figure 3-1 where the fit between the
two predicted the effectiveness of the organization to integrate new technology.
Figure 3-1 Model of Fit (Stock and Tatikonda, 2008)

56
This model has been adapted to the relationship between the innovation strategy
and operations strategy. Figure 3-2 below shows the concept for the pure research
models where a company predominantly follows one type of innovation or another and is
profitable only where the strategies fit.
Figure 3-2 Operations Strategy Model
Following the literature and research model shown about that the fit between the
corporate strategy and operations strategy has a positive effect, it is proposed that a
similar relationship between innovation strategy and operations strategy exists.
H1: Companies with better fit between operations strategy and innovation
strategy will have better performance.

57
Although having a great fit between the operations strategy and innovation
strategy is a good indicator of a company’s success, its resources can moderate this
success. If the company does not have sufficient resources to carry on as a company or
maintain operations, it cannot compete long term and will not be able to make profits.
The concept of resources comes from the Resource Based View (RBV) of the firm is a
theory of the firm that seeks to match the strategy of the organization to its internal
resources (Grant R. M., 1991).
The RBV assumes firms are profit-maximizing entities directed by bounded
rational managers in markets that are to a reasonable extent predictable and moving
towards equilibrium (Bromiley and Papenhausen, 2003; Leiblein, 2003; Kraaijenbrink,
Spender, and Groen, 2010; Rugman and Verbeke, 2002). The Resource Based View
seeks to explain the competitive advantages of the company by looking at the resources
a company has and how it uses them and that resources are heterogeneous across
companies (Barney, 1991; Grant 1991; Schroeder, Bates, and Junttila, 2002; Knott,
Bryce, and Posen, 2003; Rugman 2002). Resources that firms have are different and the
differences can persist long-term, despite the system’s attempt to reach equilibrium
(Barney, 1991; Rumelt, 1984; Wernerfelt, 1984; Chuang, 2004). There are six major
categories of resources upon which capabilities are made. These are classified as
financial, physical, human, technological, reputation, and organizational (Grant R. M.,
1991).
The resource-based model is fundamentally concerned with the internal
accumulation of assets, with asset specificity, and, less directly, with transactions costs”
(Peteraf, 1993). The competitive advantages of companies are not static and can change
over time (Helfat, Peteraf 2003).

58
Linking the RBV to exploitation and exploration can be seen on the inputs to the
barriers to entry, cost advantage and differentiation advantage. Patents leading to
barriers to entry and technology linked to product differentiation advantage would be
results of exploration.
Therefore, a company’s resources affect how well the company can take
advantage of its fit between innovation and operations strategy.
H2: The resources a company has will positively moderate the difference in
profitability of companies with good fit between operations strategy and innovation
strategy.
Figure 3-3 Model for H1 and H2
Figure 3-3 graphically shows the relationships between Innovation and
Operations Strategies into the concept of Fit. H1 examines the relationship between Fit
and Financial Performance. H2 introduces resources as a moderating variable.

59
What is good in the long run is not always good in the short run,” (March, 1991)
Established companies must continue to invest in RandD to maintain or increase its
status and competitiveness in the market (Cesaroni, Minin, and Piccaluga, 2005).
Companies must stay up to date on the current state of the art of their industries and
maintain collaborative relationships with partners (Cesaroni, Minin, and Piccaluga, 2005)
The focus on exploitation will eventually lead to technological decline in competitive
markets, (Lee and Ryu, 2002; Lee, Lee, and Lee, 2003). While both types of innovation
are needed in the long-term, there are competing demands of each and a company often
moves towards exploitation since the positive feedback is often stronger (Benner and
Tushman, 2002; Gupta, Smith and Shalley, 2006; Henderson and Clark, 1990; Levinthal
and March, 1993; March, 2003; O'Reilly and Tushman, 2008).
“Ambidexterity refers to the synchronous pursuit of both exploration and
exploitation via loosely coupled and differentiated subunits or individuals, each of which
specializes in either exploration or exploitation,” (Gupta, Smith, and Shalley, 2006). The
ambidexterity of the firm is not feasible at the group level due to the difference in
expected outcome of tasks in exploration and exploitation, but can exist when the groups
are separated (Gupta, Smith, and Shalley, 2006). Ambidextrous organizations have high
level of differentiation with dedicated management and groups focused on each form of
innovation with reporting structures that go to senior management, low integration and
contact between groups, and top management support for both exploration and
exploitation (Tushman, Smith, Wood, Westerman, and O’Reilly, 2002). Ebben and
Johnson (2005) conducted a study of 300 small companies and found they did better
when following a single strategy of either flexibility of efficiency instead of trying to do
both.

60
Research has identified three main reasons why a company would not be able to
do both effectively at the same time. March, (1991) said that pursuit of one makes you
naturally do less of the other. Firms that try to do both have to select which to give more
resources to and lack focus (Miller and Friesen, 1986). And finally, it should match its
strategy to the business environment (Galbraith, 1973; Lawrence and Lorsch, 1967;
Kyriakopoulos and Moorman, 2004). More recently, research has shown that there is a
middle ground between the Exploiters and Explorers. The group that occupies the
middle ground is called ambidextrous organizations (Gupta, Smith, and Shalley, 2006).
While there is some variations in definitions of exploration and exploitation (Nerkar, 2001;
Vassolo, Anand, and Folta, 2004; Vermeulen and Barkema, 2001, Rosenkopf and
Nerkar’s, 2001; Benner and Tushman, 2003), the definitions below will be used for this
paper. Exploitation innovation is focused on efficiency, productivity, and variance
reduction while exploration is about wide search, new discovery, and embracing variation
(O'Reilly and Tushman, 2008). Ambidexterity is about doing both (Duncan, 1976;
Tushman and O’Reilly, 1997; O'Reilly and Tushman, 2008)
H3: Companies with higher ambidexterity will have better performance.
This hypothesis is graphically represented in figure 3-4 demonstrating the
relationships between variables in H3.
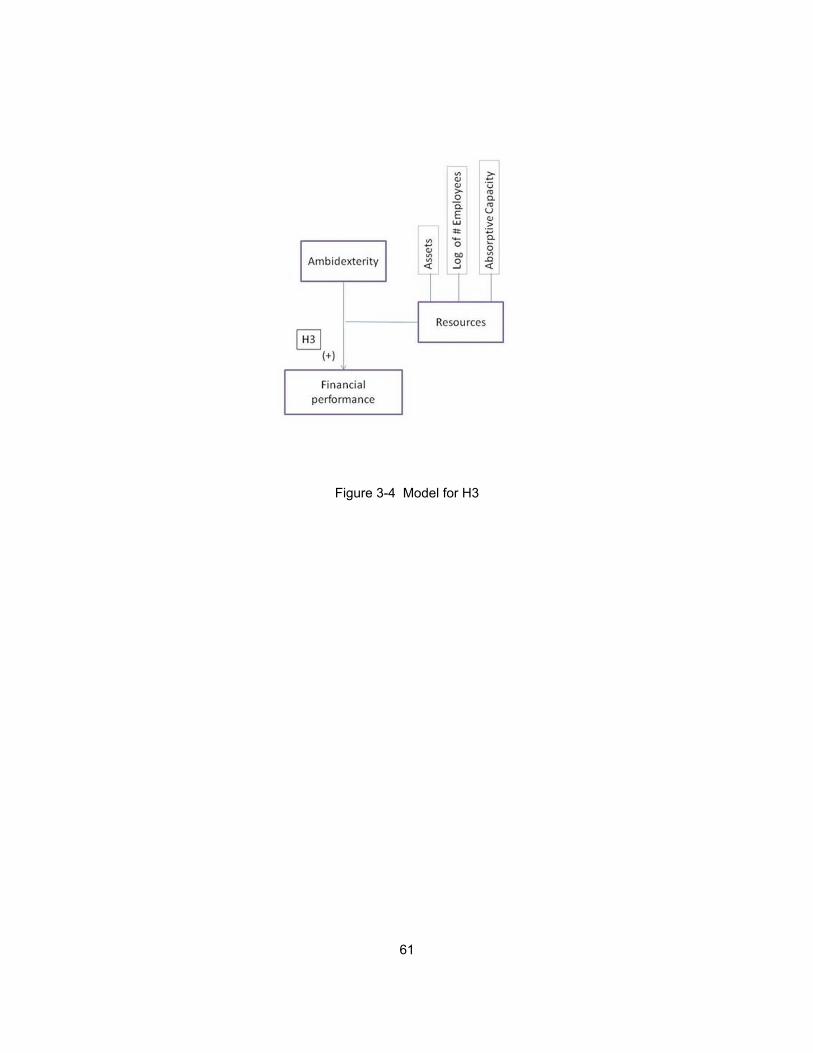
61
Figure 3-4 Model for H3

62
Chapter 4
Analysis / Methodology
4.1 Industry and Company Selection
The industry of focus for this dissertation will be the medical device industry.
One aspect of the medical device industry that lends itself well to using patent data is that
every device used on a human must have FDA approval. This approval process is
lengthy and public. The public aspect of the application process is a strong incentive for
companies to patent their innovation. Some other industries may use secrecy to protect
their innovation from competitors, but that is not possible in medical devices. Another
benefit of the medical device industry is the large number of publicly traded companies
with easily accessible financial data over a long timeframe to cover multiple economic
cycles.
4.2 Data Sources
The analysis presented in this dissertation builds off of the research using
patents as a measure of knowledge (Dutta and Weiss, 1997; Henderson and Cockburn,
1994, Jaffe, Trajtenberg and Henderson, 1993, Engelsmann and van Raan, 1994, Albert,
Avery, Narin, and McAllister, 1991; Narin, Noma, and Perry, 1987; Rosenkopf and
Nerkar, 2001). The patent data for this dissertation will come from secondary sources of
data that are readily available to the research community. Data for patents are from the
National Bureau of Economic Research (NBER) database of patents approved by United
States Patent and Trade Mark Office (USPTO) between 1963 to 1999 (Hall, Jaffe, and
Trajtenberg, 2001) and from the updated files from the updated patent data project which

63
included patents awarded until 2006 (Hall B. H., 2010). The data in the updated files also
fix many of the problems associated with the original database. Among other
improvements, the researchers standardized the assignee data and eliminated many of
the spelling discrepancies in the assignee names. The update project also included the
CUSIP number for referencing the assignee in the North American Compustat database.
One problem for the new data files is that it did not include the calculated variables such
as Originality and Generality. These were included in the 1963-1999 data files but not in
the 1976-2006 data. The data is critical to the hypotheses of this paper, so a new
dataset was created that matched the patents, assignees, and CUSIP numbers of the
1976-2006 data with the original data of the 1963-1999 dataset to create a more
complete dataset for 1963-1999. The dataset was also limited to sub group 32 (medical
devices) and limited to data entries with non-blank entries for CUSIP number and
Originality. The resulting dataset contains 11,310 separate patents assigned to 354
unique firms.
Song et. al. found through a meta-analysis that supply chain integration and
patent protection were significant factors in success of new technology ventures (Song,
Podonitsyna, Bij, and Halman, 2008). Patent data have been used to investigate
innovation. (Almeida, 1996; Rosenkopf and Nerkar, 2001; Ahuja and Lahiri 2006;
Trajtenberg, Henderson, and Jeffe, 1997). The USPTO requires patent applicants to
provide citations to other patents that were used in development of the idea being
patented, name of researchers, assignees, and industry codes. The citations and
industry codes will be used in the analysis and classification of exploration and
exploitation innovation. Financial and securities information for public companies will be
obtained from the COMPUSTAT database. These data will be used to test the
hypotheses for profitability and long-term competitive advantage. Although there are

64
some limitations using secondary sources of financial and operational data, this data is
appropriate because the data is not readily accessible from other sources and will be
used from public companies in the same industry and therefore subject to the same
accounting and reporting rules (Venkatraman and Ramanujam, 1986).
4.3 Variables
4.3.1 Innovation
An effective measure of innovation is patent data (Dutta and Weiss, 1997;
Henderson and Cockburn, 1994, Jaffe, Trajtenberg and Henderson, 1993, Engelsmann
and van Raan, 1994, Albert, Avery, Narin, and McAllister, 1991; Narin, Noma, and Perry,
1987; Rosenkopf and Nerkar, 2001; Ahuja and Lahiri 2006; Ahuja, 2000; Silverman,
1999; McGrath and Nerkar, 2004).
For this dissertation, each patent will be classified as exploratory and
exploitative based on if the innovation is based upon knowledge familiar inside the
company. This is a simplification of both the Daneels and Rosenkopf and Nerkar models
(Danneels, 2002; Rosenkopf and Nerkar, 2001). While their models further delineate the
breakdown of innovation, the root of the innovation is if the innovation is based on
existing knowledge within the firm. For this, the measure will be if the patent is related to
work previously patented by the firm. This classification is included in the NBER
database as the self citation variable (Trajtenberg, Henderson, and Jeffe, 1997; Hall,
Jaffe, and Trajtenberg, 2001) and used to measure innovativeness (Palomeras, 2007;
Yang, 2010). The higher the self citation measure is, the higher the exploitation of
knowledge inside the company.
65
The exploration of the company is measured by the originality of the patents.
The variable originality is a measure of the breadth of use of knowledge outside the
patent class. The ratio is the patent citations from outside the patent class compared to
the total reference patents. The higher the originality variable equates to a broader the
base of knowledge that the patent references (Trajtenberg, Henderson, and Jeffe, 1997).
So the higher the originality variable is, the higher the exploration of the patent.
Ambidexterity is theoretically modeled as how the company is able to do both
exploration and exploitation at the same time. For this dissertation, the measure of
ambidexterity will be the product of the variables self citation and originality.
4.3.2 Value
Valuation of the firm has been measured in multiple ways in literature from
finance, management, marketing and operations. Traditional financial metrics and ratios
used to measure performance include Return on Equity (ROE) is a common
measurement of firm performance in strategic management journals due to its ease of
use and that it eliminates the need for controlling for firm size (Tothaermel and
Alexandre, 2009), return on assets, return on sales and cash flow margin are also
common (Fullerton, McWatters, and Fawson, 2003; Cron, Sobol, 1983; Hitt, Brynjolfsson,
1996; Strassman, 1990; Weill, 1992; Bharadwaj, 2000) and sales growth rate, (Bierly and
Chakrabarti, 1996; Katila and Ahuja, 2002; Rosenkopf and Nerkar, 2001; McGrath, 2001;
He and Wong, 2004)
Tobin’s Q is used to measure the company’s value over time (Uotila, Maula, Keil,
and A.Zahra, 2009; Modi and Mishra, 2011). “Market value based measures such as
Tobin’s Q have the advantage of capturing short-term performance and long-term
prospects (Lubatkin and Shrieves, 1986; Allen, 1993), allowing us to operationalize both

66
short- and long-term performance effects using a single performance variable,” (Uotila,
Maula, Keil, and A.Zahra, 2009).
For this dissertation, I will be using the approximated Tobin’s Q as presented in
Chung
approximate q = (MVE + PS + DEBT) / TA
where MVE is the total market value of outstanding stocks at calendar year end,
PS is the value of preferred stock, DEBT is the net value of short-term debt minus short-
term assets plus book value of long-term debt, and finally TA is the total assets at book
value (Chung and Pruitt, 1994).
4.3.3 Resources
(Grant R. M., 1991) identified six categories of resources: financial resources
(short term assests), physical resources (ppe), human resources (employees),
technological resources (IT budget), reputation (goodwill), and organizational resources.
(Grant R. M., 1991).
I will use the following measures for the resources a company has based on
information available in the COMPUSTAT database:
Human Resources: number of employees (Ahuja and Katila, 2001)
Technical Resources: RandD intensity as a ratio of RandD spending/sales
(Cohen and Levinthal, 1989, 1990; Tothaermel and Alexandre, 2009; Knott, Bryce, and
Posen, 2003)
4.3.4 Efficiency
Again, there are many options to use to measure efficiency. One measure that is
often used is the traditional ROA which is ROA = Revenue / Assets and the other is

67
Production Efficiency which is Sales / PPE (Modi and Mishra, 2011; Hendricks, Singal,
and Zhang, 2009; Herold, Jayaraman, and Narayanaswamy, 2006; Bharadwaj, 2000)
defined some more operational measures commonly used such as OI/A and OI/S
Operating Income to assets or sales (McKeen and Smith 1993, 1996); OI/E - operating
income to employees (Bharadwaj, 2000); and OEXP/s - operating expenses to sales
(Bharadwaj, 2000); COGS/s - COGS to sales (Mitra and Chaya, 1996; Bharadwaj, 2000;
Ferdows and De Meyer, 1990; Hayes and Wheelwright, 1984; Miller and Roth, 1994;
Schroeder, Bates, and Junttila, 2002).
These ratios will be compared to industry averages, where the industry is
defined by SIC code until 1997 and NAICS codes after 1997, to determine if the
companies are above or below average efficiency. I believe there must be an additional
segment carved out of this number for the companies that outsource operations. These
firms would appear to be highly efficient since the limited PPE in the denominator would
tend to send both Production Efficiency and ROA to very high levels. I again propose to
initially use a quartile system of segmenting the data and then following up with a k
means cluster analysis. Firms with Production Efficiency >.75 would be classified as
highly efficient outsource; firms with ROA and Production Efficiency >.5 ≤ .75 be labeled
as efficient; >.25 ≤ . 5 would be called inefficient; and finally they bottom quartile would
be labeled as highly inefficient and likely companies in distress.
.
4.3.5 Fit Variables
The main focus of this dissertation is the degree the degree to which the
company matches their operations to the innovation strategy. These variables will be
binary 0,1 variables where 1 is true and 0 is false. Since I am going to test the lower left,
upper right, and diagonals for fit and performance, I need to construct three variables.

68
Fit-Exploit: This is for the quadrant that matches above average efficient
operations with exploitative innovation. The variable will be 1 if the firm is Exploitative
(Originality <.25) and if the firm is above average in efficiency. It will be 0 for all other
combinations.
Fit-Explore: This is for the quadrant that matches below average efficiency with
exploratory innovation. The variable will be 1 if the firm is Exploitative (Originality >.75)
and if the firm is below average in efficiency. It will be 0 for all other combinations.
Fit-General: This is a general measure if the firm is following a strategy along the
diagonal and will be 1 if it meets either Fit-Exploit, Fit-Explore, or if it is ambidextrous.
Table 4-1 summarizes the variable definitions and relevant literature foundations.
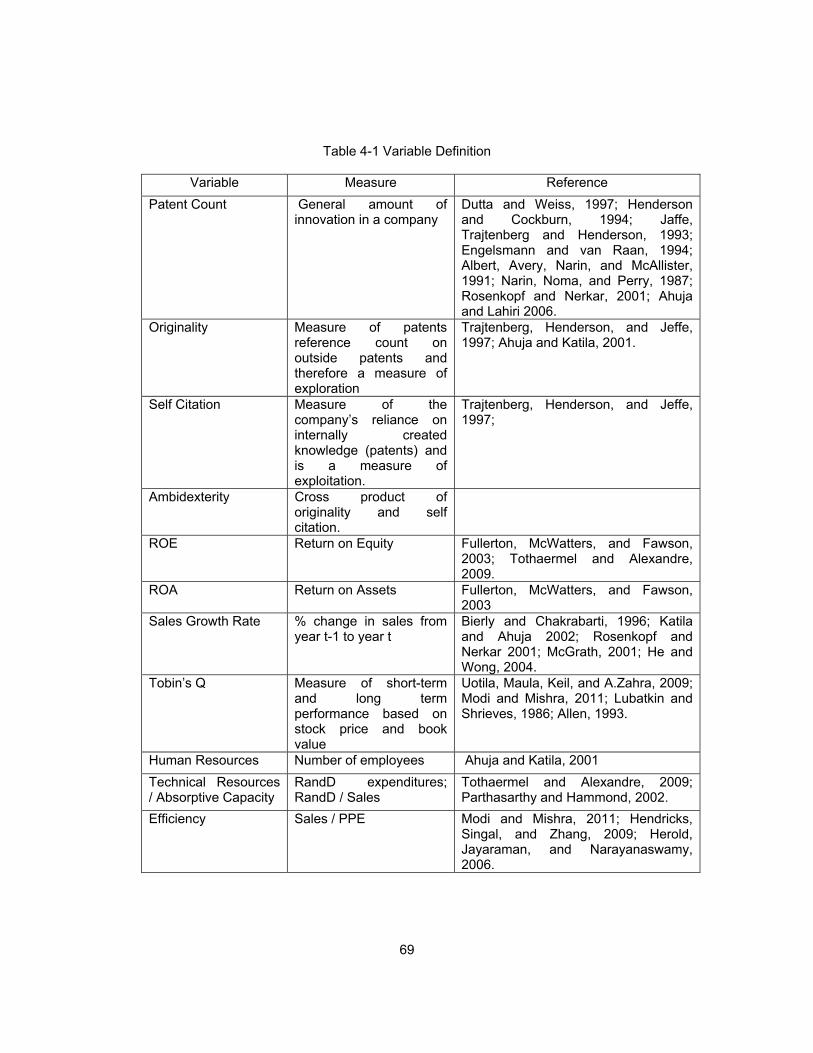
69
Table 4-1 Variable Definition
Variable Measure Reference
Patent Count General amount of innovation in a company
Dutta and Weiss, 1997; Henderson and Cockburn, 1994; Jaffe, Trajtenberg and Henderson, 1993; Engelsmann and van Raan, 1994; Albert, Avery, Narin, and McAllister, 1991; Narin, Noma, and Perry, 1987; Rosenkopf and Nerkar, 2001; Ahuja and Lahiri 2006.
Originality Measure of patents reference count on outside patents and therefore a measure of exploration
Trajtenberg, Henderson, and Jeffe, 1997; Ahuja and Katila, 2001.
Self Citation Measure of the company’s reliance on internally created knowledge (patents) and is a measure of exploitation.
Trajtenberg, Henderson, and Jeffe, 1997;
Ambidexterity Cross product of originality and self citation.
ROE Return on Equity Fullerton, McWatters, and Fawson, 2003; Tothaermel and Alexandre, 2009.
ROA Return on Assets Fullerton, McWatters, and Fawson, 2003
Sales Growth Rate % change in sales from year t-1 to year t
Bierly and Chakrabarti, 1996; Katila and Ahuja 2002; Rosenkopf and Nerkar 2001; McGrath, 2001; He and Wong, 2004.
Tobin’s Q Measure of short-term and long term performance based on stock price and book value
Uotila, Maula, Keil, and A.Zahra, 2009; Modi and Mishra, 2011; Lubatkin and Shrieves, 1986; Allen, 1993.
Human Resources Number of employees Ahuja and Katila, 2001
Technical Resources / Absorptive Capacity
RandD expenditures; RandD / Sales
Tothaermel and Alexandre, 2009; Parthasarthy and Hammond, 2002.
Efficiency Sales / PPE Modi and Mishra, 2011; Hendricks, Singal, and Zhang, 2009; Herold, Jayaraman, and Narayanaswamy, 2006.

70
Table 4.1 continued
OI/A and OI/S Ratios of Operating Income to Assets or Sales
McKeen and Smith 1993, 1996; Bharadwaj, 2000.
OI/E operating income to employees
Bharadwaj, 2000
OEXP/s operating expenses to sales
Bharadwaj, 2000
COGS/s COGS to sales Mitra and Chaya 1996; Bharadwaj, 2000
Absorptive Capacity RandD expenditures Tothaermel and Alexandre, 2009
Beta Firm specific risk Fama French 1993, Carhart 1997
4.4 Analysis and Results
Three separate methodologies were utilized to test hypotheses. First, cluster
analysis was used to let the data determine grouping and those groups were used for
testing hypotheses. Second, theory and quartiles were used to divide the data for
hypothesis testing. Finally, a regression analysis was used to test the relationships
between variables.
4.4.1 Dataset Review
The data set used was created by combining data from CRSP and USPTO
databases. The first step in the analysis was to look for problems in the data. Initial
investigation shows that there were 1077 unique data points for companies issued
patents between 1969 and 1999 in the medical device industry. This long time frame
provides a rich source of data but can also cause issues of cross-sectional dependences
in samples with timeframes > 20 years (Baltagi, 2001; Torres-Reyna, 2010).
Simple scatter plots for various pairs of variables are shown below to look for any
anomalies in the data over time.
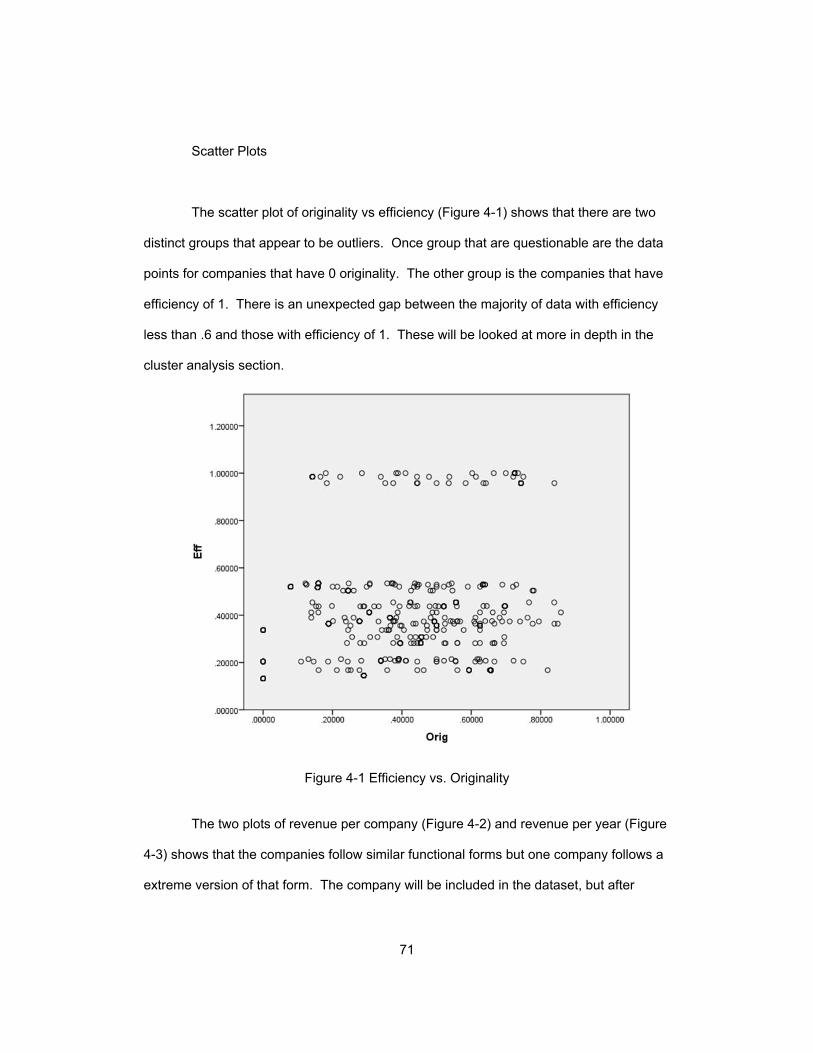
71
Scatter Plots
The scatter plot of originality vs efficiency (Figure 4-1) shows that there are two
distinct groups that appear to be outliers. Once group that are questionable are the data
points for companies that have 0 originality. The other group is the companies that have
efficiency of 1. There is an unexpected gap between the majority of data with efficiency
less than .6 and those with efficiency of 1. These will be looked at more in depth in the
cluster analysis section.
Figure 4-1 Efficiency vs. Originality
The two plots of revenue per company (Figure 4-2) and revenue per year (Figure
4-3) shows that the companies follow similar functional forms but one company follows a
extreme version of that form. The company will be included in the dataset, but after

72
hypotheses are tested, this company will be examined to see if it has an effect on the
hypotheses and the individual companies will be examined to see what makes them
unique.
Figure 4-2 Revenue per Company (CUSIP Number)
Figure 4-3 Revenue per Year per Company
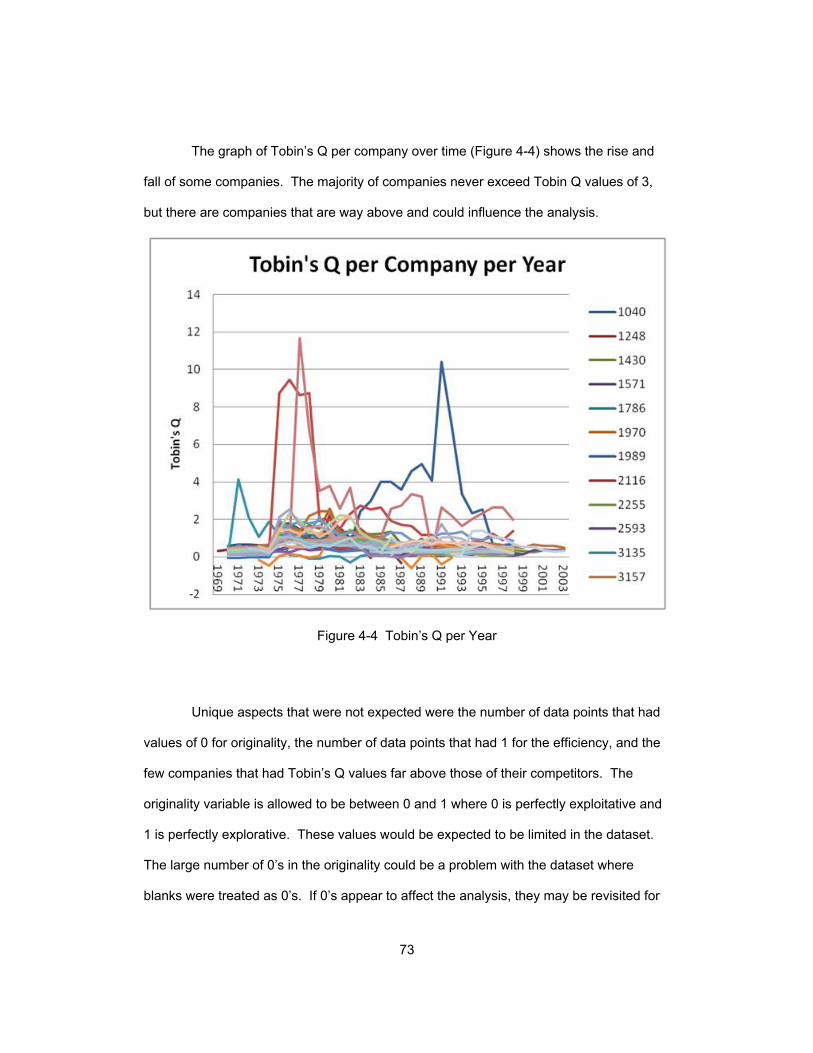
73
The graph of Tobin’s Q per company over time (Figure 4-4) shows the rise and
fall of some companies. The majority of companies never exceed Tobin Q values of 3,
but there are companies that are way above and could influence the analysis.
Figure 4-4 Tobin’s Q per Year
Unique aspects that were not expected were the number of data points that had
values of 0 for originality, the number of data points that had 1 for the efficiency, and the
few companies that had Tobin’s Q values far above those of their competitors. The
originality variable is allowed to be between 0 and 1 where 0 is perfectly exploitative and
1 is perfectly explorative. These values would be expected to be limited in the dataset.
The large number of 0’s in the originality could be a problem with the dataset where
blanks were treated as 0’s. If 0’s appear to affect the analysis, they may be revisited for

74
possible exclusion from the dataset. If 0’s were eliminated, it would leave 959 unique
data points. The data points that have 1’s for efficiency are less troublesome because
these are normalized measures of the ratio of sales to PPE so some 1’s are expected by
the nature of normalization. For the exceptional Tobin’s Q values over certain periods, in
the panel data regression, these points may require further analysis for outliers or their
effect on the analysis.
Assuming the 0’s should stay in the data set, a cluster analysis using R’s function
mclust was conducted. Theoretically, the clusters should form along a diagonal of low
originality (0) and high efficiency (1) to high originality (1) and low efficiency (0). The
expected clusters are: pure exploitative (near originality= 0; efficiency=1); pure
explorative (near originality= 1; efficiency=0); ambidextrous along the diagonal between
these two extremes; and then two clusters off the diagonal in the high and low positions.
In addition, it is hypothesized that the majority of companies will tend to fall along this
diagonal since it should be the highest profitability based on the theoretical construct of
fit.
4.4.2 Cluster Analysis
To identify patterns and grouping in the data that demonstrate how companies
actually structure their efficiency and innovation programs, a hierarchical cluster analysis
was done using the open source statistical program R function “mclust”. The mclust
function displays the Bayesian Information Criteria (BIC) as the measure of goodness of
fit of the clusters using twelve different models as shown in table 1. Of these twelve, only
four are compatible with hierarchical clusters for multivariate analysis. These four are EII
(Spherical distribution, equal volume, and equal shape), VII (spherical distribution,
variable volume, and equal shape), EEE (ellipsoidal, equal, equal) and VVV (Ellipsoidal,

75
variable, variable). The BIC value of each of these four models will be reviewed and the
model with highest BIC value will be chosen.
Table 4-2 shows the parameterizations of the covariance matrix "k currently
available in mclust for hierarchical clustering (HC) and/or EM for multidimensional data.
(‘•’ indicates availability).”

76
Table 4-2 Parameters of Covariance Matrix
Theoretically, the clusters should form along a diagonal of low originality (0) and
high efficiency (1) to high originality (1) and low efficiency (0). The clusters should form
into five (5) clusters: pure exploitative (near originality= 0; efficiency=1); pure
exploratative (near originality= 1; efficiency=0); ambidextrous along the diagonal between
these two extremes; and then two clusters off the diagonal in the high and low positions.
In addition, it is hypothesized that the majority of companies will tend to fall along this
diagonal since it should be the highest profitability based on the theoretical construct of
fit.
The first cluster analysis is using all of the proposed variables originality (orig),
efficiency (eff), the ratio of originality/efficiency (i.e. fit), the natural log of number
employees (lnEmp), and the environmental uncertainty which is the standard deviation of
the last three years of industry sales. The BIC (Bayesian Information Criterion) values
are shown below. The higher the BIC value, the better the fit of the clusters to the

77
dataset. This BIC value is a measure of the intra cluster homogeneity and inter cluster
heterogeneity.
Figure 4-5 BIC Values
As can be seen in Figure 4-5, BIC values are higher for all models across all
clusters compared to the EII and VII models with a peak at five clusters for the VEV
model and near constant BIC values for clusters above two clusters (non EEI and VII
models). Without any theoretical or data reason to chose one model over another, the
VEV model was chosen due to higher BIC values. Another difficulty with cluster analysis
is to know when to stop forming clusters. Theoretically, my model should form clusters
diagonally along a line from high efficiency, low originality to low efficiency, high
originality and clusters off of this diagonal. Instead of determining how many clusters to
form before analysis, I would allow the software to present the optimal number of clusters
based on BIC value.
The result of the cluster analysis is shown below in figure 2 but unfortunately, the
clusters do not form in any pattern close to what is hypothesized. The clusters formed
are often overlapping and do not collect along a diagonal that was envisioned in the

78
literature review. Some interesting patterns do occur in the cluster display highlighted in
red of originality vs environmental uncertainty and efficiency vs environmental uncertainty
(right column of Figure 4-6). Companies in general are more original in their research
and less efficient as uncertainty increases until the economy becomes highly uncertain
when the trend reverses.
Figure 4-6 Cluster Analysis
The cluster analysis with all possible variables did not lead to clusters that were
in line the model developed and also BIC values were very low. The next step in the
cluster analysis was to reduce the variables and see if BIC values improved and if the
clusters became more like the model. The variables were reduced to the main two
variables of the study, efficiency and originality. The first pass included all data points in
the data set, including the originality = 0 and efficiency = 1. Figure 4-7 shows the BIC
values for increasing numbers of clusters and 4-8 shows the clusters created when the
BIC is maximized at 12 clusters and using the EEV model.

79
Figure 4-7 BIC Values with 0’s Included
Figure 4-8 Clusters with 0’s Included
Cluster analysis is sensitive to outliers, so the cluster analysis was repeated
again with the 0’s omitted to see if the clusters were affected by the data points that were
outside the majority of data. With no 0’s, the BIC values increase when compared to the
model with the 0’s included, but the cluster membership and shapes are not affected:

80
Figure 4-9 shows the BIC values for increasing numbers of clusters and 4-10 shows the
clusters created when the BIC is maximized at 13 clusters and using the EEV model.
Figure 4-9 BIC Values without 0’s
Figure 4-10 Clusters without 0’s
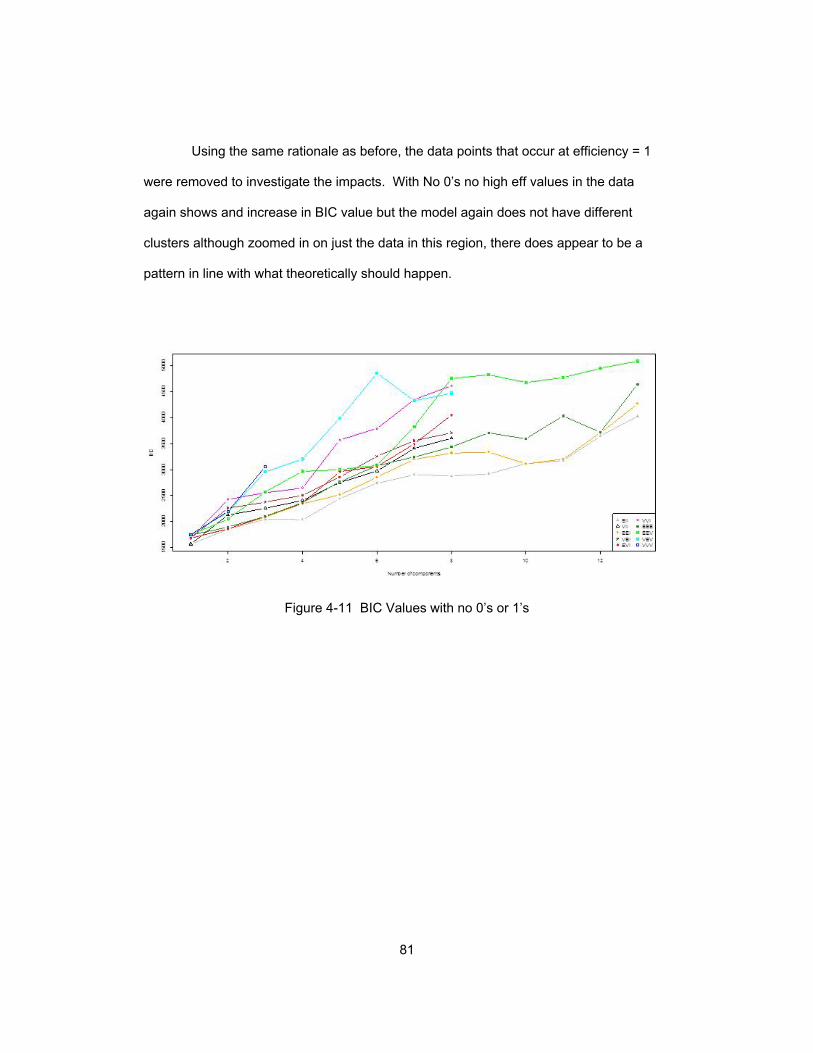
81
Using the same rationale as before, the data points that occur at efficiency = 1
were removed to investigate the impacts. With No 0’s no high eff values in the data
again shows and increase in BIC value but the model again does not have different
clusters although zoomed in on just the data in this region, there does appear to be a
pattern in line with what theoretically should happen.
Figure 4-11 BIC Values with no 0’s or 1’s
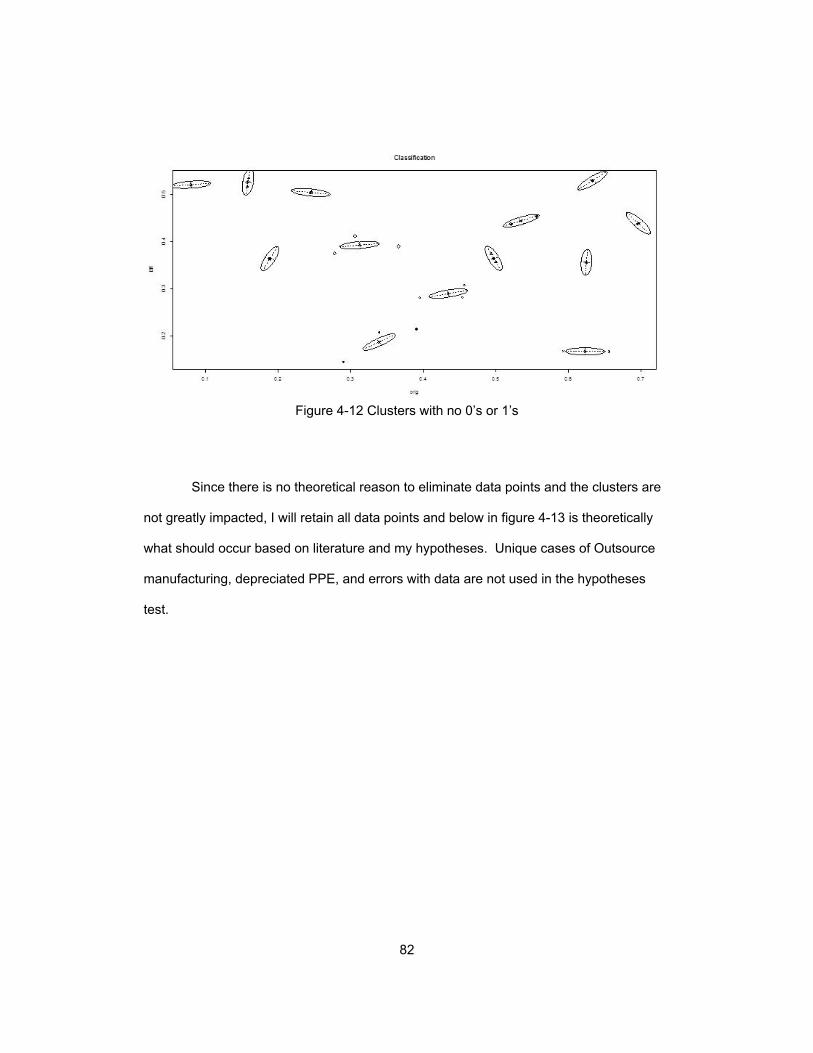
82
Figure 4-12 Clusters with no 0’s or 1’s
Since there is no theoretical reason to eliminate data points and the clusters are
not greatly impacted, I will retain all data points and below in figure 4-13 is theoretically
what should occur based on literature and my hypotheses. Unique cases of Outsource
manufacturing, depreciated PPE, and errors with data are not used in the hypotheses
test.

83
Figure 4-13 Theoretical Grouping of Clusters
Good Fit: (P+N+G+F+Q+R+C+A+K)
Bad Fit Above: (H+O+B+J)
Bad Fit Below: M
4.4.2.1 Hypotheses Testing
H1: The company’s fit between its operations and innovation strategy is
positively associated with the company’s performance.

84
This hypothesis has to be split into two separate hypotheses, one for the area
above the diagonal and one for below the diagonal so that the two bad fit areas do not
interfere with each other in the hypothesis testing.
The analysis was conducted twice using different response variables of Tobin’s
Q and Revenues.
4.4.2.1.1 H1a: µ fit=good > µ fit = bad above; H1b: µ fit=good > µ fit = bad below
H1a: µ fit=good > µ fit = bad above
µ (P+N+G+F+Q+R+C+A+K – µ (H+O+B+J) > 0
Below in Table 4-3 is the output for Tukey Simultaneous Tests using the
statistical software MiniTab. The raw output will only be shown once for clarity in how the
anaylsis was conducted and for here forward, only the relevant information will be
presented in tabular form. All analyses will be done using both Tobin’s Q as a response
variable and repeated using Revenue or Revenue per Employee as appropriate.

85
Table 4-3 Tukey Results for Hypothesis 1
Tukey Simultaneous Tests
Response Variable REVENUE
All Pairwise Comparisons among Levels of C-Fit
C-Fit = Bad-High subtracted from:
Difference SE of Adjusted
C-Fit of Means Difference T-Value P-Value
Bad-Low 473.7 1594.6 0.291 0.9525
Good 417.1 718.7 0.583 0.8306
C-Fit = Bad-Low subtracted from:
Difference SE of Adjusted
C-Fit of Means Difference T-Value P-Value
Good -56.62 1536 -0.03687 0.9993
Tukey 95.0% Simultaneous Confidence Intervals
Response Variable TobinQ
All Pairwise Comparisons among Levels of C-Fit
C-Fit = Bad-High subtracted from:
Tukey Simultaneous Tests
Response Variable TobinQ
All Pairwise Comparisons among Levels of C-Fit
C-Fit = Bad-High subtracted from:
Difference SE of Adjusted
C-Fit of Means Difference T-Value P-Value
Bad-Low -0.1451 0.16645 -0.8715 0.6583
Good 0.0236 0.07501 0.3147 0.9469
C-Fit = Bad-Low subtracted from:
Difference SE of Adjusted
C-Fit of Means Difference T-Value P-Value
Good 0.1687 0.1603 1.052 0.5439

86
Table 4-4 Hypotheses H1a and H1b Results
Hypothesis Comparison Response Variable
Difference of Means
SE of Difference
Adjusted P-Value
Reject H0
H1a µ fit=good > µ fit =
bad above Revenue 417.1 718.7 0.8306 Fail
Tobin's Q 0.0236 0.07501 0.9469 Fail
H1b µ fit=good > µ fit =
bad below Revenue -56.62 1531 0.08
Reject H0
Tobin's Q -2.307 0.5701 0.04 Reject H0
Based on the T test shown in Table 4-4, the tests fail to reject at α/2=5% . It
cannot be said with 90% confidence that there is significant difference between good fit
and bad fits above using Tobin’s Q or Revenue as a response variable.
.
H1b: µ fit=good > µ fit = bad below
µ (P+N+G+F+Q+R+C+A+K) – µ M > 0
The hypothesis will again be testing using first Tobin’s Q as a response variable
and then repeated with Revenue. Referring back to Table 3, the T tests reject the null
hypothesis using both Tobin’s Q or Revenue. The results suggest that there is a
relationship between fit and company performance using cluster analysis and suggest a
potential of a efficiency frontier that companies must reach to maximize performance.

87
4.4.2.1.2 H2: The Relationship Between Fit and Performance Will Be Positively
Moderated by a Company’s Resources
H2: The relationship between fit and performance will be positively moderated
by a company’s resources. This is modeled as the change in difference between mean
values of good fit strategies versus poor fit-below at the high level of resources and the
low level of resources.
The variable cluster corresponds to the cluster identified in the cluster analysis
coded 1-18 for each cluster and the LnEmpQ is a variable (-1,0,1) that represents SME (-
1), Large (0), and Very Large (1).
H2: (µ (P+N+G+F+Q+R+C+A+K), VL - µ M,VL ) ≠ (µ (P+N+G+F+Q+R+C+A+K),
SME - µ M, SME )
(µ (P+N+G+F+Q+R+C+A+K), high - µ M,high ) - (µ (P+N+G+F+Q+R+C+A+K),
low - µ M,low ) ≠ 0
Table 4-5 H2 Results
Hypothesis Comparison Response Variable
Difference of Means
SE of Difference
Adjusted P-Value
Reject H0
H2 (µ good, high - µ bad,
high ) ≠ (µ good, low - µ bad,low )
Revenue 6805 1121 0.0001 Reject H0
Tobin's Q -0.4528 0.1236 0.0007 Reject H0
Table 4-5 shows there is a statistically significant difference between the change
in performance from good fit versus bad fit at the high resource company versus a low
resource company at the α=.01 level.

88
4.4.3 Quartiles Analysis
After finding lack of significance using the cluster analysis the initially proposed
method of segmenting the data by quartiles was used where the upper, middle and lower
quartiles of variables were used to identify the levels of the variables. Variables were
coded as (-1) for lower quartile, 0 for mid range, and (1) for upper quartile and shown in
Table 4-6.
Table 4-6 Quartiles for Analysis
Quartiles of Independent Variables
-1
(<.25)
0
(.25-.75)
1
(>.75)
Originality (OrigQ) Exploit Explore
Efficiency (EffQ) Low Moderate High
Resources Company Size (# Emp) SME Large
Very
Large
Environmental Uncertainty (EnvUncertQ) Low Moderate High
4.4.3.1 Hypothesis 1
H1: The company’s fit between its operations and innovation strategy is
positively associated with the company’s performance.
H1: µ fit=good > µ fit = bad

89
Table 4-7 H1 Using Quartiles
Hypothesis Comparison Response Variable
Difference of Means
SE of Difference
Adjusted P-Value
Reject H0
H1 µ fit=good > µ fit = bad
Revenue 5516 2077 0.2 Fail
Tobin's Q 0.0833 0.10608 1.000 Fail
As shown in Table 4-7, the fit between operations strategy and innovation
strategy is not statistically significant using either revenue or Tobin’s Q as response
variable.
4.4.3.2 Hypothesis 2
H2: The relationship between fit and performance will be positively moderated
by a company’s resources which is modeled as the change in difference between mean
values of good fit strategies versus poor fit below at the high level of resources and the
low level of resources.
H2: (µ (Good Fit), high - µ Bad Fit,high ) ≠ (µ (Good Fit), low - µ Bad Fit,low )
(µ (P+N+G+F+Q+R+C+A+K), high - µ M,high ) - (µ (P+N+G+F+Q+R+C+A+K),
low - µ M,low ) ≠ 0

90
Table 4-8 H2 Using Quartiles
Figure 4-14 Interaction Effects
Quartile Analysis
Hypothesis Comparison Response Variable
Difference of Means
SE of Difference
Adjusted P-Value
Reject H0
H2
(µ (Good Fit), high - µ Bad
Fit,high ) ≠ (µ (Good Fit), low - µ Bad Fit,low )
Revenue 239.6 95.41 0.1309 Fail
Tobin's Q 0.6681 0.1966 0.0845 Reject H0
H2

91
The analysis shows in Table 4-8 that the null hypothesis is rejected at the α=10%
confidence level using Tobin’s Q as response variable, but failed to reject the null
hypothesis using revenue as response variable. Figure 4-14 shows the interaction
effects for H2 using Tobin’s Q as a response variable.
4.4.3.3 Hypothesis 3
H3: Companies with higher ambidexterity will have better performance.
Table 4-9 presents the results for H3 testing using quartiles and based on the
results, failed to reject the null hypotheses for both Revenue and Tobin’s Q.
Table 4-9 H3 Quartile Results
Quartile Analysis
Hypothesis Response Variable Difference of Means
SE of Difference
Adjusted P-Value
Reject H0
H3 Revenue 4485 21927 0.0211 Reject
Tobin's Q -.03606 0.1684 0.8307 Fail
92
4.4.4 Regression Analysis
Following clustering analysis and ANOVA to test for significance, a regression
model was fitted to determine the relationship between the variables. Not all hypotheses
can be examined with a regression model. The concept of fit is one of those non-
continuous variables and the hypotheses will have to be modified or combined.
H1: The measures originality and efficiency are positively associated with the
company’s performance.

93
Table 4-10 H1 Regression Results
H1 Regression
Revenue Coef. Std Err t P>|t|
Const 1663 1080 1.54 0.124
Orig 5587 1957 2.86 0.004
Eff 3663 1923 1.91 0.057
Rsq 2.2%
Tobin's Q Coef. Std Err t P>|t|
Const 0.74345 0.0729 10.2 0
Orig -0.113 0.1331 -0.85 0.396
Eff 0.1229 0.1317 0.93 0.351
Rsq 10%
Based on the regression model results shown in Table 4-10, originality and
efficiency are both positively related to company performance. The coefficients have
high statistical significance. The coefficient for originality is significant at α/2=1%
confidence and the efficiency coefficient is significant at the α/2=10% confidence level
using revenue as the response variable. The R-sq value of 2.2% is very low and
suggests that the model is missing variables that would contribute to more explanation of
the variation in revenue. The regression model using Tobin’s Q as response variable
only had the constant coefficient with significance. The expected predictor variables of
originality and efficiency had no statistical significance.
H2: The operations strategy and innovation strategy are positively associated
with the company’s performance but will be positively moderated by a company’s
resources

94
Table 4-11 H2 Regression Results
H2 Regression
Revenue Coef. Std Err t P>|t|
Const -3880.1 677.4 -5.73 0
Orig 5378 1135 4.74 0
Eff 3075 1117 2.75 0.006
Emp 0.1144 0.00322 35.54 0
Rsq 47.20%
Tobin's Q Coef. Std Err t P>|t|
Const 0.68614 0.0732 9.37 0
Orig -0.1237 0.1318 -0.9 0.396
Eff 0.1229 0.1317 0.93 0.351
Emp 0.00000213 0.00000045 4.73 0
Rsq 2.20%
Table 4-11 shows the results from the regression analysis using both Revenue
and Tobin’s Q. The addition of number of employees as a measure of research capacity
added greatly to the R-sq value of the model increasing it to 47.2% up from 2.2% when
using Revenue as the response variable. All coefficients for the model with revenue as
response variable are significant at the 99% confidence level. The regression model
indicates that if the number employees are held constant, increasing originality and
efficiency would both increase revenue, but suggests increasing originality will increase
revenue more than the same incremental increase in efficiency.
The regression model using Tobin’s Q again only had the constant and
employees as a significant terms. This suggests that Tobin’s Q as a response is not
impacted by either efficiency or originality.

95
Chapter 5
Conclusions and Discussion
As shown in Chapter 4, the analysis had mixed support for the hypotheses
developed. It was interesting to see the strong support for some hypotheses, mixed
results for some depending on the response variable, and some with no support at all.
Each hypothesis will be discussed individually and then a discussion of what the results
mean to business in general and for operations. The results that were presented
throughout the chapter are shown again below for clarity and ease of discussion. Table
5-1 shows the results from the cluster analysis; Table 5-2 shows results from the ANOVA
analysis using quartiles; and, finally Table 5-3 show the results of the regression analysis.
Table 5-1 Cluster Analysis Results
Cluster Analysis
Hypothesis Comparison Response Variable
Difference of Means
SE of Difference
Adjusted P-Value
Reject H0
H1a µ fit=good > µ fit =
bad above Revenue 417.1 718.7 0.8306 Fail
Tobin's Q 0.0236 0.07501 0.9469 Fail
H1b µ fit=good > µ fit =
bad below Revenue -56.62 1531 0.08
Reject H0
Tobin's Q -2.307 0.5701 0.04 Reject H0
H2
(µ good, high - µ bad, high ) ≠ (µ
good, low - µ bad,low )
Revenue 6805 1121 0.0001 Reject H0
Tobin's Q -0.4528 0.1236 0.0007 Reject H0

96
Table 5-2 Quartile Analysis Results
Quartile Analysis
Hypothesis Comparison Response Variable
Difference of Means
SE of Difference
Adjusted P-Value
Reject H0
H1 µ fit=good > µ fit = bad
Revenue 5516 2077 0.2 Fail
Tobin's Q 0.0833 0.10608 1 Fail
H2
(µ (Good Fit), high - µ Bad Fit,high ) ≠
(µ (Good Fit), low - µ Bad
Fit,low )
Revenue 239.6 95.41 0.1309 Fail
Tobin's Q 0.6681 0.1966 0.0845 Reject H0
H3 µ amb > µ not amb
Revenue 4485 21927 0.0211 Reject
Tobin's Q -.03606 0.1684 0.8307 Fail
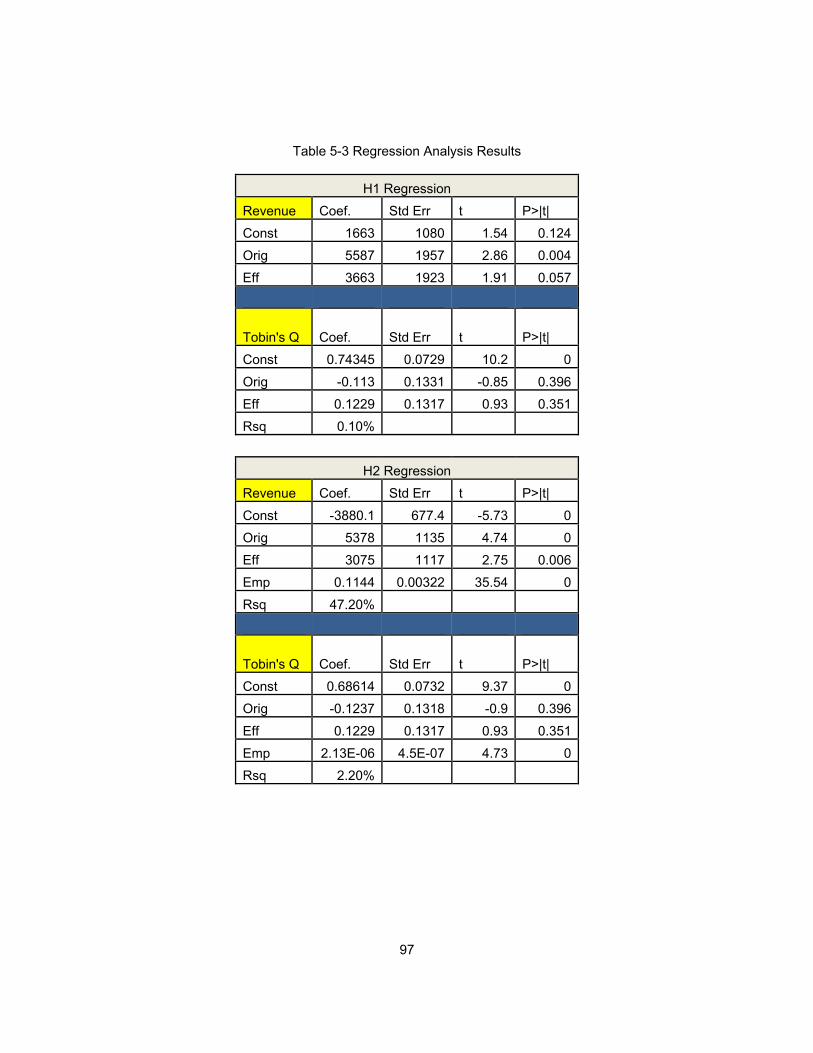
97
Table 5-3 Regression Analysis Results
H1 Regression
Revenue Coef. Std Err t P>|t|
Const 1663 1080 1.54 0.124
Orig 5587 1957 2.86 0.004
Eff 3663 1923 1.91 0.057
Tobin's Q Coef. Std Err t P>|t|
Const 0.74345 0.0729 10.2 0
Orig -0.113 0.1331 -0.85 0.396
Eff 0.1229 0.1317 0.93 0.351
Rsq 0.10%
H2 Regression
Revenue Coef. Std Err t P>|t|
Const -3880.1 677.4 -5.73 0
Orig 5378 1135 4.74 0
Eff 3075 1117 2.75 0.006
Emp 0.1144 0.00322 35.54 0
Rsq 47.20%
Tobin's Q Coef. Std Err t P>|t|
Const 0.68614 0.0732 9.37 0
Orig -0.1237 0.1318 -0.9 0.396
Eff 0.1229 0.1317 0.93 0.351
Emp 2.13E-06 4.5E-07 4.73 0
Rsq 2.20%

98
Table 5.3 continued
H3 Regression
Revenue Coef. Std Err t P>|t|
Const 5037 1280 3.93 .0000
Orig-Self -46246 33240 -1.39 0.166
Rsq 5.0%
Tobin's Q Coef. Std Err t P>|t|
Const 1.0069 .1107 9.09 .0000
Orig-Self 1.818 2.875 .63 .528
Rsq 5.0%
5.1 H1: Operations and Innovation Strategy Fit Effect on Performance
Hypothesis H1a that looked at the difference for the bad fit above and good fit
was not supported by any of the analysis. This suggests that fit is not important for higher
values of efficiency and originality. Further, it appears that highly efficient and highly
original companies do not differ in performance than companies with an operations and
innovation strategy fit. Potential causes of this result could be explained by other variable
not included in model that moderate the relationship between the innovation and
operation strategy fit and company performance. An example of which could be
outsourcing or use of contract manufacturing. This would make their efficiency high and
while still being able to be highly innovative.
Hypothesis H1b was supported using both Tobin’s Q and Revenue. H1b looked
at the difference between good fit and bad fit below the line. The significant difference
shows that there is a threshold of fit that a company needs to achieve to achieve industry

99
average results. The equation of the lower boundary will need to be investigated to
determine what the minimum mix is so companies can understand what the threshold is
for the fit. This suggests an efficiency frontier exists and future research may determine
the optimal mixture for efficiency and originality and is shown in Figure 5-1.
Figure 5-1 Possible Efficiency Frontier
5.2 H2: The Relationship Between Fit and Performance Will Be Positively Moderated by
a Company’s Resources
Using the cluster analysis results, there was support that company resources do
impact the effect of fit on company performance for both Tobin’s Q and Revenue. The
more resources the company has, the less the fit affects the revenue of the company.
This result opens up the opportunities for large and very large companies to allow for
ambidexterity and also allows the company to follow different strategies for operations
100
and innovation. It also shows that companies with fewer resources need to focus on the
strategic fit of their decisions.
The results of the quartile analysis also support the hypothesis but only when
using Tobing’s Q as response variable and the support is not as strong as in the cluster
analysis. The regression analysis also shows strong support for hypothesis H2 using
revenue for response, but not Tobin’s Q.
5.3 H3: Companies with Higher Ambidexterity Will Have Better Performance.
The hypotheses and literature review suggested that companies that are able to
follow an ambidextrous strategy will have higher revenue per employee. This is due to
the higher level of exploitation which increases efficiency and exploration that creates
new, advanced products. The null hypothesis was rejected for H3 using revenue per
employee but not for Tobin’s Q.

101
Chapter 6
Conclusions and Recommendations
Effective operations management has been shown to contribute positively to the
performance of the company. While there have been many studies that examined the
relationship between operations and other functions like finance and marketing, few have
looked at the relationship between operations and innovation. This dissertation attempted
to develop a quantitative method for measuring the fit of operations strategy and
innovation strategy and determine if the fit is positively associated with company
performance.
This study utilized secondary data publicly available from the United States
Patent and Trademark Office (USPTO) and CompuStat databases. Three separate
types of analyses were conducted using cluster analysis, quartile division of the
variables, and a linear regression to examine the relationships between the variables and
gain understanding of the role of fit plays on the performance of the company.
6.1 Contributions of this Study
New product development (NPD) and innovation are critical to the long-term
success of companies. Although some operations management aspects of NPD have
been examined such as project management’s role in NPD and concurrent design, few
studies have looked at the operational structure and the role of this structure in the
innovation and company success. This research developed a model that detailed the
role of operations strategy in company learning, innovation and performance. The model
suggested a path dependency that reinforced the internal resources of the company both

102
physical and intellectually. This model provides a theoretically based model explaining
how companies align the operations to innovation strategy. One key to this model is the
concept of fit. Unfortunately, the method proposed to measure the fit did not achieve
statistical significance. This does not mean that they concept is invalid, but only that the
relationship is more complicated than expected based on the results that innovation and
efficiency do have statistically significant relationships. It is also shown that a certain
threshold of innovation and efficiency must be accomplished to achieve higher
performance. This suggests the existence of an efficient frontier that will need to be
developed further.
6.2 Limitations of this Study
This study looked only at public companies in the disposable medical device
industry with patents granted in the United States. This narrow view facilitated analysis
but it limits the extension of results to other industries and other countries. The use of
patents as a measure of innovation is an easily available and widely accepted measure
of innovation. The use of patents, however, excludes a large population of innovations
that are not patentable. Trade secrets, company proprietary, and other non-published
research can also have an effect on corporate abilities. Also, the threshold of difference
in product that must be demonstrated for a patent may skew the research to unique and
exploratory innovation where the least innovative patent might be more exploratory than
the other innovation created in the industry. There is a more fundamental limitation of the
dissertation and that is the ability to measure the constructs effectively. Relying on
secondary data allowed for easier analysis and the opportunity to create a longitudinal
study including companies that were no longer in business, but the reliance on secondary

103
data also limits the ability to directly measure the construct and develop deep
understanding.
6.3 Conclusions
The efficiency and innovation of the company do have a positive relationship in
the performance of companies but the concept of fit is not modeled properly. More
research into how to quantify fit must be done to develop a better measure. While there
was an expectation that certain regions were the optimal performance is achieved, there
was only one region that had a statistically lower performance than other areas. This
region was the area of bad fit below the theorized optimal region. This suggest that there
is either a threshold to achieve above average performance or an efficient frontier that
can show where the optimal mix of efficiency and innovation.
Beyond the impact of operations on innovation, hypotheses of which innovation
strategy works better for environmental uncertainty and company size had mixed results.
Six of nine hypotheses had significant results based on at least one of the response
variables. This suggest that theoretically the hypotheses and models are on the right
track but need some refinement. There were some differences that were actually
significant but opposite sign than the model suggested. These need to have further
investigation to identify why the results and proposed results were opposite.

104
6.4 Recommendations for Future Research
There are many avenues for future research. The five main areas are:
• improvement in measurement and analysis;
• incorporate more primary data and case study methodology;
• incorporating organizational learning and innovation strategy into the model;
• expand the research into other industries to see if results hold in other industries;
and
• applying the model to supply chains and strategic partnerships.
The analysis conducted could be refined to develop a better measure of fit that
can be utilized in regression analysis and can be quantitatively evaluated instead of
qualitatively. The ambidextrous measure must also be enhanced. There was strong
debate in development of dissertation on how to measure ambidexterity. This
dissertation treated ambidexterity as the mid range of average originality. Going back to
the original patent data and look at each individual patent to determine ambidexterity
could provide a better result.
This dissertation presented a model in Figure 1-2 that shows the interrelationship
between innovation strategy, operations strategy, organizational learning, and resources.
There are many rich interactions that could provide insight into how operations interact
with other departments. The industry chosen was the disposable medical industry. The
research needs to be repeated in other industries to test what relationships can be
generalized.
As discussed in the introduction, this dissertation was limited to in-house
innovation. Another extension would be to test the model in supply chains to understand
how innovation works with suppliers, partners, and universities to develop products and

105
maximize value in the supply chain. The lack of significance in testing hypothesis H1
about fit could be enhanced if data on outsourcing of either innovation or manufacturing
was available for each company. Expanding the research to the supply chain could help
fill in that missing data and help management develop its larger supply chain strategy
keeping in mind the effects on innovation.
6.5 Synopsis
Highly competitive markets demand new or improved products to maintain
corporate performance and long-term survival. The effectiveness of innovation and new
product development is dependent on many competing concepts. Operations
Management has always played an important role in the launch of new products, but the
impacts of operations on the development cycle needs more research. This dissertation
was an exploratory look into how operations management can impact the innovation and
new product development process. While some relationships hypothesized were found
to have statistical support, the key concept of fit did not. The concept of fit has proof in
other settings, but as modeled in this dissertation, it did not. This is likely due to poor
measurement of the concept of fit, the reliance on secondary data, and other moderating
variables not included in the model.

106
Chapter 7
Post Hoc Analysis
Limited statistical significance was found in the hypotheses tests and low R2
values for the regression analysis. This could be possibly due to missing variables that
were not included in the model. Future research on this topic will likely need to have
more variables and to set the foundation for that future research, a secondary review of
the data was conducted without a theoretical lens to determine if variables from the
original data source omitted by the theoretical model add more predictive power. The
variables included in the Post-Hoc analysis are shown in table 7-1. The standard
deviation of some of the variables was calculated for a measure of the distribution of
values. The standard deviation variables are per company, per year.
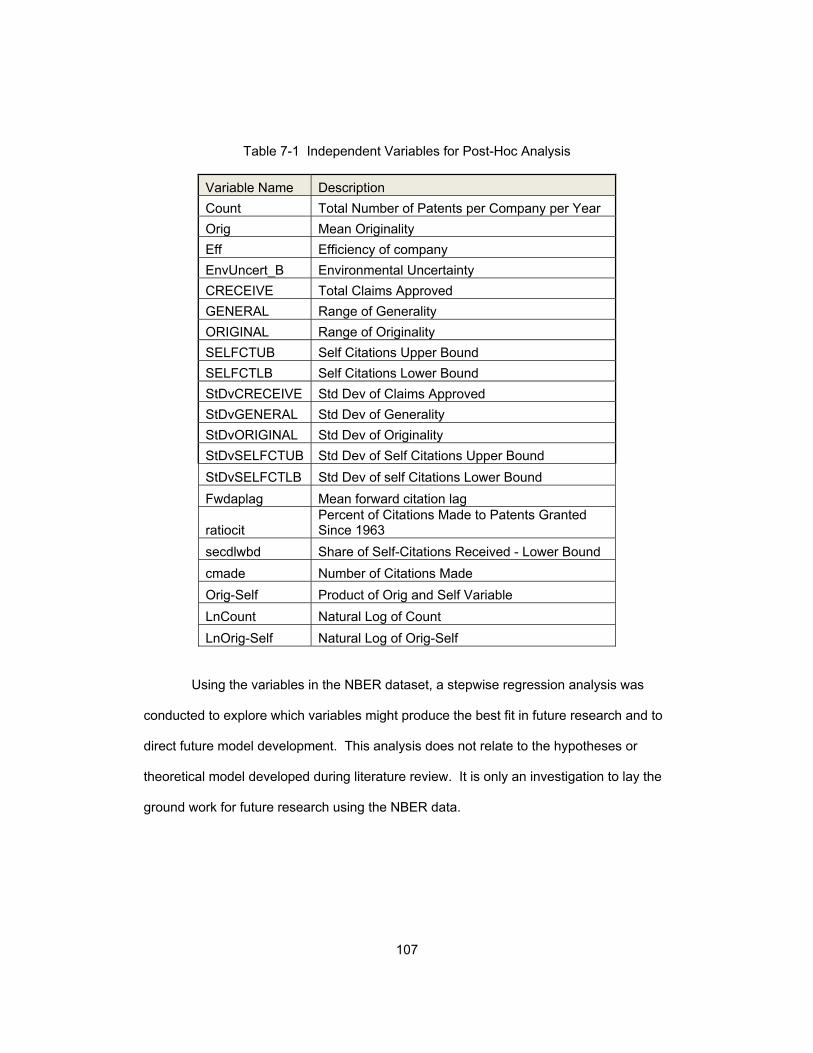
107
Table 7-1 Independent Variables for Post-Hoc Analysis
Variable Name Description
Count Total Number of Patents per Company per Year
Orig Mean Originality
Eff Efficiency of company
EnvUncert_B Environmental Uncertainty
CRECEIVE Total Claims Approved
GENERAL Range of Generality
ORIGINAL Range of Originality
SELFCTUB Self Citations Upper Bound
SELFCTLB Self Citations Lower Bound
StDvCRECEIVE Std Dev of Claims Approved
StDvGENERAL Std Dev of Generality
StDvORIGINAL Std Dev of Originality
StDvSELFCTUB Std Dev of Self Citations Upper Bound
StDvSELFCTLB Std Dev of self Citations Lower Bound
Fwdaplag Mean forward citation lag
ratiocit Percent of Citations Made to Patents Granted Since 1963
secdlwbd Share of Self-Citations Received - Lower Bound
cmade Number of Citations Made
Orig-Self Product of Orig and Self Variable
LnCount Natural Log of Count
LnOrig-Self Natural Log of Orig-Self
Using the variables in the NBER dataset, a stepwise regression analysis was
conducted to explore which variables might produce the best fit in future research and to
direct future model development. This analysis does not relate to the hypotheses or
theoretical model developed during literature review. It is only an investigation to lay the
ground work for future research using the NBER data.
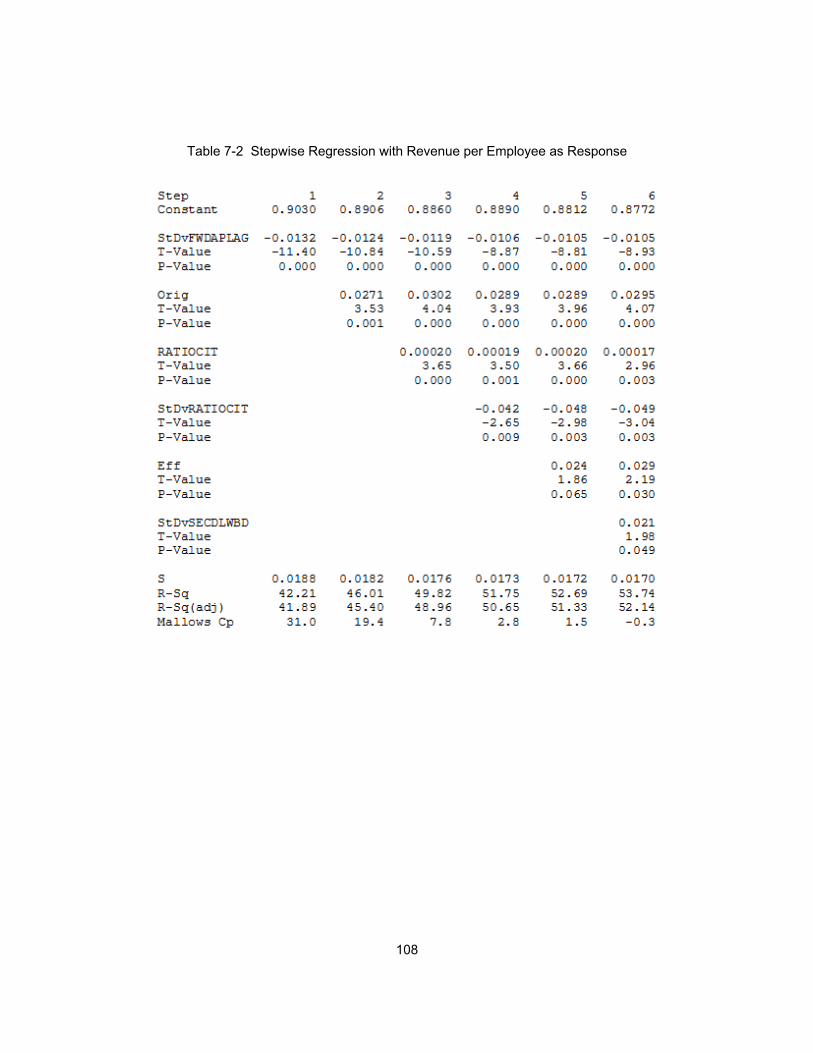
108
Table 7-2 Stepwise Regression with Revenue per Employee as Response

109
Table 7-3 Stepwise Regression with Tobin’s Q as Response
The stepwise regression showed that using revenue per employee (Table 7-2),
the best stepwise regression model achieves an R2 of 53.74 using the variables of: St
Dev of FwD Lag (how long before a patent is referenced), Orig, Ratio of Citations, St Dev
of Ratio of Citations, Efficiency, and St Dev of SecDLWBD. The best fit using the model
based on literature only achieved an R2 of 47%. The only issue with the model
suggested by the stepwise regression is that some of the variables are backward looking
instead of forward looking, meaning that when a company files a patent, it is not able to
obtain the value of some variables until time has passed. This does not help
management making decisions and is not likely a useful research path. Using Tobin’s Q
(Table 7-3), the best model reaches 20.09 for R2 using St Dv NClass, Eff, St Dv CMade,

110
and Original. This was much better than any model using Tobin’s Q in the theory-driven
model. The variables selected by the stepwise regression for Tobin’s Q are forward
looking and would help management make decisions on the innovation strategy. Future
research is needed to understand why the Tobin’s Q and Revenue have such different
predictor variables.
Revising the stepwise regression using only forward looking variables and
created new variables using the natural log of number of patents and the natural log of
the variable Orig-Self created to measure ambidexterity.
Table 7-4 Stepwise Regression with Only Forward Looking Variables

111
The newly created variable of LnOrig-Self was significant on the 4th step but the
other created variable of LnCount was not significant for any of the steps. The model
reached and R2 of 36.46% which is not as good as the model with backward and forward
looking variables, but is useful for managers in making decisions of innovation strategy.
Future research should include new literature review to determine if forward
looking variables suggested by the stepwise regression have a theoretical foundation and
help direct management in strategy decisions.
112
References
Ahuja, G., and Katila, R. (2001). Technological Acquisitions and the Innovation
Performance of Acquiring Firms: A Longitudinal Study. Strategic Management
Journal , 22, 197-220.
Almeida, P. (1996). Knowledge sourcing by foreign multinationals: Patent citation
analysis in the U.S. Semiconductor industry. Strategic Management Journal , 17,
155-165.
Arend, R. J. (1999). Emergence of Entrepreneurs Following Exogenous Technological
Change. Stategic Management Journal , 20, 31-47.
Argyris, C., and Schön, D. A. (1978). Organizational Learning: A Theory of Action
Perspective:. Reading, MA: Addison-Wesley.
Barney, J. B. (2002). Gaining and Sustaining Competitive Advantage. Prentice Hall.
Barney, J. B. (1999). How a Firm's Capabilities Affect Boundary Decisions. Sloan
Management Review , 40, 137-145.
Barney, J. B. (2005). Where Does Inequality Come From? The Personal and Intellectual
Roots of Resource-Based Theory. In K. G. Smith, and M. A. Hitt, Great Minds in
Management: The Process of Theory Development (pp. 280-303). Oxford:
Oxford University Press.
Barney, J. B., and Clark, D. N. (2007). Resource-Based Theory: Creating and Sustaining
Competitive Advantage. Oxford: Oxford University Press.
Becerra, M. (2008). A Resource-Based Analysis of the Conditions for the Emergence of
Profits. Journal of Management , 34, 1110-1126.

113
Benner, M. J., and Tushman, M. L. (2003). Exploitation, Exploration and Process
Management: THe Productivity Dilemma Revisited. Academy of Management
Review , 28 (2), 238-256.
Bharadwaj, A. S. (2000). A resource-based perspective on information technology
capability and firm performance: An empirical investigation. MIS Quarterly , 24
(1), 169-196.
Brass, D. J., Galaskiewicz, J., Greve, H. R., and Tsai, W. (2004). Taking stock of
networks and Organizations: A multilevel Perspective. Academy of Management
, 47 (6).
Bromiley, P., and Papenhausen, C. (2003). Assumptions of Rationality and Equilibrium in
Strategy Research: The Limits of Traditional Economic Analysis. Strategic
Organization , 1, 413-437.
Calantone, R. J., Vickery, S. K., and Droge, C. (1995). Business Performance and
Strategic New Product development Activities: An Empirical Investigation.
Journal of Product Innovation Management , 12, 214-223.
Cash, J. I., Earl, M. J., and Morison, R. (2008, November). Teaming up to crack
innovation and enterprise integration. Harvard Business Review .
Castellacci, F., Grodal, S., Mendonca, S., and Wibe, M. (2005). Advances and
Challenges in innovation studies. Journal of Economic Issues .
Cesaroni, F., Minin, A. D., and Piccaluga, A. (2005). Exploration and Exploitation
Strategies in Industrial RandD. Creativity and Innovation Management , 14 (3),
222-232.
Chesbrough, H. W., and Appleyard, M. M. (2007). Open Innovation and Strategy.
California Management Review , 50 (1).

114
Christensen, C. M., Kaufman, S. P., and Shih, W. C. (2008, January). Innovation Killers
How financial tools destroy your capacity to do new things. Harvard Business
Review .
Chuang, S.-H. (2004). A resource-based perspective on knowledge management
capability and competitive advantage: an empirical investigation. Expert Systems
with Applications , 27, 459-465.
Chung, K. H., and Pruitt, S. W. (1994). A Simple Approximation of Tobin's q. Financial
Management , 23 (3), 70-74.
Collis, D. J., and Montgomery, C. A. (1995, July-August). Competing on Resources:
Strategy in the 1990s. Harvard Business Review , 118-128.
Danneels, E. (2002). The Dynamics of Product Innovation and Firm Competences.
Strategic Management Journal , 23 (12), 1095-1121.
DeLuca, L. M., and Atuahene-Gima, K. (2007). Market Knowledge Dimensions and
Cross-Functional Collaboration: Examining the Different Routes to Product
Innovation Performance. Journal of Marketing , 71 (January), 95-112.
Foss, K., Foss, N. J., and Klein, P. G. (2007). Original and Derived Judgment: An
Entrepreneurial Theory of Economic Organization. Organization Studies , 28, 1-
20.
Foss, N. J., and Ishikawa, I. (2007). Towards a Dynamic Resource-based View: Insights
from Austrian Capital and Entrepreneurship Theory. Organization Studies , 28,
749-772.
Frankort, H. T. (2008). Structural Holes, Technological Resources, and innovation: A
study of an interfirm RandD network. Academy of Management Proceedings , 1-
6.

115
Fullerton, R., McWatters, C., and Fawson, C. (2003). An examination of the relationships
between JIT and financial performance. Journal of Operations Management , 21,
383–404.
Gersick, C. J. (1991). Revolutionary Change Theories: A Multilevel Exploration of the
Punctuated Equilibrium Paradigm. The Academy of Management Review , 16
(1), 10-36.
Gibbons, R. (2005). Four Formal(izable) Theories of the Firm? Journal of Economic
Behavior and Organization , 58, 200-245.
Grant, R. M. (1996). Prospering in Dynamically-Competitive Environments:
Organizational Capability as Knowledge Integration. Organization Science , 7,
375-387.
Grant, R. M. (1991). The Resource-Based Theory of Competitive Advantage: Implications
for Strategy Formulation. California Management Review , Spring.
Grant, R. M. (1996). Toward a Knowledge-Based Theory of the Firm. Strategic
Management Journal , 17 (Winter), 109-122.
Gruner, K. E., and Homburg, C. (2000). Does Customer Interaction Enhance New
Product Success? Journal of Business Research , 49, 1-14.
Gupta, A. K., Smith, K. G., and Shalley, C. E. (2006). The Interplay Between Exploration
and Exploitation. Academy of Management Journal , 49 (4), 693–706.
GUPTA, A. K., SMITH, K. G., and SHALLEY, C. E. (2006). THE INTERPLAY BETWEEN
EXPLORATION AND EXPLOITATION. Academy of Management Journal , 49
(4), 693–706.
Hall, B. H. (2010, August 5). NBER Patent Data Project. Retrieved August 1, 2012, from
NBER Patent Data Project:
http://sites.google.com/site/patentdataproject/Home/downloads
116
Hall, B., Jaffe, A., and Trajtenberg, M. (2001, October). The NBER Patent Citations Data
File. Lessons, Insights, and Methodological Tools. NBER Working Paper o. 8498
.
He, Z.-L., and Wong, P.-K. (2004). Exporation vs Exploitation: Emprical test of
ambidexterity hypohthesis. Organization Science , 15 (4), 481-494.
Helefat, C. E., and Peteraf, M. (2003). The dynamic resource-based view: Capability
lifecycles. Strategic Management Journal , 24, 997-1010.
Hendricks, K., Singal, V., and Zhang, R. (2009). The effect of operational slack,
diversification, and vertical relatedness on the stock market reaction to supply
chain disruptions. Journal of Operations Management , 27, 233–246.
Herold, D., Jayaraman, N., and Narayanaswamy, C. (2006). What is the Relationship
hetween Organizational Slack and Innovation? Journal of Managerial Issues ,
XVIII (3), 372-392.
Hoang, H., and Rothaermel, F. T. (2010). Leveraging Internal and External Experience:
Exploration, Exploitation, and RandD Project Performance. Strategic
Management Journal , 31, 734-758.
Katila, R., and Shane, S. (2005). When Does Lack of Resources Make New Firms
Innovative? Academy of Management Journal , 48 (5), 814-829.
Ketchen, D. J., and Hult, G. T. (2007). Bridging organization theory and supply chain
management: The case of best value supply chains. Journal of Operations
Management , 25, 573-580.
Knott, A. M., Bryce, D., and Posen, H. (2003). On the Strategic Accumulation of
Intangible Assets. Organization Science , 14 (2), 192-207.

117
Kraaijenbrink, J., and Wijnhoven, F. (2008). Managing Heterogeneous Knowledge: A
Theory of External Knowledge Integration. Knowledge Management Research
and Practice , 6, 274-286.
Kraaijenbrink, J., Spender, J., and Groen, A. J. (2010). The resource-based view: A
Review and Assessment of its Critiques. Journal of Management , 36 (1), 349-
372.
Kroes, J. R., and Ghosh, S. (2010). Outsourcing congruence with competitive priorities:
Impact on supply chain and firm performance. Journal of Operations
Management , 28, 124-143.
Kyriakopoulos, K., and Moorman, C. (2004). Tradeoffs in marketing exploitation and
exploration strategies: The overlooked role of market orientation. International
Journal of Research in Marketing , 21, 219-240.
Lado, A. A., Boyd, N. G., Wright, P., and Kroll, M. (2006). Paradox and Theorizing Within
the Resource-Based View. Academy of Management Review , 31, 115-131.
Lee, J., Lee, J., and Lee, H. (2003). Exploration and Exploitation in the Presence of
Network Externalities. Management Science , 49 (4), 553-570.
Leiblein, M. J. (2003). The Choice of Organizational Governance Form and
Performance:Predictions from Transaction Cost, Resource-based and Real
Options Theories. Journal of Management , 29, 937-961.
Levinthal, D. A., and March, J. G. (1993). The Myopia of Learning. Strategic Management
Journal , 14, 95-112.
Loch, C. H., and Huberman, B. A. (1999). Puntucated equilibrium model of technology
diffusion. Management Science , 45 (2), 160-177.

118
Luca, L. M., and Atuahene-Gima, K. (2007). Market Knowledge Dimensions and Cross-
Functional Collaboration: Examining the Different Routes to Product Innovation
Performance. Journal of Marketing , 71, 95-112.
Mahoney, J. T. (1995). The Management of Resources and the Resource of
Management. Journal of Business Research , 33, 91-101.
March, J. G. (1991). Exploration and Exploitation in Organizational Learning.
Organization Science, , 2, 71-87.
McFadyen, M. A., and Cannella, A. A. (2004). Social Capital and Knowledge Creation:
Diminishing Returns of the Number and Strength of Exchange Relationships.
Academy of Management Journal , 47 (5), 735-746.
McGrath, R. G., and Nerkar, A. (2004). Real Options Reasoning and a New Look at the
RandD Investment strategies of Pharmaceutical Firms. Strategic Management
Journal , 25, 1-21.
McIvor, R. (2009). How the transaction cost and resource-based theories of the firm
inform outsourcing evaluation. Journal of Operations Management , 27, 45-63.
Menora, L. J., M. V., and Sampsonc, S. E. (2002). New service development: areas for
exploitation and exploration. Journal of Operations Management , 20, 135-157.
Miller, J., and Roth, A. (1994). A taxonomy of manufacturing strategies. Management
Science , 40 (3), 285-304.
Modi, S., and Mishra, S. (2011). What drives financial performance–resource efficiency or
resource slack? Evidence from U.S. Based Manufacturing Firms from 1991 to
2006. Journal of Operations Management , 29, 254–273.
O'Reilly, C. A., and Tushman, M. L. (2008). Ambidexterity as a Dynamic Capability:
Resolving the Innovator’s Dilemma. Research in Organizational Behavior , 28,
185-206.

119
Parthasarthy, R., and Hammond, J. (2002). Product innovation input and outcome:
moderating effects of the innovation process. Journal of Engineering Technology
Management , 19, 75-91.
Peng, M. (2001). The resource-based view and international business. Journal of
Management , 27, 803-829.
Peteraf, M. A., and Barney, J. B. (2003). Unraveling the Resource-Based Tangle.
Managerial and Decision Economics , 24, 309-323.
Peteraf, M. (1993). The cornerstones of competitive advantage: A resource-based view.
Strategic Management Journal , 14, 179-191.
Powell, T. C. (2001). Competitive Advantage: Logical and Philosophical Considerations.
Strategic Management Journal , 22, 875-888.
Raisch, S., Birkinshaw, J., Probst, G., and Tushman, M. L. (2009). Organizational
Ambidexterity: Balancing Exploitation and Exploration for Sustained
Performance. Organization Science , 20 (4), 685-695.
Rittera, T., and Gemunden, H. G. (2004). The impact of a company’s business strategy
on its technological competence, network competence and innovation success.
Journal of Business Research , 57, 548-556.
Romanelli, E., and Tushman, M. L. (1994). Organizational Transformation as Punctuated
Equilibrium: An Empirical Test. Academy of Management Journal , 37 (5), 1141-
1166.
Rosenkopf, L., and Nerkar, A. (2001). Beyond Local Search: Boundary-Spanning,
Exploration and Impact in the Optical Disk Industry. Strategic Management
Journal , 22, 287-306.
Rugman, A., and Verbeke, A. (2002). Edith Penrose’s contribution to the resource-based
view of strategic management. Strategic Management Journal .
120
Sampson, R. C. (2007). RandD Alliances and Firm Performance: The Impact of
Technological Diversity and Alliance Organization on Innovation. Academy of
Management Journal , 50 (2), 364-386.
Schroeder, R., Bates, K., and Junttila, M. (2002). A resource-based view of
manufacturing strategy and the relationship to manufacturing performance.
Strategic Management Journal , 23, 105-117.
Shah, R., and Ward, P. (2007). Defining and Developing measures of Lean. Journal of
Operations Management , 25 (14), 795-805.
Song, M., Podonitsyna, K., Bij, H. v., and Halman, J. I. (2008). Succes Factors in New
Ventures: A Meta-analysis. Journal of Product Innovation Management , 25, 7-
27.
Stieglitz, N., and Heine, K. (2007). Innovations and the Role of Complementarities in a
Strategic Theory of the Firm. Strategic Management Journal , 28, 1-15.
Stock, G. N., and Tatikonda, M. V. (2008). The joint influence of technology uncertainty
and interorganizational interaction on external technology integration success.
Journal of Operations Management , 26, 65-80.
Swink, M., Narasimhan, R., and Kim, S. W. (2005). Manufacturing Practices and Strategy
Integration: Effects on Cost Efficiency, Flexibility and Market-Based
Performance. Decision Sciences , 36 (3), 427-457.
Teece, D. J. (2007). Explicating Dynamic Capabilities: The Nature and Microfoundations
of (Sustainable) Enterprise Performance. Strategic Management Journal , 28,
1319-1350.
Tothaermel, F. T., and Alexandre, M. T. (2009). Ambidexterity in Technology Sourcing:
The Moderating Role of Absorptive Capacity. Organization Science , 20 (4), 759-
780.

121
Tothaermel, F. T., and Deeds, D. L. (2004). Exploration and Exploitation Alliances in
Biotechnology: A System of New Product Development. Strategic Management
Journal , 25, 201-221.
Trajtenberg, M., Henderson, R., and Jeffe, A. (1997). University Versus Corporate
Patents: A Window on the Basicness of Invention. Economic Innovation New
Technology , 5, 19-50.
Tushman, M., Smith, W., Wood, R., Westerman, G., and O’Reilly, C. (2002). Innovation
Streams and Ambidextrous Organizational Designs: On Building Dynamic
Capabilities.
Uotila, J., Maula, M., Keil, T., and A.Zahra, S. (2009). Exploration, Exploitation and
Financial Performance: Analysis of SandP 500 Corporation. Strategic
Management Journal , 30, 221–231.
Voss, G. B., Sirdeshmukh, D., and Voss, Z. G. (2008). The Effects of Slack Resources
and Environmental Threat on Product Exploration and Exploitation. Academy of
Management Journal , 51 (1), 147–164.
Ward, P., and Duray, R. (2000). Manufacturing Strategy in Context: Environment,
Competitive Strategy and Manufacturing Strategy. Journal of Operations
Management .
Zander, U., and Kogut, B. (1995). Knowledge and the Speed of the Transfer and Imitation
of Organizational Capablities: An Empirical Test. Organization Science , 6 (1),
76-92.

122
Biographical Information
James Edward Brown earned a BS in Mechanical Engineering from the
University of Texas at El Paso in 1996, an MBA from Texas Christian University in 2001,
and will earn a PhD in Operations Management from the University of Texas at Arlington
in December 2012. He has worked in industry for over 15 years as an engineer and
program manager managing new product development from initial concept definition into
production. He currently is a project manager of strategic enterprise asset management
focusing on plant transitions and warehouse optimization.
His research interests are innovation management, entrepreneurship, supply
chain management, and design thinking. After graduation, he plans to teach full-time at a
university in the Dallas-Fort Worth area and open a boutique-consulting firm specializing
in early stage start up management.