effects of evapotranspiration on longitudinal …
TRANSCRIPT

i
EFFECTS OF EVAPOTRANSPIRATION ON LONGITUDINAL DRYLINE
POSITION IN THE GREAT PLAINS
A THESIS
SUBMITTED TO THE GRADUATE SCHOOL
IN PARTIAL FULFILLMENT OF THE REQUIREMENTS
FOR THE DEGREE
MASTER OF SCIENCE
BY
ZACHARY F. JOHNSON
DR. NATHAN HITCHENS, ADVISOR
BALL STATE UNIVERSITY
JULY 2017

ii
EFFECTS OF EVAPOTRANSPIRATION ON LONGITUDINAL DRYLINE
POSITION IN THE GREAT PLAINS
A THESIS
SUBMITTED TO THE GRADUATE SCHOOL
IN PARTIAL FULFILLMENT OF THE REQUIREMENTS
FOR THE DEGREE
MASTER OF SCIENCE
BY
ZACHARY F. JOHNSON
Committee Approval:
____________________________________ _____________
Dr. Nathan Hitchens, Committee Chairperson Date
____________________________________ _____________
Dr. Petra Zimmermann, Committee Member Date
____________________________________ _____________
Dr. David Call, Committee Member Date
Department Approval:
____________________________________ _____________
Dr. Kevin Turcotte, Departmental Chairperson Date
____________________________________ _____________
Dr. Carolyn Kapinus, Dean of the Graduate School Date

iii
Acknowledgements
There are countless people to thank; however, I would like to mention a few who
made this paper possible. This thesis could not have been completed without the support
from my friends and family, but most importantly, my mother. Her financial and
emotional support helped me complete graduate school, and I feel blessed to have her
encouragement. I would also like to thank my godparents who provided a second home
nearby in Cincinnati.
I would like to express my gratitude to Dr. Nathan Hitchens, my thesis advisor,
for his indispensible knowledge and support through the thesis process. His guidance for
my countless questions, the helpful comments for my presentation at AMS, and the
several revisions to help refine the thesis were key to my success. I would also like to
thank my committee members, Dr. Petra Zimmermann and Dr. David Call, who
compassionately cared about my research and acting more as second advisors rather than
committee members. I would also like to recognize my University of Oklahoma
professor, Dr. Jeff Basara for providing the spark that pushed my interest in land-
atmosphere processes and his helpful comments during AMS. I would like to
acknowledge Dr. Adam Berland for his expertise in data analysis. Without his guidance
and teachings, my thesis would have hit a roadblock early on.
During these past two years, the tight-knit group of graduate students in the
Department of Geography fostered an environment for lasting friendships and
collaborative research ideas. Last but not least, I would like to thank the Department of
Geography at Ball State University for providing a platform to pursue my research.
iv
Table of Contents
1. INTRODUCTION ..............................................................................................1
2. LITERATURE REVIEW ...................................................................................3
I. Dryline Broad Definition ...........................................................................3
II. Dryline Formation and Dynamics ..............................................................5
III. Dryline Climatology ..................................................................................10
IV. Land-Atmospheric Effects of the Dryline..................................................11
V. Applications of the Dryline ........................................................................15
3. JOURNAL ARTICLE ........................................................................................19
I. Abstract ......................................................................................................21
II. Introduction ................................................................................................22
III. Data and methods .......................................................................................25
a. Dryline definition ........................................................................25
b. Criteria for determining a dryline ...............................................27
c. Data .............................................................................................27
d. Analysis techniques ....................................................................32
IV. Results and Discussion ..............................................................................35
a. Dryline climatology ....................................................................35
b. Dryline longitudinal position ......................................................37
c. Climatology of specific humidity gradients ................................40
d. Soil moisture climatology ...........................................................42
e. Evapotranspiration effect ............................................................47
V. Summary ....................................................................................................54
VI. Acknowledgements ....................................................................................55
VII. References ..................................................................................................57
4. CONCLUSIONS.................................................................................................61
5. REFERENCES ...................................................................................................64
6. APPENDECIES ..................................................................................................72
I. Case A – “Oklahoma Dryline” ..................................................................72
II. Case B – “Two Drylines” ..........................................................................74
III. Case C – “No Dryline” ..............................................................................78
IV. Case D – “Texas Panhandle Moisture Boundary” .....................................80
v
List of Figures
Figure 2.1: 0000 UTC 31 May 2011 Dryline ..................................................................4
Figure 2.2: 2345 UTC 30 May 2011 Satellite Imagery of Dryline ..................................9
Figure 2.3: 0000 UTC 31 May 2011 Sounding Analysis ................................................16
Figure 3.1: Study area and stations ..................................................................................31
Figure 3.2: Thiessen polygons .........................................................................................34
Figure 3.3: Frequency of drylines days............................................................................36
Figure 3.4: 10-year average dryline longitude .................................................................38
Figure 3.5: Frequency of drylines within 0.5 increments of longitude ............................38
Figure 3.6: Elevation contours and dryline frequency .....................................................39
Figure 3.7: Frequency of specific humidity gradients .....................................................41
Figure 3.8: Average volumetric soil moisture .................................................................46
Figure 3.9: Correlation of dryline longitude and volumetric soil moisture .....................48
Figure 3.10: Correlation of soil moisture gradients and dryline intensity .......................51
Figure 3.11: Correlation of localized soil moisture gradients and dryline intensity ........53
Figure 6.1: 0000 UTC 30 May 2013 dryline ...................................................................73
Figure 6.2: 0000 UTC 02 April 2015 dryline ..................................................................75
Figure 6.3: 0000 UTC 02 April 2015 moisture boundary ...............................................77
Figure 6.4: 0000 UTC 03 April 2015 cold front ..............................................................79
Figure 6.5: 0000 UTC 29 June 2014 dryline ...................................................................81
List of Tables
Table 3.1: Yearly frequency of drylines ..........................................................................39
Table 3.2: Yearly soil moisture averages .........................................................................44
List of Equations
Equation 3.1: Vapor pressure ...........................................................................................28
Equation 3.2: Specific humidity ......................................................................................28
Equation 3.3: Fractional water index ...............................................................................29
Equation 3.4: Matric potential .........................................................................................29
Equation 3.5: Volumetric water content ..........................................................................29
Equation 3.6: Weighted mean (X̅WC) ..............................................................................33
Equation 3.7: Weighted mean (Y̅WC) ...............................................................................33
Equation 3.8: Correlation coefficient ...............................................................................35
1
1. Introduction
The dryline, a transition zone that separates dry air from moist air, is an important
meteorological phenomenon in the Great Plains of the United States (Fujita 1958). One
central mechanism for the creation of the dryline is the confluence of winds from a lee
trough. As the lee trough strengthens due to increased vorticity, hot, dry air from the
southwest advects eastward, while warm, moist air from the Gulf of Mexico advects north
and west, creating the tight gradient of moisture known as the dryline (Schaefer 1974a). It
is an area of increased severe weather risk, with dust storms toward the west and severe
thunderstorms to the east. As a surface cold front approaches the dryline, supercells can
form and produce tornadoes in a matter of minutes (Fujita 1958; Beebe 1958; Rhea 1966;
McCarthy and Koch 1982). These thunderstorms tend to be isolated in nature, allowing
each storm to take advantage of its undisrupted unstable environment, which is prime for
supercell development (Johns and Doswell 1992; Bluestein and Parker 1993). Many
violent tornadoes have occurred as a result of dryline convection; therefore, an emphasis
on past research has been on dryline dynamics. However, interactions between the land
and atmosphere, as well as the climatology of drylines, have not been researched as
comprehensively.
When forecasting for the Great Plains, a critical question to be answered on any
given spring day is: where will the dryline be located? On average, the dryline is located
at -101°, which is close to the north-south border of Oklahoma and the Texas Panhandle
(Hoch and Markowski 2005). It can extend from southern Texas through Alberta, Canada;
however, drylines are mostly found in the eastern Texas Panhandle and western Oklahoma,
extending northward into western Kansas and western Nebraska (Hane et al. 1997). The

2
dryline shifts east during the day and surges westward at night due to land-atmosphere
processes (Ziegler et al. 1995). Moisture added to the atmosphere from vegetation and the
soil, through a set of processes termed evapotranspiration, can advect toward the north and
west, potentially affecting the position of the dryline. Since the dryline is a moisture
boundary, can evaporation of soil moisture and transpiration from vegetation affect its
longitudinal position?
In this study, the position of the dryline is compared to measurements of soil
moisture values, which are related to evapotranspiration rates. Although past studies have
hypothesized and modeled the evapotranspiration effect on dryline position, there has not
been an observed climatological study of the dryline position as a function of
evapotranspiration. This study accomplishes this by comprehensively examining the
longitudinal position of the dryline and correlating it to a network of weather stations that
record soil moisture. The results of this research show that the dryline is sensitive to soil
moisture, thus sensitive to evapotranspiration, which is relevant to the work of forecasters,
climatologists, researchers, and risk planners.

3
2. Literature Review
I. Dryline Broad Definition
The dryline is a boundary with a strong gradient between moist and dry air with
dewpoint temperature gradients typically exceeding 10° 𝐶 (100 𝑘𝑚)−1 , however,
gradients as high as 10° 𝐶 𝑘𝑚−1 have been observed (Pietrycha and Rasmussen 2001;
Hoch and Markowski 2005). The American Meteorological Society defines a dryline as “a
low-level mesoscale boundary or a transition zone hundreds of kilometers in length and up
to tens of kilometers in width separating dry air from moist air” (Glickman and Walter
2000). In the past, the dryline has been known as a “dewpoint front” (Beebe 1958), “dry
front” (Fujita 1958), and even a “marfa front” (Matteson 1969) due to drylines being
common in Marfa, Texas.
It is important to note that the dryline is not a front despite the temperature
difference on each side of the boundary. A front is typically defined as a transition zone
between two air masses of different density (Glickman and Walter 2000), but a dryline
does not have a consistent density gradient, and its location fluctuates depending on the
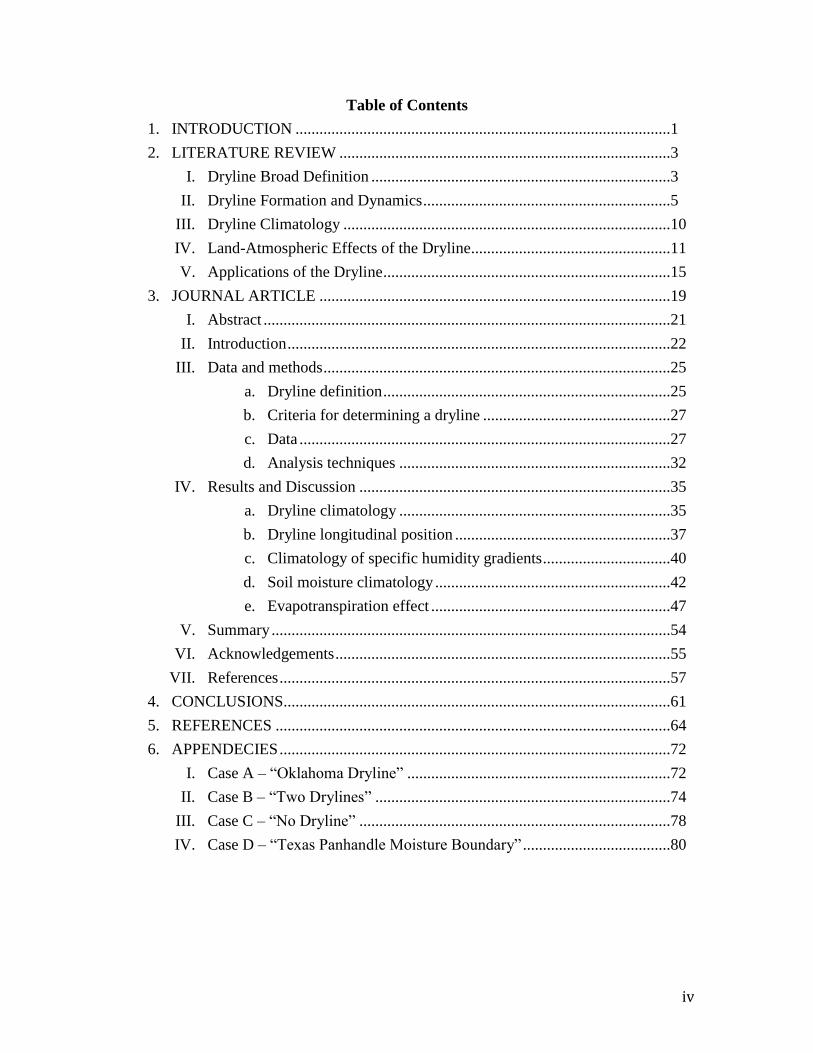
time of day. The dry sector (west of the dryline in Figure 2.1) has a larger diurnal
temperature cycle compared to the moist sector because of disparities in long wave
radiation, promoting differences in radiational cooling, insolation, and water vapor
absorption between the two sectors. In the moist sector (east of the dryline in Figure 2.1),
stratocumulus clouds are usually present, whose development is aided by moist air flowing
from the Gulf of Mexico into the Great Plains, termed the low-level jet (LLJ); therefore,
less insolation reaches the surface (Schaefer 1974a; Glickman and Walter 2000). In the dry
sector, the skies are clear, leading to far more insolation reaching the
4
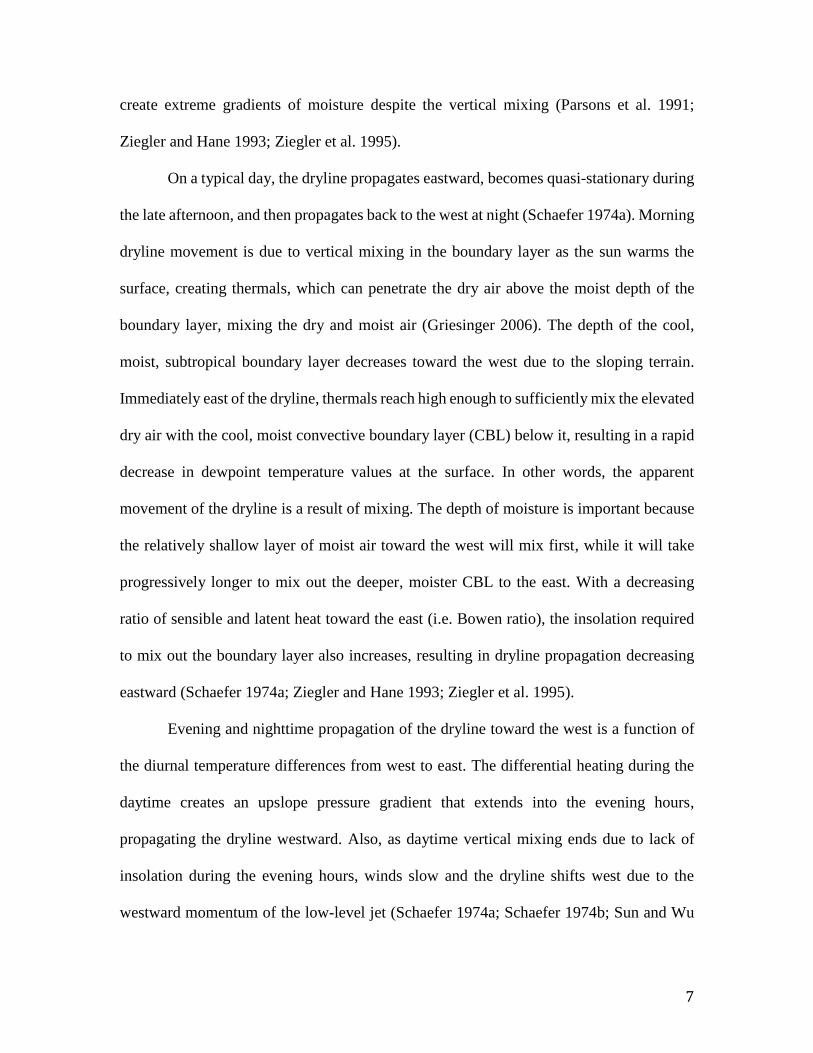
Figure 2.1: Typical dryline setup from 0000 UTC on 31 May 2011 showing the dryline
(brown dashed line), wind barbs (𝑘𝑚 ℎ−1), temperature (°C), dewpoint (°C), and specific
humidity (light grey isolines in increments of 1 𝑔 𝑘𝑔−1).

5
surface, warming the ground significantly faster than the moist sector. Vegetation
decreases from east to west in the Great Plains, so the sensible heat flux is dominant in the
surface energy balance toward the west. For this reason, the diurnal temperature cycle
fluctuates more in the dry sector compared to the moist sector. Cold fronts and warm fronts
do not exhibit these diurnal variations on either side of the front. Because of the diurnal
cycle, during the daytime it is common for temperatures to be warmer west of the dryline
and cooler east of the dryline. However, the opposite is true at night when it is cooler west
of the dryline and warmer east of the dryline. While density gradients may exist during the
night due to temperature differences between the two sectors, during the daytime this
temperature gradient weakens, and the density gradient weakens. True fronts exhibit a
consistent density gradient in both daytime and nighttime (Atkins et al. 1998).
II. Dryline Formation and Dynamics
In the Great Plains, one of the main mechanisms for an increased gradient of
moisture is the confluence of surface winds from a lee trough, which is the same
geostrophic deformation that is important to frontogenesis (Schultz et al. 2007). As a
baroclinic wave moves over the Rocky Mountains, the windward surface low decays and
is replaced with lee cyclogenesis, along with the associated deepening surface low
(Wallace and Hobbs 1977). There is a gentle downward sloping of terrain from the Rocky
Mountains eastward to the Mississippi River, which allows for the lee trough to strengthen
due to Rossby’s conservation of potential vorticity: as the depth of the atmospheric column
increases, vorticity also increases because Rossby’s potential vorticity is held constant.
Lee-side cyclogenesis is a function of vortex stretching, which causes a surface low to

6
deepen (Schultz and Doswell 2000). Cyclones peak in frequency in the lee of the Rocky
Mountains due to lee troughs and the associated cyclogenesis (Zishka and Smith 1980).
The LLJ, aided by the thermal wind as a function of the gentle sloping of the terrain, can
transport copious amounts of moist air from the Gulf of Mexico to the Great Plains region
(Holton 1967). This moisture helps create a shallow moist boundary layer toward the east,
strengthening the gradient of the dryline, while a lee-side trough helps advect dry air off
the high plains and desert region, intersecting the moist air advected from the Gulf of
Mexico (Fujita 1958; Beebe 1958; Schaefer 1974a). As the terrain rises from east to west
toward the Rocky Mountains, the easterly component of the shallow boundary layer
moisture is impeded by the dry air advecting above it. These two air masses meet, creating
a sharp, narrow, non-frontal moisture discontinuity. The cause of initial moisture advection
into the dry air is by evaporation from both the ocean and precipitation, but there is also an
evapotranspiration component (Schaefer 1974b). Soil moisture and vegetation generally
decrease from east to west, and correspondingly, latent heat flux decreases from east to
west, also aiding in the creation of the moisture gradient (Schaefer 1974a). However, these
processes do not explain the extreme gradients of moisture at the dryline, with dewpoint
temperature gradients sometimes exceeding 10° 𝐶 𝑘𝑚−1 . Grasso (2000) showed that
dryline morphology is a two-step process: first, moisture increases from evaporation and
advection, and second, solenoid and frontogentical forcing act on the dryline. The strong
moisture and virtual potential temperature gradients, along with weaker, yet noticeable
temperature gradients, help create vertical solenoids across the dryline, which strengthen
the moisture gradient to extreme values. These solenoids act as frontogentical forcing to
7
create extreme gradients of moisture despite the vertical mixing (Parsons et al. 1991;
Ziegler and Hane 1993; Ziegler et al. 1995).
On a typical day, the dryline propagates eastward, becomes quasi-stationary during
the late afternoon, and then propagates back to the west at night (Schaefer 1974a). Morning
dryline movement is due to vertical mixing in the boundary layer as the sun warms the
surface, creating thermals, which can penetrate the dry air above the moist depth of the
boundary layer, mixing the dry and moist air (Griesinger 2006). The depth of the cool,
moist, subtropical boundary layer decreases toward the west due to the sloping terrain.
Immediately east of the dryline, thermals reach high enough to sufficiently mix the elevated
dry air with the cool, moist convective boundary layer (CBL) below it, resulting in a rapid
decrease in dewpoint temperature values at the surface. In other words, the apparent
movement of the dryline is a result of mixing. The depth of moisture is important because
the relatively shallow layer of moist air toward the west will mix first, while it will take
progressively longer to mix out the deeper, moister CBL to the east. With a decreasing
ratio of sensible and latent heat toward the east (i.e. Bowen ratio), the insolation required
to mix out the boundary layer also increases, resulting in dryline propagation decreasing
eastward (Schaefer 1974a; Ziegler and Hane 1993; Ziegler et al. 1995).
Evening and nighttime propagation of the dryline toward the west is a function of
the diurnal temperature differences from west to east. The differential heating during the
daytime creates an upslope pressure gradient that extends into the evening hours,
propagating the dryline westward. Also, as daytime vertical mixing ends due to lack of
insolation during the evening hours, winds slow and the dryline shifts west due to the
westward momentum of the low-level jet (Schaefer 1974a; Schaefer 1974b; Sun and Wu
8
1992). Parsons et al. (2000) associated the westward momentum of the low-level jet with
frictional decoupling and ageostrophic motions.
Over the High Plains, there is a deep, dry CBL due to the ground warming much
faster than areas east of the dryline where there is a shallow, moist CBL. Ziegler et al.
(1995) and Shaw (1995) proposed that thermal solenoids are the main cause for vertical
circulations during the daytime, which help propagate the dryline eastward. The dryline
can also appear to “jump” over large areas due to flatness in the normally sloped terrain.
Thermals mix the air simultaneously in flat areas because the depth of the moist boundary
layer is constant throughout that area (McCarthy and Koch 1982). The dryline is situated
on a north-south line orthogonal to the sloped elevation gradient; however, there are
drylines with bulges or wave-like structures possibly linked to enhanced convergence or
downward mixing of locally strong winds aloft. Dryline bulging and wave features are
poorly understood (Schaefer 1986; Coffer et al. 2013).
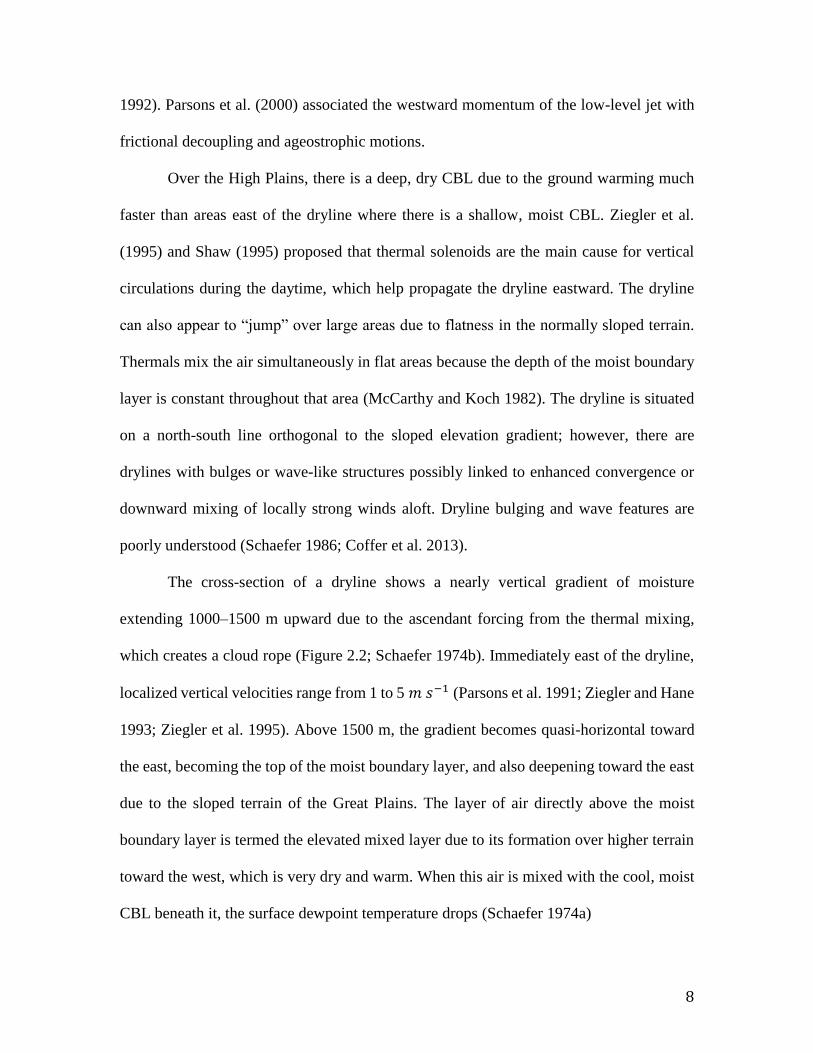
The cross-section of a dryline shows a nearly vertical gradient of moisture
extending 1000–1500 m upward due to the ascendant forcing from the thermal mixing,
which creates a cloud rope (Figure 2.2; Schaefer 1974b). Immediately east of the dryline,
localized vertical velocities range from 1 to 5 𝑚 𝑠−1 (Parsons et al. 1991; Ziegler and Hane
1993; Ziegler et al. 1995). Above 1500 m, the gradient becomes quasi-horizontal toward
the east, becoming the top of the moist boundary layer, and also deepening toward the east
due to the sloped terrain of the Great Plains. The layer of air directly above the moist
boundary layer is termed the elevated mixed layer due to its formation over higher terrain
toward the west, which is very dry and warm. When this air is mixed with the cool, moist
CBL beneath it, the surface dewpoint temperature drops (Schaefer 1974a)

9
Figure 2.2: Satellite imagery from 30 May 2011 at 2345 UTC. Arrows point to a cloud
band associated with the dryline identified in Figure 2.1

10
III. Dryline Climatology
Drylines typically occur in the spring and summer months in the Great Plains
(Schaefer 1974a). Studies on the climatology of drylines include Rhea (1966), who found
that drylines occurred on 45% of spring days (April-June), while Schaefer (1974a) found
that 41% of spring days had drylines. Hoch and Markowski’s (2005) results were similar,
with a springtime frequency of 40%. Recently, Coffer et al. (2013) found 134 (29%) cases
of drylines during the years 2007-2011 in the months April, May, and June.
Although the frequency of drylines is important, Hoch and Markowski (2005)
performed a comprehensive climatological study on drylines, which included frequency,
average longitudinal position, and relationships with upper air conditions. There was a peak
in the frequency of drylines in mid-to-late May, with more than 40% observed; however,
only about 20% of days in late June had drylines. They found the dryline’s most favored
longitude was -101° at 0000 UTC, but the average position of the dryline shifted slightly
westward over the course of the spring. The mean annual longitude did not change during
their 1973–2002 study period. Drylines tended to decrease in daily frequency in late June,
and it was suggested that the onset of the Southwestern summer monsoon increased
moisture in the area, leading to a weaker moisture gradient; increases in westerly
momentum in the Great Plains moved the position of the dryline eastward. The authors
concluded that the 850 mb relative humidity east of the climatological position of the
dryline and relative humidity in the mid troposphere had no association with the position
of the dryline. This suggests that boundary layer processes are the main cause for dryline
morphology.
11
IV. Land-Atmospheric Effects of the Dryline
Past studies concluded that sensible parameters stemming from land-atmosphere
interactions, such as convective available potential energy (CAPE), convective inhibition
(CIN), and storm-relative helicity (SRH), are directly related to boundary layer mixing,
and have caused errors in forecasting models (Coniglio et al. 2013, Holt et al. 2006). Land-
surface schemes in atmospheric models prior to 1980 had a homogenous surface with no
variety of vegetation, however, since then, more complex schemes have been introduced,
making these models more accurate. Pielke (2001) found that land-vegetative processes,
which are driven by surface heterogeneity or soil moisture gradients, have an effect on
cumulus development. The spatial structure of surface heating, which can be significantly
different due to vegetation patterns, contributes to the creation of baroclinicity,
thermodynamic discontinuities, and dynamic discontinuities. The resultant discontinuities
create a focus region for deep moist convection (Chang and Wetzel 1991; Pielke 2001;
Lauwaet et al. 2008). Evapotranspiration itself has shown evidence of strengthening
potential severe weather, such as the Benson, Minnesota tornado of 11 June 2001
(Cheresnick and Basara 2005). Severe weather parameters including effective SRH and
CAPE are maximized near the dryline due to moisture from land-atmosphere processes
(Shaw 1995; Thompson et al. 2007). Research regarding these land-atmosphere parameters
showed that they strongly affect weather in the boundary layer (Zhang and Anthes 1982;
Segal et al. 1989; Chang and Wetzel 1991; Pielke 2001; Holt et al. 2006).
Atmospheric moisture release from vegetation is an important land-atmosphere
interaction. Water is brought from the soil to the air by the plant through transpiration, a
process by which water moves within a plant from the root upward to the tiny pores on the

12
leaf surface, termed stomata. Tiny cells surrounding each stomatal pore on the leaf surface
open and close depending on many atmospheric and physiological variables. Plant
physiologists and ecologists suggest that stomata play the leading role in regulating the
quantity of water transpired by vegetation (Jarvis and McNaughton 1986; Meinzer 1993).
Plants only use 0.5–1% of water absorbed by the root for growth purposes, while the other
99–99.5% of water is released by the plant’s leaves into the air (Macfadyen and Ford 1986).
Transpiration cools plant surfaces similar to how a human cools through the evaporation
of sweat, resulting in the closure of stomata; increases in heat correlate with increases of
transpiration. However, high heat can cause stomata to close, ending the transpiration
process. Eventually, the plant will wilt if it is not replenished with moisture, which can
come in the form of precipitation or irrigation. If precipitation is the only source of water
for plants in a particular area, wilting can be a sign of the beginning of a drought
(Macfadyen and Ford 1986).
Transpiring vegetation provides a more sustained source of atmospheric moisture
than evaporation from bare soil; therefore, a model incorporating the plant biosphere is
needed to predict the weather accurately. The process of transpiration accesses water at all
levels in the soil where the root exists, which is an impactful component of the surface
energy balance equation (Chang and Peter 1991). The surface energy balance is a function
of latent heat flux (evaporation) and sensible heat flux (radiation); evapotranspiration
affects the latent heat flux by introducing moisture into the atmosphere (Ershadi et al.
2011). East of the dryline, stomata transpire moisture from water at the root level, allowing
the plant canopy to gently hold the moisture near the surface and protect it until stronger
advection forces the sub-canopy moisture to the north and west. However, west of the
13
dryline, extreme heat may limit stomata function, reducing transpiration (Ziegler et al.
1995). Warm air advection can then move the moisture transpired by vegetation north and
west, allowing for the buildup of more moisture compared to the advection of moisture
solely from the Gulf of Mexico (Sun and Wu 1992).
Findings from various studies (e.g. Ziegler and Hane 1993; Shaw 1995; Ziegler et
al. 1995; Pielke 2001; Coniglio et al. 2013) suggests that surface moisture can be impactful
on the surface energy budget due to changes in latent and sensible heating in the boundary
layer. Models from McCumber and Pielke (1981), Zhang and Anthes (1982), Ziegler et al.
(1995), and Haugland and Crawford (2005) showed that land-atmosphere interactions
could have a significant impact on meteorological parameters, such as moisture and
temperature. Specifically, the Zhang and Anthes (1982) and Ruiz-Barradas and Nigam
(2006) models found sensitivity in planetary boundary layer (PBL) structure if there were
subtle changes in thermal capacity, moisture availability, roughness length, or albedo.
Segal et al. (1989), Segal and Arritt (1992), Mahrt and Ek (1993), and Rabin et al. (2000),
found mesoscale circulations caused by horizontal variations in vegetation due to
differences in sensible heat flux. The inhomogeneity of soil moisture, directly caused by
horizontal variations in vegetation, can approach the intensity of sea breezes (Ookouchi et
al. 1984). An example of this could be a wet, irrigated crop next to dry land: insolation is
used to evaporate the moisture within the irrigated crops, while insolation on the dry land
is used to create a higher sensible heat flux, creating a thermal boundary. These localized,
mesoscale circulations are areas of convective development (Pielke and Segal 1986; Segal
and Arritt 1992).
14
There is a positive feedback system with soil moisture and precipitation as
described in Findell and Eltahir (2002). These positive feedback mechanisms are a multi-
step process: as soil moisture increases, precipitation then increases. The authors stated that
there is a transition zone between positive feedback in the eastern United States and
negative feedback in the Western United States, with Oklahoma and West Texas
constituting a transitional area. Their study looked at summer months (June, July, and
August), and found there to be a negative feedback in the dryline and monsoon areas of the
Southwest due to the topography of the area. Their reasoning for a negative feedback in
the dryline region was due to the strong capping inversion caused by the dryline. While
this is prevalent during the summer months, there are enough days in the spring months
when the capping inversion is removed, resulting in significant precipitation and severe
weather. Precipitation typically decreases during the summer months in the Great Plains,
except toward the west where monsoon effects may cause an increase in precipitation
during summer months.
Ziegler et al. (1995) found the dryline to be sensitive to sensible heat in their model,
thus sensitive to soil moisture. Increasing soil moisture with depth counterbalances the
drying of soil due to daytime heating, suggesting evapotranspiration is important in
boundary layer moisture quantity. When soil moisture was reduced, sensible heat
increased, which caused a deeper CBL, and weakened the moisture gradient at the dryline.
Shaw (1995) studied the evapotranspiration effect on dryline morphology and found that
increases in soil moisture strengthened the moisture gradient of the dryline. He found that
in his simulation with increased soil moisture, the dryline shifted further west and the
moisture gradient was stronger compared to other model parameters, concluding that
15
evapotranspiration is important to the dryline gradient and movement. Hoch and
Markowski (2005) hypothesized that, due to increasing agricultural land use toward the
west, higher moisture levels from vegetation would cause the dryline to shift slightly
westward over the course of the growing season due to evapotranspiration. They found that
by the last week in June, the longitude of the dryline ranged from -102.6° to -100.4°,
compared to their seasonal average of -101°. Grasso (2000) ran simulations to determine
whether soil moisture had an effect on the dryline, and surmised that the formation of the
dryline was sensitive to past precipitating events because they correlate with soil moisture.
These results showed that dryline morphology may respond to horizontal moisture
variations, which leads to the question: Does the longitudinal positioning of the dryline
change during days, months, or years of weak or strong evapotranspiration?
V. Applications of the Dryline
The dryline can be an area of localized convective initiation in the Great Plains due
to focused convergence and copious amounts of moisture (Fujita 1958; Rhea 1966;
Schaefer 1974a; Schaefer 1986). West of the dryline, temperatures are usually warm to hot,
and the airmass is dry, while east of the dryline, temperatures are warm, and the airmass is
moist (Figures 2.1 and 2.3; Schaefer 1986). Thunderstorm development can occur in the
dry sector immediately west of the dryline where upward motion is maximized due to a
thermal circulation at the boundary. However, due to the capping inversion, the dryline can
also inhibit convection initiation, especially to its immediate east (Schaefer 1974a).
Capping inversions are caused when hot, dry air is situated above
16
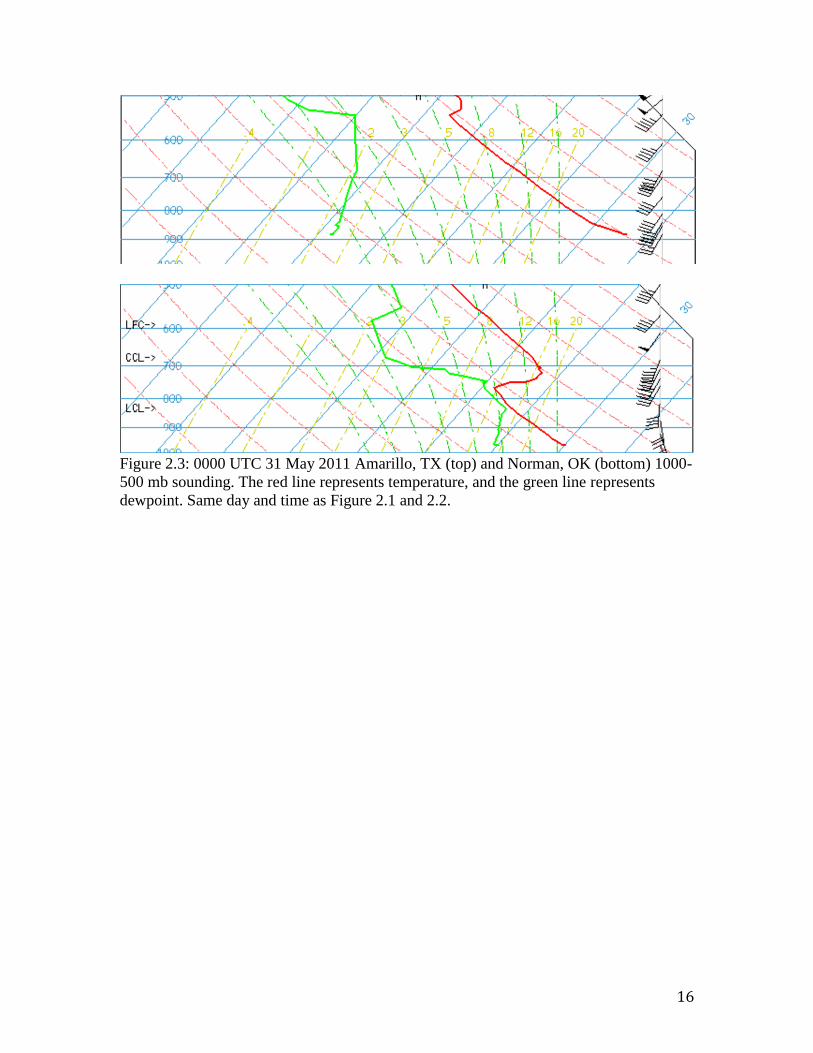
Figure 2.3: 0000 UTC 31 May 2011 Amarillo, TX (top) and Norman, OK (bottom) 1000-
500 mb sounding. The red line represents temperature, and the green line represents
dewpoint. Same day and time as Figure 2.1 and 2.2.

17
moist CBL air, which can prevent thunderstorms from forming too early. The capping
inversion allows for the buildup of buoyant energy (CAPE) in the moist sector, while the
convergence along the dryline suggests that severe weather is possible. There are several
ways to erode the capping inversion in order to initiate convection: if the convective
temperature can be reached, the capping inversion can be a very important to trigger
convection when CAPE is maximized, creating a threat for severe weather (Figure 2.3;
Fujita 1958; NSSP Staff, 1963). When strong vertical wind shear exists, convection along
the dryline can result in severe thunderstorms and even tornadoes (Ziegler and Rasmussen
1998). Drylines tend to be areas favorable to the development of tornadoes because storms
form isolated from one another and have the ability tap into the very unstable atmosphere
in the surrounding area. The dryline moisture gradient is partially aided by the LLJ, which
helps create high amounts of shear. After convection is initiated in the afternoon along the
dryline, the LLJ will activate in the evening due to the diurnal baroclinity, providing
increased veering winds, which increase the potential for tornadoes (Raymond 1978;
Uccellini and Johnson 1979).
Dryline applications to agricultural interests are also significant. For instance, the
typical mode for dryline-related severe weather is isolated convection; however, mesoscale
convective systems (MCS) such as squall lines or mesoscale convective complexes (MCC)
can form along the dryline and propagate for hundreds or even thousands of kilometers
(Koch and McCarthy 1982). These squall lines, MCSs, or MCCs can provide a reliable
source of rainfall to the Great Plains and Midwest. Persistent rainfall can lead to increased
soil moisture values, resulting in increased rates of evapotranspiration, creating a positive
feedback system. These high rates of evapotranspiration can affect severe weather

18
probabilities and even possibly contribute to the production of tornadoes due to increased
moisture content (Basara and Cheresnick 2000).
Evapotranspiration and the dryline are both boundary layer processes, so how
does one affect the other? The apparent placement and movement of the dryline may
depend on land-atmosphere effects. Most importantly, the dryline is important to for
severe weather processes and consistent rainfall in the Great Plains. This study will look
at how evapotranspiration affects the dryline through statistical analyses.

19
3. Journal Article
This following journal article (Chapter 3) is presented in this thesis in the format of
a manuscript to be submitted to the American Meteorological Society’s Journal of
Hydrometeorology. It consists of an abstract, introduction, data and methods, results and
discussion, summary, acknowledgments, and references.

20
Effects of Evapotranspiration on the Longitudinal Dryline Position in the Southern
Great Plains
manuscript submitted by:
Zachary F. Johnson* and Nathan M. Hitchens
Department of Geography, Ball State University, Muncie, Indiana
for publication as an ARTICLE in
Journal of Hydrometeorology
Submitted: May 2017
* Corresponding author: Nathan M. Hitchens, Dept. of Geography, Ball State University,
Muncie, IN 47306, [email protected]

21
I. Abstract
The dryline is among the most important meteorological phenomena in the Great
Plains because of its significance in tornadogenesis, severe weather, and consistent rainfall.
Past research has extensively examined the dynamics of the dryline, however, recent
meteorological research looks beyond dynamics and focuses on land-atmosphere
interactions. This study focuses on how evapotranspiration affects the climatological
longitudinal positioning of the dryline, presenting a climatological study for the months of
April, May, and June during 2006–15 in the southern Great Plains. Here, drylines are
defined as specific humidity gradients exceeding 3 𝑔 𝑘𝑔−1(100 𝑘𝑚)−1 that do not deviate
more than 30° from a north-south orientation; they were found to occur on 33.4% of spring
days, and the most favorable position was -100.9° at 0000 UTC. Specific humidity
gradients ranged from 3.0 to 15.2 𝑔 𝑘𝑔−1(100 𝑘𝑚)−1 , with an average value of 6.8
𝑔 𝑘𝑔−1(100 𝑘𝑚)−1 . A relationship between the dryline longitudinal position and soil
moisture was found; as soil moisture values increased, the dryline was located further west,
which suggests evapotranspiration affects the longitudinal positioning of the dryline. There
was also a relationship between the gradient of soil moisture and the intensity (specific
humidity gradient) of the dryline, such that when longitudinal soil moisture gradients were
strong (increasing from west to east), the dryline intensity increased. This relationship was
found both in at the broad scale, which includes the entire study area, and the local scale.

22
II. Introduction
The dryline, a transition zone that separates dry air from moist air, is an important
meteorological phenomenon in the Great Plains of the United States (Fujita 1958), and is
a focus for research because of its effect on severe weather in that region. Many violent
tornadoes have occurred as a result of dryline convection; therefore, an emphasis of past
research has been on dryline dynamics. However, interactions between the land and
atmosphere, as well as the climatology of drylines, have not been researched as
comprehensively. There have only been a few studies that focused on the
evapotranspiration effect on the dryline (Ziegler et. al 1995; Shaw 1995; Grasso 2000), all
of them incorporated atmospheric models. Curiously, no studies used observed
evapotranspiration data and its effect on the dryline. This study examines observed soil
moisture values as a surrogate for evapotranspiration, and relate them to the daily position
of the dryline.
Moisture gradients associated with the dryline typically exceed 10° 𝐶 (100 𝑘𝑚)−1;
however, gradients of 10° 𝐶 𝑘𝑚−1 have been observed (Pietrycha and Rasmussen 2001;
Hoch and Markowski 2005). Drylines have been found to occur on 30–40% of springtime
days, and have an average longitudinal position of -101° (Schaefer 1974a; Hoch and
Markowski 2005; Coffer et al. 2013). In the Great Plains, one of the main mechanisms for
an increased gradient of moisture is the confluence of surface winds from a lee trough,
which is the same geostrophic deformation that is important to frontogenesis (Schultz et
al. 2007). Dry air from the southwestern United States and moist air from the Gulf of
Mexico meet, creating a sharp, narrow, non-frontal moisture discontinuity. The cause of
initial moisture advection into the dry air is by evaporation from both the ocean and
23
precipitation, but there is also an evapotranspiration component (Schaefer 1974b). Soil
moisture and vegetation generally decrease from east to west, and as a result, latent heat
flux also decreases from east to west, aiding in the creation of the moisture gradient (Grasso
2000). Evapotranspiration affects the latent heat flux by introducing moisture into the
atmosphere (Ershadi et al. 2011). However, these processes do not explain the extreme
gradients of moisture at the dryline, with dewpoint temperature gradients sometimes
exceeding 10° 𝐶 𝑘𝑚−1. The strong moisture and virtual potential temperature gradients,
along with weaker temperature gradients, help create vertical solenoids across the dryline,
which strengthen the moisture gradient to extreme values. These solenoids act as
frontogentical forcing to create extreme gradients of moisture despite the vertical mixing
(Parsons et al. 1991; Ziegler and Hane 1993; Ziegler et al. 1995).
Several studies have shown that land-atmosphere interactions strongly affect
weather in the boundary layer (Zhang and Anthes 1982; Segal et al. 1989; Chang and
Wetzel 1991; Pielke 2001; Holt et al. 2006). Although a significant portion of atmospheric
moisture is advected from the Gulf of Mexico, there is an evapotranspiration component,
one of the many land-atmosphere processes. Plants only use 0.5–1% of water absorbed by
the root for growth purposes, while the remainder is released by the plant’s leaves into the
air through a process called transpiration (Macfadyen and Ford 1986). Transpiring
vegetation provides a more sustained source of atmospheric moisture than evaporation
from bare soil; therefore, a model incorporating the plant biosphere is needed to predict the
weather accurately (Chang and Wetzel 1991).
Ziegler et al. (1995) found the dryline to be sensitive to sensible heat in their model,
thus sensitive to soil moisture. In their land-atmosphere model, a domain of increasing soil

24
moisture with depth counterbalanced the drying of soil due to daytime heating, which
suggests evapotranspiration is an important boundary layer moisture quantity. They also
found that when soil moisture was reduced, sensible heat increased, which caused a deeper
convective boundary layer (CBL), and weakened the moisture gradient at the dryline. In a
different land-atmosphere model, Shaw (1995) studied the evapotranspiration effect on
dryline morphology, and found that increases in soil moisture strengthened the moisture
gradient of the dryline. He found that in his simulation with increased soil moisture, the
dryline shifted further west and the moisture gradient was stronger compared to other
model parameters, concluding that evapotranspiration is important to the formation and
movement of the dryline moisture gradient. Hoch and Markowski (2005) hypothesized
that, the westward shift in the dryline over the course of spring was due to effects of
evapotranspiration from crop growth. They found that by the last week in June, the
longitude of the dryline ranged from -102.6° to -100.4°, compared to their seasonal average
of -101°. Grasso (1999) ran simulations to determine whether soil moisture had an effect
on the dryline, and surmised that the formation of the dryline was sensitive to past
precipitating events because they correlate with soil moisture. These results show that
dryline morphology may respond to horizontal moisture variations, which leads to the
question: Does the longitudinal positioning of the dryline change during days, months, or
years of weak or strong evapotranspiration?
The purpose of this study is to show that evapotranspiration affects the longitudinal
position of the dryline, using volumetric soil moisture values as a surrogate for
evapotranspiration rates. To do this, a 10-year climatology of the dryline in the southern
Great Plains during the months of April, May, and June was constructed using strict
25
guidelines for the identification of this feature. Then, comparisons were made between soil
moisture values throughout the study area and the longitudinal dryline position to identify
possible relationships between them.
III. Data and methods
a. Dryline definition
A dryline is broadly defined as a transition zone tens of kilometers in width and
hundreds of kilometers in length, separating dry air from moist air (Fujita 1958). Over the
years, different definitions were used to identify drylines based on meteorological
variables. For instance, in Rhea’s (1966) study describing thunderstorms forming off the
dryline, he defined it as a dewpoint temperature difference of at least 5.6°C (10°F) between
reporting stations. Schaefer (1974a) also required a 5.6°C dewpoint difference between
reporting stations, and additionally required that the moist air east of the dryline be “fairly
uniform,” with an additional requirement that the mean dewpoint temperature exceed 10°C
(50°F). As part of his definition, Schaefer excluded classic fronts by ensuring minimal
virtual temperature gradients across the dryline, because at the time, it was believed that
drylines showed little to no change in virtual temperature gradients across them, while cold
fronts did. However, by using cloud-scale modeling and detailed observation, Coffer et al.
(2013) showed that there are indeed large virtual temperature gradients across the dryline.
Other studies that strictly defined drylines include Koch and McCarthy (1982), who used
the leading edge of a sharp equivalent potential temperature gradient to determine the
dryline (usually at the 355 K isopleth), Grasso (2000), who used the strong mixing ratio
gradients to determine the dryline due to its conservative properties compared to dewpoint
26
temperature, and Hoch and Markowski (2005), who used horizontal specific humidity
gradients of at least 3 𝑔 𝑘𝑔−1(100 𝑘𝑚)−1 to determine longitudinal dryline positioning.
Although methods for identifying drylines have changed over time, the use of specific
humidity gradients appears to be the preferred method for dryline identification in recent
studies, because it is a measure that is conserved with pressure (elevation) changes, unlike
dewpoint temperature (Hoch and Markowski 2005).
Following Hoch and Markowski (2005), this study defined drylines as areas of
specific humidity gradients of at least 3 𝑔 𝑘𝑔−1(100 𝑘𝑚)−1. In order to avoid incorrectly
identifying cold fronts as drylines, areas meeting the specific humidity gradient criterion
were further examined using plots of temperature, wind vectors, and surface pressure. Cold
fronts and drylines both have significant specific humidity gradients; however, cold fronts
have greater wind shifts and temperature changes across them compared to drylines.
Additionally, outflow boundaries, the leading edge of thunderstorm-cooled air, can affect
drylines, and were identified using Doppler radar imagery (Glickman and Walter 2000).
Finally, daytime drylines are often associated with increased temperatures in the dry sector
as a result of diurnal temperature cycle, especially at 0000 UTC; therefore, if the
temperatures were higher on the dry side, that was used as affirmation of the presence of a
dryline (Schaefer 1986).
The specific location of a dryline was defined as the furthest eastward extent of a
line with the greatest horizontal specific humidity gradient, as described in Hoch and
Markowski (2005), and at this location, the longitude of the dryline was recorded at the
middle of the specific humidity gradient. Drylines tend to be oriented in a north-south
direction in the Great Plains, but the dryline can tilt as much as 30° from this orientation

27
(Tegtmeier 1974; Schaefer 1986). Those drylines that deviated more than 30° from a
north-south orientation were excluded from this study.
b. Criteria for determining a dryline
The following are the criteria that were used in this study to identify drylines:
Specific humidity gradient of at least 3 𝑔 𝑘𝑔−1(100 𝑘𝑚)−1 (Hoch and Markowski
2005);
Not associated with a cold front;
Not associated with an outflow boundary;
Dewpoint temperatures in moist sector had a mean value greater than 10° C and
were close to uniform (±3° C; Schaefer 1974a);
If there were two drylines, the one with the greatest specific humidity gradient was
used, assuming all other criteria were satisfied;
There was a surface wind shift between the dry and moist sectors, even if it was
minimal (Coffer et. al. 2013);
A dryline that meets the above criteria must not have deviated more than 30° from
a north-south orientation (Schaefer 1986).
c. Data
In this study, the position of the dryline was identified using specific humidity,
atmospheric pressure, dewpoint temperature, air temperature, and wind barbs from
Oklahoma Mesonet, Automated Surface Observing System (ASOS), and Surface Aviation
Observation (SAO) stations. The Oklahoma Mesonet is a network of environmental

28
monitoring stations that goes beyond the guidelines of normal ASOS or SAO station
placement (Brock et al. 1995). Most importantly, these mesonet stations have a much finer
grid spacing compared to ASOS and SAO stations.
Following Hoch and Markowski (2005), data were analyzed at 0000 UTC each day
during the months of April, May, and June over the period of 2006–15. The Oklahoma
Mesonet records specific humidity, while ASOS and SAO stations derive specific humidity
from dewpoint temperature and pressure (Wallace and Hobbs 1977; Bolton 1980):
𝑒 = 6.112 × 𝑒𝑥𝑝 (17.67 × 𝑇𝑑
𝑇𝑑+243.5) (1)
𝑞 =(0.622 × 𝑒)
𝑝−(0.378 × 𝑒) (2)
where 𝑒 is the vapor pressure in mb, 𝑇𝑑is the dewpoint temperature in °C, 𝑝 is the surface
pressure in mb, and 𝑞 is the specifc humidity in kg kg-1. In addition to specific humidity,
atmospheric pressure, and dewpoint temperature, additional data were used to identify
drylines, including radar reflectivity, air temperature, and wind direction.
Soil moisture was chosen as a surrogate for evapotranspiration because the moisture
released into the atmosphere from plants originates from within the soil (Wetzel and Chang
1987). There are equations to calculate evapotranspiration, as described by Penman (1948)
and Monteith (1981), but they require over twenty variables, many of which are not
measured in great density, and not within the scope of this research. Thornthwaite (1948)
introduced potential evapotranspiration as a measure, which describes the amount of
evaporation that would occur if there was a sufficient water source available; however, in
the Great Plains, many days lacked sufficient water.
Soil moisture observations were obtained from the Oklahoma Mesonet, which has
a dense network of soil moisture data, and the West Texas Mesonet, which also has an

29
extensive network; however, these two mesonets use different soil moisture measurements.
The preferred measurement for soil moisture is a normalized form of the “raw” sensor
response (∆𝑇𝑟𝑒𝑓), which is measured using the calibrated Campbell Scientific 229-L heat
dissipation matric potential sensor. This measure is used to calculate the Fractional Water
Index (FWI), a unitless measure ranging from 0 (completely dry) to 1 (saturated), and is
calculated as:
FWI =∆𝑇𝑑−∆𝑇𝑟𝑒𝑓
∆𝑇𝑑−∆𝑇𝑤 (3)
where ∆𝑇𝑟𝑒𝑓 is the normalized reference sensor response, ∆𝑇𝑑 is the reference response
when the sensor is dry, and ∆𝑇𝑤 is the reference response when the sensor is wet, all
measured in °C (Schneider et. al 2003). The FWI is useful for approximating
evapotranspiration because it takes into consideration soil texture and covers the total range
of soil moisture values. It is also a function of matric potential, the adhesive intermolecular
force with which water is absorbed onto the soil particles, which is an indication of
evapotranspiration.
The Oklahoma Mesonet is among the few networks that use the FWI, but the West
Texas Mesonet does not. Therefore, FWI values from the Oklahoma Mesonet were
converted to volumetric water, the measure used by the West Texas Mesonet. First, using
∆𝑇𝑟𝑒𝑓, matric potential (MP; measured in bars) is calculated as (Schneider et al. 2003):
MP = −𝑐 ×exp(𝑎 × ∆𝑇𝑟𝑒𝑓)
100 (4)
where 𝑎, a constant, is 1.788, 𝑐, another constant, is 0.717, and ∆𝑇𝑟𝑒𝑓 is the reference
temperature as described in (3). Next, MP is converted to volumetric water content (WC):
WC = 𝑊𝐶𝑟 + (𝑊𝐶𝑠−𝑊𝐶𝑟
1+(𝛼 × −𝑀𝑃)𝑛)1−
1
𝑛 (5)

30
where 𝑊𝐶𝑟 is residual water content, and 𝑊𝐶𝑠 is the saturated water content, all in
𝑚3𝑤𝑎𝑡𝑒𝑟 (𝑚3
𝑠𝑜𝑖𝑙)−1 . The empirical constants (𝛼, 𝑛) , 𝑊𝐶𝑟 and 𝑊𝐶𝑠 all depend on
location, because the coefficients are functions of soil properties such as texture, density,
porosity, and permeability. Thus, the coefficients may change if the soil properties change.
For this study, they were held constant at each location, although they are subject to change
on the geologic time scale, or if more precise and accurate sensors are installed in the future.
The preferred depth of soil moisture measurements was 5 cm below the surface, because
the shallow nature of this depth takes into consideration transpiration from the root and
evaporation of soil moisture by insolation. Average daily soil moisture from 5 cm
underground was calculated each day.
The study area was comprised of the entire state of Oklahoma, the Texas Panhandle,
eastern New Mexico, eastern Arkansas, and extreme southwestern Missouri (Figure 3.1).
The south-central Great Plains was the preferred domain for dryline placement because
drylines are most common in the Texas Panhandle and western Oklahoma (Rhea, 1966).
Although soil moisture data were only obtained in Oklahoma and the Texas Panhandle,
due to the fluid nature of the atmosphere and the dryline, the

31
Figure 3.1: ASOS and SAO stations (black circles), Oklahoma Mesonet stations (blue
triangles), West Texas Mesonet stations (red squares), and the study area for dryline
placement (yellow box). Oklahoma Mesonet stations were used for both dryline
placement and soil moisture measurements, while West Texas Mesonet data were used
only for soil moisture measurements. ASOS and SAO stations were used only for dryline
placement.

32
study area also included areas slightly to the west of Oklahoma and the Texas Panhandle
where moisture from evapotranspiration is commonly advected (Sun and Wu 1992;
Schultz et. al 2007). Surface data from ASOS and SAO stations were used in all parts of
the study area that were not covered by the Oklahoma Mesonet.
The time frame of 2006–15 was chosen because it captured both record dry and wet
periods in the study area. According to the Oklahoma Climatological Survey (2016),
anomalous precipitation years included 2011, 2012, and 2015. Statewide, annual average
precipitation in Oklahoma ranged from only 660 mm (26 inches) in 2012 to 1370 mm (54
inches) in 2015.
d. Analysis Techniques
Following Coffer et al. (2013) and Clark et al. (2015), a manual approach to dryline
identification was used in this study. First, low-pressure centers and their associated
boundaries were identified based on temperature gradients, wind shifts, and mean surface-
level pressure. This was important because drylines tend to form in the warm sector of a
lee-side low (Schaefer 1986). Next, isopleths of specific humidity were examined to
determine if a dryline existed; if a gradient exceeded 3 𝑔 𝑘𝑔−1(100 𝑘𝑚)−1 within the
study area, then the boundary was further examined. If there were two boundaries that
exceed the required specific humidity value, then that with the strongest gradient was used
if all other criteria were met. Next, dewpoint temperatures in the moist sector were
examined for uniformity, with a mean value of at least 10°C required. If necessary, a loop
of radar reflectivity was overlaid on the specific humidity map to ensure the dryline was
not associated with an outflow boundary. Wind barbs were also inspected for a shift in

33
wind direction at the dryline, as required within the criteria. Finally, the orientation of the
boundary was examined for deviations greater than 30° from a north-south orientation,
with those exceeding this threshold excluded from the dataset.
For each day during the study period, if a dryline was identified, its longitude was
recorded, and the weighted mean center of the soil moisture values from that day was
calculated. The location of the weighted mean was calculated as:
�̅�𝑊𝐶 = ∑ 𝑓𝑖𝑋𝑖
∑ 𝑓𝑖 (6)
�̅�𝑊𝐶 = ∑ 𝑓𝑖𝑌𝑖
∑ 𝑓𝑖 (7)
where �̅�𝑊𝐶 and �̅�𝑊𝐶 are the weighted mean locations of X and Y, 𝑓𝑖 is the volumetric soil
moisture value (weight) of point 𝑖, and 𝑋𝑖 and 𝑌𝑖 are the X and Y coordinate of point 𝑖.
Converted Cartesian coordinates of longitude and latitude were used for 𝑋𝑖 and 𝑌𝑖. This
allowed for a single point each day to represent the mean center of soil moisture and
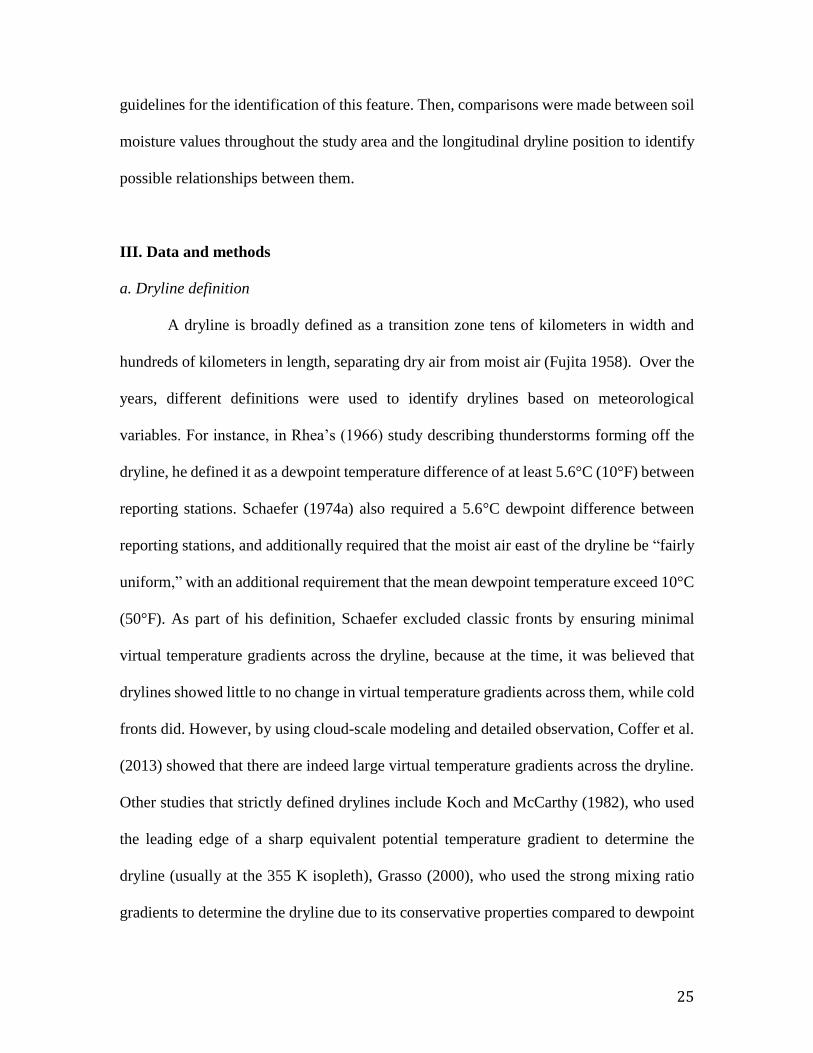
volumetric water content. If a station was in an area isolated from the dense network, then
that station would have been heavily weighted compared to other stations in a denser area
(Figure 3.2; McGrew et. al 2014). Thiessen polygons (Thiessen 1911) were used for
weighted averages, because they approximate weights based on distance from other
stations; this approach has been frequently employed in spatial applications using data from
mesonets (Zhao and Shepherd 2012; Kornelsen et al. 2015). When interpreting results
using this approach, because soil moisture generally decreased toward the west, a westward
shift in the weighted mean suggests higher soil moisture values, while an eastward shift
would be suggestive of lower values.
34
Figure 3.2: An example of Thiessen polygons for mesonet stations used in the year 2015.
Dots represent mesonet stations, and the rectangle represents the study area.

35
Finally, Pearson’s product-moment correlation coefficient was used to determine
whether a relationship exists between the longitude of the dryline and soil moisture. As
described in McGrew et al. (2014), the equation of Pearson’s Correlation Coefficient, r, is
defined as:
𝑟 = ∑ 𝑋𝑖𝑌𝑖−(
(∑ 𝑋𝑖)(∑ 𝑌𝑖)
𝑁)
√∑ 𝑋2
𝑖−(∑ 𝑋2𝑖)
𝑁√
∑ 𝑌2𝑖−(∑ 𝑌2
𝑖)
𝑁
(8)
where N is the number of paired data values. This same approach was also used to
determine relationships between the latitude of the mean center of soil moisture and the
longitude of the dryline.
IV. Results and Discussion
a. Dryline climatology
During the 10-year study period, there were 317 drylines identified out of 910
possible days (33.4%). This percentage is similar to those observed in other climatological
dryline studies, including 45% of spring days in Rhea (1966), 41% spring days in Schaefer
(1974a), and 32% of April–June days in Hoch and Markowski (2005). The decrease in
dryline days from older to newer studies was due to the use of more specific dryline
definitions and methods of identifying them. When looking at the frequency of drylines
identified during the study period, there was a peak of dryline days from mid-to-late June,
with a rapid decline toward the end of the three-month period (Figure 3.3). The last 10 days
of June (21st–30th) had a daily dryline frequency of 21%, while early June (1st–10th) had
a frequency of 49%, and mid-June (11th–20th) had a frequency of 51%. By month, the
frequency of drylines steadily increased throughout the spring season, with 27% in April,
37% in May, and 40% in June.

36
Figure 3.3: Frequency of days with a dryline during the 2006–15 period. The dashed line
is the frequency, and the black line is the exponential smoothed average. Exponential
smoothing uses weighted averages in which the weight of an observation decreases
exponentially as it moves further toward the past.
0
1
2
3
4
5
6
7
8
9
Fre
qu
en
cy
Date

37
In contrast, Hoch and Markowski (2005) found a broad peak of dryline frequency
in mid-to-late May, while in this study it was found to occur in mid-June. The difference
is likely due to the large study area and longer study period of Hoch and Markowski; for
instance, in this study, no drylines were identified on May 14, while nearly 3 were typical
of that period. However, there is agreement that dryline frequency increases throughout the
spring period, followed by a rapid decrease in late June. Hoch and Markowski hypothesized
that the summer monsoon moistens the typical source regions of dry continental air,
weakening the moisture gradient; the finding from this study supports their hypothesis.
b. Dryline longitudinal position
The average longitudinal position of drylines was found to be -100.9°, ranging from
-105° to -95°, or from the eastern edge of the Rocky Mountains to the Oklahoma-Arkansas
border. Several times there appeared to be drylines further east, but they did not satisfy this
study’s dryline criteria, mainly because the moisture gradient was associated with a cold
front. Over the course of the April–June period, the dryline tended to shift westward
(Figure 3.4). In fact, there was a clear peak in frequency between -100.5° and -101° (Figure
3.5), which seems to be associated with the Caprock Escarpment in West Texas (Figure
3.6), an area of strong elevation gradients sloping upwards of 1.9 𝑚 𝑘𝑚−1. Another peak
in frequency was observed between -102.5° and -103° in the western Texas Panhandle,
although it is not as clear why this area was favored. The annual average dryline position
(Table 3.1)

38
Figure 3.4: Average dryline longitude over April–June. The dashed line is the daily
average longitude, and the black line is the polynomial smoothed average. Breaks in the
dashed line are a result of zero drylines on a specific day.
Figure 3.5: Frequency of dryline longitudes in 0.5° increments at 0000 UTC during
April–June from 2006–15.
-106
-104
-102
-100
-98
-96
-94
Lo
ng
itu
de
(D
eg
ree
s)
Date
0
10
20
30
40
50
60
-10
6.4
9
-10
5.9
9 t
o -
10
5.0
-10
5.4
9 t
o -
10
5
-10
4.9
9 t
o -
10
4.4
9
-10
4.4
9 t
o -
10
4
-10
3.9
9 t
o -
10
3.5
-10
3.4
9 t
o -
10
3
-10
2.9
9 t
o -
10
2.5
-10
2.4
9 t
o -
10
2
-10
1.9
9 t
o -
10
1.5
-10
1.4
9 t
o -
10
1
-10
0.9
9 t
o -
10
0.5
-10
0.4
9 t
o -
10
0
-99
.99
to
-9
9.5
-99
.49
to
-9
9
-98
.99
to
-9
8.5
-98
.49
to
-9
8
-97
.99
to
-9
7.5
-97
.49
to
-9
7
-96
.99
to
-9
6.5
-96
.49
to
-9
6
-95
.99
to
-9
5.5
-95
.49
to
-9
5
Fre
qu
en
cy
Longitude (degrees)

39
Figure 3.6: Frequency of all April–June dryline longitudes at 0000 UTC. Elevation
contours are shown in 100-meter increments (thin gray lines) and 300-meter increments
(thick gray lines with labels).
Table 3.1: Number of drylines, average dryline longitude, average specific humidity
gradient, and average soil moisture for each year during the study period.
Year Frequency Average Dryline
Longitude
Average Specific
Humidity Gradient
𝑔 𝑘𝑔−1(100 𝑘𝑚)−1
2006 22 -100.24 6.45
2007 24 -101.43 6.68
2008 29 -101.59 7.30
2009 26 -100.66 7.54
2010 38 -101.14 6.74
2011 32 -99.01 8.01
2012 36 -101.07 6.90
2013 36 -101.04 7.21
2014 39 -101.41 6.39
2015 35 -102.27 5.35

40
ranged from -102.3° in 2015—approximately the same longitude as Amarillo, Texas—to -
99° in 2011, placing it just west of Wichita Falls, Texas and Lawton, Oklahoma. In 2011,
the dryline was much further east, suggesting that precipitation was occurring more
consistently in the east, which would affect agriculture in western Oklahoma and the Texas
Panhandle.
c. Climatology of specific humidity gradients
According to the dryline criteria specified in this study, gradients of specific
humidity were required to be at least 3 𝑔 𝑘𝑔−1(100 𝑘𝑚)−1 to be classified as a dryline,
assuming all other criteria were satisfied. The range of specific humidity gradients
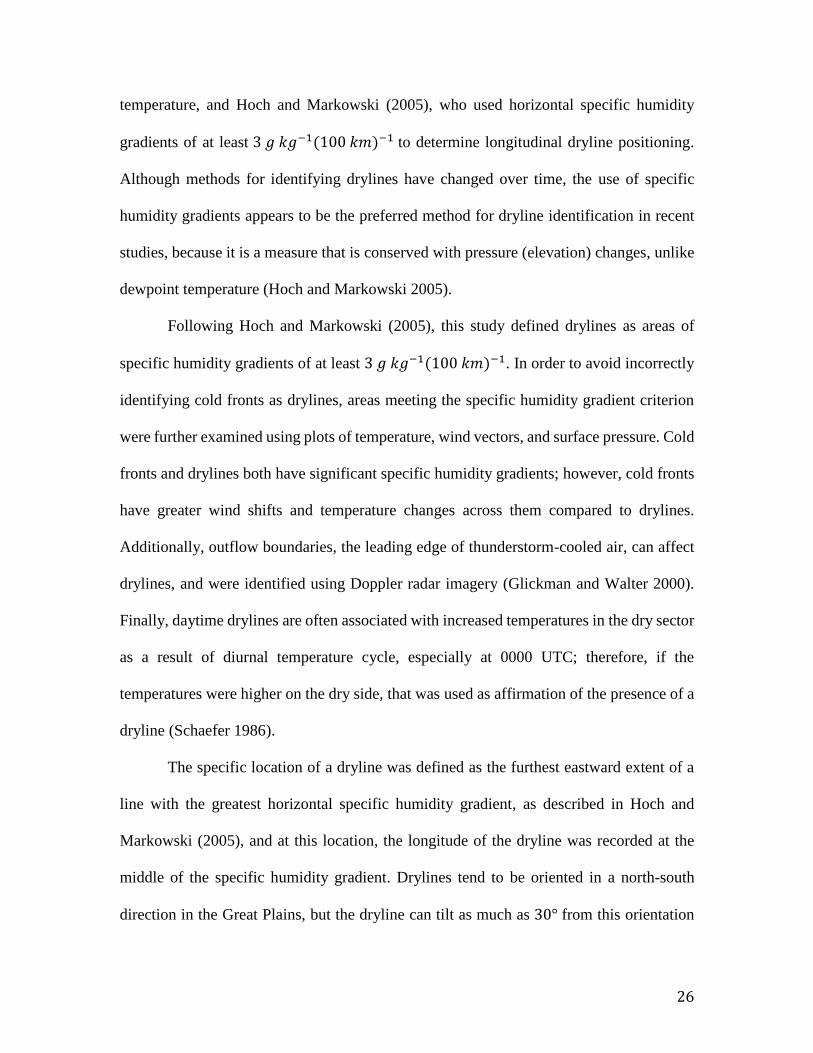
associated with drylines began at 3 and extended to 15.2 𝑔 𝑘𝑔−1(100 𝑘𝑚)−1, with an
average of 6.8 𝑔 𝑘𝑔−1(100 𝑘𝑚)−1 (Figure 3.7). Most drylines (90%) were associated with
specific humidity gradients between 3 and 10 𝑔 𝑘𝑔−1(100 𝑘𝑚)−1 , showing extreme
gradients of specific humidity to be rare. There was no statistical association found between
longitude and specific humidity gradient values, which was primarily due to the fact that
gradients of specific humidity fluctuate along the length of the dryline, and this study only
recorded one value at a single point.
41
Figure 3.7: Frequency of specific humidity gradients [𝑔 𝑘𝑔−1(100 𝑘𝑚)−1] at 0000 UTC
during April–June from 2006–15.
0
5
10
15
20
25
30
3 t
o 3
.5
3.5
to
4
4 t
o 4
.5
4.5
to
5
5 t
o 5
.5
5.5
to
6
6 t
o 6
.5
6.5
to
7
7 t
o 7
.5
7.5
to
8
8 t
o 8
.5
8.5
to
9
9 t
o 9
.5
9.5
to
10
10
to
10
.5
10
.5 t
o 1
1
11
to
11
.5
11
.5 t
o 1
2
12
to
12
.5
12
.5 t
o 1
3
13
to
13
.5
13
.5 t
o 1
4
14
to
14
.5
14
.5 t
o 1
5
15
to
15
.5
15
.5 a
nd
ov
er
Fre
qu
en
cy
Specific Humidity Gradient

42
There was a weak annual correlation between dryline longitudes and the associated
specific humidity gradients, with an average 10-year r-value of 0.26 with all years having
positive correlation values. This suggests that as the longitude of the dryline moved west,
the specific humidity gradient across the dryline also decreased; drylines located further
east tended to have stronger specific humidity gradients, perhaps due to increased
frontogenetical forcing from the intensification of lee-side lows. Although this study was
designed to exclude cold fronts, if one were approaching the dryline, the specific humidity
gradient of the dryline would increase (Ogura and Portis 1982), despite the front still being
far enough away for the gradient to meet the dryline criteria. Another possible explanation
for the decreased specific humidity gradients toward the west was the increase in
agricultural plant growth as the season progresses from April to June, suggesting an
increase in the evapotranspiration rate, and the weakening of the specific humidity gradient
when drylines are located further west.
d. Soil moisture climatology
Typically, soil moisture values were lowest in dry years and highest in wet years in
the western part of the study area. However, toward the east, soil moisture values remained
mostly constant throughout the study period (Oklahoma Climatological Survey 2016). This
is expected because the dryline is typically the initiation point of convection, which then
causes precipitation eastward. Average soil moisture values from the more notable dry
years in the southern Great Plains, such as 2006 or 2011, differed greatly in the west
compared to other years, but very little in the east (Table 3.2). The longitudes used to define
west (-101°, or the western side of the Texas Panhandle) and east (-96°, or eastern
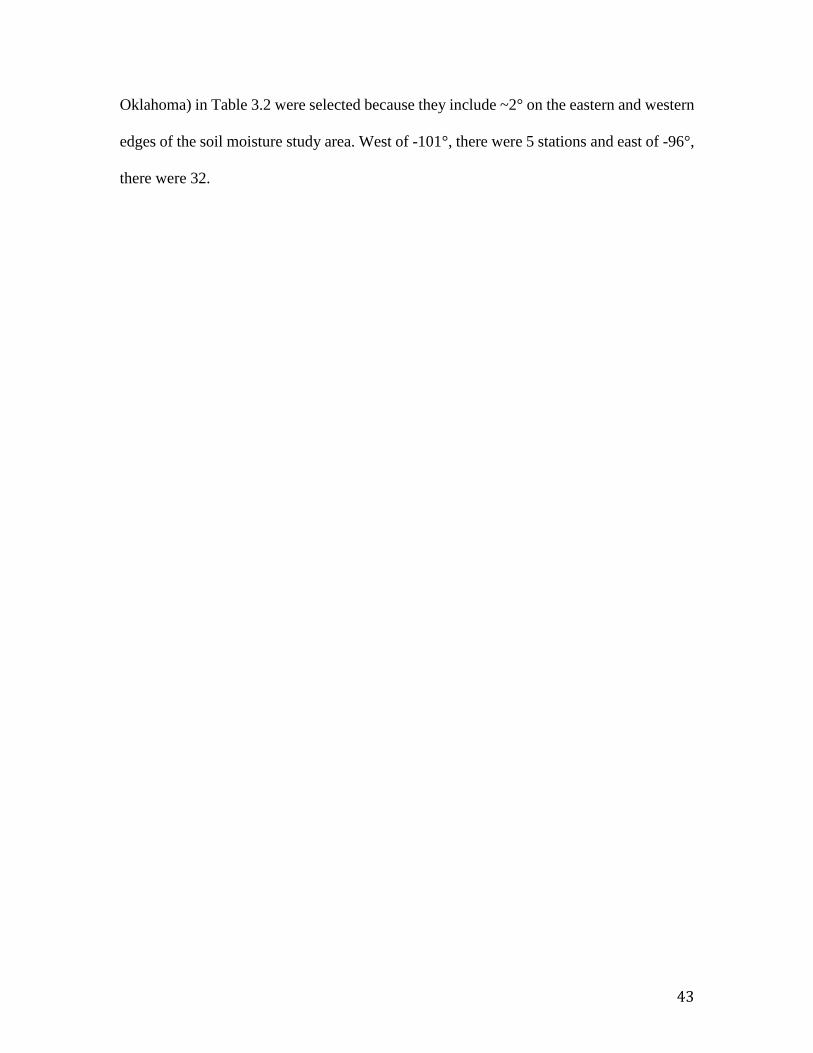
43
Oklahoma) in Table 3.2 were selected because they include ~2° on the eastern and western
edges of the soil moisture study area. West of -101°, there were 5 stations and east of -96°,
there were 32.
44
Table 3.2: Annual average soil moisture values in 𝑚3𝑤𝑎𝑡𝑒𝑟 (𝑚3
𝑠𝑜𝑖𝑙)−1.
Year Overall West of -101° East of -96°
2006 0.3283 0.1727 0.3947
2007 0.3666 0.2864 0.3968
2008 0.3491 0.2335 0.3971
2009 0.3662 0.3076 0.3970
2010 0.3673 0.3118 0.3974
2011 0.3177 0.1758 0.3946
2012 0.3449 0.2444 0.3951
2013 0.3501 0.2381 0.3973
2014 0.3436 0.2289 0.3966
2015 0.3744 0.3207 0.3972

45
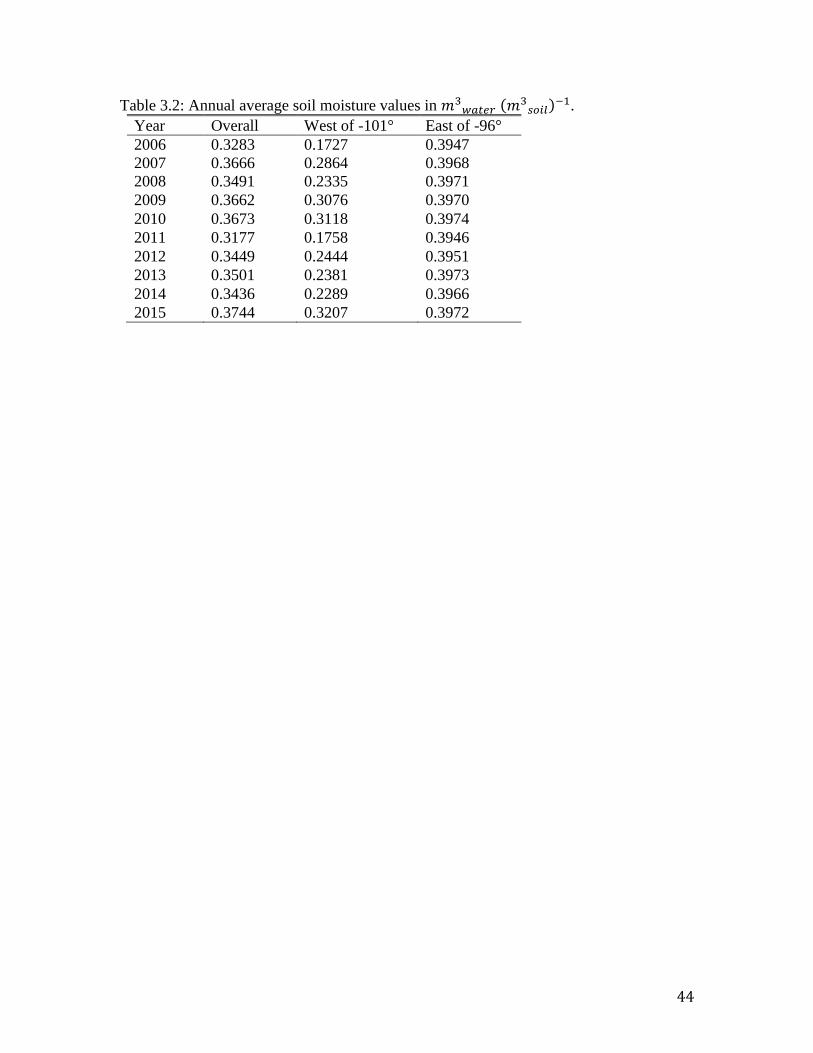
The average amount of soil moisture decreased from the beginning of April through
the end of June (Figure 3.8). Although soil moisture decreased, potential
evapotranspiration, the amount of evapotranspiration that would occur if there was
sufficient soil moisture source available increased. This occurred because the increased
insolation later in the period evaporated more soil moisture, and there was an increase in
transpiration later in the period due to crop growth, which also removed moisture from the
soil. As vegetation and agriculture greens during the spring, more precipitation is needed
to sustain high soil moisture values due to the increased evapotranspiration rate.
46
Figure 3.8: Average volumetric water content from April–June for the entire study area
from 2006–15.
0.33
0.335
0.34
0.345
0.35
0.355
0.36
0.365
So
il M
ois
ture
Date

47
e. Evapotranspiration effect
One of the questions motivating this study was whether the position of the
longitudinal weighted mean center of soil moisture was related to the longitudinal position
of the dryline, specifically: if the weighted mean center of soil moisture moved to the west,
would the longitudinal dryline position also move to the west? After comparing the
locations of these two variables each year throughout the study period, no relationship was
found, with the average correlation coefficient being very low (r=0.17) with some yearly
correlation values being negative. This suggests that the weighted center of soil moisture
has little effect on dryline positioning.
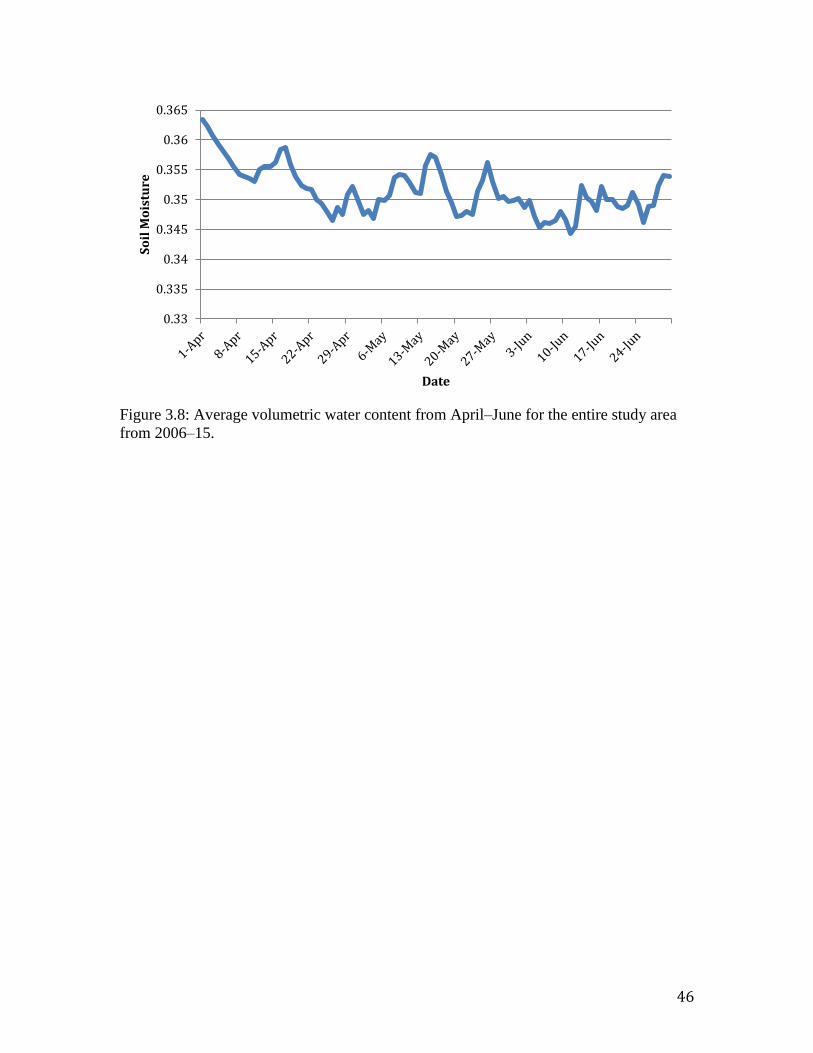
A stronger correlation was found between the longitude of the dryline and the total
volumetric soil moisture content, with a 10-year average r-value of -0.51 (Figure 3.9). The
negative correlation coefficient values suggest that as the total volumetric soil moisture
increased within the study area, the longitude of the dryline moved west. Physically, if soil
moisture is high, evapotranspiration can occur at a higher rate, resulting in an increase in
the amount of moisture in the moist boundary layer. This confirms previous idealized
model studies that looked at soil moisture’s effect on the dryline (Shaw 1995). If the study
area were reduced to only include areas west of -101°, then the 10-year average r-value
decreased further to -0.66, which is attributed to higher soil moisture values in the west
compared to the east (Table 3.2).
48
Figure 3.9: Annual correlation coefficients (r) of dryline longitude and total volumetric
soil moisture content.
-0.31
-0.37
-0.61
-0.51-0.46
-0.52 -0.53 -0.54
-0.70
-0.54
-0.8
-0.7
-0.6
-0.5
-0.4
-0.3
-0.2
-0.1
0
2005 2006 2007 2008 2009 2010 2011 2012 2013 2014 2015 2016
Co
rre
lati
on
Co
eff
icie
nt
(r)
49
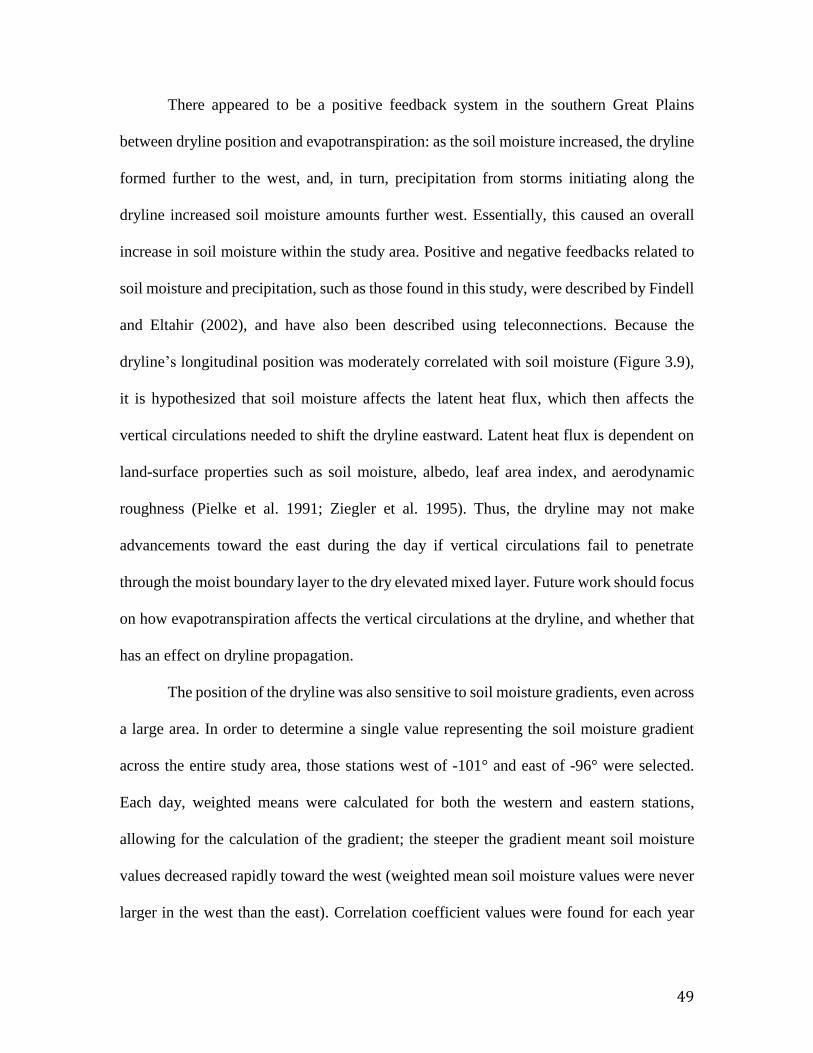
There appeared to be a positive feedback system in the southern Great Plains
between dryline position and evapotranspiration: as the soil moisture increased, the dryline
formed further to the west, and, in turn, precipitation from storms initiating along the
dryline increased soil moisture amounts further west. Essentially, this caused an overall
increase in soil moisture within the study area. Positive and negative feedbacks related to
soil moisture and precipitation, such as those found in this study, were described by Findell
and Eltahir (2002), and have also been described using teleconnections. Because the
dryline’s longitudinal position was moderately correlated with soil moisture (Figure 3.9),
it is hypothesized that soil moisture affects the latent heat flux, which then affects the
vertical circulations needed to shift the dryline eastward. Latent heat flux is dependent on
land-surface properties such as soil moisture, albedo, leaf area index, and aerodynamic
roughness (Pielke et al. 1991; Ziegler et al. 1995). Thus, the dryline may not make
advancements toward the east during the day if vertical circulations fail to penetrate
through the moist boundary layer to the dry elevated mixed layer. Future work should focus
on how evapotranspiration affects the vertical circulations at the dryline, and whether that
has an effect on dryline propagation.
The position of the dryline was also sensitive to soil moisture gradients, even across
a large area. In order to determine a single value representing the soil moisture gradient
across the entire study area, those stations west of -101° and east of -96° were selected.
Each day, weighted means were calculated for both the western and eastern stations,
allowing for the calculation of the gradient; the steeper the gradient meant soil moisture
values decreased rapidly toward the west (weighted mean soil moisture values were never
larger in the west than the east). Correlation coefficient values were found for each year
50
between the soil moisture gradient and the specific humidity gradient (Figure 3.10), with
the observed moderately positive correlations confirming the results of previous studies:
the east to west decrease in soil moisture initially helps create the dryline (Schaefer 1974a),
however, due to year-to-year variation in correlation coefficients (Figure 3.9), there are
clearly other processes at work. The moderately positive correlation coefficient values,
with a 10-year average r-value of 0.50, suggests that the strong moisture gradients across
the study area created more intense drylines.

51
Figure 3.10: Correlation coefficient (r) values between the east-west soil moisture
gradient and the specific humidity gradients associated with drylines.
0.48
0.59 0.61
0.43
0.25
0.45
0.530.50
0.80
0.39
0
0.1
0.2
0.3
0.4
0.5
0.6
0.7
0.8
0.9
2005 2006 2007 2008 2009 2010 2011 2012 2013 2014 2015 2016
Co
rre
lati
on
Co
eff
icie
nt
(r)
Year

52
To analyze the affect that soil moisture has in the vicinity of the dryline, weighted
means were calculated for stations within 1° longitude of the dryline, both to the east and
west, with the requirement that there must be at least three stations included on each side
of the dryline. Soil moisture gradient values across the dryline were calculated from the
weighted means and were compared to the specific humidity gradient of each dryline
(Figure 3.11). The results from the correlation analysis suggest that the strength of the
dryline (specific humidity gradient) is sensitive to soil moisture changes, such that negative
gradients (or no gradient) in soil moisture meant the specific humidity gradient of the
dryline was smaller (r=0.51). However, if the gradient of moisture was strong (larger
positive difference), then the specific humidity gradient was large. It is suggested that as
soil moisture values east of the dryline increased, low-level moisture within the boundary
layer also increased through evapotranspiration, strengthening the gradient of the dryline.
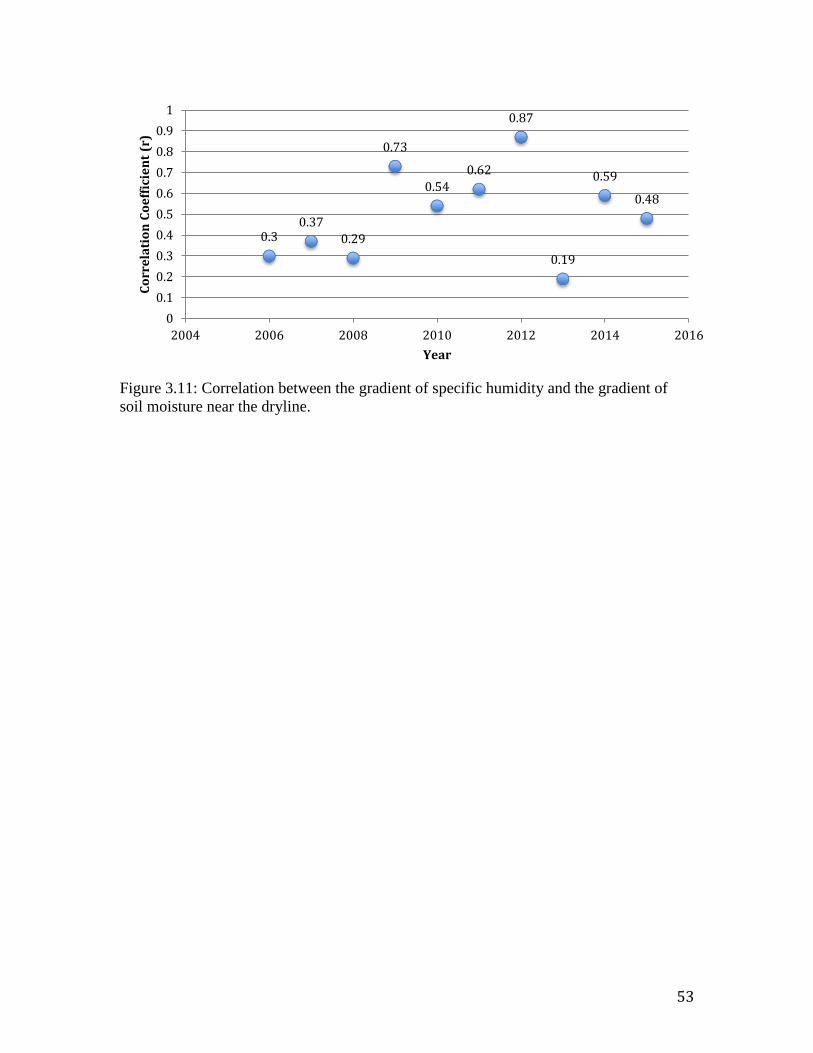
53
Figure 3.11: Correlation between the gradient of specific humidity and the gradient of
soil moisture near the dryline.
0.30.37
0.29
0.73
0.54
0.62
0.87
0.19
0.59
0.48
0
0.1
0.2
0.3
0.4
0.5
0.6
0.7
0.8
0.9
1
2004 2006 2008 2010 2012 2014 2016
Co
rre
lati
on
Co
eff
icie
nt
(r)
Year

54
Examining the year 2012 further, there were a total of 20 days on which soil
moisture gradients were calculated (out of 36 days with drylines), with only 4 days of
negative gradient values, meaning more soil moisture was present in the west than the east.
The average soil moisture gradient across the dryline was 0.01 𝑚3𝑤𝑎𝑡𝑒𝑟 (𝑚3
𝑠𝑜𝑖𝑙)−1 .
However, there were extreme cases, with the highest soil moisture gradient of 0.12
𝑚3𝑤𝑎𝑡𝑒𝑟 (𝑚3
𝑠𝑜𝑖𝑙)−1 associated with a 9.2 𝑔 𝑘𝑔−1(100 𝑘𝑚)−1 specific humidity gradient.
The weakest soil moisture gradient, -0.05 𝑚3𝑤𝑎𝑡𝑒𝑟 (𝑚3
𝑠𝑜𝑖𝑙)−1 , was associated with a
dryline with a 3.8 𝑔 𝑘𝑔−1(100 𝑘𝑚)−1 specific humidity gradient. The middle 50% of soil
moisture values fell between 0.004 and 0.020 𝑚3𝑤𝑎𝑡𝑒𝑟 (𝑚3
𝑠𝑜𝑖𝑙)−1 . It is believed that
extreme values of volumetric soil moisture played a significant role in the high correlation
coefficient value for that year.
V. Summary
The focus of this study was the effects of evapotranspiration on the longitudinal
positioning of the dryline in the southern Great Plains during the months of April, May,
and June from 2006–15. A component of this study was a climatology similar to that
produced by Hoch and Markowski (2005), albeit more concentrated both spatially and
temporally. This study yielded the following conclusions:
The average dryline was located at -100.9°, and occurred on 33.4% of spring
days during the study period;
Drylines located further east had stronger specific humidity gradients than
those located further west, with an average gradient value of
6.8 𝑔 𝑘𝑔−1(100 𝑘𝑚)−1 across the study area;
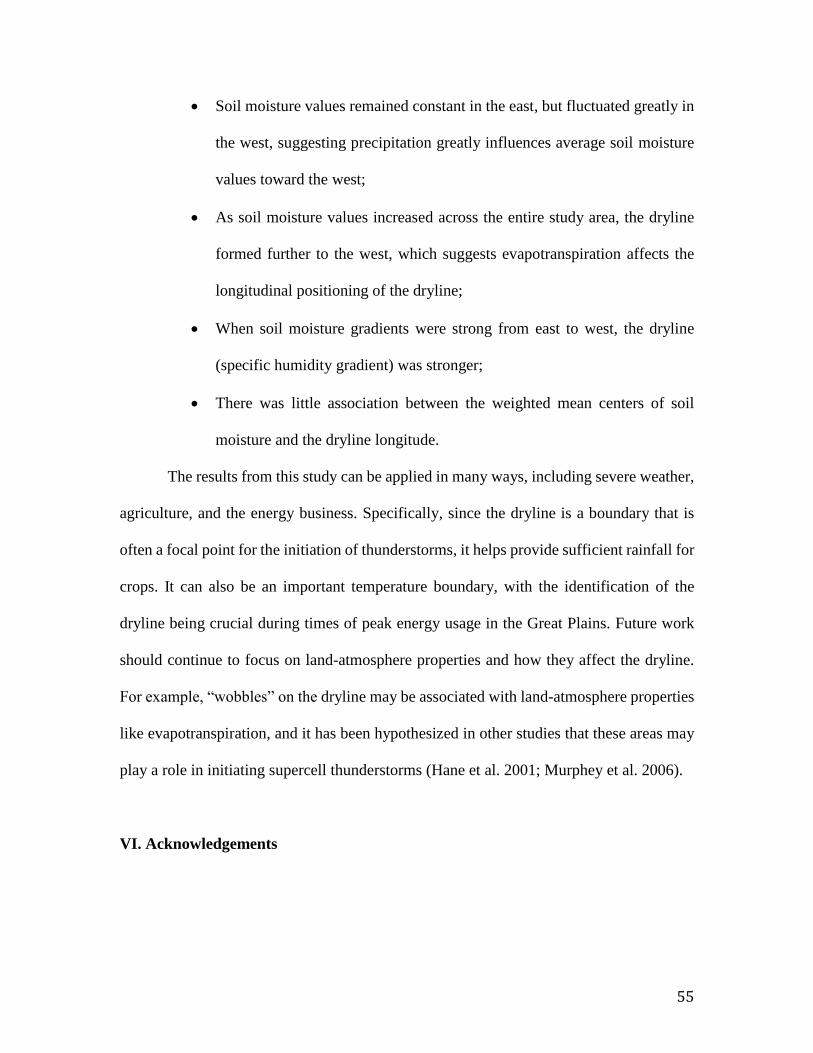
55
Soil moisture values remained constant in the east, but fluctuated greatly in
the west, suggesting precipitation greatly influences average soil moisture
values toward the west;
As soil moisture values increased across the entire study area, the dryline
formed further to the west, which suggests evapotranspiration affects the
longitudinal positioning of the dryline;
When soil moisture gradients were strong from east to west, the dryline
(specific humidity gradient) was stronger;
There was little association between the weighted mean centers of soil
moisture and the dryline longitude.
The results from this study can be applied in many ways, including severe weather,
agriculture, and the energy business. Specifically, since the dryline is a boundary that is
often a focal point for the initiation of thunderstorms, it helps provide sufficient rainfall for
crops. It can also be an important temperature boundary, with the identification of the
dryline being crucial during times of peak energy usage in the Great Plains. Future work
should continue to focus on land-atmosphere properties and how they affect the dryline.
For example, “wobbles” on the dryline may be associated with land-atmosphere properties
like evapotranspiration, and it has been hypothesized in other studies that these areas may
play a role in initiating supercell thunderstorms (Hane et al. 2001; Murphey et al. 2006).
VI. Acknowledgements
56
The authors would like to thank Dr. David Call, Dr. Petra Zimmermann, and Dr.
Adam Berland for their helpful comments to improve this manuscript, as well as the
Oklahoma Mesonet and the West Texas Mesonet for providing soil moisture data.

57
VII. References
Bolton, D., 1980: The computation of equivalent potential temperature. Mon. Wea. Rev.,
108, 1046–1053.
Brock, F. V., K. C. Crawford, R. L. Elliot, G. W. Cuperus, S. J. Stadler, H. L. Johnson,
and M. D. Eilts, 1995: The Oklahoma Mesonet: A technical overview. J. Atmos.
Oceanic Technol., 12, 5–19.
Chang, J.-T., and P. J. Wetzel, 1991: Effects of spatial variations of soil moisture and
vegetation on the evolution of a prestorm environment: A case study. Mon.
Wea. Rev., 119, 1368–1390.
Clark, C. A., and R. W. Arritt, 1995: Numerical simulations of the effect of soil
moisture and vegetation cover on the development of deep convection. J. Appl.
Meteor., 34, 2029–2045.
Clark, A. J., M. C. Coniglio, B. E. Coffer, G. Thompson, M. Xue, and F. Kong, 2015:
Sensitivity of 24-h forecast dryline position and structure to boundary layer
parameterization in convective-allowing WRF Model simulations. Wea.
Forecasting, 30, 613–638.
Coffer, B. E., L. C. Maudlin, P. G. Veals, and A. J. Clark, 2013: Dryline position errors
in experimental convection-allowing NSSL-WRF model forecasts and the
operational NAM. Wea. Forecasting, 28, 746–761.
Ershadi, A., M. F. McCabe, J. P. Evans, and J. P. Walker, 2011: Evaluation of energy
balance, combination, and complementary schemes for estimation of evaporation.
IAHS Lead Symposia 2011, Melbourne, Australia.
Findell, K. L. and E. A. B. Eltahir: Atmospheric controls on soil moisture-boundary layer
interactions. Part II: Feedbacks within the continental United States. J.
Hydrometeor., 4, 570–583.
Fujita, T. T., 1958: Structure and movement of a dry front. Bull. Amer. Meteor. Soc.,
39, 574–582
Glickman, T. S. and Z. Walter, 2000: Glossary of Meteorology. American
Meteorological Society, 850 pp.
Grasso, L. D., 2000: A numerical simulation of dryline sensitivity to soil moisture.
Mon. Wea. Rev., 128, 2816–2834.
Hoch, J., and P. Markowski, 2005: A climatology of springtime dryline position in the
U.S. Great Plains region. J. Climate, 18, 2132–2137.

58
Holt, T. R., D. Niyogi, F. Chen, K. Manning, M. A. LeMone, and A. Qureshi, 2006:
Effect of land-atmosphere interactions on the IHOP 24-25 May 2002 convection
case. Mon. Wea. Rev., 123, 113–133.
Koch, S. E. and J. McCarthy, 1982: The evolution of an Oklahoma dryline. Part II:
boundary-layer forcing of mesoconvective systems. J. Atm Sci., 39, 237–257.
Kornelsen, K. C., M. H. Cosh, and P. Coulibaly, 2015: Potential of bias correction for
downscaling passive microwave and soil moisture data. J. Geophys. Research
Atmos., 120, 6460–6479.
Macfadyen, A. and E. D. Ford, 1986: Advances in Ecological Research. Academic Press,
448 pp.
McGrew, J. C. Jr., A. J. Jr. Lembo, and C. B. Monroe, 2014: An Introduction to
Statistical Problem Solving in Geography. Waveland Press, Inc. 320 pp.
Monteith, J. L., 1981: Evaporation and surface temperature. Quart. J. Roy. Meteor. Soc.,
107, 1–27.
National Severe Storms Project Staff, 1963: Environmental and thunderstorm structures
as shown by National Severe Storms Project observations in spring 1960-61.
Mon. Wea. Rev., 91, 271–292.
Ogura, Y., and D. Portis 1982: Structure of the cold front observed in SESAME-AVE III
and its comparison with the Hoskins-Bretherton frontogenesis model. J. Atmos.
Sci., 39, 2773–2792
Oklahoma Climatological Survey, 2015: Precipitation history – annual, statewide. 15
March 2017. [Available at http://climate.ok.gov/]
Parsons, D. B., M. A. Shapiro, R. M. Hardesty, R. J. Zamora, and J. M. Intrieri, 1991:
The finescale structure of a West Texas dryline. Mon. Wea. Rev., 119, 1242
1258.
Penman, H. L. 1948. “Natural evaporation from open water, bare soil and grass.”
Preceedings of the Royal Society of London. Series A, Mathematical and
Physical Sciences, Vol. 193, No. 1032, pp. 120–145.
Pielke, R. A., G. A. Dalu, J. S. Snook, T. J. Lee, and T. G. F Kittle, 1991: Nonlinear
influence of mesoscale land use on weather and climate. J. Climate, 4, 1052
1069.
Pielke, R. A., 2001: Influence of the spatial distribution of vegetation and soils on the
prediction of cumulus convective rainfall. Rev. Geophys., 39, 151–177.

59
Pietrycha, A. E., and E. N. Rasmussen, 2001: Observations of the Great Plains dryline
utilizing mobile mesonet data. Preprints, Ninth Conf. on Mesoscale Processes,
Ft. Lauderdale, Fl, Amer. Meteor. Soc., P5.23.
Rhea, J. O., 1966: A Study of thunderstorm formation along dry lines. J. App. Met.,
5, 58–63
Schaefer, J. T., 1974a: The lifecycle of the dryline. J. Appl. Meteor., 13, 444–449.
Schaefer, J. T., 1974b: A simulative model of the dryline. J. Atmos. Sci., 31, 956–964
Schaefer, J. T., 1986: The dryline. Mesoscale Meteorology and Forecasting, P. S. Ray,
Ed., Amer. Meteor. Soc., 549–572.
Schneider, J. M., D. K. Fisher, R. L. Elliot, G. O. Brown, and C.P. Bahrmann, 2003:
Spatiotemporal variations in soil water: First results from the ARM SGP CART
network. J. Hydrometeor., 4, 106–120.
Schultz, D. M and C. A. Doswell III, 2000: Analyzing and forecasting Rocky Mountain
lee cyclogenesis often associated with strong winds. Wea. Forecasting. 15, 152
173.
Schultz, D. M, C. C. Weiss, and P. M. Hoffman, 2007: The synoptic regulation of dryline
intensity. Mon. Wea. Rev., 135, 1699–1709.
Segal, M. and R. W. Arritt, 1992: Nonclassical mesoscale circulations caused by surface
sensible heat-flux gradients. Bull. Amer. Meteor. Soc., 73, 1593–1604.
Segal, M., W. E. Schreiber, G. Kallos, J. R. Garratt, A. Rodi, J. Weaver, and R. A. Pielke,
1989: The impact of crop areas in Northeast Colorado on midsummer
mesoscale thermal circulations. Mon. Wea. Rev., 117, 809–825.
Shaw, B. L., 1995: The effect of soil moisture and vegetation heterogeneity on a Great
Plains dryline: A numerical study. M.S. thesis, Department of Atmospheric
Sciences, Colorado State University, 91 pp.
Schultz, D. M., C. C. Weiss, and P. M. Hoffman, 2007: The synoptic regulation of
dryline intensity. Mon. Wea. Rev., 135, 1699–1709.
Tegtmeier, S. A., 1974: The role of the surface, sub-synoptic low pressure system in
severe weather forecasting. M.S. thesis, Dept. of Meteorology, University of
Oklahoma, 66 pp.
Thiessen, A. H., 1911: Preciptation average for large areas. Mon. Wea. Rev, 39, 1082–
1084.

60
Thornthwaite, C. W., 1948: An approach toward a rational classification of climate.
Geogr. Rev., 38, 55–94.
Wallace, J. M. and P. V. Hobbs, 1977: Atmospheric Science: An Introductory Survey.
Academic Press, 350 pp.
Zhang, D.-L., and R. A. Anthes, 1982: A high-resolution model of the planetary
boundary layer—sensitivity tests and comparisons with SESAME-79 data. J.
Appl. Meteor., 21, 1594–1609
Zhao, F. and M. Shepherd, 2012: Preciptation changes near Three Gorges Dam, China.
Part I: A spatiotemporal validation analysis. J. Hydrometeor., 13, 735–745.
Ziegler, C. L., and C. E. Hane, 1993: An observational study of the dryline. Mon. Wea.
Rev., 121, 1134–1151.
Ziegler, C. L., W. J. Martin, R. A. Pielke, and R. L. Walko, 1995: A modeling study of
the dryline. J. Atmos. Sci., 52, 263–285.
Ziegler, C. L. and E. N. Rasmussen, 1998: The initiation of moist convection at the
dryline: Forecasting issues from a case study perspective. Wea. Forecasting, 13,
1106–1131.

61
4. Conclusions
The focus of this study was the effects of evapotranspiration on the longitudinal
positioning of the dryline. As part of this, a climatology similar to Hoch and Markowski
(2005) was constructed, albeit more concentrated both spatially and temporally. Unlike
similar model simulations that focused on the effects of land-atmosphere properties such
as the influence of evapotranspiration on the dryline, this study used observed data from
weather stations to identify the dryline and correlate it with observed soil moisture values
in Oklahoma and Texas. This is the key difference between earlier works by Ziegler et al.
(1995) and Shaw (1995), who found results similar to those from this study. The results of
this study further show that land-surface properties are important to boundary layer
processes such as deep moist convection, which is important to forecasters, climatologists,
researchers, risk planners, the energy business, and agriculture interests. This study yielded
the following conclusions:
The average dryline was located at -100.9°, and occurred on 33.4% of spring
days during the study period;
Drylines located further east had stronger specific humidity gradients than
those located further west, with an average gradient value of
6.8 𝑔 𝑘𝑔−1(100 𝑘𝑚)−1 across the study area;
Soil moisture values remained constant in the east, but fluctuated greatly in
the west, suggesting precipitation greatly influences average soil moisture
values toward the west;

62
As soil moisture values increased across the entire study area, the dryline
formed further to the west, which suggests evapotranspiration affects the
longitudinal positioning of the dryline;
When soil moisture gradients were strong from east to west, the dryline
(specific humidity gradient) was stronger;
There was little association between the weighted mean centers of soil
moisture and the dryline longitude.
Future work should continue to focus on land-atmosphere properties and how they
affect the dryline. While soil moisture is a good surrogate for evapotranspiration, there are
many more properties that go into evapotranspiration equations that should be studied. For
example, the mass of water that is transpired and evaporated from soil and plants, radiation,
and the conductivity of stomata on leaf surfaces all play roles in evapotranspiration. Many
of these variables are infeasible to observe, requiring the use of model simulations.
However, introducing observed pressure, radiation, and other meteorological properties
might allow one to formulate a regression model more closely aligned with
evapotranspiration and how it affects the positioning of the dryline. Other areas of research
that should be conducted are how the dryline “wobbles” when encountering different land-
uses. For example, if evapotranspiration is strong in an agricultural area adjacent to dry
land, which creates surface heat flux anomalies, how does the dryline change because of
the inhomogeneity of land surfaces? Perhaps those localized bulges on the dryline,
potentially caused by evapotranspiration, are areas of convection initiation similarly
proposed by Ziegler et al. (1995) and Auslander and Bannon (2004). For example,
“wobbles” on the dryline may be associated with land-atmosphere properties like
63
evapotranspiration, and it has been hypothesized that these “wobbles” can help initiate
supercell thunderstorms (Hane et al. 2001; Murphey et al. 2006).

64
6. References
Atkins, N. T., R. M. Wakimoto, and C. L. Ziegler, 1998: Observations of finescale
structure of dryline during VORTEX 95. Mon. Wea. Rev., 126, 525–550.
Auslander, G. M. and P. R. Bannon: Dryline bulge evolution in a two-dimensional
mixed-layer model. J. Atm Sci., J. Atmos. Sci., 61, 2528–2543.
Barnes, S. L., 1964: A technique for maximizing details in numerical weather map
analysis. J. Appl. Meteor., 3, 396–409
Basara, J.B., and T.M. Crawford, 2000. Improved installation procedures for deep layer
soil moisture measurements. J. Atmos. Oceanic Technol., 17, 879–884
Batra, N., S. Islam, V. Venturini, G. Bisht, and L. Jiang, 2006: Estimation and
comparison of evapotranspiration from MODIS and AVHRR sensors for clear
sky days over the Southern Great Plains. Rem. Sensing of Environment, 103,
1–15.
Beebe, R. G., 1958: An instability line development as observed by the tornado
research airplane. J. Meteor., 15, 278–282.
Bluestein, H. B. and S. S. Parker, 1992: Modes of isolated, severe convection storm
formation along the dryline. Mon. Wea. Rev., 121, 1354–1372.
Bolton, D., 1980: The computation of equivalent potential temperature. Mon. Wea. Rev.,
108, 1046–1053.
Brock, F. V., K. C. Crawford, R. L. Elliot, G. W. Cuperus, S. J. Stadler, H. L. Johnson,
and M. D. Eilts, 1995: The Oklahoma Mesonet: A technical overview. J. Atmos.
Oceanic Technol., 12, 5–19.
Brown, D. M, 2010: Field experiment observations of a dryline and the associate clouds
and precipitation, Dept. of Earth and Atmospheric Sciences University of Alberta,
125 pp.
Burba, C. G., and S. B. Verma, 2005: Seasonal and interannual variability in
evapotranspiration of native tallgrass prairie and cultivated wheat
ecosystem. Agricultural Forest Meteor., 135. 190–201.
Chang, J.-T., and P. J. Wetzel, 1991: Effects of spatial variations of soil moisture and
vegetation on the evolution of a prestorm environment: A case study. Mon.
Wea. Rev., 119, 1368–1390.

65
Cheresnick, D. R., and J. B. Basara, 2005: The impact of land– atmosphere
interactions on the Benson, Minnesota, tornado of 11 June 2001. Bull. Amer.
Meteor. Soc., 86, 637–642.
Clark, C. A., and R. W. Arritt, 1995: Numerical simulations of the effect of soil
moisture and vegetation cover on the development of deep convection. J. Appl.
Meteor., 34, 2029–2045.
Clark, A. J., M. C. Coniglio, B. E. Coffer, G. Thompson, M. Xue, and F. Kong, 2015:
Sensitivity of 24-h forecast dryline position and structure to boundary layer
parameterization in convective-allowing WRF Model simulations. Wea.
Forecasting, 30, 613–638.
Coffer, B. E., L. C. Maudlin, P. G. Veals, and A. J. Clark, 2013: Dryline position errors
in experimental convection-allowing NSSL-WRF model forecasts and the
operational NAM. Wea. Forecasting, 28, 746–761.
Collow, T. W., A. Robock, and W. Wu 2014: Influences of soil moisture and
vegetation on convective precipitation forecasts over the United States Great
Plains. J. Geophys. Research Atmos., 119, 9338–9358.
Ershadi, A., M. F. McCabe, J. P. Evans, and J. P. Walker: Evaluation of energy balance,
combination, and complementary schemes for estimation of evaporation. IAHS
Lead Symposia, Melbourne, Australia.
Findell, K. L. and E. A. B. Eltahir: Atmospheric controls on soil moisture-boundary layer
interactions. Part II: Feedbacks within the continental United States. J.
Hydrometeor., 4, 570–583.
Frye, J. D., and T. L. Mote, 2010: Convection initiation along soil moisture boundaries
in the southern Great Plains. Mon. Wea. Rev., 138, 1140–1151.
Fujita, T. T., 1958: Structure and movement of a dry front. Bull. Amer. Meteor. Soc.,
39, 574–582
Glickman, T. S. and Z. Walter, 2000: Glossary of Meteorology. American
Meteorological Society, 850 pp.
Godfrey, C. M., D. J. Stensrud, and L. M. Leslie, 2005: The influence of improved land
surface and soil data on mesoscale model predictions. 19th Conf. Hydrology,
San Diego, CA, Amer. Meteor. Soc., paper 4.7.
Coniglio, M. C., J. Correia Jr., P. T. Marsh, and F. Kong, 2013: Verification of
convection-allowing WRF model forecasts of the planetary boundary layer using
sounding observation. Wea. Forecasting, 28, 842–862.
66
Grasso, L. D., 2000: A numerical simulation of dryline sensitivity to soil moisture.
Mon. Wea. Rev., 128, 2816–2834.
Griesinger, M., 2006: Statistical analysis of variables associated with convective
initiation along the dryline. M.S. thesis, Texas Tech University, 118 pp.
Haugland, M. J. and K. C. Crawford, 2005: The diurnal cycle of land-atmosphere
interactions across Oklahoma’s winter wheat belt. Mon. Wea. Rev., 133, 120–130.
Hoch, J., and P. Markowski, 2005: A climatology of springtime dryline position in the
U.S. Great Plains region. J. Climate, 18, 2132–2137.
Holt, T. R., D. Niyogi, F. Chen, K. Manning, M. A. LeMone, and A. Qureshi, 2006:
Effect of land-atmosphere interactions on the IHOP 24-25 May 2002 convection
case. Mon. Wea. Rev., 123, 113–133.
Holton, J. R., 1967: The diurnal boundary layer wind oscillation above sloping terrain.
Tellus, 19, 199–205.
Hane, C. E, H. B. Bluestein III, M. E. Baldwin, and R. M. Rabin, 1997: Severe
thunderstorm development in relation to along-dryline variablility: A case study.
Mon. Wea. Rev., 125, 231–251.
Jarvis, P. G., and K. McNaughton, 1986: Stomatal control of transpiration: Scaling up
from leaf to region. Adv. Ecol. Res., 15, 1–49.
Johns, R. H., and C. A. Doswell III, 1992: Severe local storm forecasting. Wea.
Forecasting, 7, 588–612.
Khan, S. I, Y. Hong, B. Vieux, and W. Liu, 2010: Development evaluation of an actual
evapotranspiration estimation algorithm using satellite remote sensing
metorological observational network in Oklahoma. Int. J. Rem. Sen., 31, 3799–
3819.
Koch, S. E. and J. McCarthy, 1982: The evolution of an Oklahoma dryline. Part II:
boundary-layer forcing of mesoconvective systems. J. Atm Sci., 39, 237–257.
Kornelsen, K. C., M. H. Cosh, and P. Coulibaly, 2015: Potential of bias correction for
downscaling passive microwave and soil moisture data. J. Geophys. Research
Atmos., 120, 6460–6479.
Laurenroth, W. K., and I. C. Burke, 2008: Ecology of the Shortgrass Steppe: A Long
Term Perspective. Oxford University Press, 522 pp.
67
Lauwaet, D., K. De Ridder, and N. P. M. van Lipzig 2008: The influence of soil and
vegetation parameters on atmospheric variables relevant for convection in the
Sahel. J. Hydrometeor, 9, 461–476.
Li, B., and R. Avissar, 1994: The impact of spatial variability of land-surface
characteristics on land-surface heat fluxes. J. Climate, 7, 527–537.
Mahrt, L. and M. Ek, 1993: Spatial variability of turbulent fluxes and roughness lengths
in HAPEX-MOBILHY. Bound. –Layer Meteor., 65, 381–400
Macfadyen, A. and E. D. Ford, 1986: Advances in Ecological Research. Academic Press,
448 pp.
Markowski, P. M., and Y. P. Richardson, 2010: Mesoscale Meteorology in Midlatitudes.
Wiley-Blackwell, 407 pp.
Matteson, G. T., 1969: The West Texas dry front of June 1967. M.S. thesis, University
of Oklahoma, Norman.
McGrew, J. C. Jr., A. J. Jr. Lembo, and C. B. Monroe, 2014: An Introduction to
Statistical Problem Solving in Geography. Waveland Press, Inc. 320 pp.
Meinzer, F. C., 1993: Stomatal control of transpiration. Trends Ecol. Evol., 8, 289–294
Miller, J., A. Thomas, and P. Bannon, 2001: A shallow-water model of the diurnal
dryline. J. Atmos. Sci., 58, 3508–3524.
Monteith, J. L., 1981: Evaporation and surface temperature. Quart. J. Roy. Meteor. Soc.,
107, 1–27.
National Severe Storms Project Staff, 1963: Environmental and thunderstorm structures
as shown by National Severe Storms Project observations in spring 1960-61.
Mon. Wea. Rev., 91, 271–292.
Ogura, Y., and D. Portis 1982: Structure of the cold front observed in SESAME-AVE III
and its comparison with the Hoskins-Bretherton frontogenesis model. J. Atmos.
Sci., 39, 2773–2792.
Oklahoma Climatological Survey, 2015: Precipitation history – annual, statewide. 15
March 2017. [Available at http://climate.ok.gov/]
Ookouchi, Y., M. Segal, R. C. Kessler and R. A. Pielke, 1984: Evaluation of soil
moisture effects on the generation and modification of mesoscale circulations.
Mon. Wea. Rev., 112, 2281–2292.

68
Parsons, D. B., M. A. Shapiro, R. M. Hardesty, R. J. Zamora, and J. M. Intrieri, 1991:
The finescale structure of a West Texas dryline. Mon. Wea. Rev., 119, 1242–
1258.
Parsons, D. B., M. A. Shapiro, and E. Miller, 2000: The mesoscale structure of a
nocturnal dryline and a frontal dryline merger. Mon. Wea. Rev., 128, 3824–3838.
Penman, H. L. 1948. “Natural evaporation from open water, bare soil and grass.”
Preceedings of the Royal Society of London. Series A, Mathematical and
Physical Sciences, Vol. 193, No. 1032, pp. 120–145.
Pielke, R. A., G. A. Dalu, J. S. Snook, T. J. Lee, and T. G. F Kittle, 1991: Nonlinear
influence of mesoscale land use on weather and climate. J. Climate, 4, 1052–
1069.
——, and M. Segal, 1986: Mesoscale circulations forced by differential terrain
heating. Mesoscale Meteorology and Forecasting, P. S. Ray, Ed. Amer. Meteor.
Soc., 516–548.
——, 2001: Influence of the spatial distribution of vegetation and soils on the
prediction of cumulus convective rainfall. Rev. Geophys., 39, 151–177.
Pietrycha, A. E., and E. N. Rasmussen, 2001: Observations of the Great Plains dryline
utilizing mobile mesonet data. Preprints, Ninth Conf. on Mesoscale Processes,
Ft. Lauderdale, Fl, Amer. Meteor. Soc., P5.23.
——, G. Dalu, J. Snook, T. Lee, and T. Kittell, 1991: Nonlinear influence of mesoscale
land use on weather and climate. J. Climate, 4, 1053–1069.
Rabin, R. M., B. A. Burns, C. Collimore, G. R. Diak, and W. Raymond, 2000: Relating
remotely-sensed vegetation and soil moisture indices to surface energy fluxes in
vicinity of an atmospheric dryline. Remote Sensing Reviews, 18, 53–82.
Raymond, D. J., 1978: Instability of the low-level jet and severe storm formation. J.
Atmos. Sci., 35, 2274–2280.
Rhea, J. O., 1966: A Study of thunderstorm formation along dry lines. J. App. Met.,
5, 58–63.
Richter H., A. W. Western, and F. H. S. Chiew, 2004: The effect of soil and vegetation
parameters in the ECMWF land surface scheme. J. Hydrometeor, 5, 1131–
1146.
Ruiz-Barradas, A., and S. Nigam, 2006: Great Plains hydroclimate variability: The
view from North American regional reanalysis. J. Climate, 19, 3004–3010.
69
Schaefer, J. T., 1974a: The lifecycle of the dryline. J. Appl. Meteor., 13, 444–449.
——, 1974b: A simulative model of the dryline. J. Atmos. Sci., 31, 956–964.
——, 1986: The dryline. Mesoscale Meteorology and Forecasting, P. S. Ray, Ed., Amer.
Meteor. Soc., 549–572.
Schneider, J. M., D. K. Fisher, R. L. Elliot, G. O. Brown, and C.P. Bahrmann, 2003:
Spatiotemporal variations in soil water: First results from the ARM SGP CART
network. J. Hydrometeor., 4, 106–120.
Schultz, D. M and C. A. Doswell III, 2000: Analyzing and forecasting Rocky Mountain
lee cyclogenesis often associated with strong winds. Wea. Forecasting. 15, 152–
173.
——, C. C. Weiss, and P. M. Hoffman, 2007: The synoptic regulation of dryline
intensity. Mon. Wea. Rev., 135, 1699–1709.
Segal, M. and R. W. Arritt, 1992: Nonclassical mesoscale circulations caused by surface
sensible heat-flux gradients. Bull. Amer. Meteor. Soc., 73, 1593–1604.
——, W. E. Schreiber, G. Kallos, J. R. Garratt, A. Rodi, J. Weaver, and R. A. Pielke,
1989: The impact of crop areas in Northeast Colorado on midsummer
mesoscale thermal circulations. Mon. Wea. Rev., 117, 809–825.
——, J. H. Cramer, R. A. Pielke, J. R. Garratt, and P. Hildebrand, 1991: Observational
evaluations of the snow breeze. Mon. Wea. Rev., 119, 412–424.
Sellers, P. J., J. W. Shuttleworth, J. L. Dorman, A. Dalcher, and J. M. Roberts, 1989:
Calibrating the simple biosphere model (SiB) for Amazonian tropical rain forest
using field and remote sensing data. Part 1: Average calibration with Field Data.
J. Appl. Meteor., 28, 727–759.
Shaw, B. L., 1995: The effect of soil moisture and vegetation heterogeneity on a Great
Plains dryline: A numerical study. M.S. thesis, Department of Atmospheric
Sciences, Colorado State University, 91 pp.
Sun, W. and C. Wu, 1992: Formation and diurnal variation of the dryline. J. Atmos. Sci.,
49, 1606-1619.
Teddy R. Holt, Dev Niyogi, Fei Chen, Kevin Manning, Margaret A. LeMone, and
Aneela Qureshi, 2006: Effect of land–atmosphere interactions on the IHOP
24–25 May 2002 convection case. Mon. Wea. Rev., 134, 113–133.

70
Tegtmeier, S. A., 1974: The role of the surface, sub-synoptic low pressure system in
severe weather forecasting. M.S. thesis, Dept. of Meteorology, University of
Oklahoma, 66 pp.
Thiessen, A. H., 1911: Preciptation average for large areas. Mon. Wea. Rev, 39, 1082–
1084.
Thompson, R. L., C. M. Mead, and R. Edwards, 2007: Effective storm-relative helicity
and bulk shear in supercell thunderstorm environments. Wea. Forecasting, 22,
102–115.
Thornthwaite, C. W., 1948: An approach toward a rational classification of climate.
Geogr. Rev., 38, 55–94.
Uccellini, L. W., and Dr. R. Johnson, 1979: The coupling of upper and lower
tropospheric jet streaks and implications for the development of severe
convective storms. Mon. Wea. Rev., 107, 682–703.
Wakimoto, R. M., and H. V. Murphey, 2010: Frontal and radar refractivity analyses of
the dryline on 11 June 2002 during IHOP. Mon. Wea. Rev., 138, 228–240.
Wallace, J. M. and P. V. Hobbs, 1977: Atmospheric Science: An Introductory Survey.
Academic Press, 350 pp.
Weiss C. C., and H. B. Bluestein, 2002: Airborne pseudo-dual doppler analysis of a
dryline-outflow boundary intersection. Mon. Wea. Rev., 130, 1207–1226.
Wetzel, P. J. and J-T Chang, 1987: Concerning the relationship between
evapotranspiration and soil moisture. J. Appl. Meteor. Climatol., 26, 18–27.
Zhang, D.-L., and R. A. Anthes, 1982: A high-resolution model of the planetary
boundary layer—sensitivity tests and comparisons with SESAME-79 data. J.
Appl. Meteor., 21, 1594–1609.
Zhao, F. and M. Shepherd, 2012: Preciptation changes near Three Gorges Dam, China.
Part I: A spatiotemporal validation analysis. J. Hydrometeor., 13, 735–745.
Ziegler, C. L., and C. E. Hane, 1993: An observational study of the dryline. Mon. Wea.
Rev., 121, 1134–1151.
——, W. J. Martin, R. A. Pielke, and R. L. Walko, 1995: A modeling study of the
dryline. J. Atmos. Sci., 52, 263–285.
——, and E. N. Rasmussen, 1998: The initiation of moist convection at the dryline:
Forecasting issues from a case study perspective. Wea. Forecasting, 13, 1106–
1131.

71
Zishka, K. M., and P. J. Smith, 1980: The climatology of cyclones and anticyclones
over North America and surrounding ocean environs for January and July, 1950
1977. Mon. Wea. Rev., 130, 387–401.
72
5. Appendecies
The following are four case studies that illustrate the application of this study’s
criteria for identifying drylines. The first case demonstrates the identification of a typical
Oklahoma dryline, the second highlights an example with two potential drylines, the third
case features an environment lacking a dryline, and the fourth shows a moisture boundary
in the Texas Panhandle using derived data not from the Oklahoma Mesonet.
I. Case A – “Oklahoma Dryline”
On 30 May 2013, a dryline meeting all criteria described above was located across
Oklahoma (Figure 5.1). There was clearly a steep specific humidity gradient exceeding
3 𝑔 𝑘𝑔−1(100 𝑘𝑚)−1, and following Hoch and Markowski (2005), the dryline was defined
at the most eastward extent of the boundary, -98.4°, so the furthest east the dryline existed
in the study area was northern Oklahoma. Temperatures on the dry side of the boundary
ranged from 30° to 37° C, while temperatures on the moist side ranged from 22° to 24° C,
therefore, the dryline was not associated with a cold front [it is often the case that the
temperature is warmer in the dry sector during the day due to the sensible heat flux being
dominant compared to the greener irrigated moist sector to the east (Schaefer 1974)]. Wind
barbs showed confluence at the dryline, with winds in the dry sector from the southwest
and winds in the moist sector from the southeast. Dewpoint temperatures in the moist sector
all exceeded 10° C, and were nearly uniform ranging from 22° to 24° C. The dryline had a
slight bulging feature, but it was consistently within 30° of a north-south orientation. And
finally, there were no outflow boundaries present (not shown).
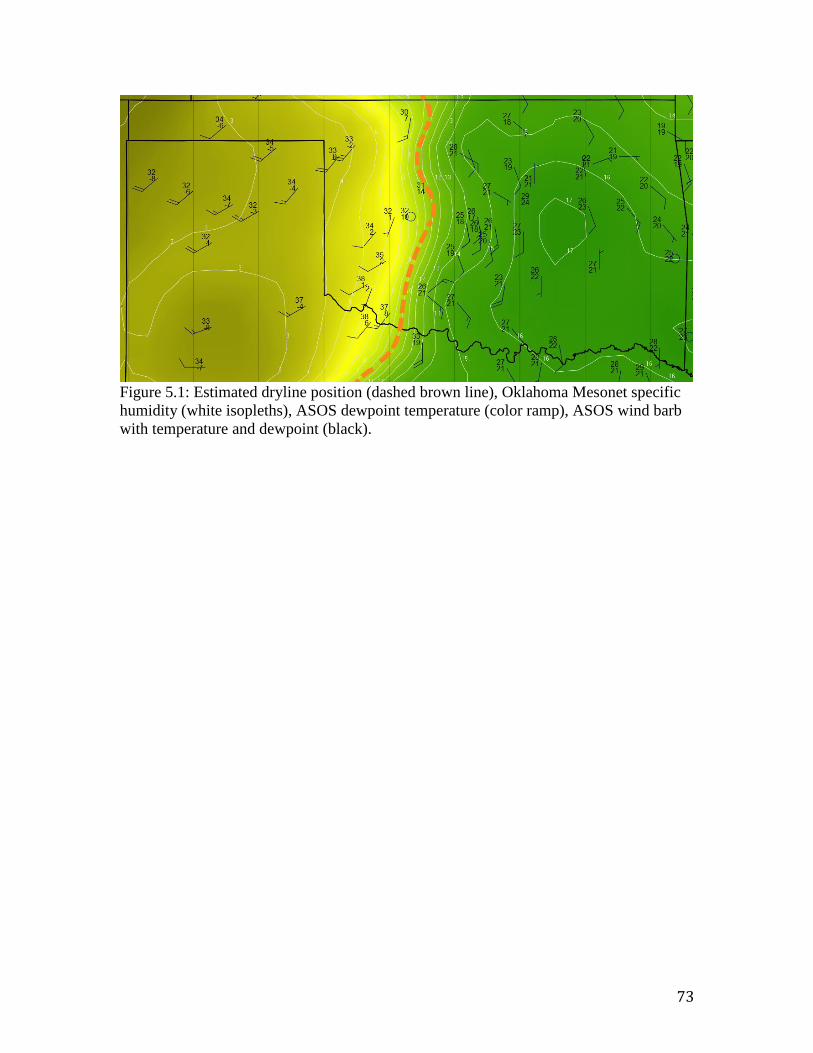
73
Figure 5.1: Estimated dryline position (dashed brown line), Oklahoma Mesonet specific
humidity (white isopleths), ASOS dewpoint temperature (color ramp), ASOS wind barb
with temperature and dewpoint (black).

74
II. Case B – “Two Drylines”
Careful examination of the environment on 2 April 2015 appeared to show two
separate boundaries (A and B in Figure 5.2) that could be identified as drylines based on
specific humidity gradients. Neither boundary was associated with a cold front, as
temperatures were consistent within the research area. An analysis of dewpoint
temperatures suggested the location of the dryline to be in western Oklahoma (boundary
A). This boundary satisfied the specific humidity requirement, and the moist sector had a
relatively uniform dewpoint temperature exceeding 10° C. There was a 10° C decrease in
temperature across boundary A, so one would experience a reduction in humidity crossing
the gradient in western Oklahoma.

75
Figure 5.2: Oklahoma Mesonet specific humidity (blue isopleths), ASOS dewpoint
temperature (color ramp), ASOS wind barb with temperature and dewpoint (black),
Oklahoma Mesonet wind barbs (30% opacity black), mesoscale boundary on KTXL radar
(black triangle), western and eastern mesoscale boundaries (dashed brown line)

76
Boundary B also had a specific humidity gradient that exceeded
3 𝑔 𝑘𝑔−1(100 𝑘𝑚)−1, and there was a dewpoint temperature difference of 5° C across the
gradient. There was clearly a wind shift crossing the gradient, which suggests it may be a
dryline, and upon closer examination (Figure 5.3), there was a better defined boundary
associated with the subtle surface convergence based on radar reflectivity.
Despite both boundaries having features of drylines, this case was excluded from
the dataset because neither met all of the dryline criteria. Specifically, boundary A had no
consistent wind shift, and there were areas along the boundary where the mean direction
of the wind was estimated at an angle of 45° across the specific humidity gradient in some
areas. Boundary B was an outflow boundary from earlier convection (not shown), which
can affect moisture, temperature, and wind fields, making the identification of an accurate
dryline position not achievable. Although both boundaries had attributes of drylines, they
were not true drylines, and could not be used in this analysis.
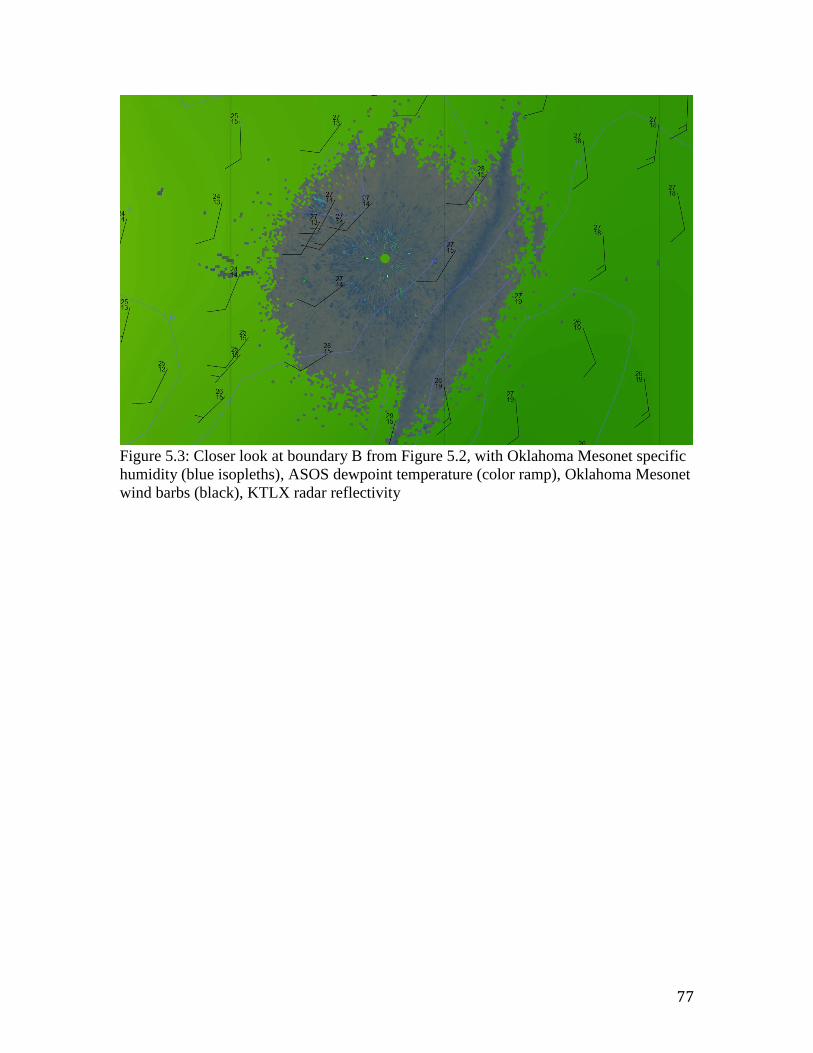
77
Figure 5.3: Closer look at boundary B from Figure 5.2, with Oklahoma Mesonet specific
humidity (blue isopleths), ASOS dewpoint temperature (color ramp), Oklahoma Mesonet
wind barbs (black), KTLX radar reflectivity

78
III. Case C – “No Dryline”
On the afternoon of 3 April 2015, there was some atmospheric moisture beyond the
study area (Figure 5.4), but the specific humidity gradient did not meet the study’s criterion.
Dewpoint temperatures exceeded a mean of 20°C in southern Texas, and there was a strong
specific humidity gradient, but this gradient was outside the study area, and it deviated far
more than 30° from a north-south orientation. According to the temperature (not shown)
and wind fields, there was a cold front located in southern Texas, with surface cold air
advection out of the north, which was confirmed by looking at the temperature gradient
compared to the previous day. This day was not included in the study because no dryline
was present.
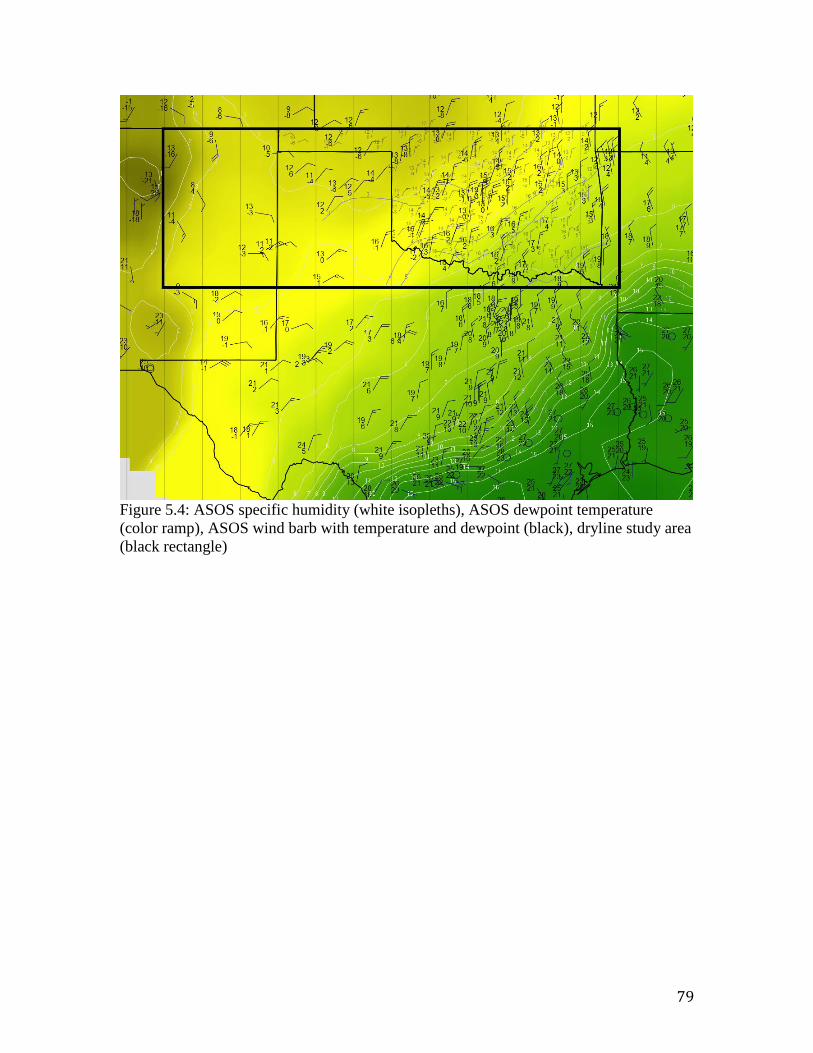
79
Figure 5.4: ASOS specific humidity (white isopleths), ASOS dewpoint temperature
(color ramp), ASOS wind barb with temperature and dewpoint (black), dryline study area
(black rectangle)

80
IV. Case D – “Texas Panhandle Moisture Boundary”
The final case featured a moisture boundary on 29 June 2014 that extended from
western Kansas through the Texas Panhandle and into West Texas (Figure 5.5). The
dewpoint temperatures ranged from 25°C in the moist sector to -5°C in the dry sector,
which suggested the presence of a dryline. Analysis of the wind barbs, however, did not.
Despite the specific humidity gradient exceeding 9 𝑔 𝑘𝑔−1(100 𝑘𝑚)−1 in some places,
which was far above the required gradient based on this study’s criteria, there was no
confluence along the boundary. The winds appeared to cross isopleths of specific humidity
despite the dewpoint temperature gradient. This case was especially challenging, because
dryline identification was reliant on sparse ASOS stations in West Texas and New Mexico.
Despite this, many stations indicated no apparent wind shift at the boundary, therefore no
dryline was identified.

81
Figure 5.5: ASOS specific humidity (white isopleths), ASOS dewpoint temperature
(color ramp), ASOS wind barb with temperature and dewpoint (black)