effects of cutting stages on re-growth dry matter
TRANSCRIPT

International Journal of Agriculture, Environment and Bioresearch
Vol. 3, No. 06; 2018
ISSN: 2456-8643
www.ijaeb.org Page 276
EFFECTS OF CUTTING STAGES ON RE-GROWTH DRY MATTER PRODUCTION
AND NUTRITIONAL VALUE OF FIVE WINTER CEREAL CULTIVARS IN MOLOTO
DISTRICT GAUTENG AND NOOIGEDACHT, MPUMALANGA PROVINCE
Patrick N Rakau1*, Chris. S Dannhauser1, and Jorrie J Jordaan1
1School of Agriculture and Environmental Sciences, University of Limpopo, Turfloop Campus, P/bag x 1106,
Sovenga, 0727, South Africa 2Agricultural Research Council, Animal Production Institute, Forage Breeding, Cedara, 3245, South Africa
ABSTRACT
A shortage in winter grazing is the major problem on most farms in South Africa. Animals loose
weight in winter, which leads to low reproduction, production of milk, mutton and meat. The
emphasis of this study was to look into the effect of cutting stages on re-growth dry matter
production and nutritional value of five different cultivars. The study was conducted 2007. Two
planting dates were used February in Mpumalanga and April in Gauteng respectively. Cultivars
(Witteberg oats, Overberg oats, LS 35 rye, LS 62 stooling rye and Cloc 1 Triticale) were planted
in three replications. Each main plot was divided in five split-plots with different cutting
treatments. Five cutting treatments were applied in five split plots: Sub-plot A was cut 8 weeks
after planting, and after that re-growth was cut every six weeks. (Ct 8), Sub-plot B was cut 10
weeks after planting, and after re-growth was cut every six weeks. (Ct 10), Sub-plot C was cut 12
weeks after planting, and after re-growth was cut every six weeks. (Ct 12), Sub-plot D was cut
14 weeks after planting, and after re-growth was cut every six weeks. (Ct 14), Sub-plot E was cut
when more than 50% of plants were in the reproductive stage (RS). The study found, planted in
April LS 62 stooling rye and Cloc 1 triticale can be described as a late winter/spring producing
cultivars. LS 62 and Cloc 1 triticale were on average the highest producers (Above 6.0 t/ha)
when defoliated initially 14 weeks after planting and two re-growth cuts was achieved in very
treatment.. On average, this defoliation treatment (Ct 14) resulted in the highest production for
all cultivars. The acid detergent fibre (ADF %) of all five cultivars was below 30%, in the young
stages. During the mature stage the ADF percentage of LS 62 stooling rye, Witteberg and
Overberg oats rose higher than 30%. The neutral detergent fibre (NDF %) of all five cultivars
was below 45% in the young stage. During the mature stage, the NDF percentage of LS 62
stooling rye, Witteberg and Overberg oats were higher than 50%. The crude protein content was
in most cases above 14 %, except Witteberg and Overberg oats, in a young stage and Overberg
oats and LS 62 stooling rye in a mature stage. These high nutritional values are indicators that
animals grazing this winter fodder will be able to gain weight and increase their production in
winter. Under the cool climate of Mpumalanga, LS 35 and LS 62 cultivars could be classified as
early to mid-winter producers, loc 1 triticale and Witteberg oats as mid-winter producers and
Overberg oats as late winter producer.

International Journal of Agriculture, Environment and Bioresearch
Vol. 3, No. 06; 2018
ISSN: 2456-8643
www.ijaeb.org Page 277
Keywords: cultivar (C), cutting stages, dry matter (DM), re-growth, reproductive stage (RS),
sub-plot
1. INTRODUCTION
The population growth between 1976 and 2011 in South Africa has increased. With a population
growth rate among the highest in the world, the population is expected to double within the next
two to three decades. The growing human population will place an increasing pressure on the
natural agricultural resources and we have to work for food security (Pretorius et al, 1976).
According to Dannhauser (1991) shortage of adequate, good quality herbage during the winter
months is one of the biggest problems confronting the stock farmer in the summer rainfall areas.
Animal scientists agree that poor winter feed is responsible for the generally low animal
production in South Africa (Dannhauser, 1991). In the lower rainfall areas where sweet veld is
available during winter, feeding of animals is less of a problem because quality is less of a
problem. Quantity presents the biggest problem (Dannhauser, 1991).
In crop production areas (high rainfall area) farmers rely on crop residues, especially maize, to a
large extend for winter survival, (Dannhauser, 1991) but this is not possible in Limpopo Province
with its low rainfall. In general, provision of fodder for the late winter and autumn remains a
problem. Besides crop residues and rested veld, livestock farmers in Limpopo Province could
also use conserved foggage, hay and silage (Van Zyl, 2006). Farmers with irrigation or limited
irrigation can make use of winter cereal crops like oats, rye and Triticale for winter feeding,
which was the topic of this study. Livestock production is the most important agricultural
activity in South Africa and accounts for more than 40% of the total value of the agricultural
output (World Bank 2002, as cited by Anon 2004). Beef cattle producers vary from highly
sophisticated commercial farmer (who rely on high technology) to communal subsistence
producers (who rely on indigenous knowledge and appropriate technology). Two major groups
of beef cattle farmers therefore co-exist in South Africa (Anon, 2004), namely:
a)The commercial beef producer, with production relatively high and who compare well with
developed countries. Commercial beef cattle production is generally based on synthetic breeds
and crossbreeding, using Indicus/ Sanga types and their crosses.
b)The emerging beef cattle farmer, who own or lease land, cattle generally consist of indigenous
crossbred types.
Both sectors are characterized by limited financial resources, land and technical skills. In the
higher rainfall areas of South Africa, many farmers normally face a forage shortage in autumn,
after the summer grasses have reached maturity. Winter cereal crops such as oats (Avenasativa),
triticale (Triticale hexaploide) and rye (Secalecereale), are cultivated under both irrigated and
dryland conditions to meet this need. Most of the rye grown in South Africa had the
disadvantage of seedling in autumn and is then less acceptable to grazing animals. Where

International Journal of Agriculture, Environment and Bioresearch
Vol. 3, No. 06; 2018
ISSN: 2456-8643
www.ijaeb.org Page 278
irrigation is available Italian rye grass (L. multiflorum)is also used especially for dairy cattle and
fat lambs (Bruckner & Raymer, 1990).
2.MATERIAL AND METHODS
2.1.Experimental Sites
The research was done at two different localities in two different provinces.
2.1.1. Dewageningsdrift (DWD) Gauteng
The research was doneDewageningsdrift, is the Hygrotech Seed Company’s Experimental Farm
and is situated along the R 573 route between Pretoria and KwaMhlanga, approximately 5 km
from Moloto village. While the Long Term Average (LTA) meteorological data of the Animal
Production Institute, Roodeplaat (ARC) stated, The Institute is approximately 10 km from DWD.
The soil varies from sandy to sandy-loam and at the South western corner of the farm loose
stones do occur. Frost occurs during May to August with the highest intensity in July.
Temperatures of below 10oC (LTA) occur from May to September with the lowest of 2.3oC in
July. The warmest months are October to March with a long term average ranging from 29.1-
30.2oC. The LTA rainfall is 562.3 mm per annum. It peaks from October to March, with the
highest (140.5 mm) in January. The experimentwas done in 2007 and two main treatments were
used: five annual winter fodder crops and five cutting treatments.
Randomly six large blocks distributed over the Experimental Farm. The same fodder species and
cutting treatments were used in the six large blocks;however, the statistical analysis were done.
The layout within large block (planting date) was a randomized block design with split-plots.
Fifteen plots were used (large block): 5 fodder crops x 3 replications (small blocks). The five
plots (fodder crops) in each replication (small block) were randomized and each plot was divided
into five sub-plots (not randomized) to apply the six cutting treatments.Three different winter
cereals (including five different cultivars) were used in the experiment: Two oats (Avenasativa)
cultivars: Witteberg oats (C1),Overberg oats (C2), Two stooling rye (Secalecereale) cultivars:LS
35 stooling rye (C3),LS 62 stooling rye (C4) and One triticale (Triticale hexploide) cultivar:Cloc
1 triticale (C5).Five cutting treatments were applied in the five split plots:Sub-plot A (Ct 8):
Was cut initially 8weeks after planting, and after that regrowth was cut every six weeks. Sub-plot
B (Ct 10): was cut initially 10 weeks after planting, and after that re-growth was cut every six
weeks. Sub-plot C (Ct 12): Was cut 12 initially weeks after planting, and after that re-growth was
cut every six weeks.Sub-plot D (Ct 14): Was cut initially 14 weeks after planting, and after that
re-growth was cut every six weeks. Sub-plot E (Ct RS): Was cut when more than 50% of plants
were in the reproductive stages.
The individual plots (fodder crops) were 1.5 m x 7.0 m (10.5m2) in size. The subplots were 1.5
m x 1.0 m, with 50 cm spaces between each sub-plot. The cutting treatment data was cut in a 100
cm x 100 cm square. The time of the first cut in each sub-plot (A to D). Re-growth on each sub-

International Journal of Agriculture, Environment and Bioresearch
Vol. 3, No. 06; 2018
ISSN: 2456-8643
www.ijaeb.org Page 279
plot was cut at intervals of six weeks starting from the first cut that was applied. The sub-plots
were hand cut to a height of 5cm.Data was analysed using the statistical program GenStat®
(Payne et al, 2009). Results were compared against each by using an ANOVA and the Fischer’s
protected LSD.
2.1.2. Nooitgedacht ADC Ermelo (Mpumalanga)
The same cultivars that were used at Dewageningsdrift were used on Nooitgedacht Agricultural
Development Center (ADC). Only one planting date was applied which was 02 February 2007.
A randomized block design was used, with five winter fodder crops in randomized plots and
three replications (blocks). The five cutting cycles were not used as cutting treatments and were
only used to illustrate a seasonal production trend. The material was cut initially when it reached
grazing stage (± 50 - 60 cm high) and after that re-growth was cut every month (4 weeks).The
size of each grass plot was 2 m x 8 m (16m2) and the data was collected in a plot of 7x1 m
(7m2).
The material was cut with sickle bar motorized machine with a cutting width of 1 m. The cutting
height was 8 cm. The length of the strip that was cut was 7 m per plot, which meant a plot size of
7m2. The area outside the experimental strip (of each bigger plot) was cut directly after each data
collection. During the season which started in May 2007 and ended in September 2007 five cuts
per plot were made.
Data was analysed using the statistical program GenStat® (Payne et al, 2009). The data was
acceptably normal with homogeneous treatment variances. Treatment means were separated
using Fisher’s protected t-test least significant difference (LSD) at the 5 % level of significance
(Payne et al, 2009)
2.1.2.Chemical analysis
The chemical analysis was done according to the Van Soest (1965) method by the accredited
Feed laboratory of the KwaZulu Natal Department of Agriculture and Environmental Affairs.
The parameters that were evaluated were the crude protein (CP), acid detergent fiber (ADF) and
neutral detergent fiber (NDF), that is according to Kalu and Fick (1983) and Fick and Mueller
(1989) some of the most important parameters to evaluates fodder.
3. RESULTS
3.1. Dewageningsdrift Results
Table 1 represents the total DM production (initial cut + regrowth) of plots that were planted on
the 5thApril 2007. The initial cutting dates for the different cutting treatments were: Ct 8 on the
31st May; Ct 10 on the 14th June; Ct 12 on the 28th June and Ct 14 on the 12th July 2007.
Table 1: The influence of cutting treatment on the total DM (t/ha) production of the
different winter pasture cultivars, planted on the 5thApril 2007 at Dewageningsdrift

International Journal of Agriculture, Environment and Bioresearch
Vol. 3, No. 06; 2018
ISSN: 2456-8643
www.ijaeb.org Page 280
* Ct 8 on the 31st May; Ct 10 on the 14th June; Ct 12 on the 28th June and Ct 14 on the 12th
July 2007
The interaction between cultivars and cutting treatments influenced DM yields significantly (P≤
0.001). Comparing the results, in Table 1, with LSD of 2.16 three production groups was
identified. LS 62 stooling rye (Ct 14) produced 6.38 t/ha and Cloc 1 triticale produced 6.6 t/ha
and 8.49 t/ha at the Ct 14 treatment and the reproduction stage respectively. These three values
form the highest production group. The DM production of an intermediate group varied between
3.54 and 5.68 t/ha and did not differ significantly from each other.
The production of the third group varied between 0.78 and 3.18 t/haand also did not differ
significantly from each other. If the productions of the three mentioned groups (Table 1) are
compared, a tendency exists that most cultivars produced the highest when cut for the first time
at 14 weeks (Ct 14). This corresponded with the average production for Ct 14, as main effect,
which was 5.44 t/ha and significantly higher (P≤0.008) than the production of the other cutting
treatments. Cultivars and cutting treatments (as main effects) both influenced DM production
significantly (P≤0.026 and P≤0.008, respectively).
The average production for Cloc 1 triticale and LS 62 stooling rye (cultivar as main effect) did
not differ significantly (P≤0.026) and were 4.99 and 4.10 t/ha, respectively, followed by
Witteberg oats with 3.65 t/ha. The average production of Cloc 1 triticale (4.99 t/ha) differed
significantly from that of Overberg oats (2.62 t/ha), but not significantly from that of LS 62 rye
(4.1 t/ha), Witteberg oats (3.65 t/ha) and LS 35 rye (3.38 t/ha).
3.1.1 The re-growth production for each cultivar and cutting treatment.
Cultivars Cutting treatments Averages
for
cultivars Ct 8 +
Regrowth
Ct 10 +
Regrowth
Ct 12 +
Regrowth
Ct 14 +
Regrowth
Reprod
stage
Witteberg 3.26 2.72 4.12 5.68 2.50 3.65bc
Overberg 2.27 2.51 2.59 3.89 1.86 2.62c
LS 35 3.54 3.66 4.25 4.65 0.78 3.38bc
LS 62 3.67 3.92 4.36 6.38 2.17 4.10ab
Cloc 1 3.18 2.89 3.78 6.60 8.49 4.99a
Average 3.18b 3.14b 3.82b 5.44a 3.16b
LSD
Interaction 2.16
Cultivars 1.28
Cutting treatments 1.18

International Journal of Agriculture, Environment and Bioresearch
Vol. 3, No. 06; 2018
ISSN: 2456-8643
www.ijaeb.org Page 281
R2 = 0.934
R2 = 0.879
R2 = 0.9215
R2 = 0.8452
0
0.5
1
1.5
2
2.5
3
3.5
01-Apr 21-May 10-Jul 29-Aug 18-Oct 07-Dec
Cutting dates
t/h
a
Ct 8
Ct 10
Ct 12
Ct 14
Poly. (Ct 8)
Poly. (Ct 10)
Poly. (Ct 12)
Poly. (Ct 14)
Figure 3.1.1.1: The influence of cutting treatment on the re-growth of Witteberg oats planted on
05 April 2007.
According to Figure 3.1.1.1,Witteberg oats cut at (Ct 8) reached an optimum re-growth of 1.1
t/ha in August and after that declined. When Witteberg oats was cut at (C10) it reached an
optimum re-growth of 1.3 t/ha during early July and declined after that. Cutting at Ct 12 resulted
in an out re-growth of 2.0 t/ha at the end of August and after that it did not decline as much as in
the case of the other cutting treatments. Witteberg oats, cut at Ct 14, reached an optimum re-
growth of 2.7 t/ha at the end of July and after that it declined.
According to results in Figure 3.1.1.2, Overberg oats, cut 8 weeks and 12 weeks after planting,
reached an optimum production of 1.2 t/ha and 1.3 t/ha, respectively, in mid-July and late
August, after that re-growth declined. Cutting Overberg oats 10 weeks after planting gave an
optimum re-growth of 2.1 t/ha early July, and after that it decline. The first cut after 14 weeks
resulted in an optimum re-growth of 2.2 t/ha in late August/September. After that it declined, but
not as low as in the other cutting treatments.
According to results in Figure 3.1.1.3, LS 35 rye that was cut initially after 8 weeks; 12 weeks
and 14 weeks, resulted in an optimum production of 1.7 t/ha in mid/July; 1.5 t/ha in August/early
September and 2.8 t/ha and in August/early September respectively. After that re-growth did not
decline drastically. Cutting LS 35 rye, 10 weeks after planting gave an optimum re-growth of 2.1
t/ha in late June, after that it decline to zero at the end of September.

International Journal of Agriculture, Environment and Bioresearch
Vol. 3, No. 06; 2018
ISSN: 2456-8643
www.ijaeb.org Page 282
R2 = 0.9318
R2 = 0.9917
R2 = 0.2094
R2 = 0.8578
0
0.51
1.5
2
2.53
3.5
01-Apr 21-May 10-Jul 29-Aug 18-Oct 07-Dec
Cutting dates
t/h
a
Ct 8Ct 10Ct 12Ct 14Poly. (Ct 8)Poly. (Ct 10)Poly. (Ct 12)Poly. (Ct 14)
Figure 3.1.1.2: The influence of cutting treatment on the re-growth of Overberg oats, planted on
05 April 2007
R2 = 0.9999
R2 = 0.9956
R2 = 0.2301
R2 = 0.9488
0
0.5
1
1.5
2
2.5
3
3.5
01-Apr 21-May 10-Jul 29-Aug 18-Oct 07-Dec
Cutting dates
t/h
a
Ct 8
Ct 10
Ct 12
Ct 14
Poly. (Ct 8)
Poly. (Ct 10)
Poly. (Ct 12)
Poly. (Ct 14)
Figure 3.1.1.3: The influence of cutting treatment on the re-growth of LS 35 rye, planted on 05
April 2007.
R2 = 0.9997
R2 = 0.9214
R2 = 0.6526
R2 = 0.9967
0
0.5
1
1.5
2
2.5
3
3.5
01-Apr 21-May 10-Jul 29-Aug 18-Oct 07-Dec
Cutting dates
t/h
a
Ct 8
Ct 10
Ct 12
Ct 14
Poly. (Ct 8)
Poly. (Ct 10)
Poly. (Ct 12)
Poly. (Ct 14)

International Journal of Agriculture, Environment and Bioresearch
Vol. 3, No. 06; 2018
ISSN: 2456-8643
www.ijaeb.org Page 283
Figure 3.1.1.4: The influence of cutting treatment on the re-growth of LS 62 stooling rye, planted
on 05 April 2007.
According to results in Figure 3.1.1.4, LS 62 stooling rye did not reach an optimum re-growth
(3.5 t/ha) before October. The production trend was the highest (3.0 t/ha in October) at the Ct 14
treatment. This increasing growth trend continued until spring. It is an indication of a late
mature, long growing season cultivars. The re-production growth was lower (maximum 1.5 t/ha
to 2.0 t/ha) at the other cutting treatments.
R2 = 0.9827
R2 = 0.9604
R2 = 0.8473
R2 = 0.9455
0
0.5
1
1.5
2
2.5
3
3.5
01-Apr 21-May 10-Jul 29-Aug 18-Oct 07-Dec
Cutting dates
t/h
a
Ct 8
Ct 10
Ct 12
Ct 14
Poly. (Ct 8)
Poly. (Ct 10)
Poly. (Ct 12)
Poly. (Ct 14)
Figure 3.1.1.5: The influence of cutting treatment on the re-growth of Cloc 1 triticale, planted on
05 April 2007.
According to results in Figure 3.1.1.5 Cloc, 1 triticale cut 8 weeks and 12 weeks after planting
reached an optimum re-growth of 1.4 t/ha (mid-July) and 1.5 t/ha (mid-August), respectively.
After that, re-growth declined. Cutting Cloc 1 triticale, 14 weeks after planting gave an optimum
re-growth of 2.5 t/ha in late August. It could be as high as 3.1 t/ha. After that re-growth declined.
The same cultivar cut for the first time 10 weeks after planting reached an optimum production
of 1.8 t/ha in early July, with a drastic decline in re-growth towards spring.
3.2. Nooitgedacht Results
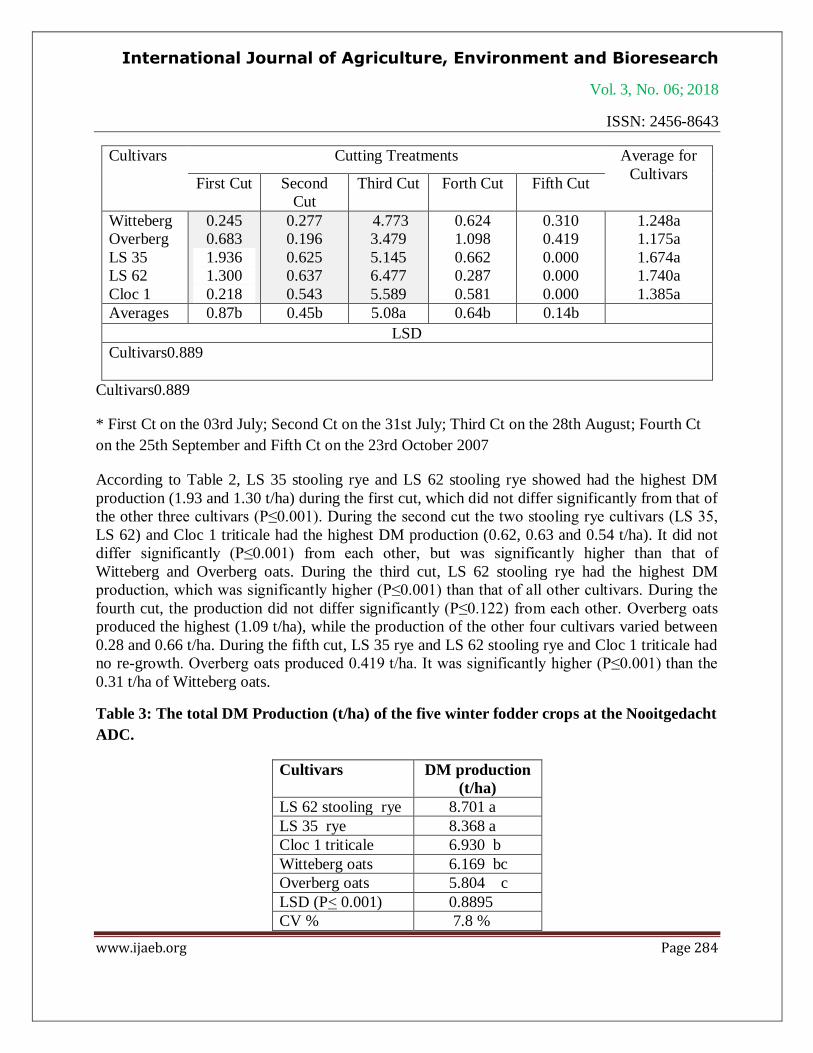
Table 2.The average monthly DM Production (t/ha) of the five winter fodder crops, planted 2nd
February 2007, at Nooitgedacht (Mpumulanga).
International Journal of Agriculture, Environment and Bioresearch
Vol. 3, No. 06; 2018
ISSN: 2456-8643
www.ijaeb.org Page 284
Cultivars Cutting Treatments Average for
Cultivars First Cut Second
Cut
Third Cut Forth Cut Fifth Cut
Witteberg
Overberg
LS 35
LS 62
Cloc 1
0.245
0.683
1.936
1.300
0.218
0.277
0.196
0.625
0.637
0.543
4.773
3.479
5.145
6.477
5.589
0.624
1.098
0.662
0.287
0.581
0.310
0.419
0.000
0.000
0.000
1.248a
1.175a
1.674a
1.740a
1.385a
Averages 0.87b 0.45b 5.08a 0.64b 0.14b
LSD
Cultivars0.889
Cultivars0.889
* First Ct on the 03rd July; Second Ct on the 31st July; Third Ct on the 28th August; Fourth Ct
on the 25th September and Fifth Ct on the 23rd October 2007
According to Table 2, LS 35 stooling rye and LS 62 stooling rye showed had the highest DM
production (1.93 and 1.30 t/ha) during the first cut, which did not differ significantly from that of
the other three cultivars (P≤0.001). During the second cut the two stooling rye cultivars (LS 35,
LS 62) and Cloc 1 triticale had the highest DM production (0.62, 0.63 and 0.54 t/ha). It did not
differ significantly (P≤0.001) from each other, but was significantly higher than that of
Witteberg and Overberg oats. During the third cut, LS 62 stooling rye had the highest DM
production, which was significantly higher (P≤0.001) than that of all other cultivars. During the
fourth cut, the production did not differ significantly (P≤0.122) from each other. Overberg oats
produced the highest (1.09 t/ha), while the production of the other four cultivars varied between
0.28 and 0.66 t/ha. During the fifth cut, LS 35 rye and LS 62 stooling rye and Cloc 1 triticale had
no re-growth. Overberg oats produced 0.419 t/ha. It was significantly higher (P≤0.001) than the
0.31 t/ha of Witteberg oats.
Table 3: The total DM Production (t/ha) of the five winter fodder crops at the Nooitgedacht
ADC.
Cultivars DM production
(t/ha)
LS 62 stooling rye 8.701 a
LS 35 rye 8.368 a
Cloc 1 triticale 6.930 b
Witteberg oats 6.169 bc
Overberg oats 5.804 c
LSD (P< 0.001) 0.8895
CV % 7.8 %

International Journal of Agriculture, Environment and Bioresearch
Vol. 3, No. 06; 2018
ISSN: 2456-8643
www.ijaeb.org Page 285
The total DM production of LS 62 stooling rye and LS 35 rye (8.70 and 8.368 t/ha, respectively)
did not differ significantly from each, but was significantly higher than the rest. Cloc 1 triticale
(6.93 t/ha) produced significantly higher than Overberg oats (5.804 t/ha), but not significantly
higher than Witteberg oats (6.169 t/ha). According to Table 3, LS 62 stooling rye produced the
highest, (8.70 t/ha). That was because of the relative high production of the first cut (3 July) and
the high production of re-growth in 31st July.
4.Nutritional Value of the five winter fodder crops
The nutritional value of the winter fodder crops planted in April 2007 on Dewageningsdriftis
shown in Table 4.
Table 4. The nutritional value (ADF %, NDF % and CP %) of the five winter fodder crops
at different regrowth stages, planted in April, at Dewageningsdrift.
Cultivars Cutting
Treatments ADF % NDF % Crude protein %
Witteberg
oats
8 weeks
10 weeks
12 weeks
14 weeks Matured
23.07
-
22.41
22.81 31.32
44.37
-
39.21
39.46 52.52
11.63
-
8.62
18.34 20.02
Average 24.90 43.89 14.65
Overberg
oats
8 weeks 10 weeks
12 weeks
14 weeks
Matured
20.65 19.85
24.49
21.44
37.28
34.74 32.28
39.83
38.45
51.51
12.39 12.02
19.70
14.82
9.19
Average 24.74 39.36 13.62
LS 35 rye
8 weeks
10 weeks
12 weeks 14 weeks
Matured
-
27.77
29.52 25.43
24.91
-
43.54
48.24 44.03
39.76
-
18.36
13.74 11.53
19.71
Average 26.91 43.96 15.84
LS 62
stooling rye
8 weeks 10 weeks
12 weeks
14 weeks Matured
25.34 26.64
27.79
22.95 36.66
36.76 38.53
44.93
37.86 56.83
17.71 22.03
22.64
15.91 12.37
Average 27.88 42.98 18.13
Cloc 1
triticale
8 weeks
10 weeks 12 weeks
14 weeks
Matured
26.00
- 25.38
25.75
-
39.70
- 43.53
43.63
-
14.14
- 15.18
20.87
-

International Journal of Agriculture, Environment and Bioresearch
Vol. 3, No. 06; 2018
ISSN: 2456-8643
www.ijaeb.org Page 286
Average 25.71 42.29 16.72
NB: The nutritional values of some treatments are not shown in the table due to the fact that they
were destroyed in a fire, during the drying process
The CP % of Witteberg oats tends to be higher in a more matured stage (18.34 % at Ct 14 and
20.02 % in a matured stage). Overberg oats showed the same trend although lower in the
reproductive stage. The CP % of LS 35 stooling rye was on average 15.84 %, with a high 19.71
% in the matured stage and only 11.5 % at Ct 14. The average CP % of LS 62 stooling rye was
18.13 % (range 15.91 % to 22.64 %) with an expected lower CP % in the matured stage (12.37
%).
Cloc 1 triticale was the most affected by the fire in the oven, but the CP % varied between 14.14
% and 20.87 %.
The ADF % of all five fodder cops were below 30 %, when cut 14 weeks after planting (Ct 14)
or earlier. The ADF % of LS35 rye, in the matured stage, was still 24.9 %, while that of the other
crops were above 31 %, which is still good quality. The ADF % of two oats cultivars was on
average the lowest (24.74 % and 24.9 %).
The NDF % of all five fodder cops were below 46 %, when cut 14 weeks after planting (Ct 14)
or earlier, except LS 35 stooling rye at Ct 12 (48.24 %). Values of lower than 46 % can be
described as very good. During the matured stage the NDF % of four of the fodder crops (except
LS 35 stooling rye) was between 50 % and 57 %, which is still classified as medium quality.
5.SUMMARY AND CONCLUSION
5.1Summary of the performance of the five winter growing fodder crops at
Dewageningsdrift.
According to Table 1 Cloc1triticale was the highest producer especially when cut later than 12
July (Ct 14) and in the reproduction stage. Its illustrate further that the six weekly re-growth rate
of the Ct 14 treatment was the highest and lasted until 18th October. This cultivar can thus be
described as a late winter/spring producer.
LS 62 stooling rye was the second highest producer (Table 1) clearly produced higher when it
was cut on 12th July (Ct 14). This cultivar is also a late winter/spring cultivar.
Although earlier initial defoliation (grazing) can be considered, but with at a lower reproduction
rate obtained.The Witteberg oats growth rate followed the same production trend as Cloc 1
triticale and LS 62 stooling rye (late winter/spring production), when defoliated on the 28th June
(Ct 12). The re-growth rate was lower but the production period continued longer. It can be

International Journal of Agriculture, Environment and Bioresearch
Vol. 3, No. 06; 2018
ISSN: 2456-8643
www.ijaeb.org Page 287
grazed later the than 18th October.LS 35 stooling rye produced on average (all cutting
treatment), 3.38 t/ha (Table 1). It is the only cultivar that produced above 3.0 t/ha of re-growth.
This cultivar can thus be described as an early winter/spring producer.
Overberg oats was the lowest producer (2.62 t/ha on average). A combination of Overberg oats
planted in April and defoliation at 10 weeks and 14 weeks can supply fodder (at a relative low
production rate) from May to October (full season).
A final option to produce maximum fodder for the longest period in winter will be to plant and
utilize the following cultivars:
1. Overberg oats and/or LS 35 rye to be utilized from 10 weeks after planting.
2. Witteberg oats and/or LS 35 rye to be utilized from 14 weeks after planting onwards for winter
fodder (July to September).
3. Cloc1 triticaleand/or LS 62 stooling rye to be utilized from 14 weeks onwards for late
winter/spring fodder (September to October).
LS 62 stooling rye and Cloc 1 triticale were on average the highest producers (above 6.0 t/ha)
when defoliated initially 14 weeks after planting. On average, this defoliation treatment (Ct 14)
resulted in the highest production for all cultivars.
Planted in April LS 62 stooling rye and Cloc 1 triticale can be described a late winter/spring
producing cultivars. Earlier utilization/defoliation (Ct 12) of LS 62 stooling rye can be
considered, although with a lower production.
When defoliated in June (Ct 12), Witteberg oats followed the same production trend than Cloc 1
triticale and LS 62 stooling rye and that is late winter/spring production. The re-growth rate was
lower but the production period longer until the 18th October.
LS 35 stooling rye produced the lowest re-growth (±3.0 t/ha), but it was available late
winter/spring.
Defoliating Overberg oats earlier (10 weeks after planting) made it a mid-winter growing
cultivar. When defoliation started later (after 14 weeks) it became a spring producer.
5.2 Summary of the performance of the five winter growing fodder crops at Nooitgedacht
ADC.

International Journal of Agriculture, Environment and Bioresearch
Vol. 3, No. 06; 2018
ISSN: 2456-8643
www.ijaeb.org Page 288
The two stooling rye cultivars (LS 35 and LS 62) were the highest producers, followed by Cloc 1
triticale andWitteberg and Overberg oats, while Witteberg oats and LS 62 stooling rye were best
producers on Dewageningsdrift. LS 35 stooling rye and Cloc 1 triticale produced relatively high
when planted earlier (April)
Under the cool climate of Nooitgedacht ADC, Mpumalanga, the two stooling rye cultivars could
be classified as early to mid-winter producers, Cloc1 triticale and Witteberg oats as mid-winter
producers and Overberg oats as a late winter producer.
5.3 Summary of the nutritional value of the five winter fodder crops.
The fact that the nutritional value of temperate species is better than that of sub-tropical species
is well documented in the literature and also visible in the results in this study. In general it can
be concluded that livestock will gain weight on all five winter fodder crops. There is a tendency
that the nutritional values were lower in the matured stage, but still good enough to maintain
animal weight.The two oats cultivars tend to be of lower quality in the younger stage, but still
good enough to maintain animal weight.
The acid detergent fiber (ADF %) of all five cultivars was below 30%, in a young stage. During
the matured stage the ADF % of LS 62 stooling, Witteberg and Overberg raised higher than 30
%. The neutral detergent fiber (NDF %) of all five cultivars was below 45 % in the young stage.
During the matured stage the NDF % of LS 62 stooling, Witteberg and Overberg oats became
higher than 50 %.
The crude protein content was in most cases above 14 %, except Witteberg and Overberg oats, in
a young stage, and Overberg oats and LS 62 stooling rye in a matured stage,These high
nutritional values are indicators that animals grazing this winter fodder will be able to gain
weight.
6. RECOMMENDATIONS
Planting dates and two different localities did influence the time of optimum production of five
winter fodder crops, as indicated in Table 5.
According to the information in Table 4, the following suggestions in terms of planting dates, for
optimum production during winter, can be made:
1)LS 35 stooling rye and Overberg oats planted early (February to April) can act as mid-winter
producers on both localities, Cloc 1 triticale reacted like that on Nooitgedacht alone.

International Journal of Agriculture, Environment and Bioresearch
Vol. 3, No. 06; 2018
ISSN: 2456-8643
www.ijaeb.org Page 289
2) The following planting dates can be recommended for different cultivars to become late-
winter producers:
LS 35 stooling rye and Overberg oats planted early
o April can act as Mid-winter producers.
o LS 62 stooling rye and witteberg oats planted early April can act as Spring producers
o LS 35 and 62 stooling ryes and Cloc 1 triticale planted early April can act as Late
winter/spring producers
Table 5: The impact of planting date on the optimum production period of the different
winter fodder cultivars.
Species Cultivar Locality Planting
date
Mid-
winter
growth
Late
winter/
Spring
growth
Spring
Growth
Stooling
rye
LS 35 Nooitgedacht, Cool* February X
Dewageningsdrift,
Warmer
April X X
LS 62 Nooitgedacht, Cool* February X
Dewageningsdrift,
Warmer
April X X
Oats Overberg Nooitgedacht, Cool* February X
Dewageningsdrift,
Warmer
April X
Witteberg Nooitgedacht, Cool* February X
Dewageningsdrift,
Warmer
April X

International Journal of Agriculture, Environment and Bioresearch
Vol. 3, No. 06; 2018
ISSN: 2456-8643
www.ijaeb.org Page 290
Triticale Cloc 1 Nooitgedacht, Cool* February X
Dewageningsdrift,
Warmer
April X
REFERENCES
Anon. 2004. Livestock Production in South Africa
Bruckner P L, Raymer PL. 1990. “Factors Influencing Species and Cultivar Choice of Small
Grains for Winter Forage.” J. Prod. Agric. 3: 349–355.
Dannhauser CS 1991. The management of cultivated pasture in the summer rainfall areas. First
adition, Warmbath.
Fick GW and Mueller SC. 1989. Alfalfa quality, maturity, and mean stage of Development.
Cornell University Information Bulletin 217.
Kalu BA and Fick GW.1983. Morphological stage of development as a predictor of alfalfa
herbage quality. Crop Science 23: 1167-1172.
Payne RW, Murray DA, Baird DB, Soutar DM. 2009. GenStat® for Windows™ 12th Edition
Introduction.VSN International, UK.
Pretorious P, King LC. 1976. Overview of the status of the Agricultural resources of South
Africa.Van Soest PJ. 1965. Symposium on factors influencing the voluntary intake of herbage
by ruminants. Voluntary intake in relation to chemical composition and digestibility. J. of Anim.
Sci. 24: 834-843.
Van Zyl EA. 2006. Dry matter yield nutritional value of companion crops, intercropped with
maize, for grazing purposes in north-western KwaZulu-Natal. South
Africa.Www.Worldbank.org/wbi/governace.2002.