effect of tidal resuspension on benthic–pelagic … of tidal resuspension on benthic–pelagic...
TRANSCRIPT

MARINE ECOLOGY PROGRESS SERIESMar Ecol Prog Ser
Vol. 413: 33–53, 2010doi: 10.3354/meps08709
Published August 26
INTRODUCTION
Sediment resuspension is ubiquitous in shallow-water environments where the water-column andbenthic environments are closely coupled. Wind andstorm events (Schoellhamer 1995), tides (Sanford et al.1991), waves (Guillén et al. 2002), or wave–currentinteractions (Grant & Madsen 1979) result in sedimentresuspension and high water-column turbidity, withtemporal changes in seston quantity and quality. Phys-ical forcing of sediment resuspension can be expressedin terms of the time history of applied bottom shear
stress, τb (units of dynes cm–2 or Pa). A related parame-ter is the shear (or ‘friction’) velocity, defined as
, (in cm s–1 or m s–1), where ρ is the waterdensity (in g cm–3 or kg m–3). Seston concentrationsdue to resuspension in low to moderately energetictidal estuaries range from 40 mg l–1 (northern Chesa-peake Bay [Sanford et al. 1991]) to 100s of milligramsper liter (e.g. 300 mg l–1 during storms, Tampa Bay[Schoellhamer 1995], 600 mg l–1, Hudson River [Heyeset al. 2004], and 1500 mg l–1, San Francisco Bay[Schoellhamer 2002]). The yearly average of the totalsuspended seston levels in the Mississippi River over a
u b∗ = τ ρ/
© Inter-Research 2010 · www.int-res.com*Email: [email protected]
Effect of tidal resuspension on benthic–pelagiccoupling in an experimental ecosystem study
Elka T. Porter,1,* Robert P. Mason2, Lawrence P. Sanford3
1Washington College, Department of Biology, 300 Washington Avenue, Chestertown, Maryland 21620, USA2University of Connecticut, Department of Marine Sciences, 1080 Shennecossett Road, Groton, Connecticut 06340, USA3University of Maryland Center for Environmental Science, Horn Point Laboratory, 2020 Horns Point Rd, PO Box 775,
Cambridge, Maryland 21613, USA
ABSTRACT: To test the effect of sediment resuspension on the nutrient and ecosystem dynamics weperformed a 4 wk experiment in three 1000 l shear-turbulence-resuspension-mesocosm (STURM)resuspension (R) tanks and three 1000 l non-resuspension (NR) tanks. All tanks contained defaunatedmuddy sediment and brackish estuarine water and had similar water-column turbulence intensities(~1 cm s–1), energy dissipation rates (~0.08 cm2 s–3), and tidal cycles (4 h mixing-on and 2 h mixing-off). However, while bottom shear velocity (stress) was low in the NR tanks, high instantaneousbottom shear produced resuspension in the R tanks during the mixing-on cycles. Tidal resuspensionin the R tanks resulted in concentrations of 120 to 220 mg l–1 total suspended solids when mixing wason, decreasing to between 10 and 20 mg l–1 when mixing was off. Particulate nitrogen, phosphorus,and carbon concentrations, as well as dissolved inorganic nitrogen, nitrate + nitrite, and phosphatelevels were higher in the R tanks. Phytoplankton biomass was also higher in the R tanks, though lightwas limiting. Tidal resuspension affected water-column algal and zooplankton community composi-tion and induced significantly higher concentrations of brown tide Aureococcus anophagefferens.Microphytobenthos biomass was significantly higher in the NR tanks. Dissolved inorganic nitrogensediment effluxes were similar in both tanks; however, polychaetes and amphipods developed in theNR, but not in the R tank sediments. Tidal resuspension shifted processes from the benthos to thewater column. Regular tidal resuspension profoundly affected ecosystem structure and function,often through indirect pathways and linkages.
KEY WORDS: Tidal resuspension · Benthic–pelagic coupling · Shear stress · Shear velocity · STURM·Ecosystem
Resale or republication not permitted without written consent of the publisher
OPENPEN ACCESSCCESS

Mar Ecol Prog Ser 413: 33–53, 2010
29 yr period ending in the mid-1990s was 360 mg l–1
(Trefry et al. 1994), and suspended seston concentra-tions in other rivers can be even higher (Meybeck et al.2003).
The critical erosion shear velocity, u*c (or stress τc)represents the level of applied forcing at which sedi-ment is first resuspended. It is a sediment bed propertythat can be affected by the time history of resuspensionand deposition (Sanford 2008) and/or by the composi-tion of the benthos (Davis 1993). Sediments that arefrequently disturbed by resuspension and subsequentdeposition remain unconsolidated and relatively easyto erode (Sanford 2008). Macrofauna change sedimenterodibility through adhesive-cohesive bonding amongparticles (Blanchard et al. 1997) and by influencing thesediment water content, which indirectly affects τc
(Aberle et al. 2004). Polychaetes and amphipods alterthe sediment water content and enhance or decreasesediment stability through the type and composition oftheir burrow structures (Meadows & Tait 1989). Mucussecreted by organisms influences sediment cohesive-ness (Blanchard et al. 1997) and thus sediment erodi-bility. High densities of organisms such as infaunalclams have been shown to increase sediment erodibil-ity in short-term flume experiments (Willows et al.1998).
Microphytobenthos can stabilize or destabilize sedi-ment. Polysaccharide matrices caused by diatommovements or webs of cyanobacteria stabilize sedi-ment and reduce resuspension (Yallop et al. 1994).However, microphytobenthos can also destabilize sed-iment as the mat ages due to bubble formation withinthe mat (Porter et al. 2004b). In ecosystems, the bio-mass of microphytobenthos is mediated by both thelight that reaches the bottom and bottom shear (MacIn-tyre et al. 1996, Porter et al. 2004a, b), as sedimentresuspension alters the benthic light environment.Microphytobenthos can also reduce nutrient regenera-tion from the sediments (Sundbäck et al. 2000) andprovide food for macrofaunal filter and deposit feeders(Muschenheim & Newell 1992, Herman et al. 2000).
It is difficult to discern cause–effect relationshipswithin natural shallow ecosystems from in situ mea-surements due to uncontrollable variability and feed-backs. As a result, many researchers turn to bench-scale process studies. Process studies investigatingsediment resuspension have been done in erosiondevices such as annular flumes (Maa et al. 1998),microcosms (Gust & Müller 1997, Thomsen & Gust2000), EROMES chambers (Andersen 2001), and parti-cle entrainment simulators (Tsai & Lick 1986). Theseinvestigations have generated a great deal of informa-tion on the effects of sediment type, organisms, andmicrophytobenthos on sediment erodibility. In addi-tion, process studies with resuspended sediments in
beakers (Fanning et al. 1982) and in benthic chamberswith oscillating grids (Garstecki et al. 2002) have beenused to examine ammonium release from particles orfrom porewater.
Such small-scale process studies have shown thatresuspension affects various water-column processes.Resuspension can stimulate nutrient regeneration andaffect water-column nutrients, potentially due to pore-water resuspension (Fanning et al. 1982) or release ofnutrients from particles. For example, Morin & Morse(1999) resuspended particles in beakers and found thatammonium was released from the particles. Similarly,resuspension in lakes increased phosphate fluxesaccording to Sondergaard et al. (1992). Using a combi-nation of in situ benthic chamber and field measure-ments, Tengberg et al. (2003) showed that resuspen-sion also affected organic carbon cycling and nutrientexchanges, as well as decreased water-column dis-solved oxygen concentrations in a Danish estuary. Inaddition, sediment resuspension can increase bacterialgrowth (Wainright 1990) and affect the coastal plank-tonic microbial food web (Garstecki et al. 2002).
Ecosystem models with realistic water-column mix-ing and bottom shear stress predict that porewater andsediment resuspension release nutrients and contami-nants into the water column (Wainright & Hopkinson1997, Chang & Sanford 2005). However, to be predic-tive, such models need data from whole-ecosystemexperiments that capture the direct and indirect inter-actions of the physical, biological, and chemical com-ponents in the ecosystem. The microphytobenthos, forexample, is an important aspect of shallow-water envi-ronments, and its growth is mediated by both light andbottom shear (Porter et al. 2004a, b). Blackford (2002)considered the microphytobenthos in his ecosystemmodel, but used only light to mediate the microphyto-benthos and not bottom shear. MacIntyre et al. (2004)put forward a hypothetical model, which includedmicrophytobenthos and resuspension in the context ofharmful algal blooms, but data to support the modelpredictions are sparse.
Natural ecosystems are fundamentally complex andencompass many direct and indirect interactions.Direct interactions have been defined as the directeffects of one process on another (Krivtsov 2004) or theeffect of one species on another that does not involve athird species (Montoya et al. 2006). Indirect interac-tions have been defined as interaction modificationsthat only become apparent when multiple species (ormultiple environmental influences) are combined(Wootton 2002). Indirect effects often are non-additive,such that the total does not equal the sum of the parts(Jørgensen et al. 1992). Thus, indirect interactions can-not be predicted by linear extrapolation from single ordual species experiments, but require the complexity
34

Porter et al.: Tidal resuspension effect on ecosystem
of a mesocosm or a field experiment (Wootton 2002,Porter et al. 2004a,b). For example, Porter et al. (2004b)found that oyster feeding increased both light atthe bottom and microphytobenthos biomass (directeffects). However, bottom shear eroded the microphy-tobenthos, thus reducing the microphytobenthos’ posi-tive effects on water quality (an indirect effect). Suchindirect effects cannot be easily tracked in nature andhave not been sufficiently explored. Whole-ecosystemapproaches are needed to track key ecosystem pro-cesses and their interactions, especially in shallowwater settings where benthic–pelagic coupling isimportant.
To study the effect of bottom shear on sedimentresuspension and benthic–pelagic coupling processesin a controllable whole-ecosystem context, we used1000 l experimental ecosystems, containing estuarinesediment and water. All tanks had the same levels ofwater-column turbulence but different levels of bottomshear velocity, resulting in either an approximation oftidal resuspension (R) or non-resuspension (NR). TheNR tanks had been used in previous ecosystem exper-iments without sediment resuspension at the Multi-scale Experimental Ecosystem Research Center(MEERC) at the Horn Point Laboratory in Cambridge,Maryland. The specific questions we sought to addresswith the R and NR tanks during a month-long experi-ment were: How does tidal resuspension affect waterquality, microphytobenthos, and meso-zooplanktondynamics, and are these effects produced throughdirect interactions or indirect interactions associatedwith complexity?
MATERIALS AND METHODS
Physical scaling in experimental ecosystems. Weused 2 sets of triplicate cylindrical tanks, the shear-tur-bulence-resuspension-mesocosm (STURM) resuspen-sion tanks (Schneider et al. 2007, who use the designa-tion STORM tanks), and standard non-resuspensionMEERC tanks (termed ‘C tanks’ in Crawford & Sanford2001). The R tanks had a single paddle (Fig. 1) toinduce high bottom shear stresses, which resuspendedsediments without overstirring the water column. Thepaddle configuration and mixing configuration in theNR tanks produced unrealistically low shear stress atthe bottom and no sediment resuspension (Porter et al.2004a). The paddle speeds and the forward-stop-back-ward motion of the R and NR mixing paddles were setto produce similar tank-averaged turbulence intensi-ties and energy dissipation rates between the NR andR tanks, however. All tanks had a 1 m deep water col-umn, a 1000 l volume and a 1 m2 sediment surfacearea, with a 10 cm layer of muddy sediment at the bot-
tom (Fig. 1). The R tanks are the successor design ofthe large linked mesocosms of Porter et al. (2004a,b)and were used at the Chesapeake Biological Labora-tory in Solomons, Maryland. The NR tanks were alsoused in ecosystem experiments at MEERC at the HornPoint Laboratory in Cambridge, Maryland. The R andthe NR tanks had the same tidal cycle approximationsof 4 h mixing-on and 2 h mixing-off over a 4 wk exper-iment. In these experiments, R and NR tanks primarilydiffered in terms of the amount of bottom shear thatwas applied, i.e. the factor that governs resuspensionof bottom sediments.
The different paddle and mixing configurations inthe NR and R tanks produced water-column turbu-lence. To determine water-column turbulence intensi-ties, we used a combination of gypsum dissolutiontechniques (as appropriate in certain flow conditions;Porter et al. 2000) and direct flow and turbulencemeasurements with an acoustic Doppler velocimeter(ADV) at different mixing speeds at a number of repre-sentative locations in the NR and R tanks followingtechniques described by Porter et al. (2004a). An ADVwas used for all turbulence measurements in the Rtanks. Turbulence intensity is defined by Tennekes &Lumley (1972) as:
(1)
where <u2>, <v2>, and <w2> are the variances of theirrespective velocity components. Energy dissipationrates were determined following Sanford (1997).Water-column turbulence characteristics were similarin all systems, with volume-weighted average turbu-lence intensities of about 1.08 cm s–1 (Fig. 1a,b) andvolume-weighted average energy dissipation rates ofabout 0.08 cm2 s–3 when mixing was on (Fig. 1c,d).Turbulence intensities of 1 cm s–1 are at the lower endof intensities in natural estuaries. These turbulencelevels were used because they still allowed energydissipation rates in the systems to be held down toreasonable levels. Turbulence intensities of about1 cm s–1 had also been used in previous experiments inNR tanks of the same shape, size, and mixing design atMEERC, e.g. as in experiments with different water-column mixing levels, but with low bottom shear stressand no resuspension (Petersen et al. 1998).
We quantified benthic shear stress in the R tanksdirectly using hot film anemometry (Gust 1988). Instan-taneous bottom shear stresses were as high as 0.35 to 0.4Pa in the R tanks, such that sediment resuspension wasinduced during the mixing-on phases (Fig. 1f). Bottomshear stress was low at ~0.001 Pa in the NR tanks (Craw-ford & Sanford 2001), with no resuspension induced(Fig. 1e). Both the NR and R tanks have been describedin more detail by Sanford et al. (2009).
q u v w= < > + < > + < >13
2 2 2( )
35

Mar Ecol Prog Ser 413: 33–53, 2010
Experimental setup. We collected muddy sedimentfrom Baltimore Harbor (39°11’29’’N, 76°31’10.5’’W)using a Van Veen grab with the sediment placed intobuckets. Sediment at the collection site had a grainsize of 0% gravel, 3.27% sand, 38.7% silt, and 58.03%clay, measured as percent dry weight (Baker et al.1997); the percent nitrogen and carbon content were0.33 and 4.57%, respectively (Baker et al. 1997). Thesediment was moved to an outdoor fiberglass tank andcovered with black plastic. Sediment was defaunated
and prepared using the techniques for large-scale sed-iment preparation developed by Porter et al. (2006)and briefly described below.
Before the start of the experiment, we kept the sedi-ment anaerobic for ≥4 d to remove macrofauna. Thenwe discarded the top 10 cm of the sediment layer andadded the underlying sediment evenly to the 6 meso-cosms to form a 10 cm bottom sediment layer. Themuddy sediment in the mesocosms was mixed thor-oughly, then carefully smoothed and leveled using a
36
Fig. 1. Turbulence intensity in the (a) non-resuspension (NR) tanks and (b) resuspension (R) tanks, with paddles in the tanks indi-cated in yellow. Energy dissipation rate in the (c) NR tanks and (d) R tanks. The circles indicate measurement locations (a to d).Concentrations of total suspended solids (TSS) generated by tidal cycles (4 h mixing-on, 2 h mixing-off) in the (e) NR tanks and
(f) R tanks, n = 3 tanks each
050
100
150
200
250
17
:00
:03
17
:58
:48
18
:57
:31
19
:56
:14
20
:54
:57
21
:53
:39
22
:52
:23
23
:51
:07
0:4
9:0
1 1
:47
:44
2:4
5:0
3 3
:41
:00
4:3
7:0
7 5
:34
:31
6:3
2:0
3 7
:29
:39
8:2
7:1
4 9
:25
:08
10
:23
:50
Ele
vatio
n (cm
)E
levatio
n (cm
)T
SS
(m
g l
–1)
Tank width (cm)Tank width (cm)
100
0.680
60
40
20
0
100
80
60
40
20
0
100
80
60
40
20
0
100
80
60
40
20
0
0.9
1.2
1.5
0.08
17
:00
:03
17
:59
:26
18
:58
:46
19
:58
:08
20
:57
:29
21
:56
:48
22
:56
:10
23
:55
:31
0:5
4:0
4 1
:53
:26
2:5
1:0
4 3
:47
:37
4:4
4:3
1 5
:42
:30
6:4
0:4
3 7
:38
:56
8:3
7:1
0 9
:35
:51
10
:35
:12
0.3
Time Time
0.2
0.3
050
100150
250
200
a b
c d
e f
NR energy dissipation rate (cm2 s–3) R energy dissipation rate (cm2 s–3)
0 20 40 60 80 100 0 20 40 60 80 100
0 20 40 60 80 100 0 20 40 60 80 100
R_1
R_2
R_3
NR_1
NR_2
NR_3
Resuspension levels
NR turbulence intensity (cm s–1) R turbulence intensity (cm s–1)

Porter et al.: Tidal resuspension effect on ecosystem
polyvinylchloride (PVC) bar that was spun around thecentral axis of each tank. The mesocosms were held inthe dark and filled slowly to about 20 cm water depthwith 0.5 µm (absolute) filtered water from the Patuxentestuary (Solomons, Maryland). A ~10 cm water layerwas replaced daily for a 2 wk period to flush outsolutes. Experiments by Porter et al. (2006) found thathomogenized sediments have high initial ammoniumeffluxes, and an equilibration period of about 2 wk isneeded for sediments to return to typical porewatergradients and effluxes. We also added defaunatedmixed sediment to three 13 cm diameter benthic cham-bers that were placed in the dark with a slow throughflow of 0.5 µm filtered Patuxent water. The benthicchamber sediments were used as proxies for the initialcondition of the mesocosm sediments to avoid havingto core the mesocosm sediments at the beginning ofthe experiment.
To prevent overheating of the tank water from highoutdoors summer temperatures (up to 38°C), the sidewalls of each tank were wrapped with a layer of alu-minum foil–covered bubble wrap insulation (ShelterInstitute). In addition, we added 3 layers of windowmesh over the superstructure, ca. 1.5 m above thetanks. We made sure that incident light was not limit-ing by regularly measuring light levels at the watersurface in the tanks using a LI-192 underwater quan-tum sensor (LI-COR Biosciences) light meter, set to the‘air’ reading and attached to a Model LI-250 lightmeter readout. Any light limitation within the tanks,thus, was due to resuspension, with associated effectson water turbidity and light penetration within thetanks. In previous experiments (Porter et al. 2004a), wehad found that light levels of about 160 µmol photonsm–2 s–1 are required at the water surface to preventlight limitation. We measured light levels of about265 µmol photons m–2 s–1 at the water surface of the NRand R tanks in this experiment.
At the start of the mesocosm experiment, 2 wk aftersediments had been added to the NR and R tanks,unfiltered water of ca. 12 g kg–1 salinity with a plank-ton community from the Patuxent River, a tributary ofChesapeake Bay, excluding only megazooplankton≥3 cm, was slowly added to the mesocosms via platesheld at the water surface, so as not to cause any sedi-ment resuspension; the tanks were thus filled to 1 mwater depth. Mixing was then turned on, and tidalcycles were mimicked for 4 h on and 2 h off cycles.Mixing in all tanks was cycled on/off at the same time.Over the first 1.5 d of the experiment, the mixing set-ting was adjusted twice in the R and NR tanks, wherethe settings between the tanks were carefully keptsimilar in turbulence intensity, after the initial settingin the R tanks did not cause the desired resuspensionlevel of about 100 mg l–1. This target resuspension
level, though high relative to levels in Baltimore Har-bor, is well within the range of tidal resuspensionobserved in other muddy estuaries. It was chosen tomaximize the likelihood of observable differencesbetween the R and NR tanks within a reasonablerange, not to mimic the precise environment fromwhich the sediments were obtained. Turbulence inten-sity and energy dissipation rates were kept the same inall tanks. Mixing in the R tanks was accidentally left offovernight between Days 20 and 21, but the experimentwas continued through Day 29, with little apparenteffect of the 2 missed R cycles. On Day 28 the paddle inTank 2 fell off, and seston data from the last day ofTank 2 were not included in the analyses.
Ten percent of the water in each tank wasexchanged daily at the end of the mid-day mixing-offphase and replaced with 0.5 µm absolute filteredPatuxent estuary water. We cleaned tank walls of wallperiphyton biweekly or more often as needed to mini-mize wall growth (Chen et al. 1997), but left the scrap-ings in the tanks. On Day 2 of the experiment, weadded a nutrient spike with ammonium (25 ml of asolution of 53.5 g l–1 NH4Cl) and soluble reactive phos-phorus (25 ml of a solution of 8.51 g l–1 KH2PO4), inRedfield proportions, to each 1000 l tank to stimulatephytoplankton growth as had been done in othermesocosm experiments (Petersen et al. 1998, Porter etal. 2004b). Nutrient samples were taken from eachtank very shortly after the spike had been added, andthe nutrient concentrations were immediately ana-lyzed to confirm the spike was successful. Water-column ammonium concentrations in the tanks were25 µmol l–1, and the soluble reactive phosphorus con-centrations were 1 µmol l–1 on the day after the spikewas added. Silica was abundant with 45 µmol l–1 atthe start of the experiment, and no silica additionswere made. The ecosystem experiment was performedat the Chesapeake Biological Laboratory, University ofMaryland Center for Environmental Science inSolomons, Maryland.
Sampling regime and variables sampled. Turbiditywas monitored continuously at 1 s intervals in eachtank with optical backscatter (OBS-3, D&A InstrumentCompany) turbidity sensors located at mid-depth. TheOBS sensor output was calibrated to total suspendedsolids (TSS) for samples taken at the same depth overthe course of the experiment. TSS samples were ana-lyzed by filtration as described below. The resultingcalibration was given by a TSS concentration of 50.512× OBS_Volts + 1.760 (r2 = 0.974). In post-processing,the OBS data were averaged over 66 s intervals. Inaddition, we measured dissolved oxygen concentra-tions daily at mid-depth in each tank using a YSI 6600sonde during afternoon mixing-on phases. Water tem-perature in each tank was measured at 10 min inter-
37

Mar Ecol Prog Ser 413: 33–53, 2010
vals during the experiment using Campbell T107 tem-perature probes connected to a Campbell CR10× datalogger (Campbell Scientific).
We used a LI-192 underwater quantum sensor (LI-COR Biosciences) light meter to measure total down-welling photosynthetically active radiation (PAR, in the400 to 700 nm waveband) at several depths. The datawere used to determine light attenuation coefficientsand to calculate irradiance levels at the sediment sur-face. In addition, mean geometric irradiance in thewater column was calculated as exp{0.5 × [ln(E0) +ln(ESed)]}, where E0 and ESed are irradiances at the sur-face of the water column and the sediment–waterinterface, respectively. The values obtained for meangeometric irradiance were similar to irradiance valuesmeasured at 50 cm depth. For the first 5 d, irradianceprofiles were determined at the surface and at 25 cmand 50 cm below the surface. During the remainder ofthe experiment, light was also measured 10, 50, and65 cm from the surface. The light meter covers the lightspectrum from 400 to 700 nm (Kirk 1994). Most mea-surements were done during the afternoon. In addi-tion, we measured light penetration using a PVC cappainted black and white, similar to a Secchi disk,mounted on a PVC rod and lowered into the water col-umn until it disappeared from view.
Every 2 d over the 4 wk experiment, during the morn-ing mixing-on phase, 1 discrete water sample per tankwas carefully siphoned from mid-depth of each tankinto sampling bottles to be filtered for various analyses.For TSS analyses, known volumes of water were fil-tered in triplicate through ashed, pre-weighed 47 mmdiameter glass-fiber filters (0.7 µm nominal pore size)and rinsed with isotonic ammonium formate to removesalts (Berg & Newell 1986). In addition, we obtainedparticulate inorganic matter (PIM) and particulate or-ganic matter (POM) concentrations from these samples.Known volumes of water were filtered through 25 mmWhatman GFF filters for analyses of particulate carbon(PC), particulate nitrogen (PN), and particulate phos-phorus (PP). Water was filtered through 47 mm Nucleo-pore filters (0.45 µm nominal pore size) to determineparticulate silica concentrations. We also filteredknown volumes of water through 47 mm Whatman GFFfilters for analyses of chlorophyll a (chl a) and phaeo-phytin. Some of this water was also filtered throughWhatman GFF filters, and the solute was frozen in indi-vidual vials for later analysis of dissolved nutrients suchas ammonium (NH4
+), nitrate + nitrite (NO3– + NO2
–),dissolved phosphate (PO4
3–), dissolved silica (Si), totaldissolved nitrogen (TDN) concentrations, and total dis-solved phosphorus (TDP) concentrations. The 10%daily exchange water was also sampled for dissolvednutrients, and the fill water was sampled once for par-ticulates to confirm low abundance.
At the start of the experiment and then once weekly,water was filtered through 25 mm Whatman GFF fil-ters (0.7 µm nominal pore size), which were folded andstored in aluminum foil in a –70°C freezer until phyto-plankton pigment analyses with high performanceliquid chromatography (HPLC) (Van Heukelem &Thomas 2001) could be performed.
Following Jeffrey & Vesk (1997), Marshall (1994) andMarshall et al. (2005), some pigments characteristic ofphytoplankton in the Chesapeake Bay area, our sourcewater, were defined: alloxanthin (Cryptophyceae),fucoxanthin (Chrysophyceae and Bacillariophyceae),lutein (Chlorophyceae and Prasinophyceae), peridinin(Dinophyceae), and zeaxanthin (cyanobacteria). Wealso found the pigment 19’-butanoyloxyfucoxanthin(but-fuco), which is a marker pigment for brown tideorganisms Aureococcus anophagefferens (Trice et al.2004) when 19’-hexanoyloxyfucoxanthin is absent(compare pigments of Prymnesiophyceae and Chryso-phyceae in Table 2.3, p. 74 to 75, in Jeffrey & Vesk1997) and when gyroxanthin diester is absent (Table50, p. 88 to 89, in Van Heukelem & Thomas 2005).Gyroxanthin diester was absent throughout the exper-iment, and 19’-hexanoyloxyfucoxanthin was absent,except on Day 5 of the experiment and in 1 R tank onDay 18 of the experiment. Thus, as in the study byTrice et al. (2004), but-fuco in the present study wasused to indicate the presence of the chrysophyte Aure-ococcus anophagefferens. Moreover, Marshall et al.(2005) reported A. anophagefferens in ChesapeakeBay water, which was our source water. We report thepigment to chl a ratio for the above pigments sincechl a abundance varied between the R and NR tanks.
At random, duplicate subsamples were filtered forquality control during each sampling. More frequentsamples of TSS were also collected during 3 mixing-offperiods to examine changes in the particulate proper-ties over time during settling.
Mesozooplankton samples were collected twice aweek during mixing-off phases by pumping 40 l tank–1
at a rate of 22.2 l min–1 with a diaphragm pumpthrough a 63 µm Nitex screen. The mesh content waswashed into bottles, mesozooplankton was preservedwith buffered formaldehyde, and the dominant taxaand age groups were later determined on a dissectingmicroscope using direct counts.
Sediment chl a, phaeophytin, PC, and PN concentra-tions in the surface sediment, as well as the sedimentwater content were measured in the tanks mid-wayinto the experiment (on Day 11) and at the end of theexperiment (Day 29). At the start of the ecosystemexperiment (Day 0), these variables were measured inthe benthic chambers set up in parallel to the meso-cosm experiment as described above, to represent thesediment conditions at the start of the experiment. To
38

Porter et al.: Tidal resuspension effect on ecosystem
sample the tanks for sediment chl a, phaeophytin, PC,PN, and sediment water content, we used 2.5 cm diam-eter cut-off syringes with a 1-way valve (BE130-23BB,Instrumentation Industries) as coring devices. In thetanks, the sediment corer was affixed to a pole forremote coring. Triplicate sediment samples were col-lected from 3 tank quadrants during the mixing-onphase. Mixing was only briefly turned off while sam-pling. For the initial benthic chamber sediment sam-ples, only the surface section of 0 to 0.5 cm was col-lected. In the mesocosm tanks, we sampled both the 0to 0.5 and 0.5 to 1 cm sediment sections, but combinedthem for data analysis. To compensate statistically forthe missing 0.5 to 1 cm section of the initial benthicchamber cores, 35% of the 0 to 0.5 cm section chl a wasadded based on the average ratio in all cores for whichdata in both sections were available. Sediment chl aand phaeophytin samples were frozen at –70°C pend-ing analysis with HPLC (Van Heukelem & Thomas2001).
To determine the abundance of any macroinfaunathat may have settled or grown up over the 4 wk periodof the experiment, we took 13.3 cm diameter sedimentcores from the tanks at the end of the experiment. Wewashed the contents through a 0.5 mm diameter mesh,counted the animals, and estimated the macrofaunalabundance per square meter. No macroinfauna werefound in the initial benthic chamber cores.
Zooplankton. Dominant taxa in the mesozooplank-ton and age groups were determined on a dissectingmicroscope using direct counts. The dominant taxawere copepod nauplii, Acartia spp. adults, polychaetelarvae, and copepodites. To estimate the dry weights ofthe individuals of the different taxa, the number ofindividuals was multiplied by the respective weightcharacteristic for individuals of these taxa provided inTable 2 by White & Roman (1992; W, µg ind.–1). Thus,the number of adult A. tonsa for each sampling daywas multiplied by 8, the number of polychaete larvaeby 1.3, the number of copepodites by 2.7, and the num-ber of nauplii by 0.31.
We converted zooplankton weight to carbon (µg l–1)for each taxon and combined the taxa for an estimateof combined mesozooplankton biomass to compare therelative biomass of phytoplankton and mesozooplank-ton abundance (in a common carbon unit) followingWhite & Roman (1992; Table 1: ‘Carbon [µg C ind.–1] =0.32 W’). Phytoplankton carbon estimation is describedbelow. Simple correlation analysis and linear regres-sion analysis were performed using SAS (SAS Insti-tute). In addition, we estimated the nitrogen content ofthe zooplankton community for an overall nitrogenbudget as described with the nitrogen budget below.
Sediment flux experiments and porewater releaseestimates. At the end of the mesocosm experiment, we
removed 3 sediment cores per tank using 13.3 cmdiameter clear acrylic core tubes. Unfortunately, thecores from 1 R tank were not usable. The cores fromthe remaining 5 tanks were capped off and arrangedaround turntables with magnets around their outeredges to drive stir bars attached to the core caps. Stan-dard sediment flux techniques were used. Briefly, weadded filtered Patuxent River water to the benthicchambers before sealing them air-tight, added stirring(without resuspension), and incubated the cores first inthe dark and then in the light to obtain sediment oxy-gen, ammonium, nitrate + nitrite, and dissolved inor-ganic nitrogen (DIN = NH4
+ + NO3– + NO2
–) fluxes inthe dark and in the light. Control (blank) cores withoutsediment were run at the same time. In addition, wedetermined the daily flux rates (flux rate in the light +flux rate in the dark). Nutrient samples were filteredthrough a 0.45 µm filter, frozen at –20°C (Parsons et al.1984) and analyzed following techniques detailed byKeefe et al. (2004). Sediments at the start of an experi-ment were taken, as described above, from the flow-through water bath and incubated only in the dark todetermine fluxes. To estimate the contribution of pore-water resuspension to the N budget, we estimatedporewater release from the 2 mm layer of sedimentthat was resuspended regularly during the mixing-oncycle.
Microcosm erosion experiments. At the end of themesocosm experiment, we collected duplicate sedi-ment cores from 2 R and 2 NR tanks for erosion tests,each in a 10 cm diameter ‘microcosm’ (Gust & Müller1997, Thomsen & Gust 2000, Dickhudt et al. 2009). Thebottom shear stress in these devices is approximatelyhomogeneous across the sediment surface, at settingsfrom 0 to 0.35 Pa. For each of the 4 erosion cores, weincreased bottom shear stress in steps of 0.01, 0.05, 0.1,0.15, 0.2, 0.25, 0.3, and 0.35 Pa. Each erosion step wasrun for a 10 min period. Samples for each step wereanalyzed for TSS, sediment chl a, and phaeophytinconcentrations. For Core 2 of the NR systems, waterwas lost from 2 sample bottles and thus the sample waslost. For Core 2 of the R systems, chl a data were lost forshear stress steps 0.3 and 0.35 Pa. Sediment depth (z,in mm) was estimated from mass eroded per unit area(m, in kg m–2) assuming 95% sediment porosity (φ) anda sediment density (ρs) of 2500 kg m–3 as follows:
(2)
Analytical methods. After drying seston filters for 24 hto constant weight at 60°C, they were re-weighed on aMettler AE 240 microbalance to determine TSS mass.Filters were then ashed at 450°C for 4 h and re-weighedto determine PIM; POM was determined by the differ-ence between TSS and PIM (Berg & Newell 1986).
zm m
s
=−( )
=1 0 125φ ρ .
39

Mar Ecol Prog Ser 413: 33–53, 2010
Chl a concentrations were measured to provideestimates of phytoplankton biomass using fluorometrictechniques without acidification (Welschmeyer 1994)after extraction with 90% acetone. Phaeophytin wasmeasured using HPLC (Van Heukelem & Thomas 2001).
PC and PN samples were analyzed on an Exeter Ana-lytical (CHN) analyzer using Environmental ProtectionAgency Method 440.0 (Zimmermann et al. 1997). POCwas determined using POC = POM × 0.5 (Geider 1987and references therein). The POC to chl a ratio wasdetermined following Steele & Baird (1965) and Changet al. (2003), by regression analysis in SAS. In addition,water samples were analyzed for PP following tech-niques described in Keefe et al. (2004). Ammonium,nitrite + nitrate, and phosphate were analyzed followingthe Technicon Industrial Methods Nos. 804-86T, 158-71W/, and 155-71W/Tentative, respectively, and TDNand TDP were analyzed using methods described byKeefe et al. (2004). Dissolved organic nitrogen (DON)was calculated by the difference between TDN and DIN.DOP was calculated by the difference between TDP andPO4
3–. Dissolved silica was analyzed using a TechniconTrAAcs-800 nutrient analyzer with oxalic acid added tominimize interference from phosphates, and particulatesilica was analyzed as described by Keefe et al. (2004).For all variables, for quality control, each sixth samplewas analyzed in duplicate. Nutrients and water-columnchl a were analyzed by the Analytical Services Labora-tory of the Chesapeake Biological Laboratory, Universityof Maryland Center for Environmental Science (stan-dard operating procedures available at: http://archive.chesapeakebay.net/pubs/quality_assurance/CBL_NASL_SOP_Feb_2004.pdf).
Sediment chl a and phaeophytin samples were ana-lyzed with HPLC (Van Heukelem & Thomas 2001).HPLC was used to prevent degradation products such aschlorophyllides and phaeophorbides from interferingwith fluorescence measurements (MacIntyre et al. 1996)and affecting chl a readings. We followed extraction pro-cedures outlined in the dissertation by Porter (1999),done in collaboration with Laurie Van Heukelem, thatextract about 97% of the sediment chl a from samplesthat contain a range of sediment chl a concentrations;however, pigment extraction procedures have beendescribed in much greater detail in Wright et al. (1997).Extracts from replicate tank samples were pooled andanalyzed for chl a and phaeophytin.
We also estimated nitrogen budgets in the R and NRtanks. Water-column chl a was converted to nitrogenequivalents (phytoplankton biomass nitrogen, µmol Ntank–1) using the ratio of POC to chl a of 51.68 (regres-sion analysis; Steele & Baird 1965, Chang et al. 2003)determined from the NR tank data and assuming thatthe POC represents phytoplankton carbon. We alsoused the measured carbon to nitrogen ratio of 5.138 for
the NR tank phytoplankton during the experiment.Nitrate + nitrate concentrations were closely coupledwith changes in chl a biomass. The POC to chl a ratioof 51.68 in the NR tanks was comparable to the C tochl a ratio of 50 that has widely been used in modelingstudies in a variety of environments (e.g. Harding et al.2002). The POC to chl a relationship for the phyto-plankton in the R tanks was not meaningful given thelarge amount of non-living matter (resuspended sedi-ment C) in the POM. Thus, the POC to chl a ratio of theNR tanks was also applied to the R tanks. Sedimentchl a, indicative of microphytobenthos abundance, wasconverted to nitrogen equivalents (µmol N tank–1) fol-lowing the same procedures as for water-column chl a,after converting mg chl a m–2 to µg of chl a m–2. Toestimate the N content of the zooplankton community,we determined the dry weights of the individuals ofthe different taxa as described above, then the num-bers were scaled up to total dry weight in the tanksusing measured abundances. The dominant taxa werecopepod nauplii, Acartia spp. adults, polychaete lar-vae, and copepodites. The nitrogen content of themesozooplankton stock in the tanks was determined as7.5% of the mesozooplankton dry weight (5 to 10% ofmesozooplankton dry weight is nitrogen; Parsons et al.1984). Water-column concentrations of TDN werescaled up to the whole tank. For accuracy, we also esti-mated the contribution of porewater nutrient flux tothe water-column N budget. Macroinfauna was foundonly in the NR tanks, and their lengths were not mea-sured, but macroinfauna nitrogen is assumed to be asmall fraction of the total nitrogen.
Statistical analyses. Chl a, TSS, phaeophytin, PN, PP,and PC, and the dissolved inorganic and organic nutri-ents were each averaged from Day 6 to the end of theexperiment for each tank (ca. 8 measurements over a3.5 wk period). Data from the first 5 d of the experimentwere not included in the averages, to avoid the immedi-ate effects of the initial nutrient spike, such that the av-eraged data for the most part represent the response tothe spike rather than the spike itself. Mesozooplanktonabundance was averaged for each tank over the entireexperiment. Only data from the mixing-on phases wereincluded in statistical comparisons. Statistical t-testswere used for water-column chl a, phaeophytin, zoo-plankton abundance, PN, PC, the dissolved nutrientdata, the dissolved oxygen data, and the phytoplanktonaccessory pigment data. Split-plot analyses were usedfor the results of the sediment flux experiments. Split-plot analyses in time were used for sediment chl a overthe duration of the experiment. To determine the rela-tionship between the mesozooplankton community andphytoplankton, correlation analysis and linear regres-sion analyses of mesozooplankton biomass and phyto-plankton biomass were used. Statistical analyses were
40

Porter et al.: Tidal resuspension effect on ecosystem
performed using SAS (SAS Institute), and the t-testsusing the Microsoft Excel Analysis ToolPak (MicrosoftCorp.). Significances of all analyses were defined at thep ≤ 0.05 level.
RESULTS
Water-column processes
Over the 4 wk long experiment, TSS levels wereobviously enhanced (100 to 220 mg l–1) in the R tankscompared to the NR tanks (6 to 18 mg l–1) (Fig. 2a,Table 1a), as were PIM and POM concentrations
(Table 1a). After the adjustments to the mixing settingsin the R and NR tanks for the first 1.5 d (see above), thefinal maximum shear stress levels in the R tanks werefrom 0.35 to 0.4 Pa, and seston concentrations were170 mg l–1. These decreased to about 120 mg l–1 towardsthe middle of the experiment, before increasing againtowards the end of the experiment (Fig. 2a). PC, PN, andPP concentrations were linearly related to TSS concen-trations (Table 2) and thus were enhanced in the R tanks(Table 1c). Particulate matter quality was, however,significantly higher in the NR tanks as demonstrated by:(1) higher POM:PIM ratios (Table 1a), (2) higher chl a:phaeophytin ratios (Fig. 2d, Table 2b), and (3) a lowerPC:PN ratio, typical of that for phytoplankton (Table 1c).
41
0
10
20
30
40
50
60
0
1
2
3
4
5
6
7
00 5 10 15 20 25 30
20
40
60
80
100
0
50
100
150
200
250
300
TS
S (m
g l
–1)
Ch
l a
(µg
l–1)
Chl a:
ph
aeo
(µg
l–1)
Part
. sili
ca (µg
l–1)
Phaeo
ph
ytin
(µg
l–1)
Ch
l a
(µg
l–1)
Phaeo
ph
ytin
(µg
l–1)
Day
0
5
10
15
20
25
30
35
0
1
2
3
4
5
6
0
1
2
3
4
e
f
g
a
b
c
d
R_on R_off NR_on NR_off
R_on
R_off
NR_on
NR_off
Fig. 2. Results over time in the non-resuspension (NR) and resuspension (R) tanks during the mixing-on and mixing-off phases.Concentrations of (a) total suspended solids (TSS) (samples on Day 1 were taken near the time that mixing was started), (b)chlorophyll a (chl a; technique according to Welschmeyer 1994), (c) phaeophytin (phaeo; HPLC technique), and (d) chl a:phaeoratios. (e) Chl a, (f) phaeo and (g) particulate silica measured during the mixing-on and at the end of the 2 h mixing-off phase onDay 12 (circled in Panels b and c). Arrow in (a) indicates when the paddles were accidentally shut off for two mixing-on cycles inthe R tanks. n = 3 tanks for each system and mixing phase, reported are the averages ± SD. For statistical results see Table 1a,b
Mar Ecol Prog Ser 413: 33–53, 2010
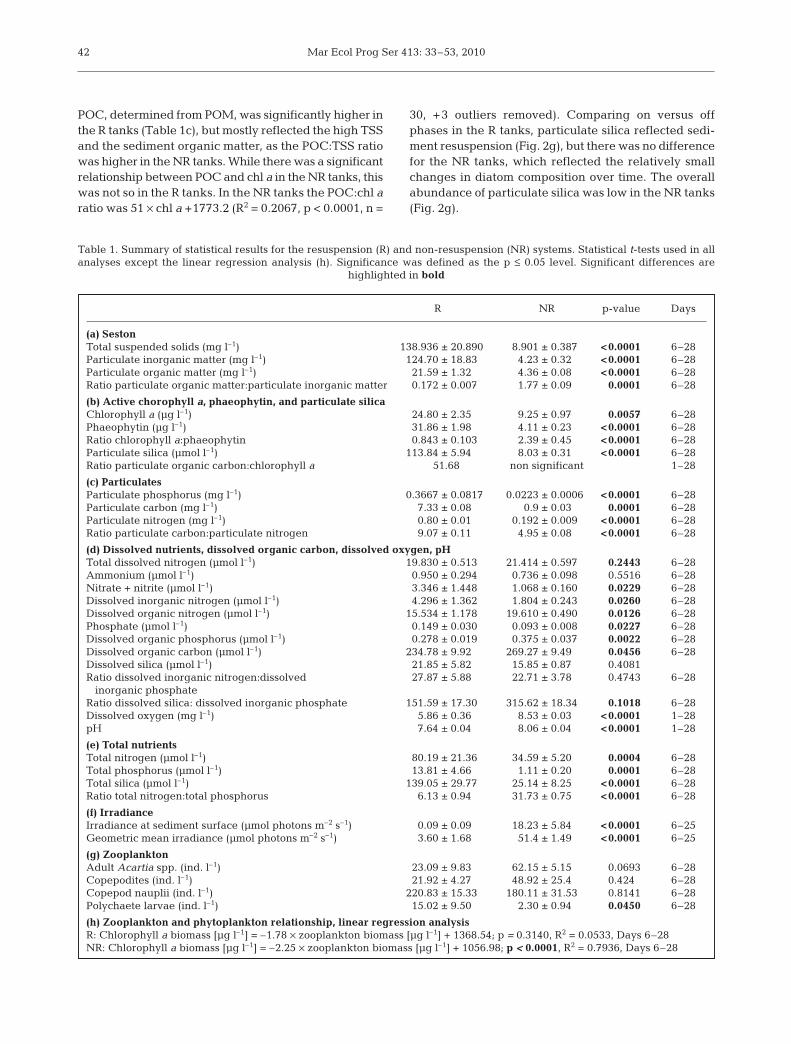
POC, determined from POM, was significantly higher inthe R tanks (Table 1c), but mostly reflected the high TSSand the sediment organic matter, as the POC:TSS ratiowas higher in the NR tanks. While there was a significantrelationship between POC and chl a in the NR tanks, thiswas not so in the R tanks. In the NR tanks the POC:chl aratio was 51 × chl a +1773.2 (R2 = 0.2067, p < 0.0001, n =
30, +3 outliers removed). Comparing on versus offphases in the R tanks, particulate silica reflected sedi-ment resuspension (Fig. 2g), but there was no differencefor the NR tanks, which reflected the relatively smallchanges in diatom composition over time. The overallabundance of particulate silica was low in the NR tanks(Fig. 2g).
42
Table 1. Summary of statistical results for the resuspension (R) and non-resuspension (NR) systems. Statistical t-tests used in allanalyses except the linear regression analysis (h). Significance was defined as the p ≤ 0.05 level. Significant differences are
highlighted in bold
R NR p-value Days
(a) SestonTotal suspended solids (mg l–1) 138.936 ± 20.890 8.901 ± 0.387 <0.0001 6–28Particulate inorganic matter (mg l–1) 124.70 ± 18.83 4.23 ± 0.32 <0.0001 6–28Particulate organic matter (mg l–1) 21.59 ± 1.32 4.36 ± 0.08 <0.0001 6–28Ratio particulate organic matter:particulate inorganic matter 0.172 ± 0.007 1.77 ± 0.09 0.0001 6–28
(b) Active chorophyll a, phaeophytin, and particulate silicaChlorophyll a (µg l–1) 24.80 ± 2.35 9.25 ± 0.97 0.0057 6–28Phaeophytin (µg l–1) 31.86 ± 1.98 4.11 ± 0.23 <0.0001 6–28Ratio chlorophyll a:phaeophytin 0.843 ± 0.103 2.39 ± 0.45 <0.0001 6–28Particulate silica (µmol l–1) 113.84 ± 5.94 8.03 ± 0.31 <0.0001 6–28Ratio particulate organic carbon:chlorophyll a 51.68 non significant 1–28
(c) ParticulatesParticulate phosphorus (mg l–1) 0.3667 ± 0.0817 0.0223 ± 0.0006 <0.0001 6–28Particulate carbon (mg l–1) 7.33 ± 0.08 0.9 ± 0.03 0.0001 6–28Particulate nitrogen (mg l–1) 0.80 ± 0.01 0.192 ± 0.009 <0.0001 6–28Ratio particulate carbon:particulate nitrogen 9.07 ± 0.11 4.95 ± 0.08 <0.0001 6–28
(d) Dissolved nutrients, dissolved organic carbon, dissolved oxygen, pHTotal dissolved nitrogen (µmol l–1) 19.830 ± 0.513 21.414 ± 0.597 0.2443 6–28Ammonium (µmol l–1) 0.950 ± 0.294 0.736 ± 0.098 0.5516 6–28Nitrate + nitrite (µmol l–1) 3.346 ± 1.448 1.068 ± 0.160 0.0229 6–28Dissolved inorganic nitrogen (µmol l–1) 4.296 ± 1.362 1.804 ± 0.243 0.0260 6–28Dissolved organic nitrogen (µmol l–1) 15.534 ± 1.178 19.610 ± 0.490 0.0126 6–28Phosphate (µmol l–1) 0.149 ± 0.030 0.093 ± 0.008 0.0227 6–28Dissolved organic phosphorus (µmol l–1) 0.278 ± 0.019 0.375 ± 0.037 0.0022 6–28Dissolved organic carbon (µmol l–1) 234.78 ± 9.92 269.27 ± 9.49 0.0456 6–28Dissolved silica (µmol l–1) 21.85 ± 5.82 15.85 ± 0.87 0.4081Ratio dissolved inorganic nitrogen:dissolved 27.87 ± 5.88 22.71 ± 3.78 0.4743 6–28
inorganic phosphateRatio dissolved silica: dissolved inorganic phosphate 151.59 ± 17.30 315.62 ± 18.34 0.1018 6–28Dissolved oxygen (mg l–1) 5.86 ± 0.36 8.53 ± 0.03 <0.0001 1–28pH 7.64 ± 0.04 8.06 ± 0.04 <0.0001 1–28
(e) Total nutrientsTotal nitrogen (µmol l–1) 80.19 ± 21.36 34.59 ± 5.20 0.0004 6–28Total phosphorus (µmol l–1) 13.81 ± 4.66 1.11 ± 0.20 0.0001 6–28Total silica (µmol l–1) 139.05 ± 29.77 25.14 ± 8.25 <0.0001 6–28Ratio total nitrogen:total phosphorus 6.13 ± 0.94 31.73 ± 0.75 <0.0001 6–28
(f) IrradianceIrradiance at sediment surface (µmol photons m–2 s–1) 0.09 ± 0.09 18.23 ± 5.84 <0.0001 6–25Geometric mean irradiance (µmol photons m–2 s–1) 3.60 ± 1.68 51.4 ± 1.49 <0.0001 6–25
(g) ZooplanktonAdult Acartia spp. (ind. l–1) 23.09 ± 9.83 62.15 ± 5.15 0.0693 6–28Copepodites (ind. l–1) 21.92 ± 4.27 48.92 ± 25.4 0.424 6–28Copepod nauplii (ind. l–1) 220.83 ± 15.33 180.11 ± 31.53 0.8141 6–28Polychaete larvae (ind. l–1) 15.02 ± 9.50 2.30 ± 0.94 0.0450 6–28
(h) Zooplankton and phytoplankton relationship, linear regression analysisR: Chlorophyll a biomass [µg l–1] = –1.78 × zooplankton biomass [µg l–1] + 1368.54; p = 0.3140, R2 = 0.0533, Days 6–28NR: Chlorophyll a biomass [µg l–1] = –2.25 × zooplankton biomass [µg l–1] + 1056.98; p < 0.0001, R2 = 0.7936, Days 6–28

Porter et al.: Tidal resuspension effect on ecosystem
Water-column chl a (20 to 50 µg l–1) and phaeophytin(4 to 6 µg l–1) levels were significantly higher in the Rthan in the NR tanks (Fig. 2b,c, Table 1b). Very littlebenthic chl a was resuspended in the R tanks (Fig. 2e),but phaeophytin concentrations differed significantlybetween the mixing-on and the mixing-off phases inthe R tanks, as degraded material was resuspendedand deposited (Fig. 2c,f). The ratio of chl a to phaeo-phytin was 2 to 16 times higher in the NR than in the Rtanks (Fig. 2d). The overall abundance of degradedmaterial was low in the NR tanks, and there was nosignificant difference in degraded material betweenthe mixing-on and mixing-off phases (Fig. 2c,f).
The phytoplankton community structure was alsoaffected by resuspension (Fig. 3). Peridinin (indicativeof Dinophyceae; Fig. 3a) decreased rapidly in the Rand NR tanks after the start of the experiment and thenutrient spike. Lutein concentrations (indicative ofChlorophyceae and Prasinophyceae; Fig. 3b) werehigher in the R than in the NR tanks, whereas zeaxan-thin (cyanobacteria; Fig. 3d) concentrations were
higher in the NR than in the R tanks. Fucoxanthin(Chrysophyceae and Bacillariophyceae; Fig. 3c) andalloxanthin (Cryptophyceae; Fig. 3e) concentrationswere higher in the R than in the NR tanks. But-fucoconcentrations, the pigment marker for Aureococcusanophagefferens (brown tide) (Trice et al. 2004), werealso higher in the R than in the NR tanks (Fig. 3f).These brown tide microorganisms developed to a smallbloom in the R systems with ca. 5300 cells ml–1 by theend of the experiment, based on the pigment to cell
43
Table 2. Particulate carbon (PC), particulate nitrogen (PN),particulate phosphorus (PP) concentrations in the resuspen-sion and the non-resuspension systems from Day 6 to the endof the experiment, and their regression relationship with total
suspended solid (TSS) concentrations; n = 85
Regression R2
PC (mg l–1) = 0.04189 × TSS (mg l–1) + 0.7156 0.97PN (mg l–1) = 0.00397 × TSS (mg l–1) + 0.172 0.93PP (mg l–1) = 0.00256 × TSS (mg l–1) + 0.004856 0.99
J
JJ
J J0
0.03
0.06
0.09
0.12
0.15
0.18
R
J NR
J
J
J J J0
0.004
0.008
0.012
0.016
0.02
J
J
J
J
J
0
0 5 10 15 20 25 30
0.1
0.2
0.3
0.4
0.5
0.6
0.7
J
JJ
JJ
0
0.01
0.02
0.03
0.04
0.05
JJ
J
J
J0
0.05
0.1
0.15
0.2
0.25
J J J JJ
0
0.01
0.02
0.03
0.04
0.05
0.06
0.07
0
Per
idin
i:chl
aLu
tein
:chl
aFu
coxa
nthi
n:ch
l a
But
fuc:
chl a
Allo
xant
hin:
chl a
Zea
xant
hi:c
hl a
0
Day0 5 10 15 20 25 30
Day
a
b
c
d
e
f
Fig. 3. (a to f) Ratios of phytoplankton accessory pigments to chlorophyll a (chl a; Welschmeyer 1994). But fuco: 19’-butanoyloxy-fucoxanthin, marker pigment for the brown tide algae Aureococcus anophagefferens (Trice et al. 2004) if gyroxanthin diester and
19’ hexanoyloxyfucoxanthin are absent (see ‘Results’); n = 3 tanks for each system ± SD

Mar Ecol Prog Ser 413: 33–53, 2010
count conversions of Trice et al. (2004). The ratio ofbut-fuco to chl a steadily increased throughout theexperiment until the last measurement on Day 25;however, 19’-hexanoyloxyfucoxanthin was also pre-sent in all tanks on Day 5 and in 1 tank on Day 18.Gyroxanthin diester was absent in this experiment aschecked by Crystal Thomas, Horn Point Laboratory.
Nitrite + nitrate concentrations were significantlyenhanced in the R tanks compared to the NR tanks(Fig. 4a, Table 1d) and so were the overall DIN con-centrations, as ammonia levels were similar in bothsystems (Fig. 4a–c, Table 1d). Increases of nitrate +nitrite (Fig. 4a) were followed by chl a increases(Fig. 2b). As chl a increased, nitrate + nitrite decreased.
DON concentrations were significantly higher in theNR tanks (19.6 ± 0.5 µmol l–1) than in the R tanks(15.5 ± 1.2 µmol l–1; Fig. 4e, Table 1d), and DONdecreased at a faster rate in the R tanks than in the NRtanks (Fig. 4e). Because of the opposite behaviors oforganic and inorganic nitrogen components, water-column TDN concentrations were not significantlydifferent between the R and the NR tanks from Day 6to the end of the experiment (Fig. 4d, Table 1d). DOPconcentrations were significantly higher in the NRtanks (0.375 ± 0.037 µmol l–1) than in the R tanks(0.278 ± 0.019 µmol l–1) and did not vary much over theexperiment (Fig. 4g). Like ammonium, PO4
3– wastaken up rapidly in the R and NR tanks after itsaddition with the nutrient spike (Fig. 4b,f). DissolvedPO4
3– concentrations were higher in the R than in theNR tanks (Fig. 4f, Table 1d). Dissolved silica concen-trations decreased to about 5 µmol l–1 around Day 13and likely became briefly limiting, but then increasedagain (Fig. 4i). Dissolved oxygen concentrations weresignificantly lower in the R tanks than in the NR tanks(Fig. 4h, Table 1d).
Silica limitation was defined as dissolved silicaconcentrations <5 µmol l–1, nitrogen limitation by DINconcentrations <2 µmol l–1, and phosphorus limitationby phosphate concentrations <0.1 µmol l–1 (Fisher et al.1992; T. Fisher, Horn Point Laboratory, University ofMaryland Center for Environmental Science, pers.comm.). While silica was generally not limiting in theNR tanks (Fig. 4i), there was likely nitrogen and/orphosphorous limitation in the NR tanks (Fig. 4c, f);however, nutrient addition bioassays such as thoseused by Fisher et al. (1999) are needed to determinethe type of nutrient limitation in the NR tanks. In con-trast, the R tanks were generally not nutrient limited(Fig. 4c,f,i).
Total nitrogen (NH4+ + NO2
– + NO3– + DON + PN)
concentrations were about twice as high in the R tanksas in the NR tanks, which, given the overall higherchl a in the R tanks, suggests that resuspended sedi-ment may have been a source of additional nutrients
(Fig. 4j), as discussed further below. Total phosphorusconcentrations (PO4
3– + DOP + PP) were about 8- to 10-fold higher in the R tanks than in the NR tanks(Fig. 4k), and the TN:TP ratio was significantly lower inthe R tanks than in the NR tanks (Fig. 4l, Table 1e).While DOP concentrations were similar between thesystems, most of this increase in TP was due to resus-pended PP, which was related linearly to TSS levels(Table 2).
Light penetration and microphytobenthos levels
Light as measured by a home-made Secchi disk,penetrated about 20 to 30 cm into the R tanks duringresuspension (Fig. 5b), with no irradiance reaching thebottom (Fig. 5a). During the off phases, light in the Rtanks reached 60 to 80 cm into the water (Fig. 5b),with occasional irradiance levels of up to 10 µmol pho-tons m–2 s–1 at the sediment surface (Fig. 5a). In con-trast, in the NR tanks, light always reached the bottom,and the measured bottom irradiance levels rangedbetween 15 and 35 µmol photons m–2 s–1 (Fig. 5a), andwere significantly different from those in the R tanks(Table 1f). Mean geometric irradiance in the water col-umn was higher in the NR tanks (Table 1f).
Sediment chl a varied significantly between systemsand over time. At the start of the experiment, in thebenthic chambers, sediment chl a levels were about10 mg m–2 (Fig. 6). In the middle of the experiment(Day 11, Fig. 6), sediment chl a levels were about30 and 160 mg m–2 in the R and NR tanks, respectively.At the end of the experiment (Day 29, Fig. 6), sedimentchl a levels were about 40 mg m–2 and 110 mg m–2 inthe R and NR tanks, respectively. Thus, sediment chl alevels were significantly higher in the NR tanks thatreceived more light at the bottom (Figs. 6 & 5a) andhad low bottom shear stress below erosion thresholds.
Sediment erodibility
Microcosm erodibility tests were conducted at theend of the mesocosm experiment on 4 sediment cores,2 from R tanks and 2 from NR tanks (Fig. 7a). Thesetests showed little difference in sediment stabilitybetween any of the cores. Thus, although the NR andR tank sediment differed greatly in sediment chl a(presumably microphytobenthos) content, the micro-phytobenthos did not appear to either stabilize ordestabilize the sediment with respect to increasingbottom stress. This may have been due to the pres-ence of polychaetes in the NR sediments (see below).The sediments in the NR tanks also contained moremicrophytobenthos. Fig. 7b illustrates how sediment
44

Porter et al.: Tidal resuspension effect on ecosystem 45
0
2
4
6
8
10
12R_on NR_on
0
5
10
15
20
25
0
5
10
15
20
25
0
10
20
30
40
50
0
5
10
15
20
25
30
00 5 10 15 20 25 30
0.2
0.4
0.6
0.8
1
1.2
0
10
20
30
40
500
2
4
6
8
10
12
14
0
30
60
90
120
150
0
10
20
30
40
50
0
10
20
30
40
50
TN
:TP
TP
(µm
ol l–
1)
TN
(µm
ol l–
1)
Dis
s.
sili
ca
(µm
ol l–
1)
Dis
s. o
xyg
en
(mg
l–1)
DO
P (µm
ol l–
1)
Day0 5 10 15 20 25 30
Day
a
b
c
d
f
h
i
j
k
l
e
0
0.1
0.2
0.3
0.4
0.5 gN
O2
–+
NO
3– (µm
ol l–
1)
PO
4–3 (µm
ol l–
1)
NH
4+ (µm
ol l–
1)
DIN
(µm
ol l–
1)
TD
N (µm
ol l–
1)
DO
N (µm
ol l–
1)
Fig. 4. Dissolved and particulate nutrient and dissolved oxygen concentrations over the experiment; n = 3 tanks for each system,reported are means ± SD: (a) nitrite + nitrate (NO2
– + NO3–), (b) ammonium (NH4
+), (c) dissolved inorganic nitrogen (DIN), (d) totaldissolved nitrogen (TDN), (e) dissolved organic nitrogen (DON), (f) phosphate (PO4
3–), (g) dissolved organic phosphorus (DOP),(h) dissolved (diss.) oxygen, (i) dissolved silica, (j) total nitrogen (TN), (k) total phosphorus (TP), and (l) TN:TP ratio. Statisticalresults are presented in Table 1c to e. The vertical lines indicate a nutrient spike of nitrogen and phosphorus added to the watercolumn, and the horizontal dashed lines in Panels c, f, and i indicate thresholds for nutrient limitation for the respective nutrients
(see ‘Results’)

Mar Ecol Prog Ser 413: 33–53, 2010
chl a was distributed over sediment depth; erodedmass and depth are synonymous for this experimentalsetup, as shown by the secondary axis in Fig. 7b.There was a high concentration of chl a in a very thinsurficial layer in the R tank sediments, suggestingdeposition of water-column phytoplankton in thelatter period of the off phase. In the R tanks, water-column chl a concentrations between the mixing-onand mixing-off phases differed by 14%, which wasprimarily due to phytoplankton that settled and resus-pended. In contrast, sediment chl a was found deeperin the sediments and increased in concentration withincreasing depth in the NR tanks (Fig. 7b), suggestingthe development of a robust microphytobenthos com-munity. The highest stress step in the erodibility tests(0.35 Pa) eroded about 1 mm of sediment. The highestinstantaneous bottom stress in the R tanks (about0.4 Pa) resuspended just over 200 mg l–1 by the end ofthe mesocosm experiments, representing slightly<2 mm of erosion using the same conversion frommass to depth. Overall, the mesocosm and erodibilitytest results are consistent. The 2 lowest stress steps inthe erodibility tests (0.01 and 0.05 Pa) approximatelyrepresent the bottom stress in the NR tanks during the
mixing-on phase. Negligible amounts of sedi-ment and chl a were eroded from the NR sed-iments at these stress levels in the erodibilitytests.
Sediment nutrient and dissolved oxygenfluxes and porewater release estimates
Fluxes were measured using sediment corestaken at the start (only 1 set run) and at the endof the mesocosm experiment (both R and NRsediments). Sediment nutrient and gas fluxeswere low at the start of the experiment(Fig. 8a–d). At the end, dissolved oxygen fluxesdiffered significantly between the dark andlight phases in the NR tanks, with oxygen in-fluxes during the dark and oxygen effluxesduring the light phase (Fig. 8a). However, therewere no significant differences in oxygen fluxesbetween the dark and light phases for the Rtanks at the end of the experiment (Fig. 8a). Am-monium, nitrite + nitrate, and DIN fluxes wereall regenerated from the sediments to the watercolumn (e.g. Fig. 8b–d). There were no signifi-cant DIN flux differences between the R and NRtanks or between the dark and light phases.However, DIN effluxes tended to be slightlylower in the light than in the dark (Fig. 8d),as was also seen for the ammonium fluxes(Fig. 8b). The NR systems also showed a trend
of slightly enhanced nitrate + nitrite effluxes in thelight compared to the fluxes in the dark (Fig. 8c).
46
Water surface
Sediment
Irra
dia
nce
at s
edim
ent
(µm
olp
hoto
ns m
–2 s
–1)
Sec
chi d
epth
(cm
)
0
10
20
30
40R_on
R_off
NR_on
NR_off
a
1000 5 10 15 20 25 30
80
60
40
20
0b
DayFig. 5. (a) Irradiance (photosynthetically active radiation, downwellingattenuation; LiCor light meter) calculated at the sediment surface duringmixing-on and occasional mixing-off phases showed that light did notreach the bottom during the on phases in the resuspension (R) tanks; n =3 for each system, reported are means ± SD. (b) Secchi depth measuredin the R and non-resuspension (NR) tanks during the mixing-on and mix-ing-off phases over the experiment; for statistical results on irradiance
at the sediment surface see Table 1f
0
50
100
150
200
a
c c
b
d
Before NR R(Day 0) Mid (Day 11)
NR REnd (Day 29)
Sed
. chl
a (d
iscr
ete)
(mg
m–2
)
Fig. 6. Sediment chlorophyll a (sed. chl a; Welshmeyer 1994)levels in the 0–1 cm depth section of sediment before theexperiment, on Day 11 (mid) of the experiment, and at the endof the experiment (Day 29), as measured using HPLC. Lettersindicate statistical differences at p < 0.05; n = 3 for each sys-tem, reported are means ± SD. Sediment chl a cores weretaken while mixing was on, and we only briefly turned off themixing to collect the sample. NR: non-resuspension tanks;
R: resuspension tanks

Porter et al.: Tidal resuspension effect on ecosystem
Macroinfauna and mesozooplankton
The sediment was defaunated at the start of theexperiment, and no macroinfauna developed in the Rtanks over the course of the experiment. However, amacroinfauna community developed in the NR tankswith about 256 ± 53 (n = 6 cores) nereid polychaetesand 93 ± 81 (n = 3 cores) amphipods per square meterby the end of the 4 wk experiment (Day 29). The dom-inant mesozooplankton taxa found in the water columnwere adult Acartia spp. copepods, copepodites, cope-pod nauplii, and polychaete larvae (Fig. 9). Pumpslikely destroyed the adult mesozooplankton stages
(Adey & Loveland 1998) during the initial raw water fillof the tanks at the start of the experiment, and it tookabout 2 wk until adult copepods and polychaete larvaewere abundant (Fig. 9). The NR tanks contained about60 adult Acartia sp. l–1 by the end of the experiment,while the R tanks contained only about 20 adult Acar-tia spp. l–1. On the other hand, about 25 polychaetelarvae l–1 were found in the R tanks over the last 2 wkof the experiment (Fig. 9d), whereas only about 1 poly-chaete larvae l–1 was found in the NR tanks (Fig. 9d),even though there were adult polychaetes in the sedi-ment. Copepodite and copepod nauplius abundanceswere not significantly different between systems(Table 1g, Fig. 9). As shown by the negative correlationof water-column chl a and mesozooplankton biomass(both in carbon units), the increasing abundance ofmesozooplankton negatively affected phytoplanktonbiomass in the NR tanks (Fig. 9e), which may partiallyexplain the lower phytoplankton levels in the NRtanks.
Nitrogen budget
Zooplankton, phytoplankton biomass, microphyto-benthos, DIN, DON, and porewater resuspension wereincluded in the nitrogen budget. The data in Table 3suggest that tidal resuspension significantly affectednitrogen partitioning within the system. Overall, about9% more nitrogen was accumulated in the R tanksthan in the NR tanks (192 vs. 174 mmol N). While theNR tanks were benthic-dominated systems, with 54%of the nitrogen partitioned into microphytobenthos, theR tanks were water-column-dominated, with 86% ofthe nitrogen partitioned into different water-columncomponents (phytoplankton, zooplankton, TDN).Overall, the total fraction of the nitrogen in algae,either phytoplankton or microphytobenthos, was simi-lar for both systems (85% in the NR tanks; 88% in theR tanks). However, the fractions of algae partitioneddifferently, where the majority partitioned into micro-phytobenthos in the NR tanks and into phytoplanktonin the R tanks. The major nitrogen inputs were due todaily water exchanges and benthic fluxes. The dailywater exchange inputs were identical between the Rand the NR tanks. Diffusive nitrogen fluxes were simi-lar between the R and the NR tanks (Fig. 8b–d); thus,the benthic nitrogen fluxes were only slightly higher inthe R systems due to porewater resuspension. Verylittle microphytobenthos in the R tanks was resus-pended. However, some phytoplankton N was expor-ted during the daily exchange in the R tanks.
Porewater N release due to resuspension was esti-mated using measured porewater ammonium concen-trations from the upper sediment section (0–5 mm)
47
Cu
mu
lative e
rod
ed
mass p
er
are
a (kg
m–2)
Sediment chl a (µg l–1)
Sed
iment
dep
th (m
m)
Shear stress (Pa)
0.12
0.1
0.08
0.06
0.04
0.02
00 0.05 0.1 0.15 0.2 0.25 0.3 0.35
R core_1
R core_2
NR core_1
NR core_2
0.12
0.1
0.08
0.06
0.04
0.02
0
0 0.5 1 1.5 2 2.5 3 3.5 4 4.5
R core_1
R core_2
NR core_1
NR core_2
0
0.16
0.32
0.48
0.64
0.8
0.96
a
b
Fig. 7. (a) Eroded mass of sediment from sediment cores fromthe non-resuspension (NR) and resuspension (R) tanks sub-jected to 8 stepwise increases in bottom shear stress in dupli-cate 10 cm diameter Gust microcosm cores. Samples for Core2 from the NR tanks for shear stress steps 0.3 and 0.35 Pa werelost. (b) Erosion of sediment chlorophyll a (chl a) from the NRand R tanks subjected to stepwise increases in bottom shearstress in duplicate 10 cm diameter Gust microcosm cores. They-axis on the right depicts the approximate depth of theeroded layer after making some assumptions concerningsediment porosity and sediment density (see ‘Results’).Eroded mass and depth are synonymous. For Core 2 of the Rsystems for shear stress steps 0.3 and 0.35 Pa, chl a data werelost. The erosion cores were collected after the water columnhad been quiescent for some time, and high surface chl a
values indicate settled phytoplankton

Mar Ecol Prog Ser 413: 33–53, 2010
(~40 µmol l–1; Porter et al. 2006) and using the assumedporosity of 0.95. Overall, 76 µmol of ammonium isreleased to the 1000 l water column per resuspensioncycle. Assuming replenishment with ammonium dur-ing each off phase (a conservative assumption) andincluding oxidized nitrogen in the benthic flux estima-tions (Fig. 8c), then porewater resuspension enhancedthe R tank nitrogen concentration by about 0.5 µmol l–1
d–1. This is equivalent to an additional efflux rate of490 µmol m–2 d–1, approximately 20 to 25%, over thediffusional flux measured in the benthic flux chambers(Fig. 8d). Thus, porewater release due to resuspensionis at most a small additional source of nitrogen to the
system. In sandy sediments, stirring can induce addi-tional porewater release due to advective flushing(Huettel & Gust 1992), but this is not the case with themuddy sediments used in this experiment.
Several variables were not included in the N budget.Sediment–water nitrogen flux rates were similar inboth the NR and the R tanks and thus not included.Denitrification was not measured, and macrofauna Ncontent was not determined. POC was estimated fromPOM and not measured directly; thus, phytoplanktonbiomass N and microphytobenthos N content in the Rtanks used the POC:chl a relationship derived from theNR tanks (see above). Even with these limitations,
48
–400
–300
–200
–100
0
100
200
0
500
1000
1500
2000
0
200
400
600
800
1000
1200
1400
0
500
1000
1500
2000
2500
–40
–20
0
20
40
0
20
40
60
80
100
120
140
0
10
20
30
40
50
60
70
0
20
40
60
80
100
120
140
d) DIN
a) O2
b) NH4+
c) NO3– +NO2
–
NR
R
p = 0.0040
p = 0.8928
p =0.4902
p = 0.7621
b
a
bb
a
aa
a
a
aa a
a
a a
a
Dark Dark Light Daily (dark + light)
Daily
flu
x (µ
mo
l m
–2 d
–1)
Ho
urly f
lux (µ
mo
l m
–2 h
–1)
Start End
Fig. 8. (a) Sediment oxygen and (b) ammonium, (c) nitrate + nitrite, and (d) dissolved inorganic nitrogen (DIN) fluxes from sedi-ment cores collected from the resuspension (R) and non-resuspension (NR) tanks; fluxes are mediated by microphytobenthosphotosynthesis and macrofauna. Sediment fluxes were run in the dark and in the light; the daily fluxes were calculated afterKemp & Cornwell (2001). ‘Start’ cores contained sediment from the start of the experiment see ‘Results’), all other cores werecollected at the end of the experiment. Letters indicate statistical differences at p < 0.05; n = 3 for each system;reported are
means ± SD

Porter et al.: Tidal resuspension effect on ecosystem
Table 3 unmistakably shows the partitioning of nitro-gen into the benthic and pelagic components, with theR tanks becoming pelagic-dominated and the NRtanks becoming benthic-dominated.
DISCUSSION
In our mesocosm experiments, tidal resuspensiongreatly affected overall water quality, the distributionof algae between the water column and microphyto-benthos, and mesozooplankton dynamics.
Unexpectedly, phytoplankton biomass was signifi-cantly higher in the R tanks than in the NR tanks,although light was limited in the R tanks. Enhancedbottom stress and resuspension in the R tanks limitedboth light penetration to the bottom and microphyto-benthos biomass. Light reached the sediments rou-tinely in the NR tanks and allowed significantlygreater microphytobenthos growth than in the R tanks,such that microphytobenthos were the dominantmicroalgae in the NR tanks. The core erosion studiesshowed that microphytobenthos were deeper in thesediments in the NR tanks than the thin veneer of set-tled phytoplankton at the sediment surface in the Rtanks.
The enhanced phytoplankton levels in the R tankswere most likely due to higher inorganic nutrient lev-els. Nitrate + nitrite increases and decreases in the Rtanks were followed by increases and decreases inphytoplankton biomass in the R tanks. This indicatesthe importance of inorganic nutrient concentrationsin driving algal biomass. Partitioning of nitrogenbetween the R and NR systems was very different. TheNR tanks were benthic-dominated, with high micro-phytobenthos biomass, while the R tanks were water-column-dominated, with more phytoplankton andmore degraded algae (phaeophytin).
Effects of sediment resuspension on nutrient dynam-ics have been noted previously. In a 4.5 d long experi-ment with grid-stirred 2.6 l benthic chambers,Garstecki et al. (2002) found that sediment resuspen-sion increased nutrient concentrations and affected thedynamics of a coastal planktonic microbial food web.Oertel & Dunstan (1981) found enhanced nutrientconcentrations in turbid environments and higherphytoplankton biomass in a Georgia embayment, asdid Lawrence et al. (2004), who found that wind-resus-pended bottom material correlated with increasednutrients in the water. Tengberg et al. (2003) foundthat sediment resuspension (generated in flux cham-bers), decreased oxygen fluxes, increased nitrate +nitrite fluxes, but had no effect on ammonium fluxes.Grémare et al. (2003) found enhanced nutrient concen-trations after a major storm event.
49
Ad
ult A
cart
ia (in
d.
l–1)
Co
pep
od
ites (in
d.
l–1)
Co
p.
nau
plii
(in
d.
l–1)
Po
lych
. la
rvae (in
d.
l–1)
Ch
l a
(µg
. l–
1)
Day
Zooplankton biomass (µg. l–1)
0
500
1000
1500
2000
2500
0 50 100 150 200 250 300 350 400 450
R: r = –0.23p = 0.31
NR: r = –0.89p < 0.0001
0
25
50
75
100
125
R
NR
0
50
100
150
200
0
200
400
600
800
1000
0
10
20
30
40
50
60
70
0 5 10 15 20 25 30
a
b
c
d
e
Fig. 9. Mesozooplankton abundance over the experiment for:(a) adult Acartia sp., (b) copepodites, (c) copepod (cop.) nau-plii, and (d) polychaete (polych.) larvae; n = 3, reported aremeans ± SD. (e) Relationship of phytoplankton biomass andthe biomass of the mesozooplankton community (commoncarbon unit, Panels a to d included) in the resuspension (R)and non-resuspension (NR) tanks, respectively. For statistical
results see Table 1g,h

Mar Ecol Prog Ser 413: 33–53, 2010
Elevated concentrations of brown tide organisms(Aureococcus anophagefferens), as detected withthe but-fuco marker pigment (Trice et al. 2004)when gyroxanthin diester and 19’hexanoyloxyfucox-anthin were absent, were found in the R tanks but notin the NR tanks and even reached bloom conditions.Thus, tidal resuspension stimulated an A. anopha-gefferens abundance. In addition, while A. anopha-gefferens increased to bloom conditions on Day 25,cyanobacteria decreased dramatically in the R tanks.
The growth of A. anophagefferens may have beenstimulated by the higher dissolved nutrient concentra-tions (nitrate + nitrite, DIN, PO4
3–). The conditions inthe R tanks, a mixture of DIN and DON and low light,may have favored the growth of brown tide algae, ashas been suggested by Pustizzi et al. (2004). In addition,MacIntyre et al. (2004) suggested that A. anophageffer-ens is likely to bloom when high turbidity providesrefuge from irradiance and that A. anophagefferens is abetter competitor under low light conditions. Moreover,MacIntyre et al. (2004, their Fig. 8) presented a modelcomparing the effect of low versus high energy envi-ronments on triggering A. anophagefferens blooms,whereby the model was primarily driven by light andnutrient availability, as mediated by resuspension.
Dissolved organic nutrient concentrations (DON,DOP) were significantly higher in the NR tanks than inthe R tanks, but these did not appear to enhancegeneral phytoplankton biomass. This is consistent withthe general understanding that plants use only inor-ganic nutrients and not the organic forms. However,DON concentrations decreased at a faster rate in the Rthan in the NR tanks, perhaps due to the ability ofbrown tide algae to use a mixture of DIN and DON(Pustizzi et al. 2004). Marshall et al. (2005) alsoreported Aureococcus anophagefferens in Chesa-peake Bay water and recognized that another ‘associa-tion within the changing trophic status of the [Chesa-peake] Bay estuary was the increased recognition ofpotentially toxic species in these waters’ (p. 1100).
We found significant differences inthe mesozooplankton community struc-ture between the R and NR tanks. Poly-chaete larvae became significantlymore abundant in the R tanks and likelyselectively grazed the diatoms and/orchrysophytes, shifting the populationtowards cyanobacteria in the NR tanks.In other experiments with defaunatedsediments, the sediments stayed devoidof macroinfauna until the end of the4 wk in experiments (Porter et al.2004a,b). In the present experiments,however, we found a macroinfaunalcommunity composed of polychaetes
and amphipods in the NR tanks, but not in the R tanks.This may be because the low bottom stress, and thusthe stable sedimentary bottom, allowed polychaete lar-vae to recruit to the bottom of the NR tanks and grow.In contrast, polychaete larvae were not able to recruitto the unstable sedimentary bottom of the R tanks, ashas been previously shown for larvae (Thrush et al.1996). Crimaldi et al. (2002) also found that instanta-neous turbulence and water flow affects larval settle-ment. High shear stress can erode larvae from surfaces(Koehl & Hadfield 2004).
The mesozooplankton community was negativelycorrelated with phytoplankton biomass in the NRtanks (Fig.9e). These estimates do not include anypotential grazing effects of the microzooplanktoncommunity, which we did not measure. Others haveshown that benthic boundary-layer flow can increasemicrozooplankton abundance and have suggested thatresuspension of protists may alter the microbial foodweb (Shimeta et al. 2003), all of which may haveselectively affected microzooplankton grazing inthe R tanks. However, Lawrence et al. (2004) foundthat resuspension decreased microzooplankton abun-dance.
In complex ecosystems, multiple direct and indirectpathways are likely to be operating simultaneously,potentially reinforcing or cancelling each other’s over-all effects (Wootton 2002) and confounding interpreta-tion of experimental results. For example, light pene-tration to the sediments, in interaction with bottomshear velocity (Porter et al. 2004a,b), nutrient availabil-ity (Sundbäck et al. 2000), and macrofaunal grazing(Muschenheim & Newell 1992, Herman et al. 2000),all may have directly mediated microphytobenthosabundance in our experiments, but were producedthrough indirect interactions. Adult polychaetes,which were very active during our flux experiments,and amphipods in the NR systems offset the positiveeffects of microphytobenthos in nutrient uptake byincreasing nutrient fluxes through bioirrigation and
50
Table 3. Partitioning of nitrogen (N) within the resuspension (R) and non-resuspension (NR) tanks (see ‘Results’). DIN: dissolved inorganic nitrogen
(ammonium + nitrate + nitrite); DON: dissolved organic nitrogen
R Distribution NR Distribution(µmol N) within R (%) (µmol N) within NR (%)
Zooplankton N 1777 0.9 3684 2.1Phytoplankton N 142448 74.3 53141 30.6Microphytobenthos N 26061 13.6 94322 54.3DIN 5074 2.6 2832 1.6DON 15998 8.3 19666 11.3Porewater N 490 0.3 0 0Total N 191848 100 173645 100Imbalance of nitrogen between R and NR: 18203 µmol N

Porter et al.: Tidal resuspension effect on ecosystem
bioturbation (Kristensen 1984, Pelegrí et al. 1994),thereby canceling out any positive effects of microphy-tobenthos on water quality. Thus, models and studiesthat consider how water-column depth and light pene-tration directly affect microphytobenthos and waterquality (Robson & Webster 2006) should be expandedto also include interaction modifications that may beinadvertently introduced through resuspension andsimilar aspects of realistic ecosystem complexity.
Indirect effects have often been identified by acci-dent when experiments produced unanticipated re-sults (Wooten 2002). In the present case, phytoplank-ton growth was driven by 2 factors, light limitation andnutrients. This was initially unanticipated as our initialhypotheses had focused only on the effect of lightlimitation due to resuspension on phytoplanktongrowth. However, resuspension also relaxed nutrientlimitation, which dominated the effects of increasinglight limitation. Thus, the R tanks were light-limited,but higher inorganic nutrient levels associated withresuspension, coupled with lower zooplankton feed-ing, resulted in higher phytoplankton biomass.
Major functional changes were brought about byone key variable, resuspension. Resuspension mecha-nistically functioned like a switch, excluding benthicfauna, reducing microphytobenthos biomass, resus-pending porewater nutrients, desorbing nutrients fromparticles, enhancing nutrient concentrations, andincreasing phytoplankton concentrations. Resuspen-sion has been found to be important in field studies inshallow-water environments; however, causal rela-tionships and interaction modifications are difficult todiscern in the field. Short-term, bench-scale experi-ments do not include interaction modifications due toindirect effects. However, our mesocosm experimentsmake it clear that resuspension is a key environmentalfactor that must be considered and included in ecosys-tem experiments that address benthic–pelagic cou-pling in shallow-water systems. Resuspension in na-ture occurs on a regular basis through tidal action andthrough episodic events such as storms. The effects ofchanging frequencies and magnitudes of resuspensionon shallow-water ecosystems need more attention andprovide a rich area for future research.
Acknowledgements. We thank Heather Soulen, Eun-HeeKim, and summer student Melissa Bonner for help with thisexperiment. We thank Heather Soulen for processing the zoo-plankton samples, and Patrick Dickhudt for running the Gustmicrocosm core erosion experiments. Giselher Gust, Technis-che Universität Hamburg-Harburg, Germany, kindly permit-ted us to use 10 cm diameter microcosms for the core erosionexperiments. The Chesapeake Biological Laboratory andHorn Point Laboratory Analytical Services Departmentsanalyzed many samples, and the Chesapeake BiologicalLaboratory, University of Maryland Center for EnvironmentalScience (UMCES), provided space to set up the mesocosm
facility. Tom Fisher provided helpful advice for the interpreta-tion of nutrient limitation, and the crew of the RV ‘Aquarius’helped us collect the sediments. We appreciate the carefulreview and suggestions by 3 anonymous reviewers thatgreatly improved the manuscript. This research was sup-ported by Grant R 824850-01-0 from the United States Envi-ronmental Protection Agency Science To Achieve Results(EPA STAR) program as part of the Multiscale ExperimentalEcosystem Research Center (MEERC) at UMCES, by Grant35236 by the Hudson River Foundation to R.P.M., E.T.P., andL.P.S. This is a publication of Washington College andUMCES Contribution No. 4445.
LITERATURE CITED
Aberle J, Nikora V, Walters R (2004) Effects of bed materialproperties on cohesive sediment erosion. Mar Geol 207:83–93
Adey WH, Loveland K (1998) Pumps. In: Adey WH, LovelandK (eds) Dynamic aquaria. Building living ecosystems. Aca-demic Press, San Diego, CA, p 27–33
Andersen TJ (2001) Seasonal variation in erodibility of twotemperate, microtidal mudflats. Estuar Coast Shelf Sci 53:1–12
Baker JE, Mason RP, Cornwell JC, Ashley J, Halka J, Hill J(1997) Spatial mapping of sedimentary contaminants inthe Baltimore Harbor/Patapsco River/Back River system.Final report to the Maryland Department of the Environ-ment. University of Maryland Center for EnvironmentalScience/Chesapeake Biological Laboratory, Solomons,MD, p 97–142
Berg JA, Newell RIE (1986) Temporal and spatial variations inthe composition of seston available to the suspension feederCrassostrea virginica. Estuar Coast Shelf Sci 23: 375–386
Blackford JC (2002) The influence of microphytobenthos onthe northern Adriatic ecosystem: a modelling study. EstuarCoast Shelf Sci 55:109–123
Blanchard GF, Sauriau PG, Cariou-Le Gall V, Gouleau D,Garet MJ, Olivier F (1997) Kinetics of tidal resuspension ofmicrobiota: testing the effects of bioturbation using flumeexperiments. Mar Ecol Prog Ser 151:17–25
Chang ML, Sanford LP (2005) Modeling the effects of tidalresuspension and deposition on early diagenesis of conta-minants. Aquat Ecosyst Health Manag 8:41–51
Chang J, Shiah FK, Gong GC, Chiang KP (2003) Cross-shelfvariation in carbon-to-chlorophyll a ratios in the EastChina sea, summer 1998. Deep-Sea Res II 50:1237–1247
Chen CC, Petersen JE, Kemp WM (1997) Spatial and tempo-ral scaling of periphyton growth on walls of estuarinemesocosms. Mar Ecol Prog Ser 155:1–15
Crawford SM, Sanford LP (2001) Boundary shear velocitiesand fluxes in the MEERC experimental ecosystems. MarEcol Prog Ser 210:1–12
Crimaldi JP, Thompson JK, Rosman JH, Lowe RJ, Koseff JR(2002) Hydrodynamics of larval settlement: the influenceof turbulent stress events at potential recruitment sites.Limnol Oceanogr 47:1137–1151
Davis WR (1993) The role of bioturbation in sediment resus-pension and its interaction with physical shearing. J ExpMar Biol Ecol 171:187–200
Dickhudt, PJ, Friedrichs CT, Schaffner LC, Sanford LP (2009)Spatial and temporal variation in cohesive sediment erodi-bility in the York River estuary: a biologically-influencedequilibrium modified by seasonal deposition. Mar Geol267:128–140
Fanning KA, Carder KL, Betzer PR (1982) Sediment resuspen-
51

Mar Ecol Prog Ser 413: 33–53, 2010
sion by coastal waters: a potential mechanism for nutrientre-cycling on the ocean’s margins. Deep-Sea Res 29:953–965
Fisher TR, Peele ER, Ammerman JW, Harding LW Jr (1992)Nutrient limitation of phytoplankton in Chesapeake Bay.Mar Ecol Prog Ser 82:51–63
Fisher TR, Gustafson AB, Sellner K, Lacouture R and others(1999) Spatial and temporal variation of resource limita-tion in Chesapeake Bay. Mar Biol 133:763–778
Garstecki T, Wickham SA, Arndt H (2002) Effects of experi-mental sediment resuspension on a coastal planktonicmicrobial food web. Estuar Coast Shelf Sci 55:751–762
Geider RJ (1987) Light and temperature dependence of thecarbon to chlorophyll a ratio in microalgae and cyanobac-teria: implications for physiology and growth of phyto-plankton. New Phytol 106:1–34
Grant WD, Madsen OS (1979) Combined wave and current in-teraction with a rough bottom. J Geophys Res 84: 1797–1808
Grémare A, Amouroux JM, Cauwet G, Charles F and others(2003) The effects of a strong winter storm on physical andbiological variables at a shelf site in the Mediterranean.Oceanol Acta 26:407–419
Guillén J, Jiménez JA, Palanques A, Gracia V, Puig P,Sánchez-Arcilla A (2002) Sediment resuspension across amicrotidal, low-energy inner shelf. Cont Shelf Res 22:305–325
Gust G (1988) Skin friction probes for field applications.JGeophys Res 93:14,121–14,132
Gust G, Müller V (1997) Interfacial hydrodynamics andentrainment functions of currently used erosion devices.In: Burt N, Parker R, Watts J (eds) Cohesive sediments.John Wiley and Sons, Chichester, p 149–174
Harding LW, Mallonee ME, Perry ES (2002) Toward a predictiveunderstanding of primary productivity in a temperate, par-tially stratified estuary. Estuar Coast Shelf Sci 55: 437–463
Herman PMJ, Middelburg JJ, Widdows J, Lucas CH, HeipCHR (2000) Stable isotopes as trophic tracers: combiningfield sampling and manipulative labelling of food re-sources for macrobenthos. Mar Ecol Prog Ser 204:79–92
Heyes A, Miller C, Mason RP (2004) Mercury and methylmer-cury in Hudson River sediment: impact of tidal resuspen-sion on partitioning and methylation. Mar Chem 90:75–89
Huettel M, Gust G (1992) Solute release mechanisms fromconfined sediment cores in stirred benthic chambers andflume flows. Mar Ecol Prog Ser 82:187–197
Jeffrey SW, Vesk M (1997) Introduction to marine phyto-plankton and their pigment signatures In: Jeffrey SW,Mantoura RFC, Wright SW (eds) Phytoplankton pigmentsin oceanography: guidelines to modern methods, Vol 10.Monographs on oceanographic methodology. UNESCOPublishing, Paris, p 74–75, Table 2.3
Jørgensen SE, Patten BC, Stra$kraba M (1992) Ecosystemsemerging—toward an ecology of complex-systems in acomplex future. Ecol Modell 62:1–27
Keefe CW, Blodnikar KL, Boynton WR, Clark CA and others(2004) Nutrient analytical services laboratory standardoperating procedures. Special Publication Series No. SS-80-04-CBL, Chesapeake Biological Laboratory, Uni-versity of Maryland Center for Environmental Science,Solomons, MD. Available at: http://archive.chesapeake-bay.net/pubs/quality_assurance/CBL_NASL_SOP_Feb_ 2004.pdf (accessed on 14 June 2010)
Kemp WM, Cornwell JC (2001) Role of benthic communitiesin the cycling and balance on nitrogen in Florida Bay.Final report to USEPA, UMCES TS-351-03. University ofMaryland Center for Environmental Science, Cambridge,MD
Kirk JTO (1994) Light and photosynthesis in aquatic ecosys-tems. Cambridge University Press, Cambridge
Koehl MAR, Hadfield MG (2004) Soluble settlement cue inslowly moving water within coral reefs induces larvaladhesion to surfaces. J Mar Syst 49:75–88
Kristensen E (1984) Effect of natural concentrations of nutri-ent exchange between a polychate burrow in estuarinesediment and the overlying water. J Exp Mar Biol Ecol 75:171–190
Krivtsov V (2004) Investigations of indirect relationships inecology and environmental sciences: a review and theimplications for comparative ecosystem analysis. EcolModell 174:37–54
Lawrence D, Dagg MJ, Liu HB, Cummings SR, Ortner PB,Kelble C (2004) Wind events and benthic–pelagic cou-pling in a shallow subtropical bay in Florida. Mar EcolProg Ser 266:1–13
Maa JPY, Sanford LP, Halka JP (1998) Sediment resuspensioncharacteristics in Baltimore Harbor, Maryland. Mar Geol146:137–145
MacIntyre HL, Geider RJ, Miller DC (1996) Microphytoben-thos: the ecological role of the ‘Secret Garden’ of unvege-tated, shallow-water marine habitats. I. Distribution,abundance and primary production. Estuaries 19:186–201
MacIntyre HL, Lomas MW, Cornwell JC, Suggett DJ, GoblerCJ, Koch EW, Kana TM (2004) Mediation of benthic–pelagic coupling by microphytobenthos: an energy- andmaterial-based model for initiation of blooms of Aureo-coccus anophagefferens. Harmful Algae 3:403–437
Marshall HG (1994) Chesapeake Bay phytoplankton. I. Com-position. Proc Biol Soc Wash 107:573–585
Marshall HG, Burchardt L, Lacouture R (2005) A review ofphytoplankton composition within Chesapeake Bay andits tidal estuaries. J Plankton Res 27:1083–1102
Meadows PS, Tait J (1989) Modification of sediment perme-ability and shear strength by two burrowing invertebrates.Mar Biol 101:75–82
Meybeck M, Laroche L, Dürr HH, Syvitski JPM (2003) Globalvariability of daily total suspended solids and their fluxesin rivers. Global Planet Change 39:65–93
Montoya JM, Pimm SL, Solé RV (2006) Ecological networksand their fragility. Nature 442:259–264
Morin J, Morse JW (1999) Ammonium release from resus-pended sediments in the Laguna Madre estuary. MarChem 65:97–110
Muschenheim DK, Newell CR (1992) Utilization of seston fluxover a mussel bed. Mar Ecol Prog Ser 85:131–136
Oertel GF, Dunstan WM (1981) Suspended-sediment distrib-ution and certain aspects of phytoplankton production offGeorgia, USA. Mar Geol 40:171–197
Parsons TR, Maita Y, Lalli CM (1984) A manual of chemicaland biological methods for seawater analysis. Pergamon,Oxford University Press, Oxford
Pelegrí SP, Nielsen LP, Blackburn TH (1994) Denitrification inestuarine sediment stimulated by the irrigation activity ofthe amphipod Corophium volutator. Mar Ecol Prog Ser105:285–290
Petersen JE, Sanford LP, Kemp WM (1998) Coastal planktonresponses to turbulent mixing in experimental ecosys-tems. Mar Ecol Prog Ser 171:23–41
Porter ET (1999) Physical and biological scaling of benthic–pelagic coupling in experimental ecosystem studies. PhDthesis, Marine Estuarine Environmental Sciences Program,University of Maryland, College Park, MD
Porter ET, Sanford LP, Suttles SE (2000) Gypsum dissolution isnot a universal integrator of ‘water motion’. LimnolOceanogr 45:145–158
52

Porter et al.: Tidal resuspension effect on ecosystem
Porter ET, Sanford LP, Gust G, Porter FS (2004a) Combinedwater column mixing and benthic boundary-layer flow inmesocosms: key for realistic benthic–pelagic couplingstudies. Mar Ecol Prog Ser 271:43–60
Porter ET, Cornwell JC, Sanford LP, Newell RIE (2004b)Effect of oysters Crassostrea virginica and bottom shearvelocity on benthic–pelagic coupling and estuarine waterquality. Mar Ecol Prog Ser 271:61–75
Porter ET, Owens M, Cornwell JC (2006) Effect of sedimentmanipulation on the biogeochemistry of experimentalsediment systems. J Coast Res 22:1539–1551
Pustizzi F, Mac H, Intyre H, Warner ME, Hutchins DA (2004)Interaction of nitrogen source and light intensity on thegrowth and photosynthesis of the brown tide alga Aureo-coccus anophagefferens. Harmful Algae 3:343–360
Robson BJ, Webster IT (2006) Representing the effects of sub-grid-scale variations in bathymetry on light and primaryproduction. Environ Model Softw 21:802–811
Sanford LP (1997) Turbulent mixing in experimental ecosys-tem studies. Mar Ecol Prog Ser 161:265–293
Sanford LP (2008) Modeling a dynamically varying mixedsediment bed with erosion, deposition, bioturbation, con-solidation, and armoring. Comput Geosci 34:1263–1283
Sanford LP, Suttles S, Porter ET (2009) Physical factors: mix-ing and flow. In: Petersen JE, Kennedy VS, Dennison WC,Kemp WM (eds) Enclosed experimental ecosystems andscale. Springer Verlag, New York, NY, p 63–74
Sanford LP, Panageotou W, Halka JP (1991) Tidal resuspen-sion of sediments in northern Chesapeake Bay. Mar Geol97:87–103
Schneider AR, Porter ET, Baker JE (2007) Polychlorinatedbiphenyl release from resuspended Hudson River sedi-ment. Environ Sci Technol 41:1097–1103
Schoellhamer DH (1995) Sediment resuspension mechanismsin Old-Tampa Bay, Florida. Estuar Coast Shelf Sci 40:603–620
Schoellhamer DH (2002) Variability of suspended-sedimentconcentration at tidal to annual time scales in San Fran-cisco Bay, USA. Cont Shelf Res 22:1857–1866
Shimeta J, Amos CL, Beaulieu SE, Katz SL (2003) Resus-pension of benthic protists at subtidal coastal sites withdiffering sediment composition. Mar Ecol Prog Ser 259:103–115
Sondergaard M, Kristensen P, Jeppesen E (1992) Phosphorusrelease from resuspended sediment in the shallow andwind-exposed Lake Arresoe, Denmark. Hydrobiologia228:91–99
Steele JH, Baird IE (1965) The chlorophyll a content of partic-ulate organic matter in the northern North Sea. LimnolOceanogr 10:261–267
Sundbäck K, Miles A, Göransson E (2000) Nitrogen fluxes,denitrification and the role of microphytobenthos inmicrotidal shallow-water sediments: an annual study. MarEcol Prog Ser 200:59–76
Tengberg A, Almroth E, Hall P (2003) Resuspension and itseffects on organic carbon recycling and nutrient exchangein coastal sediments: in situ measurements using newexperimental technology. J Exp Mar Biol Ecol 285/286:119–142
Tennekes H, Lumley JL (1972) A first course in turbulence,15th edn. The MIT Press, Cambridge, MA
Thomsen L, Gust G (2000) Sediment erosion thresholds andcharacteristics of resuspended aggregates on the western
European continental margin. Deep-Sea Res I 47:1881–1897
Thrush SF, Whitlatch RB, Pridmore RD, Hewitt JE, CummingsVJ, Wilkinson MR (1996) Scale-dependent recolonization:the role of sediment stability in a dynamic sandflat habitat.Ecology 77:2472–2487
Trefry JH, Metz S, Nelson TA, Trocine RP, Eadie BJ (1994)Transport of particulate organic carbon by the MississippiRiver and its fate in the Gulf of Mexico. Estuaries 17:839–849
Trice TM, Glibert PM, Lea C, Van Heukelem L (2004) HPLCpigment records provide evidence of past blooms of Aure-ococcus anophagefferens in the coastal bays of Marylandand Virginia, USA. Harmful Algae 3:295–304
Tsai CH, Lick W (1986) A portable device for measuring sedi-ment resuspension. J Gt Lakes Res 12:314–321
Van Heukelem L, Thomas CS (2001) Computer-assisted high-performance liquid chromatography method developmentwith applications to the isolation and analysis of phyto-plankton pigments. J Chromatogr A 910:31–49
Van Heukelem L, Thomas CS (2005) The HPL method, Chap5. In: Hooker SB, Van Heukelem L, Thomas CS, ClaustreH and others (eds) The second SeaWiFs HPLC AnalysisRound Robin Experiment (SeaHARRE-2). NASA/TM-2005-212785, Washington, DC, p 88–89, Table 50
Wainright SC (1990) Sediment-to-water fluxes of particulatematerial and microbes by resuspension and their contribu-tion to the planktonic food web. Mar Ecol Prog Ser 62:271–281
Wainright SC, Hopkinson CS (1997) Effects of sedimentresuspension on organic matter processing in coastal envi-ronments: a simulation model. J Mar Syst 11:353–368
Welschmeyer NA (1994) Fluorometric analysis of chlorophylla in the presence of chlorophyll b and phaeopigments.Limnol Oceanogr 39:1985–1992
White JR, Roman MR (1992) Seasonal study of grazing bymetazoan zooplankton in the mesohaline ChesapeakeBay. Mar Ecol Prog Ser 86:251–261
Willows RI, Widdows J, Wood RG (1998) Influence of an infau-nal bivalve on the erosion of an intertidal cohesive sedi-ment: a flume and modeling study. Limnol Oceanogr43:1332–1343
Wootton JT (2002) Indirect effects in complex ecosystems:recent progress and future challenges. J Sea Res 48:157–172
Wright SW, Jeffrey SW, Mantoura RFC (1997) Evaluationmethods and solvents for pigment extraction. In: JeffreySW, Mantoura RFC, Wright SW (eds) Phytoplankton pig-ments in oceanography: guidelines to modern methods,Vol 10. Monographs on oceanographic methodology.UNESCO Publishing, Paris, p 261–282
Yallop ML, De Winder B, Paterson DM, Stal LJ (1994) Com-parative structure, primary production and biogenic stabi-lization of cohesive and non-cohesive marine sedimentsinhabited by microphytobenthos. Estuar Coast Shelf Sci39:565–582
Zimmermann CF, Keefe CW, Basche J (1997) EPA Method440.0. Determination of carbon and nitrogen in sedimentsand particulates of estuarine/coastal waters using elemen-tal analysis. National Exposure Research Laboratory,Office of Research and Development, US EnvironmentalProtection Agency, Cincinnati, OH. Available at: www.epa.gov/microbes/m440_0.pdf (accessed 14 June 2010)
53
Editorial responsibility: Graham Savidge,Portaferry, UK
Submitted: December 23, 2009; Accepted: June 22, 2010Proofs received from author(s): August 17, 2010