effect of phytoplankton bloom deposition on benthic
TRANSCRIPT
AQUATIC MICROBIAL ECOLOGYAquat Microb Ecol
Vol. 48: 241–254, 2007 Published August 9
INTRODUCTION
The Belgian Continental Shelf (BCS) is a well mixed,nutrient-rich part of the North Sea (Brussaard et al.1995), which is characterized by high primary produc-tion and algal biomass (Joint & Pomroy 1993) with astrong seasonality. During spring, Belgian coastalwaters are dominated by intense blooms of Phaeocys-tis colonies co-occurring with diatom blooms (Reid etal. 1990, Joint & Pomroy 1993, Brussaard et al. 1995).Phaeocystis blooms occur between April and May andlast for 20 to 40 d, while diatoms can be present
throughout the year with dense blooms occurring asearly as February and smaller blooms as late asSeptember (Reid et al. 1990, Rousseau et al. 2002).
The sedimentation of the phytoplankton bloom rep-resents a major source of organic matter for the benthicsystem (see Billen et al. 1990, Graf 1992). In areas witha strong seasonal cycle of phytoplankton, as in coastalareas, a corresponding seasonality is to be expected inthe sedimentation pattern and therefore in the input oforganic matter into the benthic system.
It has previously been reported that nematodesresponded to a spring bloom deposition by an increase
© Inter-Research 2007 · www.int-res.com*Email: [email protected]
Effect of phytoplankton bloom deposition onbenthic bacterial communities in two contrasting
sediments in the southern North Sea
M. A. Franco1, 2,*, I. De Mesel1, M. Demba Diallo3, K. Van der Gucht3,D. Van Gansbeke1, P. van Rijswijk4, M. J. Costa2, M. Vincx1, J. Vanaverbeke1
1Marine Biology Section, Biology Department, Ghent University, Krijgslaan 281 (S8), 9000 Ghent, Belgium2Instituto de Oceanografia, Faculty of Sciences, University of Lisbon, Campo Grande, 1749-016 Lisbon, Portugal
3Laboratory of Microbiology, Ghent University, KL Ledeganckstraat 35, 9000 Ghent, Belgium4NIOO-KNAW Centre for Estuarine and Marine Ecology, Korringaweg 7, 4401 NT Yerseke, The Netherlands
ABSTRACT: The response of benthic bacterial community composition, diversity, and biomass tophytoplankton deposition was investigated in 2 different sediment horizons at 2 contrasting sites inthe southern North Sea. Differences in bacterial community composition between stations wereobserved. Seasonal differences in bacterial community composition were significant and werestronger in fine sediments, probably related to stronger fluctuations in food availability. Variation incommunity composition over the vertical sediment profile was different for both stations. In coarsersediment, the difference was mostly due to the absence of certain operational taxonomic units (OTUs)at the surface, while in fine sediment, 2 distinct communities were present. A RELATE test revealedthat bacterial community composition was influenced by the amount of labile organic matter (esti-mated through chl a concentration in the sediment). Diversity in terms of OTU richness and Shannon-Weaver diversity index was higher in finer grained sediments. In coarser sediments, diversity at thesurface layer was lower, which might be related to stronger hydrodynamic pressure at this station.These differences were not observed at the other station. Seasonal changes in diversity were notdetected at either station. Bacterial biomass was slightly higher in finer sediments and was not corre-lated with either chl a or temperature. Seasonal differences in bacterial biomass followed thoseobserved for community composition, while no vertical differences were detected.
KEY WORDS: Benthic bacteria · North Sea · Denaturing gradient gel electrophoresis · DGGE ·Community composition · Diversity · Bacterial biomass
Resale or republication not permitted without written consent of the publisher

Aquat Microb Ecol 48: 241–254, 2007
in both density and diversity, especially among theselective deposit-feeding nematodes (1A-nematodes;Wieser 1953, Vanaverbeke et al. 2004b) and deposit-feeding nematodes (1B-nematodes; Wieser 1953, M.Steyaert et al. unpubl.). This was partially explainedby changes in bacterial diversity (Vanaverbeke et al.2004b), since both 1A and 1B nematodes feed on bac-teria (Wieser 1953), and nematodes can selectivelyfeed on particular bacterial strains (Moens et al. 1999,De Mesel et al. 2004).
Bacteria have been reported to react fast on phyto-plankton sedimentation in terms of biomass production(larger cells), cell division, and activity, which resultsin an increase in biomass, density, and productivity(Graf et al. 1982, Meyer-Reil 1983, Goedkoop & John-son 1996, Boon et al. 1998). This response of the bacte-rial community to an input of organic matter seems tobe influenced by the covariation of both food supplyand temperature (Graf et al. 1982, Boon et al. 1998).Van Duyl & Kop (1994) indicated temperature and sub-strate availability for bacteria as the most importantfactors influencing bacterial production.
However, data concerning possible changes in ben-thic bacterial community composition and diversityafter a mass input of organic matter (OM) are lacking.Applying denaturing gradient gel electrophoresis(DGGE) in microbial ecology allows for simultaneousanalyses of multiple samples, which enables monitor-ing the complex dynamics that microbial communitiesmay undergo by diel and seasonal fluctuations or afterenvironmental perturbations (Muyzer 1999). This tech-nique has been applied successfully to documentchanges in planktonic bacterial communities duringphytoplankton bloom events (e.g. Van Hannen et al.1999a, Riemann et al. 2000, Fandino et al. 2001, Rie-mann & Winding 2001, Van der Gucht et al. 2001,Muylaert et al. 2002, Rooney-Varga et al. 2005).
Here we aimed to examine the bacterial response toa pulsed food supply in terms of community composi-tion, diversity, and biomass at 2 well studied contrast-ing sites on the BCS. The 2 study sites, Stns 115bis and330, are biogeochemically different: 115bis is a deposi-tion station, characterized by the presence of fine sed-iments (median grain size: 185 µm), with 4% of mud(M. Steyaert et al. unpubl.), while Stn 330 has perme-able sediment containing medium sand (median grainsize: 329 to 361 µm), devoid of mud (Vanaverbeke et al.2004a,b). This results in strong differences in verticalprofiles of chlorophyll (chl) a, which is a proxy for theavailability of labile OM (Boon & Duineveld 1996).Especially in depositional stations, the differences inavailability of labile OM between sediment depthsduring and after phytoplankton sedimentation can bestriking (Graf 1992), creating very different biogeo-chemical conditions. After sedimentation of phyto-
detritus, the sediment at Stn 115bis can become anoxicand remain so until mid autumn (M. Steyaert et al.unpubl.). As this affects metazoan meiobenthic verticaldistribution patterns (Steyaert et al. 1999, M. Steyaertet al. unpubl.), it probably also has important conse-quences for bacterial life.
In this study, we therefore aimed to test whetherthere are significant differences in bacterial commu-nity composition and biomass (1) between the 2 sta-tions and (2) at the surface and in a deeper sedimentlayer within a station, and (3) whether there are signif-icant seasonal shifts related to the spring bloom depo-sition.
MATERIALS AND METHODS
Study area and sampling. Samples were taken fromthe BCS Stns 115bis, located close to the coast(51° 09.2’ N, 02° 37.2’ E; 13 m depth) and 330, locatedfarther offshore (51° 26.0’ N, 02° 48.5’ E; 20 m depth;Fig. 1). The sampling sites were never located onslopes or tops of sand banks.
Sampling at both stations was conducted monthlyfrom October 2002 to October 2003 from the RVs‘Zeeleeuw’ or ‘Belgica.’ Sampling took place on thesame days at both stations. In December 2002, it wasnot possible to sample station 330 due to bad weatherand sea conditions.
The water column was sampled at 3 m depth and 1 mabove the sea floor for phytoplankton analysis using10 l Niskin bottles. To obtain pigment samples, 500 mlof water from each depth were filtered onto GF/F glassmicrofiber filters (i.d. 4.7 cm) using a vacuum pump.Three replicated samples were obtained. Water tem-perature was recorded simultaneously. The sampleswere kept in the dark and preserved at –20°C on boardand stored at –80°C in the laboratory.
Sediment was sampled using a Reineck box corer(surface area 180 cm2) or another box corer with agreater surface area (February, April, and October2003). The box corer was deployed 3 times at eachsampling station. In February, only 2 box cores wereobtained for station 330.
From each box corer, 2 perspex cores (i.d. 3.6 cm)were taken: 1 for pigment analysis and another forbacterial counts and biomass analysis. These coreswere sliced in 1 cm slices down to 10 cm. Pigment sam-ples were preserved at –20°C on board and stored at–80°C in the laboratory. Bacterial counts and biomasssamples were preserved in a 4% formaldehyde-tapwater solution, thoroughly shaken, and stored in thefridge until processed further.
During February, April, and October 2003, addi-tional cores for bacterial community composition
242

Franco et al.: Effect of bloom deposition on benthic bacteria
analysis (i.d. 6 cm) were taken. The bacterial coreswere carefully closed in order to retain the overlayingwater and preserved at 4°C until further processing inthe laboratory. Additional deployments of the Reineckbox corer or other box corer were done to obtainsamples for bacterial biomass assessment.
Laboratory treatment of samples. The pigments sed-iment samples were weighed and pigment contents(chl a, phaeophytin, and phaeophorbid) were analyzedby HPLC (Gilson) following Wright & Jeffrey (1997).The ratio of phaeopigments to the sum of chl a +phaeopigments (PAP ratio) was calculated as an indi-cation of the freshness of the material deposited on thesediment (Boon et al. 1998).
Samples for bacteria counting were prepared follow-ing Starink et al. (1994). Milli-Q water was added tothe bacterial sample to a volume of 9.5 ml, and 0.5 mlNa2P2O7 (0.2 M) was added to reach a final concentra-tion of Na2P2O7 of 0.01 M. This mixture was sonicated5 times for 30 s using a Soniprep 150 (10 W). Betweensonication pulses, the sample rested on ice for 30 s.Before staining, samples were diluted 10 to 1000×using Tris. A subsample was filtered onto a 0.2 µmpolycarbonate filter and stained with Sybrgold (Molec-ular Probes). Filters were then mounted on a slide.Counting of bacterial cells was performed using aLeica confocal microscope connected to QWIN soft-ware. From every image, 16 scans were made 0.2 µm
vertically apart from each other. In this way, a3.2 µm thick image was analyzed. From eachscan, all particles >0.2 µm were counted andallocated to a size class. Per slide, 50 to 100images were analyzed. The volume of the bac-teria was calculated as a sphere volume (4 × π ×r3 / 3; r = radius), with a radius estimation of halfthe average of lower (L) and upper (U) diame-ters, and was converted to carbon content (bac-terial biomass) by using a conversion factor of310 fg of C µm–3 (Fry 1990). Biomass was there-fore calculated as: {4 × 3.141593 × [(L + U)/ 4]3 /3} × 310. Data from Stn 115bis were onlyavailable from January 2003 onwards.
In a flow bench, 2 subsamples were takenfrom each of the sediment cores using a sterilesyringe from which the tip was removed. Fromeach of the 2 subsamples, the layers between0 to 1 and 4 to 5 cm (1 ml each) were preservedat –80ºC until further processing.
Although in most occasions 3 replicates perstation and sediment layers were obtained,methodological problems prevented completesampling for station 115bis in February (2replicates from the 0 to 1 cm layer), in April(1 replicate from the 4 to 5 cm layer), and inOctober (2 replicates from the 4 to 5 cm layer).
DNA extraction. Total DNA was extracted fromabout 1.5 g of sediment following the procedure ofDemba Diallo (2003). Sediment (1.5 g) was mixed with1.5 ml Na2HPO4 (0.1 M) and washed by shaking for30 min at room temperature. After centrifugation at7000 × g (10 min at 4°C), the supernatant was re-moved. The pellet was resuspended in 500 µl of lysisbuffer (2% cetyltrimethylammonium bromide [CTAB],0.15 M NaCl, 0.1 M Na2EDTA [pH 8], 1% polyvinylpolypyrrolidone [PVPP]), and 7.5 mg lysozyme (Sigma)were added. Samples were incubated overnight at37°C. We added 25 µl of proteinase K (20 mg ml–1,Boehringer), and the tubes were incubated at 50°C for40 min. The temperature was increased to 65°C for20 min, and 300 µl extraction buffer (0.2 M NaCl, 0.1 MTris-HCl pH 8, 2% SDS) were added. The mixture wasthen incubated at 65°C for another 10 min. After addi-tion of 350 µl of 5 M NaCl, the samples were cooled onice for 15 min. The supernatant was collected aftercentrifugation (7000 × g, 10 min, 4°C) and transferredinto 2 ml centrifuge tubes. To precipitate the crudeDNA, 75 µl of 5 M potassium acetate (Kac) and 250 µl40% polyethylene glycol 8000 (PEG) were added, andthe mixture was incubated at –80°C for 1 h. The pellet,obtained by centrifugation (13 000 × g for 15 min at4°C), was resuspended in 900 µl 2× CTAB (2% CTAB,1.4 M NaCl, 0.1 M Na2EDTA) and incubated for 15 minat 68°C. After addition of 900 µl of chloroform, the solu-
243
Fig. 1. Sampling stations 115bis and 330 on the Belgian continentalshelf
Aquat Microb Ecol 48: 241–254, 2007
tion was gently mixed and centrifuged at 13 000 × g for10 min at room temperature. The DNA was precipi-tated by addition of 1 ml of isopropanol and incubatedfor at least 15 min at 20°C. The pellet, obtained by cen-trifugation (13 000 × g for 15 min at 4°C), was dissolvedin 450 µl 2.5 M ammonium acetate (NH4OAc), and sub-sequently the DNA was precipitated by the addition of1000 µl 95% ethanol and then incubated for at least15 min at –20°C. The pellet of DNA was obtained bycentrifugation at 13 000 × g for 15 min at 4°C and re-suspended in 200 µl sterile water (Sigma). For eachsediment sample, we performed 2 independent 1.5 gsediment preparations, of which the purified DNAsamples were pooled and stored in a single vial. A100 µl aliquot of the crude extract was further purifiedusing the Wizard® DNA CleanUp kit (Promega).
PCR amplification of 16S rDNA. In total, 6 µl (ca.100 ng) of the purified DNA were amplified in aGenius temperature cycler. For each sample, 2 PCRswere performed. The PCR mixture contained 6 µl oftemplate DNA, 0.5 µM of each of the appropriateprimers, 200 µM of each deoxynucleoside triphos-phate, 5 µl of 10× PCR buffer (100 mM Tris-HCl pH 9),500 mM KCl, 15 mM MgCl2, 20 ng of bovine serumalbumin, and 2.5 U of Taq DNA polymerase (Ampli-Taq Perkin Elmer). Each mixture was adjusted to afinal volume of 50 µl with sterile water (Sigma).
The primers were: F357GC (5’-CGCCCGCCGCGC-CCCGCGCCCGGCCCGCCGCCCCCGCCCCCCTACGGGAGGCAGCAG-3’) and R518 (5’-ATTACCGCGGCTGCTGG-3’). Both primers, which were designedby Muyzer et al. (1993), are used to amplify the 16SrDNA region corresponding to positions 341 to 534 inEscherichia coli. Primer F357GC, which contains a GC-rich clamp, is specific for most bacteria, and R518 isspecific for most Bacteria, Archaea, and Eucarya (VanHannen et al. 1999b). In order to improve the specificityof the amplification and to reduce the formation of spu-rious by-products, a ‘touchdown’ PCR (Don et al. 1991,Muyzer et al. 1993) was performed starting with 5 minat 94°C, followed by 20 cycles of denaturation at 94°Cfor 1 min, annealing at 65°C (the temperature was de-creased by 0.5°C every cycle until the touchdown tem-perature of 56°C was reached) for 1 min, and primer ex-tension at 72°C for 1 min. Ten additional cycles werecarried out at an annealing temperature of 55°C. Thetubes were then incubated for 10 min at 72°C. Thepresence of PCR products and their concentration weredetermined by analyzing 5 µl of PCR product on a 2%agarose gel. A molecular weight marker (Smartladder-Eurogentec SA) was included.
Denaturing gradient gel electrophoresis (DGGE)analysis. The DGGE technique was carried out usingthe D-Code System (Bio-Rad Laboratories). The PCRproducts were loaded onto 8% (w/v) polyacrylamide
gels of 1 mm thickness, in 1× TAE buffer (20 mM Tris-acetate with pH 7.4, 10 mM acetate, 0.5 mM disodiumEDTA). The denaturing gradient contained 35% to70% denaturants (100% denaturant corresponded to7 M urea and 40% [vol/vol] deionized formamide). Thetotal lane intensity was normalized between the sam-ples at 400 ng of DNA. Electrophoresis was performedat a constant voltage of 75 V for 16 h and at a constanttemperature of 60°C. After electrophoresis, the gelswere stained for 1 h in 1× TAE containing ethidiumbromide (0.5 mg l–1; Muyzer et al. 1993). The bandswere visualized on a UV transillumination tableequipped with a digital CCD camera.
As standards, we used a mixture of DNA from 9clones (Van Der Gucht et al. 2001). On each gel, 3 stan-dard lanes were analyzed in parallel to the samples, tofacilitate comparison between gels. The bandingpatterns were then analyzed using Bionumerics 5.1(Applied Maths BVBA). By measuring an optical den-sity profile through each lane (corresponding to a sin-gle sample), this software identifies the band positionsand calculates the contribution of the intensity of eachband to the total intensity of the lane. This procedureyields a matrix with the relative intensity of each bandin all samples.
Bacterial biodiversity. Ecological diversity is consid-ered a function of the number of different classes (rich-ness) and the relative distribution of individuals amongthese classes (evenness; Washington 1984). By treatingeach band as an individual ‘operational taxonomicunit’ (OTU), the richness (number of OTUs present)and the Shannon-Weaver diversity index (H’; Shannon& Weaver 1963) were calculated using PRIMER 5. Asrare populations (less than 1% of the total community)might not be represented in a DGGE gel (Muyzer et al.1993), the bacterial community richness (total numberof OTUs detected) and diversity (Shannon-Weaverdiversity index) calculated here only refer to the domi-nant bacteria populations and should be interpreted asan indicator of the minimum diversity of the bacterialcommunity.
Statistical analysis. All correlation tests were doneusing Spearman rank R. STATISTICA 6 software wasused, and a confidence level of 0.05 was considered inall test procedures.
The analysis of the banding profiles of the DGGEgels was done by multivariate tests using PRIMER 5software. All tests were carried out on log (x+1) trans-formed data. The Bray-Curtis index was used as a sim-ilarity coefficient. A multi-dimensional scaling (MDS)analysis places samples in a multi-dimensional space,based on the similarities between them. In 2D ordina-tion plots, similar samples are therefore placedtogether (Clarke 1993). The relative intensity of eachband was therefore taken into account, which appears
244
Franco et al.: Effect of bloom deposition on benthic bacteria
to be more appropriate than using only presence/absence of the bands (Muylaert et al. 2002).
One-way analysis of similarity (ANOSIM) was usedto test for statistical differences between the commu-nity composition of the 2 stations (115bis and 330). Foreach station, a 2-way crossed ANOSIM was used totest for statistical differences between the communitycomposition at different depths (0 to 1 cm and 4 to5 cm) and the sampling months February, April, andOctober 2003 (Clarke 1993). Whenever significantdifferences were found, pairwise tests were done.
The relationship between chl a and the communitystructure was assessed by calculating rank correlationsbetween similarity matrices derived from chl a concen-tration in the sediment and the banding profiles(RELATE procedure) using the software packagePRIMER 5. The same RELATE test was used betweensimilarity matrices derived from bacterial counts persize class and bacterial biomass per size class.
One-way and 2-way analyses of variance (ANOVA)were performed to test for statistical differences in theShannon-Weaver diversity index and OTU richnessand in the bacterial counts and biomass for the monthsof February, April, and October 2003. Homogeneity ofvariances was tested using Hartley F-max, Cochran C,and Bartlett χ¯2, and data were transformed whenevernecessary. Whenever significant differences werefound, a posteriori Tukey HSD tests were performed.One-way ANOVA was used to test for significant dif-ferences between the 2 stations. A 2-way ANOVA wasused to test for the effect of depth, time, and their inter-action for bacterial counts and biomass at both stationsand for the Shannon-Weaver diversity index and OTUrichness at Stn 330. At Stn 115bis, due to the lack ofreplication in April in the 4 to 5 cm layer, a 2-wayANOVA could not be performed on the Shannon-Weaver diversity index and OTU richness. One-wayANOVA was then used to test for significant differ-ences between the sampling dates in the 0 to 1 cmlayer; a t-test was used to test for significant differ-ences between the sampling dates February and Octo-ber for the 4 to 5 cm layer, and a 1-way ANOVA wasperformed to test for statistical differences between the2 sampling depths. STATISTICA 6 software was used,and a significance level of 0.05 was considered in alltest procedures.
RESULTS
Environmental variables
At both stations, the surface and bottom water showedcomparable concentrations of chl a, indicating a well-mixed water column (Fig. 2). At Stn 115bis, the chl a con-
centration in the water was on most occasions higherthan at Stn 330. Chl a concentrations in the water at bothstations started rising in February, peaked in April(48 mg m–3 at Stn 115bis and 32 mg m–3 at Stn 330), anddecreased afterwards (Fig. 2). Smaller peaks were ob-served in July for both stations and only at Stn 330 inSeptember, reaching values no higher than 17 mg m–3.
At the sediment surface, chl a concentrations wereconsiderably higher at Stn 115bis than at Stn 330(Fig. 3) throughout the sampling period and followedthe patterns observed in the water column, with a peakin April. At Stn 330, other smaller peaks were observedin August and October 2003, corresponding to thedeposition of the late summer and autumn blooms. Forboth stations, chl a in the bottom water was correlatedwith the chl a at the sediment surface (115bis: R = 0.73,p < 0.05; 330: R = 0.62, p < 0.05).
At Stn 115bis, the PAP ratio was relatively low inwinter, started increasing in April, and remained rela-tively stable until it reached the highest value in Octo-ber 2003. At Stn 330, the PAP ratio varied moreabruptly, showing a similar value in winter, decreasingabruptly in April, and peaking 2 mo later. From Juneonwards, the PAP ratio decreased gradually (Fig. 3).
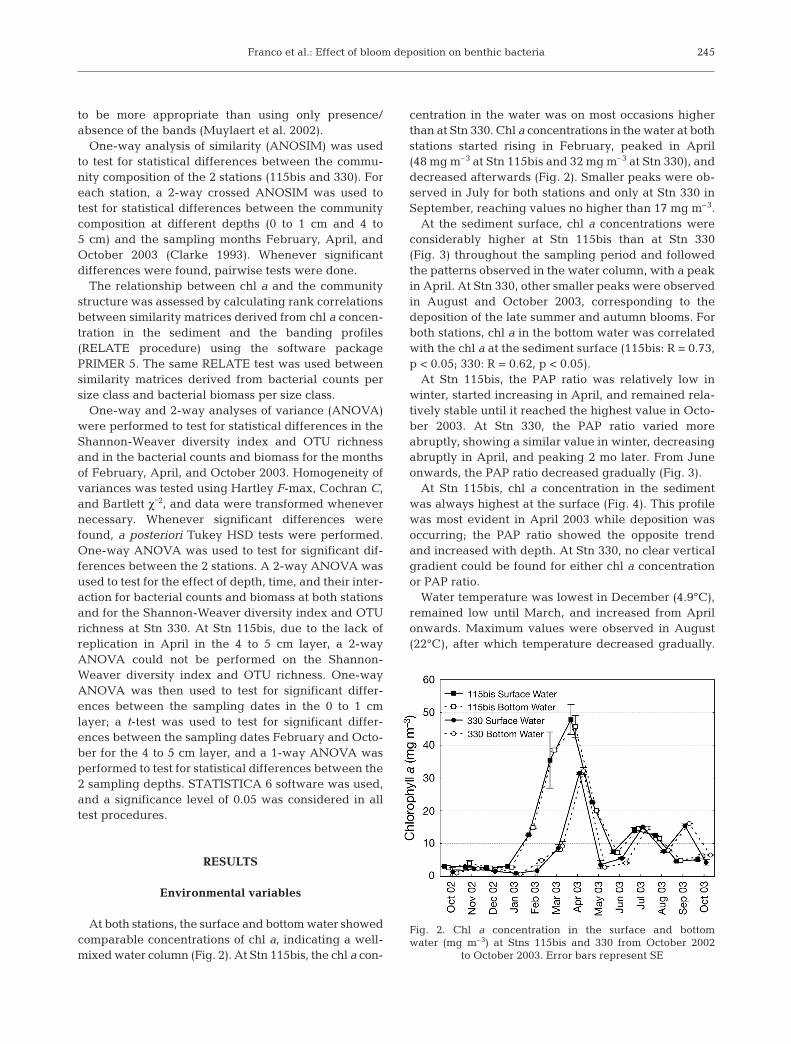
At Stn 115bis, chl a concentration in the sedimentwas always highest at the surface (Fig. 4). This profilewas most evident in April 2003 while deposition wasoccurring; the PAP ratio showed the opposite trendand increased with depth. At Stn 330, no clear verticalgradient could be found for either chl a concentrationor PAP ratio.
Water temperature was lowest in December (4.9°C),remained low until March, and increased from Aprilonwards. Maximum values were observed in August(22°C), after which temperature decreased gradually.
245
Fig. 2. Chl a concentration in the surface and bottomwater (mg m–3) at Stns 115bis and 330 from October 2002
to October 2003. Error bars represent SE

Aquat Microb Ecol 48: 241–254, 2007
Bacterial biomass
Bacterial counts varied between 1.9 (± 0.3 SE) and14.1 (± 0.9 SE) × 1012 m–2 at Stn 115bis and between 2.0(± 0.9 SE) and 10.6 (± 4.6 SE) × 1012 m–2 at Stn 330(Fig. 5). Bacterial counts were strongly correlated withbacterial biomass (R = 0.94; p < 0.001). Moreover, whentaking into account the bacterial counts and biomassdistributed per size class, a RELATE test revealed astrong relationship between both variables (ρ = 0.90;p < 0.01). Both tests indicated that bacterial counts andbacterial biomass varied in the same way. Therefore,the results are focused on bacterial biomass, assumingbacterial counts varied in the same way.
The bacterial biomass ranged from 0.2 (± 0.1 SE) to2.8 (± 0.8 SE) gC m–2 at Stn 115bis and from 0.2(± 0.1 SE) to 1.9 (± 0.8 SE) gC m–2 at Stn 330, showingdifferent seasonal patterns when comparing both sta-tions (Fig. 5). Bacterial biomass at Stn 115bis was muchmore variable than at Stn 330. Bacterial biomass waslow in January and February 2003. Peak values werereached in March 2003, with intermediate values inApril and May 2003. A progressive decrease towardinitial values was then observed. Bacterial biomass atStn 330 was lower compared to Stn 115bis, fluctuatingaround 1 gC m–2 from January to July 2003. Prior toand after that period, bacterial biomass values wereconsiderably lower. Biomass at 4 to 5 cm resembledthat in the upper layer in all seasons at both stations(Fig. 5). Biomass showed no correlation with eitherchl a or temperature (p > 0.05) at either station.
Analyzing bacterial biomass for the sampling dates ofFebruary, April, and October 2003, no statistical differ-ences were observed between the 2 stations (F = 0.243,df = 1, p > 0.05). At Stn 115bis, significant differenceswere found between sampling dates (F = 5.24, df = 2,p < 0.05) but not between layers (F = 0.08, df = 1, p >0.05), nor for the interaction term (F = 0.35, df = 2, p >0.05). Post hoc comparisons showed that April signifi-cantly differed from February and October. At Stn 330,significant differences were found between samplingdates (F = 5.99, df = 2, p < 0.05) but not between layers(F = 0.56, df = 1, p > 0.05) nor for the interaction term(F = 0.77, df = 2, p > 0.05). Post hoc comparisons showedthat April and October were significantly different.
Bacterial community composition
Each band on the DGGE represents one OTU(Fig. 6). In this study, 52 different OTUs were identi-fied. Only 25 of these were detected at both stations; 21were found only at Stn 115bis and 6 only at Stn 330.Twenty-one of the 52 OTUs were detected during the3 sampling campaigns, while 15 were restricted to 1sampling period. Sixteen OTUs were detected in only1 of the 2 layers. Five OTUs were only detected once.A 1-way ANOSIM considering all the samples showedsignificant differences between the 2 sampling stations(Global R = 0.721; p < 0.05).
MDS carried out for both stations separately re-vealed seasonal and vertical differences in bacterial
246
Fig. 3. Chl a concentration in the sediment (mg m–2) and the ratio of phaeopigments to chl a + phaeopigments (PAP ratio)for the 0 to 1 cm layer at Stns 115bis and 330 from October 2002 to October 2003. Error bars represent SE. Note different scales
on left y-axes
Franco et al.: Effect of bloom deposition on benthic bacteria 247
Fig. 4. Vertical profiles of chl a concentration (mg m–2) and ratio of phaeopigments to chl a + phaeopigments (PAP ratio) in thesediment at Stns 115bis and 330 in February, April, and October 2003. Error bars represent SE. Note different scales on top x-axes

Aquat Microb Ecol 48: 241–254, 2007
community composition (Fig. 6). When consideringStn 115bis, a 2-way crossed ANOSIM showed signifi-cant differences between the sampling months (GlobalR = 0.991, p < 0.05) and sediment depths (Global R =0.788, p < 0.05). When considering pairwise tests(Table 1), all sampling months were significantly dif-ferent from each other (p < 0.05). At Stn 330, the 2-waycrossed ANOSIM again showed significant differencesbetween sampling months (Global R = 0.884, p < 0.05)
and depth layers (Global R = 0.726, p < 0.05). Pairwisetests (Table 1) revealed that communities in Octoberwere significantly different (p < 0.05) from those inFebruary and April, while no differences were foundbetween the 2 latter months (p > 0.05).
The bacterial community composition at both stationsat all time and depths was significantly influenced bythe chl a concentration in the sediment as shown by thesignificant RELATE test (ρ = 0.26, p < 0.05).
Bacterial biodiversity
Both OTU richness and the Shannon-Weaver diversity index were relativelyhigher at Stn 115bis than at Stn 330(Fig. 7). At Stn 115bis, OTU richness andShannon-Weaver diversity index weresimilar for both sediment layers and forall seasons, with lower values detectedonly in the 4 to 5 cm layer in April. TheOTU richness and Shannon-Weaverdiversity index of the communities at Stn330 were lower in the surface layer thanin the 4 to 5 cm layer and showed minorchanges with time. The sample from 4 to5 cm in April at Stn 115bis was removedfrom the statistical analysis, since it hadno replication. A 1-way ANOVA per-formed on the Shannon-Weaver diversityindex showed significant differencesbetween the 2 stations (F = 15.20, df = 1,p < 0.001). At Stn 115bis, no significantdifferences were found between sam-pling dates for the 0 to 1 cm layer (F =
248
Fig. 5. Bacterial biomass (gC m–2 of sediment) in the 0 to 1 cm layer from Stns 115bis and 330 from October 2002 to October 2003.In February 2003, April 2003, and October 2003, the values for the 4 to 5 cm layer are also indicated. Error bars represent SE
Fig. 6. Example of DGGE gels and MDS analysis of the microbial communityfrom Stns 115bis and 330 of the sampling campaigns in February 2003(squares), April 2003 (triangles), and October 2003 (circles), in the 0 to 1 cm(white) and 4 to 5 cm (black) sediment layers. M: molecular weight marker

Franco et al.: Effect of bloom deposition on benthic bacteria
0.035, df = 2, p > 0.05); a t-test showed no significantdifferences between February and October for the 4 to5 cm layer (t = 0.071, p > 0.05), and a 1-way ANOVAshowed no significant differences between the 2 depthlayers (F = 0.129, df = 1, p > 0.05). At Stn 330, a 2-wayANOVA showed significant differences between thedepth layers (F = 14.310, df = 1, p < 0.05) but notbetween sampling months (F = 0.540, df = 2, p > 0.05),nor when combining both effects (F = 1.312, df = 2, p >0.05). The same analyses performed on the OTU rich-ness showed the same significant differences as shownby the bacterial Shannon-Weaver diversity index.
DISCUSSION
Environmental variables
As described previously (Vanaverbeke et al.2004a,b, M. Steyaert et al. unpubl.) a strong phyto-plankton bloom occurred in spring as indicated by theseasonal pattern of the concentration of chl a in thewater column. The higher chl a concentration in thewater column at Stn 115bis during the spring phyto-
plankton bloom was to be expected, since primary pro-duction is higher closer to the coast (Joint & Pomroy1993).
Patterns of chl a concentrations in the sediment alsoshowed a strong seasonal signal as already described(Vanaverbeke et al. 2004a,b, M. Steyaert et al.unpubl.), but in contrast to the water column values,differed considerably between the stations. Chl a con-centration at the sediment surface at Stn 115bis wasabout 10× higher than at Stn 330. This, together withthe absence of clear vertical profiles in the sediment,corroborated the idea that Stn 330 has more permeablesediment, where stronger bottom water currents pre-vent the deposition of sedimenting phytodetritus(Precht & Huettel 2004) and induce subsurface chl apeaks (Ehrenhauss & Huettel 2004, Ehrenhauss et al.2004a). At Stn 115bis, vertical gradients were veryobvious, especially during the deposition of the phyto-plankton bloom, corroborating that 115bis is a deposi-tion station.
The pattern of the PAP ratios showed little seasonalvariation at Stn 115bis compared to Stn 330 (Fig. 3).The comparatively higher PAP ratio at Stn 330 follow-ing bloom senescence indicate a rapid degradation oforganic matter, which is typical of permeable coastalsands (Ehrenhauss et al. 2004b). Advective transportallows fast removal of decomposition products (Huettelet al. 1998) resulting in an up and down fluctuation ofthe PAP ratio at Stn 330. At Stn 115bis, there was a car-bon build-up (phytodetritus derived) in the sedimentduring spring and subsequent degradation and miner-alization in late summer as previously reported in theNorth Sea for this type of sediment (Boon & Duineveld1998, P. Provoost et al. unpubl.). Therefore, the PAPratio did not show major fluctuations but slowlyincreased toward late summer and autumn.
249
Fig. 7. Shannon-Weaver index (H’) and number of OTUs identified in the bacterial community from Stns 115bis and 330 in thesampling campaigns in February 2003, April 2003, and October 2003, in the 0 to 1 cm and 4 to 5 cm sediment layers. Error bars
represent SE
Stn 115bis Stn 330R statistic Signif. R statistic Signif.
level level
Feb vs. Apr 0.958 0.010* 0.500 0.080Feb vs. Oct 1.000 0.025* 1.000 0.010*Apr vs. Oct 1.000 0.033* 0.944 0.010*
Table 1. Pairwise test for bacterial community composition inthe different sampling months for both stations. *p < 0.05

Aquat Microb Ecol 48: 241–254, 2007
Bacterial biomass
Bacterial counts make no distinction between dead,active, or inactive bacteria. Coastal marine sedimentscontain a large fraction of dead or inactive bacteria(Luna et al. 2002), and the percentage of active bacte-ria may change rapidly (Créach et al. 2003). In deepMediterranean sediments, the number of active bacte-ria depends on the organic substrate in the sedimentderived from the photic layer (Luna et al. 2004). How-ever, according to the same study, no relationship wasobserved between total bacterial counts and the con-tent of organic substrates in the sediment. In our study,bacterial biomass, calculated from bacterial counts,also had no correlation with either temperature or chl a(as an indicator of the amount of labile OM) at eitherstation. Both temperature and food availability seem tobe key factors influencing the response of benthic bac-terial communities to an input of organic matter (Grafet al. 1982, Boon et al. 1998), and a relationship be-tween bacterial community composition and chl a con-centration in the sediment was detected. Bacterial bio-mass and/or counts alone might not be a reliableindicator of changes in bacterial activity, although cou-pled with other data, like DGGE banding profiles, theycan help achieve a better understanding of changes inthe bacterial community. A significantly higher bio-mass was detected in April at Stn 115bis (compared toFebruary and October), which can be coupled with theseasonal shifts in bacterial community compositionobserved at this station (discussed below, in ‘Bacterialcommunity composition and diversity’). Also, a signifi-cantly lower biomass detected in October at Stn 330might be the cause of this community compositionbeing significantly different from that in February andApril (discussed below, in ‘Bacterial community com-position and diversity’).
Methodological considerations
As with any PCR and DNA based techniques, DGGEof PCR-amplified 16S rDNA (Muyzer et al. 1993) has itsown methodological limitations, including the inhibi-tion of PCR amplification by co-extracted contami-nants, deferential amplification, or formation of arte-factual PCR products or contaminating DNA, and 16SrRNA sequence variations. Co-migration of DNA, sin-gle bands representing more then 1 bacterial strain orslightly different rRNA gene sequences resulting inmultiple bands are problems that can occur in DGGEgels (Nübel et al. 1996, Palys et al. 1997, Vallaeys etal. 1997). Nevertheless, PCR-mediated analysis of16S rRNA is a powerful tool for the determination ofmicrobial diversity of environmental ecosystems (von
Wintzingerode et al. 1997), and DGGE techniques arequite effective when characterizing bacterial commu-nity structure, particularly for monitoring changes inoccurrence and/or relative frequency of the differentbacterial populations (Fromin et al. 2002). Since sam-ples were treated in the same way during the wholestudy, the method allows for a proper comparison ofthe results beyond a mere qualitative approach(Fromin et al. 2002). The Shannon-Weaver index is themost common diversity index generally used by ecolo-gists (Washington 1984) and has also been applied toDGGE fingerprints to estimate bacterial diversity (e.g.Nübel et al. 1999, Boon et al. 2002, Dilly et al. 2004,Haack et al. 2004, Gafan et al. 2005, Xia et al. 2005,Lagacé et al. 2006), even though in a DGGE gel, popu-lations representing less than 1% of the total commu-nity might not be represented (Muyzer et al. 1993).
Bacterial community composition and diversity
Our results showed that bacterial community compo-sition was significantly different at both stations. Only 6of the 52 OTUs were exclusively detected at Stn 330,while 21 OTUs were found exclusively at Stn 115bis(data not shown). OTU richness and Shannon-Weaverdiversity index were mostly higher at Stn 115bis than atStn 330, especially at the sediment surface. This may bea reflection of higher food availability at Stn 115bis, sincesubstrate availability affects the bacterial communitycomposition (Van Hannen et al. 1999a, Muylaert et al.2002) and a high concentration of potentially availablesubstrate can sustain a higher bacterial diversity (Luna etal. 2004). Even though we did not detect the whole com-munity by means of DGGE, the results on the dominantOTU (relative density higher than 1%) seem to indicatea relatively more diverse community at Stn 115bis.
In bacterioplankton, both free-living bacteria andparticle-associated bacteria can occur as 2 distinctcommunities (Fandino et al. 2001, Riemann & Winding2001, Rooney-Varga et al. 2005), although this shouldnot be generalized (Sapp et al. 2007). If this were truefor the sediment as well, we would expect thatthe establishment of free-living bacteria populationswould become more difficult at Stn 330 due to the highbottom water currents and the permeability of the sed-iment. This would be more evident at the surface of thesediment, where our results indicate the lowest bacte-rial diversity for Stn 330. At Stn 115bis with no suchcurrents, both free-living and attached bacteria couldcoexist as they can in the plankton.
Another factor that could be responsible for differentcommunity composition at both stations is the possiblecoexistence of aerobic and anaerobic bacteria at Stn115bis. At this station, the sediment becomes reduced
250
Franco et al.: Effect of bloom deposition on benthic bacteria
after a spring bloom (M. Steyaert et al. unpubl.), whileat Stn 330, sediments at the depths studied are wellaerated (Vanaverbeke et al. 2004a,b).
Significant vertical differences in bacterial commu-nity composition were observed at both stations, whichmight have different causes at each station. Only1 OTU was found exclusively at the surface layer atStn 330. This OTU was also found exclusively at thesurface layer at Stn 115bis. All other OTU encounteredat the surface were also found in the 4 to 5 cm layer,generally with relatively higher densities. TwelveOTUs were found exclusively in the 4 to 5 cm layer atStn 330, half of which were also observed at thesediment surface at Stn 115bis (data not shown). Thedifferences in the community composition between the2 layers at Stn 330 were a consequence of the non-detection of certain bacterial populations at the surfaceof the sediment. Bacterial populations in the upperlayers of Stn 330 might not be able to cope with thehigh hydrodynamic stress (advective currents throughthe sediment) prevailing there (Precht & Huettel 2004),which results in both lower Shannon-Weaver diversityindex and number of OTUs, and different bacterialcommunity composition compared to deeper layers.
At Stn 115bis, 10 OTUs were found exclusively at thesurface and 8 OTUs only in the 4 to 5 cm layer (data notshown), indicating that at this station different commu-nities might have developed at each layer. If the sam-ple from the 4 to 5 cm layer in April at Stn 115bis wasomitted, no significant differences were observed inthe Shannon-Weaver diversity index and OTU rich-ness between layers, even though community compo-sition was different. At this sampling occasion, it wasonly possible to obtain 1 replicate for the 4 to 5 cmlayer. The DNA extraction and consequent PCR wasnot as successful as for other samples. Since bacterialbiomass was not lower, this might be related to chemi-cal inhibition. Because there was no replication, resultsreferring to the 4 to 5 cm layer layer at Stn 115bis inApril should be interpreted with care.
Steep vertical gradients in chl a concentration andPAP ratio were registered at station 115bis. Moreover,deep sediment layers at this station showed strongnegative redox potential values and a build-up of NH4
+
(M. Steyaert et al. unpubl.). Vertical differences in thebenthic bacterial community have previously been re-ported (Luna et al. 2004) in Mediterranean sedimentswith oxygen depletion problems in which the verticaldifferences in the bacterial community were closely re-lated to redox potential changes (Urakawa et al. 2000).
The statistical analysis of the DGGE fingerprints alsoshowed that bacterial community composition at bothstations changed with time. In the planktonic system,shifts in plankton species composition are responsible forchanges in the attached bacterial community composi-
tion (Rooney-Varga et al. 2005). Carbon-rich mucilagesedimentation, as secreted by Phaeocystis, can be a post-bloom food source (Riebesell et al. 1995). Experimentaldegradation of such compounds in agar from differentsources and under different oxygen conditions pre-sented very different microbial communities with only afew overlapping species (Janse et al. 2000). Changes inorganic matter quality and quantity can induce shifts inbacterial community structure (Luna et al. 2004). There-fore, seasonal changes in food availability and oxygena-tion are likely to produce distinct bacterial communities.This was supported by the significant RELATE testobserved between the bacterial community compositionand the concentration of chl a in the sediment.
Temporal differences in bacterial composition werestronger at Stn 115bis, where all sampling monthswere significantly different from each other. Also, thepercentage of OTUs that were present in the 3 sam-pling campaigns was lower at Stn 115bis than at Stn330 (data not shown), indicating higher shifting of thebacterial populations at this station. Moreover, bacter-ial biomass was higher in April, implying shifts in bac-terial biomass from February to April and again fromApril to October. Stronger variations in chl a concen-tration in the sediment at Stn 115bis, probably alsorelated to shifts in bacterial biomass, would implyhigher temporal differences in the bacterial commu-nity composition at Stn 115bis.
Besides food availability, the oxygenation of the sed-iment can also change more drastically at Stn 115bis(M. Steyaert et al. unpubl.), which is not the case forStn 330 where the redox potential remains positivethroughout the studied sediment depths (Vanaverbekeet al. 2004a,b).
At Stn 330, the bacterial community composition inOctober differed from the other 2 sampling campaigns,which was also the case for bacterial biomass. Tempo-ral variability was also present at this station, albeit notstrongly.
Even though the bacterial community compositionchanged with time, such differences were not detectedin the Shannon-Weaver diversity index and OTU rich-ness at Stn 330, nor at Stn 115bis when the samplefrom the 4 to 5 cm layer in April was omitted. At eachstation, we observed that with time OTUs were disap-pearing, new ones were emerging, and others werealways present but their density changed. The regularseasonal environmental changes might be responsiblefor maintenance of diversity, since environmental fluc-tuations can provide temporal niche opportunities,allowing species to coexist (Chesson & Huntly 1997).This does not mean that the same bacteria were notalways present, but changes in dominance might pushcertain bacteria above the detection limit (Hedrick etal. 2000).
251

Aquat Microb Ecol 48: 241–254, 2007
CONCLUSIONS
We have shown that bacterial community composi-tion differed when comparing fine and coarser marinesediments, and our results indicated that diversity ingeneral tends to be higher in finer sediments. Bacterialcommunity composition also differed vertically withinthe sediment, but not in the same way for both sedi-ment types. In the fine sediment, 2 relatively distinctcommunities developed at the surface and deeper inthe sediment. In coarser sediments, vertical differenceswere related mostly to the non-detection of certainbacteria populations at the surface of the sedimentwhere hydrodynamic stress is stronger. Seasonal pat-terns in food availability played a key role in the bacte-rial community composition, which changed moredrastically within fine sediment, where the input oforganic matter was stronger.
These changes in bacterial community may also beof importance when considering higher trophic levels.Changes in nematode community composition afterbloom sedimentation toward feeding types that feedon bacteria has been observed at these 2 stations(Vanaverbeke et al. 2004b, M. Steyaert et al. unpubl.).Vanaverbeke et al. (2004b) hypothesized that anincrease in nematode species richness could have beencaused by an increase in bacterial diversity. Indeed,a shift in bacterial community composition wasobserved.
Acknowledgements. We thank the master and crew of the RVs‘Belgica’ and ‘Zeeleeuw’ for their skillful help during sam-pling. L. Moodley and L. van Ijzerloo are acknowledged fortheir contribution to the sampling and handling of bacterialbiomass samples. Prof. Dr. Jean Swings is acknowledged forallowing us to use his laboratory facilities. This research wasfunded by the Belgian Science Policy (TROPHOS – Contractno. EV/02/25A), UGENT-BOF project 01GZ0705 Biodiversityand Biogeography of the Sea (BBSea) (2005-2010). M.A.F. wasfinancially supported by a PhD grant from the Foundation forScience and Technology (FCT - SFRH/BD/10386/2002). Weacknowledge the support from the MarBEF Network of Excel-lence ‘Marine Biodiversity and Ecosystem Functioning,’ whichis funded by the Sustainable Development, Global Changeand Ecosystems Programme of the European Community’sSixth Framework Programme (contract no. GOCE-CT-2003-505446). This publication is contribution number MPS-07032of MarBEF and publication no. 4074 from NIOO-CEME.
LITERATURE CITED
Billen G, Joiris C, Meyerreil L, Lindeboom H (1990) Role ofbacteria in the North-Sea Ecosystem. Neth J Sea Res 26:265–293
Boon AR, Duineveld GCA (1996) Phytopigments and fattyacids as molecular markers for the quality of near-bottomparticulate organic matter in the North Sea. J Sea Res 35:279–291
Boon AR, Duineveld GCA (1998) Chlorophyll a as a markerfor bioturbation and carbon flux in southern and centralNorth Sea sediments. Mar Ecol Prog Ser 162:33–43
Boon AR, Duineveld GCA, Berghuis EM, van der Weele JA(1998) Relationships between benthic activity and theannual phytopigment cycle in near-bottom water andsediments in the southern North Sea. Estuar Coast ShelfSci 46:1–13
Boon N, De Windt W, Verstraete W, Top EM (2002) Evaluationof nested PCR-DGGE (denaturing gradient gel elec-trophoresis) with group-specific 16S rRNA primers for theanalysis of bacterial communities from different waste-water treatment plants. FEMS Microbiol Ecol 39:101–112
Brussaard CPD, Riegman R, Noordeloos AAM, Cadee GCand 5 others (1995) Effects of grazing, sedimentation andphytoplankton cell-lysis on the structure of a coastalpelagic food web. Mar Ecol Prog Ser 123:259–271
Chesson P, Huntly N (1997) The roles of harsh and fluctuatingconditions in the dynamics of ecological communities. AmNat 150:519–553
Clarke KR (1993) Non-parametric multivariate analyses ofchange in community structure. Aust J Ecol 18:117–143
Créach V, Baudoux AC, Bertru G, Le Rouzic B (2003) Directestimate of active bacteria: CTC use and limitations.J Microbiol Methods 52:19–28
Demba Diallo M (2003) Molecular study of the microbial com-munity in pasture soil under Acacia tortilis subsp. raddi-ana and Balanites aegyptiaca in North Senegal. PhDthesis, Ghent University
De Mesel I, Derycke S, Moens T, Van der Gucht K, Vincx M,Swings J (2004) Top-down impact of bacterivorous nema-todes on the bacterial community structure: a microcosmstudy. Environ Microbiol 6:733–744
Dilly O, Bloem J, Vos A, Munch JC (2004) Bacterial diversityin agricultural soils during litter decomposition. ApplEnviron Microbiol 70:468–474
Don RH, Cox PT, Wainwright BJ, Baker K, Mattick JS (1991)Touch down PCR to circumvent spurious priming duringgene amplification. Nucleic Acids Res 19:503–514
Ehrenhauss S, Huettel M (2004) Advective transport anddecomposition of chain-forming planktonic diatoms inpermeable sediments. J Sea Res 52:179–197
Ehrenhauss S, Witte U, Bühring SL, Huettel M (2004a) Effectof advective pore water transport on distribution anddegradation of diatoms in permeable North Sea sedi-ments. Mar Ecol Prog Ser 271:99–111
Ehrenhauss S, Witte U, Janssen F, Huettel M (2004b) Decom-position of diatoms and nutrient dynamics in permeableNorth Sea sediments. Cont Shelf Res 24:721–737
Fandino LB, Riemann L, Steward GF, Long RA, Azam F (2001)Variations in bacterial community structure during adinoflagellate bloom analyzed by DGGE and 16S rDNAsequencing. Aquat Microb Ecol 23:119–130
Fromin N, Hamelin J, Tarnawski S, Roesti D and 6 others(2002) Statistical analysis of denaturing gel electrophore-sis (DGE) fingerprinting patterns. Environ Microbiol 4:634–643
Fry JC (1990) Direct methods and biomass estimation.Methods Microbiol 22:41–85
Gafan GP, Lucas VS, Roberts GJ, Petrie A, Wilson M, SprattDA (2005) Statistical analyses of complex denaturinggradient gel electrophoresis profiles. J Clin Microbiol 43:3971–3978
Goedkoop W, Johnson, RK (1996) Pelagic-benthic coupling:profundal benthic community response to spring diatomdeposition in mesotrophic Lake Erken. Limnol Oceanogr41:636–647
252
Franco et al.: Effect of bloom deposition on benthic bacteria
Graf G (1992) Benthic–pelagic coupling — a benthic view.Oceanogr Mar Biol 30:149–190
Graf G, Bengtsson W, Diesner U, Schulz R, Theede H (1982)Benthic response to sedimentation of a spring phytoplank-ton bloom - process and budget. Mar Biol 67:201–208
Haack SK, Fogarty LR, West TG, Alm EW, McGuire JT, LongDT, Hyndman DW, Forney LJ (2004) Spatial and temporalchanges in microbial community structure associated withrecharge-influenced chemical gradients in a contami-nated aquifer. Environ Microbiol 6:438–448
Hedrick DB, Peacock A, Stephen JR, Macnaughton SJ,Bruggemann J, White DC (2000) Measuring soil microbialcommunity diversity using polar lipid fatty acid and dena-turing gradient gel electrophoresis data. J MicrobiolMethods 41:235–248
Huetttel M, Ziebis W, Forster S, Luther GW (1998) Advectivetransport affecting metal and nutrient distributions andinterfacial fluxes in permeable sediments. Geochim Cos-mochim Acta 62:613–631
Janse I, Zwart G, van der Maarel MJEC, Gottschal JC (2000)Composition of the bacterial community degradingPhaeocystis mucopolysaccharides in enrichment cultures.Aquat Microb Ecol 22:119–133
Joint I, Pomroy A (1993) Phytoplankton biomass and produc-tion in the southern North Sea. Mar Ecol Prog Ser 99:169–182
Lagacé L, Jacques M, Mafu AA, Roy D (2006) Compositions ofmaple sap microflora and collection system biofilms eval-uated by scanning electron microscopy and denaturinggradient gel electrophoresis. Int J Food Microbiol 109:9–18
Luna GM, Manini E, Danovaro R (2002) Large fraction ofdead and inactive bacteria in coastal marine sediments:comparison of protocols for determination and ecologicalsignificance. Appl Environ Microbiol 68:3509–3513
Luna GM, Dell’Anno A, Giuliano L, Danovaro R (2004) Bacte-rial diversity in deep Mediterranean sediments: relation-ship with the active bacterial fraction and substrate avail-ability. Environ Microbiol 6:745–753
Meyer-Reil LA (1983) Benthic response to sedimentationevents during autumn to spring at a shallow-water stationin the western Kiel Bight 2. Analysis of benthic bacterial-populations. Mar Biol 77:247–256
Moens T, Verbeeck L, de Maeyer A, Swings J, Vincx M (1999)Selective attraction of marine bacterivorous nematodes totheir bacterial food. Mar Ecol Prog Ser 176:165–178
Muylaert K, Van der Gucht K, Vloemans N, De Meester L,Gillis M, Vyverman W (2002) Relationship between bacte-rial community composition and bottom-up versus top-down variables in four eutrophic shallow lakes. ApplEnviron Microbiol 68:4740–4750
Muyzer G (1999) DGGE/TGGE: a method for identifyinggenes from natural ecosystems. Curr Opin Microbiol 2:317–322
Muyzer G, Dewaal EC, Uitterlinden AG (1993) Profiling ofcomplex microbial populations by denaturing gradient gelelectrophoresis analysis of polymerase chain reaction-amplified genes coding for 16s ribosomal RNA. ApplEnviron Microbiol 59:695–700
Nübel U, Engelen B, Felske A, Snaidr J, Wieshuber A, AmannRI, Ludwig W, Backhaus H (1996) Sequence hetero-geneities of genes encoding 16S rRNAs in Paenibacilluspolymyxa detected by temperature gradient gel electro-phoresis. J Bacteriol 178:5636–5643
Nübel U, Garcia-Pichel F, Kuhl M, Muyzer G (1999) Quantify-ing microbial diversity: morphotypes, 16S rRNA genes,and carotenoids of oxygenic phototrophs in microbial
mats. Appl Environ Microbiol 65:422–430Palys T, Nakamura LK, Cohan FM (1997) Discovery and clas-
sification of ecological diversity in the bacterial world: therole of DNA sequence data. Int J Syst Bacteriol 47:1145–1156
Precht E, Huettel M (2004) Rapid wave-driven advective porewater exchange in a permeable coastal sediment. J SeaRes 51:93–107
Reid PC, Lancelot C, Gieskes WWC, Hagmeier E, Weichart G(1990) Phytoplankton of the North Sea and its dynamics —a review. Neth J Sea Res 26:295–331
Riebesell U, Reigstad M, Wassmann P, Noji T, Passow U(1995) On the trophic fate of Phaeocystis pouchetii (Hariot)6. Significance of Phaeocystis-derived mucus for verticalflux. Neth J Sea Res 33:193–203
Riemann L, Winding A (2001) Community dynamics of free-living and particle-associated bacterial assemblages dur-ing a freshwater phytoplankton bloom. Microb Ecol 42:274–285
Riemann L, Steward GF, Azam F (2000) Dynamics of bacterialcommunity composition and activity during a mesocosmdiatom bloom. Appl Environ Microbiol 66:578–587
Rooney-Varga JN, Giewat MW, Savin MC, Sood S, LeGresleyM, Martin JL (2005) Links between phytoplankton andbacterial community dynamics in a coastal marine envi-ronment. Microb Ecol 49:163–175
Rousseau V, Leynaert A, Daoud N, Lancelot C (2002) Diatomsuccession, silicification and silicic acid availability in Bel-gian coastal waters (Southern North Sea). Mar Ecol ProgSer 236:61–73
Sapp M, Schwaderer AS, Wiltshire KH, Hoppe HG, Gerdts G,Wichels A (2007) Species-specific bacterial communities inthe phycosphere of microalgae? Microb Ecol 53: 683–699
Shannon CE, Weaver W (1963) The mathematical theory ofcommunication. University of Illinois Press, Urbana, IL
Starink M, Bargilissen MJ, Bak RPM, Cappenberg TE (1994)Quantitative centrifugation to extract benthic protozoafrom fresh-water sediments. Appl Environ Microbiol 60:167–173
Steyaert M, Garner N, Van Gansbeke D, Vincx M (1999).Nematode communities from the North Sea: environmen-tal controls on species diversity and vertical distributionwithin the sediment. J Mar Biol Assoc UK 79:253–264
Urakawa H, Yoshida T, Nishimura M, Ohwada K (2000) Char-acterization of depth-related population variation inmicrobial communities of a coastal marine sediment using16S rDNA-based approaches and quinone profiling.Environ Microbiol 2:542–554
Vallaeys T, Topp E, Muyzer G, Macheret V, Laguerre G,Rigaud A, Soulas G (1997) Evaluation of denaturing gradi-ent gel electrophoresis in the detection of 16S rDNAsequence variation in rhizobia and methanotrophs. FEMSMicrobiol Ecol 24:279–285
Vanaverbeke J, Soetaert K, Vincx M (2004a) Changes inmorphometric characteristics of nematode communitiesduring a spring phytoplankton bloom deposition. Mar EcolProg Ser 273:139–146
Vanaverbeke J, Steyaert M, Soetaert K, Rousseau V, VanGansbeke D, Parent JY, Vincx M (2004b) Changes instructural and functional diversity of nematode communi-ties during a spring phytoplankton bloom in the southernNorth Sea. J Sea Res 52:281–292
Van der Gucht K, Sabbe K, De Meester L, Vloemans N, ZwartG, Gillis M, Vyverman W (2001) Contrasting bacterio-plankton community composition and seasonal dynamicsin two neighbouring hypertrophic freshwater lakes.Environ Microbiol 3:680–690
253
Aquat Microb Ecol 48: 241–254, 2007
Van Duyl FC, Kop AJ (1994) Bacterial production in North-Sea sediments - clues to seasonal and spatial variations.Mar Biol 120:323–337
Van Hannen EJ, Mooij WM, van Agterveld MP, Gons HJ,Laanbroek HJ (1999a) Detritus-dependent developmentof the microbial community in an experimental system:qualitative analysis by denaturing gradient gel electro-phoresis. Appl Environ Microbiol 65:2478–2484
Van Hannen EJ, Zwart G, van Agterveld MP, Gons HJ, EbertJ, Laanbroek HJ (1999b) Changes in bacterial and eukary-otic community structure after mass lysis of filamentouscyanobacteria associated with viruses. Appl EnvironMicrobiol 65:795–801
von Wintzingerode F, Göbel UB, Stackebrandt E (1997) Deter-mination of microbial diversity in environmental samples:pitfalls of PCR-based rRNA analysis. FEMS Microbiol Rev
21:213–229Washington HG (1984) Diversity, biotic and similarity indices:
a review with special relevance to aquatic ecosystems.Water Res 18:653–694
Wieser W (1953) Die Beziehung zwischen Mundhöh-lengestalt, Ernährungsweise und Vorkommen beifreilebenden marinen Nematoden. Ark Zool 4:439–484
Wright SW, Jeffrey SW (1997) High-resolution HPLC systemfor chlorophylls and carotenoids of marine phytoplankton.In: Jeffrey SW, Mantoura RFC, Wright SW (eds) Phyto-plankton pigments in oceanography: guidelines to mod-ern methods. UNESCO, Paris, p 327–341
Xia SQ, Shi Y, Fu YG, Ma XM (2005) DGGE analysis of 16SrDNA of ammonia-oxidizing bacteria in chemical-biologi-cal flocculation and chemical coagulation systems. ApplMicrobiol Biotechnol 69:99–105
254
Editorial responsibility: Staffan Kjelleberg,Sydney, New South Wales, Australia
Submitted: November 17, 2006; Accepted: May 10, 2007Proofs received from author(s): July 18, 2007