university of warwick institutional repository: … rna gene sequences ... phytoplankton bloom...
TRANSCRIPT

University of Warwick institutional repository: http://go.warwick.ac.uk/wrapThis paper is made available online in accordance with publisher policies. Please scroll down to view the document itself. Please refer to the repository record for this item and our policy information available from the repository home page for further information. To see the final version of this paper please visit the publisher’s website. Access to the published version may require a subscription. Author(s): Josh D. Neufeld, Rich Boden, Hélène Moussard, Hendrik Schäfer, J. Colin Murrell. Article Title: Substrate-specific clades of active marine methylotrophs associated with a phytoplankton bloom in a temperate coastal environment Year of publication: 2008 Link to published version: http://dx.doi.org/ 10.1128/AEM.01266-08 Publisher statement: None

1
Substrate-specific clades of active marine methylotrophs associated with a phytoplankton
bloom in a temperate coastal environment
Diversity of active marine methylotrophs
5
Josh D. Neufeld†, Rich Boden, Hélène Moussard, Hendrik Schäfer
*‡, J. Colin Murrell.
Department of Biological Sciences, University of Warwick, Coventry CV4 7AL, United
Kingdom
10
†Present address: Department of Biology, University of Waterloo, Waterloo, Ontario, N2L 3G1,
Canada
‡ Present address: Warwick HRI, University of Warwick, Wellesbourne, CV35 9EF, United
Kingdom
15
*Corresponding author. Mailing address: Warwick HRI, University of Warwick, Wellesbourne,
CV35 9EF, United Kingdom. Phone: +44 (0)2476 575052. Fax: +44 (0)2476 574500. E-mail:
20
Supplemental material for this article may be found at http://aem.asm.org/.

2
ABSTRACT
Marine microorganisms that consume one-carbon (C1) compounds are poorly described,
despite their impact on global climate via an influence on aquatic and atmospheric chemistry.
This study investigated marine bacterial communities involved in the metabolism of one-carbon 25
compounds. These communities were of relevance to surface seawater and atmospheric
chemistry in the context of a phytoplankton bloom that was dominated by phytoplankton known
to produce dimethylsulfoniopropionate. In addition to using 16S rRNA gene fingerprinting and
clone libraries to characterize samples taken from a bloom transect in July 2006, seawater
samples from the phytoplankton bloom were incubated with 13
C-labelled methanol, 30
monomethylamine, dimethylamine, methyl bromide, and dimethylsulfide to identify microbial
populations involved in turnover of C1 compounds using DNA stable isotope probing (DNA-
SIP). The 13
C-DNA samples from a single time point were characterized and compared using
denaturing gradient gel electrophoresis (DGGE), fingerprint cluster analysis and 16S rRNA gene
clone library analysis. Bacterial community DGGE fingerprints from 13
C-labelled DNA were 35
distinct from those obtained with the DNA of the non-labelled community DNA and suggested
some overlap in substrate utilization between active methylotroph populations growing on
different C1 substrates. Active methylotrophs were affiliated with Methylophaga spp. and several
clades of undescribed Gammaproteobacteria that utilized methanol, methylamines (both
monomethylamine and dimethylamine) and dimethylsulfide. Ribosomal RNA gene sequences 40
corresponding to populations assimilating 13
C-labelled methyl bromide and other substrates were
associated with Alphaproteobacteria (e.g. Rhodobacteraceae family), Cytophaga-Flexibacter-
Bacteroidetes, and unknown taxa. This study expands the known diversity of marine
3
methylotrophs in surface seawater and provides a comprehensive dataset for focussed cultivation
and metagenomic analyses in the future. 45
INTRODUCTION
Methylotrophic bacteria represent an important functional guild, contributing to the
metabolism and assimilation of one-carbon (C1) compounds. As the carbon sources that they
depend on in the marine environment are present at low concentrations, characterizing marine 50
methylotrophs has involved the use of enrichment and cultivation approaches with a variety of
C1 substrates. The C1 substrates of relevance to the marine environment include methane,
methanol, methylated amines, methyl halides and methylated sulfur compounds. Methane is
supersaturated in surface seawater and several studies have isolated methanotrophs from the
marine environment (14, 16, 27, 46). Methyl halides are produced by a number of phytoplankton 55
species (e.g. 41) and these ozone-depleting compounds have been used to isolate methylotrophic
Alphaproteobacteria that belonged to the Roseobacter clade (42, 44). Methanol represents a
marine C1 substrate derived from phytoplankton (13) and the atmosphere (7), which may be
actively metabolised by marine methylotrophs (21). Methanol has been estimated at between 100
nM (47) and 300 nM (10) and has been directly measured in one study, ranging between 50-250 60
nM in several tropical Atlantic samples (53). Enrichment and isolation studies using methanol as
a sole carbon source have generated molecular fingerprint phylotypes and characterised isolates
of Methylophaga spp. (Gammaproteobacteria). Methylophaga spp. have also been isolated using
dimethylsulfide (DMS; 8, 43) and can grow on monomethylamine (e.g. 23), both of which occur
at nM concentrations in surface seawater (11, 24). Together, these cultivation-based approaches 65
have revealed the presence of organisms capable of C1 cycling in the marine environment. Their

4
involvement in methylotrophic metabolism in situ can be experimentally addressed using stable
isotope probing (39).
DNA stable-isotope probing recently identified Methylophaga-like organisms as active
methylotrophs that assimilated methanol and methylamine in surface waters of the English 70
Channel (35). This study also demonstrated that 16S rRNA gene sequences representing clades
of uncultivated Gammaproteobacteria were also retrieved from the heavy DNA for each of these
compounds that clustered close to Methylophaga. A SIP experiment with methanol substrate
dilution to concentrations anticipated to reflect those in situ (33) confirmed the involvement of
Methylophaga spp. in methanol consumption and retrieved functional genes involved in 75
methanol metabolism from these active methylotrophs using metagenomic libraries.
The goal of the current study was to extend our previous observations that were made
during non-bloom conditions, by studying methylotrophic populations in the context of a
phytoplankton bloom dominated by Emiliania huxleyi and Karenia mikimotoi (formerly
Gyrodinium aureolum). Both coccolithophores (e.g. Emiliania) and small dinoflagellates (e.g. 80
Karenia) are associated with dimethylsulfoniopropionate (DMSP) production (22, 28) and
phytoplankton blooms are known to produce relevant C1 compounds or their precursors,
including methanol (13), methylated sulfur compounds (24), and methyl halides (41). As with
our previous marine SIP studies (33, 35), seawater samples were incubated with methanol and
methylamine, and in this investigation, SIP incubations were also carried out with 13
C-labelled 85
methane, dimethylamine, methyl bromide and DMS in order to identify microbial populations
that are actively involved in the cycling of these C1 compounds during phytoplankton blooms in
situ.
MATERIALS AND METHODS
5
Bloom sampling. A transect across a phytoplankton bloom dominated by E. huxleyi and K. 90
mikimotoi (D. Schroeder, personal communication) was sampled in the English Channel
bordering the south coast of the UK. Surface seawater was taken from inside the bloom (49.3222
N, 5.1446 W to 49.5105 N, 5.1217 W), at the edge of the bloom (49.5472 N, 4.3966 W to
49.5523 N, 4.4045 W), and outside the bloom area (50.1158 N, 4.1998 W to 50.1053 N 4.2062
W). The distances between the beginning and end of sampling differed for the three sampling 95
stations and were 1.3 km, 0.8 km, and 20 km for the outside, edge, and inside of bloom,
respectively. All samples were taken between 10.00 h and 22.00 h on July 26, 2007. Water
samples were returned to the laboratory and aliquots were taken for filtration (for DNA
extraction) and to establish SIP incubations on July 27, 2006. Upon arrival, multiple aliquots of
approximately one-litre were filtered through 0.2-µm Sterivex filters (Durapore, Millipore) and 100
frozen at -80°C until processed for nucleic acid extraction.
Incubation with 13
C labelled substrates. Samples taken from the edge of the bloom were chosen
to set up SIP incubations with several 13
C-labelled C1 substrates. Seawater sample aliquots of
750 ml were added to 1-liter serum bottles with the addition of 0.1% (750 µl) marine ammonium 105
mineral salts medium (MAMS; modified from 12) and substrate. A total of 75 µmol of 13
C-
labelled substrate was added to bottles for methanol, monomethylamine, dimethylamine, methyl
bromide, and methane (final concentration of 100 µM assuming complete dissolution). For
dimethylsulfide, 187.5 µmol of substrate were added to make up a final concentration of
250 µM. All serum bottles were crimp-sealed with butyl rubber bungs to prevent loss of volatile 110
substrates. All 13
C-labelled compounds were 99% or greater purity and obtained from Cambridge
Isotope Laboratories (Hook Hampshire, UK) except methylated amines (Sigma, Gillingham,

6
UK). Dimethylsulfide (13
C2-labelled) was prepared by a method adapted from that for labelled
dimethylsulfoxide synthesis (5). Sodium sulfide nonahydrate (6.5 g) was dissolved in 6.5 mL of
sterile deionised water in a glass test-tube and cooled to 0°C in an ice-water bath with vigorous 115
stirring. Subsequently, 5 g of 13
C-methyl iodide (Cambridge Isotope Laboratories LTD,
Andover, MA) was added dropwise over a period of 30 min prior to incubating the reaction
mixture at 0°C for 5 h with stirring. Five mL of each 2 M sodium hydroxide solution and 1 M
sodium thiosulfate solution were added and the reaction vessel was then connected to a receiving
tube held at -170°C in liquid nitrogen and the reaction mixture allowed to warm to 40°C in a 120
water bath. The 13
C2-dimethylsulfide was distilled from the reaction mixture for 90 minutes and
then re-distilled into a sterile receiving vessel for 1 hour. Sterile deionised water was added to
the receiving vessel to dissolve the 13
C2-dimethylsulfide and the resulting solution transferred,
with washings, to a sterile 1-l serum vial which was then sealed with a butyl rubber bung. The
concentration and purity of the 13
C2-dimethylsulfide solution were assessed by gas 125
chromatography with a flame ionization detector. A total of 250 ml of a 7 mM solution of pure
13C2-dimethylsulfide was obtained.
For all substrates, parallel incubations were set up as 12
C-unlabelled controls and 13
C and
12C-substrate incubations were harvested at a single time point. With the exception of
monomethylamine and dimethylamine, substrate utilization was monitored by gas 130
chromatography, using a flame ionization detector. Measurement of DMS and methyl bromide
concentrations in sterile seawater controls confirmed that the degradation observed in SIP
incubations was due to a biological processes and not due to chemical decomposition. The
concentrations of the methylamines were assumed to mirror those of methanol; recovery of
13C-DNA from methylamine and dimethylamine incubations confirmed that methylated amines 135

7
had been assimilated. Following substrate depletion, SIP incubations were filtered through
0.22-µm Sterivex filters and frozen at -80°C until processed for nucleic acid extraction.
DNA extraction, SIP gradient centrifugation and fractionation. Total nucleic acids were
extracted directly from Sterivex filters according to a previously described protocol (35). Briefly, 140
lysozyme, proteinase K and sodium dodecyl sulfate (SDS) were used to lyse cells and lysates
were transferred to 15-ml phase lock tubes (Qiagen, West Sussex, UK) for phenol-chloroform
and chloroform extractions. Purified DNA was quantified on a 1% (w/v) agarose gel. Aliquots
(1-5 µg) of DNA extracts from each of the SIP incubations were added to cesium chloride (CsCl)
solution (average density of ~1.725 g ml-1
) and transferred to an ultracentrifuge gradient tube for 145
centrifugation and fractionation as previously described (36). Briefly, tubes were added to a Vti
65.2 rotor (Beckman Coulter, Fullerton, CA) and centrifuged at 44,100 rpm (177,000 gav) for 40
h at 20°C. Gradients were fractionated from bottom (fraction 1; highest density) to top (fraction
12; lowest density) into 425-µl fractions. DNA was purified from CsCl and quantitatively
recovered by precipitation with glycogen (20 µg) and polyethylene glycol (30% PEG 6000 and 150
1.6 M NaCl). Purified DNA was suspended in 30 µl of sterile LoTE buffer (3 mM Tris at pH 8,
0.2 mM EDTA) and 5-µl aliquots were run on a 1% (w/v) agarose gel for quantification and to
identify the distribution of labelled 13
C-DNA relative to background unlabelled 12
C-DNA (Figure
S1 in the supplemental material). These data indicated that the 13
C-labelling of DNA was very
high for methanol, monomethylamine, and dimethylsulfide incubations; most of the DNA for 155
these 13
C-incubated samples eluted in heavy fractions (fractions 7 and 8; ~1.725-1.730 g ml-1
).
The detection of 13
C-labelled DNA confirmed that the substrate was incorporated into microbial
biomass. For dimethylamine and methyl bromide incubations, the extent of DNA labelling was
8
less pronounced. For methyl bromide incubations, there was almost no difference between the
smears of DNA across gradients associated with 12
C and 13
C methyl bromide SIP incubations 160
(Figure S1 in the supplemental material).
Denaturing gradient gel electrophoresis (DGGE). For each fractionated gradient, two fractions
were selected for analysis of the ‘heavy’ (13
C) DNA (fractions 7 and 8; ~1.725-1.730 g ml-1
), and
one fraction was selected for the characterization of ‘light’ (12
C) DNA (either fraction 11 or 12; 165
~1.710-1.705 g ml-1
). One-µl aliquots of gradient fractions were used as template for PCR to
obtain 16S rRNA gene fragments suitable for DGGE analysis. Each 50-µl reaction mix consisted
of 25 pmol each of primers 341f-GC and 534r (31), 1 X (NH4)2SO4 buffer (Fermentas, York,
UK), 1.5 mM MgCl, 33.6 µg non-acetylated bovine serum albumin (Sigma, Gillingham, UK), 40
nmol dNTPs, 1.25 U Taq polymerase (Fermentas). The reaction tubes were loaded directly into 170
the block at 95°C (simplified hot start), followed by an initial denaturation at 95°C for 5 min and
30 cycles of 94°C for 1min (denature), 55°C for 1 min (anneal), and 72°C for 1 min (extension).
A final extension at 72°C for 7 minutes was followed by a holding step at 10°C. Five-µl aliquots
were quantified on a 1% (w/v) agarose gel.
For DGGE, 5-µl aliquots (100-300 ng) were run on a 10% polyacrylamide gel with a 30-175
70% denaturing gradient (100% denaturant is 7.0 M urea and 40% deionized formamide)
according to the D-Code System instructions (Bio-Rad, Hercules, CA, USA). Gels were run
overnight (14 h) at 85 V, then stained for 1 h in SYBR Green I (Invitrogen, Paisley, UK). Gel
images were captured with a FLA-5000 imaging system (Fujifilm, Tokyo, Japan). Bands
selected for sequence analyses were sampled from the gel by means of sterile pipette tips and 180
amplified from the gel using the PCR conditions described above for DGGE. Sequencing was

9
done with the 341f primer and the BigDye terminator version 3.1 kit (Applied Biosystems,
Foster City, USA) and the sequencing products were run on an ABI PRISM 3130 x l Genetic
Analyser (Applied Biosystems) by the Molecular Biology Service, University of Warwick.
DGGE band sequences were approximately 150 bases in length. 185
For determining the relatedness of the DGGE fingerprints, gels were imported into
Gelcompar II (Applied Maths, Sint-Martens-Latem, Belgium) and normalized to ladder bands
and additional internal standard bands. A UPGMA dendrogram was generated by performing a
Pearson correlation on background-subtracted densitometric curves which takes band intensities
into account. The output of the clustering analysis was independent of the input order of DGGE 190
fingerprints.
16S rRNA gene libraries. Clone libraries of bacterial 16S rRNA genes were generated from the
original seawater samples (outside bloom, edge of bloom, inside of bloom; 36 clones sequenced
from each) and for the heavy DNA associated with the five substrates (methanol, 195
monomethylamine, dimethylamine, methyl bromide, dimethylsulfide) that yielded 13
C-labelled
DNA (24 clones sequenced from each). The PCR to amplify the 16S rRNA gene used primers
27f and 1492r (25) and the same amplification reaction as for DGGE except with an extension
time of 1.5 min. Products were cloned into the TOPO-TA vector according to the manufacturer’s
protocol (Invitrogen). Screening was done as described previously (37) and cloned 16S rRNA 200
gene inserts were sequenced at the Edinburgh node of the NERC Molecular Genetics Facility
using the 27f primer. The program Pintail (3) was used to identify suspected chimeras and
identified one heavy-band sequence which was likely chimeric in origin and several water library
sequences that were likely chimeric, these sequences were excluded from further analyses. For
10
seawater samples, classification of 16S rRNA gene sequences was done using the RDP-II 205
classifier (52) after manually verifying base calls. For 16S rRNA gene libraries constructed using
13C-DNA from SIP experiments, manually verified 16S rRNA gene sequences were compared to
Genbank (6) to retrieve three closest matches for each library sequence. Sequences were aligned
within Arb (29) and an alignment was exported to MEGA4 (48). Evolutionary distances were
computed using the Maximum Composite Likelihood method (49) and are in the units of the 210
number of base substitutions per site. All positions containing gaps and missing data were
eliminated from the dataset (complete deletion option). There were a total of 466 nucleotide
positions in the final dataset. The percentage of replicate trees in which the associated taxa
clustered together in the bootstrap test (1000 replicates) are shown next to the branches (9). The
tree was drawn to scale, with branch lengths in the same units as those of the evolutionary 215
distances used to infer the phylogenetic tree. In the absence of cultivated methylotrophic
organisms that fell within the groups of 16S rRNA genes derived from SIP experiments, clades
were defined based on the consistent association with particular substrates but a specific cut-off
value was not used.
220
Genbank sequence deposition. All sequences were deposited in Genbank for the marine samples
taken from the edge (EU399242-EU399272), inside (EU399273-EU399306) and outside
(EU399307-EU399340) of the phytoplankton bloom. The 16S rRNA gene clone library
sequences from heavy DNA were deposited with the following accession numbers for SIP
incubations with dimethylamine (EU399341-EU399364), dimethylsulfide (EU399365-225
EU399386), methyl bromide (EU399387-EU399407), monomethylamine (EU399408-
EU399428) and methanol (EU399429-EU399451). DGGE band sequences from heavy DNA

11
were deposited with the following accession numbers for SIP incubations with methanol
(EU399452-EU399457), monomethylamine (EU399458-EU399464), dimethylamine
(EU399465-EU399469), dimethylsulfide (EU399470-EU399474) and methyl bromide 230
(EU399475-EU399477).
RESULTS
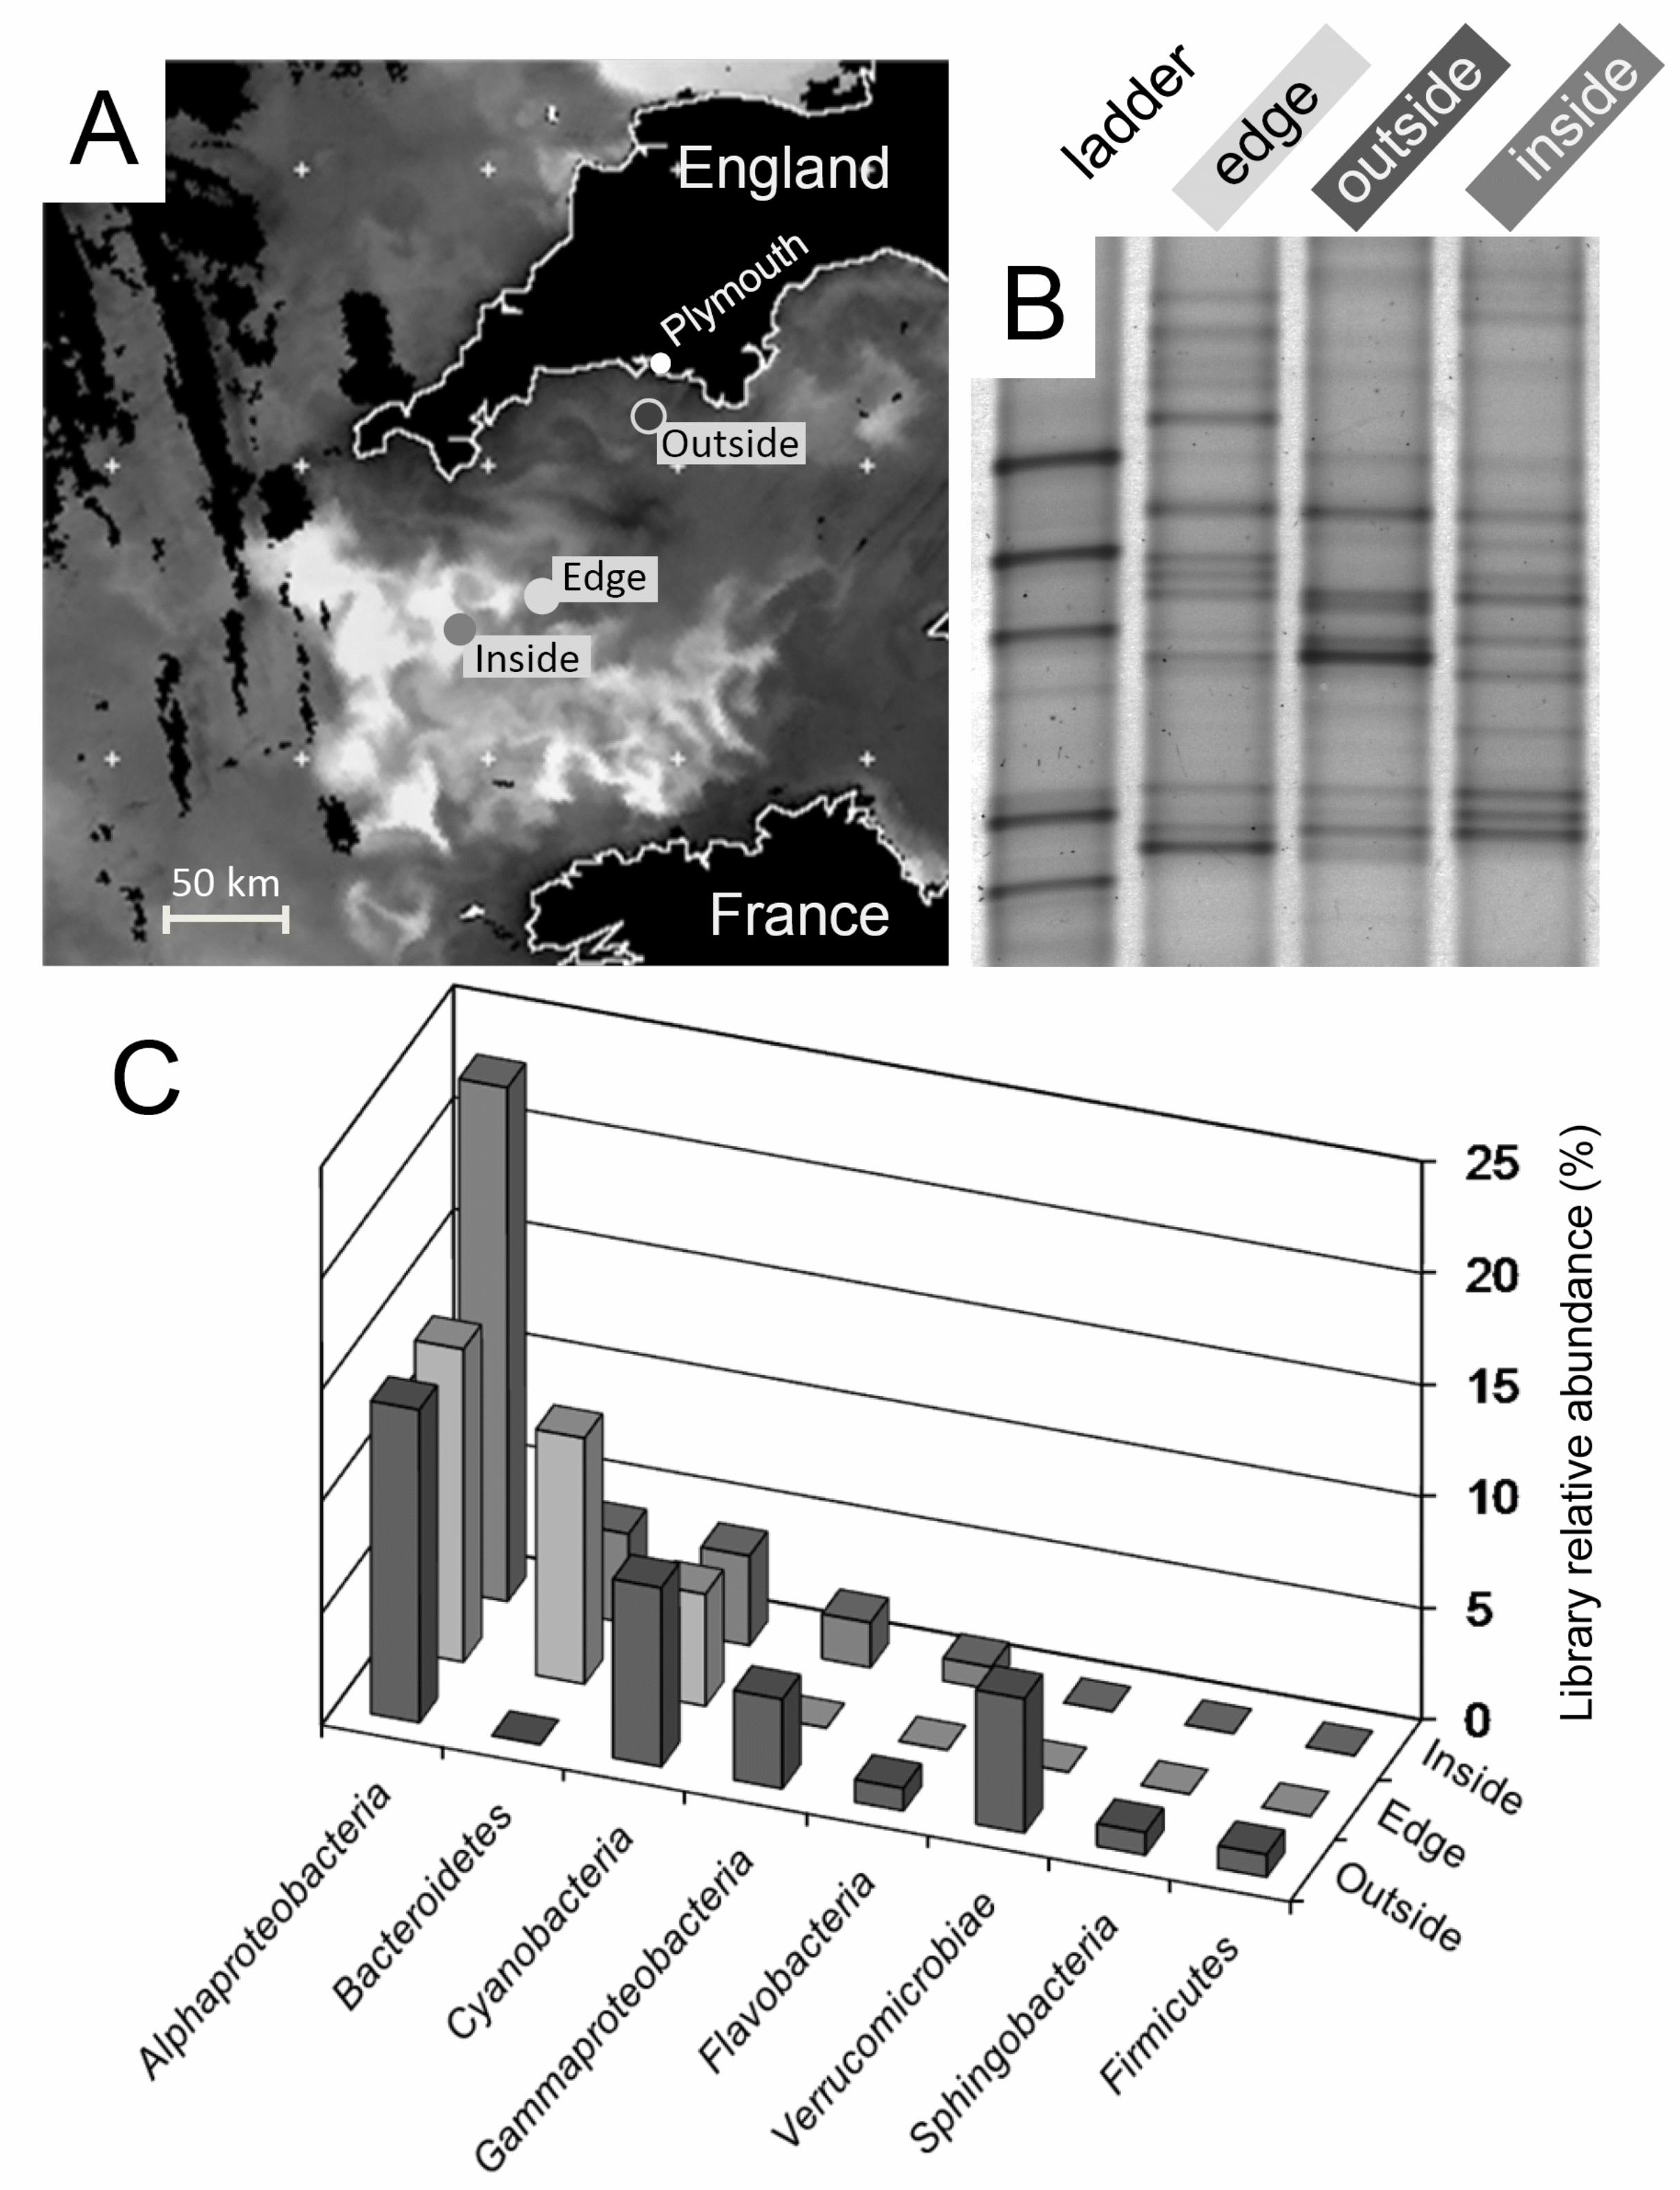
Phytoplankton bloom microbial community analysis. This study was conducted on samples from
an extensive mixed phytoplankton bloom with a predominance of both Emiliania huxleyi and 235
Karenia mikimotoi (D. Schroeder, personal communication). Based on remotely sensed
observations from the day prior to sampling, three sampling stations within the western English
Channel were selected to represent areas of varying chlorophyll concentrations (Figure 1A),
indicating regions internal to the bloom (‘inside’), on the edge of the bloom (‘edge’) and external
to the bloom (‘outside’). Prior to assessing the methylotrophs in the bloom (edge sample), we 240
assessed the background bacterial community composition of the three water samples using 16S
rRNA gene fingerprinting (Figure 1B) and clone libraries (Figure 1C). The DGGE profiles
indicate that the bacterial communities of these three water samples were represented by unique
predominant band phylotypes, although several bands were shared between the three samples
(Figure 1B). Almost all sequences collected from the 16S rRNA gene clone libraries were most 245
similar to Genbank sequences derived from other marine surface water samples, reflecting a
composition similar to previous studies (data not shown). All libraries were dominated by
Alphaproteobacteria and Cyanobacteria, although Bacteroidetes were also prevalent in the
‘Inside’ and ‘Edge’ libraries (Figure 1C). Overall, the communities shared similar division-level

12
composition but also indicated that local sample heterogeneity existed across this relatively short 250
bloom transect.
DNA-SIP incubations. Enrichment incubations with six C1 substrates were established on the day
following sampling (day 0) with substrate concentrations of 100 µM (250 µM for DMS).
Substrate had been depleted by day 3 in methanol incubations and these were filtered for DNA 255
extraction as were those containing methylamines. Approximately 110 µM of 12
C and 13
C-DMS
were consumed by the fourth day (data not shown) and these incubations were subsequently
sacrificed for DNA extraction. Methyl bromide incubations (12
C and 13
C) had consumed >90%
of the 100 µM of substrate originally present by day 18 and were filtered for DNA extraction.
Changes in headspace concentrations of methane (100 µM total in bottle; ~0.63% in headspace) 260
for seawater incubations with methane were unchanged for several months (data not shown) and
these incubations were not analyzed further.
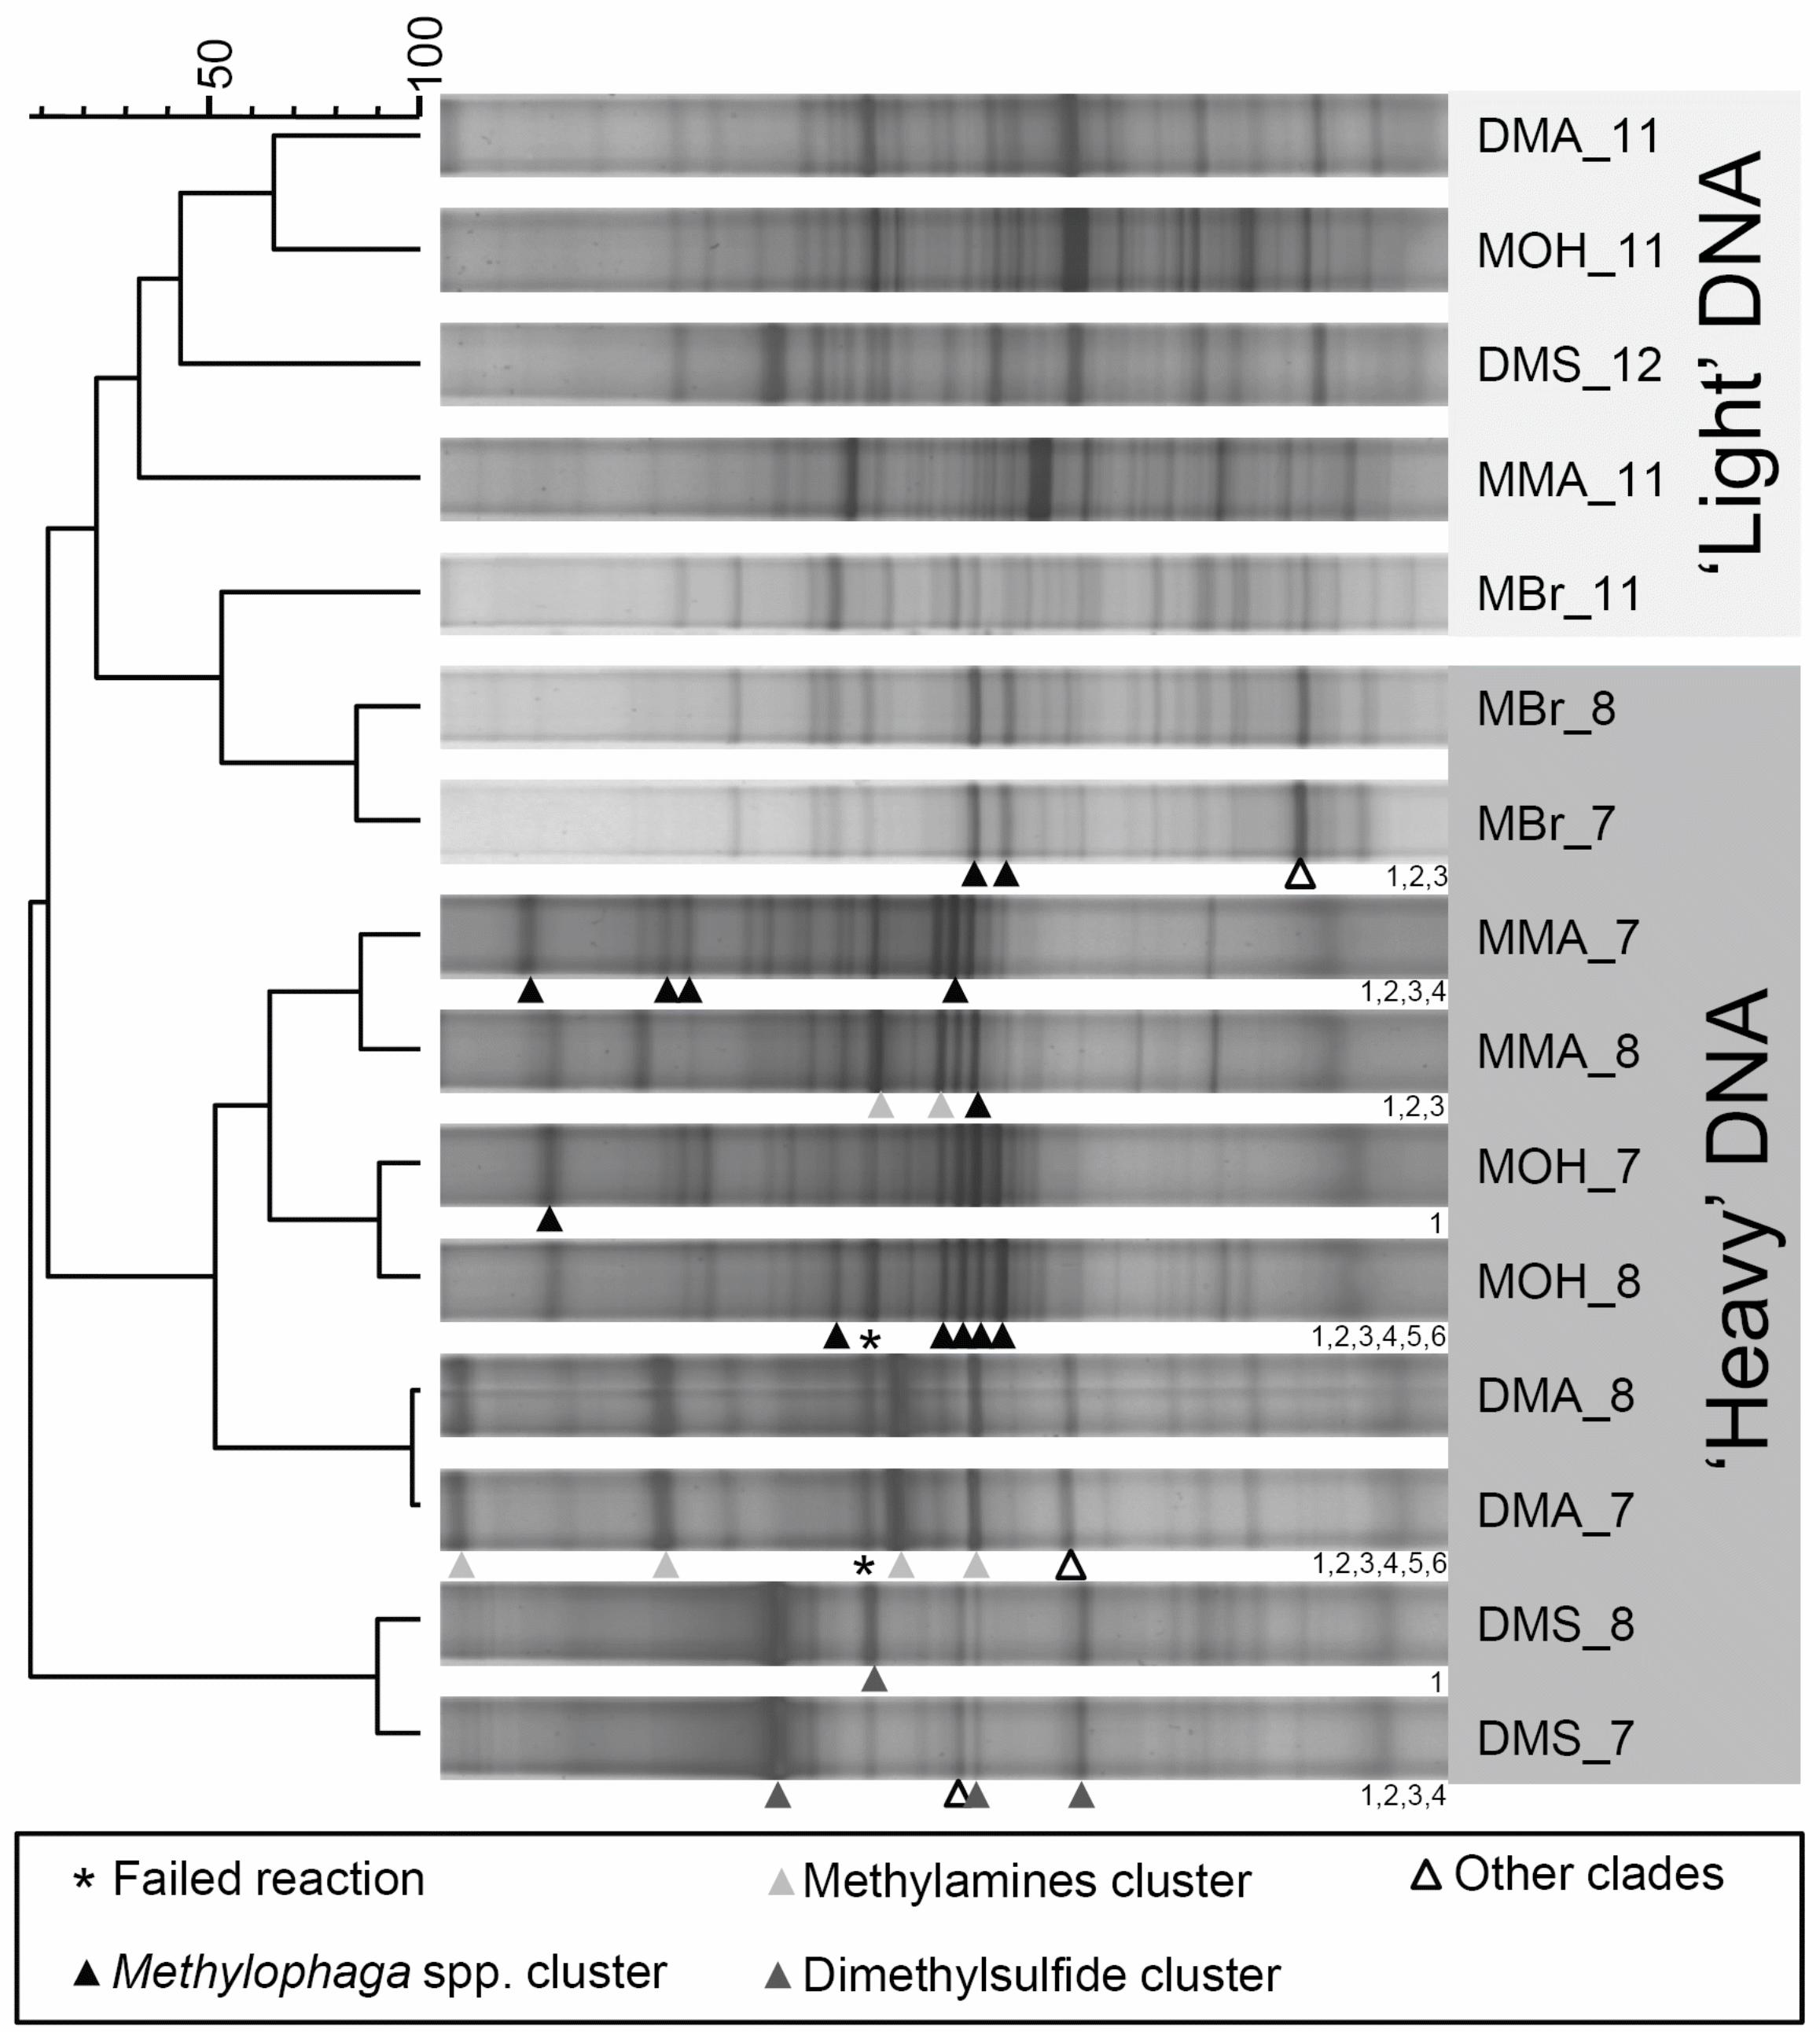
16S rRNA gene fingerprinting of DNA from SIP experiments. Denaturing gradient gel
electrophoresis (DGGE) was used to profile the bacterial communities associated with ‘heavy’ 265
and ‘light’ fractions for both 12
C-control samples and 13
C-incubated samples. The 12
C incubated
samples showed no profile difference between the ‘heavy’ and ‘light’ fractions (data not shown),
whereas unique fingerprints were evident for all C1-substrate incubations (Figure 2). As
expected, the fingerprints for the light fractions of all tubes clustered together. The ‘background’
bacterial communities in each SIP incubation were more similar to one another than to the 270
‘heavy’ 13
C-fraction fingerprints of the same incubation. However, for the methyl bromide SIP
incubation, the fingerprint of the ‘heavy’ DNA was less clearly unique from the light DNA than

13
for the other substrate incubations, reflecting that only a small amount of DNA was labelled and
was just detectable above background 12
C-DNA. All other DGGE fingerprints from heavy
fractions (fractions 7 and 8) of 13
C-substrate incubations clustered in distinct clades apart from 275
the ‘light’ DNA, with monomethylamine and methanol fingerprints clustering closely, with some
similarity to the dimethylamine fingerprints. Dimethylsulfide 13
C-DNA fingerprints were distinct
from all other patterns in this study, reflecting a unique composition of active methylotrophs
enriched in these SIP incubations. Individual bands from fingerprints representing ‘heavy’ DNA
from 13
C1 incubations were selected for PCR reamplification and sequencing. These sequences 280
were used to assign band sequences to specific SIP-related 16S rRNA gene clades derived from
this study and from a previous SIP study that was carried out during non-bloom conditions in the
English Channel (35). The results indicate that Methylophaga spp. were associated with methyl
bromide, methanol and methylamine SIP incubations, whereas additional clades were affiliated
with dimethylamine and dimethylsulfide, likely contributing to their more distinct fingerprint 285
profiles (Figure 2).
16S rRNA gene clone libraries of 13
C-DNA. As the diversity of active methylotrophs was
anticipated to be relatively low, 24 clones were sequenced from each library associated with SIP
incubations with each of the five substrates analyzed in this study. The results of the sequencing 290
confirmed relative low diversity of methylotrophs within each SIP incubation, but across the
different substrates applied indicated a broad diversity of active marine methylotrophs in this
study.

14
Methanol-assimilating phylotypes. Phylogenetic analysis demonstrated that sequences associated 295
with SIP incubations with methanol clustered in the Methylophaga spp. clade of the
Gammaproteobacteria together with sequences from a previous SIP incubation (35) and with
several characterised Methylophaga isolates (Figure 3, Figure S2 in the supplemental material).
In addition, one cloned 16S rRNA gene sequence obtained from the methanol SIP was a member
of a clade of unknown phylogenetic affiliation, which also contained one DMS and DMA-SIP 300
derived cloned 16S rRNA gene respectively. The methanol clade identified in a previous
methanol SIP experiment (Figure 3; Figure S2 in the supplemental material) has closest
affiliation to Gammaproteobacteria sequences in Genbank that were retrieved from multiple
marine Arctic surface sediments or detected on the surface of submerged artificial substrates
incubated in marine water near China. This clade however, was not detected in the current study. 305
Phylotypes assimilating methylated amines. As with the methanol SIP incubation, a previously
characterised clade of sequences associated with a monomethylamine SIP incubation (35) was
also represented by sequences from the monomethylamine SIP from the current study, and also
from the dimethylamine SIP incubation. In particular, 22 of the 24 sequences generated from the 310
dimethylamine SIP incubation and most of the corresponding DGGE band sequences (Figure 2)
fell within this clade (Figure 3, Figure S3 in the supplemental material). This clade also
contained several sequences isolated from Arctic sediment (Li et al, unpublished), a mangrove
ecosystem (Liao et al. 2007, Microb Ecol. 54(3):497-507), and a deep-sea coral (Penn et al
unpublished) and a strain isolated from the Yellow Sea (Kim and Cho, unpublished, Genbank 315
accession EF468718). Additional 16S rRNA gene sequences obtained from the

15
monomethylamine SIP incubation belonged to the Methylophaga clade many species of which
can grow on methylated amines.
Phylotypes assimilating DMS. Almost all 16S rRNA gene sequences derived from the 320
dimethylsulfide SIP ‘heavy’ DNA were nearly identical and formed an additional clade with low
relative diversity (Figure 3; Figure S4 in the supplemental material). The DMS clade was most
closely related to the methanol SIP clade associated with the Gammaproteobacteria and
identified in a previous study (35) and shared close similarity (96%) with sequences retrieved
from clone libraries associated with DMS-enriched seawater samples from the Sargasso Sea (51) 325
and was approximately 91% similar to the Methylophaga sp. clade, based on the percent
similarity between sequences DMS_584_22 and Methylophaga marina (accession number
X95459) over 722 bases. Another sequence from the ‘heavy’ DNA of the DMS SIP was
affiliated with a clade of unknown phylogeny.
330
DISCUSSION
The study site was chosen based on the mixed Emiliania and Karenia bloom that
occurred in the English Channel in July of 2006. The growth of phytoplankton in oceanic surface
water has been associated with the direct or indirect production of methanol (13), methylamines 335
(reviewed in 32), methyl halides (2, 4, 30, 41), methylated sulfur compounds (19, 20, 26) and
methane, through decomposition (15, 38). In sampling from the edge of the bloom for SIP
analysis (Figure 1), the objective was to retrieve sequences of methylotrophs relevant to bloom
C1 substrate production. Although the sample chosen was relevant to C1 metabolism, it is
16
important to note that the substrate concentrations (100 µM) were far higher than those normally 340
present in marine surface water samples. This was done because for a previous bloom in Bergen,
Norway, the application of C1 substrates at low µM concentrations did not result in the detection
of 13
C-labelled DNA, possibly due to relatively high bacterial biomass associated with the bloom
(Murrell et al., unpublished). In this study, the objective was to identify phylotypes associated
with the use of labelled C1 substrates and the use of elevated substrate concentrations may have 345
biased the results obtained. Typically, SIP experiments require substrate concentrations that
exceed those found naturally and the data may have to be interpreted with caution (34).
Nonetheless, a comparison of near in situ substrate concentrations (1 µM) with a marine
methanol SIP incubation detected the same Methylophaga spp. phylotypes as detected in the
present study (33). As a result, for C1 substrates in the marine environment, the results may be 350
consistent despite the range of substrate concentrations used. In all SIP incubations thus far, the
incubation times were extended to days and an addition of nutrients may have also selected for a
fast growing species of methylotrophs. However, the uncultivated methylotrophs detected here
are consistently present, which suggests that they do play an active role in C1 metabolism in
coastal marine environments. 355
This study represents a comprehensive survey of active methylotrophs in a marine
surface water sample during a bloom of phytoplankton associated with production of DMSP.
The methylotrophs detected in this survey are consistent with the results of our pilot study with
only methanol and monomethylamine under non-bloom conditions obtained a year prior to the
current sampling event (35); however, use of a wider range of C1 substrates allowed the 360
identification of a larger diversity of methylotrophs than found previously, including populations
assimilating dimethylamine, DMS and methyl bromide. DMS SIP clones obtained were most

17
closely related to clones obtained from DMS enrichments from Pensacola and the Sargasso Sea
by Vila-Costa and colleagues (51), suggesting that the latter had similar metabolic activities and
indeed represented DMS degrading populations. Those sequences were classified as 365
“uncultivated Methylophaga”; however, given the relatively low similarity of the 16S rRNA
gene sequences of these cloned 16S rRNA gene sequences to those of Methylophaga isolates
(around 92%) and their distinct clustering supported by bootstrap analysis (see Fig. S2 and S4), it
is also possible that these represent DMS-degrading populations belonging to a different genus.
Conversely, none of the DMS SIP clones were closely related to previously isolated DMS-370
degrading Methylophaga isolates (43), which belonged to the Methylophaga clade detected on
methanol, monomethylamine and methyl bromide, strongly suggesting that populations closely
related to the isolated strains may have a preference for other C1 substrates and/or are
outcompeted by those represented by the DMS clade under the specific incubation conditions.
The methyl bromide SIP sequences suggest that methyl bromide may be used by members of the 375
Methylophaga genus and an organism with a 16S rRNA gene sequence most similar to
Phaeobacter gallaeciensis (formerly Roseobacter) within the Rhodobacteraceae. The notion that
the Phaeobacter-related population degraded methyl halides would be supported by previous
cultivation based identification of marine methyl halide degrading organisms which were closely
related (42, 44, 45); however, screening of several Methylophaga isolates has failed to show their 380
ability to degrade methyl halides (Schäfer, unpublished). The observation of Methylophaga-like
sequences in the 13
C-methyl bromide incubation could therefore be due to the slow hydrolytic
conversion of methyl bromide to methanol (1) and subsequent utilisation of the resulting
methanol by these organisms. If Methylophaga populations in the methyl bromide incubations
became labelled with 13
C due to uptake of methanol produced by conversion of methyl halides to 385
18
methanol, this would further underline their ability to take up methanol at ambient concentrations
and support using SIP incubations with elevated substrate concentrations to investigate substrate
responsive populations in seawater. Together, these data suggest that marine waters harbour a
diverse suite of active methylotrophs that, apart from Methylophaga spp. have been unnoticed
by previous cultivation studies (8, 17, 23, 42-44) and are almost completely without 390
representation in marine clone libraries. The sequences represented here represent important
targets for directed cultivation and focussed activity-based studies of marine methylotrophy.
Given the focus of past marine metagenomic studies on abundant community members, it
is perhaps not surprising that few genes (phylogenetic or ‘functional’) have reflected the
predominance of methylotrophic bacteria. Although formaldehyde oxidation genes were 395
identified in the Sargasso Sea metagenomic libraries (50), genes for methane, methylamine, and
methanol oxidation were not detected (18). Furthermore, the only presumed methylotroph 16S
rRNA gene sequences identified in a marine metagenomic library was from Methylophilus spp.
and these sequences occurred at ~0.4% of the total 16S rRNA gene dataset from the global ocean
survey (40). The contribution of Methylophilus to marine C1 cycling remains unclear and 400
Methylophilus spp. have not been detected in 13
C DNA from the incubations carried out in this
study. One possibility is that Methylophilus spp. represent K-selected organisms that are adapted
to concentrations of carbon and nutrients that are lower than those used in this study. Cultivation-
based approaches (17), enrichment cultures (43, 51) and SIP incubations (current study; 33, 35)
have all demonstrated that Methylophaga spp. and related Gammaproteobacteria from multiple 405
disparate marine samples (including estuary sediment; unpublished data) are present in the
seawater samples and rapidly respond to the presence of C1 substrates. It is possible that these
organisms may represent low-abundance and r-selected bacteria that are capable of opportunistic

19
growth in the presence of relatively high concentrations of growth substrates during
phytoplankton blooms, for example. 410
This study represents a comprehensive cultivation-independent survey of active marine
methylotrophs and demonstrates that previously unrecognized bacterial groups are present in
seawater, which are capable of responding to the presence of added C1 substrates. The presence
of numerous clades of presumed substrate-specific methylotrophs presents a challenge to
microbiologists to focus cultivation and quantitative molecular approaches to better understand 415
the metabolism and distribution dynamics of these organisms with potentially enormous
biogeochemical significance.
ACKNOWLEDGEMENTS
We thank Ian Joint, Clare Evans, Declan Schroeder, and Jack Gilbert for assistance with 420
sampling. The authors thank the NERC Earth Observation Data Acquisition and Analysis
Service (NEODAAS) for supplying satellite data for this study. This work was supported by
funding from the Natural Environment Research Council (UK) Aquatic Microbial Metagenomics
and Biogeochemical Cycles grant reference NE/C001 923/1. H.S. was supported by a NERC
postdoctoral fellowship (NE/B501404/1). J.D.N. also acknowledges support from the Natural 425
Sciences and Engineering Research Council (Canada).

20
REFERENCES(9, 32, 57)
1. Abbattista Gentile, I., L. Ferraris, M. Sanguinetti, M. Tiprigan, and G. Fisichella.
1992. Methyl bromide in fresh waters: hydrolysis and volatilisation. Pesticide Science
34:297-301. 430
2. Anbar, A. D., Y. L. Yung, and F. R. Chavez. 1996. Methyl bromide: Ocean sources,
ocean sinks, and climate sensitivity. Global Biogeochem. Cycles 10:175-190.
3. Ashelford, K. E., N. A. Chuzhanova, J. C. Fry, A. J. Jones, and A. J. Weightman.
2005. At least 1 in 20 16S rRNA sequence records currently held in public repositories is
estimated to contain substantial anomalies. Appl. Environ. Microbiol. 71:7724-7736. 435
4. Bakera, J. M., C. E. Reeves, P. D. Nightingale, S. A. Penkett, S. W. Gibb, and A. D.
Hatton. 1999. Biological production of methyl bromide in the coastal waters of the North
Sea and open ocean of the northeast Atlantic. Mar. Chem. 64:267-285.
5. Beerli, R., and H.-J. Borschberg. 1991. Preparation of [13
C2]-DMSO. J. Label. Comp.
Radiopharm. 29:957-961. 440
6. Benson, D. A., I. Karsch-Mizrachi, D. J. Lipman, J. Ostell, B. A. Rapp, and D. L.
Wheeler. 2000. Genbank. Nucleic Acids Res. 28:15-18.
7. Carpenter, L. J., A. C. Lewis, J. R. Hopkins, K. A. Read, I. D. Longley, and M. W.
Gallagher. 2004. Uptake of methanol to the North Atlantic Ocean surface. Global
Biogeochem. Cycles 18:GB4027. 445
8. de Zwart, J., P. Nelisse, and J. Kuenen. 1996. Isolation and characterization of
Methylophaga sulfidovorans sp. nov.: an obligately methylotrophic, aerobic,
dimethylsulfide oxidizing bacterium from a microbial mat. FEMS Microbiol. Ecol.
20:261-270.

21
9. Felsenstein, J. 1985. Confidence limits on phylogenies: an approach using the bootstrap. 450
Evolution 39:783-791.
10. Galbally, I. E., and W. Kirstine. 2002. The production of methanol by flowering plants
and the global cycle of methanol. J. Atmos. Chem. 43:195-229.
11. Gibb, S., and A. Hatton. 2004. The occurrence and distribution of trimethylamine-N-
oxide in Antarctic coastal waters. Mar. Chem. 91:65-75. 455
12. Goodwin, K. D., R. K. Varner, P. M. Crill, and R. S. Oremland. 2001. Consumption
of tropospheric levels of methyl bromide by C1 compound-utilizing bacteria and
comparison to saturation kinetics. Appl. Environ. Microbiol. 67:5437-5443.
13. Heikes, B. G., W. Chang, M. E. Q. Pilson, E. Swift, H. B. Singh, A. Guenther, D. J.
Jacob, B. D. Field, R. Fall, D. Riemer, and L. Brand. 2002. Atmospheric methanol 460
budget and ocean implication. Global Biogeochem. Cycles 16:80-81.
14. Heyer, J., Y. Malashenko, U. Berger, and E. Budkova. 1984. Verbreitung
methanotropher Bakterien. Z. Allg. Mikrobiol. 24:725–744.
15. Holmes, A. J., N. J. P. Owens, and J. C. Murrell. 1995. Detection of novel marine
methanotrophs using phylogenetic and functional gene probes after methane enrichment. 465
Microbiol. 141:1947-1955.
16. Holmes, A. J., N. J. P. Owens, and J. C. Murrell. 1996. Molecular analysis of
enrichment cultures of marine methane oxidising bacteria. J. Exp. Mar. Biol. Ecol.
203:27-38.
17. Janvier, M., C. Frehel, F. Grimont, and F. Gasser. 1985. Methylophaga marina gen. 470
nov., sp. nov. and Methylophaga thalassica sp. nov., marine methylotrophs. Int. J. Syst.
Bacteriol. 35:131–139.
22
18. Kalyuzhnaya, M. G., O. Nercessian, A. Lapidus, and L. Chistoserdova. 2005. Fishing
for biodiversity: novel methanopterin-linked C1 transfer genes deduced from the Sargasso
Sea metagenome. Environ. Microbiol. 7:1909-1916. 475
19. Kiene, R. P. 1990. Dimethyl sulfide production from dimethylsulfoniopropionate in
coastal seawater samples and bacterial cultures. Appl. Environ. Microbiol. 56:3292-3297.
20. Kiene, R. P. 1992. Dynamics of dimethyl sulfide and dimethylsulfoniopropionate in
oceanic water samples. Mar. Chem. 37:29-52.
21. Kiene, R. P. 1993. Microbial sources and sinks for methylated sulfur compounds in the 480
marine environment, p. 15-33. In D. P. Kelley and J. C. Murrell (ed.), Microbial Growth
on C1 Compounds. Intercept Ltd., London.
22. Kim, S. K., F. Rassoulzadegan, B. Krajka, B. C. Nguyen, N. Mihalopoulos, and P.
Buat-Menard. 1990. Production of dimethylsulfonium propionate (DMSP) and
dimethylsulfide (DMS) by a microbial food web. Limnol. Oceanog. 35:1810-1821. 485
23. Kimura, T., I. Sugahara, and K. Hayashi. 1990. Use of short-chain amines and amino
acids as sole sources of nitrogen in a marine methylotrophic bacterium, Methylophaga sp.
AA-30. Agric. Biol. Chem. 54:1873-1874.
24. Kwint, R. L. J., and K. J. M. Kramer. 1995. Dimethylsulphide production by plankton
communities. Mar. Ecol. Prog. Ser. 121:227-237. 490
25. Lane, D. J. 1991. 16S/23S rRNA sequencing., p. 115-175. In E. Stackebrandt and M.
Goodfellow (ed.), Nucleic acid techniques in bacterial systematics. John Wiley & Sons,
Inc., Chichester, UK.
26. Levasseur, M., S. Michaud, J. Egge, G. Cantin, J. C. Nejstgaard, R. Sanders, E.
Fernandez, P. T. Solberg, B. Heimdal, and M. Gosselin. 1996. Production of DMSP 495

23
and DMS during a mesocosm study of an Emiliania huxleyi bloom: influence of bacteria
and Calanus finmarchicus grazing. Mar. Biol. 126:609-618.
27. Lidstrom, M. E. 1988. Isolation and characterization of marine methanotrophs. Antonie
van Leeuwenhoek 54:189-199.
28. Liss, P., G. Malin, and S. Turner. 1992. Production of DMS by marine phytoplankton, 500
p. 1-14. In G. Restelli and G. Angeletti (ed.), Dimethylsulphide: oceans, atmosphere and
climate. Kluwer Academic Publishing, Dordrecht.
29. Ludwig, W., O. Strunk, R. Westram, L. Richter, H. Meier, Yadhukumar, A.
Buchner, T. Lai, S. Steppi, G. Jobb, W. Forster, I. Brettske, S. Gerber, A. W.
Ginhart, O. Gross, S. Grumann, S. Hermann, R. Jost, A. Konig, T. Liss, R. 505
Lussmann, M. May, B. Nonhoff, B. Reichel, R. Strehlow, A. Stamatakis, N.
Stuckmann, A. Vilbig, M. Lenke, T. Ludwig, A. Bode, and K.-H. Schleifer. 2004.
ARB: a software environment for sequence data. Nucl. Acids Res. 32:1363-1371.
30. McDonald, I. R., K. L. Warner, C. McAnulla, C. A. Woodall, R. S. Oremland, and
J. C. Murrell. 2002. A review of bacterial methyl halide degradation: biochemistry, 510
genetics and molecular ecology. Environmental Microbiology 4:193-203.
31. Muyzer, G., E. C. de Waal, and A. G. Uitterlinden. 1993. Profiling of complex
microbial populations by denaturing gradient gel electrophoresis analysis of polymerase
chain reaction-amplified genes coding for 16S rRNA. Appl. Environ. Microbiol. 59:695-
700. 515
32. Naqvi, S. W. A., H. W. Bange, S. W. Gibb, C. Goyet, A. D. Hatton, and R. C. Upstill-
Goddard. 2005. Biogeochemical ocean-atmosphere transfers in the Arabian Sea. Prog.
Oceanogr. 65:116.
24
33. Neufeld, J. D., Y. Chen, M. G. Dumont, and J. C. Murrell. 2008. Marine
methylotrophs revealed by stable-isotope probing, multiple displacement amplification 520
and metagenomics. Environ. Microbiol. 10:1526-1535.
34. Neufeld, J. D., M. G. Dumont, J. Vohra, and J. C. Murrell. 2007. Methodological
considerations for the use of stable isotope probing in microbial ecology. Microb. Ecol.
53:435-442.
35. Neufeld, J. D., H. Schäfer, M. J. Cox, R. Boden, I. R. McDonald, and J. C. Murrell. 525
2007. Stable-isotope probing implicates Methylophaga spp. and novel
Gammaproteobacteria in marine methanol and methylamine metabolism. ISME J. 1:480-
491.
36. Neufeld, J. D., J. Vohra, M. G. Dumont, T. Lueders, M. Manefield, M. W. Friedrich,
and J. C. Murrell. 2007. DNA stable-isotope probing. Nat. Protocols 2:860-866. 530
37. Neufeld, J. D., Z. Yu, W. Lam, and W. W. Mohn. 2004. Serial analysis of ribosomal
sequence tags (SARST): a high-throughput method for profiling complex microbial
communities. Environ. Microbiol. 6:131-144.
38. Oremland, R. S. 1979. Methanogenic activity in plankton samples and fish intestines: a
mechanism for in situ methanogenesis in oceanic subsurface waters. Limnol. Oceanogr. 535
24:1136-1141.
39. Radajewski, S., P. Ineson, N. R. Parekh, and J. C. Murrell. 2000. Stable-isotope
probing as a tool in microbial ecology. Nature 403:646-649.
40. Rusch, D. B., A. L. Halpern, G. Sutton, K. B. Heidelberg, S. Williamson, S. Yooseph,
D. Wu, J. A. Eisen, J. M. Hoffman, K. Remington, K. Beeson, B. Tran, H. Smith, H. 540
Baden-Tillson, C. Stewart, J. Thorpe, J. Freeman, C. Andrews-Pfannkoch, J. E.

25
Venter, K. Li, S. Kravitz, J. F. Heidelberg, T. Utterback, Y.-H. Rogers, L. I. Falcón,
V. Souza, G. Bonilla-Rosso, L. E. Eguiarte, D. M. Karl, S. Sathyendranath, T. Platt,
E. Bermingham, V. Gallardo, G. Tamayo-Castillo, M. R. Ferrari, R. L. Strausberg,
K. Nealson, R. Friedman, M. Frazier, and J. C. Venter. 2007. The Sorcerer II global 545
ocean sampling expedition: Northwest Atlantic through Eastern Tropical Pacific. PLoS
Biol. 5:e77.
41. Sæmundsdóttir, S., and P. A. Matrai. 1998. Biological production of methyl bromide
by cultures of marine phytoplankton. Limnol. Oceanogr. 43:81-87.
42. Schaefer, J. K., K. D. Goodwin, I. R. McDonald, J. C. Murrell, and R. S. Oremland. 550
2002. Leisingera methylohalidivorans gen. nov., sp. nov., a marine methylotroph that
grows on methyl bromide. Int. J. Syst. Evol. Microbiol. 52:851-859.
43. Schäfer, H. 2007. Isolation of Methylophaga spp. from marine dimethylsulfide-
degrading enrichment cultures and identification of polypeptides induced during growth
on dimethylsulfide. Appl. Environ. Microbiol. 73:2580-2591. 555
44. Schäfer, H., I. R. McDonald, P. D. Nightingale, and J. C. Murrell. 2005. Evidence for
the presence of a CmuA methyltransferase pathway in novel marine methyl halide-
oxidizing bacteria. Environ. Microbiol. 7:839-852.
45. Schäfer, H., L. Miller, R. Oremland, and J. C. Murrell. 2007. Bacterial cycling of
methyl halides, p. 307-346. In A. I. Laskin, S. Sariaslani, and G. Gadd (ed.), Adv. Appl. 560
Microbiol., vol. 61.
46. Sieburth, J. N., P. W. Johnson, M. A. Eberhardt, M. E. Sieracki, M. Lidstrom, and
D. Laux. 1987. The first methane-oxidizing bacterium from the upper mixing layer of the
deep ocean: Methylomonas pelagica sp. nov. Curr. Microbiol. 14:285-293.
26
47. Singh, H. B., A. Tabazadeh, M. J. Evans, B. D. Field, D. J. Jacob, G. Sachse, J. H. 565
Crawford, R. Shetter, and W. H. Brune. 2003. Oxygenated volatile organic chemicals
in the oceans: inferences and implications based on atmospheric observations and air-sea
exchange models. Geophys. Res. Lett. 30:1862.
48. Tamura, K., J. Dudley, M. Nei, and S. Kumar. 2007. MEGA4: Molecular evolutionary
genetics analysis (MEGA) software version 4.0. Mol. Biol. Evol. 24:1596. 570
49. Tamura, K., M. Nei, and S. Kumar. 2004. Prospects for inferring very large
phylogenies by using the neighbor-joining method. Proc. Natl. Acad. Sci. U. S. A.
101:11030-11035.
50. Venter, J. C., K. Remington, J. F. Heidelberg, A. L. Halpern, D. Rusch, J. A. Eisen,
D. Wu, I. Paulsen, K. E. Nelson, W. Nelson, D. E. Fouts, S. Levy, A. H. Knap, M. W. 575
Lomas, K. Nealson, O. White, J. Peterson, J. Hoffman, R. Parsons, H. Baden-
Tillson, C. Pfannkoch, Y.-H. Rogers, and H. O. Smith. 2004. Environmental genome
shotgun sequencing of the Sargasso Sea. Science 304:66-74.
51. Vila-Costa, M., D. A. del Valle, J. M. Gonzalez, D. Slezak, R. P. Kiene, O. Sanchez,
and R. Simo. 2006. Phylogenetic identification and metabolism of marine 580
dimethylsulfide-consuming bacteria. Environ. Microbiol. 8:2189-2200.
52. Wang, Q., G. M. Garrity, J. M. Tiedje, and J. R. Cole. 2007. Naive Bayesian classifier
for rapid assignment of rRNA sequences into the new bacterial taxonomy. Appl. Environ.
Microbiol. 73:5261-5267.
53. Williams, J., R. Holzinger, V. Gros, X. Xu, E. Atlas, and D. W. R. Wallace. 2004. 585
Measurements of organic species in air and seawater from the tropical Atlantic. Geophys.
Res. Lett. 31:L23S06.

27
Figure 1. Physical location and bacterial composition of samples. A chlorophyll-a satellite
image (A) from July 24, 2006 shows regions of high chlorophyll associated with a mixed bloom 590
dominated by Emiliania huxleyi and Karenia. (B) Bacterial DGGE fingerprints of samples taken
from the locations indicated in (A). (C) Frequency of 16S rRNA gene clones belonging to major
phylogenetic groups across the different gene libraries analysed.
Figure 2. DGGE fingerprint comparison of ‘light’ and ‘heavy’ DNA associated with DNA SIP
incubations with different carbon sources (MMA, monomethylamine; DMA, dimethylamine; 595
MOH, methanol; MBr, methyl bromide; DMS, dimethylsulfide). The dendrogram scale bar
refers to percent similarity of Pearson correlations between fingerprint densitometric curves.
Shading of the triangle pointers indicates the phylogenetic affiliations of sequenced bands, most
of which were associated with clades in Figure 3. Numbers to the bottom right of fingerprints
correspond to sequenced bands submitted to Genbank. For example, the open triangle for 600
fraction 7 of the 13
C-methylbromide SIP (MBr_7) will be labelled MBr_7_3 for the Genbank
submission. Several bands were not associated with clades but were affiliated with sequences in
Figure 3: MBr_7_3 is identical to MBr_587_7, DMA_7_6 is closest to MBr_587_24, DMS_7_2
is identical to DMS_584_3.
Figure 3. Phylogenetic affiliations of 16S rRNA gene sequences obtained by 13
C1-SIP 605
incubations with methanol (MOH), monomethylamine (MMA), dimethylamine (DMA), methyl
bromide (MBr) and dimethylsulfide (DMS) SIP incubations. Selected Genbank sequences from
uncultivated clones and reference strains are included for comparison. Bootstrap values are
included for all branch points on this neighbour-joining tree. Genbank accession numbers are
28
included within parentheses. The scale bar (within tree) represents 5% sequence divergence. The 610
collapsed clades are expanded in Figures S2, S3 and S4 found in the supplemental material. The
division-level affiliation of sequences indicated in the boxes along the right-hand side. CFB is
Cytophaga–Flavobacterium–Bacteroides.
615