effect of organizational employee retention …
TRANSCRIPT

i
EFFECT OF ORGANIZATIONAL EMPLOYEE RETENTION
STRATEGIES ON PROJECT COMPLETION
THE CASE OF CIVICON LIMITED –MOMBASA COUNTY, KENYA
BY
PETER MUNYAO KIMILU
A RESEARCH PROJECT REPORT SUBMITTED IN PARTIAL FULFILLMENT OF THE REQUIREMENT FOR THE AWARD OF THE DEGREE OF MASTER OF ARTS IN PROJECT PLANNING AND MANAGEMENT OF THE UNIVERSITY OF NAIROBI.
2014

ii
DECLARATION
I hereby declare that this project report is the result of my original work and that no part of it has
been presented for another dissertation in this university or elsewhere for the purpose of
examination or otherwise.
PETER MUNYAO KIMILU
REGISTRATION NUMBER: L50/69021/2011
Signature: …………………………….. Date: ……….………………………
This research project report has been submitted for examination with my approval as a University
Supervisor.
Signature……….……………………….. Date: …………………………
MR. JOHNBOSCO KISIMBII
LECTURER, DEPARTMENT OF EXTRA MURAL STUDIES
UNIVERSITY OF NAIROBI

iii
DEDICATION
This project is dedicated to my loving family and friends for their daily inspiration, moral support
and encouragement during my study. A special dedication to my daughter Trizah who relentlessly
motivated me and stayed with me at late hours while writing the project.
Above all I thank God Almighty for guiding me and opening this window of opportunity for me.

iv
ACKNOWLEDGEMENT
I wish to express my gratitude to the University of Nairobi for refining and increasing my
knowledge in Project Planning and Management. I appreciate my supervisor Mr. Johnbosco
Kisimbii for not only reading and offering very incisive comments but also for the great patience
with me. I highly appreciate his insight and guidance over this work and the encouragement. I am
also grateful to my lecturers in the University that laid the foundation useful in the writing of this
project. My sincere appreciation also goes to my classmates Shadrack Kibet, Jackbet Mwanza,
Ken, Esther, Janet, Mike, Kinyua etc who made my studies fun. I extend my gratitude to my
brother Cyprian Kimilu for the support in this research report.

v
TABLE OF CONTENTS Page
DECLARATION ………….……………………………………………………………………..ii
DEDICATION …………………………………………………………………………………..iii
ACKNOWLEDGEMENT ……………………………………………………………………...iv
TABLE OF CONTENTS ……………………………………………………………………......v
LIST OF TABLES ……………………………………………………………………………..viii
ABBREVIATIONS ……………………………………………………………………………...xi
ABSTRACT……………………………………………………………………………………..xii
CHAPTER ONE: INTRODUCTION …………………………………………………………..1
1.1 Background of the Study……………………………………………………………………..1
1.2 Statement of the Problem…………………………………………………………………….5
1.3 Purpose of the study …………..……………………………………………………………..6
1.4 Objectives of the study……………………………………………………………………... .6
1.5 Research Questions ……………………………………………………………….................6
1.6 Research Hypothesis ………………………………………………………………………...7
1.7 Significance of the Study…………………………………………………………………….7
1.8 Basic Assumptions of the study……………………………………………………………...7
1.9 Limitations of the study…..………………………………..………………………………...8
1.10 Delimitations of the Study…………………………………………………………………...8
1.11 Definition of significant terms used in the Study………………………………....................9
1.12 Organization of the study…………………………………………………………………...10
CHAPTER TWO: LITERATURE REVIEW ………………...………………………………11
2.1 Introduction………………………………………………………………………………….11
2.2 Overview of importance of retention strategies……………………………………………..11
2.3 Organisational commitment as an employee retention strategy……………………………..13
2.4 Wages and rewards as a retention strategy affecting employee retention…….......................14
2.5 The effect of training and development as a retention strategy…………..……....................17
2.6 The effect of the work environment as a retention strategy.…...……………………………20

vi
2.7 Conceptual framework…..…………………………………………………………………..21
2.8 Summary of the literature review……………………………………...…………………….23
CHAPTER THREE : RESEARCH METHODOLOGY …….……………………………….24
3.1 Introduction………………………………………………………………………………….24
3.2 Research Design…………………………………………………………………................. 24
3.3 Target Population……………………………………………………………….……….…..24
3.4 Sample size and Sampling Procedure……………………………………………………….25
3.5 Data Collection Instruments…………………………….……………………………….…..26
3.6 Validity and Reliability of the Research Instrument……………………………..................26
3.7 Data Collection Procedures………………………………………………………………….27
3.8 Ethical considerations……………………………………………………………………….27
3.9 Data presentation and Analysis…………………………………………………..................27
3.10 Operational definition of variables……………………………………………………...….28
CHAPTER FOUR: DATA ANALYSIS, PRESENTATION AND INTER PRETATION... .29
4.1 Introduction……………………………………………………………………....................29
4.2 Response rate………………………………………………………………………………..29
4.3 Demographic Information of Respondents….…………………………………...................30
4.4 Organisational commitment as retention strategy affecting project completion..............…..37
4.5 Wages level and rewards as retention strategy affecting project completion...………….….42
4.6 Training and career development as retention strategy affecting project completion……....45
4.7 Working environment as a retention strategy affecting project completion…………….…..51
CHAPTER FIVE: SUMMARY OF FINDINGS, DISCUSSIONS, CON CLUSION AND
RECOMMENDATIONS ……………………………………………………………................59
5.1 Introduction…………………………………...…………………………………………….59
5.2 Summary of findings…………………………………………………………......................59
5.3 Discussions……………………………………………………………………………..…...61
5.4 Conclusion……………………………………………………….………….........................63
5.5 Recommendation……………………………………………………………….………...…63

vii
5.6 Suggestions for further research……………………………………………………..……...63
REFERENCES………………………………………...………………………….…................65
Appendix I: Letter to the Respondents...……………………………………………………......70
Appendix II: Research Questionnaires……………………………………...…………................71
viii
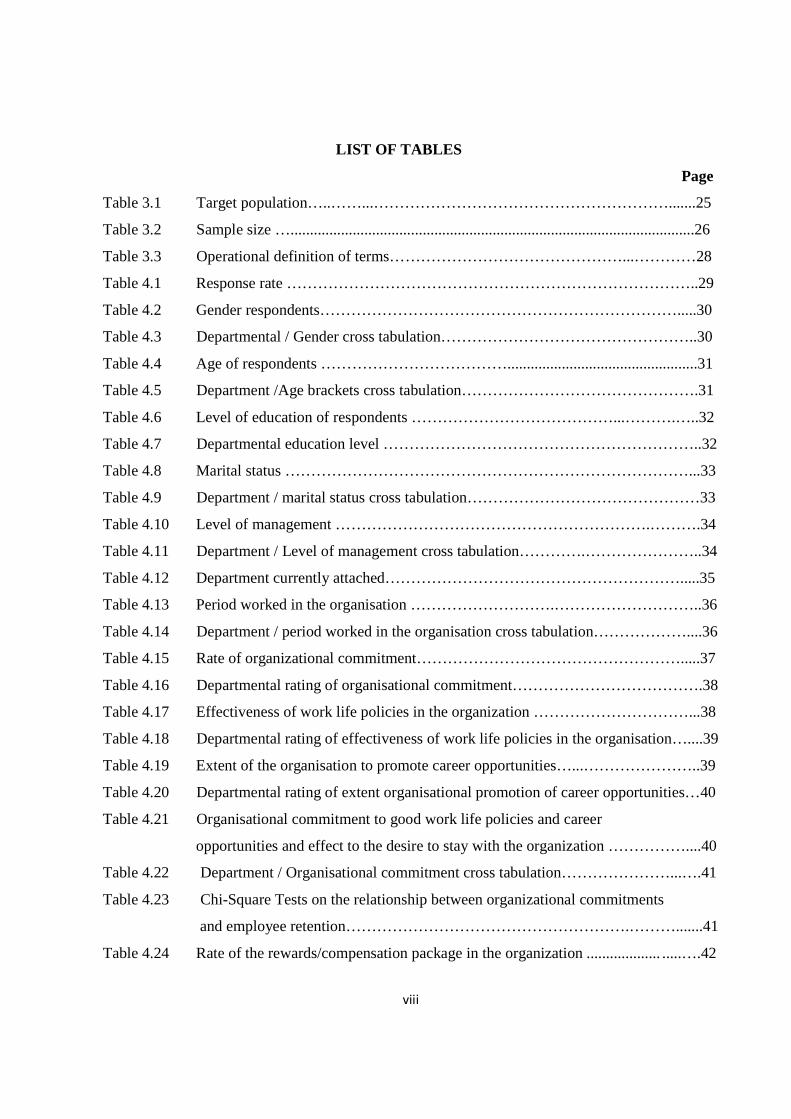
LIST OF TABLES
Page
Table 3.1 Target population…..……...………………………………………………….......25
Table 3.2 Sample size …........................................................................................................26
Table 3.3 Operational definition of terms………………………………………...…………28
Table 4.1 Response rate ……………………………………………………………………..29
Table 4.2 Gender respondents…………………………………………………………….....30
Table 4.3 Departmental / Gender cross tabulation…………………………………………..30
Table 4.4 Age of respondents ……………………………….................................................31
Table 4.5 Department /Age brackets cross tabulation……………………………………….31
Table 4.6 Level of education of respondents …………………………………...……….…..32
Table 4.7 Departmental education level ……………………………………………………..32
Table 4.8 Marital status ……………………………………………………………………...33
Table 4.9 Department / marital status cross tabulation………………………………………33
Table 4.10 Level of management …………………………………………………….……….34
Table 4.11 Department / Level of management cross tabulation………….…………………..34
Table 4.12 Department currently attached………………………………………………….....35
Table 4.13 Period worked in the organisation ……………………….………………………..36
Table 4.14 Department / period worked in the organisation cross tabulation………………....36
Table 4.15 Rate of organizational commitment…………………………………………….....37
Table 4.16 Departmental rating of organisational commitment……………………………….38
Table 4.17 Effectiveness of work life policies in the organization …………………………...38
Table 4.18 Departmental rating of effectiveness of work life policies in the organisation…....39
Table 4.19 Extent of the organisation to promote career opportunities…...…………………..39
Table 4.20 Departmental rating of extent organisational promotion of career opportunities…40
Table 4.21 Organisational commitment to good work life policies and career
opportunities and effect to the desire to stay with the organization ……………....40
Table 4.22 Department / Organisational commitment cross tabulation…………………...….41
Table 4.23 Chi-Square Tests on the relationship between organizational commitments
and employee retention……………………………………………….……….......41
Table 4.24 Rate of the rewards/compensation package in the organization ................... .....….42

ix
Table 4.25 Departmental rating of the rewards / compensation package in the organisation…43
Table 4.26 Feeling proud of your work is more important to you than getting a pay raise. .....43
Table 4.27 Departmental rating of importance of pay raise……………………………….…..44
Table 4.28 Extent of various types of rewards increases on commitment to the
organization……………………………………………………………………..…44
Table 4.29 Chi-square test results on the effect of Wages level and rewards on
employee turnover and project completion……………………………………..…45
Table 4.30 Rate of the organization’s training programme……………………………………46
Table 4.31 Departmental rating of the organization’s training programme…………………...46
Table 4.32 The extent would training and career development opportunities
influence employee commitment to the organization………………………….…47
Table 4.33 Departmental rating to extent to which training and career development
opportunities influence employee commitment…………………………………...47
Table 4.34 How education level increases commitment to the organisation…………...……..48
Table 4.35 Departmental rating of how education level increase commitment to the
Organisation………………………………………….……………………………48
Table 4.36 The effect of number of training days in the organisation on commitment
to the organisation…………………………………………………………...……49
Table 4.37 Department rating on whether the number of training days in the
organisation affects commitment to the organisation………..……………………49
Table 4.38 The rating of education level, Training days and training programmes
on influence on commitment to the organization …………...…………….....…..50
Table 4.39 Departmental rating of education level, Training days and training
programmes on influence on commitment to the organization…….…………….50
Table 4.40 Chi-Square Tests on the relationship between training and career
development and employee retention…..…………..………………………..….....51
Table 4.41 Rating of the organization’s working environment…………………………..…....52
Table 4.42 Department rating of the organization’s working environment…………………..52

x
Table 4.43 Which of the following would mostly influence your commitment to the
organization……..……………………..……………………………………..……53
Table 4.44 Departmental ranking of working condition, safety regulation and working
hours on their influence on commitment to the organisation……………...………53
Table 4.45 How safety regulation affects decision to leave or stay in the organisation.....…....54
Table 4.46 Departmental rating of whether safety regulation affects decision to leave or
stay in the organisation…………………………………………………………….54
Table 4.47 How the work environment in the organisation increase commitment
to the organisation…………………….…………………….………………..……55
Table 4.48 Departmental rating of whether the work environment in the organisation
increase commitment………………………………………………………………55
Table 4.49 How working hours affects decision to leave or stay in the organisation………... 56
Table 4.50 Departmental rating of whether working hours affect decision to leave or stay
in the organisation…………………………………………………………………56
Table 4.51 Chi-Square Tests on the relationship between working environment and
Employee retention………………..……………………………………...……….57
Table 4.52 Numbering the various Retention Strategies to indicate the extent to which
they would affect your commitment to the organization…………..……...………57
Table 4.53 Departmental rating of various retention strategies to indicate the extent to
which they would affect your commitment to the organization ………………..…58

xi
ABBREVIATIONS
ILO International Labour Organisation
MBA Master of Business Administration
SPSS Statistical Package for Social Sciences

xii
ABSTRACT
Retention of employees is an important function of the Human Resource Department. Employee retention is the foremost problem which all organizations are now facing in the global competitive environment as employee retention is a major challenge faced by the companies globally. Unless there is a deliberate and serious effort from the management towards this direction, the competitors in the industry are likely to attract and snatch the talent already nurtured in the company over a period of time. Careful strategies for crafting and implementing employee retention strategies are a skill and should be given top priority by the management. The purpose of this study was to empirically examine employee retention strategies and their effect on project completion at Civicon Limited. The study would benefit other companies which may wish to retain their talented employees. From the analysis of past studies, it was clear that retention of employees is very important and more so retention of key staff. Concerted action is thus required to retain talented people. The study adopted descriptive survey research design with questionnaires being the data collection procedure. This study involved a target population of 120 employed staff working in this organisation and a sample size of 90 employees representing 75% of the target population. The study revealed that it is more profitable for organizations to put in place appropriate employee retention strategies such as organisational commitment, financial rewards inform of wages, promoting training and career development on employees and improving the working environment. The researcher recommended that the reward package should be restructured to motivate the employees more. This could be done by comparing and implementing using those of best practices in the industries. Also the management of the organisation should address employees concerns on time and improve the working conditions. This can be done by putting the employee’s suggestions in action and act on them immediately they are expressed.
1
CHAPTER ONE
INTRODUCTION
1.1 Background of the study
Retaining a positive and motivated staff is vital to an organization's success. High employee
turnover increases expenses and also has a negative effect on company morale. Implementing an
employee retention program is an effective way of making sure key workers remain employed
while maintaining job performance and productivity.
Beadles et al. (2008) found a positive and significant correlation between job retention and
organizational performance. Campion (2007) found that inescapable turnover was
characteristically viewed as critical to an organization. The notion that turnover decreases the
organizational performance was supported by the most of researchers. Mobley (2008) suggested
that turnover might interrupt job performance when an employee who intended to leave became
less efficient and effective. Shaw, Gupta, and Delery, (2012) found empirically that voluntary
turnover was associated with the inferior organizational performance. Other researchers suggested
that turnover could improve performance and completion of projects. One probable advantage of
turnover was the exclusion of poor performing employees (Price, 2009). Furthermore, Staw et al;
(2009) proposed that turnover might enhance performance if most of the turnover was by
employees with longer or very short tenure.
Employee turnover refers to the movement of employees out of an organization (Reggio 2010). It
is a negative aspect, which might lead to the failure of employee retention strategies in the
organizations affecting the completion of projects. Leaving of job appears to reflect significant
work place problems, rather than opportunities for advancement into better jobs (Holzer and
Wissoker, 2001). Turnover of employees disrupts teams, raises costs, reduces productivity, and
results in lost knowledge. So, it is essential for the management to realize the importance of
employee job satisfaction. It was estimated in a study by Abbasi & Hollman in 2000 that
American industries incurred $11 billion annually as a result of voluntary and involuntary
turnover. This cost was due to termination, advertising, recruitment, selection and hiring. Turnover
also produced ethereal costs, such as declining morale, and the interruption of social and
communication patterns as noticed by Mobley (2009). Beadles et al (2008) stressed the study of
turnover as a well-researched area which was one of the major interests in organizational

2
behaviour. Shaw (2007) studied the association between employee turnover and organizational
culture and Kaak, Feild, Giles, and Norris in 2007 explored the concept of turnover culture
amongst lower staff. Some studies by Pizam & Ellis, (1999) recommended retention programs that
could diminish turnover and its cause and effects. Realistic job previews, job enrichment,
socialization practices were included. Boles et al. (2011) studied to make use of the pre-
employment application demographics to reduce employee turnover. Hampton, 2012 Shanahan,
2012, Schreiber, 2013; Baumann, 2010 studied that the literature was also immersed with
recommendations to undertake turnover and reduce retention.
In their study, Pinkovitz et al. (2004) attempted to know how much an organization is more likely
to spend to ensure getting an adequate return on investment (ROI) in employees. Turnover direct
costs enclose factors such as termination, vacancy, recruitment and selection, orientation and
training. Other indirect costs can encompass such factors as loss of productivity of incumbent prior
to departure, loss of productivity of co-worker, loss of productivity of the new hire during initial
transition.
According to Pizam & Ellis, (2012), retaining top talented employees is a priority for every
organization, in every industry and every part of the globe. However, turnover is not always a bad
thing. It is important for any organization to see an ongoing, regular influx of new talent that
brings fresh ideas and experience along with a different perspective. Turnover can help rejuvenate
an organization and invites everyone to continually examine and challenge common practices and
assumptions, looking for ways to improve. But too much turnover can harm the organization,
resulting in uneven workloads, lower employee morale or engagement, loss of corporate
knowledge or memory, lack of continuity particularly in customer or supplier relationships,
problems with quality or productivity and finally affect project completion .
The people organizations wish to retain are often the ones most likely to live. It was claimed by
Reed (2008) as cited by Armstrong (2009) that every worker is five minutes away from handing in
his or her notice and 150 working hours away from walking out of the door to a better offer. There
is no such thing as a job for life and today’s workers have a few qualms about leaving employers
for greener pastures.

3
One of the biggest challenges companies undertaking project work are facing is the attraction and
retention of top performers as some of the projects require specialist skills. Armstrong (2009)
defines employee turnover – also referred to as wastage, attrition – as the rate at which people
leave an organization. Turnover of employees, especially key staff or high performers for
specialised projects, can be disruptive and costly.
Retention involves taking measures to encourage employees to remain in the organization for the
maximum period of time. Effective employee retention is a systematic effort by employers to
create and foster an environment that encourages current employees to remain employed, by
having policies and practices in place that address their diverse needs (Workforce Planning for
Wisconsin State Government, 2005). These policies and practices employed by organizations to
encourage employees to remain in the organization are what are referred to as the retention
strategies.
Labour turnover can be either voluntary or involuntary. According to Noe, Hollerbeck, Gerhart
and Wright (2007), involuntary turnover is turnover initiated by the organization (often among
people who would prefer to stay), while voluntary turnover is turnover initiated by employees
(often whom the company would prefer to keep). For purposes of this study, the researcher
focused on effect of employee retention strategies on voluntary turnover affecting project
completion. The turnover of key employees will mean loss in productivity, loss of customers,
damaged morale, damaged organization image, destabilized business and incurring costs
associated with separation, hiring and training, all which will affect the organization’s overall
performance and project completion. Powerful leaders know that the success of their company is
built on the quality of their people. Thus retaining top or key performers is critical to the long term
health and success of the business (Armstrong 2009).
To counter turnover and its resulting effects, concerted action is required to retain talented people.
Organizations must therefore work on their employee value proposition. An organization’s
employee value proposition consists of what an organization has to offer that prospective or
existing employees would value and which would help to persuade them to join or remain with the
business (Armstrong 2009). It will include remuneration which is important but can be over
emphasized compared with other elements that are non-financial in nature. These non-financial
factors may be crucial in attracting and retaining people and include the attractiveness of the

4
organization, the degree to which it acts responsibly, respect, diversity and inclusion, work-life
balance and opportunities for personal and professional growth. The aim is to become an employer
of choice, a firm people want to work and stay with.
According to Kusluvan (2012), one of the major benefits of the development of the service
industry in any economy is the provision of employment as the industry is labour intensive. In
Kenya, little research has been conducted regarding labour turnover in the service industry and
especially on organisations undertaking projects. Research on labour turnover in service industry
in Kenya (International Labour Organisation, 2001) indicated similar trends of labour turnover
with lodges on the lead with 60% in 2000. This impacted negatively in business sustainability due
to high costs of training new employees, replacement and separation for the departing employees.
In addition, are the detrimental effects of customer dissatisfaction. In Kenya especially the banking
industry, tourism industry, construction industry and media houses are making all efforts to retain
key performing employees by training them and offering financial incentives. Despite all this,
employees are moving from one bank to another and one media house to another or from one
NGO to another (International Labour Organisation, 2001)
In almost any organization, if the management utilizes the information compiled through the exit
interview system positively, it would result in a controlled turnover and develop an effective
retention strategy (Gray, 2013). Gray (2013) reiterates that organizations need to assess their
typical patterns of turnover pertaining to their own circumstances. However, there are some
general policies that should be considered so as to improve employee job satisfaction. Employees'
job satisfaction is positively correlated with employees' retention. Reggio (2010) concluded from
literature review that it is important that organizations strive to keep employees satisfied. Happy
employees may be less likely to be absent from their job voluntarily or to look for work elsewhere.
To overcome the negative consequences of turnover affecting project completion, there is a need
to understand the causes and the consequences of turnover. Firms must therefore strive at all times
to ensure that the right caliber of employees is recruited. The success or failure of the firm
therefore depends to a large extent, on the ability of the company to attract and retain the right
people for the job. However, an organizations ability to retain its employees is a function of many
factors. For business organisations to succeed and sustain their success in any project undertaken,

5
the understanding of the functioning of the organisation is vital. Human resource activities
especially retention programme is a key component.
1.2 Statement of the problem
Employee retention is a major challenge faced by companies globally. It affects the ability of the
organisation achievement of its objectives. Organizations are striving to retain their talented staff
by implementing effective retention strategies. High employee turnover would subsequently have
an impact on productivity and sustainability of the organization affecting projects. Some
organisations are not aware of the causes of employee turnover or what can retain the employees
in the organisation as studies conducted have dealt with financial retention strategies and no much
study has been carried out to identify other retention strategies.
Several studies have been done on labour turnover especially in the western countries such as the
United Kingdom. However, there have been conflicting results as to what these factors are and
how much each contributes to the turnover incident. For example, Viscussi and Khan (2006),
argued in their findings that there is a significant inverse relationship between wages and turnover,
while other researchers argue turnover is related to work environment (Martin 2008). From the
previous research findings (Freeman 1980, Datche,r 1993 and Booth al, 1996), it was found that
labour turnover is related to certain industrial, economic, and demographic factors such as age,
sex, education, ethnicity, and length of service among other variables.
Researchers like Freeman 1980, Datcher 1993 and Booth al, 1996, have suggested that employee
turnover is among the highest in the service industry. Many project organisations and construction
companies are familiar with this costly problem. When employees leave, valuable knowledge is
lost and even projects are adversely affected. Moreover, getting a new employee ramped up to
performance levels similar to the one you have lost takes time and money. NGOs and other
organisations which actively find ways to retain employees gain a sustainable competitive
advantage.
Labour turnover continues to be a contentious issue in the service industry in Kenya and especially
for organisation undertaking projects as affects project completion and these projects requires
specialised knowledge. Employers see the process of staff leaving and being replaced as a natural
and inevitable feature of the industry. Labour turnover represents direct cost to these

6
organizations. It affects organizational growth, profitability and customer satisfaction. This may
also affect donor funding for projects funded by donors. Previous studies done on other parts of
the world reveal this phenomenon as costly and subsequently create operational difficulties in the
workplace. There is a direct correlation between labour turnover and project completion as most of
the projects are labour intensive and if employees leave the organisation project completion may
be affected. When projects are not completed in time, resources may be wasted. In Kenya,
statistics indicated that there has been documentation on labour turnover index rate and mobility
rate within the industry but the reasons for mobility is not clearly known thus there was a need to
carry out research to establish the cause of high labour turnover in the construction industry,
(International Labour Organisation, 2001)
1.3 Purpose of the study
The purpose of this study was to analyze the effects of organizational employee retention
strategies on project completion.
1.4 Objectives of the study
The objectives of this study were: i) To determine the extent to which organizational commitment influences employees retention
and project completion.
ii) To investigate the extent to which wage level and rewards influences employee retention and
project completion
iii) To assess the extent to which training and career development affects employee retention and
project completion
iv) To establish the extent to which working environment influences employee retention and
project completion.
1.5 Research Questions
The study was guided by the following research questions:
i) To what extent does organisational commitment influence employee retention and project
completion?

7
ii) To what extent does wages level and reward influence employee retention and project
completion?
iii) To what extent does training and career development affect employee retention completion of
contracts?
iv) To what extent does the working environment influence employee retention and projects
completion?
1.6 Research Hypotheses
The study tested the following hypothesis;
1. H1 Organisational commitment does influence employee retention and project completion.
2. H1 Wages level and rewards does influence and employee retention and project completion.
3. H1 Training and career development does influence employee retention and project completion.
4. H1 Working environment does influence employee retention and project completion.
1.7 Significance of the study
The findings of this study will not only be useful to the researcher but also to the organization
under study and to other researchers. To the researcher, it will give a better understanding of the
different retention strategies and their effectiveness. To Civicon Limited, it is hoped that the study
will help the Human Resource department refine retention policies and strategies already in
existence by highlighting the adequacy or otherwise of these policies.
To the employees of the organisation, the study will give them a chance to voice their appreciation
or concern about the existing retention strategies and give their recommendations. Other
researchers will benefit from this study by borrowing ideas on how to retain employees when
organizations experience high turnovers. They will borrow suggested study areas that will come
out from the findings of this research.
1.8 Basic Assumptions of the Study
The research project was based on the assumptions that the respondent of this study are conversant
with the various methods employed by the organisation to retain them and the employees will
provide truthful and reliable survey information and the organisation is a good representative of
the rest of the companies in the construction industry.
8
1.9 Limitations of the study
Limitations include any aspect of the study that might negatively affect the results of that study.
Therefore, the challenges that might be encountered during the study include:
Limited study; The study focused on one organization leaving no chance for comparison and this
might affect the effectiveness of the study. Additionally the study was based only at Civicon
Limited offices in Mombasa County which is the head office it did not extend to project in other
places in Southern Sudan, Turkana County and Congo. To counter this, it was believed that the
company applies the same policies for employee retention in all other construction sites.
Additionally Civicon Limited has been one of the leading construction companies in East and
Central Africa, may be the best company in the industry applying the appropriate policies of
retaining key performing employees to remain more competitive in the market and ensure that
their projects are completed on time.
Accessibility to information; Organizations hold their information and operations with a high
level of confidentiality. Civicon Limited might not be willing to divulge information in fear of
breaching confidentiality. To tackle this problem of confidentiality, the researcher assured the
management of the organisation that the information acquired will be used only for research
purposes.
Delayed response; Not all respondents filled in their questionnaires within the scheduled time and
so the researcher was forced to give them more time. Extending the time affected the time plan set
by the researcher. The researcher had envisioned this kind of delay and had to provide for this in
the initial set up of the time plan. Thus all that was done for reworking the time plan to reflect the
changes.
1.10 Delimitations of the study
This study was confined to Civicon Limited head office and targeted its top management, middle
level managers, operational staff and support staff. The study was to seek to understand the
retention strategies and policies applied at all these levels and come up with suggestions on how to
make them more effective so as to reduce employee turnover which may affect the completion of
their projects. It is believed that the organisation is one of the leading construction companies in
Kenya and beyond and is the best firm applying the appropriate policies of retaining key

9
performing employees to remain more competitive in the market. Also Civicon Limited is
operating in the construction industry which is believed to be one of the sectors where
management is sensitive in implementing policies to retain key performing employees. By
carrying a study in this industry, it identified the key retention strategies applied by the key players
in this important sector of the Kenya economy.
1.11 Definition of significant terms used in the study
The key terms used in the study were:
Organizational commitment: Is the individual's psychological attachment to the organization
which predicts work variables such as turnover, organizational citizenship behavior, and job
performance
Training and career development: is where organizations provide opportunities for personal and
professional growth through training. It refers to any attempt to improve employee performance on
a currently held job or one related to it.
Work environment: It refers to the surrounding within which employees carry out their
respective tasks or duties. It consists of the systems of work, the design of jobs, working
conditions and the way in which people are treated at work by their managers and co-workers.
Employee Retention strategy: The process of keeping employees within the organization by
taking steps to help prevent unwanted turnover. It also involves taking measures to encourage
employees to remain in the organization for the maximum period of time
Project completion: A term used to refer to the setting of explicit goals that must be attained to
call a component or deliverable of the project done.

10
1.12 Organization of the study
Chapter one outlines the background of the study, the problem statement, the purpose of the study
and its rationale together with its significance. The researcher come up with research objectives
and research hypothesis that guided the study in coming up with the effect of employee retention
strategies on project completion.
Chapter two presents a review of literature and relevant research associated with the five variables
by providing a clear understanding on the objectives of the study. Incorporated in the chapter is the
conceptual framework.
Chapter three presents the methodology and procedures for data collection and analysis.
Chapter four contains data analysis, presentation and interpretation of the results in tables, cross
tabulation, percentages and Chi- square test results.
Chapter five offers a summary and discussion of the researcher’s findings on the effects of
organisational retention strategies on project completion.
11
CHAPTER TWO
LITERATURE REVIEW
2.1 Introduction
Literature review is the evaluation of all sources of information or data that relates to the topic
under study. Literature review has also been defined by Hart (2004) as the use of ideas in the
literature to justify the particular approach to the topic, the selection of methods, and
demonstration that a study or project contributes something new.
This chapter analyzed views from several authors related to retention of employees which may
affect project completion. The chapter has four sections which include a review of past studies,
conceptual frame work, a critical review of the gaps in the literature and the summary of the
specific objectives of the study.
2.2 Overview of importance of retention strategies
Long term health and success of any organization depends upon the retention of key employees.
To a great extent customer satisfaction, organizational performance in terms of increased sales,
satisfied colleagues and reporting staff, effective succession planning etc. is dependent upon the
ability to retain the best employees in any organization. Encouraging employees to remain in the
organization for a long period of time can be termed as employee retention. It is a process in which
the employees are encouraged to remain with the organization for the maximum period of time or
until the completion of the project. Maertz & Campion (2008) stated relatively less turnover
research has focused specifically on how an employee decides to remain with an organization and
what determines this attachment. Retention processes should be studied along with quitting
processes. Zineldin, (2005) has viewed retention as an obligation to continue to do business or
exchange with a particular company on an ongoing basis.
Denton (2010) has clearly stated that employees who are happy and satisfied with their jobs are
more dedicated towards their work and always put their effort to improve their organizational
customer’s satisfaction. Stauss et al., (2001) has defined retention as customer liking,
identification, commitment, trust, readiness to recommend, and repurchase intentions, with the
first four being emotional-cognitive retention constructs, and the last two being behavioural

12
intentions. Panoch, (2001) forwarded the view that organizations today take great care in retaining
its valuable employees and good employees as they are increasingly becoming more difficult to
find . Walker (2007) was of the view that managing and retaining promising employees’ is an
important fundamental mean of achieving competitive advantage among the organizations. Cutler
(2001) was of the view that one of the most important demands on management today in any
organization is keeping the most vital and dynamic human resources motivated and dedicated. It is
not important to see who the organization hires but what counts is that who are kept in the firm.
Steel, Griffeth, & Hom (2002) added to this view that the fact is often overlooked, but the reasons
people stay are not always the same as the reasons people leave. Researchers such as Amadasu
(2003), Taplin et al.(2003), Gberevbie(2008) have found that if appropriate employee retention
strategies are adopted and implemented by organisations employees will surely remain and work
for the successful achievement of organisational goals . In the view of Acton et al., (2003), the
Human Resource Department plays an active role in retaining its employees. It make policies for
employee betterment such that employee would be satisfied with the organization and stay with
the firm for longer time. This shows that it is not just retention of employees but also retention of
valued skills.
Researchers such as Cascio (2003), Heneman and Judge (2003), Gberevbie (2008) have agreed
that an organization’s inability to formulate and implement strategies capable of recruiting
competent employees and retaining them to achieve organizational goals is one of the main
challenge facing organizations in the area of performance. Workforce Planning for Wisconsin
State Government (2005) has defined employee retention as a systematic effort to create and foster
an environment that encourages employees to remain employed by having policies and practices in
place that Employee Retention. According to Olowu and Adamolekun (2005), it is becoming more
essential to secure and manage competent human resource as the most valuable resource of any
organization, because of the need for effective and efficient delivery of goods and services by
organizations, whether in public or private sector. Therefore, for an organization to realize its
goals, appropriate strategies for employee recruitment and retention are very important for
enhanced performance. Researcher such as Kaliprasad (2006) has confirmed that despite the fact
that a company may try to bring all these factors into play to enhance employee retention, an
employee can still choose to leave the workplace because of, for example, bad management.
Kaliprasad (2006) pointed out that an organizations ability to retain its employees completely

13
depends upon its ability to manage them. He found out four interlinked processes that can be
utilized for an effective human resource management system: the motivational process; the
interaction process; the visioning process; and the learning process. Baker (2006) gave stress on
the fact that hiring new employees are far difficult as well as costlier than to keep the current
employees in the organization. That is why the core issue in any organization is to give a
continuous ongoing effort to identify and try to keep all the best performers irrespective of their
age. Gberevbie (2008) has stated that employee retention strategies refer to the plans and means,
and a set of decision making behavior put formulated by the organizations to retain their
competent workforce for performance
2.3 Organisational commitment as an employee retention strategy
Many studies have reported a significant association between organisational commitment and
turnover retentions (Lum et al, 2011). Tang et al’s (2008) study confirmed the link between
commitment and actual turnover and Griffeth et al’s (2010) analysis showed that organisational
commitment was a better predictor of turnover than overall job satisfaction.
Researchers have established that there are different types of organisational commitment. Allen &
Meyer (2007) investigated the nature of the link between turnover and the three components of
attitudinal commitment: affective commitment refers to employees’ emotional attachment to,
identification with and involvement in the organisation; continuance commitment refers to
commitment base on costs that employees associate with leaving the organisation; and normative
commitment refers to employees’ feelings of obligation to remain with the organisation. Put
simply, employees with strong affective commitment stay with an organisation because they want,
those with strong continuance commitment stay because they need to, and those with strong
normative commitment stay because they feel they ought to. Allen and Meyer’s study indicated
that all three components of commitment were a negative indicator of turnover. In general, most
research has found affective commitment to be the most decisive variable linked to turnover
The relationship between satisfaction and turnover has been consistently found in many turnover
studies (Lum et al, 2003). Mobley et al 2008) indicated that overall job satisfaction is negatively
linked to turnover but explained little of the variability in turnover. Griffeth et al (2000) found that
overall job satisfaction modestly predicted turnover. In a recent New Zealand study, Boxall et al

14
(2003) found the main reason by far for people leaving their employer was for more interesting
work elsewhere. It is generally accepted that the effect of job satisfaction on turnover is less than
that of organisational commitment.
Some researchers have established a relationship between satisfaction, organisational commitment
and turnover. Lum et al’s (2003) study of pediatric nurses suggested that organisational
commitment has the strongest and most direct impact on the intention to quit whereas job
satisfaction has only an indirect influence. They suggested that satisfaction indirectly influences
turnover in that it influences commitment and hence turnover intentions. (Mueller & Price,2010
cited in Lum).
Elangovan (2001) noted that the notion of job satisfaction and organisational commitment being
causally related has not been incorporated in most turnover models. His study indicated there were
strong causal links between stress and satisfaction (higher stress leads to lower satisfaction) and
between satisfaction and commitment (lower satisfaction leads to lower commitment). He further
noted a reciprocal relationship between commitment and turnover intentions (lower commitment
leads to greater intentions to quit, which in turn further lowers commitment). In summary, only
commitment directly affected turnover intentions.
2.4 Wages and rewards as a retention strategy affecting employee retention and project
completion
The single most important obligation owed by an employer to an employee is to pay him/her
wages (Cole 2002). It must be emphasized, however, that pay is not the only form of reward.
Indeed it is occasionally argued that financial payment is not even the most effective form of
reward (Kressler 2003). Today workers expect more than just an hourly wage or a salary from
their employer; they want additional considerations that will enrich their lives. These
considerations in an employment setting are called employee benefits (Decenzo, Robbins 1999).
Compensation, sometimes referred to as rewards, deals with every type of reward individuals
receive in exchange for performing organizational tasks (Ivancevich 2007). It is the chief reason
why most individuals seek employment. Ivancevich (2007), views it as an exchange relationship
where employees trade labour and loyalty for financial and non-financial compensation (pay,
benefits, services, recognition etc).

15
Reward, as remuneration for the effort and results of work encompasses a variety of elements that
are both financial and non financial (Kressler 2003). Ivancevich (2007) further divides the
components of compensation into direct financial compensation, indirect financial compensation
and non-financial rewards.
Where direct financial compensation consists of the pay an employee receives in the form of
wages, salaries, bonuses or commissions. Indirect financial compensation also called benefits and
services consists of all financial rewards that are not included in direct financial compensation, for
instance, pensions, insurance cover among others. While non-financial rewards, as defined by
Armstrong (2009), are rewards which do not involve any direct payments and often arise from the
work itself, for instance, achievement, self esteem and recognition.
Recognition is one of the several types of non-financial incentives (Dessler 2008). It includes
things like employee of the month award, praise, personalized plaques, parties and movie tickets.
Recognition Armstrong (2007) adds, can be provided by positive and immediate feedback from
managers and colleagues that acknowledges individual and team contributions. It is also provided
by managers who listen to and act upon suggestions of their team members. Others include
promotion, allocation to a high-profile project, job enlargement to provide for more interesting and
rewarding work, public applause and sabbaticals among others.
Recognition, as Armstrong (2007) points out, is one of the most powerful methods of rewarding
people. They need to know not only how much well they have achieved their objectives or carried
out their work but also that their achievements are appreciated. Employee compensation is a vital
part of human resource management. According to Gupta (2008), no organization can expect to
attract and retain qualified and motivated employees unless it pays fair compensation. By paying
at competitive levels, the company can retain its personnel. It can minimize the incidence of
quitting and increase employee loyalty.
For most people, work is their primary source of income and financial security. Pay is also seen as
an indicator of status within the organization as well as in the society at large. Thus, for some
people, pay is a reflection of self-worth, so pay satisfaction takes on critical significance when it
comes to retention (Noe, Hollenbeck, Gerhart and Wright 2006). One of the main dimensions of
satisfaction with pay, deals with pay levels – that is, the absolute amount of income associated

16
with the job. Indeed, when it comes to retention, employees being recruited away from one
organization by another are often lured with promises of higher pay levels (Noe, Hollenbeck,
Gerhart and Wright 2006).
The research conducted on the link between dissatisfaction with pay and voluntary turnover
appears to be inconclusive. Mobley et al (2010) concluded that results from studies on the role of
pay in turnover were mixed but that often there was no relationship between pay and turnover.
Other studies found no significant relationship. On the other hand Campion (2002) cited in Tang
suggests that the most important reason for voluntary turnover is higher wages/career opportunity.
Martin (2003) investigates the determinants of labour turnover using establishment-level survey
data for the United Kingdom. Martin indicated that there is an inverse relationship between
relative wages and turnover (ie establishments with higher relative pay had lower turnover).
Griffeth et al (2000) noted pay and pay-related variables have a modest effect on turnover. Their
analysis also included studies that examined the relationship between pay, a person’s performance
and turnover. They concluded that when high performers are insufficiently rewarded, they leave.
They cite findings from Milkovich and Newman (1999) that where collective reward programs
replace individual incentives, their introduction may lead to higher turnover among high
performers.
According to Taplin et al (2003) who conducted a large-scale turnover study in the British clothing
industry. Two factors emerged as the most significant reasons for employees leaving the industry.
One was the low level of wage rates in the clothing industry relative to other manufacturing
sectors. The other reason referred to industry image with staff leaving because of fears relating to
the long-term future of clothing manufacture in the United Kindom. In this study, turnover rates
were highest among the most skilled workers. The study also examined the role of payment
systems in turnover. The researchers found that where there were flat-rate payment systems alone,
average turnover exhibited a statistically significant difference from the industry mean. However,
most firms in the clothing industry adhered to piece rate payment systems finding it to be the most
effective way of regulating the effort-bargain. This is, in the authors’ view, despite anecdotal
evidence that many skilled workers dislike its unpredictability and new entrants to the workforce
lack the skills to maximise their earnings potential.
17
For some individuals pay will not be the sole criterion when people decide to continue within an
existing job. In their study of mental health professionals, Tang et al (2000) examined the
relationship between attitudes towards money, intrinsic job satisfaction and voluntary turnover.
One of the main findings of this study is that voluntary turnover is high among employees who
value money (high money ethic endorsement), regardless of their intrinsic job satisfaction.
However, those who do not value money highly but who have also have low intrinsic job
satisfaction tended to have the lowest actual turnover. Furthermore, employees with high intrinsic
job satisfaction and who put a low value on money also had significantly higher turnover than this
second group. The researchers also found that placing a high value of money predicted actual
turnover but that withdrawal cognitions (ie thinking about leaving) did not.
2.5 The effect of training and career development as retention strategy affecting
employee retention and project completion
According Bernardin (2006), defines training as any attempt to improve employee performance on
a currently held job or one related to it. He goes further to point out that development differs from
training, where development refers to learning opportunities designed to help employees grow –
such opportunities do not have to be limited to improving employees’ performance on their current
jobs. Armstrong (2006) describes career management as being concerned with providing
opportunities for people to progress and develop their careers and ensuring that the organization
has the flow of talent it needs. He goes on to say that the elements of career management are the
provision of learning and development opportunities, career planning and management succession
planning.
Career development programs, according to Bernardin (2006), are effective retention tools and are
quickly becoming an employee expectation. Organizations recognize that they can link their career
programs to specific business objectives while developing their employees to meet their goals.
These programs tell employees that the organization values and respects them by investing in their
future career growth. Thus feel the need to remain in the organization. Bernardin (2006) points out
that, organizations with exceptional training opportunities and programs often make Fortune
Magazine’s list of the best companies to work for, an honour that also translates into financial

18
success. A recent study found that companies that make Fortune’s list had 50 percent less turnover
than their peers and returned about three times more money for stockholders.
To become a leading edge company, Bernardin (2006) says, a firm will need to become more
concerned with the types of programs they use to improve workplace learning and performance,
not simply how much money they spend on training. People want to be associated with leading
edge companies and thus show more commitment to such companies. A direct incentive to remain
with an employer, Torrington et al (2005) says, can be through sponsoring of long-term courses of
study such as an MBA or accountancy qualification. In financing such courses, the employers send
a very clear signal to the employees concerned that their contribution is valued and that they can
look forward to substantial career advancement if they opt to stay. Leaving would mean an end to
the funding for the course, thus an employee opting to remain with the sponsoring employer.
There are however two widely expressed, but wholly opposed, perspectives on the link between
training interventions and employee turnover. On the one hand is the argument that training
opportunities enhance commitment to an employer on the part of individual employees, making
them less likely to leave voluntarily than they would if no training were offered. The alternative
view holds that training makes people more employable and hence more likely to leave in order to
develop their careers elsewhere (Torrington et al 2005). According to Green et al (2000) report as
cited by Torrington et al (2005), research on perceptions of 1,539 employees on different kinds of
training found that the overall effect is neutral; 19% of employees saying that the training was
more likely to make them actively look for another job and 18% saying it was less likely to do so.
However, they also found the type of training and the source of sponsorship to be a significant
variable. Training which is paid for by the employer is a good deal less likely to raise job mobility
than that paid for by the employee. Firm-specific training is also shown in the study to be
associated with lower turnover than training which leads to the acquisition of transferable skills.
Torrington et al (2005) concludes that whatever form of training, an employer can develop a
workforce which is both capable and committed by combining training interventions with other
forms of retention initiatives
Shah and Burke (2003) reviewed some of the literature on the relationship between turnover and
training. In a British study examining the impact of training on mobility, Green et al (2000)

19
concluded that, in aggregate, training has on average no impact on mobility. However, training
that is wholly sponsored by the individual (or their families) is on balance likely to be a prelude to
job search. In contrast, when employers pay for training the downward effect on mobility is more
likely.
Lynch (1991, 1992, 2008) concluded that both on-the-job and off-the-job training have a
significant effect on job mobility. While formal on-the-job training reduces the likelihood of
mobility, particularly for young women, off-the-job training increases the likelihood of mobility.
In a study of six local labour markets in Britain, Elias (2004) found that women who received
employer-provided and job-related training had a lower probability of changing employer or
making the transition to non-employment, but for men training made no significant difference to
this type of turnover.
In a study examining the effect of apprenticeships on male school leavers in the United Kingdom,
Booth and Satchell (1994) found that completed apprenticeships reduced voluntary job-to-job,
voluntary job-to-unemployment and involuntary job termination rates. In contrast, incomplete
apprenticeships tended to increase the exit rate to these destinations relative to those who did not
receive any training. Winkelmann (1996) reported that in Germany apprenticeships and all other
types of vocational training reduce labour mobility in spite of the fact that the German
apprenticeship training is intended to provide general and thus more transferable training.
Chang (2009) examined the relationship between career commitment, organisational commitment
and turnover intention among Korean researchers and found that the role of career commitment
was stronger in predicting turnover intentions. When individuals are committed to the organisation
they are less willing to leave the company. This was found to be stronger for those highly
committed to their careers. The author also found that employees with low career and
organisational commitment had the highest turnover intentions because they did not care either
about the company or their current careers.
Individuals with high career commitment and low organisational commitment also tend to leave
because they do not believe that the organisation can satisfy their career needs or goals. This is
consistent with previous research that high career committers consider leaving the company if
development opportunities are not provided by the organisation. However, this group is not apt to

20
leave and is likely to contribute to the company if their organisational commitment is increased.
Chang found that individuals become affectively committed to the organisation when they
perceive that the organisation is pursuing internal promotion opportunities, providing proper
training and that supervisors do a good job in providing information and advice about careers.
2.6 The effect of the work environment as a retention strategy affecting employee retention
and project completion
Armstrong (2009) defines the work environment as consisting of the systems of work, the design
of jobs, working conditions and the way in which people are treated at work by their managers and
co-workers. Working conditions need to meet health and safety requirements. The way people are
treated is a matter of managerial behaviour, achieving work-life balance and dealing with issues
such as stress, harassment and bullying. Torrington et al (2005) point out the inability to juggle the
demands of a job with those of the family as one of the more significant reasons for voluntary
resignations from jobs. Raising children has never been easy, and in an age when both parents
work or where families are being run by single parents, this task is not getting any easier (Noeet al
2006). Employers who have staff retention high on their agenda are now considering ways in
which employment can be made more family friendly.
Armstrong (2009), explains that work-life balance employment practices are concerned with
providing scope for employees to balance what they do at work with the responsibilities and
interests they have outside work; and this balance should be healthy further explains Kodz et al
(2002) as cited by Armstrong (2009). Thus, the idea that employers might use family-friendly
(work-life balance) policies to help recruit and retain valued workers is one that has been used for
years by many employers (Noeet al 2006).
The IRS (2002) considers that ‘Flexible working is considered the most practical solution to
establishing an effective work-life balance.’ The term flexible working covers flexi time, home
working, part-time working, compressed working weeks, annualized hours, job sharing and term-
time only working. It also refers to special leave schemes that provide employees with the freedom
to respond to a domestic crisis or to take a career break without jeopardizing their employment
status (Armstrong 2009).
21
Armstrong (2009), points out that, work-life balance policies can lower absence and help to tackle
the low morale and high degrees of stress that can lead to retention problems as employees tire of
juggling work and life responsibilities. A research conducted by the Institute of Employment
Studies (Kodz et al, 2002), identified employees who were staying longer with their firms because
of access to flexible working arrangements. If it is the case that many, if not most, voluntary
resignations are explained by dissatisfaction on the part of employees with their supervisors, it
follows that the most effective means of reducing staff turnover in organizations is to improve the
performance of line managers. Too often, it appears, people are promoted into supervisory
positions without adequate experience or training. Organizations seem to assume that their
managers are capable supervisors, without recognizing that the role is difficult and does not
usually come naturally to people. This organization should take action to improve the effectiveness
of supervisors (Torrington et al 2005). Lawler (2003) suggests that what managers have to do is to
treat people right. This means recognizing them as individuals with different needs and wants,
rewarding their achievements, helping them to develop and treating them with consideration as
human beings.
2.7 Conceptual Framework
To conceptualize, the research concentrated on five main strategies of employee retention. The
framework developed to meet the objectives and answer the research questions is as shown below:

22
Independent Variables
Dependent variable
Moderating variable
Figure 1: Conceptual framework on the effect of organizational employee retention strategies
on labour turnover affecting project completion
The conceptual framework shows how employee turnover and project completion are affected. It
shows the various independent variables which affect employee turnover. Organisational
commitment which covers issues such as work life policies and career opportunities. The wages
level and rewards is a very important variable affecting the employee turnover the higher the
salaries the greater the motivation in the job. Training and development tend to retain employees
in the same organisation hence affecting employee turnover. Work environment will also have a
great effect on the employee turnover. The working conditions safety regulations and the working
Organisational commitment • Work life policies • Career opportunities
Working environment • Working conditions • Safety regulation • Working hours
Employee retention and project completion
Wages level and rewards
• Salary level • Other pay packages
Training and career development
• Education level • Training days • Training programmes
Government policy on employee retention

23
hours must be favorable. There was one moderating variable of government policy on the
employee retention which is beyond the control of the organisation.
2.8 Summary the literature review
From the analysis of past studies, it is clear that retention of employees is very important and more
so retention of key staff. Employee turnover especially at an alarming rate will mean loss in
productivity and incurring costs associated with recruiting and training new employee among
others which affects projects. Employee turnover also tarnishes the company image. Concerted
action is thus required to retain talented people.
The literature review does not clearly bring out which of the retention strategies or a combination
is best placed at resulting into a higher retention rate. We acknowledge there are limits to what any
organization can do to retain its employees, but there are those strategies, even though not giving a
100 percent retention, which can result in a retention rate acceptable to the organization and the
industry at large.
This study was thus seek to address this gap and so try to point out the retention strategies, which
when applied can result in a high retention rate of employees in organizations and more so in the
construction industry. Many agree that retention of employees, especially the high performing
employees in the organization is very important. Retention policies are thus designed to ensure
that people remain committed members of the organization.
Employee turnover to some extent is inevitable. An organization cannot shield its people from
attractive opportunities and aggressive recruiters. Once an organization understands the factors
that affect retention, for instance understanding employee career needs, it will be able to draw up
policies or strategies that will not only help minimize overall employee turnover but also help
them influence who leaves and when. This will in turn ensure increased productivity and
performance as there will be no gaps left by key people.

24
CHAPTER THREE
RESEARCH METHODOLOGY
3.1 Introduction
This chapter describes the methodology that was used in data collection and its analysis in order to
answer the research questions addressing the effectiveness of employee retention strategies and its
effect on project completion. It details the target and sample population of the respondents that the
researcher focused on in the study. This chapter also point out the data collection instruments the
researcher used. As such, this chapter covers the research design, target population and sampling
design, a description of data collection instruments used and analysis of the data collected.
3.2 Research Design
The type of research design that the researcher used in the study to gather information from the
respondents is Descriptive Research Design. This design provides a deep understanding of the
events being studied and its instruments are helpful in getting firsthand experience as well as in-
depth of the study (Kothari, 2004). It is concerned with conditions that exist, practices that prevail,
beliefs and attitudes that are held, processes that are ongoing and trends that are developing.
Kothari also notes that this method has the ability to allow large amount of data to be collected
quickly and at minimal cost.
Further, the choice of using descriptive design was preferred since the methods of data collection it
utilizes, that is, questionnaires was applicable to the study and aid in collecting precise
information. Descriptive type of research also supports case study and the proposed research was
be taking the case study approach.
3.3 Target Population
Population, also referred to as universe, is the units of analysis that are contained in a problem
complex that a researcher would like to say something general about. The target population was
the employees from Civicon limited in Mombasa County.

25
Below is a summary of the target population:
Table 3.1 Target Population
Department Target Population Percentage
Finance 16 13%
Procurement 8 7%
Transport 28 23%
Operations/ workshop 36 30%
Stores 20 17%
Human Resources 12 10%
TOTAL 120 100%
3.4 Sample size and Sampling Procedure
The researcher used stratified random sampling to obtain the probability samples. Samples here
being units that the researcher selected from the population studied. Nyandemo (2007) points out
that stratified random sampling is preferred as a way of obtaining probability samples over other
methods like simple random sampling because it gives a sample that is representative of the
population, especially if it is a small sample from a large population. Thus for this study, stratified
random sampling was be preferred as it will gave a sample that was a representative of the
population.
The target population was divided into various categories or groups referred to as strata and
employees of Civicon Limited were randomly selected from these strata to form the samples. This
sample size was adopted from Mugenda & Mugenda (1999) that suggests that one may use a
sample size of at least 10 per cent, but for better, more representative results, a higher percentage
is better. Thus the researched used 75 percent of the population.

26
The study sample will be as follows:
Table 3.2 Sample Size
Department Target Population Sample size
(75% of target population)
Finance 16 12
Procurement 8 6
Transport 28 21
Operations/ workshop 36 27
Stores 20 15
Human Resources 12 9
TOTAL 120 90
3.5 Data Collection Instruments
The study involved collection of primary data. The researcher used questionnaires to collect data.
The questionnaire was the main instrument used to collect data as, according to Nyandemo (2007),
its administration is at a lower cost even when the universe is large, it allows for anonymity of the
respondents if needed, the respondents will have enough time to give well-thought answers and it
also allows use of large samples thus making the results more dependable and reliable. The
questionnaires were administered to all categories. Open and closed ended questions were used.
Closed ended questionnaires provided multiple choice answers, respondent expected to select
among possibilities. Suitable when possible replies are few and clear cut. Open-ended
questionnaires allow respondent freedom of response. Individuals respond in own words, space
provided is good indicator of response length.
3.6 Validity and Reliability of the Research instrument
Validity and reliability are two statistical properties used to evaluate the quality of research
instruments (Kothari, 2004). It is important that assessment techniques possess both validity and
reliability. Reliability of an instrument is defined as a characteristic of an instrument that reflects
the degree to which the instrument provokes consistent responses, reflects its stability and
consistency within a given context. Validity in relation to research is a judgment regarding the

27
degree to which the components of the research reflect the theory, concept, or variable under study
(Kothari, 2004).
3.6.1 Validity
Mugenda & Mugenda (1999) describe the validity in quantitative research as “construct validity”.
The construct validity is the initial concept, notion, question or hypothesis that determines which
data is to be gathered and how it is to be gathered. To ensure content validity the questionnaires
were prepared to cover as much aspect on all departments as possible and an expert opinion
sought. The questionnaire is thus valid as it is able to measure the various indicators.
3.6.2 Reliability
Reliability is the ability of an instrument to provide consistent results in data gathering (Kothari,
2004). To test the reliability, the researcher carried out a test re-tests by administering the
questionnaire to ten respondents at an interval of two days. Data was then analyzed by use of
correlation coefficient to determine whether it is reliable.
3.7 Data Collection Procedures
The researcher personally collected the data using questionnaires. The questionnaires were taken
by the researcher to the organisation and then picked later after they have been filled.
3.8 Ethical Considerations
In order to conduct the study the researcher submitted a written request to Human Resource
Manager for permission to conduct the study. Similarly consent from the participants was also
sought, their confidentiality assured and the purpose of the study explained.
3.9 Data presentation and Analysis Techniques
Data analysis refers to computation of certain measures along with searching for patterns of
relationship that exist among data groups (Kothari 2004). Data analysis facilitated the answering
of the research objectives and questions and this was done using descriptive survey design which
included percentages and tables used to summarize, organize data. Before analysis, data was
checked for accuracy and completeness then coded and entered into the computer for analysis. As

28
Kothari (2004) explains, processing implies editing, coding, classification and tabulation of
collected data so that they are amenable to analysis. The term analysis on the other hand refers to
the computation of certain measures along with searching for patterns of relationship that exist
among data groups. Thus the data collected was edited, coded, classified and tabulated after which
it was subjected to analysis.
The researcher used content analysis techniques on the data generated by Statistical Package for
Social Sciences (SPSS) version 16 for windows. Chi- square was calculated and used to test the
hypothesis.
3.10 Operational Definition of variables
Variables referred to anything that might impact the outcome of a study. The operational definition
of variables describes what the variables were and how they would be measured within the context
of this study. Table 3.3 shows the operational definition of variables for this study, indicators,
measurement, and the data collection methods that were used.
Table 3.3: Operational definition of terms
Variable Type of variable
Indicators Level of scale
Questionnaires
Organisational commitment
Dependent
• Work life policies • Career opportunities
Nominal
8, 9, 10 and 11
Wages level and rewards
Independent
• Salary level • Other pay packages
Normal 12, 13 and 14
Training and career development
Independent
• Education level • Training days • Training programmes
Nominal
15, 16, 17, 18 and 19
Work environment
Independent
• Working conditions • Safety regulations • Working hours
Nominal 20, 21, 22 and 23

29
CHAPTER FOUR
DATA ANALYSIS, PRESENTATION AND INTERPRETATION
4.1 Introduction
The main focus of this chapter is the analysis, presentation and interpretation of the results of the
research. Data obtained was analyzed to determine the effect of organisational employee retention
strategies on project completion at Civicon Limited. Descriptive statistics such as frequencies and
percentages were used to analyze responses to various items in the questionnaire. In addition cross
tabulation of the data was analyzed according to the departments. The questionnaires were
administered to all levels of management in the six departments of finance department,
procurement department, transport department, operations or workshop department, store
department and human resource department.
4.2 Response Rate
Out of 90 questionnaires issued 75 were returned and accounted for 83.3% of the sampled
population which was used for data analysis
Table 4.1 Response rate
Department Number of Number of Proportion of
Questionnaires Questionnaires Response in
Issued returned percentage
Finance 12 12 100
Procurement 6 5 83
Transport 21 18 86
Operations/ workshop 27 22 81
Stores 15 11 73
Human Resources 9 7 78
Total 90 75

30
4.3 Demographic Information of Respondents
The main objective of this study was to find out the effect of organisational retention strategies on
project completion at Civicon Limited. As such, the study found it paramount to first establish the
background of the study under which the interpretations would be justifiably made. The
demographic information sought included: gender, age and level of education of respondents,
marital status level of management and department attached to.
4.3.1 Gender of Respondents
The study sought to establish the gender of the respondents since the main purpose of the study
involved assessing the effects of employee retention strategies on project completion. This is
because some project activities especially construction activities can only be done by male gender.
Table 4.2: Gender Respondents
Gender Frequency Percentage Cumulative Percent
Male 47 62.7 62.7
Female 28 37.3 100.0
Total 75 100.0
The study findings indicate that majority 47 (62.7%) were male while female were 28(37.3%).
This implies that the organisation does not practice gender equality in its recruitment. Workshop
department had highest male and the transport department the highest female.
Table 4.3: Departmental / Gender cross tabulation Department Male Female Total
Finance 7 5 12
Procurement 5 0 5
Transport 8 10 18
Operations/ workshop 16 5 21
Stores 7 4 11
Human resource 4 4 8
Total 47 28 75

31
The gender cross tabulation table indicates that operations or workshop department had the highest
number on the male gender of 16 and the human resource the lowest of 4. For the female gender,
transport hade the highest of 10 while the procurement had no female gender
4.3.2 Age of the Respondents
It was necessary to find out the age of the respondents to show their ability and efficiency.
Table 4.4: Age of respondents
Age Frequency Percentage Cumulative Percent
20-30 24 32.0 32.0
31-40 32 42.7 74.7
41-50 13 17.3 92.0
51-60 6 8.0 100.0
Total 75 100.0
The study findings indicate that age bracket 31-40 years has majority 32 (42.7%) of the
respondents and age bracket 51-60 years has the lowest 6 (8%) as shown in Table 4.4.
Table 4.5: Department /Age brackets cross tabulation Department 20-30 31-40 41-50 51-60 Total
Finance 7 4 0 1 12
Procurement 0 4 0 1 5
Transport 4 10 4 0 18
Operations/ workshop 8 5 6 2 21
Stores 2 5 2 2 11
Human resource 3 4 1 0 8
Total 24 32 13 6 75

32
The table shows that in the age brackets of 20-30 years, the operation had the highest number of 8
while the procurement had none. For 31- 40 age brackets transport had highest of 10, 41-50 age
brackets operation had the highest of 6 and the age brackets of 51-60 operations and stores
department had the both the highest of both 2 each
4.3.3 Level of Education of Respondents
The study in this section sought to find out the level of education of the respondents.
Table 4.6 Level of Education of Respondents
Level Frequency Percentage Cumulative Percent
University 26 34.7 34.7
College 41 54.7 89.3
High school 7 9.3 98.7
Primary school 1 1.3 100.0
Total 75 100.0
The study findings indicate that 41 (54.7%) of the respondents possess up to college level of
education followed by university with 26 (34.7%) and the primary level has the least as shown in
table 4.3. This implies that the organisation considers a lot education level. This can be interpreted
to imply that projects do not require high levels of education when recruiting its personnel.
Table 4.7: Departmental education level Department University College High school Primary School Total
Finance 7 5 0 0 12
Procurement 0 5 0 0 5
Transport 6 9 3 0 18
Operations/ workshop 3 16 2 0 21
Stores 6 4 0 1 11
Human resource 4 2 2 0 8
Total 26 41 7 1 75

33
The study findings indicate that in the university level finance department has the highest number
of 7 respondents; in the college level operations had the highest of 16 respondents, at high school
level transport had the highest of 3 respondents and at the primary only one respondent in the
stores department
4.3.4 Marital status
The respondents were asked to indicate their marital status falls between 31-40 years.
Table 4.8: Marital Status
The marital status indicates that a large proportion of the respondents are married 44 (58.7%). This
is because the greatest age brackets. The singles were 28 representing 37.3 % and others and only
3 respondents representing 4 %.
Table 4.9: Department / marital status cross tabulation
Department Single Married Others Total
Finance 6 5 1 12
Procurement 0 5 0 5
Transport 5 11 2 18
Operations/ workshop 7 14 0 21
Stores 5 6 0 11
Human resource 5 3 0 8
Total 28 44 3 75
Status Frequency Percentage Cumulative Percentage
Single 28 37.3 37.3
Married 44 58.7 96.0
Others 3 4.0 100.0
Total 75 100.0

34
The table indicates that the operations department had the highest number of singles of 7. Also the
operations department had the highest number of married employees of 14 while in the others
transport had the highest of 2 respondents.
4.3.5 Level of management
Analysis was made on the level of management.
Table 4.10: Level of management
Level of management Frequency Percentage Cumulative Percentage
Senior management 11 14.7 14.7
Middle level management 24 32.0 46.7
Supervisory 20 26.7 73.3
Junior workers 20 26.7 100.0
Total 75 100.0
Table shows that most respondents worked at middle level management 24 (32.0%) and also
supervisory level management and junior workers with 20 (26.7%) each. Senior management had
the least of 11(14.7%) respondents.
Table 4.11: Department / Level of management cross tabulation
Department Senior mgt. Middle level mgt. Supervisory Junior worker Total
Finance 3 6 2 1 12
Procurement 1 1 1 2 5
Transport 3 6 4 5 18
Operations/ workshop 2 3 7 9 21
Stores 2 4 3 2 11
Human resource 0 4 3 1 8
Total 11 24 20 20 75

35
The study indicates that the transport and the finance departments had the highest number in the
senior management of 3 respondents each. In the middle level management the same departments
had also the highest if 6 respondents also each. In the supervisory and junior workers the
operations department had the highest of 7 and 9 respondents respectively.
4.3.6 Department currently attached to.
The respondents where asked to indicate the department where they are attached.
Table 4.12: Department currently attached
Department Frequency Percentage Cumulative percentage
Finance 12 16.0 16.0
Procurement 5 6.7 22.7
Transport 18 24.0 46.7
Operations/ workshop 22 29.3 76.0
Stores 11 14.7 90.7
Human resource 7 9.3 100.0
Total 75 100.0
From the table many respondents are attached to the operations department 22 (29.3%) while
procurement has the least having 5 (6.7%). This is because most of the activities in the projects are
operational in nature.
4.3.7 Distribution of respondents by period they have worked in the organisation
In order to determine the experience of the respondents in their area of work, the study sought
information on the length of service they had worked in the current organization as well as the
length of time they had worked in the current capacity.

36
Table 4.13: Period worked in the organisation
Frequency Percentage Cumulative Percentage
Below 3 years 20 26.7 26.7
3-5 years 28 37.3 64.0
6-10 years 18 24.0 88.0
11-15 years 7 9.3 97.3
Above 15 years 2 2.7 100.0
Total 75 100.0
The analysis indicates that 28 (37.3%) of the respondents had worked in the current organization
for between 3 and 5 years as shown in table 4.8. Above 15 years has the least of 2 (2.7%) an
indication the most staff do not stay in the organisation for a long period. This implies that the
organization must have a good working scheme and conditions going by the rate of staff work-
service. It could also emphasize the delicate nature of the projects where experience is core and so
the organization is committed to retaining productive employees.
Table 4.14: Department / period worked in the organisation cross tabulation
Department Below 3 years 3-5 years 6-10 years 11-15 years above 15 years Total
Finance 6 4 1 1 0 12
Procurement 0 3 2 0 0 5
Transport 2 6 7 3 0 18
Workshop 5 9 7 0 0 21
Stores 3 5 0 2 1 11
Human resource 4 1 1 1 1 8
Total 20 28 18 7 2 75
From the analysis, in the finance department the highest number has worked for below 3 years of 6
respondents. In the procurement, the highest has worked for between 3 and 5 years. In the
transport the highest number has worked for 6 to 10 years. In the workshop the highest number has
worked for between 3 and 5 years. In the transport the highest respondents have worked for
between 3 and 5 years and the human resource the highest have worked below 3 years.

37
4.4 Organisational commitment as retention strategy affecting project completion
Organisational commitment is a variable affecting employee’s turnover and project completion
thus it was necessary to establish the extent this variable affect the project’s completion.
4.4.1 Rate of organisational commitment
The table shows that the organisation has a good commitment to retention of employees to ensure
the projects are completed in time with 42 (56.0%) respondents rating the commitment as good
and only 1(1.3%) indicating that the commitment is unsatisfactory.
Table 4.15: Rating of organisational commitment
Rate Frequency Percentage Cumulative Percentage
Excellent 7 9.3 9.3
Good 42 56.0 65.3
Fair 18 24.0 89.3
Poor 7 9.3 98.7
Unsatisfactory 1 1.3 100.0
Total 75 100.0
On the cross tabulation, the analysis shows that in the finance department highest respondents
rated it good. Also in the rest the of the departments the highest number rated if as been good. In
all the departments, rating of unsatisfactory was the lowest.

38
Table 4.16: Departmental rating of organisational commitment
Department Excellent Good Fair Poor Unsatisfactory Total
Finance 2 7 2 1 0 12
Procurement 0 3 1 1 0 5
Transport 2 8 6 2 0 18
Workshop 2 12 5 1 1 21
Stores 1 6 2 2 0 11
Human resource 0 6 2 0 0 8
Total 7 42 18 7 1 75
4.4.2 Effectiveness of work life policies in the organisation
From the table it shows that the effectiveness of work life policies of the organisation are average
as 44(58.7%) are rating it as effective. Only 6(8.0%) rated it as no extent it is effective. Thus it is
an indication that effective work life policies can reduce labour turnover hence ensuring that the
projects are completed in time
Table 4.17: Effectiveness of work life policies in the organisation
Rate Frequency Percentage Cumulative Percentage
Great extent 11 14.7 14.7
Average 44 58.7 73.3
Little extent 14 18.7 92.0
No extent 6 8.0 100.0
Total 75 100.0
The analysis of departmental cross tabulation, in the finance department great extent was the
highest, transport department average was the highest .also in operations, stores and human
resource average was the highest.

39
Table 4.18: Departmental rating of effectiveness of work life policies in the organisation
Department Great extent Average Little extent No extent Total
Finance 4 5 3 0 12
Procurement 0 3 2 0 5
Transport 1 11 5 1 18
Operations/ workshop 3 13 4 1 21
Stores 2 8 0 1 11
Human resource 1 4 0 3 8
Total 11 44 14 6 75
4.4.3 To what extent does the organisation promote career opportunities
The results shows that most of the respondents 49(65.3%) rate the organisations career
opportunities as average. Only 3(4%) rate it as no extent and this is coming from those
respondents who their education level is not beyond high school. It only shows that the employees
who are well educated are the ones who have career opportunities.
Table 4.19: Extent of the organisation promotion of career opportunities
Extent Frequency Percentage Cumulative Percentage
Great extent 8 10.7 10.7
Average 49 65.3 76.0
Little extent 15 20.0 96.0
No extent 3 4.0 100.0
Total 75 100.0
From the analysis on departmental cross tabulation of the extent to which organisation promotes
career opportunities, the highest on the entire department was average rating.

40
Table 4.20: Departmental rating of extent organisational promotion of career opportunities
Department Great extent Average Little extent No extent Total
Finance 3 8 1 0 12
Procurement 1 2 0 2 5
Transport 1 14 2 1 18
Operations/ workshop 2 13 6 0 21
Stores 0 8 3 0 11
Human resource 1 4 3 0 8
Total 8 49 15 3 75
4.4.4 Would organisational commitment to good work life policies and career opportunities
affect the desire to stay with the organization and be commitment to the job?
The response rate in the table 4.12 shows that most respondents 49(64.3%) would be influenced by
the organisational commitment to good work life policies and career opportunities to stay with the
organization and be committed to their job as compared to 26(34.7%) who indicated that it cannot
affect them.
Table 4.21: Organisational commitment to good work life policies and career opportunities and effect to the desire to stay with the organization and be commitment to your job
Response Frequency Percentage Cumulative Percentage
Yes 49 65.3 64.3
No 26 34.7 100.0
Total 75 100.0
From the table of cross tabulation of organisational commitment, the highest number of
respondents indicated that the organisation is committed to good work life policies and career
opportunities.

41
Table 4.22: Department / Organisational commitment cross tabulation
Department Yes No Total
Finance 9 3 12
Procurement 3 2 5
Transport 13 5 18
Operations/ workshop 11 10 21
Stores 7 4 11
Human resource 7 1 8
Total 50 25 75
Presentation of hypothesis testing between organisational commitment as a retention strategy
affecting employee turnover and project completion
Table 4.23: Chi-Square Tests on the relationship between organisational commitment and employee turnover
Chi-Square value df
Asymp. Sig.
(2-sided)
How would you rate the organisational commitment in your organization?
13.745 3 0.003
To what extent are the work life policies in your organization effective?
11.016 4 0.0268
To what extent does your organisation promote career opportunities?
10.877 3 0.000
Table 4.23 shows that organisational commitment and employee turnover are dependent variables.
The calculated Chi- square values at 3 and 4 degrees of freedom shows significant relationship
meaning between the two thus the null hypothesis is rejected while the alternative hypothesis is
accepted concluding that the organisational commitment does influence the employee turnover and
project completion at Civicon Limited.

42
4.5 Wages level and rewards as retention strategy affecting project completion
Wages and other rewards are variables which can affect project completion. Research was carried
out to establish the extent to which these variables can affect employee’s turnover at Civicon
limited.
4.5.1 Rating of the rewards/compensation package in the organization
From the analysis it is clear that the reward and compensation package is good with 30 (40%)
respondents rating it good, 28(37.3%) rating it fair, 9 (12%) rating it excellent, 7 (9.3%) rating it
poor and only 1(1.3%) rating it unsatisfactory
Table 4.24: Rate of the rewards/compensation package in the organization
Rate Frequency Percentage Cumulative Percentage
Excellent 9 12.0 12.0
Good 30 40.0 52.0
Fair 28 37.3 89.3
Poor 7 9.3 98.7
Unsatisfactory 1 1.3 100.0
Total 75 100.0
From the analysis of the cross tabulation table, the highest rating in the finance department was
fair and good, procurement and human resource departments was highest was rated fair while in
the transport, operations and stores was rated good.

43
Table 4.25: Departmental rating of the rewards / compensation package in the organisation
Department Excellent Good Fair Poor Unsatisfactory Total
Finance 0 5 5 2 0 12
Procurement 0 2 4 0 0 6
Transport 4 7 6 1 1 19
Operations/ workshop 2 11 7 1 0 21
Stores 3 4 0 3 0 10
Human resource 0 1 6 0 0 7
Total 9 30 28 7 1 75
4.5.2 Do you agree with the following statement: “Feeling proud of your work is more
important to you than getting a pay raise.”
From the analysis it shows that more respondents 26 (34.7%) mostly agree that feeling proud of
the work is more important than getting a pay raise, 24(32.0%) barely agree, 14(18.7%) disagree
and 11(14.7%) strongly agree.
Table 4.26: Feeling proud of your work is more important to you than getting a pay raise.
Frequency Percentage Cumulative Percentage
Strongly agree 11 14.7 14.7
Mostly agree 26 34.7 49.3
Barely agree 24 32.0 81.3
Disagree 14 18.7 100.0
Total 75 100.0
Analysis on the cross tabulation table mps of the departments mostly agree that pay rise make
them feel proud at their work. This means that the pay package is a good retention strategy as
employees can remain in the organisation because of pay.

44
Table 4.27: Departmental rating of importance of pay raise
Department Strongly agree Mostly agree Barely agree Disagree Total
Finance 1 5 5 1 12
Procurement 1 1 3 1 6
Transport 3 5 9 2 19
Operations/ workshop 2 7 5 7 21
Stores 2 5 2 1 10
Human resource 2 3 0 2 7
Total 11 26 24 14 75
4.5.3 Extent of various types of rewards increases on commitment to the organization
From the table it shows that employees are committed a lot in the organisation by financial
rewards as compared to non-financial rewards. Basic pay motivates a lot than other benefits and
contingent pay. Recognition does not make employees committed to organisation. Also contingent
pay does not make employees more committed to the organisation.
Table 4.28: Extent of various types of rewards increases on commitment to the organization
Types of Rewards / Rate Greatest Extent
Some extent,
Average Little extent
No extent
Financial rewards
Basic Pay/Salary 50 10 8 7 0
Contingent pay 3 5 10 32 25
Benefits 40 20 8 7 0
Non-financial rewards
Recognition 2 8 10 25 30
A chi-square test was computed to determine whether there is a relationship wages level and other
reward and the employee turnover that affect project completion at Civicon Limited
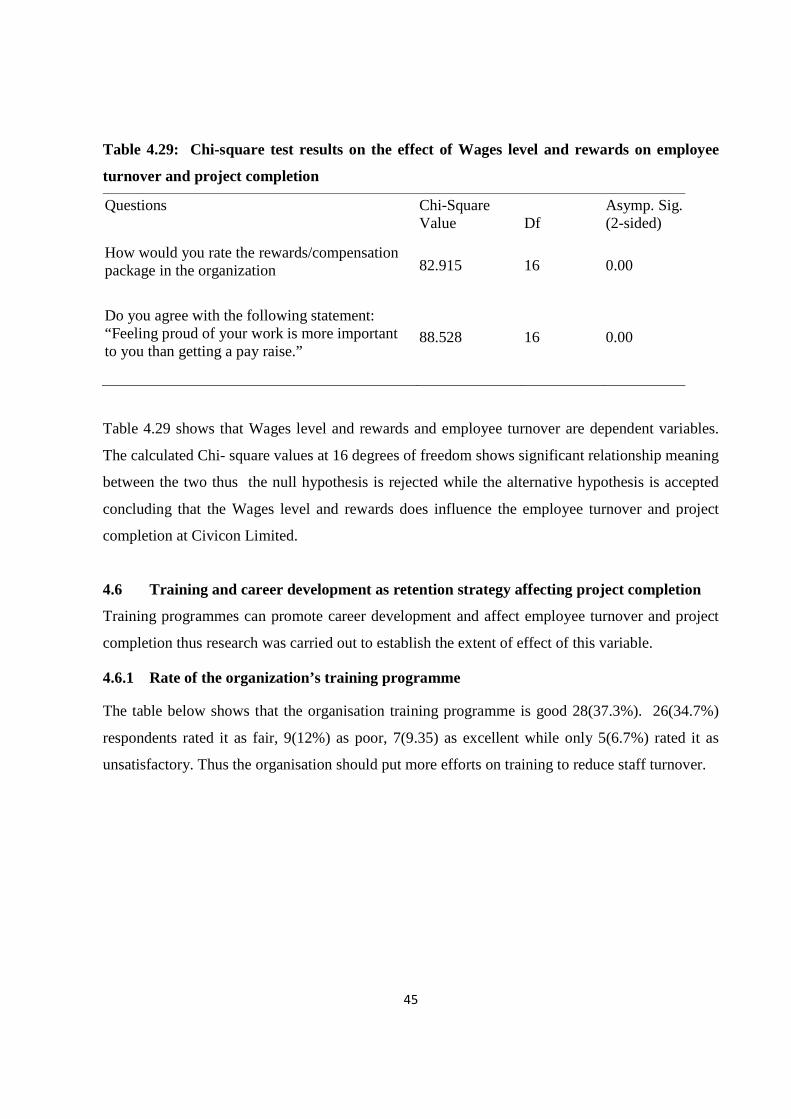
45
Table 4.29: Chi-square test results on the effect of Wages level and rewards on employee
turnover and project completion
Questions Chi-Square Value Df
Asymp. Sig. (2-sided)
How would you rate the rewards/compensation package in the organization 82.915 16 0.00
Do you agree with the following statement: “Feeling proud of your work is more important to you than getting a pay raise.”
88.528 16 0.00
Table 4.29 shows that Wages level and rewards and employee turnover are dependent variables.
The calculated Chi- square values at 16 degrees of freedom shows significant relationship meaning
between the two thus the null hypothesis is rejected while the alternative hypothesis is accepted
concluding that the Wages level and rewards does influence the employee turnover and project
completion at Civicon Limited.
4.6 Training and career development as retention strategy affecting project completion
Training programmes can promote career development and affect employee turnover and project
completion thus research was carried out to establish the extent of effect of this variable.
4.6.1 Rate of the organization’s training programme
The table below shows that the organisation training programme is good 28(37.3%). 26(34.7%)
respondents rated it as fair, 9(12%) as poor, 7(9.35) as excellent while only 5(6.7%) rated it as
unsatisfactory. Thus the organisation should put more efforts on training to reduce staff turnover.

46
Table 4.30: Rate of the organization’s training programme
Rate Frequency Percentage Cumulative Percentage
Excellent 7 9.3 9.3
Good 28 37.3 46.7
Fair 26 34.7 81.3
Poor 9 12.0 93.3
Unsatisfactory 5 6.7 100.0
Total 75 100.0
The analysis of the table below on departmental cross tabulation shows that most of the
departments rated the training programme as good or fair except the stores department which rated
it as been excellent.
Table 4.31: Departmental rating of the organization’s training programme
Department Excellent Good Fair Poor Unsatisfactory Total
Finance 0 4 7 1 0 12
Procurement 1 3 2 0 0 6
Transport 2 7 6 3 1 19
Operations/ workshop 1 9 6 2 3 21
Stores 3 3 2 1 1 10
Human resource 0 2 3 2 0 7
Total 7 28 26 9 5 75
4.6.2 The extent would training and career development opportunities influence employee
commitment to the organization
From table 4.19 it shows that career and development opportunities influences commitment to the
organisation with 60(80%) respondents indicating great extent, 12(16%) rating it fair, 2(2.7%)
rating it little extent and 1(1.3%) rating it no extent.

47
Table 4.32: The extent to training and career development opportunities influence employee commitment to the organization
Rating Frequency Percentage Cumulative Percentage
Great extent 60 80.0 80.0
Average 12 16.0 96.0
Little extent 2 2.7 98.7
No extent 1 1.3 100.0
Total 75 100.0
On the analysis of the departmental cross tabulation, all the six department rated training and career development opportunities of great extent affecting their commitment in the organisation hence it a good retention strategy,
Table 4.33: Departmental rating to extent to which training and career development opportunities influence employee commitment
Department Great extent Average Little extent No extent Total
Finance 9 2 1 0 12
Procurement 5 0 1 0 6
Transport 16 3 0 0 19
Operations/ workshop 16 4 0 1 21
Stores 8 2 0 0 10
Human resource 6 1 0 0 7
Total 60 12 2 1 75
4.6.3 Effect of education level on increase on the commitment to the organisation.
The table shows that education level influences commitment to the organisation with 66(88%)
respondents indicating that it does effect while 9(12%) respondents say that it does not affect them

48
Table 4.34: Does your education level increase your commitment to the organisation
Response Frequency Percentage Cumulative Percentage
Yes 66 88.0 88.0
No 9 12.0 100.0
Total 75 100.0
From the cross tabulation on the rating of how education level increase commitment to the
organisation, the analysis shows that the entire department had indicated that it does affect with
only few respondents stating that it does not influence
Table 4.35: Departmental rating of how education level increase commitment to the organisation
Department Yes No Total
Finance 10 2 12
Procurement 6 0 6
Transport 19 0 19
Operations/ workshop 17 4 21
Stores 8 2 10
Human resource 6 1 7
Total 66 9 75
4.6.4 The effect of number of training days in the organisation on increasing commitment
to the organisation
From the analysis in table 4.21, it shows that the number of training days does increase the level of
commitment in the organisation with 57(76%) respondents responding yes while only 18(24%)
respondents indicated that it does not increase.

49
Table 4.36: The effect of number of training days in the organisation on commitment to the organisation
Response Frequency Percentage Cumulative Percentage
Yes 57 76.0 76.0
No 18 24.0 100.0
Total 75 100.0
The analysis on the departmental cross tabulation shows the transport department is the leading to
supports that training days affects the employee commitment followed by operations while human
resources is the last. All the departments support that training days affects their commitment to the
organisation
Table 4.37: Department rating on whether the number of training days in the organisation affects commitment to the organisation
Department Yes No Total
Finance 8 4 12
Procurement 5 1 6
Transport 17 2 19
Operations/ workshop 15 6 21
Stores 7 3 10
Human resource 5 2 7
Total 57 18 75
4.6.5 The rating of education level, training days and training programmes on influence on
commitment to the organization.
Training programmes does influence commitment to the organisation with 57(76%) indicating that
it mostly influence. Education level and Training days had 9(12%) respondents each only
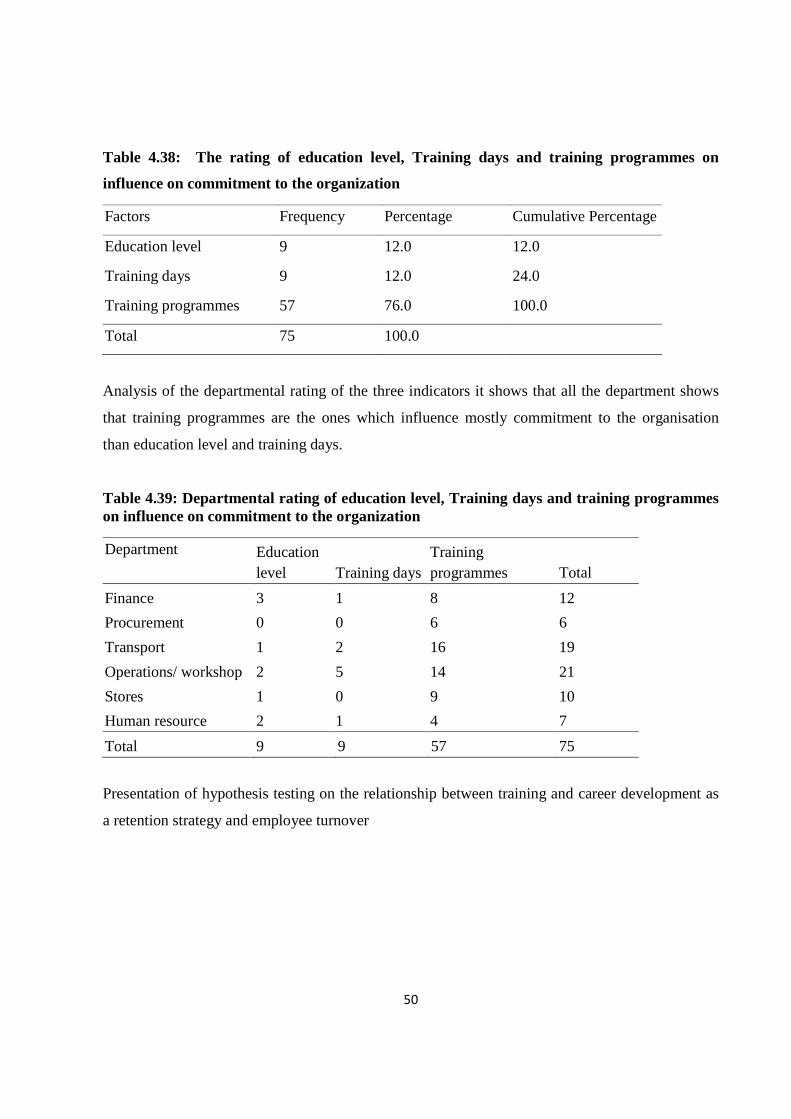
50
Table 4.38: The rating of education level, Training days and training programmes on
influence on commitment to the organization
Factors Frequency Percentage Cumulative Percentage
Education level 9 12.0 12.0
Training days 9 12.0 24.0
Training programmes 57 76.0 100.0
Total 75 100.0
Analysis of the departmental rating of the three indicators it shows that all the department shows
that training programmes are the ones which influence mostly commitment to the organisation
than education level and training days.
Table 4.39: Departmental rating of education level, Training days and training programmes on influence on commitment to the organization
Department Education level Training days
Training programmes Total
Finance 3 1 8 12
Procurement 0 0 6 6
Transport 1 2 16 19
Operations/ workshop 2 5 14 21
Stores 1 0 9 10
Human resource 2 1 4 7
Total 9 9 57 75
Presentation of hypothesis testing on the relationship between training and career development as
a retention strategy and employee turnover

51
Table 4.40: Chi-Square Tests on the relationship between training and career development and employee turnover
Questions Chi-Square value df
Asymp. Sig.
(2-sided)
To what extent would training programmes influence your commitment to the organization?
90.680 12 0.000
Does your education level increase your commitment to the organisation?
84.354 6 0.000
Does the number of training days in the organisation increase your commitment to the organisation?
79.310 6 0.000
Table 4.40 confirms that training and career development and employee’s retention are not
independent since at 12 and 6 degrees of freedom the calculated Chi- square is greater than
expected. The null hypothesis is rejected meaning that training and career development and the
employee retention and project completion are related hence there is a direct relationship between
the two variables.
4.7 Working environment as a retention strategy affecting project completion
It was necessary to establish the effect of working environment as variable affecting employee
turnover and project completion as many projects are undertaken in environments which are
different and thus the organisation has to ensure that the environment is conducive.
4.7.1 Rating of the organization’s working environment
Most of the respondents 52 (69.3%) rated the company’s work environment as good. 12(16%) as
fair, 7 (9.3%) as excellent and only 1(1.3) as unsatisfactory. This shows that the organisation is
committed to making the work environment good as a strategy for retaining the employees.

52
Table 4.41: Rating of the organization’s working environment
Response Frequency Percentage Cumulative Percentage
Excellent 7 9.3 9.3
Good 52 69.3 78.7
Fair 12 16.0 94.7
Poor 3 4.0 98.7
Unsatisfactory 1 1.3 100.0
Total 75 100.0
The analysis on the departmental cross tabulation shows that the organization’s working
environment its good. The transport department was the leading with 14 respondents and the
procurement was the last with 3 respondents.
Table 4.42: Department rating of the organization’s working environment
Department Excellent Good Fair Poor Unsatisfactory Total
Finance 2 9 1 0 0 12
Procurement 0 3 3 0 0 6
Transport 1 14 2 1 1 19
Operations/ workshop 2 12 5 2 0 21
Stores 2 7 1 0 0 10
Human resource 0 7 0 0 0 7
Total 7 52 12 3 1 75
4.7.2 Which of the following would mostly influence your commitment to the organization:
working condition, safety regulation and working hours.
From table 4.42, it shows that working condition would mostly influence one to organisations
commitment with 61(81.3%) responding to it. While safety regulations only 13(17.3%) rated
safety regulations as mostly affecting and only 1(1.3%) rating that working condition does affect
mostly.

53
Table 4.43: Which of the following would mostly influence your commitment to the organization?
Response Frequency Percentage Cumulative Percentage
Working condition 61 81.3 81.3
Safety regulation 13 17.3 98.7
Working hours 1 1.3 100.0
Total 75 100.0
From table 4.44 on cross tabulation, it shows that working condition would mostly influence all
the departments on their commitment to the organisations. Safety regulations is the second and
working hours the last.
Table 4.44: Departmental ranking of working condition, safety regulation and working hours on their influence on commitment to the organisation
Department Working condition Safety regulation Working hours Total
Finance 10 2 0 12
Procurement 4 1 1 6
Transport 15 4 0 19
Workshop 19 2 0 21
Stores 9 1 0 10
Human resource 4 3 0 7
Total 61 13 1 75
4.7.3 Would safety regulation affect your decision to leave or stay in the organisation?
From the table, it shows safety regulations do affect employee turnover and project completion
with a rating 65(86.7%]) responding yes and only 10(13.3%) responding no. Thus organisations
should improve the safety regulation to improve employee turnover and project completion.

54
Table 4.45: would safety regulation affect your decision to leave or stay in the organisation?
Frequency Percentage Cumulative Percentage
Yes 65 86.7 86.7
No 10 13.3 100.0
Total 75 100.0
The analysis on the cross tabulation below shows all the departments values the safety regulations
and can affect their decisions of whether to leave or to stay in the organisation. Transport and the
operations department were the leading with the procurement been the last one.
Table 4.46: Departmental rating of whether safety regulation affects decision to leave or stay in the organisation
Department Yes No Total
Finance 10 2 12
Procurement 5 1 6
Transport 18 1 19
Operations/ workshop 18 3 21
Stores 8 2 10
Human resource 6 1 7
Total 65 10 75
4.7.4 Does the work environment in the organisation increase your commitment to the organisation?
From the table 4.27 below, it indicates that work environment does increase commitment to the
organisation with 64(85.3%) responding yes while only 11(14.7%) responded no. Thus
organisations should improve the work environment to reduce the employee turnover and increase
the rate of project completion
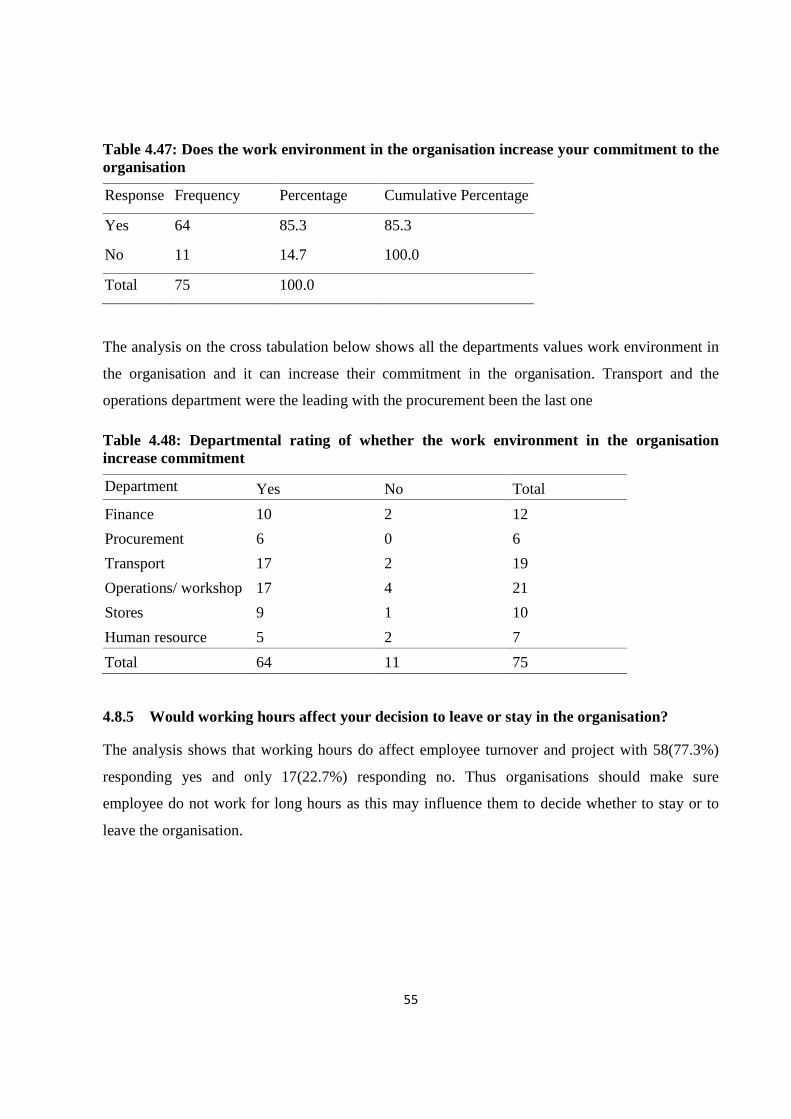
55
Table 4.47: Does the work environment in the organisation increase your commitment to the organisation
Response Frequency Percentage Cumulative Percentage
Yes 64 85.3 85.3
No 11 14.7 100.0
Total 75 100.0
The analysis on the cross tabulation below shows all the departments values work environment in
the organisation and it can increase their commitment in the organisation. Transport and the
operations department were the leading with the procurement been the last one
Table 4.48: Departmental rating of whether the work environment in the organisation increase commitment
Department Yes No Total
Finance 10 2 12
Procurement 6 0 6
Transport 17 2 19
Operations/ workshop 17 4 21
Stores 9 1 10
Human resource 5 2 7
Total 64 11 75
4.8.5 Would working hours affect your decision to leave or stay in the organisation?
The analysis shows that working hours do affect employee turnover and project with 58(77.3%)
responding yes and only 17(22.7%) responding no. Thus organisations should make sure
employee do not work for long hours as this may influence them to decide whether to stay or to
leave the organisation.

56
Table 4.49: Would working hours affect your decision to leave or stay in the organisation?
Frequency Percentage Cumulative Percentage
Yes 58 77.3 77.3
No 17 22.7 100.0
Total 75 100.0
The analysis on cross tabulation shows that working hours do affect employee retention in all the
departments with the operations department having the highest respondents and the human
resources with the lowest respondents. Thus organisations should make sure employee do not
work for long hours as this may influence them to decide whether to stay or to leave the
organisation
Table 4.50: Departmental rating of whether working hours affect decision to leave or stay in the organisation
Department Yes No Total
Finance 12 0 12
Procurement 4 2 6
Transport 14 5 19
Operations/ workshop 17 4 21
Stores 8 2 10
Human resource 3 4 7
Total 58 17 75
Presentation of hypothesis testing between organisational commitment as a retention strategy and
employee turnover

57
Table 4.51: Chi-Square Tests on the relationship between working environment and employee turnover
Questions Chi-Square value df
Asymp. Sig.
(2-sided)
Would safety regulation affect your decision to leave or stay in the organisation?
77.724 4 0.000
Would working hours affect your decision to leave or stay in the organisation??
77.007 4 0.000
Would working conditions affect your decision to leave or stay in the organisation?
79.103 6 0.000
Table above confirms that working environment and employee’s retention are not independent
since at 4 and 6 degrees of freedom the calculated Chi- square is greater than expected. The null
hypothesis is rejected meaning that working life influence the employee retention and project
completion hence there is a direct relationship between the two variables.
4.7.6 Number (1 to 5) the following Retention Strategies to indicate the extent to which they
would affect your commitment to the organization.
From table below it shows that wages level and rewards would affect ones commitment to the
organisation with 42(56%) respondents showing great extend, training and career development
was number two with 17(22.75) respondents, followed by work environment with 11(14.7%) and
organisational commitment was the last with 5(6.7%)
Table 4.52: Number (1 to 5) the following Retention Strategies to indicate the extent to which they would affect your commitment to the organization.
Variables Frequency Percentage Cumulative Percentage
Organisational commitment 5 6.7 6.7
Wages level and rewards 42 56.0 62.7
Training and career development 17 22.7 85.3
Work environment 11 14.7 100.0
Total 75 100.0

58
From table below on cross tabulation it shows that wages level and rewards would affect ones
commitment to the organisation in all the departments. Training and development was the second.
Thus the organisation should put more efforts on wages and training development as a strategy of
retaining employees.
Table 4.53: Departmental rating of various retention strategies to indicate the extent to which they would affect your commitment to the organization
Department Organisational commitment
Wages level & commitment
Training and development
Work environment Total
Finance 3 4 5 0 12
Procurement 0 4 0 2 6
Transport 0 12 7 0 19
Workshop 2 10 1 8 21
Stores 0 9 1 0 10
Human resource 0 3 3 1 7
Total 5 42 17 11 75
From the analysis wages and rewards is the one which affects mostly employee turnover and
project completion and the organisational commitment is the least one. Thus organisation should
put more efforts in improving the wages and rewards to retain more employees.

59
CHAPTER FIVE
SUMMARY OF FINDINGS, DISCUSSIONS, CONCLUSION AND
RECOMMENDATIONS
5.1 Introduction
This chapter reports the findings and highlights various discussions of the organization’s employee
retention strategies affecting their turnover and project completion. The cumulative data was
analyzed using quantitative analysis and presented in form of tables. Finally conclusions and
recommendations emanating from this study are presented.
5.2 Summary of findings
This study was conducted with the aim of identifying effects of the organisational retention
strategies on employee retention and project completion at Civicon Limited, a company
undertaking major construction projects in Kenya, Tanzania, Rwanda, Southern Sudan Congo and
other countries with its head office based in Mombasa county, Kenya. It was found according to
gender, male represented the biggest proportion of the employees with 62.7% and female 37.3%.
This shows that in construction companies male are more required than female. The study findings
indicate that age bracket 31-40 years has majority 42.7% of the respondents and age bracket 51-60
years has the lowest 8%.
The study findings indicate that 54.7% of the respondents possess up to college level of education
followed by university with 34.7% and the primary level has the least of 1.3%. This implies that
the organisation considers a lot as far as education level. This can be interpreted to imply that
projects do not require high levels of education when recruiting its personnel. As per the marital
status it indicates that a large proportion of the respondents are married with 58.7%. The analysis
indicates that 37.3% of the respondents had worked in the current organization for between 3 and
5 years and 15 years has the least of 2.7% an indication the most staff do not stay in the
organisation for a long period. This implies that the organization must have a good working
scheme and conditions going by the rate of staff work-service. It could also emphasize the delicate
nature of the projects where experience is core and so the organization is committed to retaining
productive employees.
60
The first independent variable was organisational commitment. Two indicators were used to
measure the organisational commitment as retention strategy at Civicon Limited. The first
indicator was work life policies. This shows that the effectiveness of work life policies in the
organisation was average with 58.7% of the respondents rating it as average, 18.7% little extent,
14.7% great extent and only 8% indicated that there is no extent. The second indicator was career
opportunities. This shows that the extent of promotion off career opportunities by the organisation
is average with 65.3% rating it average, 20% little extent 10.75% great extend and only 45 no
extent. This shows that organisational commitment is very essential in employee retention and
project completion. For the chi-square test it was found that there is a relationship between
organisational commitment and employee turnover affecting project completion thus the null
hypothesis was rejected
The second independent variable was wage level and rewards. There were two indicators for this
variable. The first indicator was salary level which indicated that it was good with 40% rating is as
good, 37.3% fair, 12% excellent 7% as poor and only 1.3% as unsatisfactory. The other indicator
was other pay packages like contingent pay, benefits and recognition. For this rewards cash
rewards affected employee commitment than contingent pay and recognition. From the chi-square
test the null hypothesis was rejected as it shows that there is e relationship between wages level
and other rewards with employee retention and project completion therefore organisation should
use this as one the strategy for retaining the employees.
The third independent variable was training and career development. This variable had three
indicators. The first indicator was education level. From the analysis it shows that the level of
education increases the employee commitment to the organisation with 88% indicating that it
affects especially where there are opportunities for career growth based on the level of education.
12% indicated that it does not increase their commitment. This was especially from those who
were not highly educated. The second indicator was training days. The analysis shows that the
training days do affect employee’s commitment to the organisation hence affecting employee
turnover. Out of the 75 respondents 76% indicated that training days affects the employee
commitment and 24 % do not affect. The third indicator was training programmes. The analysis
shows that 37.4% rated the programme as good, 34.7% rated it as fair, 12% as poor and 9.3%. The

61
chi-square results indicated that there is a relationship between training and career development
and employee turnover hence this should be used as a retention strategy by organisations.
The fourth independent variable was work environment. There were three indicators for this
variable. The first indicator was working conditions. The findings indicated that 69.3% rated the
organisation work environment as good. This implies that Civicon limited is making efforts the
make the work environment good as a strategy in order to retain the employees. Of the balance, 16
% rated is as fair, 9.3% as excellent and 4% as poor. Only 1.3% indicated it as unsatisfactory. The
second indicator was safety regulation. The findings shows that safety regulations do affect
employee turnover and project completion with a rating 86.7% responding yes and only 13.3%
responding no. Thus organisations should improve the safety regulation to improve employee
turnover and project completion. The third indicator was working hours. The analysis shows that
working hours do affect employee turnover and project with a rating of 77.3% responding yes and
only 22.7% responding no. Thus organisations should make sure employee do not work for long
hours as this may influence them to decide whether to stay or to leave the organisation. The chi-
square test shows that there is a strong relationship between work environment and employee
turnover thus the null hypothesis was rejected. Thus organisations should emphasis on improving
working environment as a retention strategy affection employee turnover and project completion.
5.3 Discussions
Based on the findings of this study, it was revealed that wages and rewards play an important role
in employee retention. This represented 56% of the total population sampled. This is in agreement
with Cole (2002) that this is single most important obligation owed by an employer to an
employee. Griffeth et al (2000) noted pay and pay-related variables have a modest effect on
turnover. Their analysis also included studies that examined the relationship between pay, a
person’s performance and turnover. They concluded that when high performers are insufficiently
rewarded, they leave. They cited findings from Milkovich and Newman (2009) that where
collective reward programs replace individual incentives, their introduction may lead to higher
turnover among high performers.
Training and career development was the second rating representing 22.7% of the total sample
size. Armstrong (2006) describes training and career development as being concerned with
providing opportunities for people to progress and develop their careers and ensuring that the

62
organization has the flow of talent it needs. He goes on to say that the elements of career
management are the provision of learning and development opportunities, career planning and
management succession planning. Career development programs, according to Bernardin (2006),
are effective retention tools and are quickly becoming an employee expectation. Organizations
recognize that they can link their career programs to specific business objectives while developing
their employees to meet their goals. These programs tell employees that the organization values
and respects them by investing in their future career growth thus feel the need to remain in the
organization.
The third one was work environment which represented 14.7%. Armstrong (2009), explains that
work-life balance employment practices are concerned with providing scope for employees to
balance what they do at work with the responsibilities and interests they have outside work and
this balance should be healthy further explains Kodz et al (2002) as cited by Armstrong (2009).
Thus, the idea that employers might use family-friendly (work-life balance) policies to help recruit
and retain valued workers is one that has been used for years by many employers (Noeet al 2006).
The last variable was organisational commitment which was rated 6.6%. This does not mean that
organisation should not be committed. Lum et al’s (2003) study of pediatric nurses suggested that
organisational commitment has the strongest and most direct impact on the intention to quit
whereas job satisfaction has only an indirect influence. They suggested that satisfaction indirectly
influences turnover in that it influences commitment and hence turnover intentions. (Mueller &
Price,2010 cited in Lum). Elangovan (2001) noted that the notion of job satisfaction and
organisational commitment being causally related has not been incorporated in most turnover
models. His study indicated there were strong causal links between stress and satisfaction (higher
stress leads to lower satisfaction) and between satisfaction and commitment (lower satisfaction
leads to lower commitment). He further noted a reciprocal relationship between commitment and
turnover intentions (lower commitment leads to greater intentions to quit, which in turn further
lowers commitment). In summary, only commitment directly affected turnover intentions.

63
5.4 Conclusion
The study has established that some of the variables do affect the employee turnover. From table
4.52 it shows that wages level and rewards would mostly affect ones commitment to the
organisation with 42(57%) respondents showing great extend, training and career development
was number two with 17(22.7%) respondents, followed by work environment with 11(14.7%) and
lastly organisational commitment with 5(6.6%). Also from the chi-square test results it indicated
that only three variables out of the four have strong relationship with employee retention and
project completion. Organisations should emphasis more on reducing employee turnover as this
one can affect the period when projects can be completed. Also organisations should look for more
ways and strategies on how they can reduce the rate of staff turnover.
5.5 Recommendation
Having looked at the implications of the study and made the above conclusions, the researcher has
made some recommendations based on the findings of the study
1. The management of the organisation should address employees concerns on time and improve
the working conditions. This can be done by putting the employee’s suggestions in action and
act on them immediately they are expressed.
2. The reward package should be restructured to motivate the employees more. This could be
done by comparing and implementing using those of best practices in the industries.
3. The organisation should also be very much committed so as retain more talented employees as
its commitment affect project completion.
4. The organisation should look for more retention strategies especially those applied by other
organisations in the same industry and also other industries.
5.6 Suggestions for further research
Given that the findings on the effect of organization retention strategies on employee turnover at
Civicon Limited;
1. The researcher suggests that more research be conducted in other organisations in the same
sector and other sectors as well.

64
2. The policy makers of the company to investigate more on employee’s perceptions of the
retention strategies and their direct impact on the project completion.
3. A research should be conducted on various other retention strategies or organizational
activities which increase employee turnover.

65
REFERENCES
Abelson M. A. (2007), ‘Examination of avoidable and unavoidable turnover’ Journal of Applied
Psychology, vol. 72(3), pp. 382-386.
Allen N. J. & Meyer J. P. (2012), ‘The measurement and antecedents of affective, continuance and
normative commitment on the organization’, Journal of Occupational Psychology, vol.
63(1), pp.1-18
Babbie, E and Mouton ,J. (2001) The practice of Social Research. Cape Town: Oxford University
Press, Southern Africa.
Bannister, B.D and Grieffeth, R.W.(2004), Applying a casual analytical framework to the Mobley,
Horner and Hollingsworth (1978) turnover model: a useful re-examination, ‘Journal of
hospitality management Vol.12 No.3, pp 433-443.
Beach R., Brereton D. & Cliff D. (2003), Workforce turnover in FIFO mining operations in
Australia: An exploratory study, Centre for Social Responsibility in Mining, University of
Queensland & Sustainable Minerals Institute. http://www.csrm.uq.edu.au. Accessed
November 2004.
Brownell and Judi (1998) Striking a balance; the future of work and family issues in the
Hospitality industry: The Haworth Press inc.Vol.28 (No 1 and 2),p 21-26.
Boxall P., Macky K. & Rasmussen E. (2003), ‘Labour turnover and retention in New Zealand; the
causes and consequences of leaving and staying with employers’, Asia Pacific Journal of
Human Resources, vol.41(2), pp.196-214.
Chang E. (2009), ‘Career commitment as a complex moderator of organizational commitment and
turnover intention’, Human Relations, vol. 52 (10), pp.1257-1278.
Chartered Institute of Personnel and Development (2004), Fact sheet on employee turnover and
retention.
Cornell Hospitality Quarterly (1992, June,).International Journal of Hospitality Management,
Vol.14, (Issue 2). pp 139-150.

66
Davies D., Taylor R. &Savery L. (2001), ‘The role of appraisal, remuneration and training in
improving staff relations in the Western Australian accommodation industry: a omparative
study’, Journal of European Industrial Training, vol.25(6/7), pp. 366-373.
Derek Torrington, Laura hall and Stephen Taylor. (2008) Human Resource Management.7th
edition Prentice Hall.
Elangovan A. R. (2001), ‘Causal ordering of stress, satisfaction and commitment, and intention to
quit: a structural equations analysis’, Leadership & Organization Development Journal,
vol.22(4), pp.159-165.
Fair, R. (1992) Australian Human Resource Management: Framework and practice, (2nd edition),
McGraw-Hill, Sidney.
Firth L., Mellor D. J., Moore K. A. & Loquet C. (2004), ‘How can managers reduce employee
intention to quit?’, Journal of Managerial Psychology, vol.19(2), pp.170-187.
Fortino, P., Ninemeier, J. (1996) "Industry in the dark about turnover rate", Lodging, Vol. 22
(No.4), pp.25.
Glebbeek, A.C., Bax, E.H. (2004) Is high employee turnover really harmful; An empirical test
using company records, Academy of Management Journal, Vol. 47 (No.2), pp.86-277
Griffeth R. W., Hom P. W. &Gaertner S. (2000), ‘A Meta-analysis of antecedents and correlates of
employee turnover: Update, moderator tests, and research Implications for the next
millennium’, Journal of Management vol. 26(3), pp.463-488.
Guerrier, Y. (1999). Organizational behavior in hotels and restaurants: An international
perspective, Chichester: John Wiley.
Gupta, N. and Shaw,J.(2001) Pay fairness and Employee outcomes. Exacerbation and attenuation
effects of financial needs.Journal of Occupational and Organizational Psychology Vol 74
(3), pp 22.
Guthrie J. P. (2001), ‘High-involvement work practices, turnover and productivity: Evidence from
New Zealand’, Academy of Management Journal vol. 44(1), pp.180-190.

67
Hegney D., Rogers-Clark C., Gorman D., Baker S. & McCarthy, A. (2001), Factors influencing
the recruitment and retention of nurses in rural and remote areas in Queensland,
Department of Nursing, University of Southern Queensland.
Hiemstra, S.J. (1990) Employment policies and practices in the lodging industry, International
Journal of Hospitality Management Volume 9 (No.3) page 207-221.
Hinkin,T.R and Tracey,J.B. (2000) The cost of turnover, The Cornell HRA Quarterly .page 14-21.
Hinkin,T.R and Tracey,J.B. (2000). Impact of your employees resigning from work. (1998),
Huselid M. A., (1995), ‘The impact of human resource management practices on turnover,
productivity and corporate financial performance’, Academy of Management Journal, vol.
38(3), pp.635-672.
Kenya Bureau of statistics (2009) Job opening and labour turnover survey. Retrieved from URL
Kirschenbaum A. & Mano-Negrin R. (1999), ‘Underlying labor market dimensions of
“opportunities”: The case of employee turnover’, Human Relations, vol. 52(10), pp.1233-
1255.
Kirschenbaum A. & Weisberg J. (2002), ‘Employee’s turnover intentions and job destination
choices’, Journal of Organizational Behavior, vol. 23(1), pp.109-125.
Kothari C.R (2004) Research Methodology. New Delhi, WishwaPrakashan
Lee T. W. & Mitchell T. R. (1994), ‘An Alternative approach: The unfolding model of voluntary
employee turnover’, Academy of Management Review vol.19(1), pp.51-89.
Lum L., Kervin J., Clark K., Reid F. &Sirola W. (1998), ‘Explaining nursing turnover intent: job
satisfaction, pay satisfaction or organizational commitment?’, Journal of Organizational
Behavior, vol.19(3), pp.305-320.
International journal of Industrial Organization Vol 16, (Issue 3) Pages 353-376.
International Labor Organisation. (2001) Human resource development, employment and
globalization in the hotel, catering and tourism sector: Report for discussion at the
tripartite meeting on the human resource development, employment and globarisation in
the hotel, catering and tourism sector. Geneva:

68
Kusluvan, S. (2003) Multinational enterprises in tourism; A case study of Turkey. Unpublished
doctoral dissertation, Strathclyde University, the Scottish Hotel School, Glascow.
Martin C. (2003) ‘Explaining labour turnover: Empirical evidence from UK establishments’,
Labour, vol.17(3), pp.391-412.
Michael Armstrong (2008) Human Resource Management Practice. 10th edition Internationaln
student edition London .
Mitra, A., Jenkins, G.D and Gupta, .N (1992) A meta-analysis review of the relationship between
absence and turnover.Journal of Applied Psychology; Vol.1 (Issue 3).page 879-889.
Mobley, W.H. (1977). Employee turnover, Causes, Consequences, and Control. Reading MA:
Addison- Wesley.
Mobley W. H., Griffeth R. W., Hand, H. H. &Meglino, B. M. (1979)‘Review and conceptual
analysis of the employee turnover process’, Psychological Bulletin vol. 86 (3), pp.493-522.
Morrell K.M., Loan-Clarke J. & Wilkinson J (2004), ‘Organisational change and employee
turnover’, Personnel Review, vol. 33(2), pp.161-173.
Mugenda, O.M and Mugenda, A.G (2003) Research Methods: Quantitative and Qualitative
Approaches. ACTS Press, Nairobi, Kenya.
Nachmias C.F and Nachmias D. (2004) Research Methods in Social Science. 5th edition, Arnold:
London
Nankervis, A.L., Compton, R. L., and McCarthy, E. T., (1996) Strategic human resource
management, National Library of Australia. Thomas Nelson, Australia
Politt D. (2003) ‘Shift-pattern switch improves staff turnover and recruitment at Seeboard’,
Human Resource Management International Digest , vol.11(1), pp.12-14.
Politt D. (2004) ‘Marina Developments staff get a lift from boatyard training’ Human Resource
Management, vol.12(2), pp.14-16.
Samuel M. Nyandemo. (2007) Research Methodology Methods and Approaches. University of
Nairobi: Bishen Sign Publishers

69
Shah C. & Burke G. (2003), Labour mobility: demographic, labour force and education effects and
implications for VET, Report to ANTA, Centre for the Economics of Education and
Training, Monash.
Statistics Canada (2003), ‘Innovative work practices and labour turnover in Canada’ The Evolving
Workplace Series.
Tang T. L. P., Kim J. W. & Tang D. S. H (2000), ‘Does attitude toward money moderate the
relationship between intrinsic job satisfaction and voluntary turnover?’ Human Relations,
vol. 53(2), pp.213-245.
Taplin I. M., Winterton J. &Winterton R. (2003), ‘Understanding labour turnover in a labour
intensive industry: Evidence from the British clothing industry’ Journal of Management
Studies, vol. 40 (4),pp.1021-1046.
Taylor, S. (2002) People and Organization Employee Resourcing. Prentice-Hall, Sidney;
Australia.
Tziner A. &Birati B. (1996), ‘Assessing employee turnover costs: A revised approach’ Human
Resource Management Review, vol. 6(2), pp.113-122
White, G.L (2005). Employee turnover;The hidden drain on profits; HR Focus, Vol.72 (No.1)
pp.15-17.
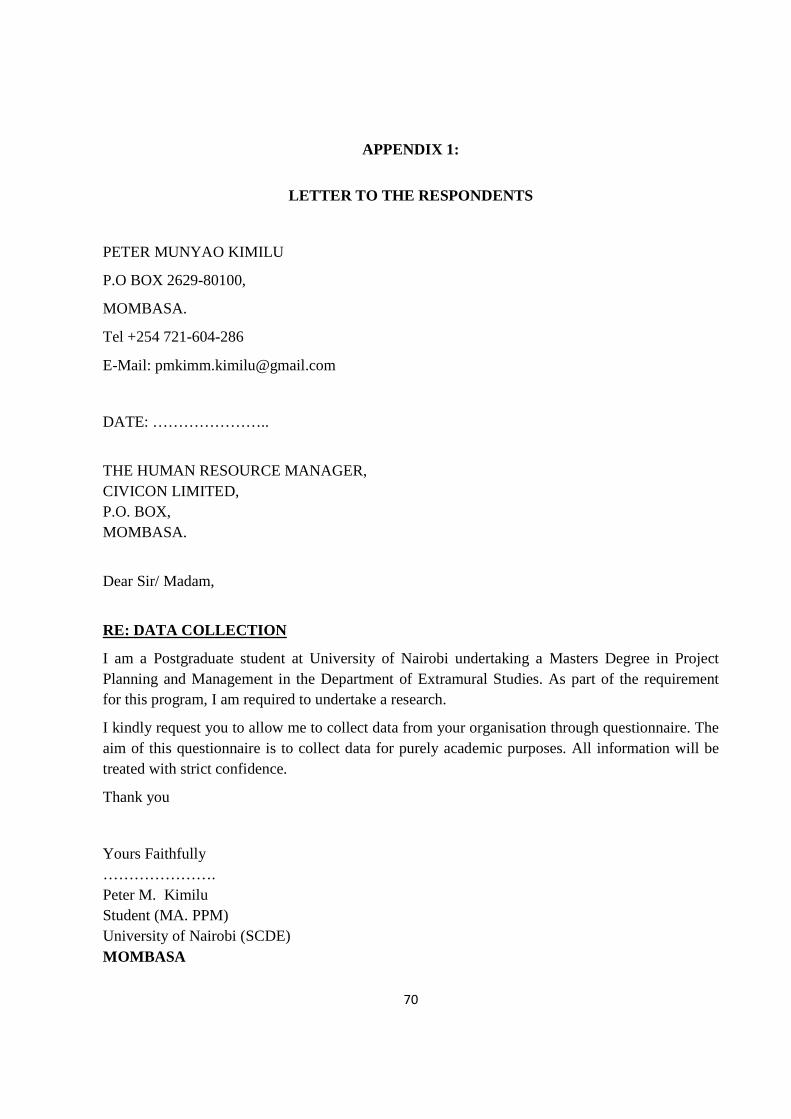
70
APPENDIX 1:
LETTER TO THE RESPONDENTS
PETER MUNYAO KIMILU
P.O BOX 2629-80100,
MOMBASA.
Tel +254 721-604-286
E-Mail: [email protected]
DATE: …………………..
THE HUMAN RESOURCE MANAGER, CIVICON LIMITED, P.O. BOX, MOMBASA.
Dear Sir/ Madam,
RE: DATA COLLECTION
I am a Postgraduate student at University of Nairobi undertaking a Masters Degree in Project Planning and Management in the Department of Extramural Studies. As part of the requirement for this program, I am required to undertake a research.
I kindly request you to allow me to collect data from your organisation through questionnaire. The aim of this questionnaire is to collect data for purely academic purposes. All information will be treated with strict confidence.
Thank you
Yours Faithfully …………………. Peter M. Kimilu Student (MA. PPM) University of Nairobi (SCDE) MOMBASA

71
APPENDIX II
RESEARCH QUESTIONNAIRE
EFFECT OF ORGANIZATIONAL RETENTION STRATEGIES ON EM PLOYEE
TURNOVER AND PROJECT COMPLETION
Dear respondent
I am a student at University of Nairobi undertaking a Master’s Degree in Project Planning and
Management. I am in the process of conducting a research with the view of analyzing the effect of
organizational retention strategies on employee turnover in your organisation. The project is a
partial requirement by the institution for the award of the Masters Degree. You are selected as one
of the respondent. Kindly fill in the questionnaire below to assist in data gathering for my analysis.
Your co-operation in ensuring that the questionnaires are answered will be highly appreciated.
Information collected from this questionnaire will be handled with high confidentiality and will
strictly be used for academic purposes by the researcher.
Kindly answer the following questions by ticking in (√) the appropriate box or filling the spaces
provided.
SECTION A: PERSONAL INFORMATION
1. What is your gender? Male Female
2. How old are you?
Age (years) 20 – 30 31 – 40 41 - 50 51 – 60 Above 60
Response
3. What is your highest level of education?
University College High School Primary School
4. What is your marital status?
Single Married Other (Specify)……………….....

72
5. What is your current designation (position held)……………………..……………...
6. Which department are you currently attached to?
Finance
Procurement
Transport
Operation/workshop
Stores
Human resource
7. How long have you worked in this organization?
Length Below 3 years 3 –5 years 6 –10 years 11 –15 years Above 15 years
Response
SECTION B: RETENTION STRATEGY 1: ORGANISATIONAL COM MITMENT.
8. How would you rate the organisational commitment in your organization?
Excellent Good Fair Poor Unsatisfactory
9. To what extent are the work life policies in your organization effective?
Great Extent Average Little extent No extent
10. To what extent does your organisation promote career opportunities?
Great Extent Average Little extent No extent
11. Would organisational commitment to good work life policies and career opportunities affect
your desire to stay with the organization and be commitment to your job?
Yes No

73
SECTION C: RETENTION STRATEGY 2: WAGES LEVEL AND R EWARDS.
12. How would you rate the rewards/compensation package in the organization?
Excellent Good Fair Poor Unsatisfactory
13. Do you agree with the following statement:
“Feeling proud of your work is more important to you than getting a pay raise.”
Strongly agree Mostly agree Barely agree Disagree
14. To what extent would the following types of rewards increase your commitment to the
organization?
Where 1–Greatest Extent, 2–Some extent, 3–Average, 4–Little extent, 5–No extent
Types of Rewards / Rate 1 2 3 4 5
Financial rewards
Basic Pay/Salary
Contingent pay
Benefits
Non-financial rewards
Recognition
NB: Where contingent pay is additional financial rewards that are related to performance,
competence or contribution.
SECTION D: RETENTION STRATEGY 3: TRAINING AND CAREE R DEVELOPMENT
15. How would you rate the organization’s training programme?
Excellent Good Fair Poor Unsatisfactory

74
16. To what extent would training and career development opportunities influence your
commitment to the organization?
Great Extent Average Little extent No extent
17. Does your education level increase your commitment to the organisation?
Yes No
18. Does the number of training days in the organisation increase your commitment to the
organisation?
Yes No
19. Which of the following would mostly influence your commitment to the organization?
Education level Training days Training programmes
SECTION E: RETENTION STRATEGY 4: WORKING ENVIRONMEN T
20. How would you rate the organization’s working environment? Consider physical working
conditions, welfare, working hours, work-life balance, nature of work, organization culture and
safety regulations.
Excellent Good Fair Poor Unsatisfactory
21. Which of the following would mostly influence your commitment to the organization?
Working conditions Safety regulations Working hours
22. Would working hours affect your decision to leave or stay in the organisation?
Yes No
23. Does the work environment in the organisation increase your commitment to the
organisation?
Yes No

75
24. Number (1 to 6) the following Retention Strategies to indicate the extent to which they
would affect your commitment to the organization.
Where 1 – Greatest Extent 6 – Least Extent
Organisational commitment
Job satisfaction
Age characteristics of employee
Wages level and rewards
Training and career development
Working environment
Comment…………………………………………………………………………………..…………
………………......................................................................................................................................
...........………………………………………………………………………………………………
………………………………………………………………………………………………………
………………………………………………………………………………………………………
……………...……...….……………...................................................................................................
.................................................................................................................................................
25. What other factors or strategies or policies, which have not been covered in this
questionnaire, does the organization employ as an attempt to retain staff members?
………………………………………………………………………………………………………
………………………………………………………………………………………………………
………………………………………………………………………………………………………
………………………………………………………………………………………………………
………………………………………………………………………………………………………
………………………………………………………………………………………………………

76
26. Comment on any improvements or policies or strategies that you think the organization
could adopt to minimize labour turnover
………………………………………………………………………………………………………
………………………………………………………………………………………………………
………………………………………………………………………………………………………
………………………………………………………………………………………………………
……………………………………………………………
NB: Brochures or other materials relevant to this study are welcome.
Thank you for taking time to fill in this questionnaire and God bless you.