effect of mix ingredients on performance of rubber-modified
TRANSCRIPT
• 1 " .
., . . , :
Effect of Mix Ingredients on Performance of
Rubber Modified Asphalt Mixtures
EFFECT OF MIX INGREDIENTS ON PERFORMANCE OF RUBBER MODIFIED ASPHALT MIXTURES
Final Report
by
H. B. Takallou, Jay Mcquillen, Jr.
and R. G. Hicks
Transportation Research Institute Oregon State University
Corvallis, OR 97331-2302
ALASKA DEPARTMENT OF TRANSPORTATION AND PUBLIC FACILITIES RESEARCH SECTION 2301 Peger Road
Fairbanks, Alaska 99709
in cooperation with
U. S. Department of Transportation Federal Highway Administration
The contents of thi s report refl ect the vi ews of the author who is responsible for the facts and the accuracy of the data presented herein. The contents do not necessarily reflect the official views or policies of the Alaska Department of Transportation and Public Facilities or the Federal Highway Administration. This report does not constitute a standard, specification or regulation.

Technical Report Documentation Page
1. Report No. 2. Government Accession No. 3. Recipient" s Coralog No.
FHWA-AKRD-86-05
•• Title and Subtille 5. Reporl Dale
I Effect of Mix Ingredients on Performance of Rubber- May 1985 Modified Asphalt M:!-xtures 6. Performing Orgoni :.ollon Code
8. Performing Organi:.orion Report No. 7. Aurhar's)
H. B. Takallou, J. Mcquillen, Jr. , and R.G. Hicks 85-8 9. Performing Organization Nome and Address 10. Work Unit No. (TRA1S)
Department of Civil Engineering Oregon State University II. Contract or Grant No. Corvallis, OR 97331 92IP287
13. Type of Report and Period Covered
12. Sponsoring Agency Nome and Address April 1983-April 1985 ftlaska Regt.tof Transportation & Public Facilities esearc ec l.on Final
2301 Peger Road I •. Sponsoring Agency Code Fairbanks, Ak 99701-6364
15. Supplementary Notes
In cooperation with the u.s. Department of Transportation, Federal Highway Administration
16. Abstract
This research project consisted mainly of a laboratory study of mix properties as a function of variables, such as rubber gradation and content, void content, aggregate gradation, mix process, temperature, and asphalt content. Twenty different mix combinations were evaluated for diametral modulus and fatigue at two different temperatures (_6°C, + 10°C). Layered theory was used to evaluate the effects of mixture variations on pavement life. The information resulting from the study was used to develop guidelines for use of rubber asphalt mixes in Alaska.
The findings of this study indicate that the rubber gradation and content, aggregate gradation, and use of surcharge during sample preparation have consider-able effect on modulus and fatigue life of the mix. Also, due to greater allowable tensile strain in rubber-modified mixtures, the thickness of the modified mixtuI'.e 'can be reduced, using a layer equivalency of approximately 1.4 to 1. o. An economic comparison between rubber asphalt and conventional mixtures constructed in Alaska indicated that rubber mixes are slightly less cost effective. Other reported benefits of rubber-modified mixes, such as noise and ice control, were not included in the analysis.
17. Key Words 18. Distribution Statement
Robber-modified asphalt, reclaimed This document is available to the public rubber, modulus fatigue, layered analysis through the National Technical Informa-
tion Service, Springfield, VA 22168
19. Security Classi£. (of this report) 20. Security Clas!!.if. (of ,hi!!. page) 21. No. of Poges 22. Price
Unclassified Unclassified 212
Form DOT F 1700.7 (8-721 Reproduction of completed poge authorized
Implementation
This report .summarizes the results of field performance surveys and 1 aboratory testing programs aimed at i dentHyi ng the criti ca 1 factors in designing and constructing rubber-modified asphalt pavements using a content of 2 to 3% of coarse (! inch to #40 sieve) ground tire rubber. The benefits of adding rubber in this size range to asphalt paving mixes are those of increasing traction and reducing stopping distances.
A prior study by the Alaska Department.of Transportation evaluated the ice-removal and stopping distance aspects and documented an average reduction of 25% in icy-road stoppi ng di stances from the additi on of the
rubber. Si nce that time, the use of such "rubberi zed" mi xes has been encouraged for special situations where this benefit will offset the higher mix costs.
Thi s study has i ndi cated that benefits of extended fati gue 1 He may also be expected, and that the addition of rubber may normal paving mixes not specifically gap-graded to
be practi ca 1 in provi de a hi gh
percentage of coarse (+ k inch) parti cl es as has previously been done.
Initially, implementation will take the form of field trials of such "dense-graded" rubber-modHi ed mi xes to evaluate thei r workabil i ty and field performance. The consequence of varying mixing temperatures, rubber gradations, and density levels were also evaluated. Pavement designers are encouraged to evaluate the results reported herein when proceeding to prepare specifications and trial mix designs for construction projects.
David C. Esch Highway Research Manager Department of Transportation
and Public Facilities Statewide Research
ACKNOWLEDGEMENTS
The authors wish to acknowledge the support of the Alaska Department of
Transportation and Public Facilities, who sponsored this study. Special
thanks are extended to our contract manager, Dave Esch, ADOTPF, Research
Section, Fairbanks, Alaska, for keeping us on target and on time. His support
and assistance were extremely helpful throughout the project. Numerous other
AOOTPF personnel were extremely helpful throughout the project. In addition,
special thanks goes to numerous laboratory personnel from Oregon State Univer
sity. Particular recognition should be extended to Andy Brickman, Scientific
Technician at Oregon State University, for his assistance in preparing testing
equipment. Also, special thanks goes to James Lundy for his assistance in the
preparation of samples and conducting the performance survey, and Ginnie
Grilley for assistance with the literature review and in preparation of
samples. Both are graduate students at Oregon State University.
Finally, a special thank you is extended to the OSU Engineering Experi
ment Station (Laurie Campbell, Peggy Offutt, and Marilyn Tubbs) for typing
this report.
DISCLAIMER
The contents of this report reflect the views of the authors who are
responsible for the facts and the accuracy of the data presented herein. The
contents do not necessarily reflect the official views or policies of either
the Alaska Department of Transportation and Public Facilities or Oregon State
University. This report does not constitute a standard, specification, or
regulation. Alaska DOTPF does not endorse products or manufacturers. Trade
marks or manufacturers' names appear herein only because they are considered
essential to the object of this document.
ii
1.0
2.0
3.0
TABLE OF CONTENTS
INTRODUCTION ...................................................................................................... ..
I. I Problem. St aternent .................................................................................... ..
1.2 Project Objectives ................................................................................. ..
1.3 Scope of Report ....................................................................................... ..
LITERATURE REVI'EW" .............................................................................................. ..
2.1
2.2
2.3
2.4
2.5
Use of Rubber in Asphalt Mixtures ••.•••••••.•••.•..••••••.••
2.1.1 2.1.2 2.1.3 2.1.4 2.1.5 201.6
History of Rubber Industry •••••••••••••••.•..•••••••• Tire Construction and Compounding •••••••••••••••••••• Important Properties of Recycled Rubber •••••••••••••• Survey of Rubber Suppliers •••.••••••••••••••••••.•••• Asphalt-Rubber Interactions •••••••••••••••••••••••••• Pa tents .......................................................................................... ..
Mix Design Considerations •••••••••••••••••••••••••••••••••••
2.2.1 2.2.2
Guidelines for Mix Design Guidelines for Mix Design
Marshall Method •••••••••• Hveem Procedure ••••••••••
Evaluation of Mix Properties ••••••••••••••••••••••••••
2.3.1 2.3.2
Alaska DOTPF Study (25) .•.•....•.•••..............••. All Seasons Surface Corporation Study •••••••••••••••
Evaluation of Field Projects ••••••••••••••••••••••••••••••••
2.4.1 2.4.2
Questionnaire Survey ••••••••••••••••••••••••••••••••• Discussion of Survey Results ••..•••••..•.••.•••••.••.
Summary ••••••••••••••••••••••••••••• , •••••••••• " ••••••••••
LABORATORY PROGRAM. •••••••••••••••••••••••••••••••••••••••••••••••
3.1
3.2
Test Variables ••••••••••••••.•••• : ••••••••••••••••••••••••••
Description of Materials ••••••••••••••••••••••••••••••••••••
3.2.1 3.2.2 3.2.3
Aggrega te •••••••••••••••••••••••••••••••••••••••••••• Asphal t •••••••••••••••••.••.•••••••••••••••.••••••••• Rl.1bber •••••••••••••••••••••••••••••••••••••••••••••••
iii
1
I
3
3
6
6
6 8 9
14 14 17
19
20 20
21
21 32
37
37 38
46
49
49
51
51 51 54
4.0
5.0
3.3
3.4
Laboratory Test Procedures and Equipment ••••••••••••••••••••
3.3.1 3.3.2
Mix Des ign Tes t:s ••••••••••••••••••••••••••••••••••••• Mixing Property Tests ••••••••••••••••••••••••••••••••
Summary ........................................................................................................ ..
TEST RESULTS ........................................................................................................ ..
4.1
4.2
4.3
4.4
4.5
4.6
4.7
Mix Design .................................................................................................. ..
4.1.1 Discussion of Results ••••••••••••••••••••••••••••••••
Mix Properties at lOoe ••••••••••••••••••••••••••••••••••••
4.2.1 4.2.2
Resilient: Modulus and Fat:igue at: +10°C ••••••••••••••• Fatigue Results at lOoe ••••••••••••••••••••••••••••••
Mix Properties at -6°e ••••••.•••••••••••••••••••••••••••••••
4.3.1 4.3.2
Resilient Modulus and Fatigue at -6°e •••••••••••••••• Fatigue Results at -6°e •••••.••••••••••••••••••••••.•
Effect: of Temperat:ure on Modulus of Rubber Asphalt: Mixt:ures
Effect: of Temperat:ure on Resilient: Modulus for Reclaimed Rubber ..................................................... Effect. of Aging on Resilient Modulus ••••••••••••••••••••••••
SUDJmary •••••••••••••••••••••••••••••••••••••••••••••••••••••
ANALYSIS OF DATA •••••••••••••••••••••••••••••••••••••••••••••••••
5.1
5.2
5.3
Layered Elastic Analysis of Data •••••••••••••••••••••••••••.
5.1.1 5.1.2 5.1.3
Analysis Procedure ••••••••••••••••••••••••••••••••••• Estimation of Shift Factor ••••••••••••••••••••••••••• Resul ts ••••••••••••••••••••••••••••••••••••••••••••••
Material Cos t.s ••••••••••••••••••••••••••••••••••••••••••••••
Life Cycle Cost Analysis ••••••••••••••••••••••••••••••••••••
5.3.1 5.3.2 5.3.3
5.3.4
Equal Annual Capit:al and Maint:enance COst:s ••••••••••• Equal Annual Capital Costs ••••••••••••••••••••••••••• Capit:alCost: Comparison Considering Layer
Equivalencies •••••••••••••••••••••••••••••••••••••• Summary Discussion •••••••••••••••••••••••••••••••••••
iv
54
54 56
72
73
73
80
80
80 95
97
97 109
L09
114
120
120
123
123
123 125 125
132
138
141 145
147 147
5.4 Guidelines for Use of Rubber-Modified Mlxes................. 149
5.5 Summary........................ .......................... •........ 151
6.0 CONCLUSIONS AND RECOMMENDATIONS ......••..••••••••••.•••.••..•.... 152
6 .. 1 Conclus ions.. .. .. .. .. .. .. .. .. .. .. .. .. .. .. .. .. .. .. .. .. .. .. .. .. .. .. .. .. .. .. .. .. .. .. .. .. .. .. .. .. .. .. .. .. .. .. .. .. 152
6.2 Recommendations .............................................................. """ ............ " .. " .... 154
6.3 Recommended Research .••••••.••....•••......•••••••••••••.•.. 155
7.0 REFERENCES .......................................................................................................... 156
APPENDICES
APPENDIX A SUMMARY OF INITIAL AND FOLLW-UP QUESTIONNAIRE SURVEY.. .. .. .. .. .. .. .. .. .. .. .. .. .. .. .. .. .. .. .. .. .. .. .. .. .. .. .. .. .. .. .. .. .. .. .. .. .. .. .. .. .. .. .. .. .. A-I
APPENDIX B DESCRIPTION OF LEMON ROAD PROJECT (RS-0955(l)) •••••• B-1
APPENDIX C TEST DATA..................................................................................... C-l
APPENDIX D PROGRAM FOR DETERMINING THE MODIFIED PAVEMENT GIVEN THE CONVENTIONAL PAVEMENT LIFE ..•......•....•• D-1
v
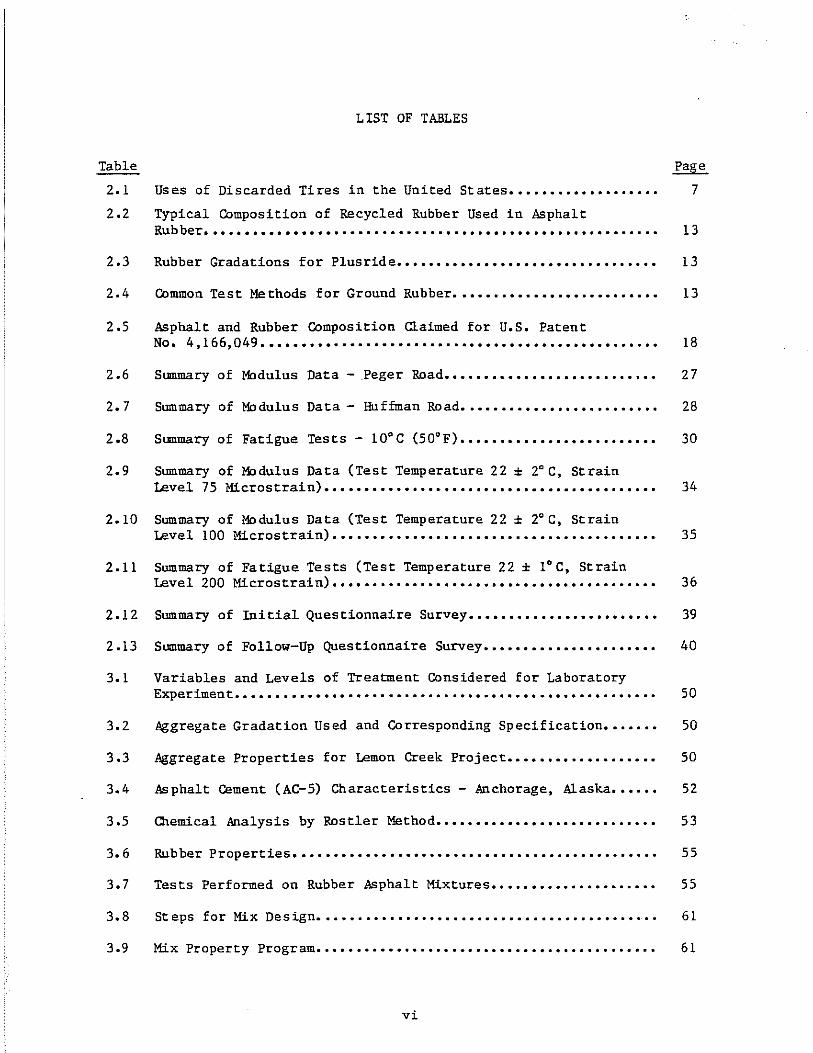
LIST OF TABLES
Table
2.1 Uses of Discarded Tires in the United States •••.•..•••.•...•.•.
2.2 Typical Composition of Recycled Rubber Used in Asphalt
Page
7
Rubber •••.••••••••••••..•.••••••..•.••••.••.•••••••.••••••.•.•. 13
2.3 Rubber Gradations for Plusride •••..•••••••••••••••••••.••...•.. 13
2.4 Common Test Me thads for Ground Rubber ......................... "" .................... .. 13
2.5 Asphalt and Rubber Composition Claimed for U.S. Patent No. 4,166,049. ...••.••..•..••.•..•.............••...•.......... 18
2.6 Stmmary of Modulus Data - .Peger Road ................................................... .. 27
2.7 Summary of Modulus Data - Huffman Road ............................................... .. 28
2.8 Summary of Fatigue Tests - 10"C (50"F) •...•.•....•..•••..•.•... 30
2.9 Summary of Modulus Data (Test Temperature 22 ± 2" C, Strain level 75 Microstrain).................................................................................... 34
2.10 Summary of Modulus Data (Test Temperature 22 ± 2" C, Strain Level 100 Microstrain).................................................................................. 35
2.11 Summary of Fatigue Tests (Test Temperature 22 ± l"C, Strain Level 200 Microstrain)......................................... 36
2.12 Summary of Initial Questionnaire Survey........................ 39
2.13 Summary of Follow-Up Questionnaire Survey...................... 40
3.1 Variables and Levels of Treatment Considered for Laboratory Experimen t.. . . . . . . . . . . . . . . . . . . . . . . .. . . . . . . . . . . . . . .. . . . .. . . .. . . . . . . . 50
3.2 Aggregate Gradation Used and Corresponding Specification ••••••• 50
3.3 Aggregate Properties for Lemon Creek Project •••••••••••.••••••• 50
3.4 Asphalt Cement (AC-5) Characteristics - Anchorage, Alaska •••••• 52
3.5 Chemical Analysis by Rostler Method •••••••••••••••.•••••••.•••• 53
3.6 R.u.b ber Properties •••••••.••.••..•...••••.••.•......•••.•.•.•... 55
3.7 Tests Performed on Rubber Asphalt Mixtures •••.•••••••••••..•••• 55
3.8 Steps for Mix Design ........................................... . 61
3.9 Mix Property Program ...................................................... .. 61
vi
Table
3.10 Summary of Compaction Study........................................................................ 66
4.1 Results of Mix Design (Gap-Graded Aggregate 0/100 Rubber Blend and 2% Rub be r) .. .. .. .. .. .. .. .. .. .. .. .. .. .. .. .. .. .. .. .. .. .. .. .. .. .. .. .. .. .. .. .. .. .. .. .. .. .. .. .. .. .. .. .. .. .. .. .. .. 74
4.2 Results of Mix Design (Gap-Graded Aggregate 0/100 Rubber Blend and 3% Rubber).................................................................................................. 74
4.3 Results of Mix Design (Gap-Graded Aggregate 60/40 Rubber Blend and 2% Rubber).................................................................................................. 74
4.4 Results of Mix Design (Gap-Graded Aggregate 60/40 Rubber Blend and 3% Rubber).................................................................................................. 74
4.5 Results of Mix Design (Gap-Graded Aggregate 80/20 Rubber Blend and 2% Rubber).......................... .... ................ ... 75
4.6 Results of Mix Design (Gap-Graded Aggregate 80/20 Rubber Blend and 3% Rubber).................................................................................................. 75
4.7 Results of Mix Design (Dense-Graded Aggregate 80/20 Rubber Blend and 3% Rubber)...................................................................................... 75
4.8 Results of Mix Design (Dense-Graded Aggregate, Control)........ 75
4.9 Summary of Modulus Data for Gap-Graded Mixes - Fine Rubber (Strain Level 100 Microstrain)................................. 78
4.10 Summary of Modulus Data for Gap-Graded Mixes - Medium Rubber (Strain Level 50 Microstrain).................................. 78
4.11 Summary of Modulus Data for Gap-Graded Mixes - Coarse Rubber (Strain Level 50 Microstrain).................................. 79
4.12 Summary of Modulus Data for Dense-Graded Mixes - Coarse Rubber (Strain Level 100 Microscrain)................................. 79
4.13 Specimen Identification........................................ 84
4.14 Summary of Resilient Modulus and Fatigue Life.................. 86
4.15 Summary of Fatigue Lives at Different Strain Levels (+10°C).... 98
4.16 Summary of Resilient Modulus and Fatigue Life.................. 99
4.17 Summary of Fatigue Lives at Different Strain Levels (-6°C)..... 111
4.18 Summary of Resilient Modulus at Three Different Temperatures ••• 112
4.19 Summary of Temperture Drop in Rubberized Asphalt Specimen at Different Time Intervals ••...•••....•..•...•••••••••.•..••.•••. 115
vii
Table
4.20 Sample Characterization .••••••••••••••••••••••••••.•••••••••••• 118
4.21 Temperature Effects on Modulus of Elasticity................... 118
4.22 Summary of Resilient Modulus After Aging....................... 121
5.1 Resilient Modulus for Conventional Asphalt and Rubberized Asphal t. . . . . . . . . . . . . . . . . . . . . . . . . . . . . . . . . . . . . . . . . . . . . . . . . . . . . . .. 124
5.2 Summary of Dat:a for Shift: Fact:or Det:erminat:ion................. 128
5.3 Tensile Strains from ELSYM5 Runs............................... 129
5.4 Summary of Laborat:ory and Shifted Fat:igue Lives................ 130
5.5 Summary of Layer Equivalency Results .•.......••.••...••..•••... 130
5.6 Material Cost of Asphalt Cement and Asphalt-Rubber Binders - Anchorage Area ••••••••••••••••••••••••••••••••••••••• 134
5.7 Material Cost of Asphalt Cement: and Asphalt-Rubber Binders - Fairbanks Area....................................... 135
5.8 Material Cost of Asphalt Cement and Asphalt-Rubber Binders - Juneau Area •••••••••••••••••••••••••••••••.•••••••••• 136
5.9 Estimated Cost for Rubber Asphalt Mix, 80/20 Blend, 3% Rubber Binders - Anchorage Area............................. 139
5.10 Estimated Costs for Rubber Asphalt Mix, 80/20 Bland, 2% Rubber - Anchorage Area ••.••••.•.•••.•.•••..•..••.•....••.•• 139
5.11 Estimated Cost: for Rubber Asphalt Mixes, 60/40 Blend, 2% Rubber - Anchorage Area •••••••••••••••••••••••••••.••••.••.• 140
5.12 Estimated Costs for Rubber Asphalt Mixes, 80/20 Blend, 3% Rubber, Dense Aggregate Grading - Anchorage Area •••••••••••• 140
5.13 Life Cycle Cost Comparisons with Equivalent Annual Costs .•..•.. l42
5.14 Comparison of Pavement Life for Equivalent Annual Capital Costs of Conventional and Asphalt Rubber-Modified Mixes........ 146
5.15 Capit:ol Cost Comparison Considering Layer Equivalencies........ 148
viii
L 1ST OF FIGURES
Figure
1.1 St udy .Approach •••.••••.••••..••.••••.•..•••.••.•.... _,_ ••••.••. 4
2.1 Cross Section View of a Passenger Tire .••••••••••••••••..•.•.• 7
2.2 Chemical Mechanism of Vulcanization and Devulcanization • •••••• 10
2.3 Effect of Rubber Processing Method ••••••••••.•••••••••••.••••• 10
2.4 Effect of Digestion Temperature on Properties of an Asphalt Natural Rubbe r. . . • . . . • • • . • . . . . . . . • . • • • . . . . . . . • .. . . .. . . . . . . . . • . 16
2.5 Effect of Digestion Temperature on Properties of an Asphalt Synthetic Rubber.............................................. 16
2.6 Effect of Rubber Content on Stability Peger Road •••••••••••• 23
2.7 Effect of Rubber Content on Air Voids - Peger Road •••••••••••• 23
2.8 Aggregate Gradation Used - Huffman Road •••••••••••••..••••••.• 25
2.9 Effect of Aggregate Gradation in Air Voids - Huffman Road ••••• 25
2.10 Effect of Aggregate Gradation on Stability ••••••••.•••••.••••• 26
2.11 Effect of Aggregate Gradation on Flow ••••••••••••••••••.•••••• 26
2.12 Modulus vs. Amounts of Coarse and Fine (-30) Rubber in Mix • ••• 29
2.13 Fatigue Life for Mixes with Fine and Coarse Rubber •••••••••••• 31
2.14 Aggregate Gradation Used on Selected Rubber Asphalt Projects...................................................... 39
3.1 Material Components for Specimen Preparation ••••••••••••••••.. 57
3.2 QJx t1i.xe r ••••••••••••••••••••••••••••••••••••••••••••••••••••• 57
3.3 Marshall As sernbly •••••••••••••••••••••••••••••••••.•••••..•••. 58
3.4 Sample Extrusion Assembly ••••••••••••••.•••••..•••.•.•••.•.••• 58
3.5 Stability and Flow Determination by MTS Machine ••••••••••••••• 59
3.6 Resilient Modulus Setup ••••••••••••••••••.•••••••••••..••••••• 60
3.7 Temperature Control System ••••••••••••.••••.••••••••••••.••••• 60
3.8 Resilient Modulus Setup .•.••••••.••.••••••••••••••.••••.••••.• 65
ix
Figure
3.9 Example of HP Recorder Output for Diametral Test •••••••••••••• 65
3.10 OJntrol Panel .•...•........•....•........•...........•...•.... 68
3.11 Testing Apparatus and Shel-Low Temperature Incubator •••••••••• 68
3.12 Sample with Diametral yoke •••••••••••••••••••••••••••••••••••• 69
3.13 Two-Channel Oscillographic Recorder ••••••••••••••••••••.•••••• 69
3.14 Sp ecimen Se tup for Fa tigue Te sting •.••..•.••••.••....•........ 70
3.15 Specimen Orientation for Diametral Fatigue •••••••••••••••••••• 70
3.16 Failed Specimen with Broken Foil Tape that Stops the Test &chine. . . . . . . . . . . • . • . • • • . . . . . . . • . •• • . •• • . . . . • . • . . • . . . • . .. . . . . 71
3.17 Specimen Aging Method (Placed in Outdoor Environment) ••••••••• 71
4.1 Voids vs. Asphalt Content for Gap-Graded Mix Fine Rubber •••• 76
4.2 Voids vs. Asphalt Content for Gap-Graded Mix Mediun Rubber •• 76
4.3 Voids vs. Asphalt Content for Gap-Graded Mix - Coarse Rubber •• 77
4.4 Voids vs. As phalt Content for Dense-Graded Mix •....•....•.•.•. 77
4.5 Effect of Rubber Gradations and Content on Design Asphalt Content. . . •• .•. •.• ••. .•.• •.• ..•. .•. . . ... •••. . . •• . . .. . . .•. ...•. 81
4.6 Comparison of Design Asphalt Content Conventional vs. 3%
4.7
4.8
4.9
4.10
4.11
4.12
4.13
Rubber. ••••••••••••••••••••••••••••••••••••••••••••••••••••••. 81
Effect of Rubber Contents on Resilient Modulus at 22 ± 2°C •••• 82
Comparison of Resilient Modulus - Conventional vs. Rubber Asphalt at 22 ± ZoC ••••••••••••••••••••••••••••••••••••••••••• 82
Ef fect of Aggregate Gradation on Design Asphalt Content ••••••• 83
Effect of Aggregate Gradation on Resilient Modulus at ZO±2°C •••••••••••••••••••••••••••••••••••••••••••••••••••••• 83
Effect of Aggregate Gradation, Cure Time, and Surcharge on Resilient Modulus at +lO°C (3% Rubber 80/20 Blend) •••.••••••.•
Effect of Aggregate Gradation, Cure Time, and Surcharge on Fatigue Life at +10° C (3% Rubber 80/20 Blend) •.••..•.••••••••.
Effect of Rubber Gradations on Resilient Modulus at +10°C
87
87
(Gap-Graded Aggregate)........................................ 88
x
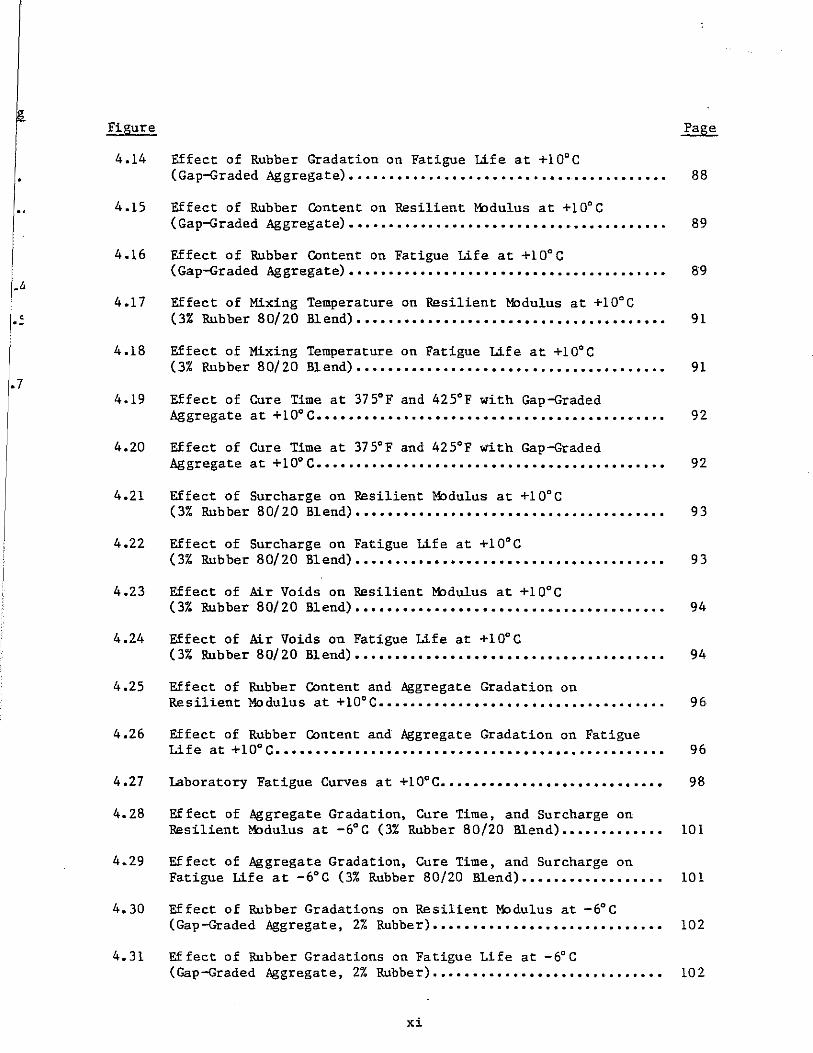
.6
. .:
.7
Figure
4.14 Effect of Rubber Gradation on Fatigue Life at +10cC (Gap-Graded Aggregate).. .............................................................................. 88
4.15 Effect of Rubber Content on Resilient Modulus at +lOcC (Gap-Graded Aggregate)........................................ 89
4.16 Effect of Rubber Content on Fatigue Life at +10c C (Gap-Graded Aggregate)................................................................................ 89
4.17 Effect of Mixing Temperature on Resilient Modulus at +10cC (3% Rubber 80/20 Blend).............................................................................. 91
4.18 Effect of Mixing Temperature on Fatigue Life at +10cC (3% Rubber 80/20 Blend)....................................... 91
4.19 Effect of Cure Time at 375cF and 425cF with Gap-Graded Aggregate at +100 C ..................................................................................... .. 92
4.20 Effect of Cure Time at 375cF and 425cF with Gap-Graded Aggregate at +lO°C.... .•••.•.•...•.•.•.••••.•.•••..•.•••.....• 92
4.21 Effect of Surcharge on Resilient Modulus at +10cC (3% Rubber 80/20 Blend) ............................................................................ .. 93
4.22 Effect of Surcharge on Fatigue Life at +10cC (3% Rubber 80/20 Blend) ••.•••.•.•••••••••••.•..••••.••..•....• 93
4.23 Effect of Air Voids on Resilient Modulus at +10cC (3% Rubber 80/20 Blend)....................................... 94
4.24 Effect of Air Voids on Fatigue Life at +10cC (3% Rubber 80/20 Blend) ................................................. . 94
4.25 Effect of Rubber Content and Aggregate Gradation on Resilient Modulus at +10°C............................................ 96
4.26 Effect of Rubber Content and Aggregate Gradation on Fatigue Life at +10° C................................................................ 96
4.27 Laboratory Fatigue Curves at +10°C............................ 98
4.28 Effect of Aggregate Gradation, Cure Time, and Surcharge on Resilient Modulus at _6c C (3% Rubber 80/20 Blend)............. 10 1
4.29 Effect of Aggregate Gradation, Cure Time, and Surcharge on Fatigue Life at _6c C (3% Rubber 80/20 Blend).................. 101
4.30 Effect of Rubber Gradations on Resilient Modulus at -6c C (Gap-Graded Aggregate, 2% Rubber)............................. 102
4.31 Effect of Rubber Gradations on Fatigue Life at -6c C (Gap-Graded Aggregate, 2% Rubber). .......................... ...•. 102
xi
1.0 INTRODUCTION
1.1 Problem Statement
The Alaska Department of Transportation and Public Facilities is pres
ently evaluating the use of rubber-modified asphalt pavements in field trials
(1,2,3). The potential advantages of using these mixtures include improved
ice control and increased pavement life. Greatly needed is an evaluation of
mix ingredients (rubber, asphalt, and aggregate) which will result in the dis
covery of optimum mix properties and greatest life for the least cost.
Rubber-modified asphalt paving mix is prepared by a process that typical
ly uses 3% by weight of granulated coarse and fine rubber particles to replace
some of the aggregate in the mixture. This concept was originated in the late
1960's by the Swedish companies Skega AB and AS Vaegfoerbaettringar (ABV) (4)
and was patented under the trade name "Rubit". This product has been patented
in the United States under the trade name Plusride*, and is marketed by All
Seasons Surfacing Corporation of Bellevue, Washington (5).
The introduction of granulated recycled rubber into asphalt paving mixes
has been attempted by various investigators in the past with varying success
(5,6,7,8,9). Charles H. McDonald, conSidered to be the father of the asphalt
granulated rubber system developed in the United States, initiated work in
1963 which was based on concepts developed as early as the 1930's in the
United States (9). These early experiments included the introduction of
various forms of rubber (including raw unvulcanized rubber, rubber latex, and
ground whole tire rubber from synthetic and/or natural tires) and various
types and percentages of rubber to produce a "rubberized" asphalt for use in
surface seal coating of deteriorated pavements (9). Because of its lower cost
and promising performance in field experiments, the use of ground waste tire
rubber was selected for extensive study in Arizona (8).
Since the work by McDonald, engineers and researchers have been adding
rubber, or rubber-like, materials in one form or another to asphalt. The
results have not always been successful, but the benefits of flexibility and
durability have long been recognized (9). The durability and fatigue resist
ance of the rubber asphalt mixture is achieved, in part, by the physical
*Plusride is a trademark for a rubber-modified asphalt mix.
swelling action of rubber at elevated temperature and the rubber's reaction
with the asphalt. There also appears to be a partial molecular bond between
the two hydrocarbons which yields an increased fatigue resistance in the
pavement structure (5).
In addition to the above advantages, use of waste rubber in asphalt
mixtures provides many other advantages including:
1) Environmental: Discarded tires provide the source for the
rubber granules used in rubber asphalt. It is estimated that
the annual amount of rubber available from discarded tires is
1.9 million tons, an amount sufficient to modify the pavements
on 40,000 miles of two-lane highway (10). The use of these
discarded tires helps to solve the environmental problem of
disposing of them in other ways.
2) De-icing: Rubber asphalt pavements have been reported to keep
themselves de-iced. The patent holder claims de-icing occurs
by compression of protruding rubber granules which sufficient
ly deform the pavement under the weight of traffic. This
causes fracture of the ice layer formation. Following this,
wind created by passing vehicles clears the ice from the
roadway (10).
3) Noise Reduction: Reductions of up to 10 dB (A) in noise level
in comparison with noise levels of conventional pavement
surfaces have been reported (5).
4) Skid Resistance: The surface texture and protruding rubber
granules are reported to give the pavement improved skid
resistance during dry, wet, and icy conditions. Measurements
have shown a reduction in stopping distance averaging 25%
under icy road conditions (2).
5) Hydroplaning and Water Spray: The high content of coarse
aggregate in this product results in a coarse surface texture
with good surface drainage, which reportedly eliminates hydro
planing and reduces water spray (10).
6) Sanding and Salting: With improved skid resistance and de
icing characteristics, the need for sanding and salting would
be greatly reduced. This would result in a reduction of
maintenance costs and corrosive damage to vehicles.
2
A major disadvantage of rubber-modified asphalt over conventional asphalt
is increase in cost. However, if it can be shown that the increased cost is
offset by improved performance, the greater expense will be justified.
1.2 Project Objectives
The purpose of this study is to optimize mix ingredients for rubber
modified asphalt pavement in terms of critical mix properties. Specifically,
the objectives are to:
1) develop mix design recommendations for rubber-modified asphalt
mixes for use in Alaska, and
2) formulate guidelines indicating how these mixes can best be
utilized in the Alaska State roadway system.
3) Analyze the economic alternatives of various rubber-modified
mixes as compared to conventional mixes.
To accomplish these tasks, a laboratory study was set up to evaluate the
effects of:
1) amount and gradation of rubber on mix properties and pavement
life,
2) aggregate gradation on mix properties and pavement life,
3) void content on mix properties and pavement life, and
4) mixing temperature, cure time, and surcharge on mix properties
and pavement life.
The results of the laboratory study will be used to develop guidelines for
selecting mix properties and for determining how rubber-modified asphalt mixes
can best be utilized in a state roadway system.
1.3 Scope of Report
The approach used in the conduct of this study is shown in Figure 1.1. A
general literature review of the effect of rubber particle shape, type, and
gradation upon the properties of the asphalt rubber mix is presented in Chap
ter 2. The criteria for designing .rubber-modified pavements using the Mar
shall and Hveem procedure are also described. In addition, an evaluation of
mix properties (modulus and fatigue) on submitted cores tested by Alaska DOT
and All Seasons Surfacing Corporation are included. Finally, a summary of the
answers to a questionnaire submitted to various agencies that have used
rubber-modified asphalt is presented.
3

'"
Literature Review
Brainstonning Meetings
Development of Experiment
Design
Mix Design
Determine the modulus, and fatigue life of
each combi nation
Test for Mix
Properties •
Eval uatior of
Results
Determine the optimum asphalt content
Fig. 1.1. Study Approach
Final Report

Chapter 3 presents the laboratory experiment design for the study. In
particular, it describes the mix variables studied, the materials used, speci
men preparation techniques, and the types ·of tests and test procedures.
Twenty different mix combinations of rubber asphalt mixtures are evalu
ated for mix design, resilient modulus, and fatigue life. These results are
presented in Chapter 4. Also, in Chapter 4, is analysis of data to evaluate
the effect of each variable on mix properties.
Chapter 5 presents layered elastic analysis of data to evaluate the
effect on pavement life, and an economic analysis of rubber asphalt versus
conventional mixtures. Chapter 5 also includes guidelines indicating how
rubber modified mixes may best be utilized.
Chapter 6 presents conclusions, along with recommendations for future use
of rubber-modified asphalt mixes in the state of Alaska and recommendations
for additional research.
5
2.0 LITERATURE REVIEW
Discarded tires are the source of the rubber granules used in rubber
modified asphalt mixes. It is estimated that the amount of rubber available
annually from discarded tires is 1.9 million tons. While a limited number of
these 1.9 million tons of tires are used for resource and energy recovery, the
vast majority go to landfills or are disposed of in an environmentally un
acceptable manner (12). Table 2.1 shows the use of discarded tires in the
United States.
This chapter presents the results of a search of the literature related
to the following aspects of rubber-modified asphalt:
1) examination of the effects of rubber particle shape, type, and
gradation upon the properties of rubber-modified mixes,
2) evaluation of current mix design procedures and guidelines for
rubber-modified mixes,
3) evaluation of the effects of varying the rubber content,
rubber source, rubber and aggregate gradations, and mixing
temperature on mix properties (resilient modulus and fatigue
life), and
4) evaluation of the performance of selected field projects
placed in the United States.
2.1 Use of Rubber in Asphalt Mixtures
Recommendations for use of rubber to improve asphalt pavements date back
for more than a century (9). This section briefly reviews the history of the
rubber industry, important properties of rubber, asphalt-rubber interaction
theories, and existing patents which deal with various aspects of utilizing
rubber in asphalts for road construction and maintenance.
2.1.1 History of the Rubber Industry
Rubber was one of the first substances to impress the early European
explorers of the New World. They had never encountered anything like the
resilient balls that were used by the natives of Central and South America for
playing games. The balls were made from a dried milky liquid which could be
obtained by cutting the bark of certain trees. Samples of this curious gum
6

Table 2.1. Uses of Discarded Tires in the United States (12).
Discarded Tires
. 200.000.000 Passenger
40,000.000 Trucks
I I I I I I Used Ti res Rubber Tire Retreaded Other Uses legal and Less Than Reclaimers Spl i tters Tires Rl!efs 11 1 eCJiI 1 5 Percent 6.ZS Percent 8.7S Percent 1B.7 Percent Breakwaters Di<;posa]
15,000,000 Tires 21.000.000 Tires 45,000.000 Tires Planters 63.1 Per-ceont Swings 147,01]0,000
Erosion Control Ti rp'S
Etc.
TREAD OR CAP
INNER LINER
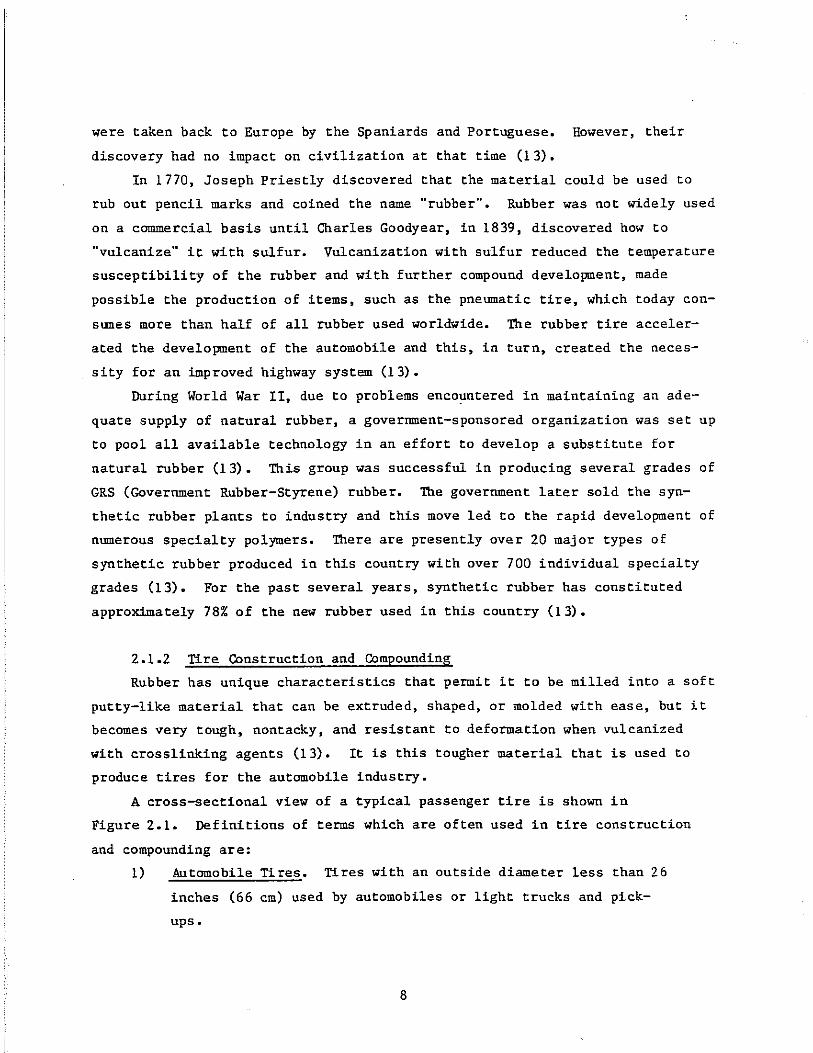
Figure 2.1. Cross Section of a Passenger Tire (13)
7
were taken back to Europe by the Spaniards and Portuguese. However, their
discovery had no impact on civilization at that time (13).
In 1770, Joseph Priestly discovered that the material could be used to
rub out pencil marks and coined the name "rubber". Rubber was not widely used
on a commercial basis until Charles Goodyear, in 1839, discovered how to
"vulcanize" it with sulfur. Vulcanization with sulfur reduced the temperature
susceptibility of the rubber and with further compound development, made
possible the production of items, such as the pneumatic tire, which today con
sumes more than half of all rubber used worldwide. The rubber tire acceler
ated the development of the automobile and this, in turn, created the neces
sity for an improved highway system (13).
During World War II, due to problems encountered in maintaining an ade
quate supply of natural rubber, a government-sponsored organization was set up
to pool all available technology in an effort to develop a substitute for
natural rubber (13). This group was successful in producing several grades of
GRS (Government Rubber-Styrene) rubber. The government later sold the syn
thetic rubber plants to industry and this move led to the rapid development of
numerous specialty polymers. There are presently over 20 major types of
synthetic rubber produced in this country with over 700 individual specialty
grades (13). For the past several years, synthetic rubber has constituted
approximately 78% of the new rubber used in this country (13).
2.1.2 Tire Construction and Compounding
Rubber has unique characteristics that permit it to be milled into a soft
putty-like material that can be extruded, shaped, or molded with ease, but it
becomes very tough, nontacky, and resistant to deformation when vulcanized
with crosslinking agents (13). It is this tougher material that is used to
produce tires for the automobile industry.
A cross-sectional view of a typical passenger tire is shown in
Figure 2.1. Definitions of terms which are often used in tire construction
and compounding are:
1) Automobile Tires. Tires with an outside diameter less than 26
inches (66 cm) used by automobiles or light trucks and pick-
ups.
8
2) Truck Tires. Tires with an outside diameter greater than 26
inches (66 cm) and less than 60 inches (152 cm) used by com
mercial trucks and buses.
3) Whole Tire Rubber. Rubber that includes tread and sidewalls
in proportions that approximate the respective weights in an
average tire. This is approximately 1/5 tread and 4/5 side
wall by total weight.
4) Tread. The tread section of a passenger tire is normally
compounded using styrene butadiene rubber (SBR) with some
polybutadiene rubber added for improved wear. Tread has
approximately 33% of a very fine, high structure carbon black
to give the best possible abrasion resistance.
5) Sidewall Rubber. Tire rubber that is usually composed of
synthetic rubbers.
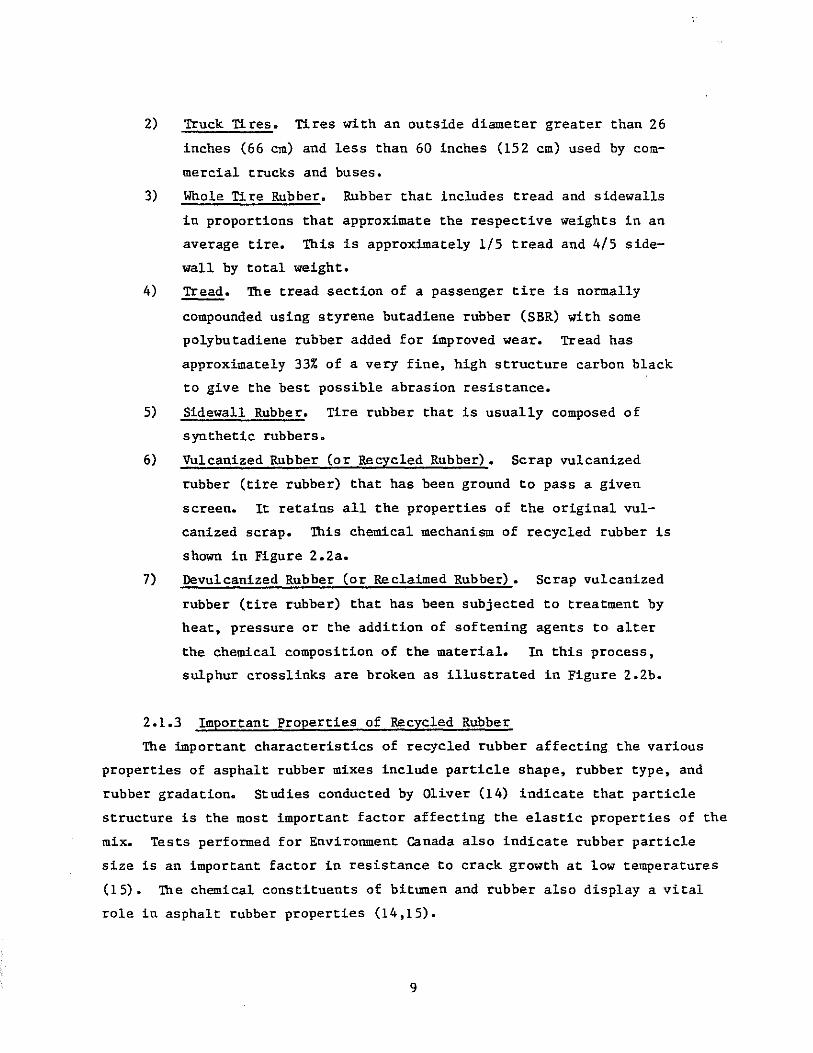
6) Vulcanized Rubber (or Recycled Rubber). Scrap vulcanized
rubber (tire rubber) that has been ground to pass a given
screen. It retains all the properties of the original vul
canized scrap. This chemical mechanism of recycled rubber is
shown in Figure 2.2a.
7) Devulcanized Rubber (or Reclaimed Rubber). Scrap vulcanized
rubber (tire rubber) that has been subjected to treatment by
heat, pressure or the addition of softening agents to alter
the chemical composition of the material. In this process,
sulphur crosslinks are broken as illustrated in Figure 2.2b.
2.1.3 Important Properties of Recycled Rubber
The important characteristics of recycled rubber affecting the various
properties of asphalt rubber mixes include particle shape, rubber type, and
rubber gradation. Studies conducted by Oliver (14) indicate that particle
structure is the most important factor affecting the elastic properties of the
mix. Tests performed for Environment Canada also indicate rubber particle
size is an important factor in resistance to crack growth at low temperatures
(15). The chemical constituents of bitumen and rubber also display a vital
role in asphalt rubber properties (14,15).
9
..... a
.-----------------------------------------------------------
BRIDGE TYPE CROSSLINK
(SULPHUR OR BIVALENT ELEMENTS)
/ •
B
C-C CROSSLINK
a) Vulcanized Rubber
•
~ .-. CHEMICAL 4 MECHANICAL CHAIN SCISSION
b) Devulcanized Rubber
Figllre 2.2. Chemical Mechanism of Vulcanization and Devu1canization (13).
~,~--: a) Buffinga - hair-like or stranded materials,
elastic recovery 21%
b) Ambient1y Ground-rubber with torn edges, elastic recovery 35% .
~ ~ 0J&~
c) Cryogenically Ground-rubber with sharp angular edges, elastic recovery 6%
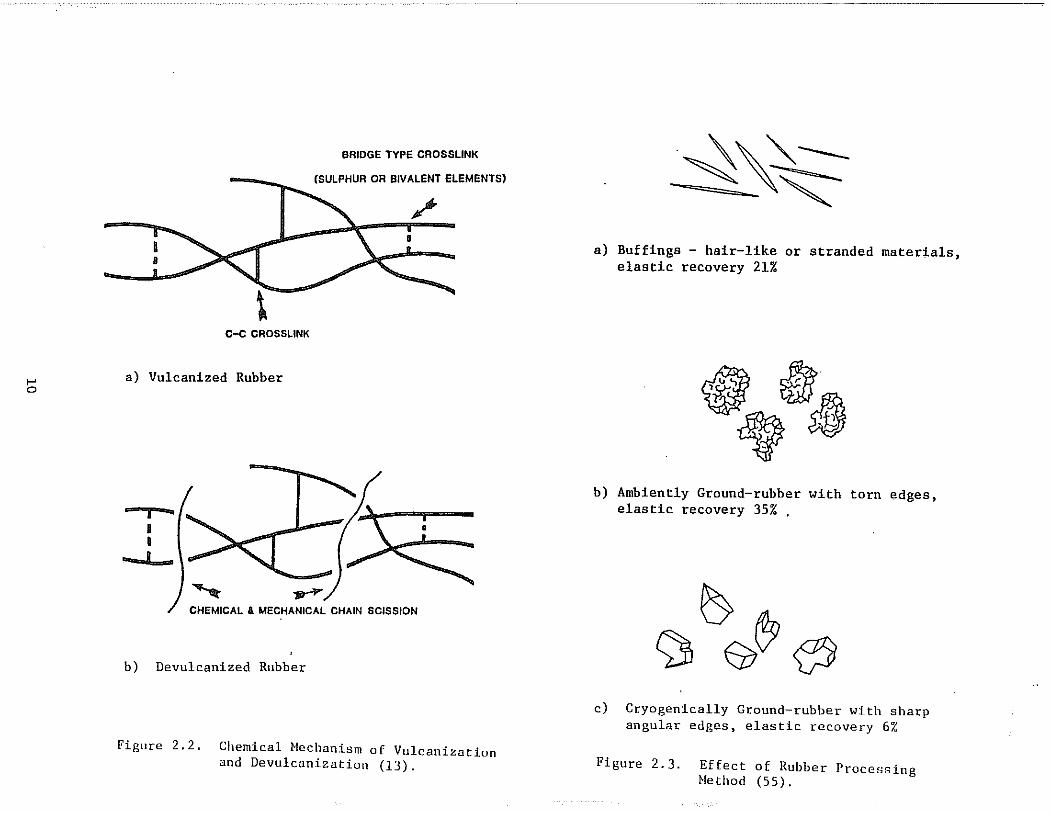
Figure 2.3. Effect of Rubber Processing Method (55).
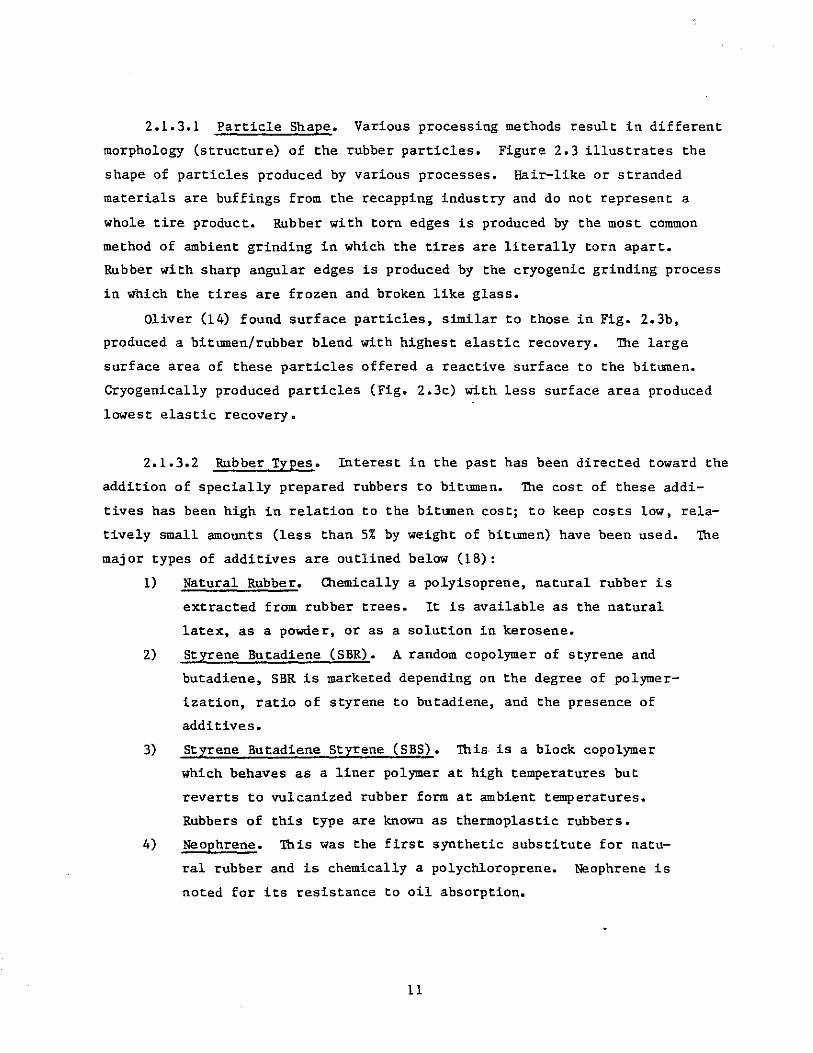
2.1.3.1 Particle Shape. Various processing methods result in different
morphology (structure) of the rubber particles. Figure 2.3 illustrates the
shape of particles produced by various processes. Hair-like or stranded
materials are buffings from the recapping industry and do not represent a
whole tire product. Rubber with torn edges is produced by the most common
method of ambient grinding in which the tires are literally torn apart.
Rubber with sharp angular edges is produced by the cryogenic grinding process
in which the tires are frozen and broken like glass.
Oliver (14) found surface particles, Similar to those in Fig. 2.3b,
produced a bitumen/rubber blend with highest elastic recovery. The large
surface area of these particles offered a reactive surface to the bitumen.
Cryogenically produced particles (Fig. 2.3c) with less surface area produced
lowest elastic recovery.
2.1.3.2 Rubber Types. Interest in the past has been directed toward the
addition of specially prepared rubbers to bitumen. The cost of these addi
tives has been high in relation to the bitumen cost; to keep costs low, rela
tively small amounts (less than 5% by weight of bitumen) have been used. The
major types of additives are outlined below (18):
1) Natural Rubber. Chemically a polyisoprene, natural rubber is
extracted from rubber trees. It is available as the natural
latex, as a powder, or as a solution in kerosene.
2) Styrene Butadiene (SBR). A random copolymer of styrene and
butadiene, SBR is marketed depending on the degree of polymer
ization, ratio of styrene to butadiene, and the presence of
additives.
3) Styrene Butadiene Styrene (SB5). This is a block copolymer
which behaves as a liner polymer at high temperatures but
reverts to vulcanized rubber form at ambient temperatures.
Rubbers of this type are known as thermoplastic rubbers.
4) Neophrene. This was the first synthetic substitute for natu
ral rubber and is chemically a polychloroprene. Neophrene is
noted for its resistance to oil absorption.
11
In recent times, attention has centered on the use of recycled rubber in
asphalt rubber mixes. The main sources of this rubber are used motor vehicle
tires and rubber buffings from tire retreaders. However, it should be noted
that the treads of truck tires normally have a high natural rubber content,
while passenger and light truck tire treads are usually composed of synthetic
rubber. The sidewalls of most vehicle tires are composed of synthetic rubbers
(Table 2.2).
2.1.3.3 Rubber Gradation. The improvement of pavement properties via
the effect of rubber gradation depends on the pavement application. Plus ride
recommends the coarse and fine rubber gradation shown in Table 2.3. The fine
rubber particles (- #10 sieve) are added in addition to coarse particles
because they tend to swell and disperse within the binder, reportedly pro
ducing a mix with increased viscosity. This thickening results in good sta
bility at low surface temperatures. Oliver (14) found the elastic recovery of
the rubber/bitumen blend improved as rubber particle size decreased. He
suggested that the improvement could be due to a difference in particle shape;
the larger particles had smooth faces, while the smaller particles were rough
er and more porous.
Coarse rubber particles act as an elastic aggregate in the mix. Studies
done in Canada suggest that larger rubber particles are more effective than
small particles for increasing crack resistance and toughness (15). Also, the
repeated flexing of protruding large rubber particles due to traffic loading,
has been suggested as causing breakdown of surface ice deposits (16).
Rubber gradation also affects the optimum asphalt content of the mix. A
fine rubber gradation (100% passing #10 sieve) requires less asphalt because
the rubber disperses better throughout the mix (17).
12
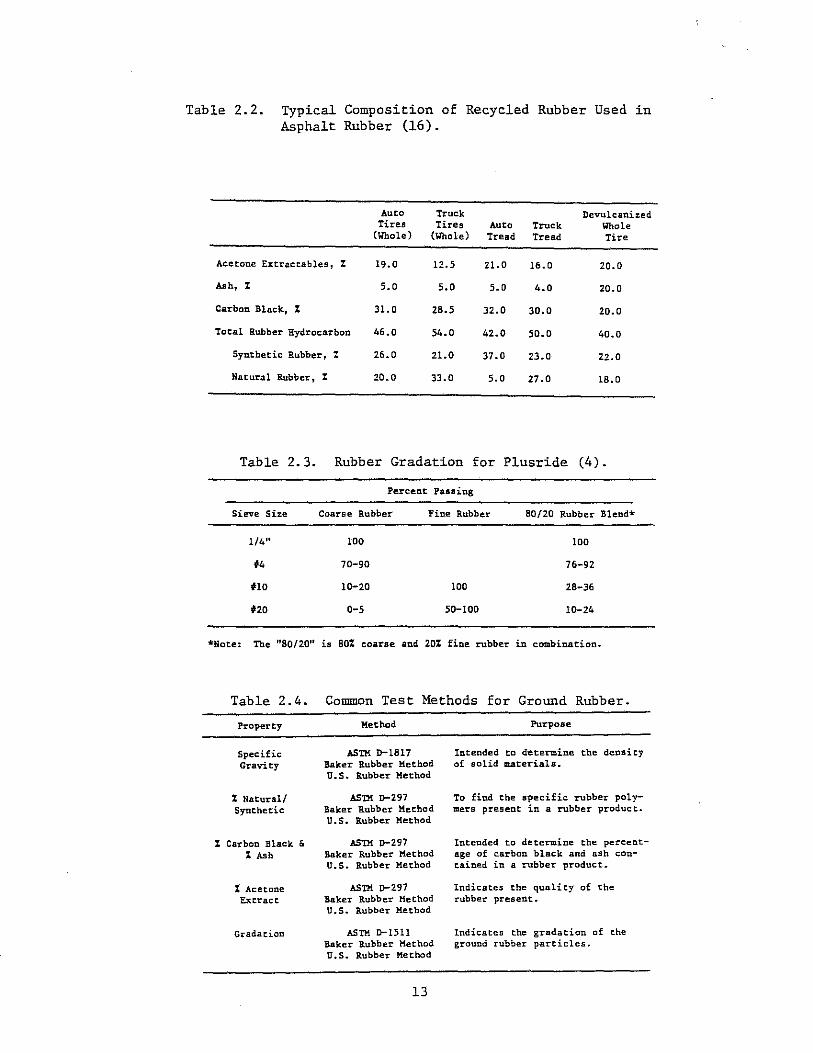
Table 2.2. Typical Composition of Recycled Rubber Used in Asphalt Rubber (16).
Auto Truck Devulcanized Tires Tires Auto Truck \Jhole
(Whole) (Whole) Tread Tread Tire
Acetone Extract.ables, % 19.0 12.5 21.0 16.0 20.0
Ash, % 5.0 5.0 5.0 4.0 20.0
Carbon Black, % 31.0 28.5 32.0 30.0 20.0
Total Rubber Hydrocarbon 46.0 54.0 42.0 50.0 40.0
Synthetic Rubber, % 26.0 21.0 37.0 23.0 22.0
Natural Rubber, % 20.0 33.0 5.0 27.0 18.0
Table 2.3. Rubber Gradation for Plus ride (4) •
Percent Paning
Sieve Size Coarse Rubher Fine Rubber 80/20 Rubber Blend*
1/4" 100 100
#4 70-90 16-92
#10 10-20 100 28-36
#20 0-5 50-100 10-24
*Note: The "80/20" is 80% coarse and 20% fine rubber in combination.
Table 2.4.
Propert.y
Specific Gravity
% Natural/ Synthetic
% Carbon Black • % Ash
% Acetone Extract
Gradation
Common Test Methods for Ground Rubber.
Method
ASTH D-1817 Baker Rubber Method U.S. Rubber Method
AS'Jli D-297 Baker Rubber Hethod U.S. Rubber Method
AS'IH 1>-297 Baker Rubber Method U.S. Rubber Method
ASTM 0-297 Baker Rubber Method U.S. Rubber Method
ASTH 0-1511 Baker Rubber Method U.S. Rubber Method
13
Purpose
Intended to determine the density of solid materials.
To find the specific rubber polymers present in a rubber product.
Intended to determine the percentage of carbon black and ash contained in a rubber product.
Indicates the quality of the rubber present.
Indicates the gradation of the ground rubber particles.
2.1.4 Survey of Rubber Suppliers
In October 1983, a survey of the following recycled rubber suppliers was
conducted:
1)
3)
Baker Rubber P.O. Box 2438 South Bend, IN 46680
Atlos Rubber 1522 Fishburn Ave. Los Angeles, CA 90063
5) Rubber Granulators, Inc. 12701 Mukiltee Speedway Everett, WA
2)
4)
Genstar Conservation Division 3733 West Willis Road Chandler, AZ 85224
u.S. Rubber and Reclaiming Co., Inc. P.O. Box 54 Vicksburg, MS 39180
The purpose of the survey was to collect information on the type and portion
of tire used, the method of processing, and test methods used to evaluate the
rubber.
The results of the survey indicated that all of the suppliers processed
the tires at ambient temperature. The majority ground the whole tire using
fabric-type automobile or light truck tires, producing a heterogeneous mixture
of synthetic rubbers.
Common tests run by the suppliers are summarized in Table 2.4. It should
be noted that Baker Rubber and U.S. Rubber have developed many of their own
test methods.
2.1.5 Asphalt-Rubber Interaction
This section briefly examines the effect of rubber type on the asphalt
rubber blend. Most research conducted in this area has been oriented toward
the use of rubber additives rather than recycled rubbers. Since recycled
rubber is generally composed of a mixture of natural, SBR, and SBS rubbers,
this information should provide insight on recycled rubber-asphalt inter
actions.
2.1.5.1 Theories. In a rubber/bitumen system, the rubber can be dis
persed as an integral part of the binder (true solution), as microscopic par
ticles, or as visible discrete particles. The degree of dispersion depends on
the time and temperature of heating, the composition of the rubber and the
asphalt, and the degree of mixing (18). It is not clear at this time what
degree of dispersion is needed to produce optimum mix properties.
14
Rostler (19) provided an explanation of the rubber-bitumen interaction as
follows. Bitumen is composed of a bodying agent (asphaltenes) dissolved in a
solvent (the chemically active portion of the maltenes), and a gelling agent
(paraffins). Rubber in true solution with asphalt is incorporated as part of
the solvent or the asphaltene portion. Rubber soluble in n-pentane will
become part of the solvent, while rubber insoluble in n-pentane will modify
the asphaltene fraction. Natural and SBR rubbers, soluble in n-pentane, will
primarily act to increase the viscosity of the maltene fraction. Insoluble in
n-pentane, SBS rubbers increase the viscosity of the asphaltene portion. As
with any solution, surplus will be precipitated out when supersaturated.
Work done by Huff (20) suggests that asphalts having less than 30% second
acidaffins (part of the solvent portion) do not produce the adhesive proper
ties required with rubber. Those asphalts that contain more than 40% second
acidaffins become soft at summer pavement temperatures.
2.1.5.2 Results of Lab Studies. Van Seem and Brasser (21) investigated
the properties of an SBS block copolymer and bitumen blends. They discovered
the degree of dispersion of rubber in the mix depended on the bitumen type and
particularly the aromaticity of the bitumen. In low aromaticity bitumens, the
dispersion of the rubber was visible to the naked eye and only marginally
affected the bitumen properties. Blends with an intermediate aromaticity were
found to exhibit much improved flow and deformation characteristics, with the
rubber present as microscopically fine filaments. Very high aromaticity
blends did not show improved bitumen properties; the rubber was visible as a
"single phase" system under a microscope.
Studies conducted by Patrick indicate the addition of Samrubbam, another
thermoplastic rubber, decreases the penetration of the blend at low tempera
tures (18). The addition of natural rubber produced no significant effect on
penetration at low temperatures (18).
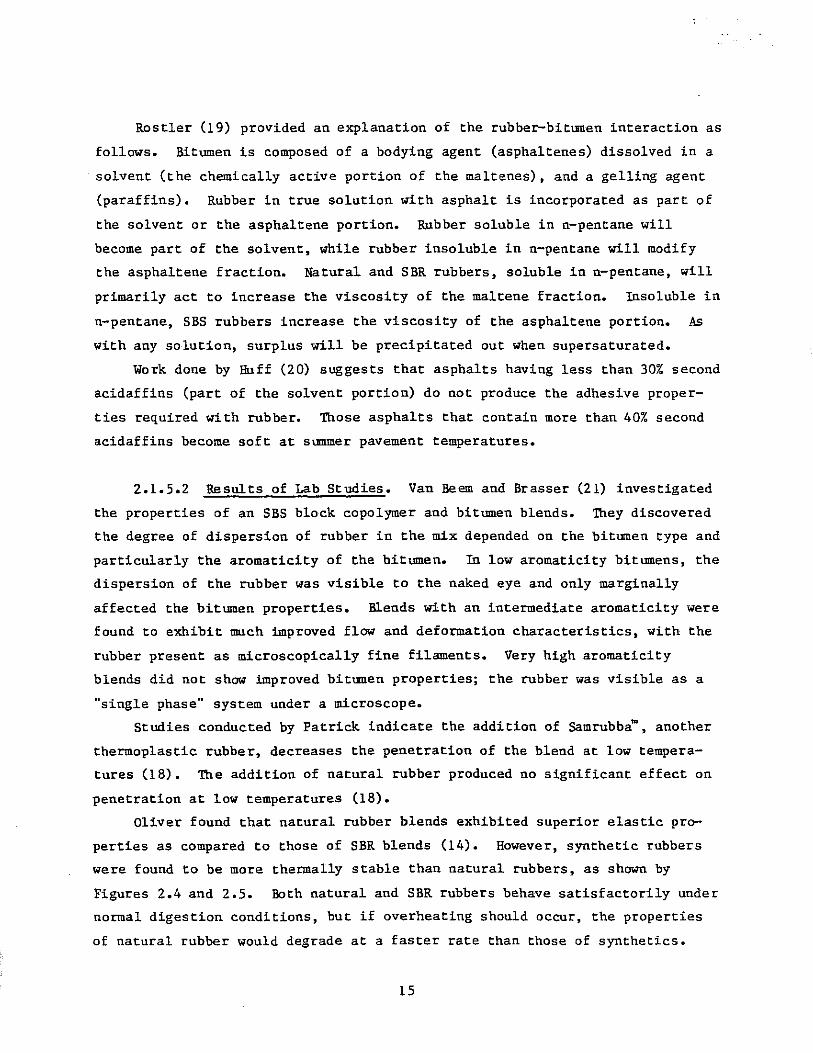
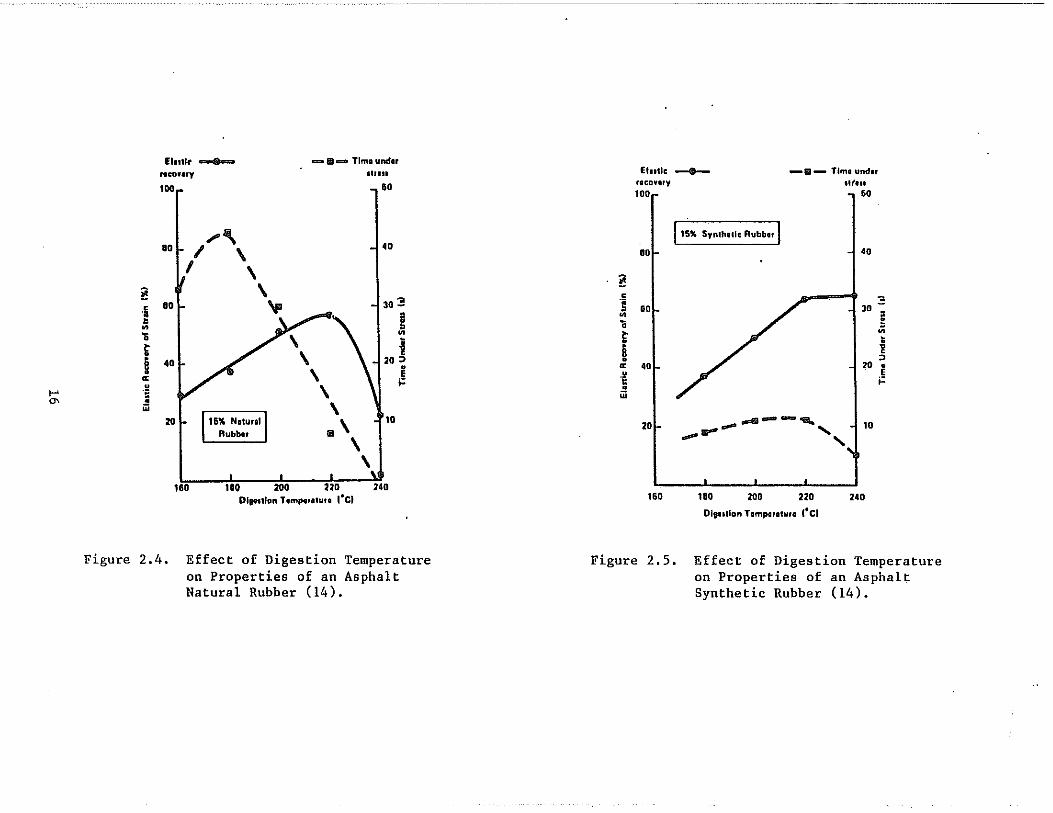
Oliver found that natural rubber blends exhibited superior elastic pro
perties as compared to those of SBR blends (14). However, synthetic rubbers
were found to be more thermally stable than natural rubbers, as shown by
Figures 2.4 and 2.5. Both natural and SBR rubbers behave satisfactorily under
normal digestion conditions, but if overheating should occur, the properties
of natural rubber would degrade at a faster rate than those of synthetics.
15
.... '"
EII.llt _ _ 11- Tlma under rtCOflry 111111
'OO~
r 80 I- I .... ,
40 , f ,
i! ,
80 'f1 30 ~ c •• e • '" • 1; , '" ti i fi 40
, 20 :>
\ • a: .§
•• , l-
• .! \ w
1,6% N, ... " I lD iii' r , \
160 110 200 220 240 DI ... llon Tomptrllutl I·C,
Figure 2.4. Effect of Digestion Temperature on Properties of an Asphalt Natural Rubber (14).
(Iullc --e- -1iI- Tlml undu IICOVIfY Iltln 100 ... ~6O
J 115% Synlhilic Rubbo,
-l '0
i! c ; ...
60 30 -;
'" 1; ~
to '" t • ~ § :> a: '0 lD • •• E t ;: • w
20r ""..----, ~ 10 -- " '60 180 lDO 220 2.0
OIIl.lIon TlmparllUfl C·CI
Figure 2.5. Effect of Digestion Temperature on Properties of an Asphalt Synthetic Rubber (14).
2.1.6 Patents
Many patents currently exist which deal with various aspects of utilizing
recycled rubber in asphalts for road construction and maintenance. A summary
of patents are presented in this section.
2.1.6.1 Patent Types. Two major types of patents were reviewed in this
study. U.S. Patent Numbers 3,844,668, 3,919,148, 4,068,023, 4,069,182, and
3,891,585 deal with the use of asphalt rubber for chip seals, stress absorbing
membranes, waterproofing membranes, and crack fillers. U.S. Patent Numbers
4,166,049 and 4,086,291 describe processes in which the asphalt rubber is used
as a binder in asphaltic mixtures.
2.1.6.2 Asphalt Concrete Patents. The process described in U.S. Patent
Number 4,166,049, which is held by U.S. Rubber Reclaiming Company, provides a
rubberized asphalt using devulcanized reclaimed and scrap crumb rubber pro
duced from whole tires. The asphalt composition is quite specific, as shown
in Table 2.5. Asphalt and rubber (75% to 95% and 5% to 25% by weight, respec
tively) are cooked at about 177°C to 232°C (350°F to 450°F) for 30 minutes to
2 hours, producing a blend with a viscosity of 800 centipoises at 204°C
(400°F). This material is then incorporated as a binder in an asphaltic
concrete using conventional equipment. The mix produced is claimed to have
improved strength and flexibility, and stripping, cracking, rutting, bleeding,
and skid resistance (20).
The primary objective of U.S. Patent Number 4,086,291, held by All
Seasons Surfacing Corporation, is stated "to render possible the production of
a paving mass which can contain a substantially greater amount of well-bound
macadam than heretofore possible" (22). The patent holder claims the in
creased amount of macadam improves the "wear resistance" of the pavement,
while the addition of rubber in the asphalt provides increased flexibility,
and skid, and stripping resistance (22). In general, the process involves the
following steps:
1) Heating the aggregates to a temperature of 160° C to 170° C
(320°F to 338°F).
17

Table 2.5. Asphalt and Rubber Composition Claimed for u.s. Patent No. 4,166,049 (20).
a) Asphalt Composition
Percent by Weight Component
20-30 Asphaltenes
5-15 Nitrogen Bases
10-20 First Acidaffins
30-40 Second Acidaffins
10-20 Paraffins
b) TyPical Rubber Composition
Rubber Compounding Materials 15-20% by weight
Carbon Black 10-35% by weight
Ash 10-20% by weight
Rubber Hydrocarbon 35-45% by weight
18
2) Adding vulcanized rubber particles (1 to 8 mm measured in the
greatest dimension) to the heated rock, and mixing together
for a time sufficient to cause the rubber to adhere to the
rock.
3) Adding fine (less than 1 mm measured in the greatest dimen
sion) vulcanized rubber particles to the above mixture.
4) Mixing the above mass with a filling material and an asphalt.
The amount of materials being as follows:
1) Aggregates - at least 65% by weight (defined as particles
larger than 8 mm).
2) Coarse rubber (1 to 8 mm in the greatest dimension) - 1.35% by
weight.
3) Fine rubber (less than 1 mm in the greatest dimension) - 1.65%
by weight.
4) As phalt - 8.5% by weight.
5) Filling material (which may include lime) - 6% to 10% by
weight.
2.2 Mix Design Considerations
Mix designs for rubber-modified asphalt mixtures are normally made using
the Marshall or Hveem method; however, the criteria (at least for Plusride)
for selecting the asphalt content are different for conventional hot mix
asphaltic concrete and rubber-modified asphalt. Most engineers use stability,
flow, cohesion, air voids, and density as criteria for designing conventional
hot mix asphaltic concrete pavements. However, stability values for rubber
asphalt mixes which are currently on the market are lower than values obtained
for typical asphalt mix. The flow values for rubber-modified mixes are gen
erally greater than the maximum allowable in asphalt mix design criteria
(23). Consequently, stability and flow values for rubber-modified mixes may
give guidance only in terms of their relative position on design curves.
Prior experience has shown that the critical factor for successful rubber
modified asphalt installations has been a low percentage of voids of the total
mix (23). For example, pavements placed in Alaska which have low void con
tents (approximately 4.6%) and satisfactory performance had stabilities as low
as 350 pounds and flows up to 0.19 inch (23). In general, the laboratory air
19

voids are recommended to range from 0% to 4% maximum depending on the traffic
level of the facility being designed (23):
1) Low traffic - 0% to 2%.
2) Medium traffic - 3% max.
3) High traffic - 4% max.
This required void content is achieved by increasing both the mineral filler
and the asphalt cement content until the target value is reached (23).
2.2.1 Guidelines for Mix Design - Marshall Method
Results of mix designs with the Marshall method have indicated that the
added rubber greatly changes the mix properties, and the optimum asphalt
content is generally increased by 1.5% to 2% compared with conventional mix
tures. The aggregates, heated to a temperature between 163D C (325D F) and
177D C (350D F), should be placed in the mixing bowl and then the rubber gran
ules are added and thoroughly mixed before adding the liquid asphalt. The
compaction mold, as well as the hammer and bottom plate, should be lightly
greased to break any bond between the mold and mixture. Filter papers stick
to the specimens and should not be used unless some method is available for
removal (e.g., a knife and/or temperature flame). Alternatives to filter
paper are release paper or a greased composition paper.
The compaction mold assembly and the compaction hammer should be pre
heated to 141D C to 149D C (285D F to 300D F). The compaction temperature shall
be over 116D C (240DF). At lower compaction temperatures, the mixture may get
stiff and proper compaction is not possible. After compaction and during
cooling, wood plugs should be used to provide a surcharge of at least 5 pounds
during cooling. This helps prevent the specimen from expanding or decompact
ing. The standard 50-blow Marshall procedure is recommended by Plus ride to
select the asphalt content for low to medium traffic (4).
2.2.2 Guidelines for Mix Design - Hveem Procedure
The Hveem method of designing paving mixtures was developed by Francis N.
Hveem, formerly Materials and Research Engineer with the California Division
of Highways (33). This test involves determining an approximate asphalt
content by the centrifuge kerosene equivalent test and then subjecting the
specimen at that asphalt content, and at higher and lower asphalt contents, to
20
a stability test after compaction by a particular method of kneading compac
tion (33). A swell test on a specimen exposed to water is also made.
The purpose of the Hveem method is to determine the optimum asphalt
content for a particular blend of aggregate and/or rubber. It also provides
information about the properties of the resulting asphalt mix. Currently,
there are no specifications existing for a Hveem procedure on rubber-modified
mixes.
The Federal Highway Administration (WDFD) has performed a mix design for
rubber-modified asphalt mixtures using the standard Hveem procedure (11).
After blending, the aggregate was heated to 160°C (320°F). Rubber at ambient
temperature was added to the heated aggregate and dry mixed for 15 seconds.
After adding the required asphalt, the sample was mixed for an additional 3
minutes. Each sample was then returned to the 160°C (320°F) oven for a I-hour
curing period. After curing, the samples were compacted using 50 compactor
foot applications at 250 psi, followed by a 40,OOO-pound leveling load. The
forming mold part of the compaction mold was lubricated using standard multi
purpose grease and a release paper disk was used to prevent the mix sticking
to the base. Finally, a 5-pound surcharge was placed on each sample until it
cooled to room temperature.
2.3 Evaluation of Mix properties
Only limited mix properties (e.g., modulus and fatigue) are available for
Plus ride asphalt mixtures. Most of this data was developed by Oregon State
University and Alaska Department of Transportation and Public Facilities
(24,25). The results of resilient modulus and fatigue tests on laboratory
prepared samples from two rubber asphalt projects in the State of Alaska and
on laboratory-prepared samples prepared by All Seasons Surfacing Cbrporation
are presented in this section.
2.3.1 Alaska DOTPF Study (25)
This section describes the results of resilient modulus and fatigue on
rubberized asphalt mix performed by Alaska DOTPF. Two projects were evalu
ated:
1) Peger Ro ad, and
2) Upper Huf fman.
21
All tests were performed in the Central Region Laboratory (ADOTPF) using
aggregates secured from the Anchorage area.
The purpose of this study was to evaluate the effect of varying:
1) aggregate gradation (coarse, medium, fine),
2) rubber content, and
3) proportion of fine rubber.
2.3.1.1 Test Procedures. Standard Marshall mix designs were made for
the two projects. For Peger Road, the variables considered included:
1) rubber content - 2.5%, 3%, and 3.5% by weight of total mix.
In all cases an 80 to 20 blend of coarse and fine rubber was
used.
2) proportion of fine rubber - one set had an added 2% fine
rubber, and
3) mix temperatures - 190°C (375°F) and 204°C (400°F).
The compaction temperature in all cases was 121°C (250°F) while· the asphal t
content was held constant at 8.0%, AC-2.5.
For Huffman Road, the variables considered were:
1) aggregate gradation - coarse, medium, and fine,
2) proportion of fine rubber - one set had 2% additional fine
rubber, and
3) mix temperatures - 190°C (375°F) and 204°C (400°F).
The compaction temperature in all cases was 121°C (250°F).
The asphalt and rubber content were calculated by weight of dry aggre
gate. The optimum asphalt content (based on 2% air voids) for Peger Road
varied with rubber content as follows:
Rubber Content, %
2.5
3
3.5
Optimum Asphalt Content, %
7.5
8
8.5
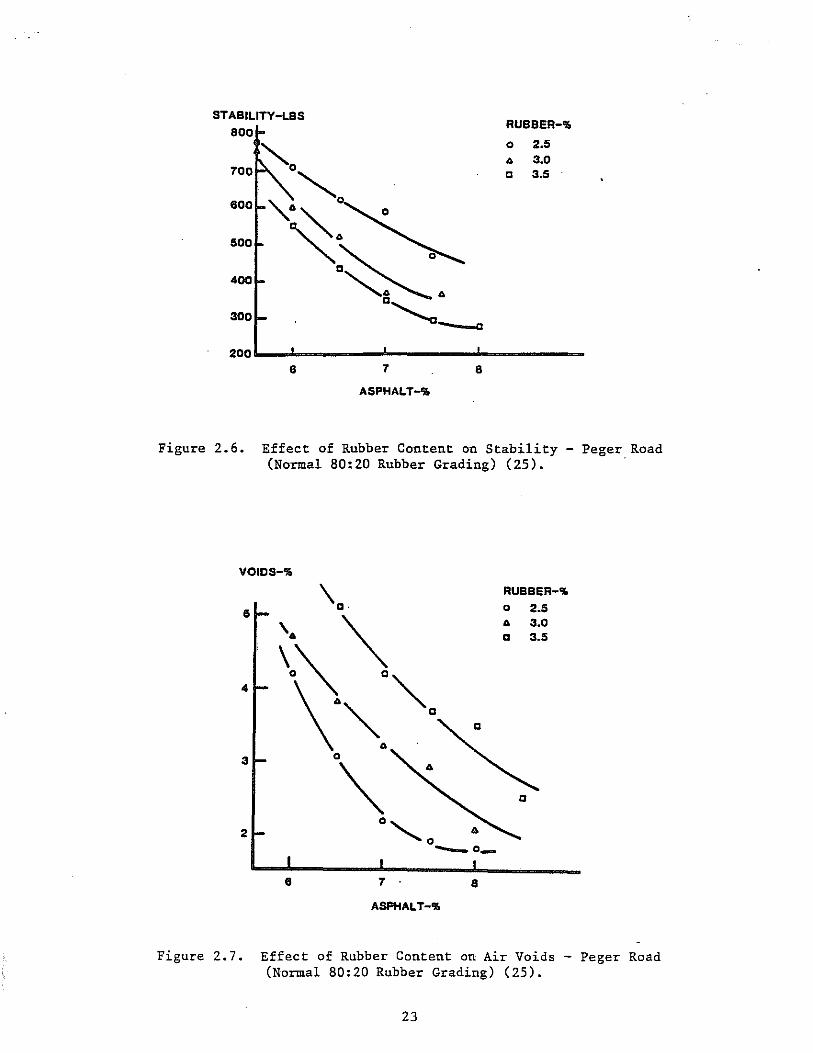
Figures 2.6 and 2.7 show the effect of rubber content on Marshall stability
and voids.
22
STABILITY-LSS 800
500
400
300
200
~O
" "~, ' ,
~ .. 8
C"-....._
7
ASPHALT-'!!o
RUBBER-'!!o
0 2.5 .. 3.0 c 3.5
c
8
Figure 2.6. Effect of Rubber Content on Stability - Peger.Road (Normal 80:20 Rubber Grading) (25).
VOIDS-'!!o
\0 RUBBER-'!!o
15 0 2.5
\6 ~ .. 3.0 0 3.5
4 \~ '", \'''', .
3 0
~ 0
2 0,
0 _o_ Il 7 . 8
ASPHALT-'!!o
Figure 2.7. Effect of Rubber Content on Air Voids - Peger Road (Normal 80:20 Rubber Grading) (25).
23
For Huffman Road, the optimum asphalt content (based on 2% air voids)
varied with aggregate gradation as follows:
Aggregate Optimum Recommended for Gradation AsEhalt Content I % Test Program
Coarse A 10.5% 9.7
Medium e 8.7% 8.0
Fine - B 7.5% 7.0
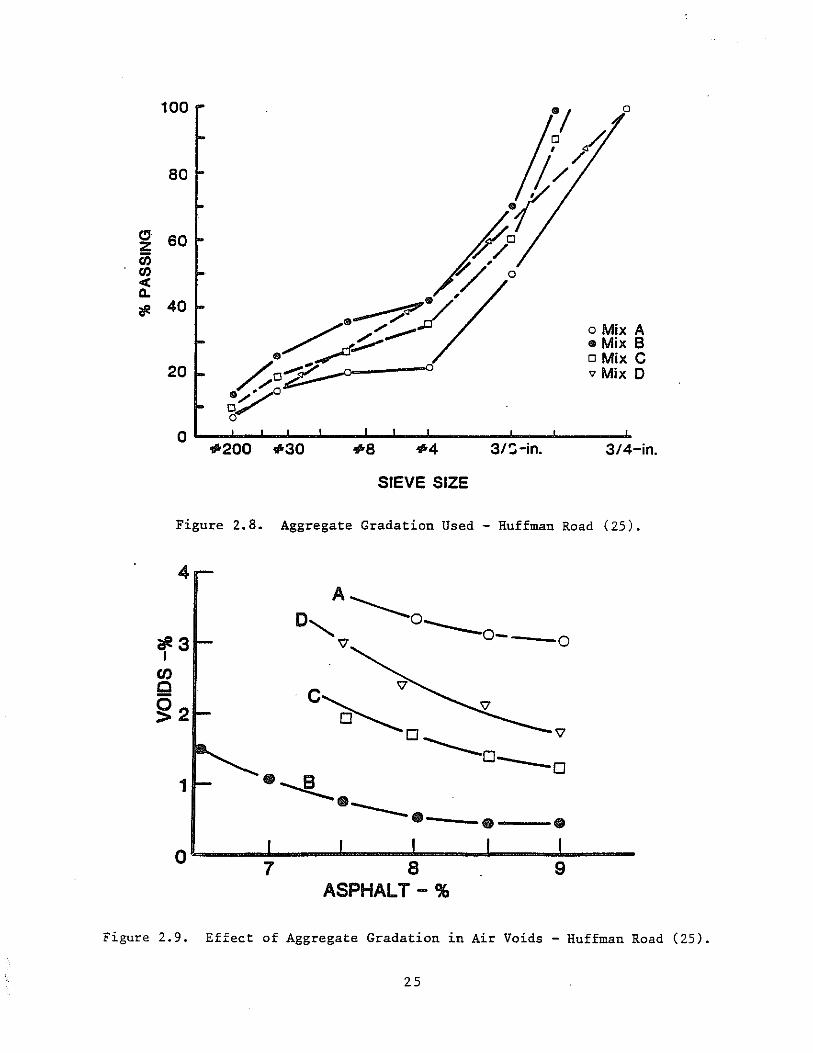
Figure 2.8 shows the aggregate grading employed. Mixes A, B, and e are those
discussed above, while Mix D is dense grading. The effects of aggregate
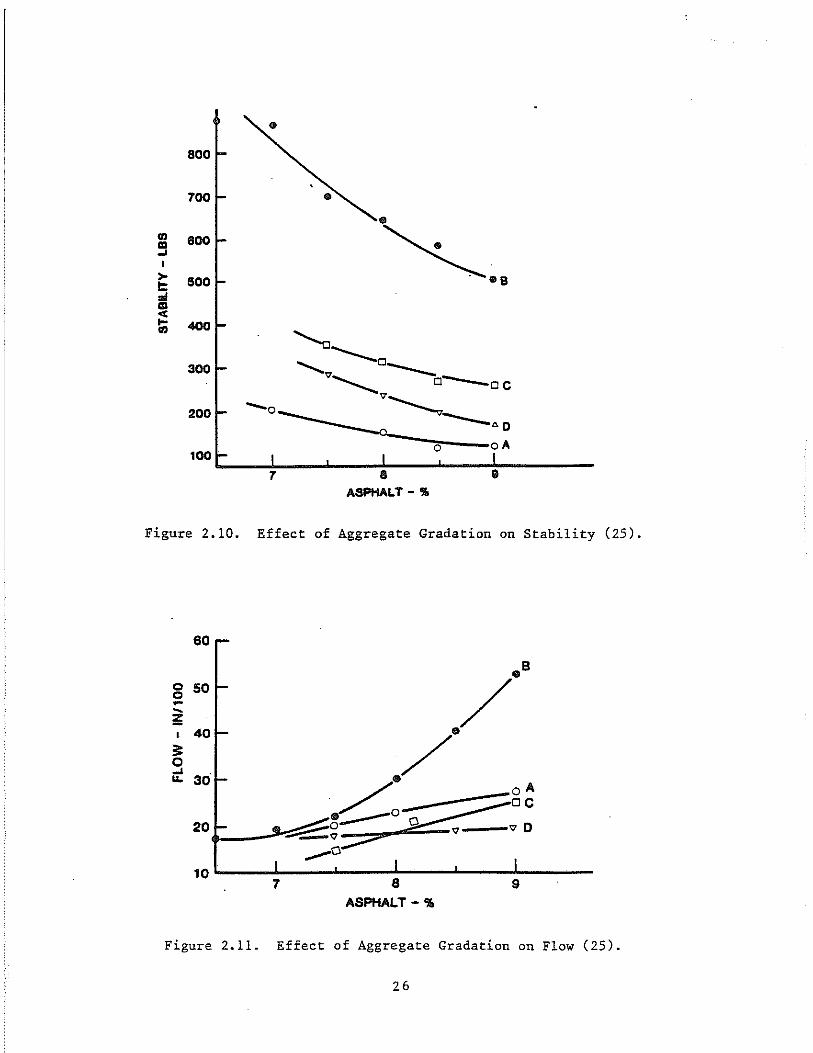
gradation on voids, Marshall stability, and flow is shown in Figures 2.9,
2.10, and 2.11.
2.3.1.2 Modulus and Fatigue Data. Eighteen samples from each project
were tested for diametral modulus and fatigue at 50°F (100 e). All tests were
conducted using a load duration of O.ls at a frequency of 1 Hz.
Tables 2.6 and 2.7 summarize the results of modulus tests for each proj
ect. As indicated in Table 2.6, the effect of rubber content is slight;
however, the effect of added fine rubber and mixing temperature increases the
modulus from 22% to 61%. In Table 2.7, the effects of aggregate gradation,
fine rubber content, asphalt content, and mixing procedure on the modulus are
shown. The highest modulus values resulted with the finer aggregate grada
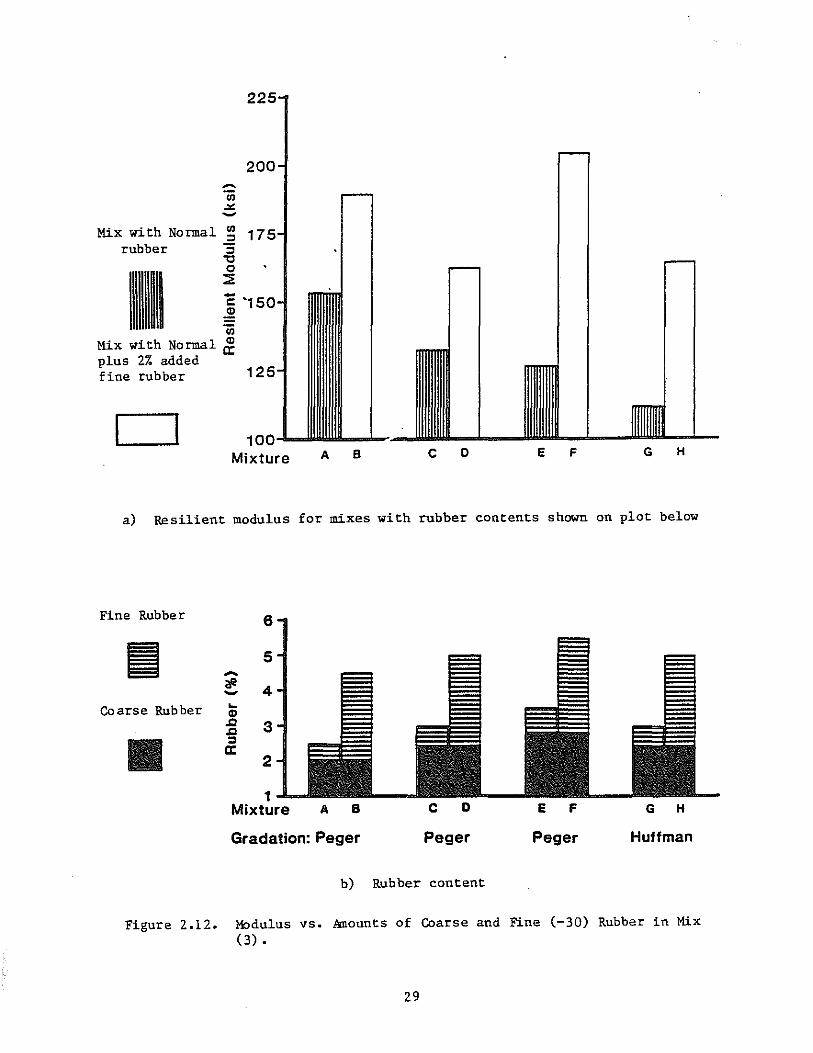
tions. Figure 2.12 summarizes all modulus data for both projects.
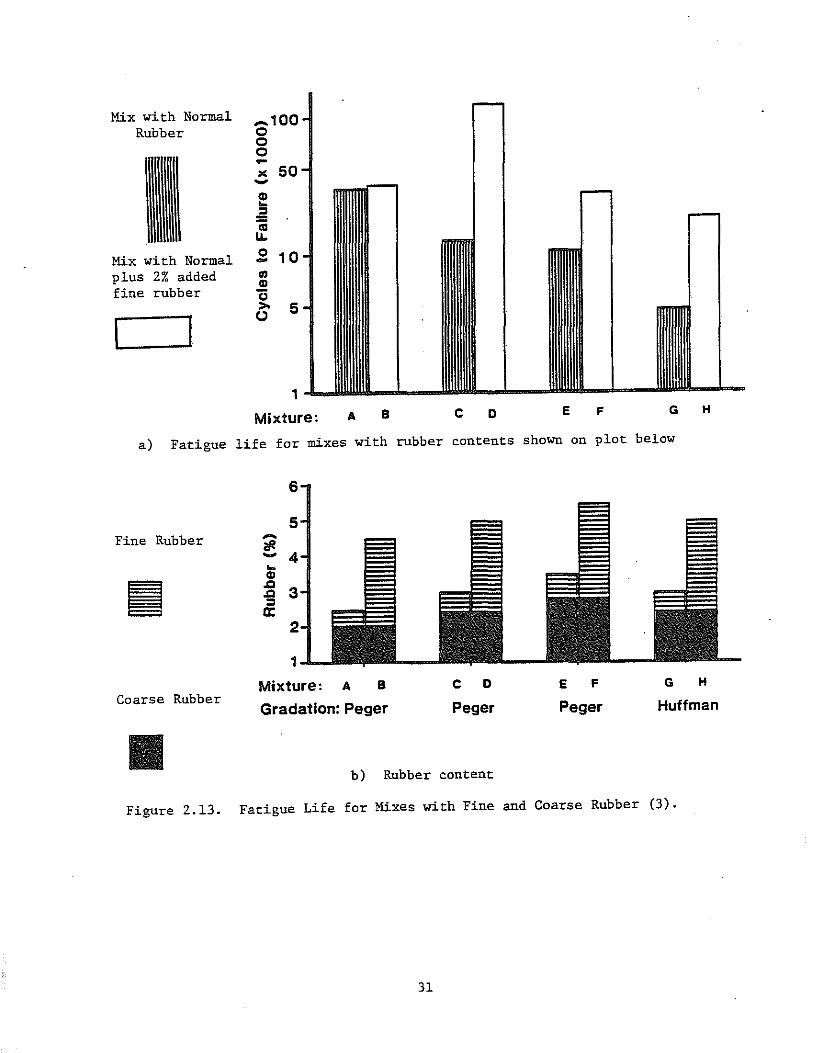
Table 2.8 and Figure 2.13 summarize the results oE the diametral fatigue
tests. Only the medium gradation results are given for Huffman Road. As
indicated, the rubber content (Peger Road) and fine rubber percentage both
increased the fatigue life.
2.3.1.3 Discussion of Results. The results of these tests generally
indicate:
1) The effects oE aggregate gradation (Huffman Road) are drama
tic, affecting the asphalt content by 3%. As the asphalt
content increases, the modulus decreases. When the aggregate
gradation approaches the fine end of the band, 2% voids can be
24
100
80
~ 60 en rIJ « a. <p- 40
20
a Mix A .. Mix B o Mix C v Mix 0
o~~~~~~--~~--~----~--~----~ #200 #30 #8 #4 3/~-in. 3/4-in.
SIEVE SIZE
Figure 2.8. Aggregate Gradation Used - Huffman Road (25).
4
Cf!a en c ~2
1
A _____
0" 0 ___ 0-
\l
\l
C~ \l
0 ___ 0_
-~ ----- -I , , 7 8
ASPHALT - %
0
\l
-0
-I 9
Figure 2.9. Effect of Aggregate Gradation in Air Voids - Huffman Road (25).
25
CD III ... I
> t:
'" III
'" ... CD
800
700
1100
1500
400
300
200
100
7
~ ..
II ASPHALT - 'lIo
Figure 2.10. Effect of Aggregate Gradation on Stability (25).
60
o 50 o ... -l!; I 40
20
10L-----~----~----~----~----~------789 ASPHALT - 'lit
Figure 2.11. Effect of Aggregate Gradation on Flow (25).
26
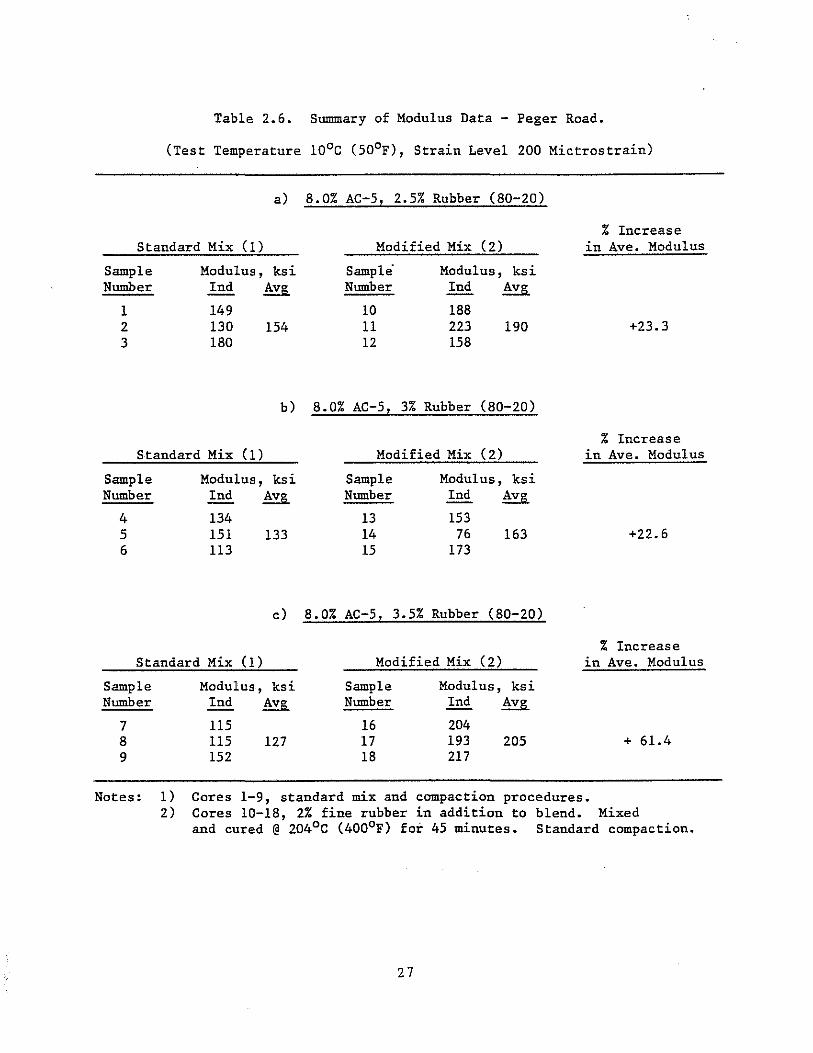
Table 2.6. Summary of Modulus Data - Peger Road.
(Test Temperature 100 C (500 F), Strain Level 200 Mictrostrain)
a) 8.0% AC-5, 2.5% Rubber (80-20)
% Increase Standard Mix (1) Modified Mix (2) in Ave. Modulus
Sample Modulus, ksi Sample" Modulus, ksi Number Ind Avg Number Ind Avg
1 149 10 188 2 130 154 11 223 190 +23.3 3 180 12 158
b) 8.0% AC-5, 3% Rubber (80-20)
% Increase Standard Mix (1) Modified Mix (2) in Ave. Modulus
Sample Modulus, ksi Sample Modul us, ks i Number Ind Avg Number Ind Avg
4 134 13 153 5 151 133 14 76 163 +22.6 6 113 15 173
c) 8.0% AC-5, 3.5% Rubber (80-20)
% Increase Standard Mix (1) Modified Mix (2) in Ave. Modulus
Sample Number
7 8 9
Modulus, ksi Ind Avg
115 115 127 152
Sample Modulus, ksi Number Ind Avg
16 204 17 193 205 + 61.4 18 217
Notes: 1) Cores 1-9, standard mix and compaction procedures. 2) Cores 10-18, 2% fine rubber in addition to blend. Mixed
and cured @ 2040 C (4000 F) for 45 minutes. Standard compaction.
27
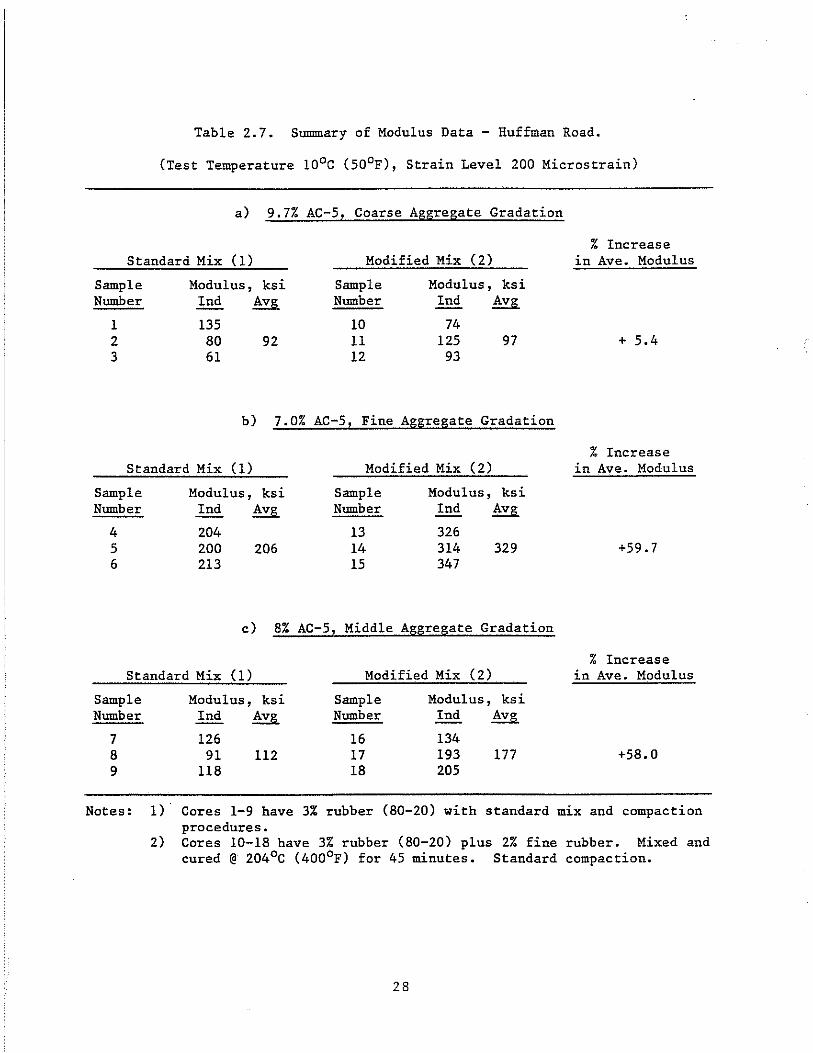
Table 2.7. Summary of Modulus Data - Huffman Road.
(Test Temperature 100C (500F), Strain Level 200 Microstrain)
a) 9.7% AC-5, Coarse Aggregate Gradation
% Increase Standard Mix (1) Modified Mix (2) in Ave. Modulus
Sample Number
1 2 3
Modulus, ksi Ind Avg
135 80 92 61
Sample Number
10 11 12
Modulus, ksi Ind Avg
74 125
93 97
b) 7.0% AC-5, Fine Aggregate Gradation
+ 5.4
% Increase Standard Mix (1) Modified Mix (2) in Ave. Modulus
Sample Modulus, ksi Sample Modulus, ksi Number Ind Avg Number Ind Avg
4 204 13 326 5 200 206 14 314 329 +59.7 6 213 15 347
c) 8% AC-5, Middle Aggregate Gradation
% Increase Standard Mix (1) Modified Mix (2) in Ave. Modulus
Sample Modulus, ksi Sample Modulus, ksi Number Ind Avg Number Ind Avg
7 126 16 134 8 91 112 17 193 177 +58.0 9 118 18 205
Notes: 1)· Cores 1-9 have 3% rubber (80-20) with standard mix and compaction procedures.
2) Cores 10-18 have 3% rubber (80-20) plus 2% fine rubber. Mixed and cured @ 204°C (4000F) for 45 minutes. Standard compaction.
28
22
200 -en .:z: ~
Mix with Normal en 17 :l rubber :;
" 0 ::E - '150 c: CI)
;;; Mix with Normal ~ plus 2% added
125 fine rubber
0 1 Mixture A B C 0 E F G H
a) Resilient modulus for mixes with rubber contents shown on plot below
Fine Rubber 6
ii 5 ...... ;/i!
4 ..... Coarse Rubber ...
CI) .c 3 .c :l a:
2
1 Mixture A B c D E F G H
Gradation: Peger Peger Peger Huffman
b) Rubber content
Figure 2.12. Modulus vs. Amounts of Coarse and Fine (-30) Rubber in Mix (3) •
29
Table 2.8. Summary of Fatigue Tests - looe (50°F).
a) Peger Road
Sample No.* Tensile Strain, 10-6 m/m
2 200
4 200
7 200
8 200
10 200
14 200
15 200
18 200
b) Upper Huffman Road
Sample No.** Tensile Strain, 106
2 200
5 200
8 200
11 200
13 200
17 200
*See Table 2.6 for sample identification. **See Table 2.7 for sample identification.
30
Fati~ue Life Ind Result Average
31,360
13,180
6,686 11,095
15,504
33,463
134,000 131,726
129,452
29,239
Fatigue Life
9,349
5,914
4,069
17,161
227,000
19,242
Mix wi th Normal Rubber
Mix wi th Normal plus 2% added fine rubber
-.100 0 0 0 ... x 50 .... QI -.2 iii 1.1. 0 10 -..., QI g >- 5 (.)
1
Mixture: A B c o E F G H
a) Fatigue life for mixes with rubber contents shown on plot below
Fine Rubber
Coarse Rubber
-?ft .... .. QI ..c ..c :::s a:
6
Mixture: A B
Gradation: Peger
C 0
Peger
b) Rubber content
E F
Peger
G H
Huffman
Figure 2.13. Fatigue Life for Mixes with Fine and Coarse Rubber (3).
31
obtained only at low asphalt contents, which results in a high
modulus. The effect of aggregate gradation on fatigue Was not
evaluated.
2) The effect of rubber content (Peger Road) on modulus was
slight (Figure 2.12). However, the maximum fatigue life was
achieved at 3% rubber (standard 80 to 20 blend). Fatigue life
decreased as the rubber content increased to 3.5% as shown in
Figure 2.13.
3) Added fine rubber proportions increased the modulus and
fatigue values in all cases. The maximum fatigue life was
obtained with 5% total rubber (2.4% coarse and 2.6% fine).
2.3.2 All Seasons Surfacing COrporation Study
This section describes the results of preliminary tests on rubberized
asphalt mix performed by Oregon State University on prepared samples submitted
by All Seasons Surfacing Corporation (24). The evaluation consisted of:
1) varying the types of filler, amount of filler, amount of fine
rubber, and supplier of rubber asphalt mixes,
2) visual observation of the mixture consistency (or appearance)
and determination of mix void content, and
3) resilient modulus and fatigue tests of the briquettes.
2.3.2.1 Test Procedures. To reduce result variations due to lab pro
cedures, the following standards were used for each mixture:
1) All mixes were made with Plus ride 12 aggregate gradation and
3% rubber by weight of the total mix.
2) The aggregates and rubber granules were heated to 171°C
(340°F), and the specimens were compacted using a Marshall
hammer (SO blows) at 149°C (300°F) to 154°C (310°F).
3) All briquettes were surcharged with a 5-pound weight and
allowed to cool down to about 49°C (120°F) before removal from
the mold.
4) Voids were determined using Rice's specific gravity (AASHTO
T-209).
5) Samples were tested for diametral modulus and fatigue.
32
Items 1 to 4 above were determined by All Seasons, while item 5 was determined
by Oregon State University.
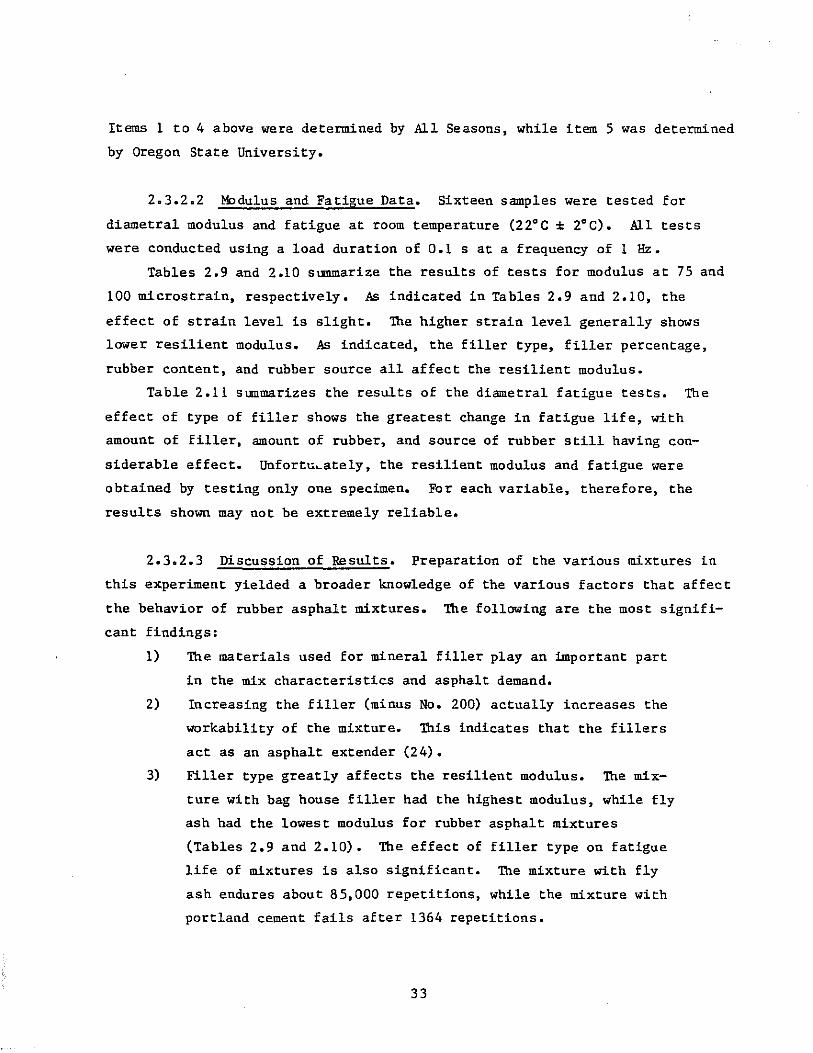
2.3.2.2 Modulus and Fatigue Data. Sixteen samples were tested for
diametral modulus and fatigue at room temperature (22°C: 2°C). All tests
were conducted using a load duration of 0.1 s at a frequency of 1 Hz.
Tables 2.9 and 2.10 summarize the results of tests for modulus at 75 and
100 microstrain, respectively. As indicated in Tables 2.9 and 2.10, the
effect of strain level is slight. The higher strain level generally shows
lower resilient modulus. As indicated, the filler type, filler percentage,
rubber content, and rubber source all affect the resilient modulus.
Table 2.11 summarizes the results of the diametral fatigue tests. The
effect of type of filler shows the greatest change in fatigue life, with
amount of filler, amount of rubber, and source of rubber still having con
siderable effect. Unfort~~ately, the resilient modulus and fatigue were
obtained by testing only one specimen. For each variable, therefore, the
results shown may not be extremely reliable.
2.3.2.3 Discussion of Results. Preparation of the various mixtures in
this eXperiment yielded a broader knowledge of the various factors that affect
the behavior of rubber asphalt mixtures. The following are the most signifi
cant findings:
1) The materials used for mineral filler play an important part
in the mix characteristics and asphalt demand.
2) IncreaSing the filler (minus No. 200) actually increases the
workability of the mixture. This indicates that the fillers
act as an asphalt extender (24).
3) Filler type greatly affects the resilient modulus. The mix
ture with bag house filler had the highest modulus, while fly
ash had the lowest modulus for rubber asphalt mixtures
(Tables 2.9 and 2.10). The effect of filler type on fatigue
life of mixtures is also significant. The mixture with fly
ash endures about 85,000 repetitions, while the mixture with
portland cement fails after 1364 repetitions.
33
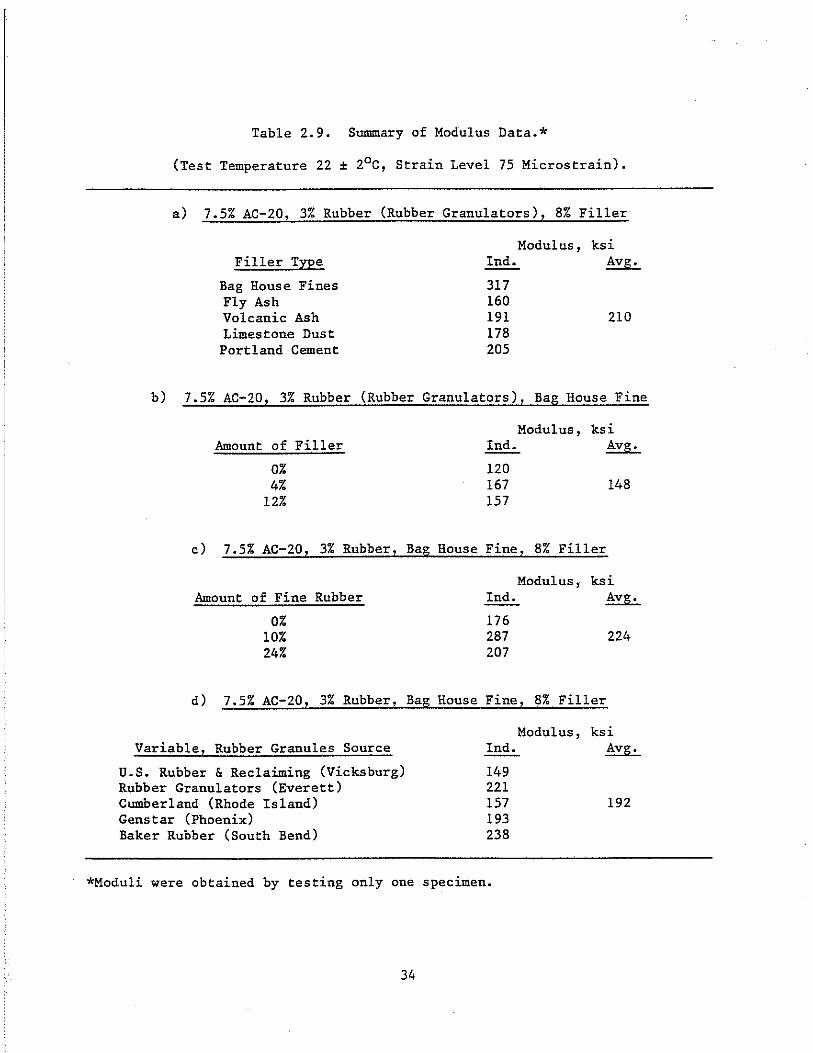
Table 2.9. Summary of Modulus Data.*
(Test Temperature 22 ± 2oC, Strain Level 75 Microstrain).
a) 7.5% AC-20, 3% Rubber (Rubber Granulators), 8% Filler
Filler TyPe
Bag House Fines Fly Ash Volcanic Ash Limestone Dust Portland Cement
Modulus, ksi Ind. Avg.
317 160 191 178 205
210
b) 7.5% AC-20, 3% Rubber (Rubber Granulators), Bag House Fine
Amount of Filler
0% 4%
12%
c) 7.5% AC-20, 3% Rubber,
Amount of Fine Rubber
0% 10% 24%
d) 7.5% AC-20! 3% Rubber!
Variable! Rubber Granules Source
U.S. Rubber & Reclaiming (Vicksburg) Rubber Granulators (Everett) Cumberland (Rhode Island) Genstar (Phoenix) Baker Rubber (South Bend)
Bag House
Ball; House
Modulus, ksi Ind. Avg.
120 167 148 157
Fine, 8% Filler
Modulus, ksi Ind. Avg.
176 287 224 207
Fine z 8% Filler
Modulus, ksi Ind. AVll;.
149 221 157 193 238
192
*Moduli were obtained by testing only one specimen.
34
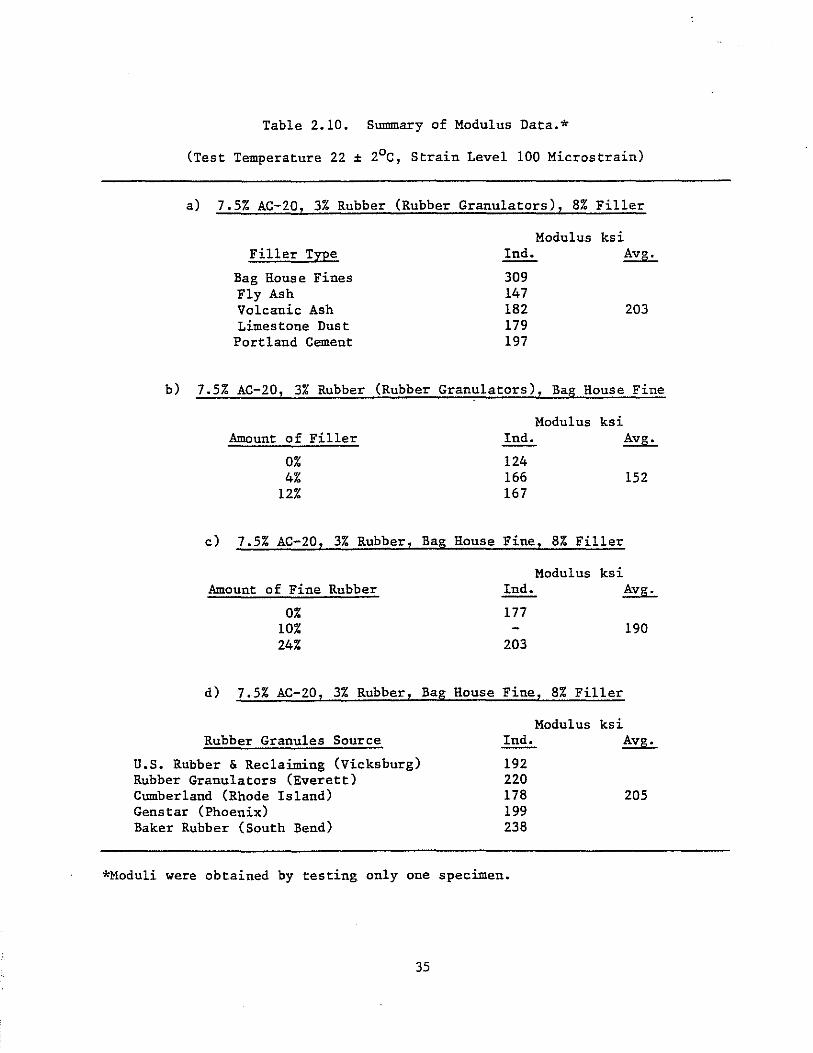
Table 2.10. Summary of Modulus Data.*
(Test Temperature 22 ± 2oC, Strain Level 100 Microstrain)
a) 7.5% AC-20, 3% Rubber (Rubber Granulators), 8% Filler
Modulus ksi Filler Type
Bag Hause Fines Fly Ash Volcanic Ash Limestone Dust
Portland Cement
Ind. Avg.
309 147 182 179 197
203
b) 7.5% AC-20, 3% Rubber (Rubber Granulators), Bag Hause Fine
Modulus ksi Amount of Filler Ind. Avg.
0% 124 4% 166 152
12% 167
c) 7.5% AC-20, 3% Rubber, Bag Hause Fine, 8% Filler
Modulus ksi Amount of Fine Rubber Ind. Avg.
0% 177 10% 190 24% 203
d) 7.5% AC-20, 3% Rubber, Bag Hause Fine, 8% Filler
Modulus ksi Rubber Granules Source Ind. Avg.
U.S. Rubber & Reclaiming (Vicksburg) Rubber Granulators (Everett) Cumberland (Rhode Island) Genstar (Phoenix) Baker Rubber (South Bend)
192 220 178 199 238
*Moduli were obtained by testing only one specimen.
35
205
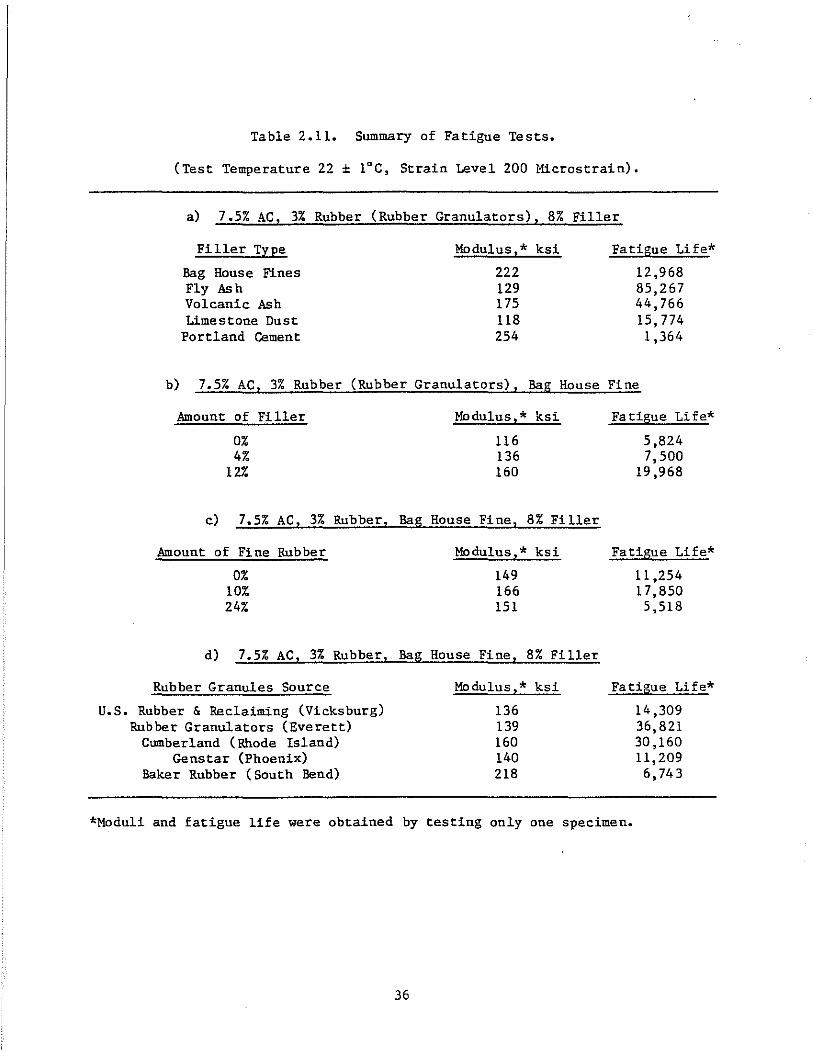
Table 2.11. Summary of Fatigue Tests.
(Test Temperature 22 ± 1°C, Strain Level 200 11icrostrain).
a) 7.5% AC, 3% Rubber (Rubber Granulators), 8% Filler
Filler Type Modulus,* ksi Fatigue Life*
Bag House Fines 222 12,968 Fly Ash 129 85,267 Volcanic Ash 175 44,766 Limestone Dust 118 15,774
Portland Cement 254 1,364
b) 7.5% AC, 3% Rubber (Rubber Granulators), Bag House Fine
Amount of Filler
Amount
0% 4%
12%
c) 7.5% AC, 3%
of Fine Rubber
0% 10% 24%
Rubber,
d) 7.5% AC, 3% Rubber,
Rubber Granules Source
u.S. Rubber & Reclaiming (Vicksburg) Rubber Granulators (Everett)
Cumberland (Rhode Island) Genstar (Phoenix)
Baker Rubber (South Bend)
Bag
Bag
Modulus,* ksi
116 136 160
House Fine, 8% Filler
Modulus, * ksi
149 166 151
House Fine, 8% Filler
Modulus,* ksi
136 139 160 140 218
Fa tigue Life*
5,824 7,500
19,968
Fa tigue Life*
11 ,254 17,850 5,518
Fatigue Life*
14,309 36,821 30,160 11,209 6,743
*Moduli and fatigue life were obtained by testing only one specimen.
36
4) The effect of filler and rubber content on resilient modulus
and fatigue life is interesting. The mixtures with 12% filler
and with 10% fine rubber exhibited the highest fatigue life.
5) The effect of rubber source on resilient modulus and fatigue
life is also significant. The Baker Rubber source resulted in
the highest modulus of both the 75 and 100 microstrain levels,
while the Rubber Granulator source has the highest fatigue
life. Due to the number of specimens tested in the study, it
is impossible to make any statement regarding the effect of
type and amount of rubber or filler on mix properties.
2.4 Evaluation of Field Projects
This section presents a summary of the results of initial and follow-up
questionnaire surveys. The initial survey was sent to various transportation
agencies that have used Plusride mixes. The initial questionnaire requested
specific details concerning the mix design, construction, mix performance, and
reasons for use. Also included in the summary are the results of an Aus
tralian Road Research Board (ARRB) experiment on a rubber-modified asphalt
project conducted in 1977 (26), and the results from five test projects con
ducted between 1979 and 1983 (23,27) by the Alaska Department of Transporta
tion and Public Facilities (ADOTPF). The follow-up questionnaire was sent in
July of 1984 to the same agencies originally surveyed. The follow-up ques
tionnaire was used to further define the present condition of the Plusride
mixes.
2.4.1 questionnaire Survey
The results of both surveys are summarized in Appendix A and include
information on:
1) Project location and agency in charge.
2) General data, including tons mixed and thickness of paving.
3) Rubber and asphalt content.
4) Construction data and prOblems encountered.
5) Overall performance and any problems noted.
6) Reasons for using rubberized asphalt.
7) Present condition (1984).
37
Some agencies enclosed a copy of their preliminary performance evaluation
report with their questionnaire, which allowed a more complete understanding
of the rubber asphalt mix performance (23,26,27,29,31).
2.4.2 Discussion of Survey Results
From the summaries of the replies obtained from the various agencies
queried, certain general trends were established. These are shown in
Table 2.12.
The aggregate gradation used by those agencies which reported a gradation
different from that specified is shown in Figure 2.14, along with the grada
tion envelope recommended by All Seasons Surfacing Corporation for Plusride
(12) •
The results of the follow-up questionnaire are summarized in
Table 2.13. This table shows that only one agency visually observed and
reported de-icing behavior on their rubber-modified asphalt project. Each of
the projects is evaluated in the discussion that follows.
Bellevue, Washington. Of the agencies which did not include a prelimi
nary evaluation report with their reply, only the City of Bellevue reported no
problems with the mix used. The existing pavement was PCC with transverse
cracks every 10 to 12 feet, along with random cracks and moving slabs. As
reported in Table A.l, the main reason for use was based on a comparison
between rubber-modified asphalt and geotextile-reinforced pavement for the
control of reflective cracking. To date, after two years, the rubber-modified
asphalt remains virtually unchanged; however, the fabric-reinforced pavement
is beginning to show the transverse cracks.
Washington State Department of Transportation. As of 1984, WSDOT had
used rubber-modified asphalt in three projects. Of these three, the question
naire received concerned only the Union Gap Project (Table A.I0). This pro
ject consisted of resurfacing of four lanes which were divided into two sec
tions. The first consisted of 2-1/2 inches of Class B asphalt base and 1-1/4
inches of Class B wearing course. The second section received 2-1/4 inches of
the same base and 1-1/2 inches of Plusride (23) as the wearing course. The
area, Eastern Washington, experiences below freezing temperatures in the
winter and summer temperatures exceeding 100°F. Preliminary data indicates
some problems with rutting and bleeding. The asphalt content was 8% with an
air void content of 3.5%.
38
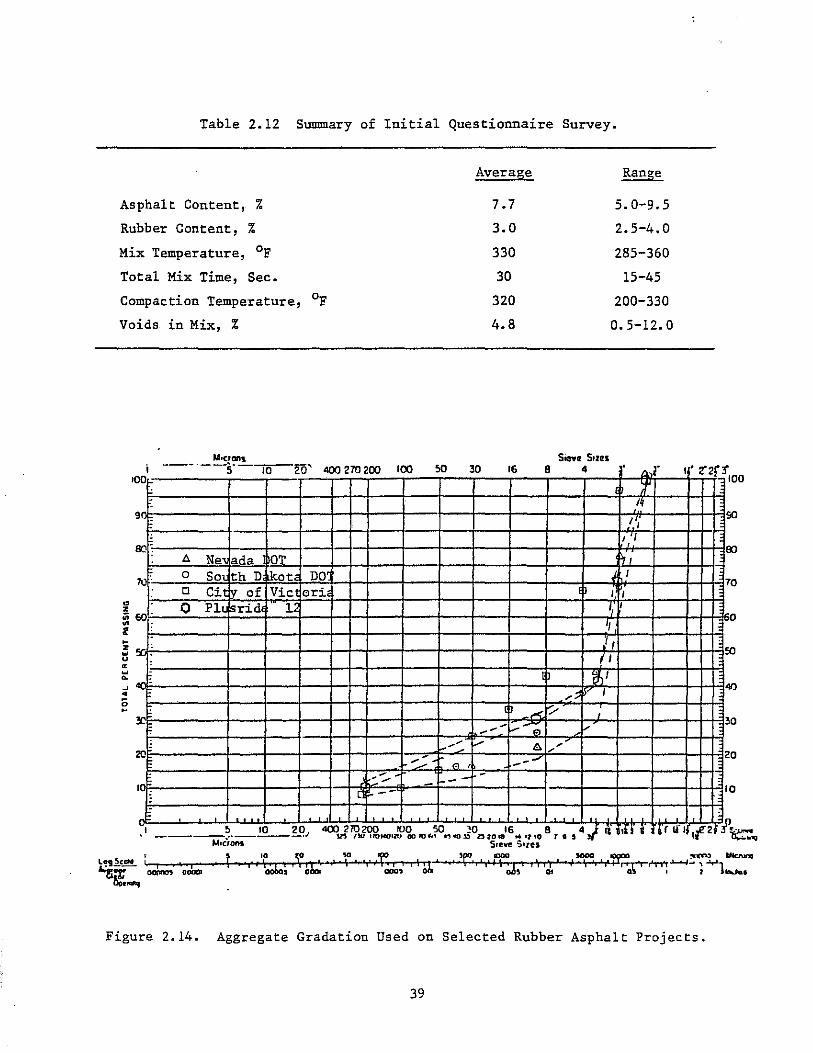
Table 2.12 Summary of Initial Questionnaire Survey.
Average Range
Asphalt Content, % 7.7 5.0-9.5
Rubber Content, % 3.0 2.5-4.0
Mix Temperature, of 330 285-360
Total Mix Time, Sec. 30 15-45
Compaction Temperature, of 320 200-330
Voids in Mix, % 4.8 0.5-12.0
i ,--- '- --S- --'-0-20' <I()() 270 200 '00 50 30 '6 a 4 r A,- ,. nrr 00
'if' , 00
- Iq 9 - 1 'j -
so
- I I OO~
OT "- Ne, ada ~ I 80
71) " a SOL th D ikot DO I 7
Cl Cit ~ of Vic sri , I o
60' 0 Plu srid l;, I; ,
" o
- I, -: ,
- (1' , ...,; ,
,.-< ..,- , 3C - -1-_-0 f'
3 -- o _/ V ll._ -20E <.- ---' 2
C-l , o - -1-- --- - -,
0 - - , o -- ., I, T, I ______ ~.--'O--~'?.1 <I()() 270200 ",0 50 }O '6 8 4 J II hOi j (Ir ,I", (2
115 no 110""'20 GOlD"'" .,..a~ ~ .. o .. ~.,tO r _, I
Figure 2.14. Aggregate Gradation Used on Selected Rubber Asphalt Projects.
39
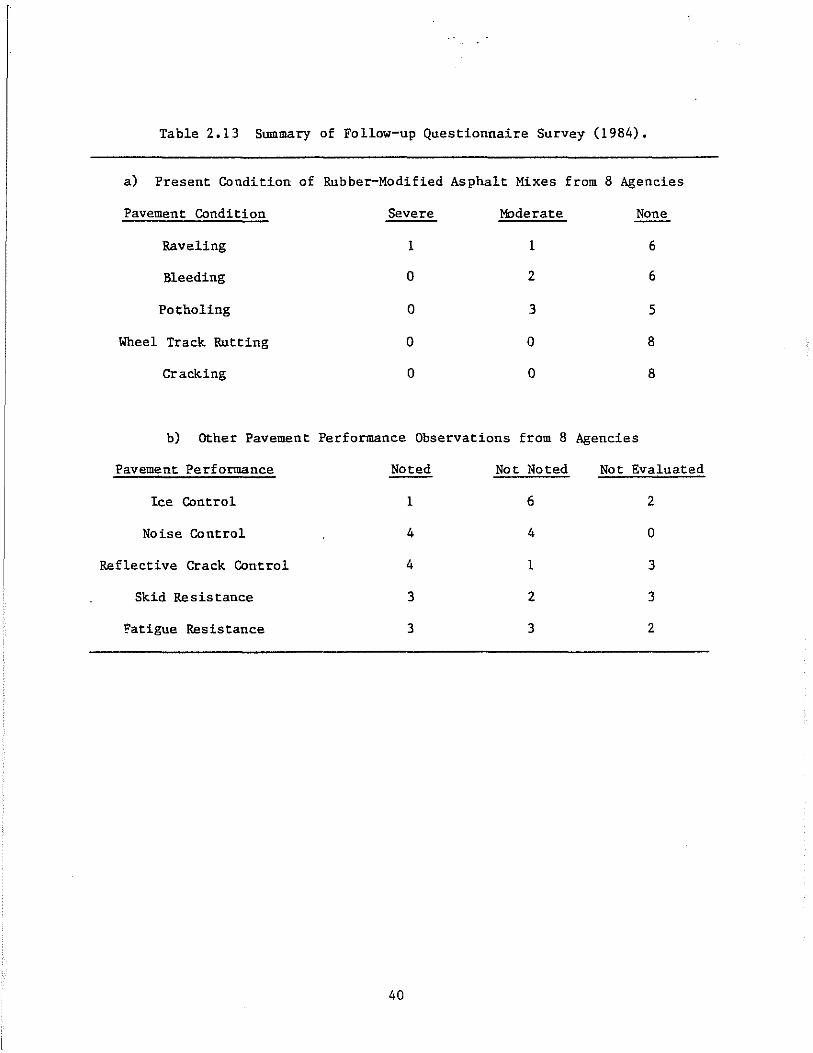
Table 2.13 Summary of Follow-up Questionnaire Survey (1984).
a) Present Condition of Rubber-Modified Asphalt Mixes from 8 Agencies
Pavement Condition Severe Moderate None
Raveling 1 1 6
Bleeding 0 2 6
Potholing 0 3 5
Wheel Track Rutting 0 0 8
Cracking 0 0 8
b) Other Pavement Performance Observations from 8 Agencies
Pavement Performance Noted Not Noted Not Evaluated
Ice Control 1 6 2
Noise Control 4 4 0
Reflective Crack Control 4 1 3
Skid Resistance 3 2 3
~atigue Resistance 3 3 2
40
Data was limited on the other two projects in Washington (28). The first
of these was an overlay on Interstate 82 at the Yakima River Bridge. This
consisted of 3/4 of an inch of Plusride (28). The climatic conditions are
similar to those reported above. The expected ADT is 14,000 with 13%
trucks. The final application was on a circular interchange 25 miles south of
Seattle at Auburn. The overlay thickness varied from 1-1/4 to 1-1/2 inches.
Oklahoma DOT. The Oklahoma project included comparisons of four dense
graded pavement products: Chem-Crete asphalt, Arm-r-Shield asphalt-rubber,
Over-Flex asphalt-rubber, and Plusride rubber-modified asphalt concrete
(28). The existing pavement was overlaid with 2 inches of each product for a
distance of one mile. Unfortunately, the response contained only comments
concerning the Plus ride product.
This pavement was placed to evaluate reflective crack control compared to
conventional mix. To date (1984), after two years, the rubber-modified
asphalt remains virtually unchanged, except for a moderate amount of pot
holes. The pavement performance (noise control, reflective crack control,
skid resistance, and fatigue resistance) was promising. Rubberized asphalt
has not demonstrated de-icing characteristics. The Oklahoma DOT reported
potholing occurred at the beginning of construction. The 0.2-mile potholed
area was totally removed and patched.
South Dakota DOT. This project consisted of paving a two-lane street and
its 1-90 interchange ramps. One lane and two ramps were overlaid with 1-1/2
inches of Class G asphalt concrete (control) with the remaining lane and ramps
receiving 1-1/2 inches of Plusride (Table A.2).
The mix contained 8.4% P200 and air voids of 3%. In 1982, Dynaflect
testing was conducted on both the Class G and the rubber-modified asphalt.
The Class G averaged 1.24, whereas the Plusride mean was 1.14. Testing for
skid resistance was performed shortly after completion of paving. The Class G
skid number at 32.2 and Plusride at 31.8. Both numbers were relatively low,
probably due to the asphalt coating of aggregate at the surface. This was
expected to wear off under traffic. South Dakota DOT reported moderate to
severe raveling and potholing in localized areas. The poor performance has
been tentatively attributed to an asphalt content being too low (6.5 to 6.8%).
City of Victoria. This project involved overlaying 1.3 kID of downtown
streets in Victoria, B.C. The mixture had 7% asphalt and approximately 3% air
41

voids. The rubber-modified asphalt was placed over severely cracked existing
pavement to determine, among other things, the mixture's ability to control
reflective cracking (Table A.7).
Some raveling problems were reported from the first 150 tons of the 1200
tons placed (6). The raveled strips were confined to one-half the width of
the paving machine. Numerous possibilities have been suggested as the cause
of this problem. There was an asphalt deficiency of 1% in these batches and
the aggregate used was flaky. It was also reported that half the screed was
not vibrating properly, indicating the initial compaction provided by the
paving machine may be important in the ultimate compaction of the mixture. In
a report submitted by the City of Victoria by West-Tech Inspection Service,
Limited, a minimum Marshall stability value of 500 and maximum air voids of 2%
are suggested as laboratory mix design criteria for a stable, durable product
(30).
ARRB. The report received from the Australian Road Research Board (AARB)
summarized the results of three rubber-modified asphalt overlay projects con
ducted in 1977 using a similar process called Rubit (26). The projects were
small-scale, in high-density traffic areas. The first project, Kingsway Site,
failed completely within ten weeks of placement. Severe rutting and separa
tion from the underlying asphalt occurred with a moist layer of uncoated sand
and fines present at the interface. The air void content was 9.2%. The
reported cause of failure was the penetration of rainwater into the surfacing
prior to complete sealing by traffic which apparently caused stripping of the
pavement (Table A.B). The second overlay project, Mordialloc Road, also
failed completely within one year, after the bond at the interface broke. The
layer of fines was not present at the interface, indicating stripping did not
occur as at the Kingsway Site (Table A.9). The third project, also at Kings
way Site, involved the replacement of the original rubber asphalt mix with new
material. This new mix contained hydrated lime to prevent stripping and had a
much lower air void content of 2.9%. After seven months, the experimental
section showed no signs of distress (Table A.9).
FHWA - EDFD. This experimental section was placed in Tellico Plaines,
Tennessee in November, 19B1. Although mixed at 325°F, compaction occurred at
235°F. The percent passing No. 200 sieve was reported to be 3.5%. The aver
age air void content was 5.5%. This pavement was placed to evaluate reflec-
42
tive crack control and skid resistance compared to conventional mixes
(Table A.S). The follow-up questionnaire was not received from this agency.
Nevada DOT. The project included resurfacing a 1-mile section of east
bound Interstate 80 from the California border. The expected traffic volume
is 17,775 with 22% trucks (Table A.7). Within one month, the Plusride asphalt
began showing signs of raveling and potholing. According to the preliminary
evaluation received with the questionnaire, the distress was caused by hy
draulic action from the traffic loading (31). This resulted in the washing of
the asphalt from the aggregate. Visual inspection of other areas revealed a
"brittle appearance which resembled age hardened asphalt." Nevada DOT sus
pects that the heated rubber and asphalt react in a way which may affect the
quality of the asphalt. Their laboratories, however, were unable to determine
if, in fact, this was the cause of the brittle asphalt.
All Seasons Surfacing Corporation (56) offered a different explanation
for the observed distress. They reported that excessive voids (10 to 12%),
instead of the 3 to 5% target air voids, Was the main cause of the pavement
distress. The excess air voids in the mix was caused by deficient P-200
material in the contractor's aggregate. As a result, the pavement had exces
sive voids that permitted water intrusion. This, together with heavy traffic
created excess hydrostatic pressures resulting in early pavement failure.
In the follow-up questionnaire, Nevada DOT reported extensive raveling
and bleeding in the Plus ride section and the mix was subsequently removed.
The main reason for use of Plus ride was ice control. This reported character
istic of rubber modified asphalt was not noted in this project.
Alaska DOT - Carnation Curve and Fairhill Access Road (23). The first
test project in North America utilizing rubber-modified asphalt consisted of
two test sections constructed in Fairbanks in 1979. These sections were
chosen due to the hazardous icing conditions which frequently existed at both
locations.
The first section, Carnation Curve, was placed with a tracked paver to a
depth of 2 inches over existing asphalt concrete paving which had been tacked
with RC-800. The final air void, as determined by coring, was 4.6%
(Table A.5).
The second section, Fairhill Access Road, Was placed using a motor patrol
after end dumping onto the existing asphalt concrete paving. This procedure
43
was utilized to determine if rubber asphalt could also be used in maintenance
type situations. The mixture proved too sticky to handle well and excessive
blading caused the mixture to cool quickly, resulting in the final air vo~ds
being 9%. Both sections are still serviceable. The second site raveled
slightly, but was reported to be still functional after 5 years.
Alaska DOT: Old Seward Highway (23). This project was undertaken to
determine· the influence of various rubber contents on mix performance. The
work included 5.7 miles of badly cracked and rutted asphalt which was prepared
using a 1-inch conventional asphalt concrete overlay to the ruts. Rubber
contents of 3%, 3.5%, and 4% by weight of total mix were placed on the pre
pared surface. The mixtures were produced in a batch~type plant with a dis
charge temperature of 285°F and were placed at 260°F or less. The 4% section
was placed considerably below 260°F due to traffic control delays. Cores of
the various test sections indicated air voids in the 4% rubber section averag
ing up to 12%, and 7.5% in the other two sections (Table A.6). The 4% section
raveled almost immediately and the other sections within 2 to 3 months.
Subsequent testing revealed that most samples were out of gradation specifica
tions and lacked mineral filler. All sections have been replaced with con
ventional mix.
Alaska DOT: Peger - Van Horn Intersection (23). Because ADOTPF believed
the failure of the 4% test section of the Old Seward Highway Project was due,
in part, to the heavy truck turning movements, this intersection was chosen to
further investigate performance under similar conditions. This mixture,
produced in a batch plant, was discharged at 310°F and placed over an un
treated aggregate base to a thickness of 1-1/2 inches. The initial asphalt
content of 8%* at 310°F was raised by 8.2%* at 330°F and finally increased to
8.5%* at 345°F with no resultant placement problems. Compaction was achieved
with a single static 10-ton steel-wheeled roller breaking down at 295°F and
continuing for 10-15 passes until the temperature was below 140°F. Due to the
restrictive confines of this test section, only one roller was necessary for
compaction. The final air voids averaged 4.2% (Table A.7). This section
demonstrated de-icing characteristics of P1usride during the winters, of 1981
through 1983, as measured by Tapley meter stopping distance tests.
*Asphalt contents by weight of dry aggregate.
44

Alaska DOT: Upper Huffman Road (23). This site in Anchorage was chosen
to determine the effectiveness of rubber-modified asphalt on very steep (aver
age grade 10%) roads in alleviating icing problems. The test section con
sisted of 1.01 miles of unconstructed surface with 1-1/2 inches of conven
tional mix overlaid with 3/4-inch Plusride. This mix contained 9.5%* AC-s
asphalt which was discharged from a batch plant at 360°F. The apparent air
void content was 10%, but this value may be in error due to the thin overlay
(Table A.s). To date, the section is performing well with no raveling or
surface failures apparent.
Alaska DOT: Lemon Road (27). This project undertaken by Alaska DOT
includes the placement of 2,462 tons of rubberized asphalt pavement to deter
mine the mix effectiveness in reducing ice deposits, improving skid resistance
and increasing pavement life through improved fatigue failure resistance. The
recommended asphalt content was 8.6%*, with a mix temperature of 275°F
(Table A.4). To date, after one year, the rubber-modified asphalt remains
virtually unchanged.
Montana DOH (53). In September 1983, the Montana Department of Highways
constructed an experimental rubber-modified section to determine the de-icing
capabilities of Plus ride 12. The mix was placed 1-1/2 inches thick at an
asphalt content of 8.75%. The mixture was produced in a batch-type plant at
377°F. Breakdown compaction commenced at 250°F and was continued until the
mix reached a temperature of approximately 203°F. The average air void con
tent was 2% (Table A.3). To date, after one year, the rubber-modified asphalt
remains virtually unchanged. Montana DOH reported that pavement performed
well against noise and reflective crack, but pavement performance against ice,
fatigue, and skid resistance was not noticed.
CALTRANS (54). The California Department of Transportation has begun
compiling test data on a 9-mile test section. This section was designed to
compare, among others, Plus ride and ARCO rubberized binder, of various thick
ness, with and without rubberized stress absorbing membrane interlayers
(SAMI's). Also included in the test section is 2.5 miles of rubberized chip
seal (Table A.3). To date, after one year, the rubber-modified asphalt is
performing well with no raveling or surface failures apparent. CALTRANS
reported, "The 0.15' and 0.2' thick conventional AC control sections on the
project have begun to crack heavily in places, whereas the rubberized AC,
including the Plus ride shows no sign of distress."
45
FEWA - WOFD (11). This experimental section was placed in the Gifford
Pinchot National Forest as part of the Volcanic Activity Disaster Relief
(VADR) project in August 1983. It consisted of 1.11 miles of rubber-modified
asphalt overlay (Plus ride) of various thicknesses placed to determine the de
i~ing effect and the fatigue life of Plusride (Table A-4).
This test section was expected to receive heavy log truck traffic as the
timber blowdown during the Mt. St. Helens eruption was removed. This traffic
was to have helped define the fatigue life of Plusride within three years,
however, delays prevented construction until after the majority of timber had
been removed.
Testing and monitoring of the section is continuing. At present, the
Plus ride section is performing as well as the control.
2.5 Summary
The results of this chapter indicate that
1) Asphalt-rubber is a viable material that provides an attrac
tive alternative for construction, rehabilitation, and main
tenance of roadway networks if properly constructed. Reported
advantages include increased skid resistance, increased life,
and reduced thicknesses of asphalt pavement sections. In
addition, the material is attractive from an energy and re
source recovery point of view.
2) Rubber particle shape, as determined by the method used in
processing recycled rubber, is an important factor in deter
mining the elastic properties of an asphalt rubber mix.
Particles with a low bulk density give blends with a desirable
high elastic recovery. Those particles with a high bulk
density, as produced by cryogenic processing, give products
with poor elastic properties (14).
3) The effect of rubber gradation on asphalt rubber pavement
material is not well known at this time. Based on past exper
ience, Plus ride recommends a rubber gradation to provide
pavement with increased skid resistance and improved durabil
ity characteristics (4). Continued research in this area is
needed to ascertain the advantages or disadvantages of various
rubber gradations.
46
4) Rubber type is known to affect the properties of the asphalt
rubber mix. The addition of natural rubber produces improved
elastic properties of the binder. However, recycled rubber
includes both natural and synthetic rubbers of which the exact
percentages of each are rarely known. The effect of recycled
rubber on asphalt mix properties is dependent on such vari
ables as rubber source, recycle processing, and recycled tire
type.
S) The mixtures may be compacted using the Marshall or Hveem pro
cedure. The optimum asphalt content is generally determined
by the voids in the total mix. The air voids in place should
range from 0% to 4% maximum depending on the traffic level of
the facility being designed. Tests for stability and flow are
not currently used as criteria for optimum asphalt content, as
these conventional asphalt tests have been found to be in
appropriate for rubber-modified mixes due to their resiliency.
6) The results of modulus and fatigue tests on laboratory-pre
pared samples from two projects in Alaska and samples prepared
by All Seasons Surfacing Corporation indicated the follOWing
factors affect these properties:
a) rubber content and gradation,
b) aggregate filler type and content, and
c) rubber source.
7) A total of 19 experimental projects constructed between 1976
and 1983 were evaluated using a questionnaire survey. Almost
all of the projects encountered some difficulties in the
construction and/or performance of the mix. Many of the
performance problems appeared to be related, at least
indirectly, to the construction methods used. In a few cases
construction was hampered by "sticky" mixes which can be
attributed to the added rubber. The stickiness appeared to
make joint construction difficult. This may have led to high
voids and contributed to early mix raveling. Other possible
causes of performance problems included: 1) incomplete
mixing, 2) excess or insufficient asphalt, 3) high voids, and
4) low P200 content.
47

The patent holder, All Seasons Surface Corporation,
claims that the cause of pavement performance problems prior
to 1983, was due to technology transfer. In the spring of , 1983, the first guide specification was developed and this
reportedly has solved most of the construction related
performance problems.
8) The de-icing characteristics expected gf a rubber-modified
asphalt have not been observed in most of the surveyed proj
ects. However, Tapley stopping distance tests by the Alaska
DOT Research Section showed an average reduction in icy-road
stopping distances of 25% on rubber-modified pavements for 23
test-days over a 3-year period. On nearly all of these days
no difference in surface ice was apparent by the visual wind
shield survey method. This demonstrates that test measure
ments are needed for other sites before conclusions can be
reached on ice-control benefits.
48
3.0 LABORATORY PROGRAM
This chapter. describes the test program used to evaluate the effect of
mix variations on properties of rubber-asphalt mixes. In particular, it
describes the following:
1) variables considered,
2) materials used and their preparation,
3) the types of tests and test procedures, and
4) specimen preparation techniques.
The project materials selected for evaluation for this study were from
the Lemon Road project in Juneau, Alaska. A description of the project,
together with related field test data, is given in Appendix B.
3.1 Variables Cbnsidered
To evaluate the· effect of mix variations on the behavior of rubber
asphalt mixture, it was necessary to first establish a list of variables to be
considered. Each variable was selected based on discussions with ADOTPF and
on a critical review of the literature. The test variables considered for
this study are given in Table 3.1.
Variations in void content were selected to see if one could produce
acceptable mixes at higher void contents. Two percent (normally recommended)
and 2-10% (normally obtained in the field) were selected for study. Rubber
contents of 2% and 3% were also selected to determine their effects on optimum
asphalt content, resilient modulus, and fatigue life. The existing rubber
gradation employed is a mixture of 20% fine (- #40) and 80% coarse rubber (#40
x 1/4 in.). Increasing the amount of fine rubber to 40% and 100% of total
rubber may increase the potential for improving some of the mix properties,
such as fatigue. Mix temperatures of 190°C (375°F) and 218°C (425°F) were
considered. By increasing the mix temperature there is increased potential
for dissolving some of the finer rubber into the asphalt. This interaction
may improve resilient modulus or fatigue life. The high mixing temperature
and lowered compaction temperature simulates the effects of cooling during a
long haul and placement. One compaction temperature 129°C (265°F) was
selected. However, to obtain 4% void content in the mix, the compaction
temperature, as well as compaction effort (normally 50 blows), were lowered to
49
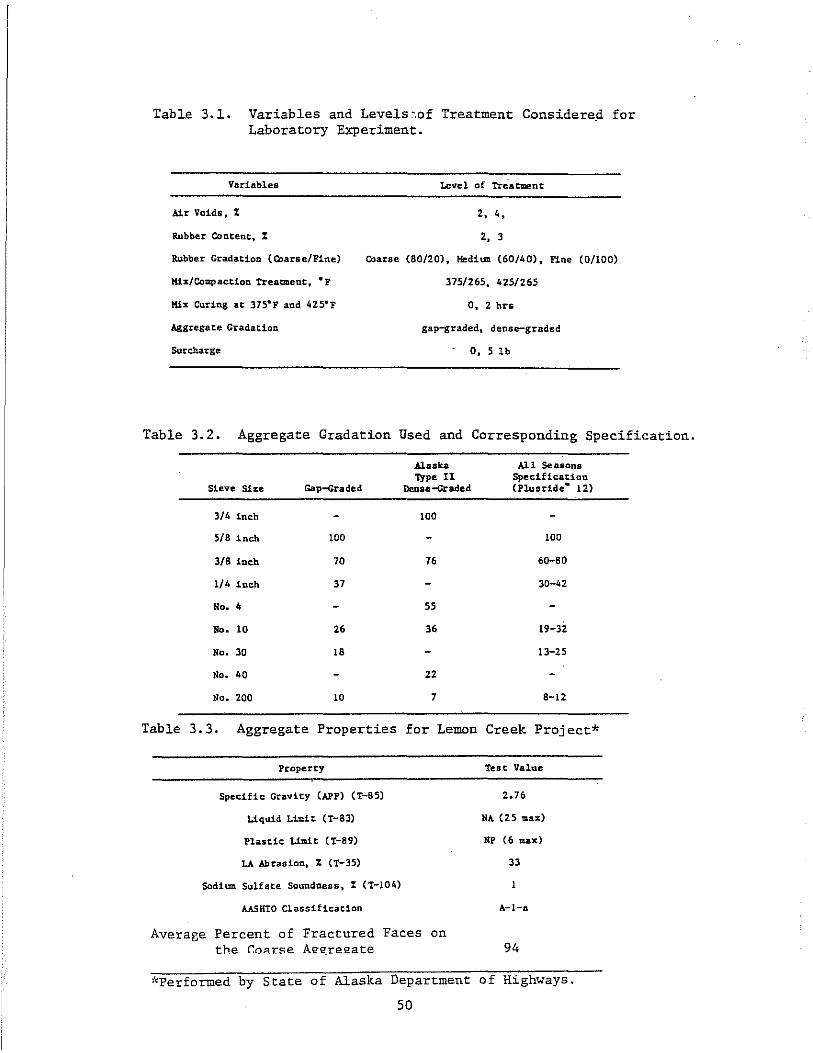
Table 3.1. Variables and Levels '.of Treatment Cons ide rep' for Laboratory Experiment.
Variables Level of Treaement
Air Voids, % 2, 4,
Rubber Content, % 2, 3
Rubber Gradation (Coarse/Fine) Coarse (80/20), Hedilm (60/40). Fine (0/100)
Mix/Compaction Treatment, .p 375/265, 425/265
0, 2 hrs
Aggregace Gradation gap-graded, dense-graded
Surcharge D. 5 Ib
Table 3.2. Aggregate Gradation Used and Corresponding Specification.
Alaska All SeasoDs Type II Specification
Sieve Size Gap-Graded Denaa-Graded (Pluaride- 12)
3/4 inch 100
5/8 inch 100 100
3/8 inch 70 76 60-80
1/4 inch 37 30-42
No. 4 55
No. 10 26 36 19-32
No. 30 18 13-25
No. 40 22
No. 200 10 7 8-12
Table 3.3. Aggregate Properties for Lemon Creek Project*
Propercy
Spec1fic: Gravity (APP) (T-85)
Liquid Lim! t. (T-83)
Plascic Limit (T-89)
LA Abrasion, % (t-35)
Sodium. Sulfate Soundness, % (T-104)
AASHIO Classification
Averar,e Percent of Fractured Faces on the r:OR.r.se Aggr.eeate
Test Value
2.76
NA (25 max)
NP (6 max)
33
A-I-a
94
;'Performed by State of Alaska Department of Highways.
50
99°C (210°F) and 10 blows, respectively. TWo mix curing periods (0 and 2
hours) were also selected for study to determine whether increased curing or
"reaction time" can impart any beneficial effects. TWo aggregate gradations
were used to perform the tests. These are the recommended aggregate gradation
by Plusride (gap-graded) and the mid-band gradation used for conventional
asphalt mixes (see Table 3.2).
3.2 Description of 11aterials
3.2.1 Aggregate
The aggregates were obtained from the actual source used for the Lemon
Read project in Juneau, Alaska. Aggregate processing operations were started
by drying the aggregate to a constant weight. Then the aggregates were sieved
in the following sizes: 3/4"x5/S", 5/S"x3/S", 3/S"x1/4", 1/4"x4, 4xB, Sx16,
l6x30, 3Ox50, 5Ox100, and -100. The different size fractions of the aggre
gates were stored in separate containers. Tables 3.2 and 3.3 include the
gradations and properties of aggregate which were used in making the labora
tory samples of rubber asphalt mixtures.
3.2.2 Asphalt
The paving grade asphalt generally used in the project area was
selected. For this study, an AC-5 produced by Chevron USA's Richmond Beach
Refinery was used. Its physical properties are given in Table 3.4.
Also, Rostler-Sternberg composition data for that AC-5 were determined
based on former ASTM procedure D2006, which is described in reference
(47,4S,50). The procedure entails the removal of asphaltenes with reagent
grade n-pentane and stepwise precipitation of the components (nitrogen bases,
first and second acidiffins, and paraffins) from the maltenes with sulfuric
acid. The test results for the Restler-Sternberg analyses are presented in
Table 3.5. This table shows the amount of individual chemical components.
This is important for identification purposes, but relatively unimportant in
determining behavior of asphalts. Of importance is the combined effect of
these components and their interrelationship. One such relationship is the
ratio of the two more reactive components to the two less reactive components
expressed by the Rostler parameter (N+A1)/(P+Az)' In previous studies, this
parameter has been shown to be a decisive factor in identifying embrittlement
S1
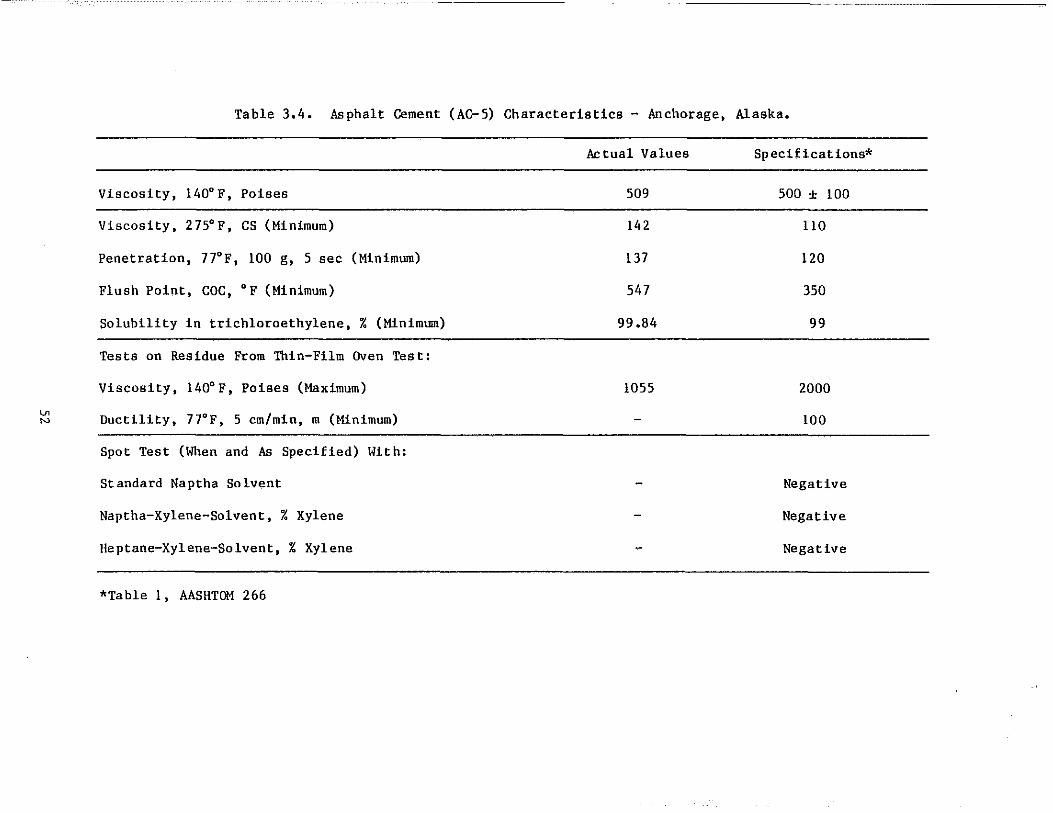
1ft N
Ta ble 3.4. As phalt Cement (AC- 5) Characteristics - Anchorage, Alaska.
Ac tual Values Specifications*
Viscosity, 140°F, Poises 509 500 ± 100
Viscosity. 275°F, CS (Minimum) 142 110
Penetration, 77°F, 100 g, 5 sec (Minimum) 137 120
Flush Point, CDC, of (Minimum) 547 350
Solubility in trichloroethylene, % (Minimum) 99.84 99
Tests on Residue From Thin-Film Oven Tes t:
Viscosity, 140°F, Poises (Maximum) 1055 2000
Ductility, 77°F, 5 cm/min, m (Minimum) 100
Spot Test (When and As Specified) With:
Standard Naptha Solvent Negative
Naptha-Xylene-Solvent, % Xylene Negative
Heptane-Xylene-Solvent, % Xylene Negative
*Table I, AASHTOM 266
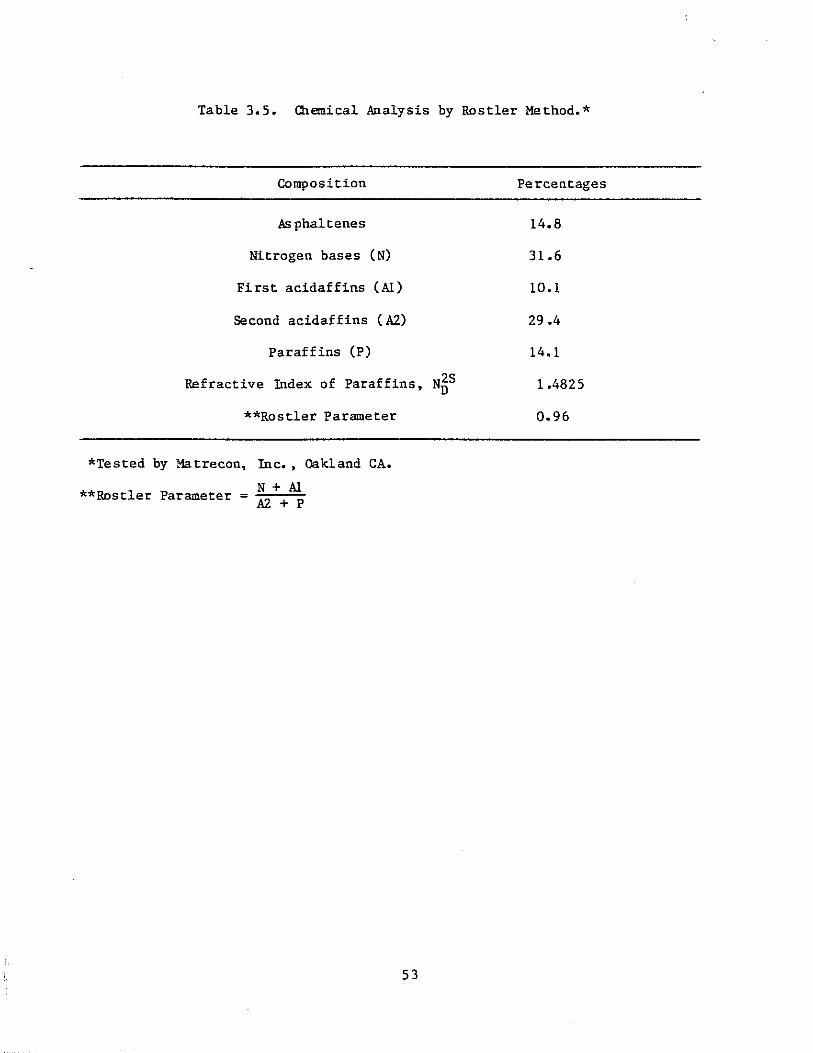
Table 3.5. Chemical Analysis by Rostler Method.*
Composition
As phaltenes
Nitrogen bases (N)
First acidaffins (Al)
Second acidaffins (A2)
Paraff ins (P)
Refractive Index of Paraffins, N~S
**Rostler Parameter
*Tested by Matrecon, Inc., Oakland CA.
N + Al **Rostler Parameter = ~~~ A2 + P
53
Pe rcentages
14.8
31.6
10.1
29.4
14.1
1.4825
0.96
of asphalts in aging, as measured by the Pellet abrasion test and also shown
to relate to field performance (50,51,52).
The purpose of the behavior parameters is to determine that two asphalts
can be expected to perform alike in service. In this regard, they need not be
chemically identical as long as the Rostler parameter is the same. Asphalts
which are identical should behave alike. Others, which differ in one or more
identity characteristics but have the same Rostler parameter, should also
perform the same (50).
3.2.3 Rubber
Recycled rubber was obtained from Rubber Granulators in Everett, Washing
ton for use in the study. The samples were sieved using 1 to 2% talcum powder
to reduce tackiness on the following sizes: 1/4"x4, 4x10, 1Ox20, 2Ox40,
40XSO, and -50. The talcum powder was removed by sieving the fine rubber (-
50) through a No. 200 sieve. The different size fractions of the rubbers were
stored in separate containers. The rubber properties and gradations are given
in Tables 3.6.a and 3.6.b.
3.3 LaboratoEZ Test Procedures and EquiE!!!ent
The two general types of tests used in this study were:
1) mix design tests, and
2) mix properties tests.
Each of these different types of tests are summarized in Table 3.7. The
follOwing sections describe the procedures and equipment used in performing
each of these tests.
3.3.1 Mix Design Tests
The Marshall mix design procedure was used as part of this study. The
samples were prepared using the standard Alaska DOTPF procedure (T-17). This
method is the 50-blow Marshall procedure. The aggregates were sieved to
different sizes and stored in separate containers. To ensure hot and dry mix,
the aggregates were placed in an oven at a temperature of 190°C (375°F) for at
least 12 hours. The aggregates were weighed into separate pans for each test
specimen and then blended by the appropriate fractional size to a 1100-gram
sample. The asphalt was heated to 135°C (275°F) prior to mixing. Previously
54
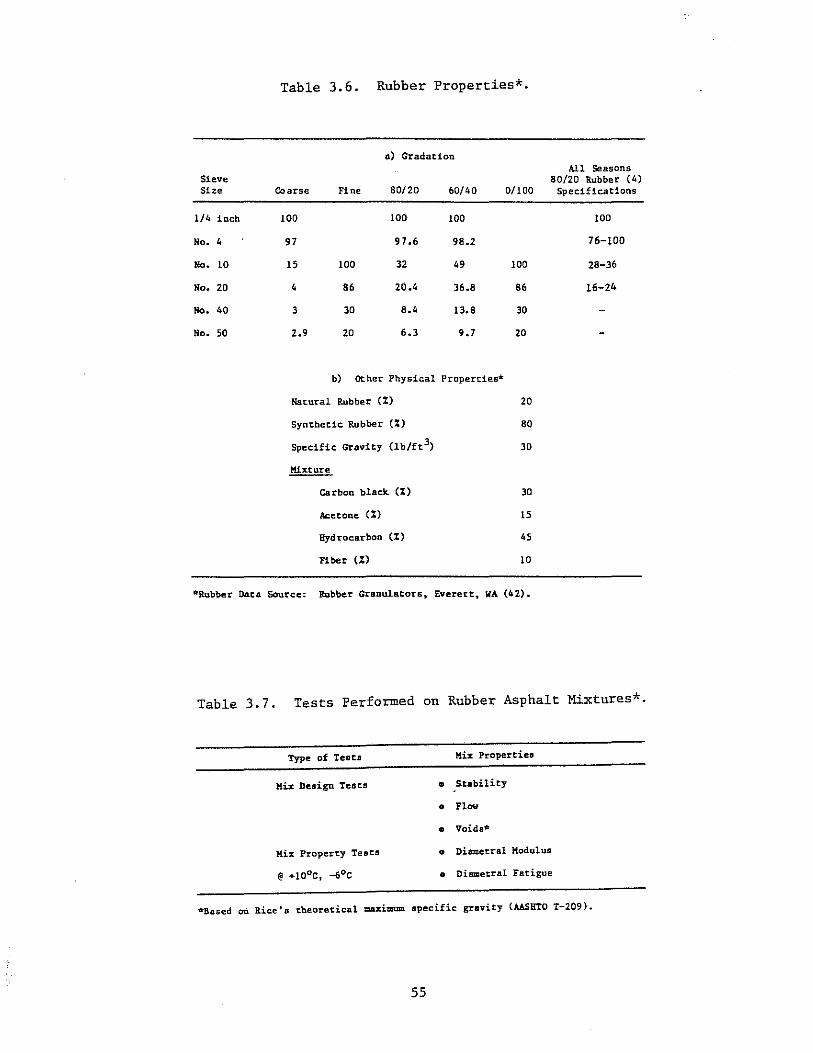
Sieve She
1/4 inch
No. 4
No. 10
No. 20
No. 40
No. 50
Table 3.6. Rubber Properties*.
0) Gradation
Coarse Fine 80/20 60/40
100 100 100
97 97.6 98.2
15 100 32 49
4 86 20.4 36.8
3 30 8.4 13.8
2.9 20 6.3 9.7
b) Other Physical Properties*
Na~ural Rubber (X)
Syn~hetlc Rubber (X)
Specific Gravity (lb/ft3)
Mixture
Carbon black. (%)
Acetone (X)
Hydrocarbon (X)
Fiber (%J
0/100
100
86
30
20
20
80
30
30
15
45
10
All Seasons 80/20 Rubber (4)
Specifications
100
76-100
28-36
16-24
-Rubber Data Source: Rubber Granulators, Everett~ WA (42).
Table 3.7. Tests Performed on Rubber Asphalt Mixtures*.
Type of Teats Hi% Propertiea
Mix Design Teata • .Stability
• Flow
• Voids*
Mix Property Tests • Diametral Modulus
o Diametral Fatigue
*Sased on Rice's theoretical =aximum specific gravity (AASHTO I-209).
55
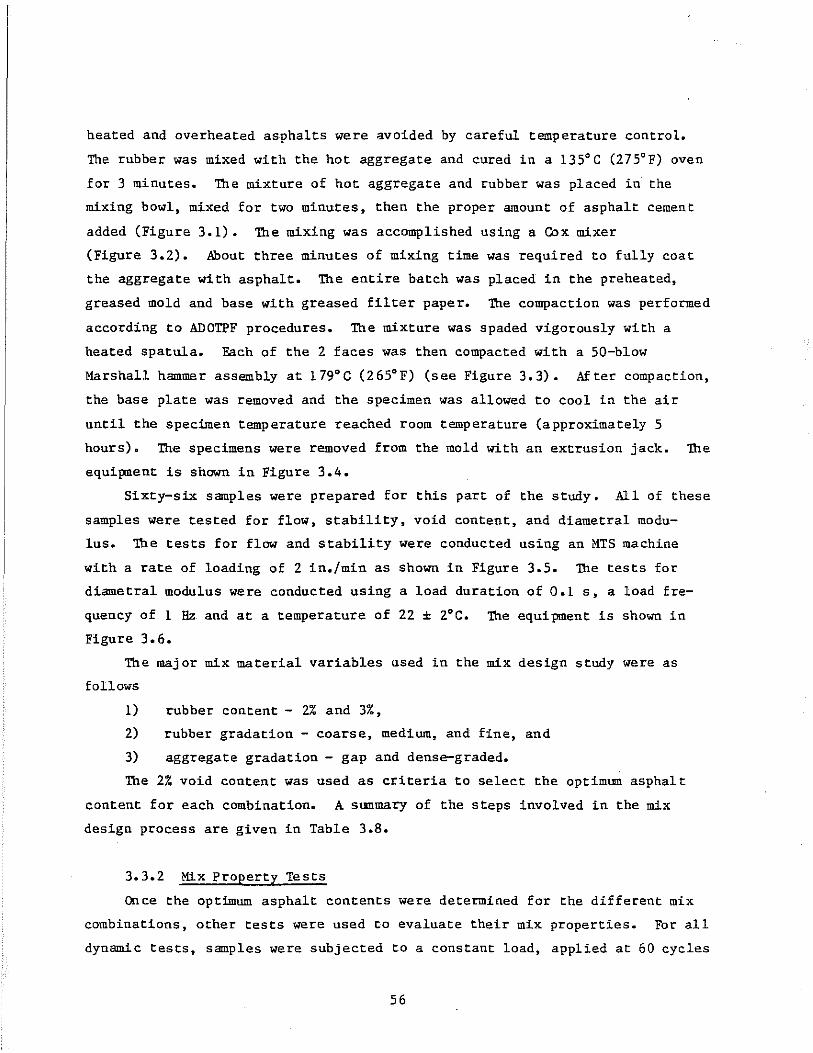
heated and overheated asphalts were avoided by careful temperature control.
The rubber was mixed with the hot aggregate and cured in a 13SoC (27S0F) oven
for 3 minutes. The mixture of hot aggregate and rubber was placed in' the
mixing bowl, mixed for two minutes, then the proper amount of asphalt cement
added (Figure 3.1). The mixing was accomplished using a Cox mixer
(Figure 3.2). About three minutes of mixing time was required to fully coat
the aggregate with asphalt. The entire batch was placed in the preheated,
greased mold and base with greased filter paper. The compaction was performed
according to ADOTPF procedures. The mixture was spaded vigorously with a
heated spatula. Each of the 2 faces was then compacted with a SO-blow
Marshall hammer assembly at 179°C (26S0F) (see Figure 3.3). After compaction,
the base plate was removed and the specimen was allowed to cool in the air
until the specimen temperature reached room temperature (approximately S
hours). The specimens were removed from the mold with an extrusion jack. The
equipment is shown in Figure 3.4.
Sixty-six samples were prepared for this part of the study. All of these
samples were tested for flow, stability, void content, and diametral modu
lus. The tests for flow and stability were conducted using an MIS machine
with a rate of loading of 2 in./min as shown in Figure 3.S. The tests for
diametral modulus were conducted using a load duration of 0.1 s, a load fre
quency of 1 Hz and at a temperature of 22 ± 2°C. The equipment is shown in
Figure 3.6.
The major mix material variables used in the mix design study were as
follows
1) rubber content - 2% and 3%,
2) rubber gradation - coarse, medium, and fine, and
3) aggregate gradation - gap and dense-graded.
The 2% void content was used as criteria to select the optimum asphalt
content for each combination. A summary of the steps involved in the mix
design process are given in Table 3.8.
3.3.2 Mix Property Tests
Once the optimum asphalt contents were determined for the different mix
combinations, other tests were used to evaluate their mix properties. For all
dynamic tests, samples were subjected to a constant load, applied at 60 cycles
56
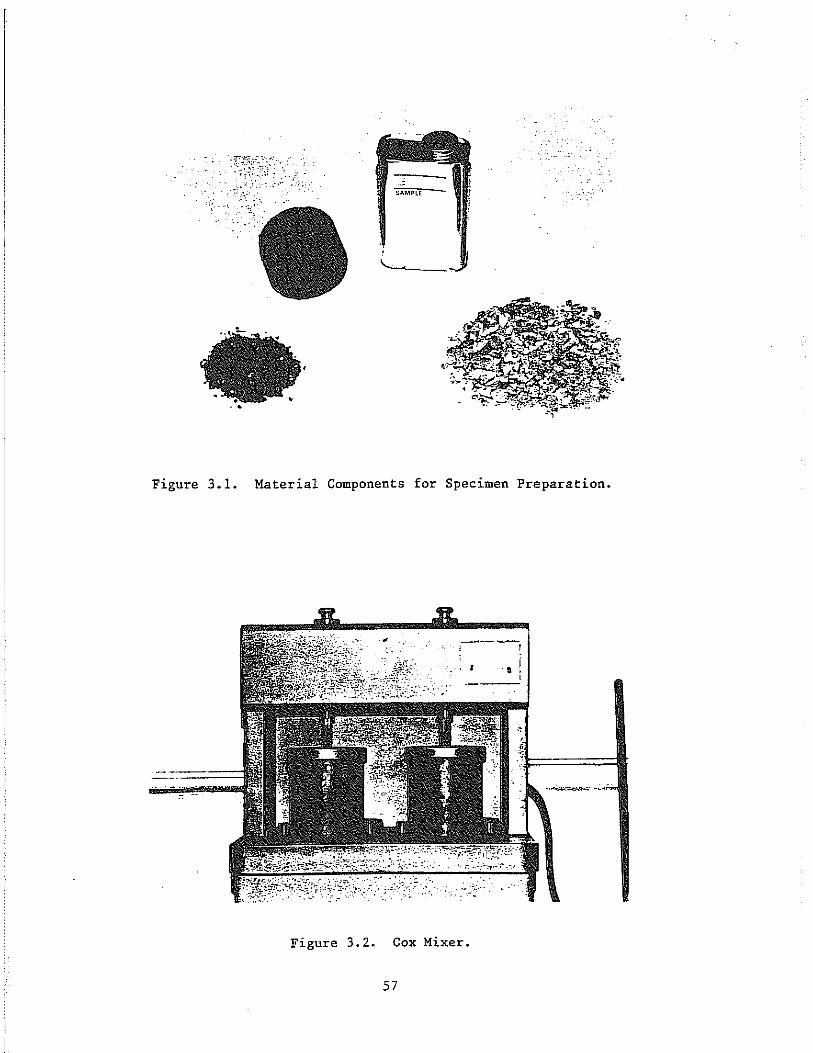
Figure 3.1. Material Components for Specimen Preparation.
-----,
" .,! I
Figure 3.2. Cox Mixer.
57
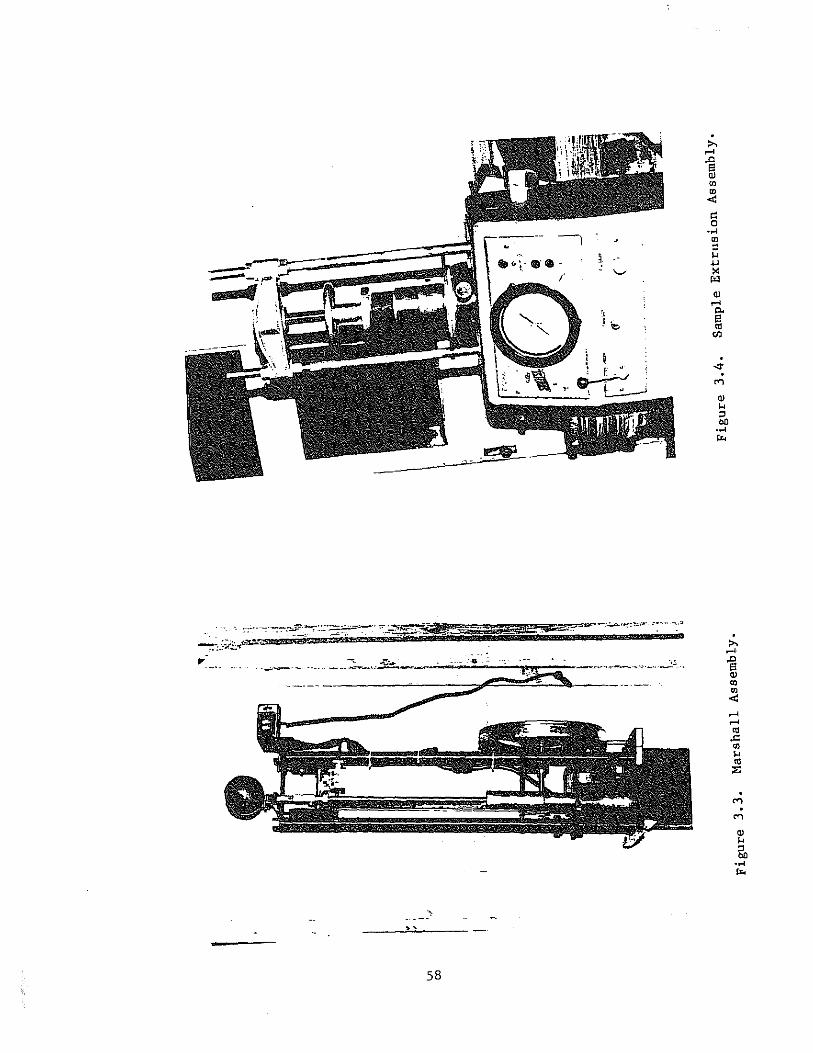
» ..... ~ Q)
'" UJ <t:
0: 0 ..... UJ ::l
l ... ... '-' ><
~
Q) .....
:1 "'" J;e i3
'" CIl
... ""' Q) ... ::l OIl ..... '" .~
-;;,
58
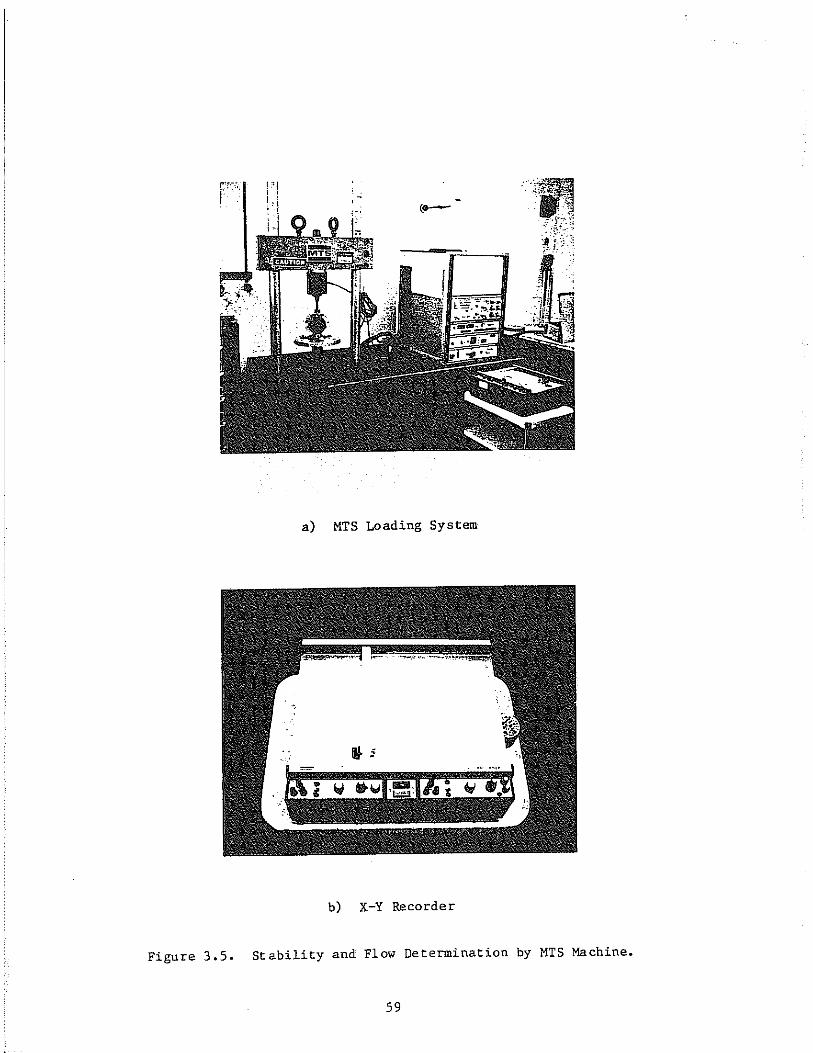
a) MTS Loading System
b) X-Y Recorder
Figure 3.5. Stability and Flow Determination by MTS Machine.
59
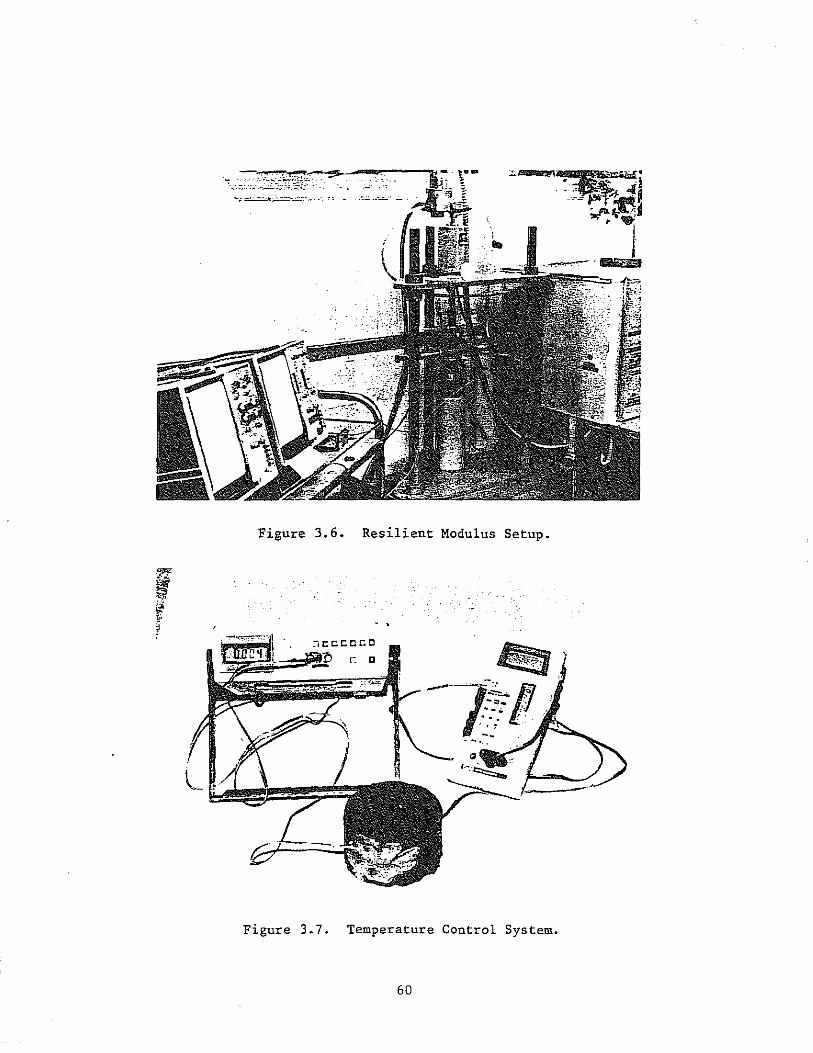
Figure 3.6. Resilient Modulus Setup.
:;cct:Cc.c
r: "
Figure 3.7. Temperature Control System.
60
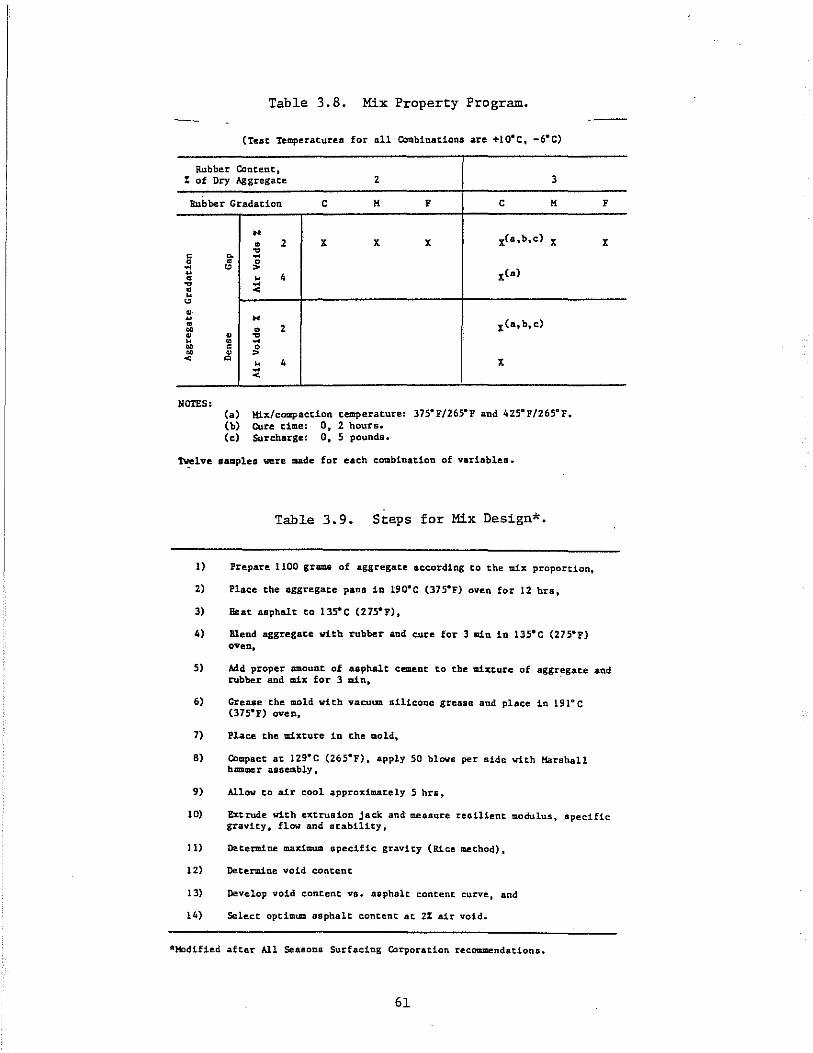
Table 3.8. Mix Property Program.
(Test Temperatures for all Co=bioatlona are +lO·C, -6·C)
Rubber Content, % of Dry Aggregate 2 3
Rubber Gradation C II F C II
.. X(a,b.c) • 2 X X X X
'" c ~ ~ 0 • g ~ " xC a) u
" 4 • '" ::i • " " • .. u X(a,b,c) • • 2 "" • • '" " • ~
" C Q .. • ,. < Q
" 4 X ~
<
NOTES: Ca) Cb) Ce)
Hix!coazpaction t.emperat.ure: 375- F/265°P and 425- F1265° F. Cure time: 0, 2 hours. Surcharge: O. 5 pounds.
Twelve samples were made for each combination of variables.
Table 3.9. Steps for Mix Design*.
1) Prepare 1100 grams of aggregate according to the ~x proportion.
2) Place the aggregate pans in 190·C (37S·F) oven for 12 hrs.
3) Beat asphalt to 13S·C (27S0F),
4) Blend aggregate with rubber and cure for 3 min in 13S·C (275°F) oven,
F
X
5) Add proper amount. of Asphalt cement to the mixt.ure of aggr~gate and rubber and adx for 3 Illin.
6) Grease the mold with vacuum silicone grease Bnd place in 191 G C (37S·F) oven.
7) Place the mixture in the mold,
8) Compact at 1Z9a C (26SaF), apply 50 blows per side with Harshall bDmmer assembly.
9) Allow to air cool approximately 5 hrs,
10) Extrude with extrusion jack and measure resilient modulus, speCific gravity, flow and stability.
J 1) Determine maximum speCific gravity (R1.ce method),
1Z) Determine void content
13) Develop void content vs. asphalt content curve. and
14) Select optimum asphalt content at Z% air void.
*Hcdified after All Seaaons Surfacing COrporation recommendations.
61
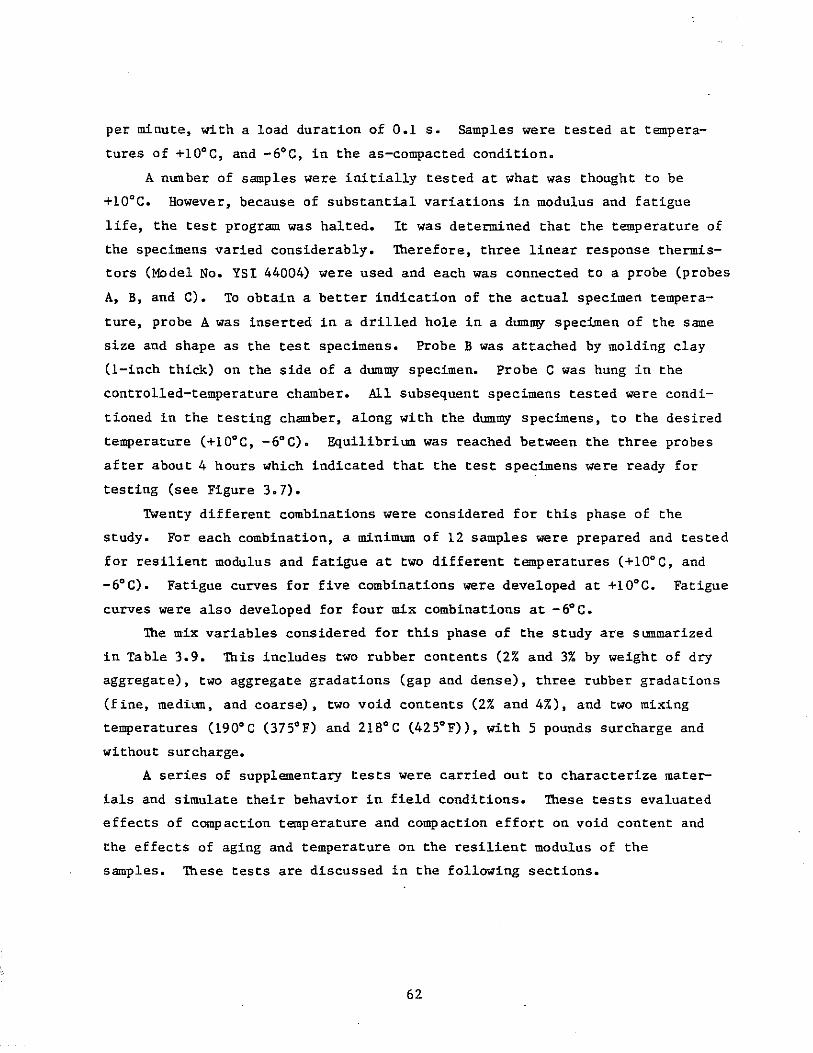
per minute, with a load duration of 0.1 s. Samples were tested at tempera
tures of +10°C, and -6°C, in the as-compacted condition.
A number of samples were initially tested at what was thought to be
+10°C. However, because of substantial variations in modulus and fatigue
life, the test program was halted. It was determined that the temperature of
the specimens varied considerably. Therefore, three linear response thermis
tors (Model No. YSI 44004) were used and each was connected to a probe (probes
A, B, and C). To obtain a better indication of the actual specimen tempera
ture, probe A was inserted in a drilled hole in a dummy specimen of the same
size and shape as the test specimens. Probe B was attached by molding clay
(I-inch thick) on the side of a dummy specimen. Probe C was hung in the
controlled-temperature chamber. All subsequent specimens tested were condi
tioned in the testing chamber, along with the dummy specimens, to the desired
temperature (+10°C, -6°C). Equilibrium was reached between the three probes
after about 4 hours which indicated that the test specimens were ready for
testing (see Figure 3.7).
TWenty different combinations were considered for this phase of the
study. For each combination, a minimum of 12 samples were prepared and tested
for resilient modulus and fatigue at two different temperatures (+10°C, and
-6°C). Fatigue curves for five combinations were developed at +10°C. Fatigue
curves were also developed for four mix combinations at -6°C.
The mix variables considered for this phase of the study are summarized
in Table 3.9. This includes two rubber contents (2% and 3% by weight of dry
aggregate), two aggregate gradations (gap and dense), three rubber gradations
(fine, medium, and coarse), two void contents (2% and 4%), and two mixing
temperatures (190·C (375°F) and 21BoC (425°F», with 5 pounds surcharge and
without surcharge.
A series of supplementary tests were carried out to characterize mater
ials and simulate their behavior in field conditions. These tests evaluated
effects of compaction temperature and compaction effort on void content and
the effects of aging and temperature on the resilient modulus of the
samples. These tests are discussed in the following sections.
62
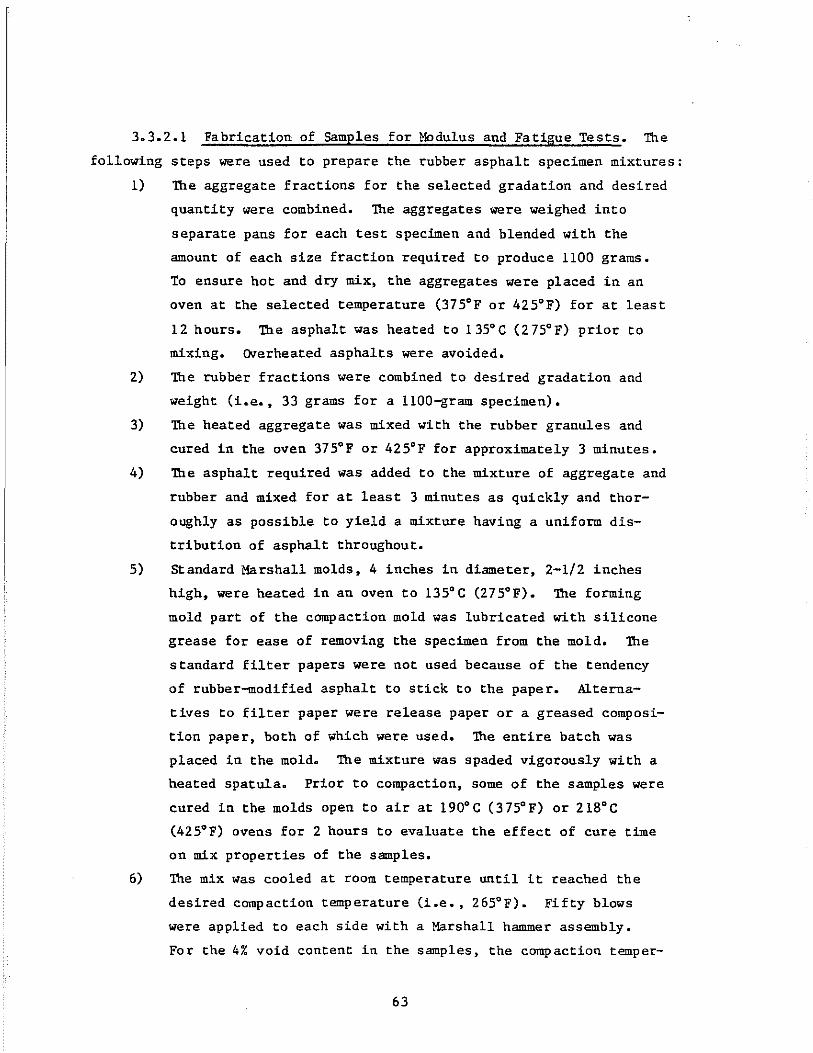
3.3.2.1 Fabrication of Samples for Modulus and Fatigue Tests. The
following steps were used to prepare the rubber asphalt specimen mixtures:
1) The aggregate fractions for the selected gradation and desired
quantity were combined. The aggregates were weighed into
separate pans for each test specimen and blended with the
amount of each size fraction required to produce 1100 grams.
To ensure hot and dry mix, the aggregates were placed in an
oven at the selected temperature (375°F or 425°F) for at least
12 hours. The asphalt was heated to 135°C (275°F) prior to
mixing. Overheated asphalts were avoided.
2) The rubber fractions were combined to desired gradation and
weight (i.e., 33 grams for a 1100-gram specimen).
3) The heated aggregate was mixed with the rubber granules and
cured in the oven 375°F or 425°F for approximately 3 minutes.
4) The asphalt required was added to the mixture of aggregate and
rubber and mixed for at least 3 minutes as quickly and thor
oughly as possible to yield a mixture having a uniform dis
tribution of asphalt throughout.
5) Standard Marshall molds, 4 inches in diameter, 2-1/2 inches
high, were heated in an oven to 135°C (275°F). The forming
mold part of the compaction mold was lubricated with silicone
grease for ease of removing the specimen from the mold. The
standard filter papers were not used because of the tendency
of rubber-modified asphalt to stick to the paper. Alterna
tives to filter paper were release paper or a greased composi
tion paper, both of which were used. The entire batch was
placed in the mold. The mixture was spaded vigorously with a
heated spatula. Prior to compaction, some of the samples were
cured in the molds open to air at 190°C (375°F) or 218°C
(425°F) ovens for 2 hours to evaluate the effect of cure time
on mix properties of the samples.
6) The mix was cooled at room temperature until it reached the
desired compaction temperature (i.e., 265°F). Fifty blows
were applied to each side with a Marshall hammer assembly.
For the 4% void content in the samples, the compaction temper-
63
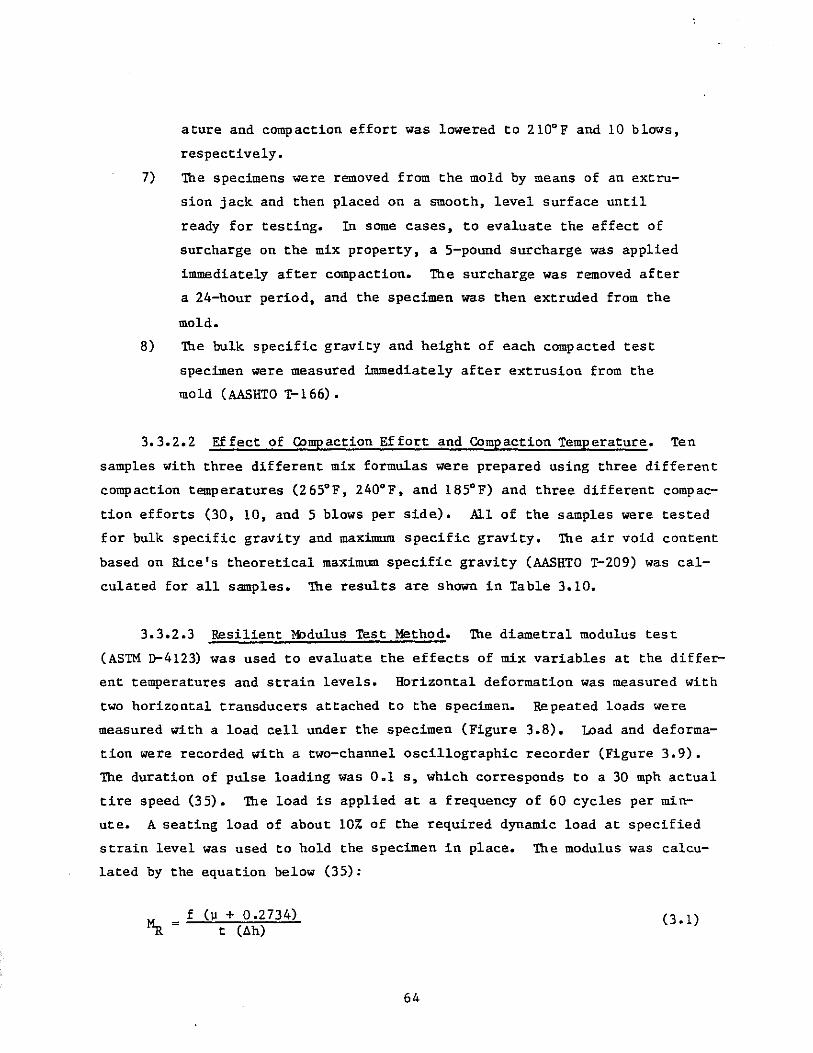
ature and compaction effort was lowered to 210°F and 10 blows,
respectively.
7) The specimens were removed from the mold by means of an extru
sion jack and then placed on a smooth, level surface until
ready for testing. In some cases, to evaluate the effect of
surcharge on the mix property, a 5-pound surcharge was applied
immediately after compaction. The surcharge was removed after
a 24-hour period, and the specimen was then extruded from the
mold.
8) The bulk specific gravity and height of each compacted test
specimen were measured immediately after extrusion from the
mold (AASHTO T-166).
3.3.2.2 Effect of Cbrnpaction Effort and Cbmpaction Temperature. Ten
samples with three different mix formulas were prepared using three different
compaction temperatures (265°F, 240°F, and 185°F) and three different compac
tion efforts (30, 10, and 5 blows per side). All of the samples were tested
for bulk specific gravity and maximum specific gravity. The air void content
based on Rice's theoretical maximum specific gravity (AASHTO T-209) was cal
culated for all samples. The results are shown in Table 3.10.
3.3.2.3 Resilient Modulus Test Method. The diametral modulus test
(ASTM 0-4123) was used to evaluate the effects of mix variables at the differ
ent temperatures and strain levels. Horizontal deformation was measured with
two horizontal transducers attached to the specimen.
measured with a load cell under the specimen (Figure
Repeated loads were
3.8). Load and deforma-
tion were recorded with a two-channel oscillographic recorder (Figure 3.9).
The duration of pulse loading was 0.1 5, which corresponds to a 30 mph actual
tire speed (35). The load is applied at a frequency of 60 cycles per min
ute. A seating load of about 10% of the required dynamic load at specified
strain level was used to hold the specimen in place. The modulus was calcu
lated by the equation below (35):
f (~ + 0.2734) ~ = t (8h)
64
(3.1)
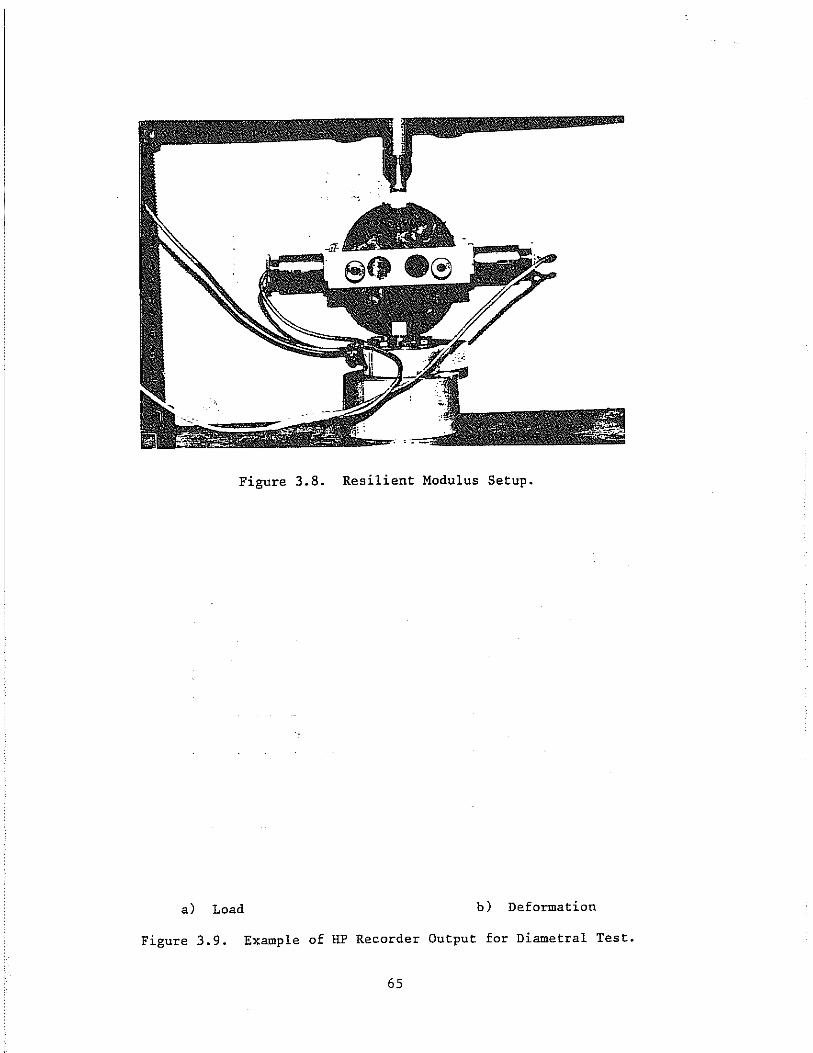
Figure 3.8. Resilient Modulus Setup.
a) Load b) Deformation
Figure 3.9. Example of HP Recorder Output for Diametral Test.
65
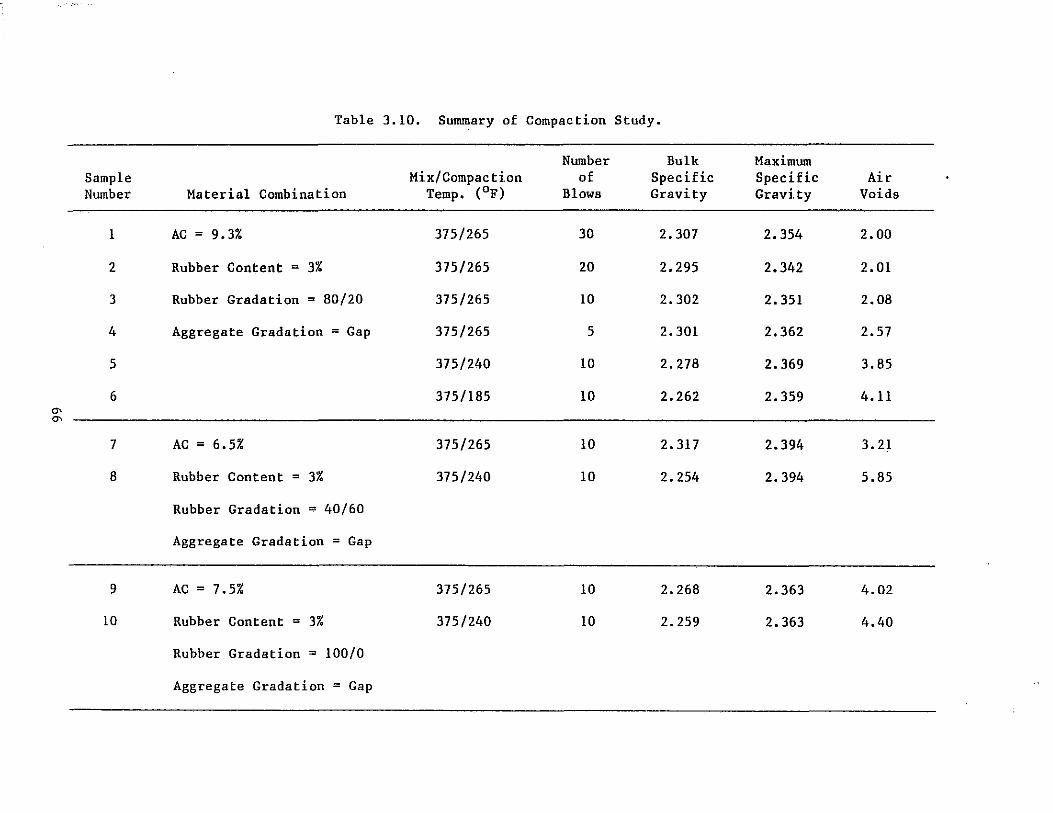
Table 3.10. Summary of Compaction Study.
Number Bulk Maximum Sample Mix/Compaction of Specific Specific Air Number Material combination Temp. (OF) Blows Gravity Gravity Voids
1 AC = 9.3% 375/265 30 2.307 2.354 2.00
2 Rubber Content = 3% 375/265 20 2.295 2.342 2.01
3 Rubber Gradation = 80/20 375/265 10 2.302 2.351 2.08
4 Aggregate Gradation = Gap 375/265 5 2.301 2.362 2.57
5 375/240 10 2.278 2.369 3.85
6 375/185 10 2.262 2.359 4.11 a-a-
7 AC = 6.5% 375/265 10 2.317 2.394 3.21
8 Rubber Content = 3% 375/240 10 2.254 2.394 5.85
Rubber Gradation = 40/60
Aggregate Gradation = Gap
9 AC = 7.5% 375/265 10 2.268 2.363 4.02
10 Rubber Content = 3% 375/240 10 2.259 2.363 4.40
Rubber Gradation = 100/0
Aggregate Gradation = Gap
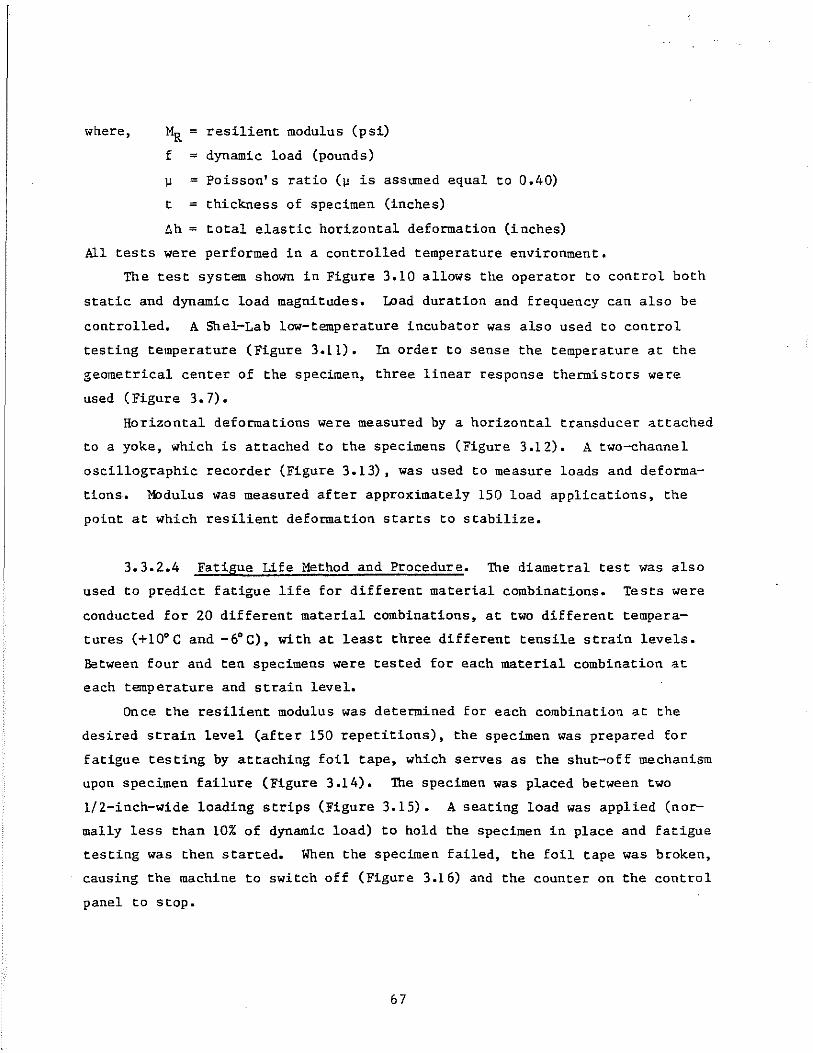
where, t~ = resilient modulus (psi)
f = dynamic load (pounds)
II = Poisson's ratio (ll is asstnned equal to 0.40)
t = thickness of specimen (inches)
th = total elastic horizontal deformation (inches)
All tests were performed in a controlled temperature environment.
The test system shown in Figure 3.10 allows the operator to control both
static and dynamic load magnitudes. Load duration and frequency can also be
controlled. A Shel-Lab low-temperature incubator was also used to control
testing temperature (Figure 3.11). In order to sense the temperature at the
geometrical center of the specimen, three linear response thermistors were
used (Figure 3.7).
Horizontal deformations were measured by a horizontal transducer attached
to a yoke, which is attached to the specimens (Figure 3.12). A two-channel
oscillographic recorder (Figure 3.13), was used to measure loads and deforma
tions. Modulus was measured after approximately 150 load applications, the
point at which resilient deformation starts to stabilize.
3.3.2.4 Fatigue Life Method and Procedure. The diametral test was also
used to predict fatigue life for different material combinations. Tests were
conducted for 20 different material combinations, at two different tempera
tures (+10°C and -6°C), with at least three different tensile strain levels.
Between four and ten specimens were tested for each material combination at
each temp erature and strain level.
Once the resilient modulus was determined for each combination at the
desired strain level (after 150 repetitions), the specimen was prepared for
fatigue testing by attaching foil tape, which serves as the shut-off mechanism
upon specimen failure (Figure 3.14). The specimen was placed between two
1/2-inch-wide loading strips (Figure 3.15). A seating load was applied (nor
mally less than 10% of dynamic load) to hold the specimen in place and fatigue
testing was then started. When the specimen failed, the foil tape was broken,
causing the machine to switch off (Figure 3.16) and the counter on the control
panel to stop.
67
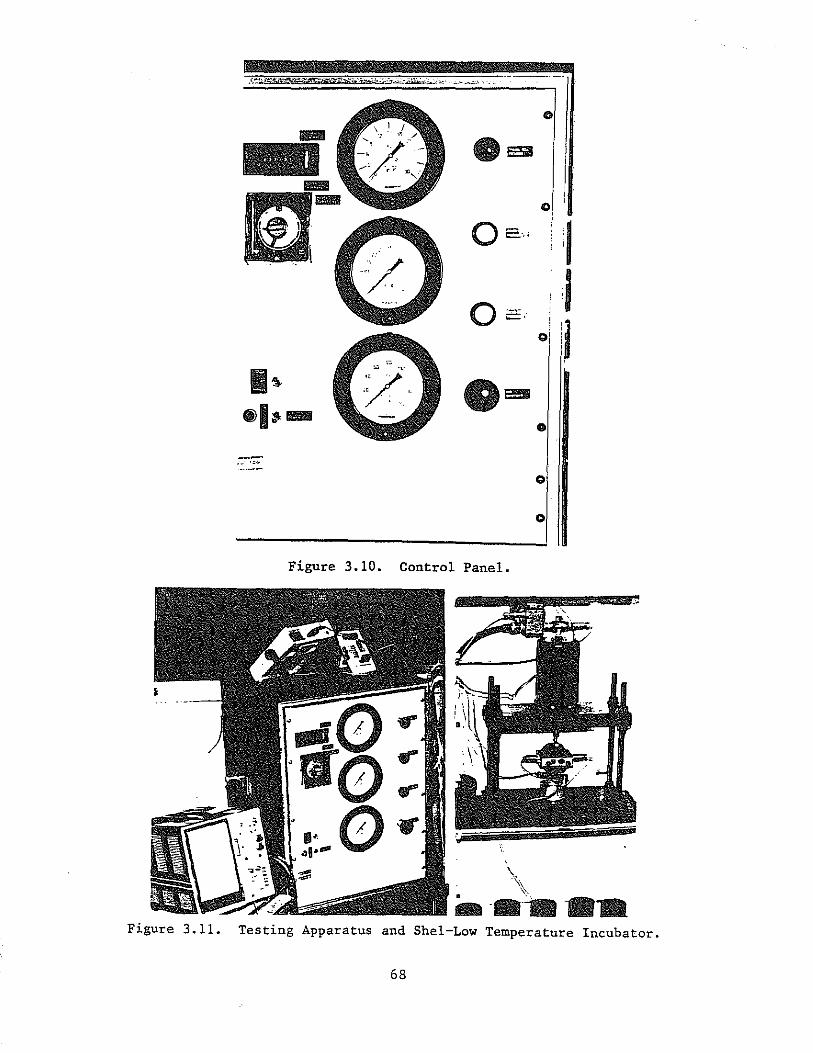
-.;~ .~",
ee;;
OE"
o ;:::,
o
Figure 3.10. Control Panel.
, \
" \ .-.••• Figure 3.11. Testing Apparatus and She1-Low Temperature Incubator.
68
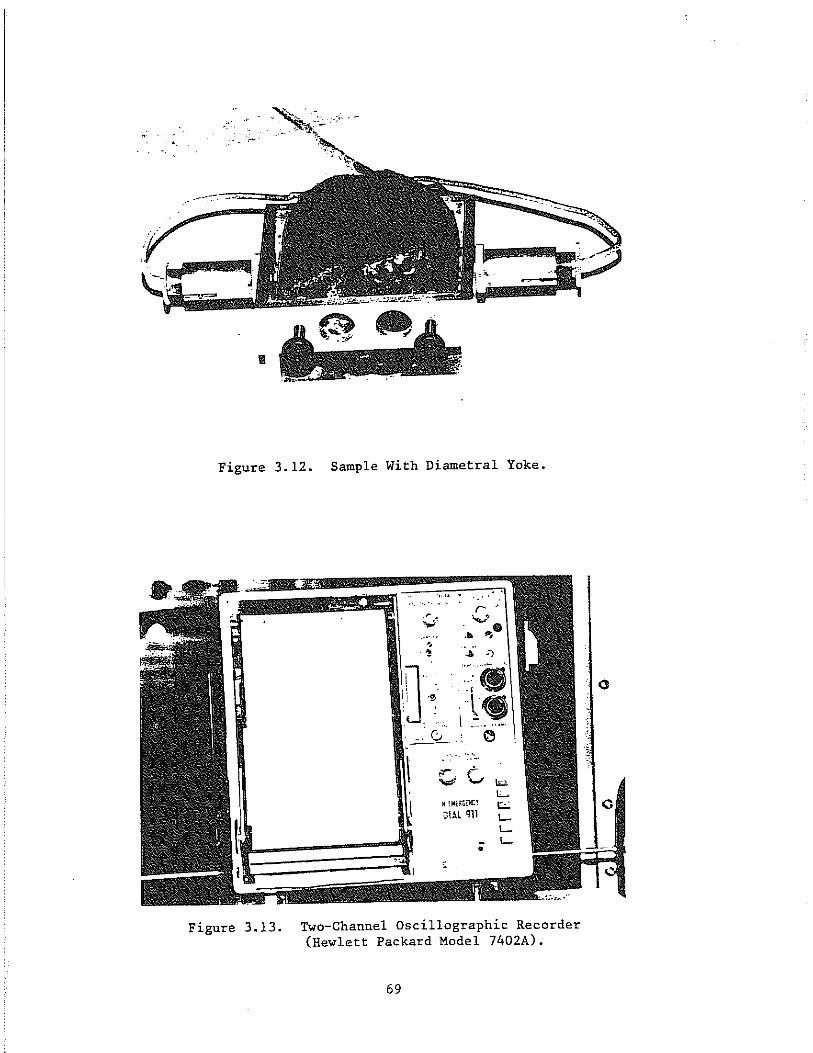
Figure 3.12. Sample With Diametral Yoke.
H ,MUWlt!
JIAl em
Figure 3.13. Two-Channel Oscillographic Recorder (Hewlett Packard Model 7402A).
69
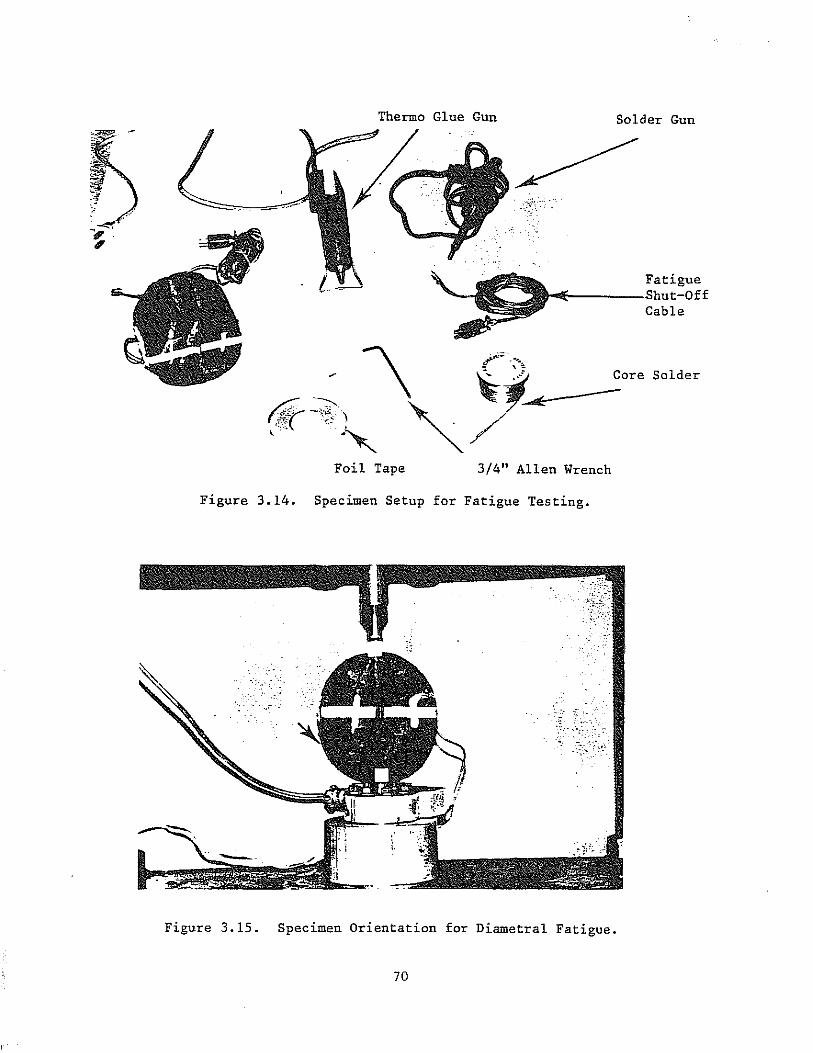
Thermo Glue Gun Solder Gun
Fatigue ~~------~htlt-Cff
Cable
Foil Tape 3/4" Allen Wrench
Figure 3.14. Specimen Setup for Fatigue Testing.
Figure 3.15. Specimen Orientation for Diametral Fatigue.
70
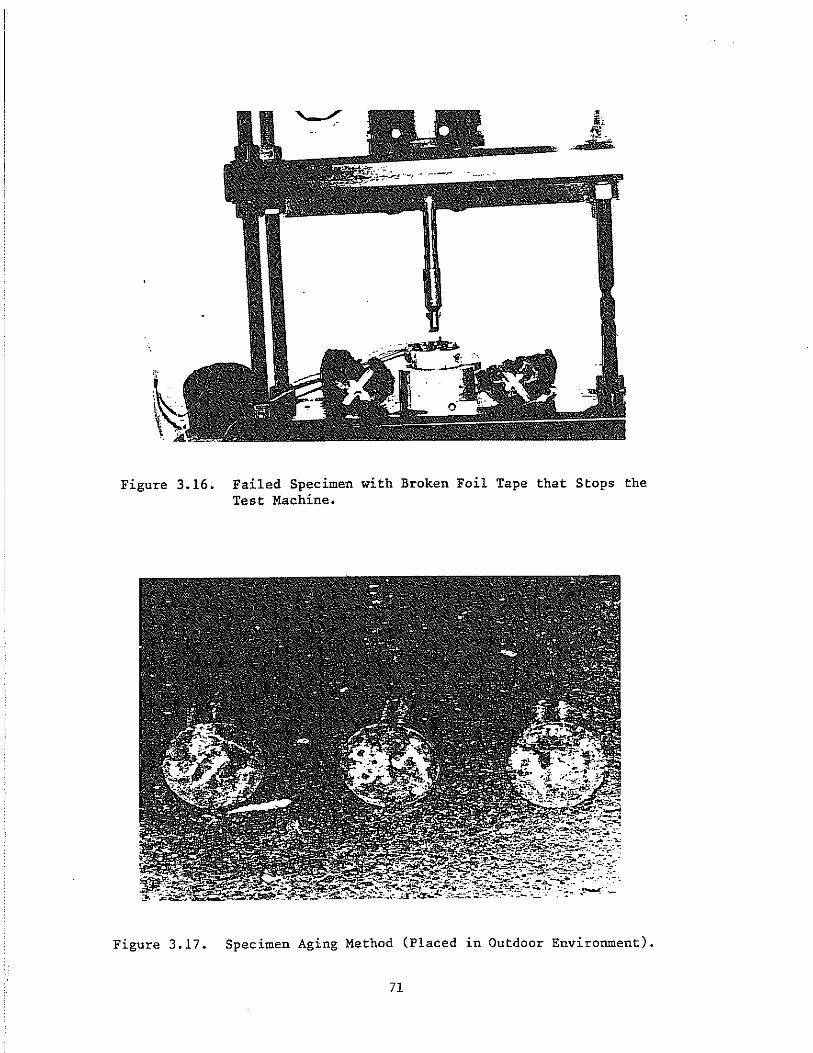
i:-. ~-7 -
Figure 3.16. Failed Specimen with Broken Foil Tape that Stops the Test Machine.
Figure 3.17. Specimen Aging Method (Placed in Outdoor Environment).
71
3.3.2.5 Specimen Aging Method. Eighteen samples were prapared to evalu
ate the effect of aging on the modulus of rubbarized asphalt mixtures. All
samples were fabricated using the method described in the previous section.
All samples were· tested at +lOoC and 100 micros train immediately after fabri
cation (no aging). Then the samples were placed in an outdoor environment
conditions (35°F at night and 55°F during daytime (Figure 3.17». Each sample
was aged for 4 months. Four resilient modulus readings were taken every
month.
3.4 Summary
To evaluate the effect of mix variations on the behavior of rubber
modified asphalt, 20 different mix combinations were considered. These vari
ables included: two mix voids, two rubber contents, three rubber gradations,
two mixing temperatures, cure time, and use of surcharge.
The aggregates were obtained from the actual source used for the Lemon
Road Project in Juneau, Alaska. The asphalt (AC-5) was supplied by Chevron
USA. The recycled rubber was obtained from Rubber Granulators in Everett,
Washington.
The two general types of tests used in this study were mix design tests
and mix properties tests. The Marshall mix design procedure was used in this
study and mix design samples prepared using the standard Alaska DOTPF pro
cedure (T-17). To evaluate mix properties, the diametral modulus and fatigue
tests were performed on all 20 different combinations at two different temper-
atures.
To evaluate the effect of compaction effort and compaction temperature,
20 samples with three different mix formulas were prepared. Finally, to study
the effect of aging on the resilient modulus, two different mix combinations
were tested at 100 micros train in a +lO°C environmental chamber.
72
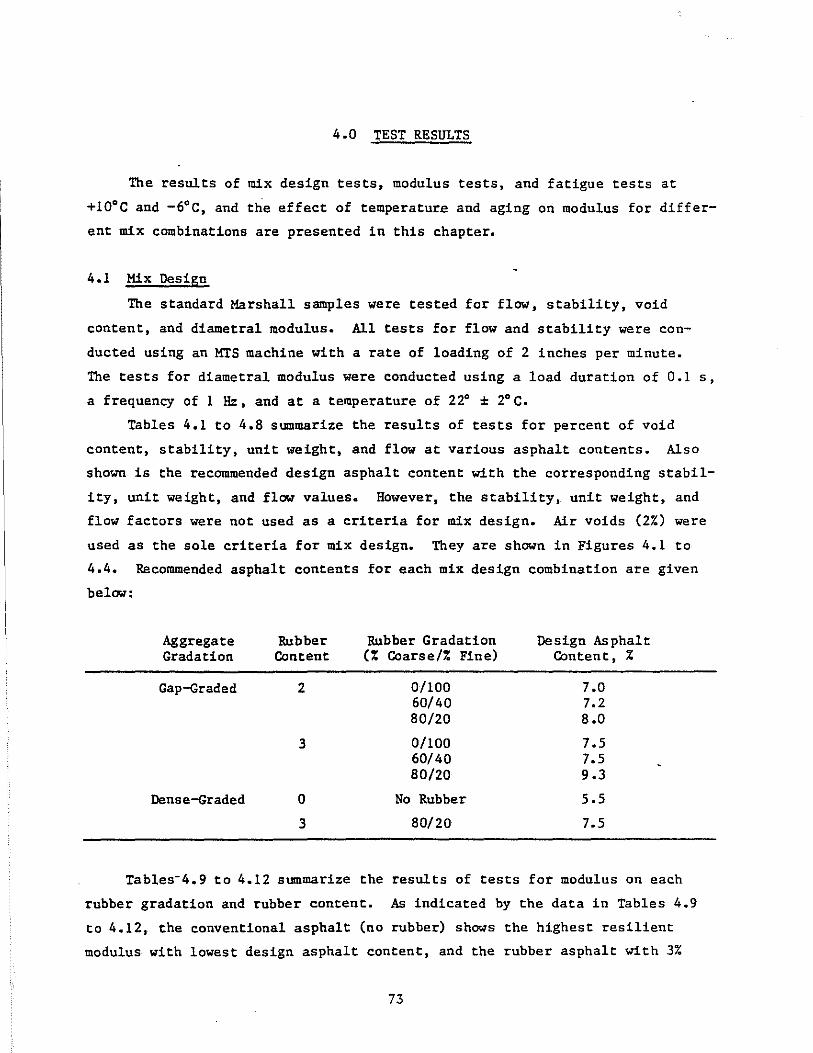
4.0 TEST RESULTS
The results of mix design tests, modulus tests, and fatigue tests at
+100 e and -6°C, and the effect of temperature and aging on modulus for differ
ent mix combinations are presented in this chapter.
4.1 Mix Design
The standard Marshall samples were tested for flow, stability, void
content, and diametral modulus. All tests for flow and stability were con
ducted using an MrS machine with a rate of loading of 2 inches per minute.
The tests for diametral modulus were conducted using a load duration of 0.1 s,
a frequency of 1 Hz, and at a temperature of 22° ± 2°C.
Tables 4.1 to 4.8 summarize the results of tests for percent of void
content, stability, unit weight, and flow at various asphalt contents. Also
shown is the recommended design asphalt content with the corresponding stabil
ity, unit weight, and flow values. However, the stability, unit weight, and
flow factors were not used as a criteria for mix design. Air voids (2%) were
used as the sole criteria for mix design. They are shown in Figures 4.1 to
4.4. Recommended asphalt contents for each mix design combination are given
below:
Aggregate Rubber Rubber Gradation Design Asphalt Gradation Content (% Coarse/% Fine) Content, %
Gap-Graded 2 0/100 7.0 60/40 7.2 80/20 8.0
3 0/100 7.5 60/40 7.5 80/20 9.3
Dense-Graded 0 No Rubber 5.5
3 80/20 7.5
Tables-4.9 to 4.12 summarize the results of tests for modulus on each
rubber gradation and rubber content. As indicated by the data in Tables 4.9
to 4.12, the conventional asphalt (no rubber) shows the highest resilient
modulus with lowest design asphalt content, and the rubber asphalt with 3%
73
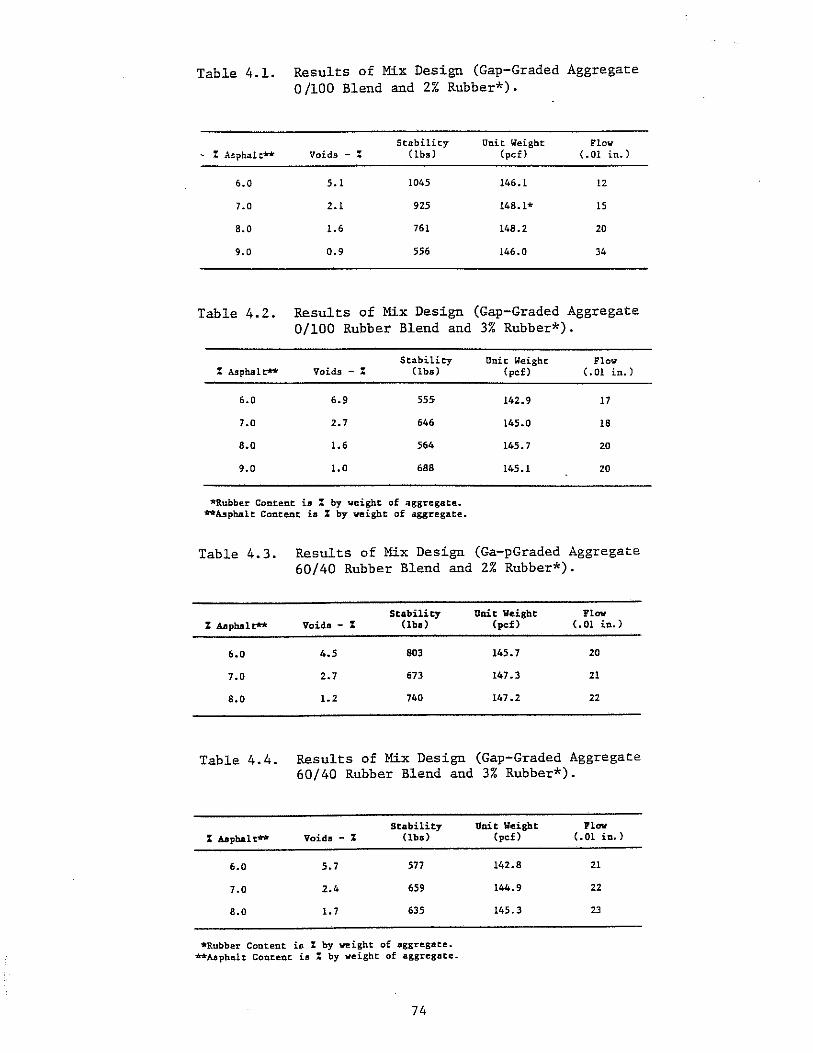
Table 4.1. Results of Mix Design (Gap-Graded Aggregate 0/100 Blend and 2% Rubber*).
Stability Unit Weight Flow % Asphalt** Voids - % (lb.) (pef) (.01 in.)
6.0 5.1 1045 146.1 12
7.0 2.1 925 148.1* 15
B.O 1.6 761 14B.2 20
9.0 0.9 556 146.0 34
Table 4.2. Results of Mix Design (Gap-Graded Aggregate 0/100 Rubber Blend and 3% Rubber*).
Stability % A.5phal t**' Voids - % (lba)
6.0 6.9 55~
7.0 2.7 646
8.0 1.6 564
9.0 1.0 688
*Rubber Content ia % by weight of aggregate. **A.sphalt Content is % by weight of aggregate.
Unic Weight Flow (pcf) (.01 in.)
142.9 17
145.0 1B
145.7 20
145.1 20
Table 4.3. Results of Mix Design (Ga-pGraded Aggregate 60/40 Rubber Blend and 2% Rubber*).
% Asphalt** Voida - %
6.0 4.5
7.0 2.7
8.0 1.2
Stability (lb.)
803
673
740
unit Weight (pcf)
145.7
147.3
147.2
Flow (.01 in.)
20
21
22
Table 4.4. Results of Mix Design (Gap-Graded Aggregate 60/40 Rubber Blend and 3% Rubber*).
% Asphalt**' Voida - %
6.0 5.7
7.0 2.4
B.O 1.7
Stability (lb.)
577
659
635
*Rubber Content ia % by weight of aggregate. **Asphalt Content ia % by weight of aggregate.
74
Unit Weight (po£)
142.8
144.9
145.3
Flow (.01 in.)
21
22
23
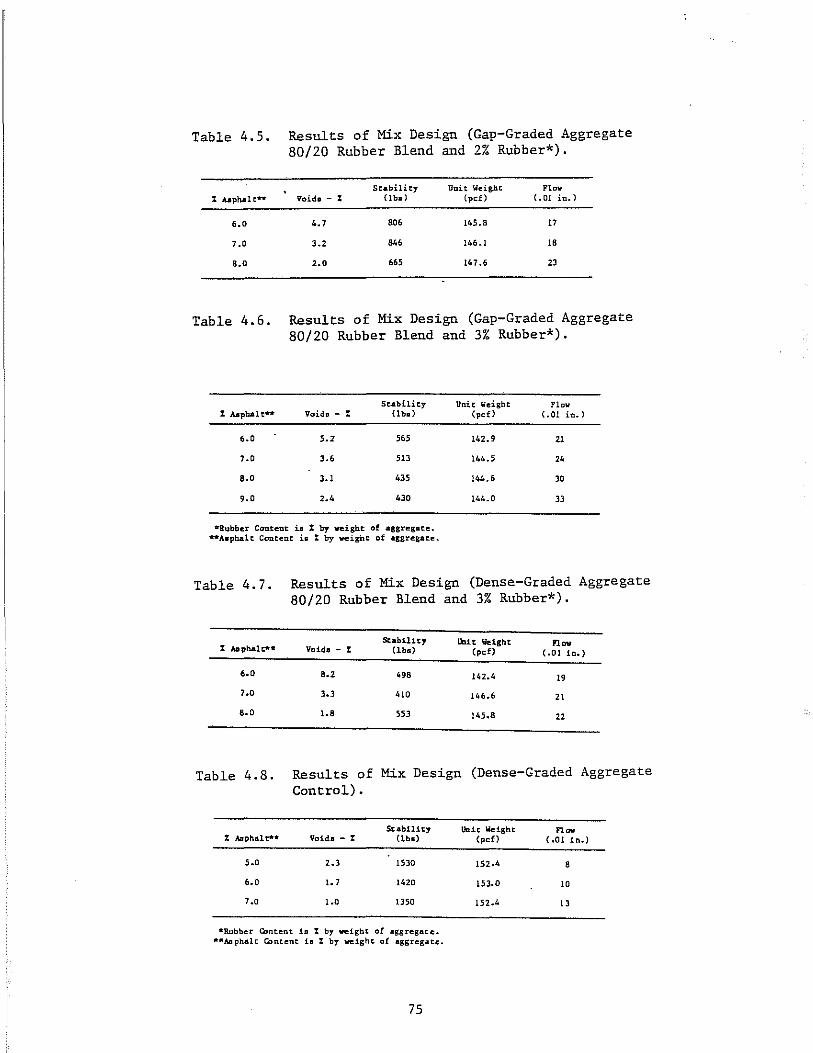
Table 4.5. Results of Mix Design (Gap-Graded Aggregate 80/20 Rubber Blend and 2% Rubber*).
St .. bility UDit Weight FloW' I AJlphdt ...... Voida - : Uba) (pef) (.Ol in.)
6.0 4.7 806 145.8 17
7.0 3.2 846 146.1 18
8.0 2.0 66' 147.6 23
Table 4.6. Results of Mix Design (Gap-Graded Aggregate 80/20 Rubber Blend and 3% Rubber*).
Stability % Aapb.a.lt** Voidll - % (lba)
6.0 '.2 'OS 7.0 3.6 513
8.0 3.1 435
'.0 2.4 430
*Rubber ConteDt i~ % by veight of aggregate. **Alphalt Content ia : by veight of aggregate.
Oni t Weight (pef )
142.9
144.5
144.6
144.0
Flow L01 in.)
21
30
33
Table 4.7. Results of Mix Design (Dense-Graded Aggregate 80/20 Rubber Blend and 3% Rubber*).
% ADpru.l~· StabUity Do.lt Weight Flov
Velda - % (lba) (pcf ) (.01 in.)
6.0 8.2 498 142.4 19
7.0 3.3 410 146.6 21
8.0 1.8 SS3 145.8 22
Table 4.8. Results of Mix Design (Dense-Graded Aggregate Control).
St.b1l1ty % AIIptlal t*- Valda - % (lbl)
'.0 2.3 1530
6.0 1.7 1420
7.0 1.0 1350
-Rubber COntent 10 % by veight of aggregate. ··Asphalt COntent is I by velght of aggregate.
75
Unit Weight Flov (pd) (.01 In.)
152.4 8
153.0 10
152.4 13
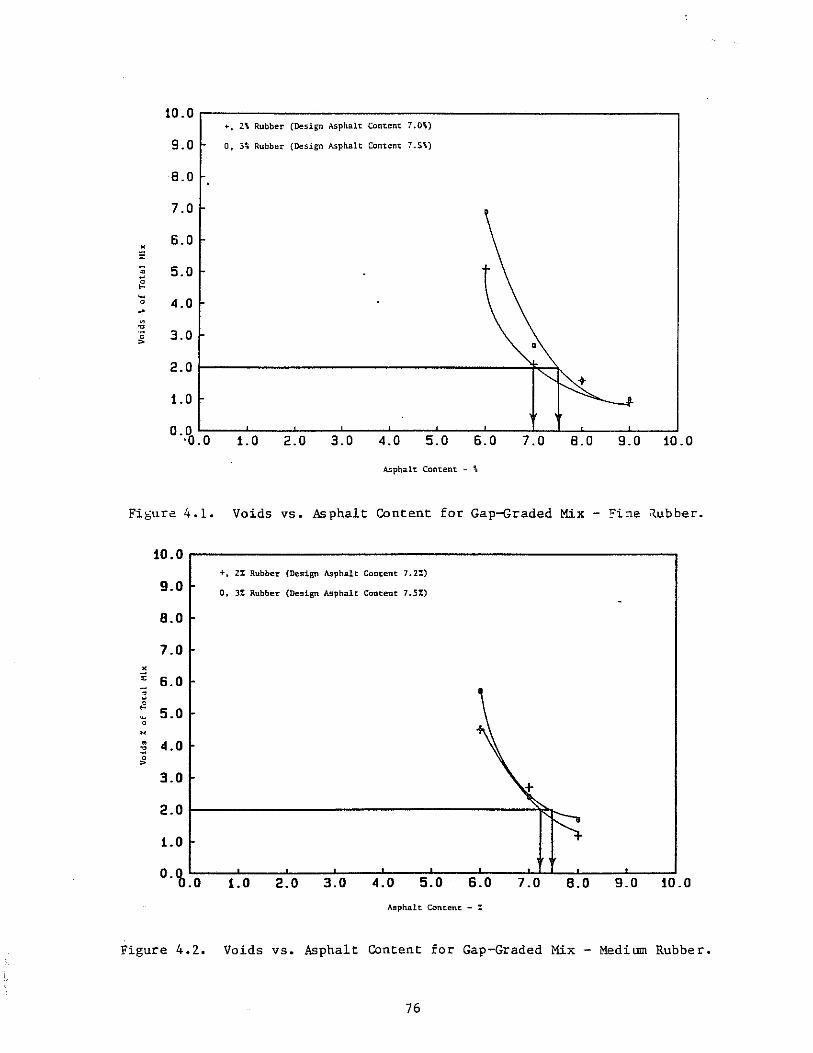
10.0 ~. 2\ Rubber (Design AsphalL ConLenL 7.0\)
9.0 0, 3% Rubber (Design Asphalt CanLent 7.5\)
8.0
7.0
6.0 • '" · 5.0 ~
~ ~ 0 4.0 ~
" ." ·0 3.0 >
2.0 ... 1.0
0.0 '0.0 1.0 2.0 3.0 4.0 5.0 6.0 7.0 8.0 9.0 10.0
Asphalt Content - \
Fi5ure 4.1. Voids vs. Asphalt Content for Gap-Graded Mix - "ine ~ubber.
10.0 +, 2% Rubber (Design Asphalt Content 7.2:)
9.0 0, 3% Rubber (Design Asphalt Content 7.5%) .
B.O
7.0 • ;; 6.0 :l ,3
5.0 ~
0
· 4.0 3 0 >
3.0
"" 2.0
1.0 ~ O·'b.o 1.0 2.0 3.0 4.0 5.0 6.0 7.0 B.O 9.0 10.0
Asphalt Content - %
Figure 4.2. Voids vs. Asphalt Content for Gap-Graded Mix - Medium Rubber.
76
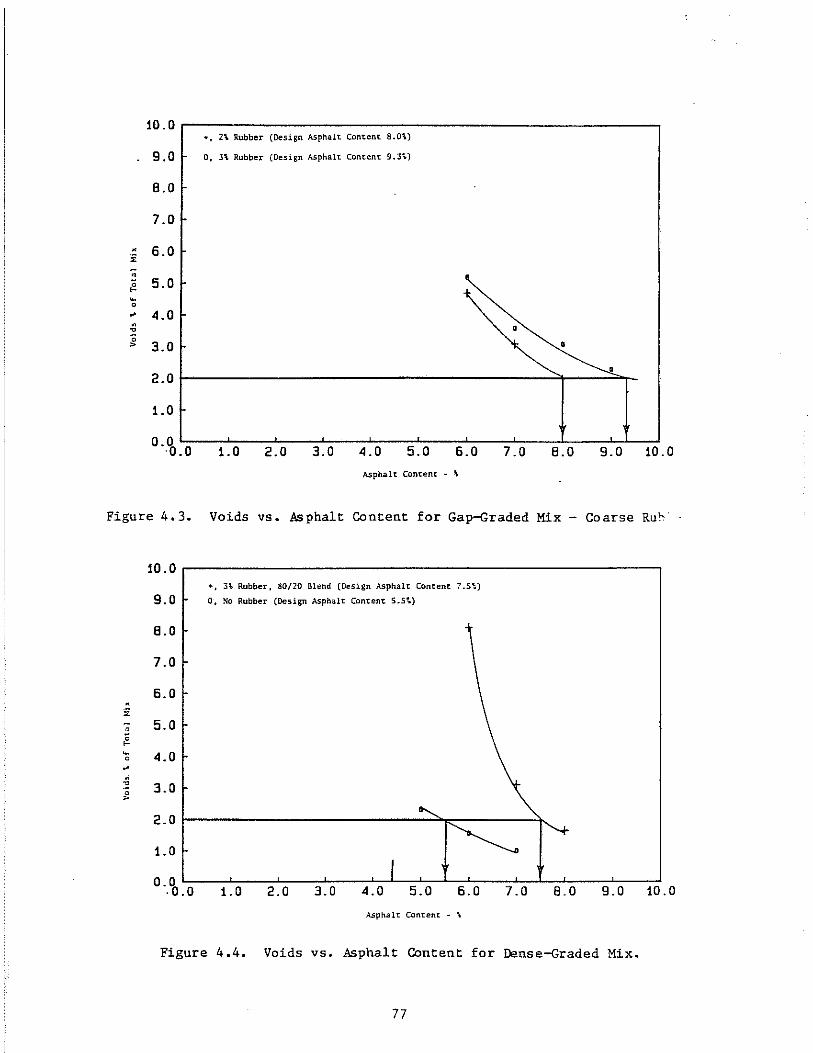
10.0 ., 2\ Rubber (Design Asphalt Content 8.0\)
9.0 O. 3\ Rubber (Design Asphalt Content 9.3~)
8.0
7.0
" 6.0 i
• 0 5.0 ,.. ~ 0
~ 4.0 . ~ • 0; > 3.0 •
2.0
1.0
0.0 '0.0 1.0 2.0 3.0 4.0 5.0 6.0 7.0 8.0 9.0 10.0
Asphalt Content - \
Figure 4.3. Voids 11S. Asphalt Content for Gap-Graded Mix - Coarse Ru>"·
'" . 0 ,.. ~
0
~ . ~
0 >
10.0
9.0
8.0
7.0
6.0
5.0
4.0
3.0
2.0
1.0
0.0 ·0.0
+, 3\ Rubber, gO/20 Blend (Design Asphalt Content 7.S~)
0, No Rubber (Design Asphalt Content S.S~)
1.0 2.0 3.0 4.0 5.0 6.0
A5phalt Content· '\
7.0 8.0 9.0
Figure 4.4. Voids 11S. Asphalt Content for Dense-Graded Mix.
77
10.0
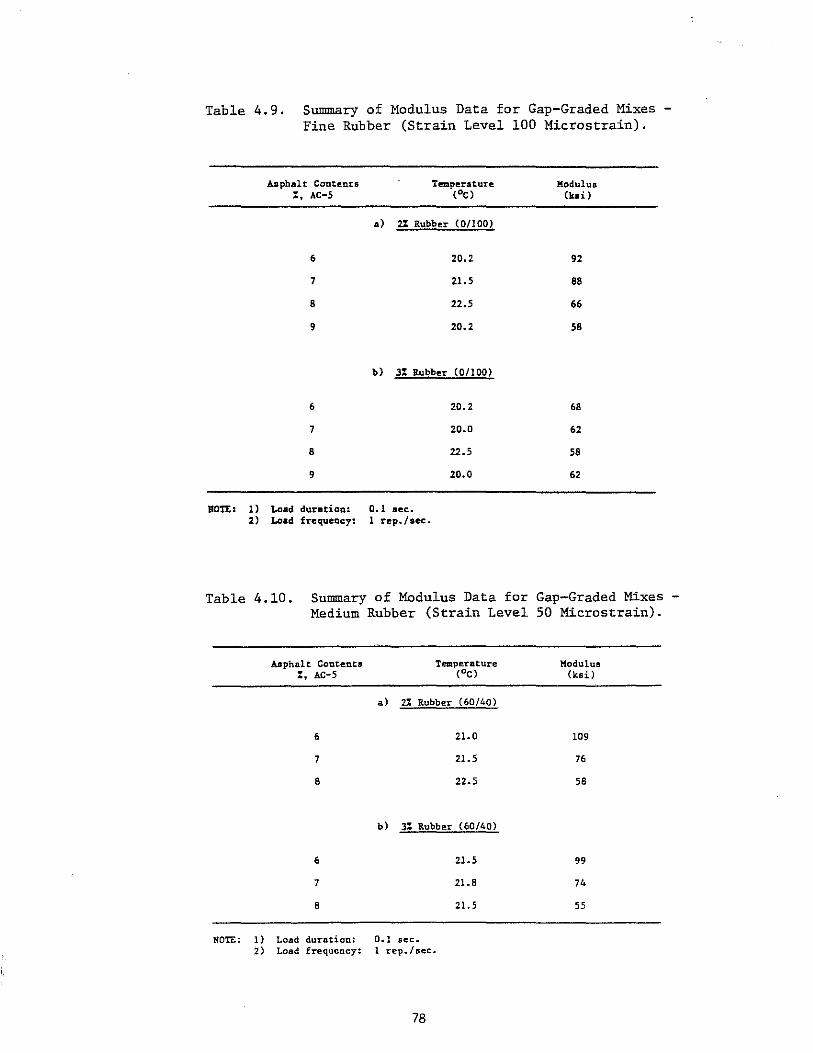
Table 4.9. Summary of Modulus Data for Gap-Graded Mixes Fine Rubber (Strain Level 100 Microstrain).
As phal t Ccntent:S Temperature Modulus %, AC-S (DC) (lui)
.) 2% Rubber (01100)
6 20.2 92
7 21.5 88
8 22.5 66
9 20.2 58
b) 3% Rubber (01100)
6 20.2 68
7 20.0 62
8 22.5 58
9 20.0 62
Ron:: 1) Load duration: 0.1 Dec. 2) Load frequency: 1 rep./oee.
Table 4.10. Summary of Modulus Data for Gap-Graded Mixes Medium Rubber (Strain Level 50 Microstrain).
NOTE:
Aaphalt ConCentD I, AC-5
6
7
8
6
7
8
1) Load duration: 2) Load frequency:
a) 2% Rubber (60/40)
21.0
21.5
22.5
b) 3% Rubber (60/40)
21.5
21.8
21. 5
0.1 sec. 1 rep./sec.
78
Modulus (ksi)
109
76
58
99
74
55
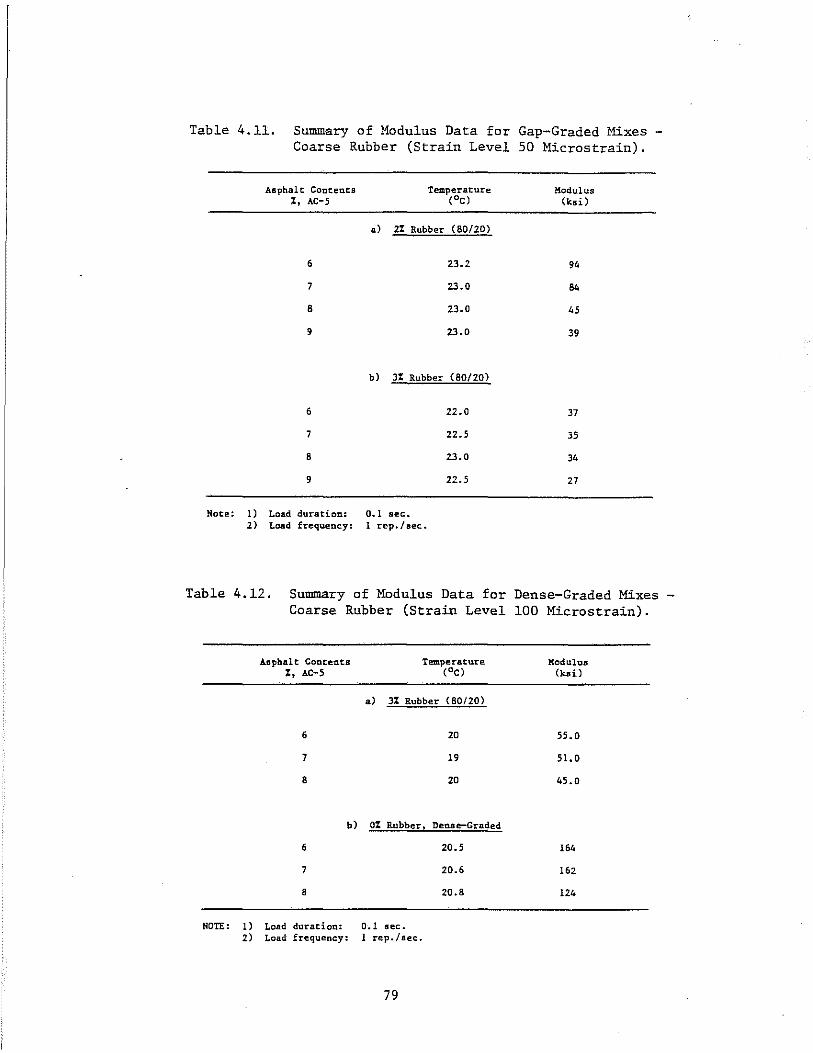
Table 4.11. Summary of Modulus Data for Gap-Graded Mixes Coarse Rubber (Strain Level 50 Microstrain).
Asphalt Contents X, AC-S
6
7
8
9
6
7
8
9
Note: 1) Load duration: 2) Load frequency:
Temperature (OC)
a) 2% Rubber (80/20)
23.2
23.0
23.0
23.0
b) 3% Rubber (80/20)
22.0
22.5
23.0
22.5
0.1 sec. 1 rep./aec.
Modulus (ksi)
94
84
45
39
37
35
34
27
Table 4.12. Summary of Modulus Data for Dense-Graded Mixes Coarse Rubber (Strain Level 100 Microstrain).
Asphalt Contents %, AC-S
6
7
8
b)
6
7
8
NOTE: 1) Load duration: 2) Load frequency:
Temperature Modulus (oe) (ksi)
a) 3% Rubber (80/20)
20 55.0
19 51.0
20 45.0
0% Rubber! DeD1l e-Graded
20.5 164
20.6 162
20.8 124
0.1 sec. 1 rep./sec.
79

rubber 80/20 blend shows the lowest resilient modulus with highest design
asphalt content.
4.1.1 Discussion of Results
The effects of rubber content, rubber gradation, and aggregate gradation
on design asphalt content and resilient modulus at room temperature are des
cribed in the following sections.
4.1.1.1 Effect of Rubber Content and Rubber Gradation. The effect of
two rubber contents (2% and 3%) on design asphalt content for three different
rubber gradations (fine, medium, and coarse) and two different aggregate
gradations (gap and dense) were evaluated. The effect of rubber gradation and
content is shown by Figure 4.5. The mixture with coarse rubber gradation
required the highest design asphalt content, while the mixture with fine
rubber gradation required the lowest design asphalt content. Figure 4.6 shows
the rubber-modified mix requires approximately 2% more asphalt cement than a
conventional mix.
The effect of rubber content on resilient modulus is shown in Figures 4.7
and 4.8. The highest asphalt content, and lowest resilient modulus, was
achieved at 3% coarse rubber with gap-graded aggregate. Figure 4.8 shows that
the control mix has the highest stiffness with the lowest design asphalt
content.
4.1.1.2 Effect of Aggregate Gradation. The effect of aggregate grada
tion on design asphalt content is noticeable. For example, the design asphalt
content at 2% voids for dense-graded aggregate is 1.8% less than the gap
graded aggregate. Figure 4.9 shows this relationship.
The effect of aggregate gradation on resilient modulus is shown in
Figure 4.10. The dense-graded aggregate has a higher resilient modulus than
gap-graded aggregate.
4.2 Mix Properties at +10°C
4.2.1 Resilient Modulus and Fatigue
Twenty different mix combinations were tested at 100 micros train in a
+10°C environmental chamber for resilient modulus and fatigue (Table 4.13).
80
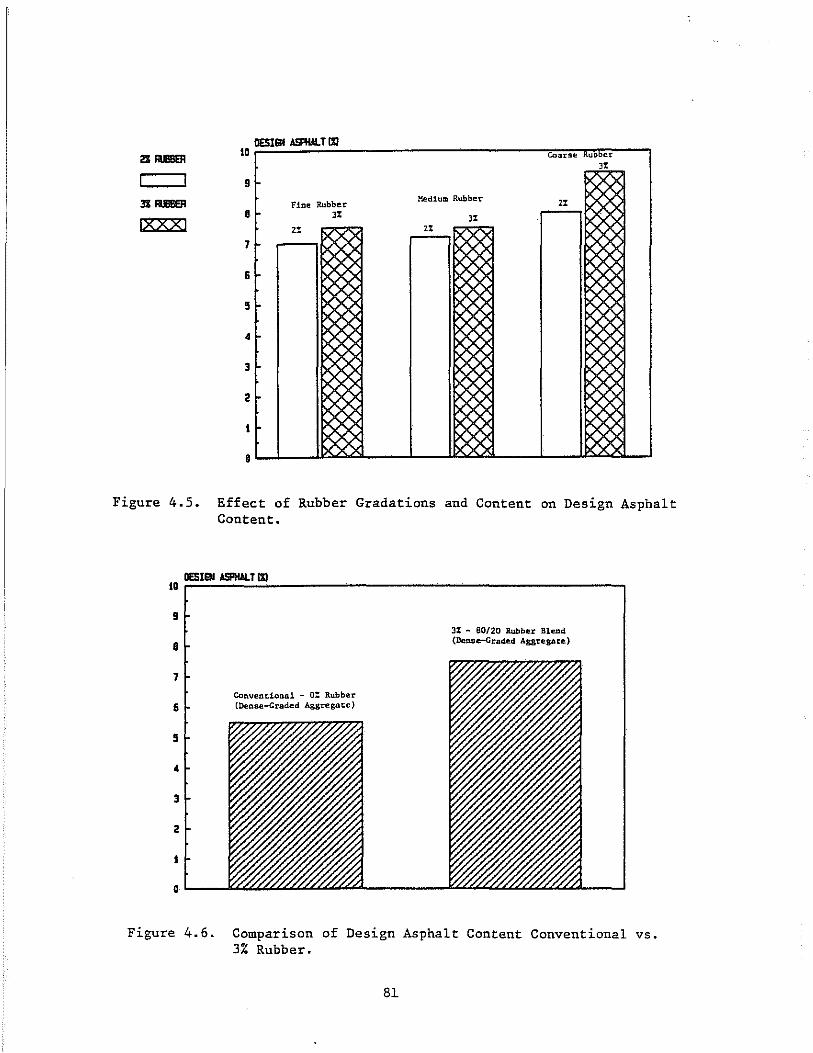
3Z RIJBIl£R
Ixxxi
10
9
8
7
6
3
2
1
o
OESIEII A5I'IW. T IJI
Fine Rubber ,%
2%
Coarse Rubber ,%
Medium Rubber 2%
,% 2%
X.
Figure 4.5. Effect of Rubber Gradations and Content on Design Asphalt Content.
10
9
8
7
6
5
• 3
2
1
;::OES=I=EII~A5I'IW.~=T~IJI=-______________________________________ ~
Conventional - 0: Rubber (Dense-Graded Aggregate)
J% - 80/20 Rubber Blend (Dense-Graded Aggregate)
Figure 4.6. Comparison of Design Asphalt Content Conventional vs. 3% Rubber.
81
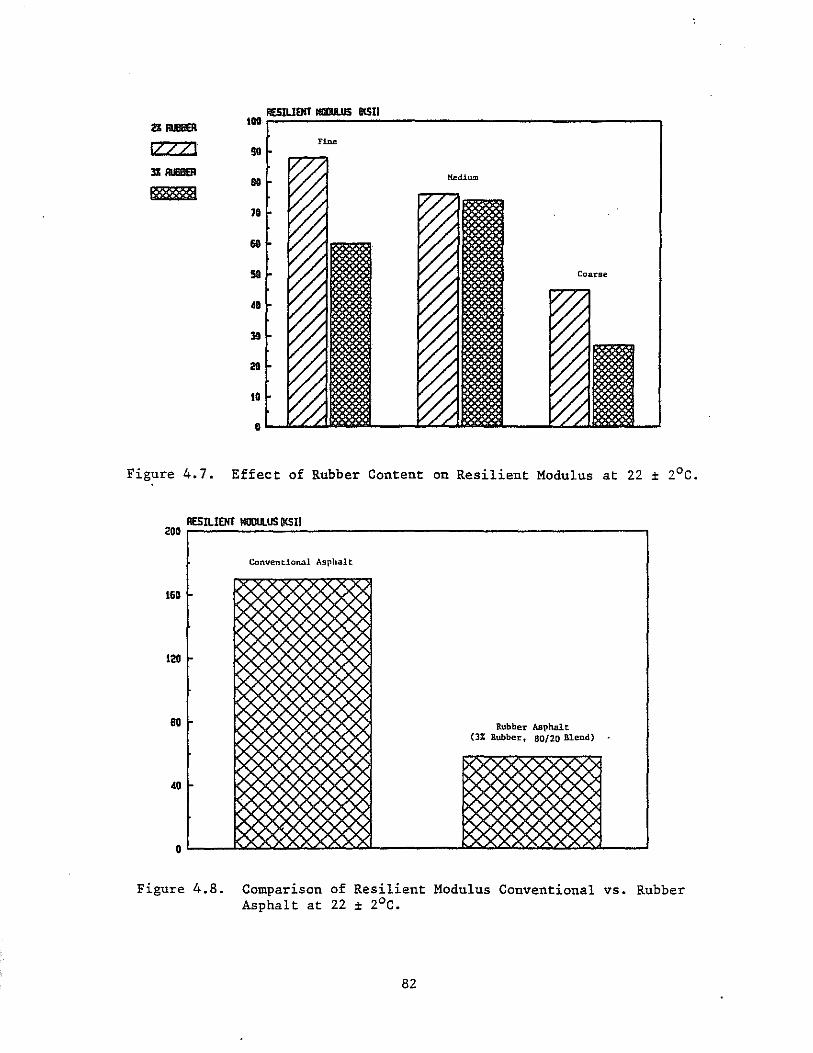
IlESIUElIT IIIIIIlUIS IKSII 21_ 100
IIZZI Fine SO 3:1_
gxgxxga 110
70
fiG
SO
.. ]!I
21
10
,
Figure 4.7. Effect of Rubber Content on Resilient Modulus at 22 ± 2°C.
200 IlESILlENT MOOULUS IKSII
Convendonal Asphalt
160
)< )<
121 I- >< )<
"" '>< Rubber Asphalt 80
(3% Rubber. 80/20 Blend)
)<
40
o
Figure 4.8. Comparison of Resilient Modulus Conventional vs. Rubber Asphalt at 22 ± 2°C.
82
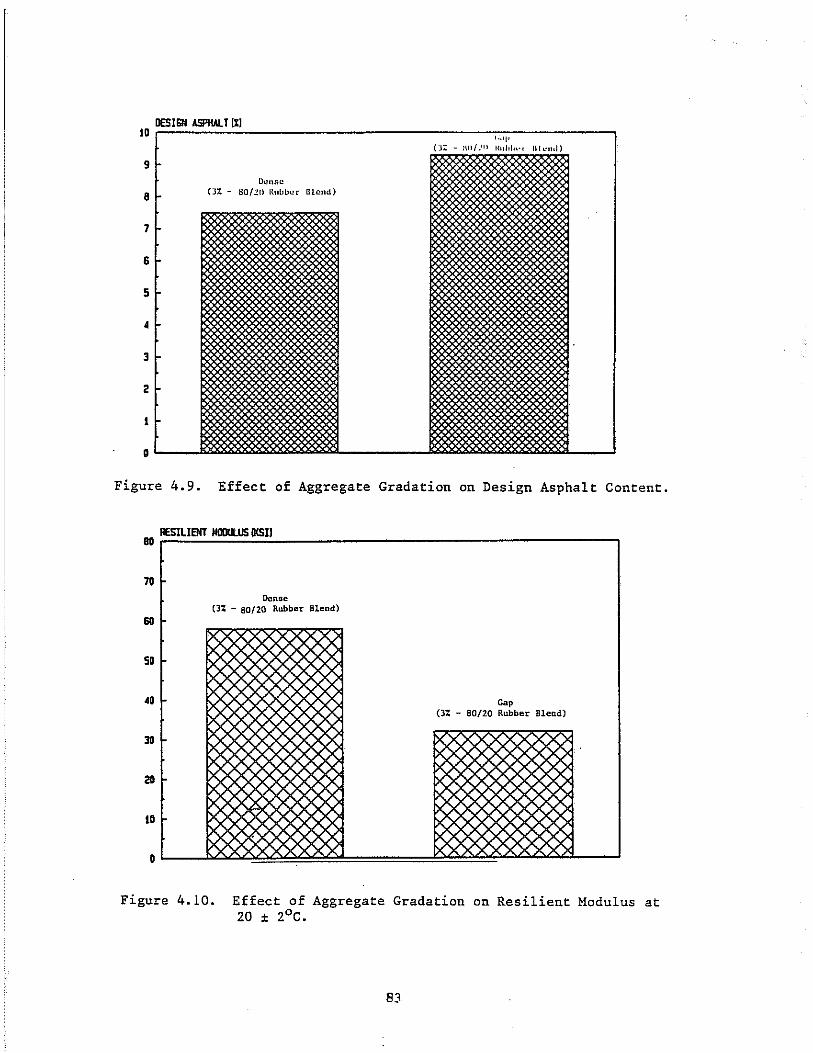
DeSI6N ASPHAlT 111 10
1 •• ,1' (T':: - l\u/.'II 111,111 ... , Ill""
9 ~ DlllISC
8 (J% - 80/20 llubber Blend)
7 ~ 6 ~ ~
:888 5 38:
• ~ 3
~ 2 §§l 1
o ~ m ~
Figure 4.9. Effect of Aggregate Gradation on Design Asphalt Content.
eo RESILIOO HDIIILIJS IKSII
70 Dense
(3% - 80/20 Rubber Blend)
so X
50
Gap (3% - 80/20 Rubber Blend)
30
20 X
10 I-
.J< XX \. X)< o
Figure 4.10. Effect of Aggregate Gradation on Resilient Modulus at ZO ± ZOC.
83
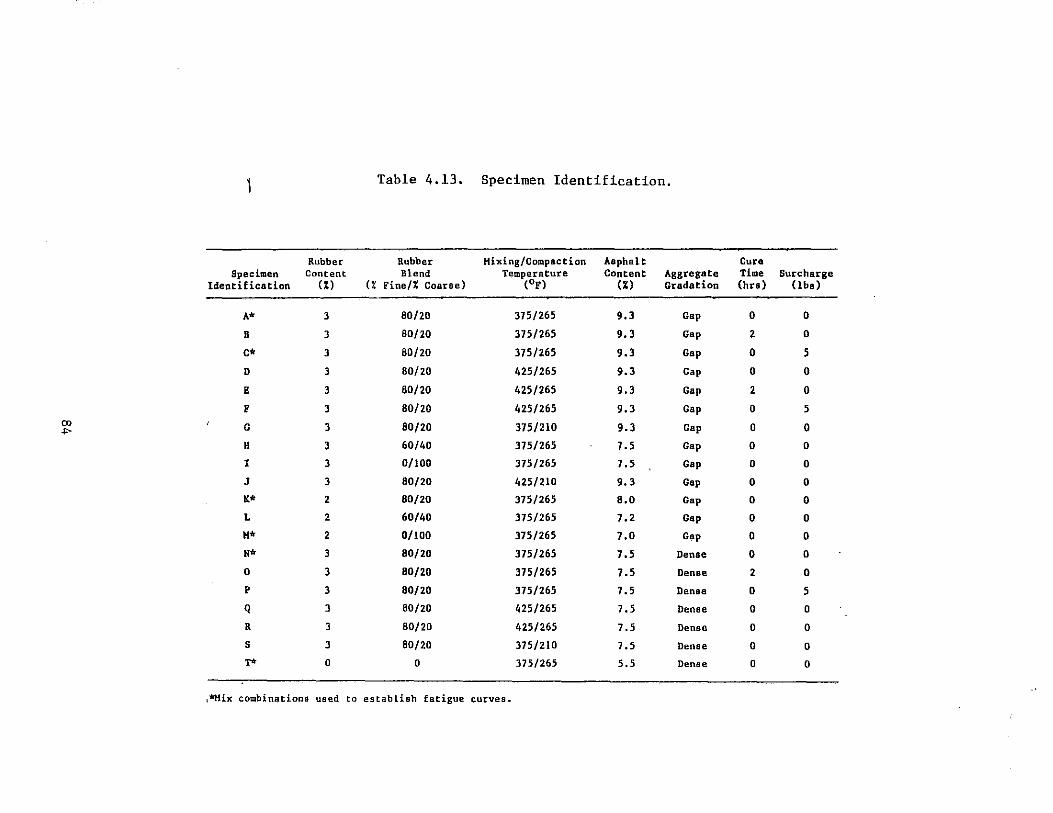
1 Table 4.13. Specimen Identification.
Rubber Rubber Mixing/Compaction Asphalt Cure Specimen Content Blend Temperature Content Aggregate Time Surcharge
Identification (%) (X Fine/% Coarae) (OF) (Xl Gradation (hr.) (lba)
A* 3 80/20 375/265 9.3 Gap a a B 3 80/20 375/265 9.3 Gap 2 a c* 3 80/20 375/265 9.3 Gap a 5
D 3 80/20 425/265 9.3 Gap a a E 3 80/20 425/265 9.3 Gap 2 0
P 3 80/20 425/265 9.3 Gap 0 5 00 G 3 80/20 375/210 9.3 Gap 0 0 .0-
R 3 60/40 375/265 7.5 Gap 0 0
I 3 0/100 375/265 7.5 Gap 0 0
J 3 80/20 425/210 9.3 Gap 0 0
K* 2 80/20 375/265 8.0 Gap 0 0
L 2 60/40 375/265 7.2 Gap 0 0
H* 2 0/100 375/265 7.0 Gap 0 0
N* 3 80/20 375/265 7.5 Dense 0 0
0 3 80/20 375/265 7.5 Dense 2 0
P 3 80/20 375/265 7.5 Denoe 0 5
Q 3 80/20 425/265 7.5 Dense 0 a R 3 80/20 425/265 7.5 Denae 0 0
S 3 80/20 375/210 7.5 Dense 0 0 1'* 0 0 375/265 5.5 Dense 0 0
,*Mix combinations used to establish fatigue curves.
For all dynamic tests, samples were subjected to a constant load, applied at
60 cycles per minute, with a load duration of 0.1 s. A 28-pound seating load
was applied to all samples.
At least three samples for each combination were tested. The results of
all tested samples were presented in Appendix C. The re·sults of resilient
modulus and fatigue for 20 different mixes are summarized in Table 4.14.
The effects of aggregate gradation, rubber gradation, rubber content,
mixing temperature, surcharge, cure time, and air voids are discussed in the
following sections.
4.2.1.1 Effect of Aggregate Gradation (Gap vs. Dense). The effects of
aggregate gradation on resilient modulus and fatigue life for three different
mixing conditions are shown in Figures 4.11 and 4.12. These figures show that
the mixtures with gap-graded aggregate in all three mixing conditions have
lower resilient modulus and higher fatigue life than the mixtures with dense
graded aggregate.
4.2.1.2 Effect of Rubber Gradations (Fine, MediUlll, and Coarse). The
resilient modulus and fatigue life for three different rubber gradations
(fine, medium, and coarse) are compared in Figures 4.13 and 4.14. The mixture
with fine rubber has the highest modulus and lowest fatigue, and the mixture
with coarse rubber has the lowest modulus and highest fatigue life. These
results contradict those obtained by ADOTPF on Peger Road where 2% additional
fine rubber extended the fatigue life in all cases, as well as increasing the
modulus (Figures 2.12 and 2.13).
4.2.1.3 Effect of Rubber Content (2% vs. 3%). The effect of rubber
content on resilient modulus and fatigue is shown in Figures 4.15 and 4.16.
The samples with 3% rubber content generally have lower resilient modulus than
the samples with 2% rubber content (Figure 4.15). The rubber content vari
ations did not show any significant impact on fatigue life (Figure 4.16), with
. the exception of the fine rubber (0/100) samples. These fine rubber results
agree with the ADOTPF observations that a high content of fine rubber may
greatly increase fatigue life.
85
"
Table 4.14. Summary of Resilient Modulus and Fatigue Life.
(Test Temperature: +10oC; Strain Level: 100 Microstrain)
Number of Samples Air Voids (%) MR (ksi) Nf
Mix Used in ID Calculations x a x (J x (J
A 4 1.99 0.11 411 22 27,993 3,728
B 4 2.09 0.03 414 46 23,800 3,558
C 4 2.07 0.12 360 19 48,240 / 4,627
D 4 2.00 0.05 405 31 40,117 11,026
E 3 2.02 0.03 438 43 26,199 4,096
F 5 1.96 0.24 393 103 82,360 7,235
G 3 4.34 0.34 375 17 42,710 4,131
H 5 2.20 0.17 614 73 13,155 4,203
I 4 2.44 0.26 528 87 16,663 2,004
J 4 4.16 0.31 374 14 22,200 5,406
K 3 2.26 0.17 471 22 28,858 4,683
L 3 2.19 0.30 720 38 13,197 5,474
M 3 2.69 0.11 814 114 9,536 4,316
N 5 2.94 0.20 674 55 16,506 6,730
0 4 2.28 0.13 858 68 11,620 6,268
P 4 2.01 0.06 649 60 18,311 7,065
Q 4 2.01 0.09 803 105 7,500 1,942
R 3 2.03 0.21 702 20 17,296 3,945
S 3 4.58 0.89 352 23 13,113 3,725
T 5 2.13 0.25 1,105 67 9,323 2,758
- 86
SAP !IOIIRESlUElITIm.UJS
2 Hrs Cure Tillie GIWlfD
IXxx) BOO
DeNSE GIWlfD No Cure Time
IlZZ) 700 5 Lbs Surcharge
IiOII
SOD
<100
300
200
100
• Figure 4.11. Effect of Aggregate Gradation, Cure Time, and Surcharge on
Resilient Modulus at +lOoC (3% Rubber 80/20 Blend).
FAllQIE LIFE m ON'
IiOIIDD GIWlfD
I I 55DD0
= 5DDD0 5 Lbs Surcharge
IlZZI 4500B
40000
35000
3II0OD No eu re T lQle
2 Hrs Cure Tb:e
25000
2DDDO
I5DOD I_ !IOIIO
0
Figure 4.12. Effect of Aggregate Gradation, Cure Time, and Surcharge on Fatigue Life at +10oC (3% Rubber 80/20 Blend).
87
Figure 4.13. Effect of Rubber Gradations on Resilient Modulus at +10oC (Gap-Graded Aggregate).
J50IIII FATIEIIE lIFE
Coarse -I-
aooo I-
-ISOOO
Medium
Fine 1-5000
o
Figure 4.14. Effect of Rubber Gradation on Fatigue Life at +10oC (Gap-Graded Aggregate).
88
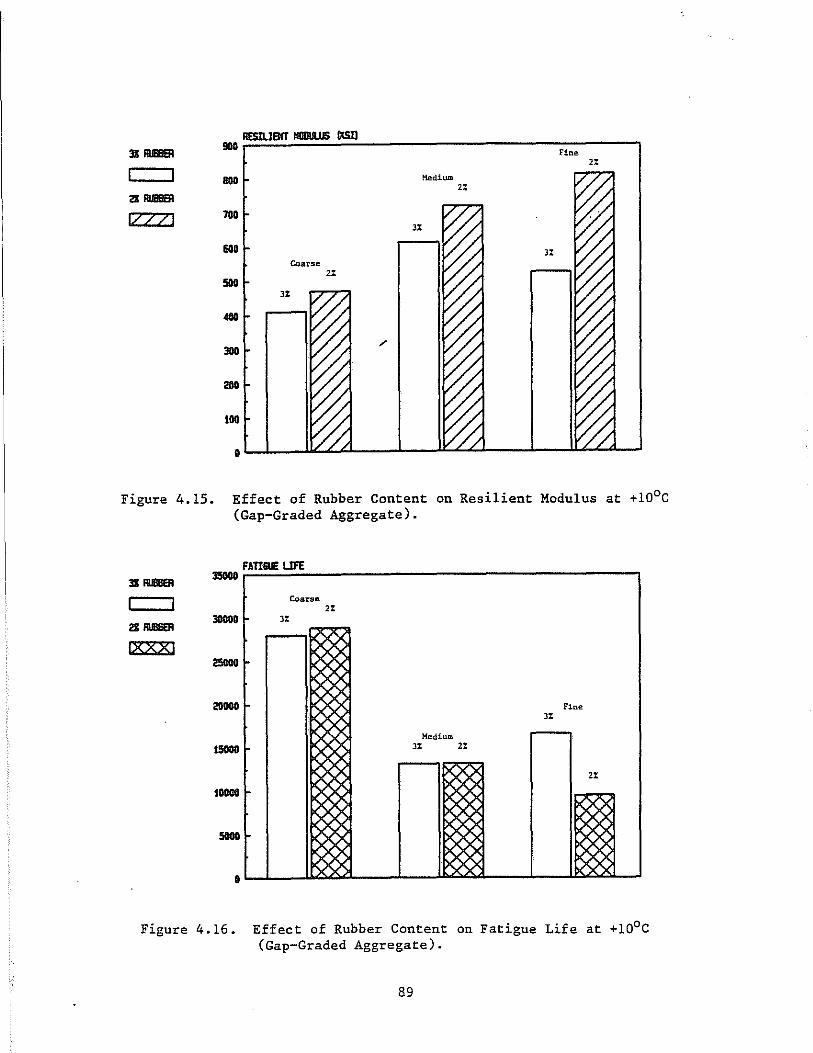
IZZZ)
~~AA=S=I!I~BIT~mm=='=16~~~ ______________________________ , Fine
lIOII
700
&110
500 3%
400
300
2110
SOO
•
Coarse 2%
"
3%
HediUlll 2%
2%
Figure 4.15. Effect of Rubber Content on Resilient Modulus at +10oC (Gap-Graded Aggregate).
FATI&UE LIFE 35000
Coarse 2%
30000 f- 3%
IxxX)
20lI0II Fine 3%
Medium 3% 2%
2%
soooo
• Figure 4.16. Effect of Rubber Content on Fatigue Life at +10oC
(Gap-Graded Aggregate).
89
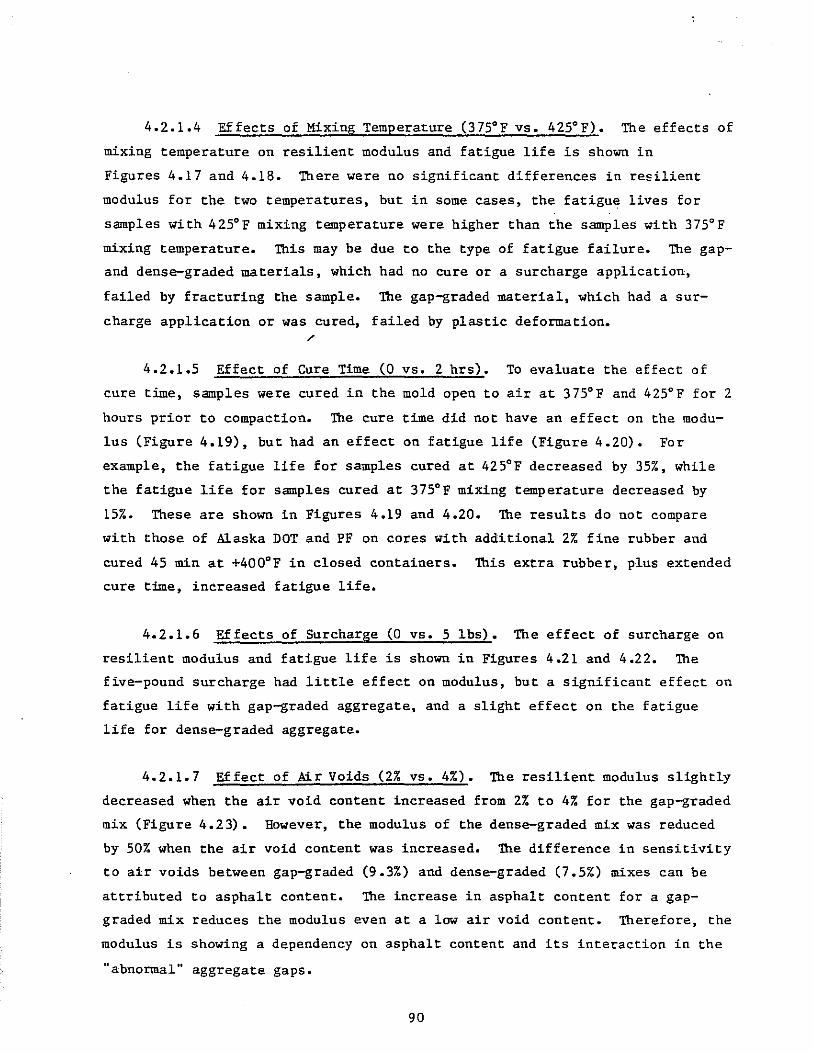
4.2.1.4 Effects of Mixing Temperature (375°F vs. 425°F). The effects of
mixing temperature on resilient modulus and fatigue life is shown in
Figures 4.17 and 4.18. There were no significant differences in resilient
modulus for the two temperatures, but in some cases, the fatigue lives for
samples with 425°F mixing temperature were higher than the samples with 375°F
mixing temperature. This may be due to the type of fatigue failure. The gap
and dense-graded materials, which had no cure or a surcharge application,
failed by fracturing the sample. The gap-graded material, which had a sur
charge application or was cured, failed by plastic deformation.
'" 4.2.1.5 Effect of Cure Time (0 vs. 2 hrs). To evaluate the effect of
cure time, samples were cured in the mold open to air at 375°F and 425°F for 2
hours prior to compaction. The cure time did not have an effect on the modu
lus (Figure 4.19), but had an effect on fatigue life (Figure 4.20). For
example, the fatigue life for samples cured at 425°F decreased by 35%, while
the fatigue life for samples cured at 375°F mixing temperature decreased by
15%. These are shown in Figures 4.19 and 4.20. The results do not compare
with those of Alaska DOT and PF on cores with additional 2% fine rubber and
cured 45 min at +400°F in closed containers. This extra rubber, plus extended
cure time, increased fatigue life.
4.2.1.6 Effects of Surcharge (0 vs. 5 lbs). The effect of surcharge on
resilient modulus and fatigue life is shown in Figures 4.21 and 4.22. The
five-pound surcharge had little effect on modulus, but a significant effect on
fatigue life with gap-graded aggregate, and a slight effect on the fatigue
life for dense-graded aggregate.
4.2.1.7 Effect of Air Voids (2% vs. 4%). The resilient modulus slightly
decreased when the air void content increased from 2% to 4% for the gap-graded
mix (Figure 4.23). However, the modulus of the dense-graded mix was reduced
by 50% when the air void content was increased. The difference in sensitivity
to air voids between gap-graded (9.3%) and dense-graded (7.5%) mixes can be
attributed to asphalt content. The increase in asphalt content for a gap
graded mix reduces the modulus even at a low air void content. Therefore, the
modulus is showing a dependency on asphalt content and its interaction in the
"abnormal" aggregate gaps.
90
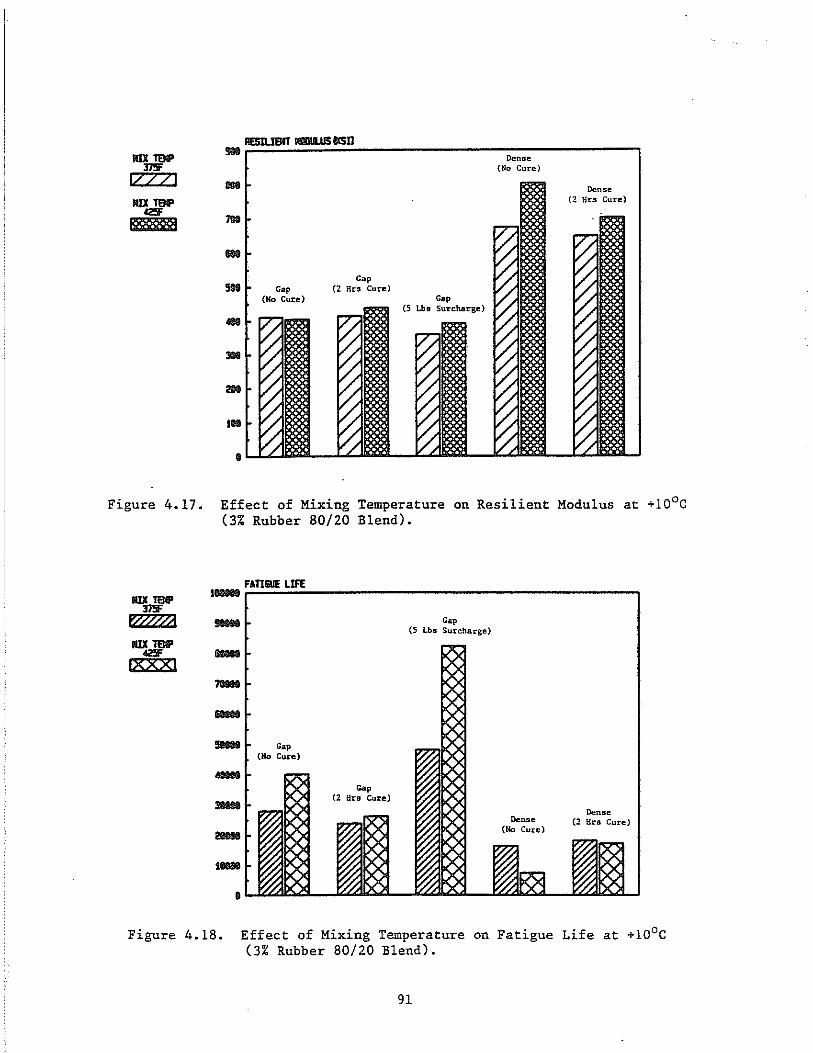
~~~==~~==.~IS~53~n ________________ ~ ____________ -, Dense
(No Cure)
Dense (2 Mrs Cure)
1m
~ Gap Gap
(2 BrB Cure) (Ho Cure)
... -m
1l1li
• Figure 4.17. Effect of Mixing Temperature on Resilient Modulus at +10 0 C
(3% Rubber 80/20 Blend).
FAnU LIFE 1-- Gap
(5 Lbo Surcharge)
lID 19I' - -IZ:8;ZI ?);
7IIIIIIII ... - Gap (Ho Cure) ---
I-
I
r if A!
Gap ~~ (2 !:ira Cure)
~ 1<7" ~ Dense
De~. (2 Brs Cure) (No Cure)
~ ~ ~~ :% D< ~r 0Ji)<
~K; ~ 1M
Figure 4.18. Effect of Mixing Temperature on Fatigue Life at +10oC (3% Rubber 80/20 Blend).
91
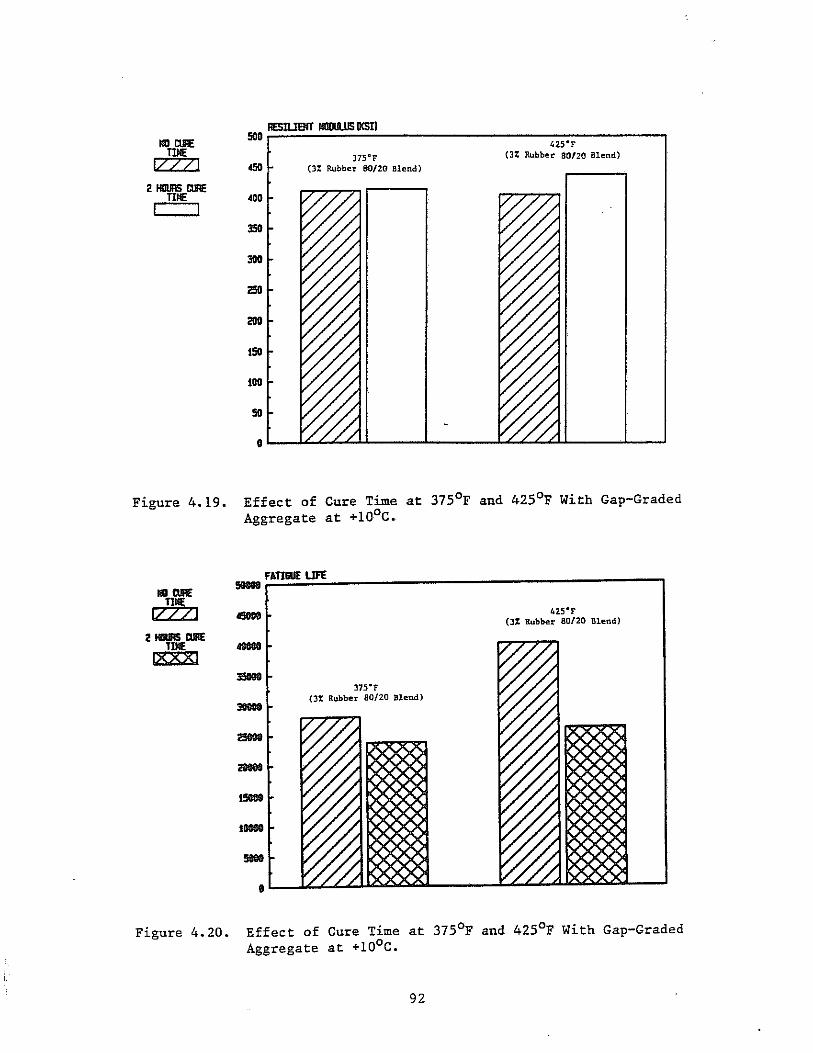
NO CIJIE TIME
IZZZI
2 I«IUIIS CIJIE
=~~~~NOm=='~15~oon~I ____________________________ -, 500 r Us-r
37S"r (3% Rubber 80/20 Blend) 4SO (3% Rubber BO/20 Blend)
TillE 400
300
200
150
100
50
Figure 4.19. Effect of Cure Time at 37SoF and 42SoF With Gap-Graded Aggregate at +10oC.
NO CIJIE TIllE
I/ZZI
~~~~TI~BE~un~ ____________________________________ ,
42s-r (3% Rubber 80/-20 Blend)
2 HIIIlIIS CIJIE TIllE _
IXXX)
37s-r (3% Rubber 80/20 Blend) -
-•
Figure 4.20. Effect of Cure Time at 37SoF and 42SoF With Gap-Graded Aggregate at +10oC.
92
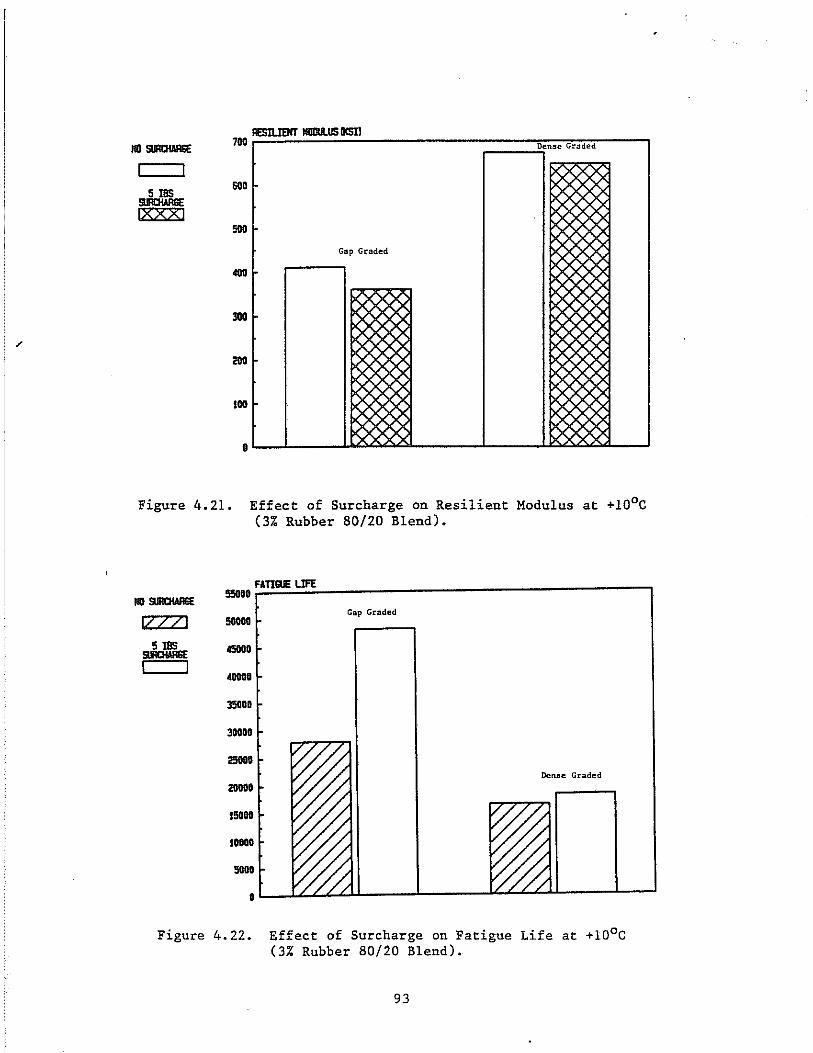
/
5 IBS 5lIRCHARGE Ixxxi
700
600
400
100
ReSILIENT IGllI..US IKSIl Dense Graded
Gap Graded
Figure 4.21. Effect of Surcharge on Resilient Modulus at +10oC (3% Rubber 80/20 Blend).
NO 5lIRCHARGE
IZZZI
~ I I
fR.~n!QE~un~ ________________________________ --, 55000 r-
Gap Graded SOOOO
40000
35000
30000
Dense Graded
ISOoo
10000
SODa
Figure 4.22. Effect of Surcharge on Fatigue Life at +10oC (3% Rubber 80/20 Blend).
93
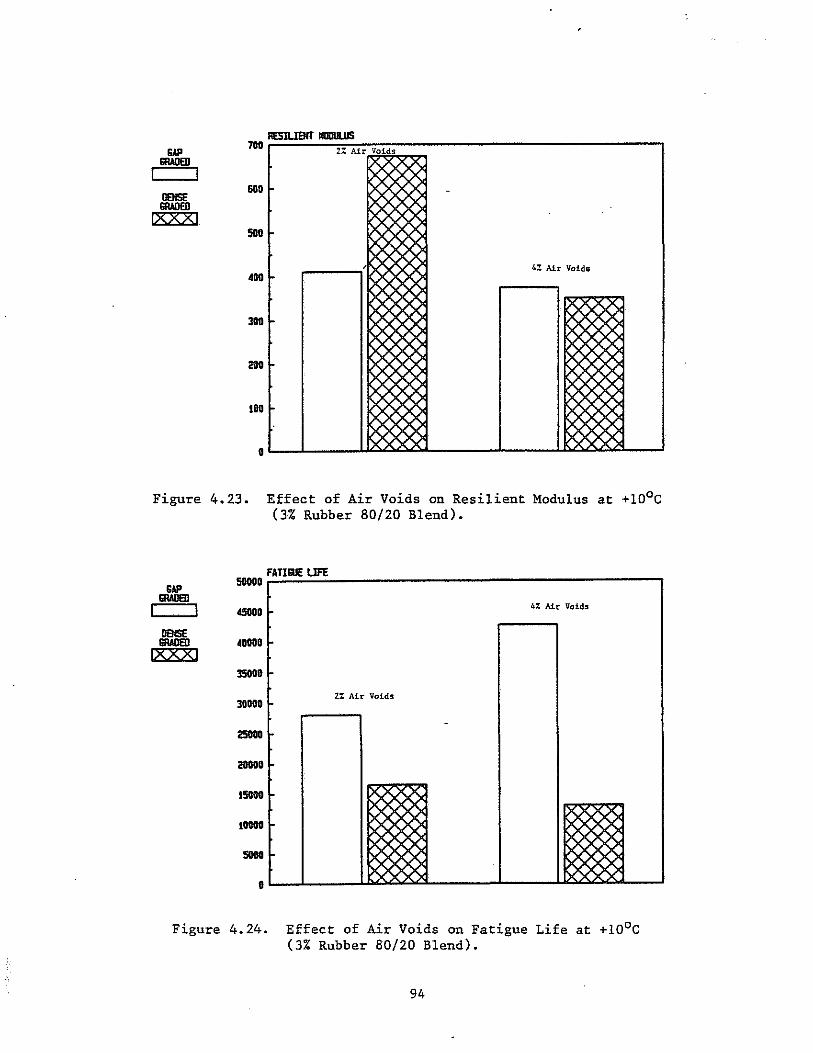
!lAP ERA!l£IJ
I I Il8ISE ERA!l£IJ
(XXX!
600
SOD
400
300
200
100
2% Air Voids
X
-
4% Air Voids
~
~
Figure 4.23. Effect of Air Voids on Resilient Modulus at +lOoC (3% Rubber 80/20 Blend).
SAP ERA!l£IJ
I I
Il8ISE ERA!l£IJ
IXXXI
50000
45000
40000
35000
30000
25000
20000
15000
10000
5000
o
FAmlE LIFE
4% Air Voids
2% Air Voids
-
~
~
Figure 4.24. Effect of Air Voids on Fatigue Life at +lOoC (3% Rubber 80/20 Blend).
94
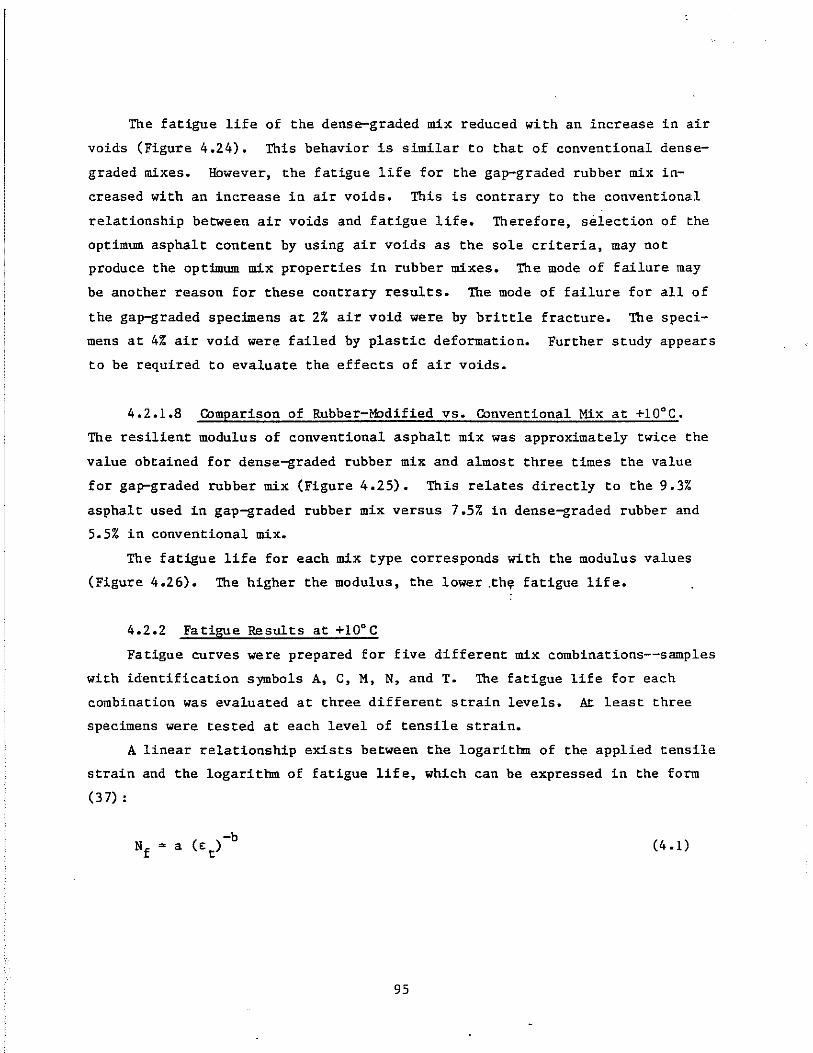
The fatigue life of the dense-graded mix reduced with an increase in air
voids (Figure 4.24). This behavior is similar to that of conventional dense
graded mixes. However, the fatigue life for the gap-graded rubber mix in
creased with an increase in air voids. This is contrary to the conventional
relationship between air voids and fatigue life. Therefore, selection of the
optimum asphalt content by using air voids as the sole criteria, may not
produce the optimum mix properties in rubber mixes. The mode of failure may
be another reason for these contrary results. The mode of failure for all of
the gap-graded specimens at 2% air void were by brittle fracture. The speci
mens at 4% air void were failed by plastic deformation. Further study appears
to be required to evaluate the effects of air voids.
4.2.1.8 COmparison of Rubber-Modified vs. COnventional Mix at +10°C.
The resilient modulus of conventional asphalt mix was approximately twice the
value obtained for dense-graded rubber mix and almost three times the value
for gap-graded rubber mix (Figure 4.25). This relates directly to the 9.3%
asphalt used in gap-graded rubber mix versus 7.5% in dense-graded rubber and
5.5% in conventional mix.
The fatigue life for each mix type corresponds with the modulus values
(Figure 4.26). The higher the modulus, the lower .th~ fatigue life.
4.2.2 Fatigue Results at +10°C
Fatigue curves were prepared for five different mix combinations--samples
with identification symbols A, C, M, N, and T. The fatigue life for each
combination was evaluated at three different strain levels. At least three
specimens were tested at each level of tensile strain.
A linear relationship exists between the logarithm of the applied tensile
strain and the logarithm of fatigue life, which can be expressed in the form
(37) :
(4.1)
95
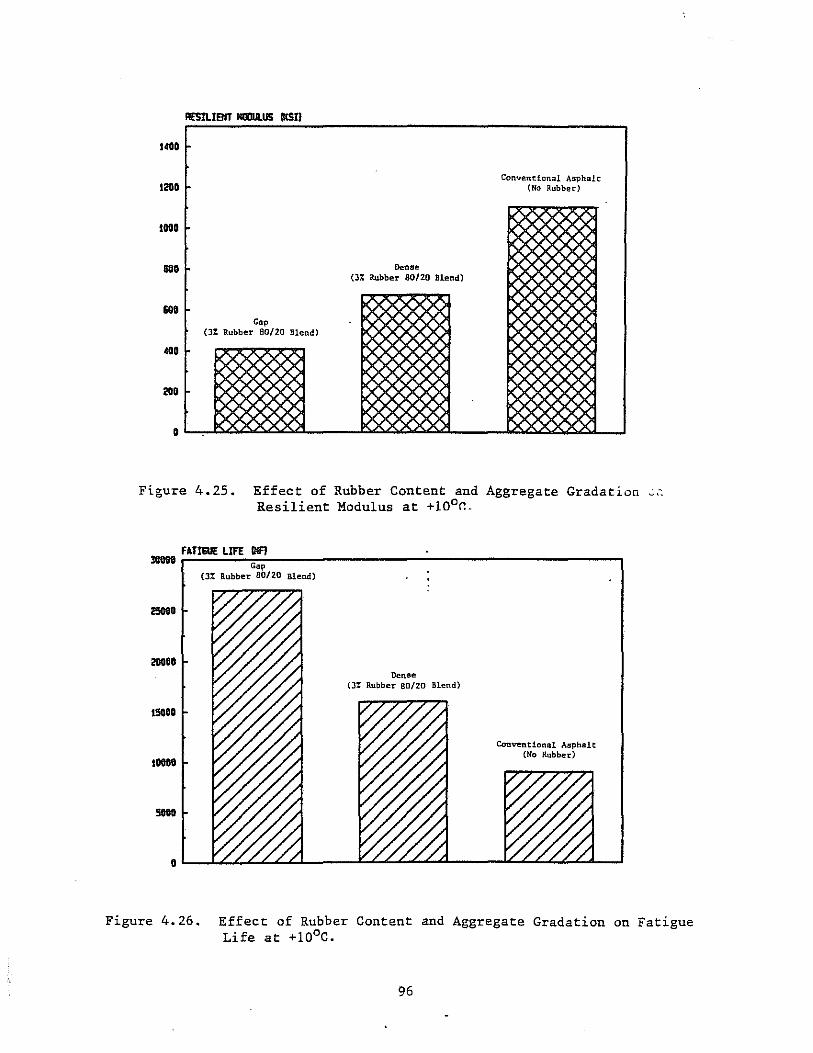
14DD
12D0
1000
1100
&110
400
2D0
o
ReSIl.IOO IIIIIIlI.US IkSII
Gap (3% Rubber 80/20 Blend)
Denoe (3% Rubber 80/20 Blend)
Conventional Asphalt (No Rubber)
Figure 4.25. Effect of Rubber Content and Aggregate Gradation Resilient Modulus at +lO°r..
~~FA~TI~~~L~~~;~~ ________________ ~ ____________________ ~ Gap
(3% Rubber 80/20 Blend)
25000
2D000
15000
10000
Dense ()% Rubber 80/20 Blend)
Conventional Asphalt (No Rubber)
Figure 4.26. Effect of Rubber Content and Aggregate Gradation on Fatigue Life at +lOoC.
96
where
E: t = initial tensile strain, in. lin.
a = antilog of the intercept of the logarithmic relationship
b = slope of the logarithmic relationship between fatigue life and
initial strain.
Values of "a" and "b" are affected by mix type, asphalt content, rubber grada
tion, rubber content, and aggregate gradation. A low value of "a" usually
indicates a low fatigue life, assuming the fatigue curves are parallel to one
another.
The results of the fatigue tests are summarized in Table 4.15. The
averaged logarithm fatigue life values versus logarithm of strains are shown
as a linear relationship in Figure 4.27. The conventional mix has the lowest
"a" value, while the rubberized asphalt with surcharge has the highest "a"
value. The fatigue life equations are shown in Figure 4.27 together with R2,
or coefficient of determination. R2 values tend to be greater than 0.95.
This is attributed to the precise testing techniques and limited number of
strain levels (three strain levels) at which each mix combination was tested.
If the performance of the pavement is based on fatigue, Figure 4.27 shows
the rubber-modified mixes to be superior to conventional asphalt mixes.
4.3 Mix Properties at - 6° e
4.3.1 Re silient Mo dulus and Fa tigue
Twenty different mix combinations were tested at 100 micros train in a
-6°e environmental chamber for resilient modulus and fatigue (Table 4.13).
For all dynamic tests, samples were subjected to a constant load, applied at
60 cycles per minute, with a load duration of 0.1 s. A SO-pound seating load
was applied to all samples.
At least three samples for each combination were tested. The results of
all tested samples are presented in AppendiX e. The results of resilient
modulus and fatigue for 20 different mixes are summarized in Table 4.16.
The effects of aggregate gradation, rubber gradation, rubber content,
mixing temperature, surcharge, cure time, and air voids are discussed in the
following sections.
97
Table 4.15. Summary of Fatigue Lifes at Different Strain Levels (+10°C).
Fa tigue Life
Sample Micro-strain Level Identification 85 100 150
A 44,073 27,993 5,904
C 62,036 48,240 10,490
M 20,985 9,536 3,550
N 32,454 16,506 6,247
T 12,997 9,323 2,826
1E3 % Rubber A~gregate
Curve Rubber Blend Gradation Surcharge L _a __ _b_
A 80/20 Gap-Graded .99 1.07E-I0 -).6
5 C 80/20 Gap-Graded 5 Lbs .,. 4.08E-9 -3.3
H BO/20 Gap-Graded .97 1.18E-6 -3.0
N 80/20 Dense-Graded .,. L14E-7 -2. 8
.s T 0 Dense-Graded .,. 9.94£-8 -Z.7 - 2 .s ~ , ~ .!!
.s 1E2 ~ " ~
~ 5 . c ~ T
~
2
1EiE3 2 5 1E4 2 5 lE5 2 5 lEG Hueber of RGpatitionD to Failure
Figure 4.27. Laboratory Fatigue Curves at +lO°c.
98

Table 4.16. Summary of Resilient Modulus and Fatigue Life.
(Test Temperature: _6° C; Strain Level: 100 Microstrain)
NUIllber of Samples Air Voids (%) MR (ksi) . Nf
Mix Used in ID Calculations x a x a x a
A* 3 2.17 0.06 1,872 27 29,237 3,629
B 3 2.19 0.12 2,044 128 29,736 2,991
C 3 2.18 0.08 2,084 83 25,070 7,600
D 3 2.14 0.08 2,165 18 22,515 1,504
E 3 2.09 0.03 2,149 52 24,174 1,996
F 4 2.13 0.12 2,047 58 20,768 3,887
G 3 4.08 0.27 1,713 194 46,751 20,326
H 3 2.05 0.08 2,356 175 47,990 256
I 4 2.24 0.09 2,149 74 41,194 5,471
J 3 4.02 0.17 1,787 113 43,271 4,617
K 3 2.12 0.07 2,351 50 89,062 7,012
L 3 2.22 0.05 2,488 127 75,325 4,920
M 2 2.33 0.16 2,588 34 41,788 2,075
N* 3 2.22 0.19 2,414 212 118,186 15,670
0 3 2.15 0.24 2,592 161 97,032 18,825
p 3 2.21 0.09 2,225 100 84,153 5,007
Q 3 2.12 0.05 2,116 94 93,651 4,198
R 3 2.02 0.11 1,939 133 81,141 8,354
S 3 4.50 0.23 1,443 177 137,682 24,996
T* 3 2.25 0.13 3,163 133 15,536 2,562
*Specimens used to establish fatigue curves.
99
4.3.1.1 Effect of Aggregate Gradation (Gap vs. Dense). The effects of
aggregate gradation on resilient modulus and fatigue life for three different
mixing conditions are shown in Figures 4.28 and 4.29. These figures show that
the mixture with gap-graded aggregate in all three mixing conditions have
lower resilient modulus and lower fatigue life than the mixtures with dense
graded aggregate.
At - GOC, the effect of aggregate on fatigue life was reversed from the
results at +10°C. The reason for this behavior is not clear. A possible
explanation is that there were differences in the modes of failure between the
dense-graded and gap-graded mixtures. At both temperatures (+10°C and -GoC)
most of the samples with gap-graded aggregate failed by deformation fail
ures. However, the samples with dense-graded aggregate at +10°C failed by
breakage bond between rubber, asphalt, and aggregate. At -GoC, most of the
samples with dense-graded aggregate failed by fatigue cracking (aggregate
fracture) in a uniform tensile plane.
4.3.1.2 Effect of Rubber Gradation (Fine, Medium, and Coarse). The
resilient modulus and fatigue life for three different rubber gradations
(fine, medium, and coarse) were compared. The mixture with coarse rubber has
the lowest modulus and highest fatigue life. This is shown in Figures 4.30
and 4.31. The results at +10°C have the same relationship (coarse rubber has
the lowest modulus and highest fatigue life) as those found at -GoC.
4.3.1.3 Effect of Rubber Content (2% vs. 3%). The effect of rubber
content on resilient modulus and fatigue for gap-graded mixes is shown in
Figures 4.32 and 4.33. The samples with 3% rubber generally have lower resil
ient modulus than the samples with 2% rubber (Figure 4.32). The rubber con
tent reduction (3% to 2%) increased the fatigue life by 2 to 3 times. These
results compare directly with those found at +10°C.
4.3.1.4 Effect of Mixing Temperature (37S0F vs. 42S0F). The effect of
mixing temperature on resilient modulus and fatigue life are shown in Figures
4.34 and 4.3S. There were no significant differences in resilient modulus for
two mixing temperatures. The fatigue lives for samples with 42SoF mixing
temperature in all cases were lower than the samples with 37SoF mixing. The
100
GAP SRAIJElI
I I
Figure 4.2B.
GAP SRAIJElI
IZZZI
= Ixxxi
m~=nl~err~=~~~~~~~l~l ______________________________ -, 3000 r
2700 2 Hrs Cure Titoo
No Cure rime 2400 5 Lbs Surc.harge
2100
1800
!5IlO
1200
900
6lI0
300
0
Effect of Aggregate Gradation, Cure Time, and Surcharge on Resilient Modulus at -6°C (3% Rubber 80/20 Blend).
II_ 120000
II_
100000
!lOOOO
80000
711000
_0 5GOOD -30000
20000
I-I
FATIIIIE IIIFl
l-
l-
I-
l-
I-
~ ~
No Cure Time
2 hrs Cure Time
X SIbs Surcharg
X X
;X
'0 ~ ~
~~ ~
Figure 4.29. Effect of Aggregate Gradation, Cure Time, and Surcharge on Fatigue Life at -6°C (3% Rubber BO/20 Blend).
101

~~~nsn~~~~'~I~S~~~II __________________________________ --, 3000 .-
27D0 Fine
Coat"se
2400
2100
1800
1500
1200
600
300
Figure 4.30. Effect of Rubber Gradations on Resilient Modulus ac -6°C (Gap-Graded Aggregate, 2% Rubber).
,,~~n~QE~Uff~~~~ ____________________________________ --, 100000 ...
Coarse
90000
80000 Hediu=
70000
60000
50000
40000
3II00D
20000
100DO
Figure 4.31. Effect of Rubber Gradations on Fatigue Life at -6°C (Gap-Graded Aggregate, 2% Rubber).
102
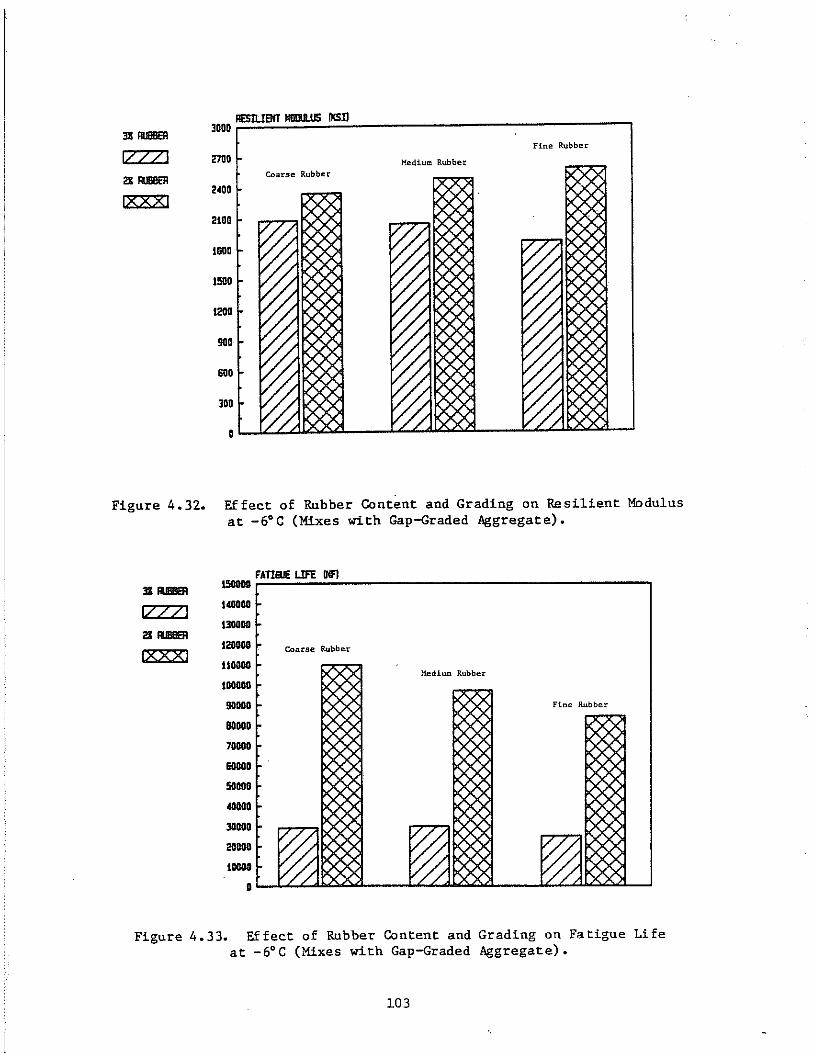
RESllIBIT II!IlJlLlJS IKSll 31 _ lOOO
Fine Rubber
IZZZI 2700 Medium Rubber
21_ Coarse Rubber
2400 IZZ:X:j
2100
1800
1500
12011
!!GO
SOD
lOO
0
Figure 4.32. Effect of Rubber Content and Grading on Resilient Modulus at -6°C (Mixes with Gap-Graded Aggregate).
I/ZZ] 21 _
IZZZI
I5000D FATI6IJE UFE Ui'I
140000
130000
12OtIOD
110000
100000
90000
BlIOOO
7DODO
60000
50000
40000
30000
20000
IDODO
I
Coarse Rubber
X)< X)<
~ ~
MediUJII Rubber
Fine Rubber
% % % ~ Figure 4.33. Effect of Rubber Content and Grading on Fatigue Life
at -6°C (Mixes with Gap-Graded Aggregate).
103
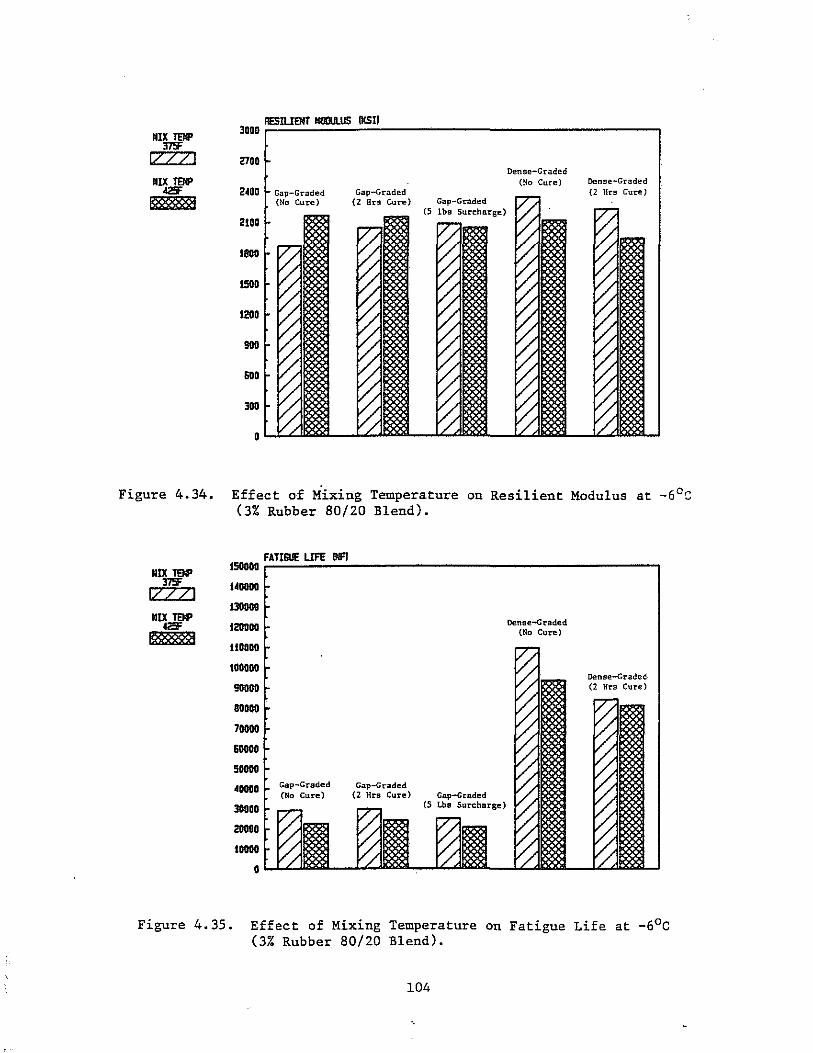
MIX TEIIP JOOO
375F I7ZZI 2700
NIX TEIIP oI2SF 2400
B8888Xi! 2100
II!OO
1500
1200
9911
600
300
0
RESIlIEIIT IIO!JWlS IXSII
iknge-Graded (No Cure) Dense-Graded
(2 Hrs Cure)
Figure 4.34. Effect of Mixing Temperature on Resilient Modulus at -6 0 S (3% Rubber 80/20 Blend) •
MIX TEIIP 375F
IZZZI
.. ~~TI~a£~Uff~~~~ ________________________________ -, 150000 ,..
UI!OOO
\30000
120000
110000
100000
90000
80000
71!OOO
60000
90000
40000
30000
20800
II!OOO
o
Gap-Graded (No Cure)
Gap-Graded (2 Hrs Cure) Gap-Graded
(5 Lbu Surchllrge)
Dense-Graded (No Cure)
Dense-Graded (2 Hrs Cure)
Figure 4.35. Effect of Mixing Temperature on Fatigue Life at -6oC (3% Rubber 80/20 Blend).
104
results at +10°C have the same relationship (lower fatigue life at higher
mixing temperature) as those found at -6°C. This is probably due to excessive
oxidation of the asphalt cement at the higher temperatures.
4.3.1.S Effect of Cure Time (0 vs. 2 hrs.). To evaluate·the effect of
cure time, samples were placed in the mold and cured in 37SoF and 42SoF ovens
for 2 hours prior to compaction. The effect of cure time on resilient modulus
and fatigue life for gap-graded and dense-graded aggregate is shown in Fig
ures 4.36 and 4.37. These figures show that the effect of cure time on resil
ient modulus and fatigue is not significant. This is contrary to the results
at +10°C. In most cases (gap-graded aggregate, coarse rubber), the cure time
increased modulus and fatigue life at -6°C very slightly.
4.3.1.6 Effect of Surcharge (0 va. SIbs.). The effect of surcharge on
resilient modulus and fatigue life is shown in Figures 4.38 and 4.39. These
figures show that the effect of surcharge on resilient modulus is very slight,
but the samples with surcharge have a lower fatigue life than the samples with
no surcharge. These results are contrary with those found at +10°C. This is
due to a change of behavior of rubber at low temperature. Generally rubber
lost its elasticity characteristic at low temperatures.
4.3.1.7 Effect of Air Voids (2% vs. 4%). The resilient modulus slightly
decreased when the air void content increased from 2% to 4% for the gap-graded
aggregate mix (Figure 4.40). However, the modulus of the dense-graded aggre
gate mix was reduced by 40% when the air void content was increased. The
difference in sensitivity to air voids between gap-graded aggregate (9.3%) and
dense-graded aggregate (7.S%) mixes can be attributed to asphalt content.
The fatigue life for both dense-graded and gap-graded mixes increased
with an increase in air voids (Figure 4.41). This is contrary to the conven
tional relationship between air voids and fatigue life. The main reason for
this inconsistent behavior is the mode of fatigue failure of the specimens.
All of the specimens with 4% air voids failed by plastic deformation, while
the specimens with 2% air voids failed by fracturing the sample.
IDS
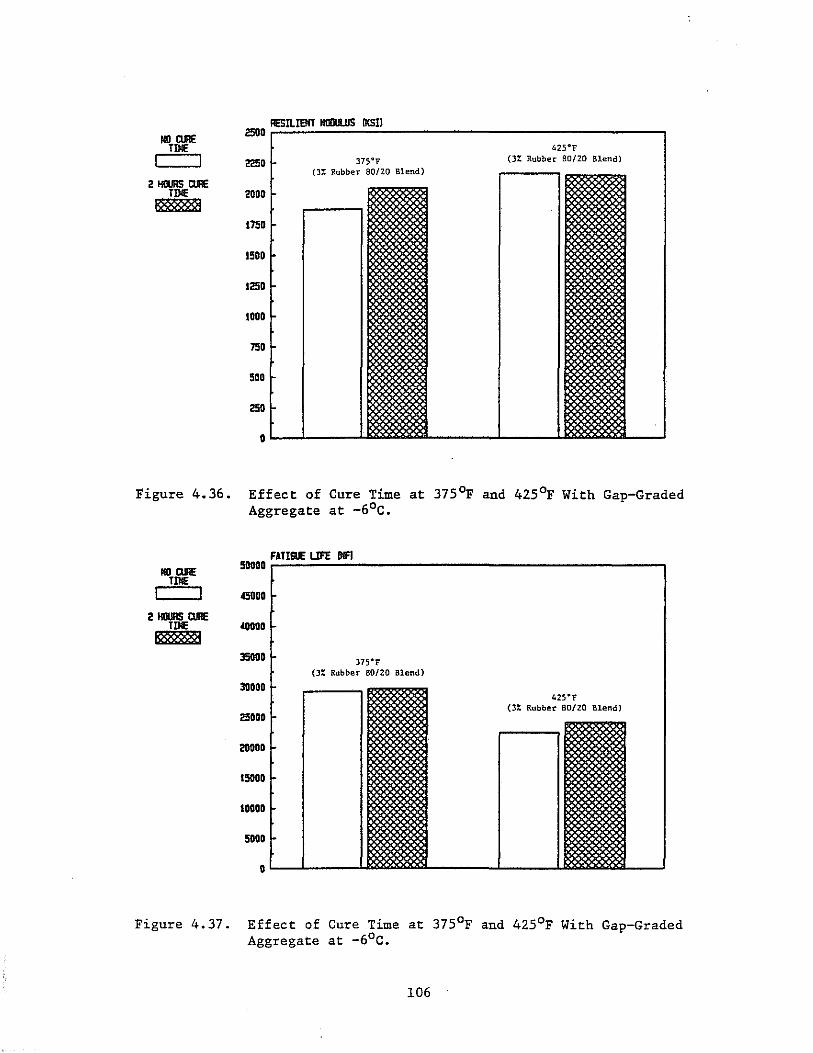
NO CIIlE TIllE
2 HOURS CIIlE
~.~R~I=err~mD=='='~5~~==I) ________________________________ ~ 2500 ....
425°r
2250 )75°r (3% Rubber BO/20 Blend) (3% Rubber 80/20 Blend)
TIllE 2D00 !O@X88
Figure 4.36.
1750
1500
1250
1000
750
500
250
oL-.....L __ .....L..I!:
Effect of Cure Time at 37SoF and 42SoF With Gap-Graded Aggregate at -6°c.
5DD00 ;.:n~T~==~un~~MR~ __________________________________ -,
6ODO
4000D
J5DD0 37s-r {J% Rubber 80/20 Blend}
30000 42S-F
(3% Rubber Bolza Blend) 25000
20000
1!5000
10000
5000
Figure 4.37. Effect of Cure Time at 375°F and 42SoF With Gap-Graded Aggregate at -6°C.
106
~ I I
5 LBS SlI!C!WI6E LXXX)
JOOO
2100
2400
2100
111110
1500
1200
900
3110
o
1IES1l.l00 IIOIlU..lIS IXSII
Dense-Graded
Gap-Graded
" X
X
f- X
~
Figure 4.38. Effect of Surcharge on Resilient Modulus at -6°C (3% Rubber 80/20 Blend).
~ I I
~ lXXx)
1501181 II-120800
u_ 1--80m
781D. -----1-o
FATI&IIE UFE IIIFI
Dense-Graded
f.
f. X f.
Gap-Graded
f. -
f- .l'
Figure 4.39. Effect of Surcharge on Fatigue Life at -6°C (3% Rubber 80/20 Blend).
107
GAP SIAD£lI
IlZZI
= !l88888l!
l8DD
2700
2400
2100
1001
!5DII
12IJII
9IMI
IiOO
3ID
•
;:m5~IL~IBIT~=wm~'='5~00il~J~ ____________________________ -;
4;: Air Void·;
2% Air Voids
Figure 4.40. Effect of Air Voids on Resilient Modulus at _6°C (3% Rubber 80/20 Blend).
FATIEI£ LIFE INFJ GAP 1-
SIAD£lI 1-IZ?71 4% Air Voids
I-
I-
I-
II-
1---7DIIIII - 2% Air Voida ----IDDDI
0
Figure 4.41. Effect of Air Voids on Fatigue Life at -6°C (3% Rubber 80/20 Blend).
108

4.3.1.8 Comparison of Rubber-Modified vs. Conventional Mix. The resil
ient modulus of conventional asphalt mix was approximately 40% higher than
gap-graded rubber mix and 25% higher than dense-graded rubber mix
(Figure 4.42). This relates directly to 9.3% asphalt used in gap-graded
rubber mix versus 7.5% in dense-graded rubber and 5.5% in conventional mix.
The fatigue life of conventional asphalt mix is approximately 600% lower
than dense-graded rubber mix and 88% lower than gap-graded rubber mix
(Figure 4.43). This confirms the high fatigue characteristics of rubber
modified asphalt mixes. However, the results at -Goe show a difference in the
optimum aggregate grading as compared to the mixes tested at +10·e. At -Goe
the dense-graded aggregate had the best fatigue life. At +10 oe the gap-graded
aggregate had the highest fatigue life.
4.3.2 Fatigue Results at -Goe
Fatigue curves were prepared for three different mix combinations-
samples with identification symbols A, N, T. The fatigue life for each com
bination was evaluated at three different strain levels. At least three
specimens were tested at each level of tensile strain.
The results of fatigue tests are summarized in Table 4.17. The averaged
logarithm fatigue life values versus logarithm of strains are shown as a
linear relationship in Figure 4.44.
4.4 Effect of Temperature on Modulus of Rubber Asphalt Mixtures
Twenty different mix combinations were tested at three different tempera
tures for resilient modulus. The specimen temperatures were controlled by
three linear response thermistors as described in Section 3.3.2. Tests for
diametral modulus were conducted at 100 microstrain, using a load duration of
0.1 s and a frequency of 1 Hz.
Table 4.18 summarizes the results of resilient modulus at different
temperatures for all 20 mix combinations. The effect of temperature on resil
ient modulus for typical rubberized asphalt mixture are shown in Figures 4.45
and 4.4G. The results show that the rubber-modified asphalt modulus has a
linear relationship with temperature. As temperature decreases, the modulus
increases with a constant slope.
109

~~~=nJ==~=T~mp~='I~~~~==IJ~ __________________________________ -,
Gap (3% Rubber 80/20 Blend)
1500
12110
Dense (3% Rubber 80/20 Blend)
Conventional Asphalt (No Rubber)
Figure 4.42. Effect of Rubber Content and Aggregate Gradation on Resilient Modulus at -6°C.
150000
\40000
\30000
1211000
\10000
10DDOO
SOOOO
l1li000
70000
5OO0B
50000 _0 lUDOD
ZOOOO
10000
o
;..:~~T~IQE~~LI~~~~~ __________________________________________ ~
Dense (3% Rubber 80/20 Blend)
Gop (3% Rubber 80/20 Blend)
Conventional Asphalt (No Rubber)
xX!
Figure 4.43. Effect of Rubber Content and Aggregate Gradation on Fatigue Life at -6oC.
110
Table 4.17. Summary of Fatigue Lives at Different Strain Levels (-6°C).
Fatigue Life
Sample Micro-strain Level Identification 70 100 130
A 68,752 29,237 19,263
N 199,227 118,186 73,262
T 14,250 8,526 2,526
c 2 ~
--: c ~
'" '0 ~ 1E2 .::0 c ~ d
" ~ ~
5 • ~ ~
• c • ... ...
'" 2
2 5 1E4 2 5 1E5 2 5 1E6 Number of Repetitions to Failure
Figure 4.44. Laboratory Fatigue Curves at -6°C.
III
Table 4.18. Summary of Resilient Modulus at Th~ee Different Tc=peratures.
Resilient Modulu8 Temperature Sat!lp1e .D (ksil (oe)
A 39 24 A 388 10 A 1,842 -7
8 56 24 B 307 10 B 2,191 -7
C 50 24 C 361 10 C 2,000 -7
D 49 23 D 335 10 0 1,809 -7
E 53 23 E 373 10 E 2,157 -7
F 49 23 F 383 10 F 2,049 -7
G 51 22 G 285 11 G 1,747 -7
H 98 22 H 511 13 H 2,301 -7
I 91 22 I 464 12 I 2,049 -7
J 40 24 J 311 10 J 1,657 -7
K 83 24 K 454 10 K 2,583 -7
L 107 24 L 603 10 L 2,616 -7
!I 124 22 !I 606 12 !I 2,613 -7
N 99 23 N 673 10 N 2,651 -7
0 157 23 0 811 10 0 2,503 -6 p 88 24 P 667 10 P 2,111 -6
Q 113 24 Q 811 11 Q 2,027 -6
R 72 23 R 409 10 R 1,947 -6
S 57 22 S 209 13 S 1,610 -6 T 167 22 T 1,146 11 T 3,354 -6
112
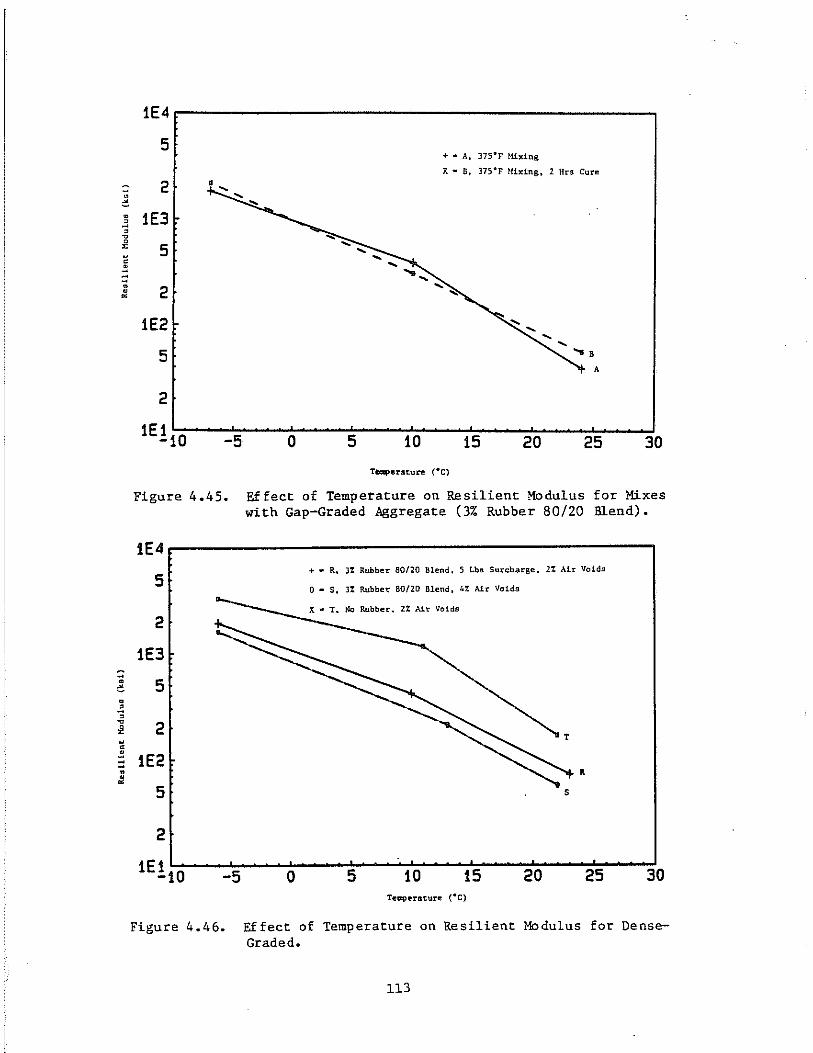
~ · ~ · .:: , ~ 0 ~
" c !i ~ ~ · • ~
::; • ~
• .:: , ~
i! " c !i :: • ~
1E4
5
2 •
1E3
5
2
1E2
5
2
1E!10 -5
Figure 4.45.
1E4
5
2
1E3
5
2
1E2
5
2
1E!10 -5
+ .. A, 375°F lllxing
X· B, 375°F ~Iixing. 2 Ht'9 Cure
....
....
A
0 5 10 15 20 25 30 Tbmperature (·e)
Effect of Temperature on Resilient Modulus for Mixes with Gap-Graded Aggregate (3% Rubber 80/20 Blend).
+ • R, J% Rubber SO/20 Blend. 5 Lbs Surcharge, 2% Air Voids
o - S, 3% Rubber BO/20 Blend, 4% Air Voids
• s
o 5 10 15 20 25 30
Figure 4.46. Effect of Temperature on Resilient Modulus for DenseGraded.
113
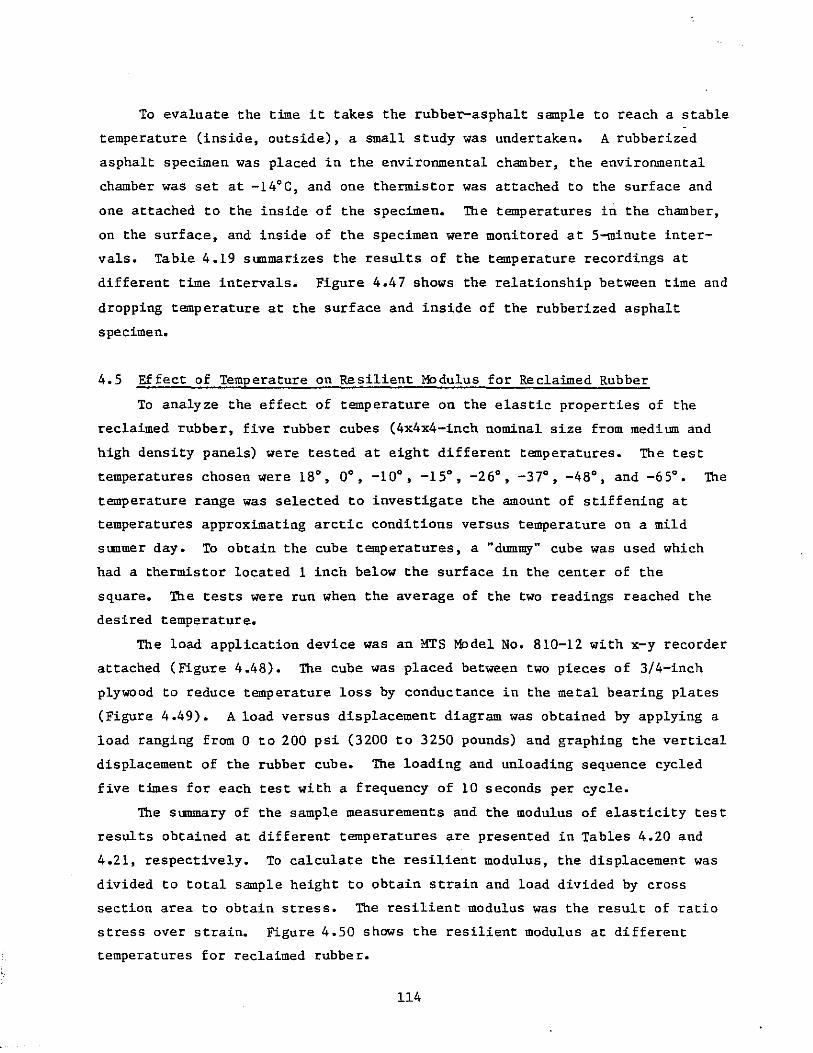
To evaluate the time it takes the rubber-asphalt sample to reach a stable
temperature (inside, outside), a small study was undertaken. A rubberized
asphalt specimen was placed in the environmental chamber, the environmental
chamber was set at -14°C, and one thermistor was attached to the surface and
one attached to the inside of the specimen. The temperatures in the chamber,
on the surface, and inside of the specimen were monitored at 5-m1nute inter
vals. Table 4.19 summarizes the results of the temperature recordings at
different time intervals. Figure 4.47 shows the relationship between time and
dropping temperature at the surface and inside of the rubberized asphalt
specimen.
4.5 Effect of Temperature on Resilient Modulus for Reclaimed Rubber
To analyze the effect of temperature on the elastic properties of the
reclaimed rubber, five rubber cubes (4x4x4-inch nominal size from medium and
high density panels) were tested at eight different temperatures. The test
temperatures chosen were 18°, 0°, -10°, -15°, -26°, -37°, -48°, and -65°. The
temperature range was selected to investigate the amount of stiffening at
temperatures approximating arctic conditions versus temperature on a mild
summer day. To obtain the cube temperatures, a "dummy" cube was used which
had a thermistor located 1 inch below the surface in the center of the
square. The tests were run when the average of the two readings reached the
desired temperature.
The load application device was an MTS Model No. 810-12 with x-y recorder
attached (Figure 4.48). The cube was placed between two pieces of 3/4-inch
plywood to reduce temperature loss by conductance in the metal bearing plates
(Figure 4.49). A load versus displacement diagram was obtained by applying a
load ranging from 0 to 200 psi (3200 to 3250 pounds) and graphing the vertical
displacement of the rubber cube. The loading and unloading sequence cycled
five times for each test with a frequency of 10 seconds per cycle.
The summary of the sample measurements and the modulus of elasticity test
results obtained at different temperatures are presented in Tables 4.20 and
4.21, respectively. To calculate the resilient modulus, the displacement was
divided to total sample height to obtain strain and load divided by cross
section area to obtain stress. The resilient modulus was the result of ratio
stress over strain. Figure 4.50 shows the resilient modulus at different
temperatures for reclaimed rubber.
114
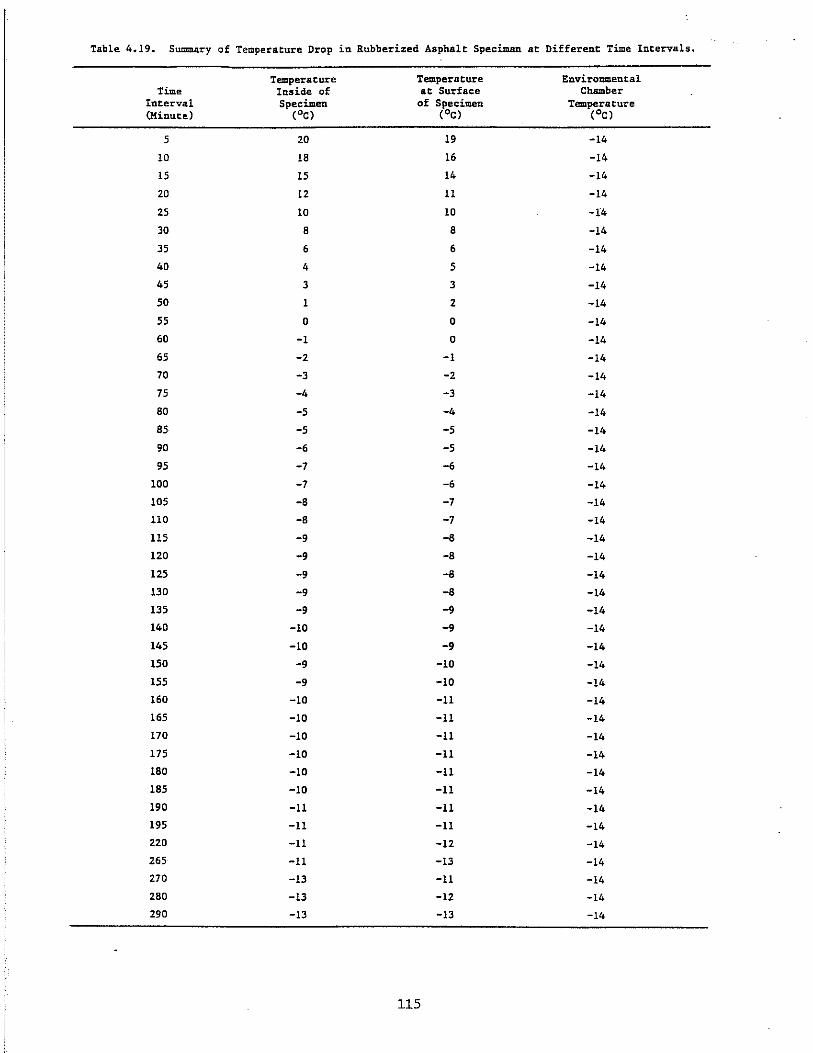
Table 4.19. Summary of Temperature Drop in Rubberized Asphalt Speeiman at Different Time Intervals.
Temperature Temperature Environmental Time Inside of at Surface Chamber
Interval Specimen of Specimen Temperature (Minute) (oC) (oC) (oC)
5 20 19 -14
10 IB 16 -14
15 15 14 -14
20 12 11 -14
25 10 10 -1'4
30 B B -14
35 6 6 -14
40 4 5 -14
45 3 3 -14
50 1 2 -14
55 0 0 -14
60 -1 0 -14
65 -2 -1 -14
70 -3 -2 -14
75 -4 -3 -14
BO -5 -4 -14
B5 -5 -5 -14
90 -6 -5 -14
95 -7 -6 -14
100 -7 -6 -14
105 -B -7 -14
llO -B -7 -14
ll5 -9 -B -14
120 -9 -B -14
125 -9 -B -14
130 -9 -B -14
135 -9 -9 -14
140 -10 -9 -14
145 -10 -9 -14
150 -9 -10 -14
155 -9 -10 -14
160 -10 -ll -14
165 -10 -11 -14
170 -10 -ll -14
175 -10 -ll -14 IBO -10 -ll -14
IB5 -10 -11 -14 190 -ll -ll -14 195 -11 -11 -14 220 -11 -12 -14 265 -11 -13 -14 270 -13 -11 -14 2BO -13 -12 -14 290 -13 -13 -14
115

..... ..... '"
400
360
320
.. 2BO
240 ~
<l
g 200 ~ H 160
120
BO
40
0 -30.0 -20.0
x = Environmental Chamber Temperature
+ = Temperature Inside of Specimen
o = Temperature at Surface of Specimen
.,-,-'-,-,-
''-,-, II
-10.0 0.0 Temperature (OC)
IJ
10.0
-, -, -, -,-Fa
20.0
Figure 4.47" Time Required for Sample to Stabilize at Test Temperature of -13°C.
30.0

Figure 4.48. Load Application Device (MTS).
t )
Figure 4.49. Rubber Cube Testing Setup.
117

Table 4.20. Sample Characterization.
Sample Unit Sample Average Dimensions Weight Weight
ID (ht x sa) (lbs) (lbs/ft3)
23-Y 4-1/8 inch x 16.47 inch2 2.704 68.78
24-Y 4-1/8 inch x 16.47 inch2 2.690 68.42
19-B 4-1/16 inch x 15.37 inch2 2.266 62.71
23-B 4 inch x 14.76 inch2 2.277 66.64
24-B 4 inch x 14.30 inch2 2.238 67.61
Table 4.21. Temperature Effects on Modulus of ElasticitV' •
Average Sample Temperature wad Displac.e!1lent M:Jdulus i'bdulus
tD ( 'C) (lb) (inch) (psi) (psi)
23-Y 18 3235 0.8753 926 24-Y 18 3256 0.8655 942 924 19-8 18 3256 0.9531 903
23-Y 0 3256 0.7683 1061 24-Y 0 3256 0.8169 998 1017 23-B 0 3212 ·0.8947 973 24-8 0 3212 0.8655 1038
23-Y -10 3235 :0.6613 1225 24-Y -10 3235 ·0.6123 1322 1253 23-8 -10 3212 0.7590 1147 24-8 -10 3212 0.6810 1319
19-B -16 3212 0.8052 1054 13-B -16 3212 0.8072 1078 24-B -16 3212 0.7586 1184 1129 19-Y -16 3203 0.6652 1273 23-Y -16 3203 0.7352 1091 24-Y -16 3203 0.7333 1094
19-6 -26 3210 0.5932 1430 23-B -26 3212 0.6419 1364 24-6 -26 3212 0.5835 1539 1761 19-Y -26 3212 0.4824 1760 23-Y -26 3203 0.3793 2115 24-Y -26 3203 0.3404 2356
19-Y -37 3212 0.3105 2816 23-Y -37 3212 0.5252 1532 24-Y -37 3190 0.5057 1580 2071 19-8 -37 3203 0.4085 2072 23-8 -37 3203 0.4182 2076 24-6 -37 3190 0.3793 2353
19-Y -48 3212 0.0973 8725 23-Y -48 3212 0.0973 8263 24-y -48 3212 0.1400 5746 6772 19-B -48 3212 0.1459 5819 23-8 -48 3212 0.1751 4971 24-6 -48 3212 0.1264 7108
23-6 -65 1256 0.0389 22683 24-6 -65 1256 0.0389 23413 23048
118

1E5rf------------------------------------~
5
2
1E4 ~
"'" 0
~ .,., 5 Ul
P< ~
Ul
" .... " 21 "" 0
..... :>: ............. 0
..... '"'
.., 1E3
1 <l OJ .,., ------ 0
.... . ,., Ul
3l 5
2 1 E2 I I I I I I I I
-70 -55 -40 -25 -10 5 20 Temperature (DC)
Figure 4.50. Resilient Modulus vs. Temperature for Reclaimed Rubber.
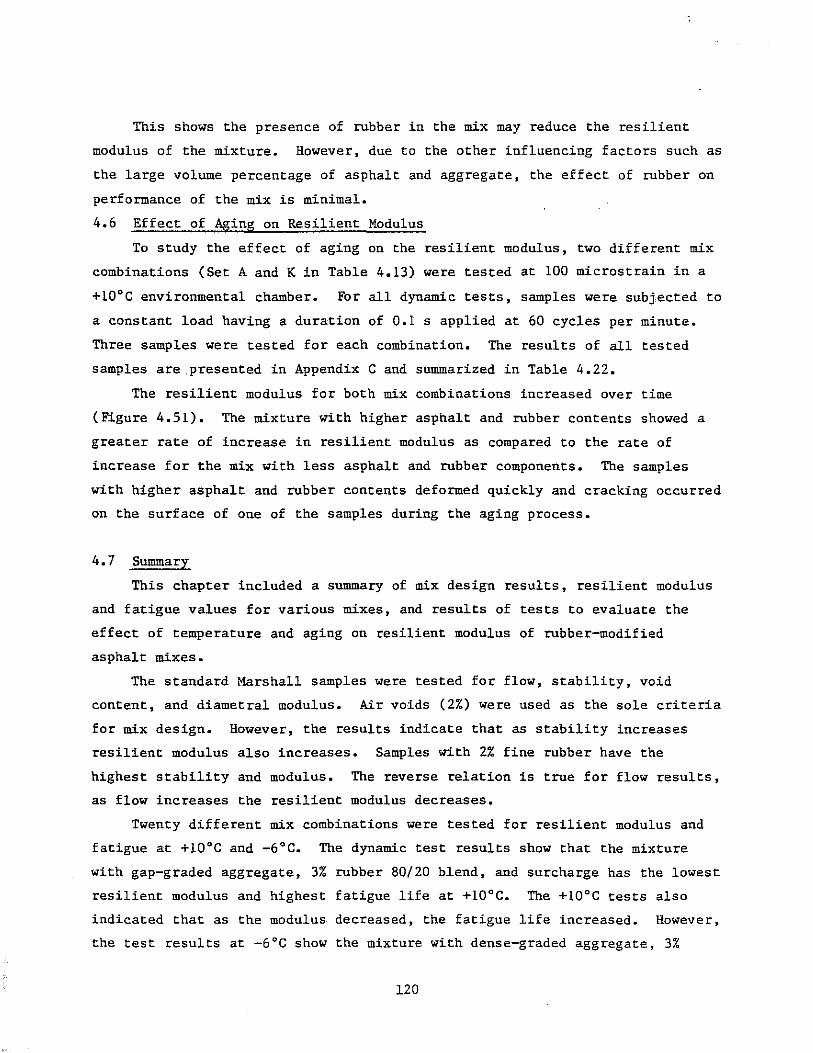
This shows the presence of rubber in the mix may reduce the resilient
modulus of the mixture. However, due to the other influencing factors such as
the large volume percentage of asphalt and aggregate, the effect of rubber on
performance of the mix is minimal.
4.6 Effect of Aging on Resilient Modulus
To study the effect of aging on the resilient modulus, two different mix
combinations (Set A and K in Table 4.13) were tested at 100 microstrain in a
+10°C environmental chamber. For all dynamic tests, samples were subjected to
a constant load having a duration of 0.1 s applied at 60 cycles per minute.
Three samples were tested for each combination. The results of all tested
samples are .presented in Appendix C and summarized in Table 4.22.
The resilient modulus for both mix combinations increased over time
(Figure 4.51). The mixture with higher asphalt and rubber contents showed a
greater rate of increase in resilient modulus as compared to the rate of
increase for the mix with less asphalt and rubber components. The samples
with higher asphalt and rubber contents deformed quickly and cracking occurred
on the surface of one of the samples during the aging process.
4.7 Summary
This chapter included a summary of mix design results, resilient modulus
and fatigue values for various mixes, and results of tests to evaluate the
effect of temperature and aging on resilient modulus of rubber-modified
asphalt mixes.
The standard Marshall samples were tested for flow, stability, void
content, and diametral modulus. Air voids (2%) were used as the sole criteria
for mix design. However, the results indicate that as stability increases
resilient modulus also increases. Samples with 2% fine rubber have the
highest stability and modulus. The reverse relation is true for flow results,
as flow increases the resilient modulus decreases.
Twenty different mix combinations were tested for resilient modulus and
fatigue at +10°C and _6°C. The dynamic test results show that the mixture
with gap-graded aggregate, 3% rubber 80/20 blend, and surcharge has the lowest
resilient modulus and highest fatigue life at +10°C. The +10°C tests also
indicated that as the modulus decreased, the fatigue life increased. However,
the test results at -6°C show the mixture with dense-graded aggregate, 3%
120
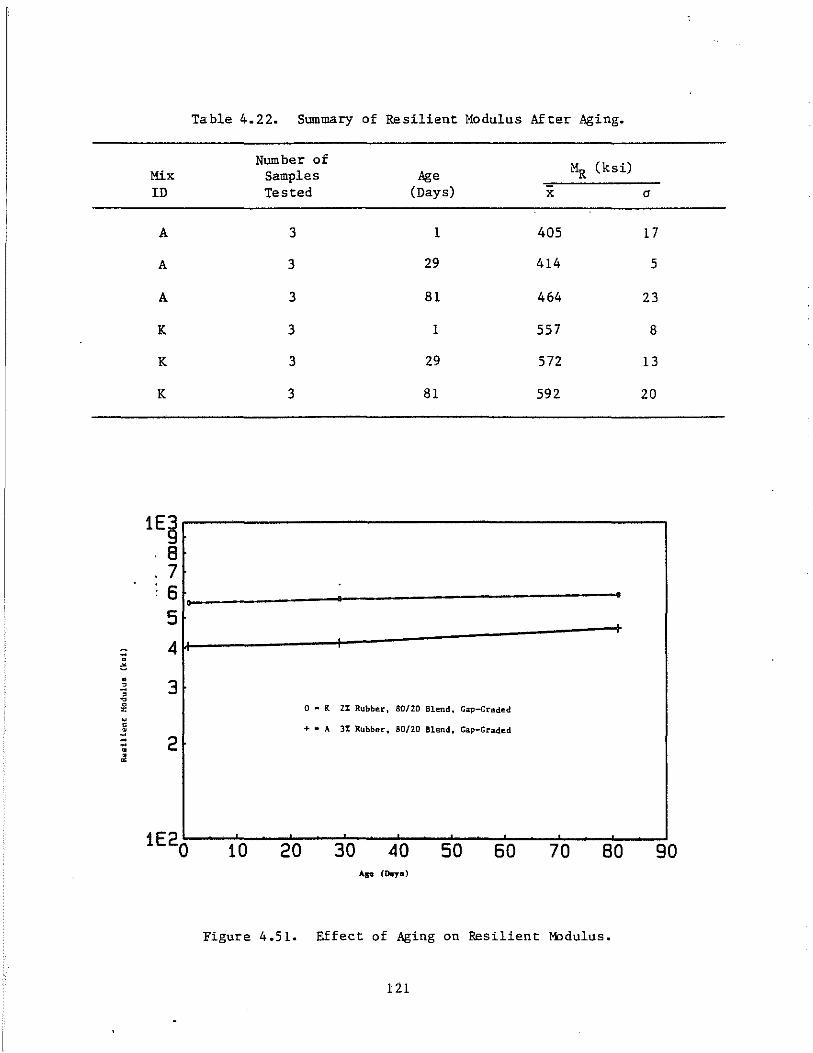
Mix ID
A
A
A
K
K
K
1E~ 8 7 6 o
Table 4.22. Summary
Number of Samples Tested
3
3
3
3
3
3
of Resilient Modulus After Aging.
Age MR (ksi)
(Days) x
1 405
29 414
81 464
1 557
29 572
81 592
o
5
4~----~--------------3
o • K 2% Rubber, 80/20 Blend, Gap-Graded
+ • A 3% Rubber. 80/20 Blend, Gap-Graded
2
(j
17
5
23
8
13
20
1E20~~1~O--~20~-3~O~-4~O~~5~O--~6~O--~7~O--~8~O--~90 Age (0.,-0)
Figure 4.51. Effect of Aging an ReSilient Modulus.
121
rubber 80/20 blend, with the highest fatigue life. Further, the results at
-6°C indicated no direct relation between modulus and fatigue.
The effect of aggregate gradation on resilient modulus for both tempera
tures (+lO°C, -6°C) are similar. The dense-graded aggregate has a higher
modulus value. The effect of fatigue on aggregate gradation at two different
temperatures (+lO°C, -6°C) was reversed. At -6°C, the fatigue life was less
for mixes with gap-graded aggregate than mixes with dense-graded aggregate.
No explanation for this behavior can be offered at this time.
The effect of rubber gradation on resilient modulus at both temperatures
are consistent. The mixture with coarse rubber has the lowest modulus and
highest fatigue life. The higher mixing temperature increases resilient
modulus in all cases. Mixes prepared with the higher mixing temperature
(425°F) showed increased fatigue life for the gap-graded aggregate and de
creased fatigue life for the dense-graded aggregate. The differences in
asphalt content could be a strong factor in this behavior.
The effect of cure time on mix properties at both temperatures were not
significant. The effect of surcharge increased the fatigue at +lO°C and
decreased the fatigue life at -6°C in all cases. The effect of air voids was
interesting, as increasing the air voids in the mix from 2% to 4% increased
the fatigue life at both temperatures. This is contrary to the conventional
relationship between air voids and fatigue. Additional work is definitely
needed to evaluate the effect of voids over a range of 2 to 8 percent.
Twenty different mix combinations were tested at three different tempera
tures (+24°C, +lO°C, -7°C) for resilient modulus. The results show that the
stiffness decreases, as expected, with increasing temperature.
The effect of temperature on modulus of compacted rubber buffings were
analyzed. The reclaimed rubber cubes were tested at eight different tempera
tures. The results show that stiffness increases, as expected, with
decreasing temperature. However, the rate of increase of stiffness as
temperature decreases was slight (9% of increase when the temperature dropped
from 18°C to DOC).
To study the effect of aging on the resilient modulus, two different mix
combinations were tested. The resilient modulus for both mix combinations
increased slightly over time.
122
5.0 ANALYSIS OF DATA
The purpose of this chapter is to bring together selected test data and
project information to estimate the effects of mixture variables on pavement
life. Layered elastic theory was used with the material properties developed
and project information supplied to evaluate the effect of mix variations on
pavement life and to establish layer equivalencies from rubber asphalt
mixes. These data are also used to evaluate the economics of rubber-modified
and conventional mixes by equivalent annual cost methods. Finally, guidelines
are developed to indicate the best uses for rubber-modified asphalt mixes.
5.1 Layered Elastic Analysis
One of the main benefits of rubber-modified asphalt concrete over conven
tional mixes is increased pavement fatigue life. However, rubber-modified
asphalt concrete generally costs more per ton to produce than conventional
mixes, due to the rubber costs and additional asphalt cement required. To
justify this increased cost and to compare the response to wheel loadings of
rubberized pavement with conventional pavement systems, elastic layered theory
was used. The procedure and results of these studies for rubber-modified
asphalt are described in the following sections.
5.1.1 Analysis Procedure
The Elastic Layer System Computer Program (ELSYM5) was used to analyze
the typical pavement structures shown in Figure 5.1. Output from this program
includes stresses, strains, and displacements. For a more complete descrip
tion of ELSYMS, the reader should refer to reference (38).
As seen in Figure 5.1, three pavement structures were evaluated using
ELSYMS. The layer equivalencies for three seasons (winter, spring thaw,
spring/fall) were evaluated for three different surface thicknesses (2, 4, and
6 inches). The analysis for the summer season was not included because
fatigue curves were not available at 20 o e. The modulus for the surface and
subgrade varied for each season. The base modulus was assumed to be 1.5 times
the subgrade modulus. The values for surface resilient modulus were obtained
from laboratory-made samples described in Sections 4.2 and 4.3. The resilient
123
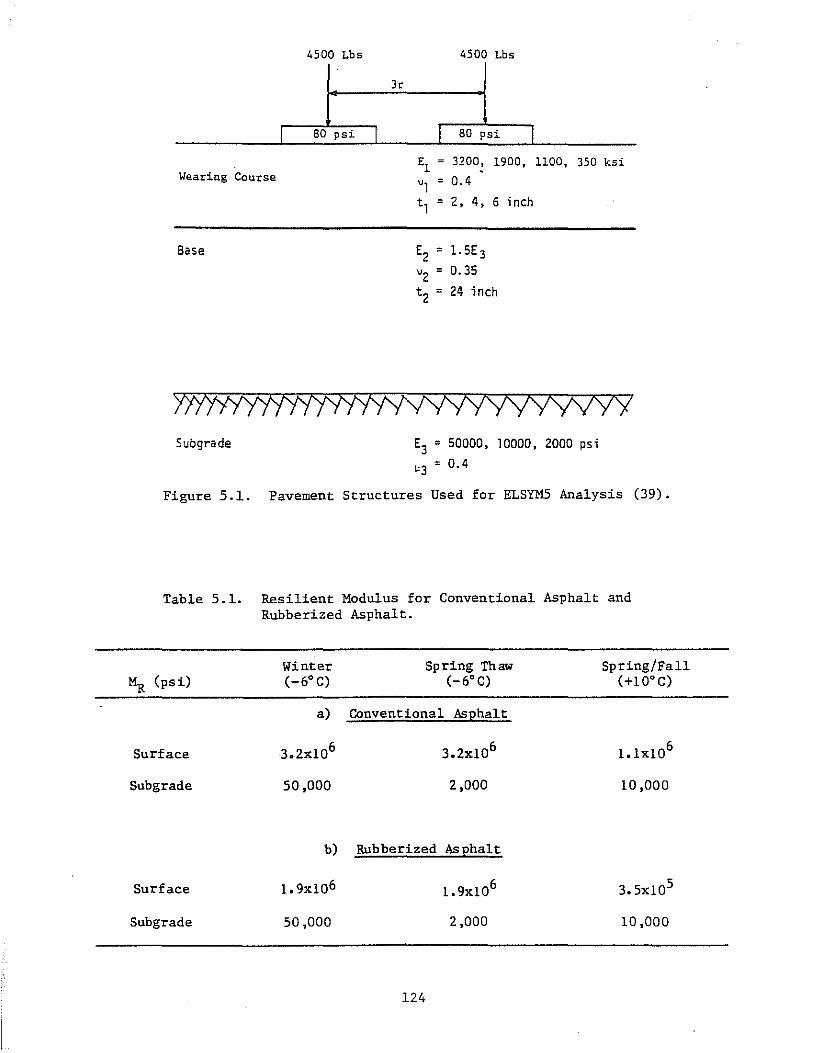
4500 Lbs
3r
I 80 psi I
Wearing Course
Base
Subgrade
4500 Lbs
I 80 psi I E1 = 3200: 1900, 1100, 350 ksi
", = 0.4 t, = 2, 4, 6 inch
E = 2 1. 5E 3
"2 = 0.35
t = 2 24 inch
E3 = 50000, '0000, 2000 psi
"3 = 0.4
Figure 5.1. Pavement Structures Used for ELSYMS Analysis (39).
Table 5.1. Resilient Modulus for Conventional Asphalt and Rubberized Asphalt.
Ha (psi)
Surface
Subgrade
Surface
Subgrade
Winter (-6° C)
Spring Thaw (_60 C)
a) Conventional Asphalt
50,000 2,000
b) Rubberized Asphalt
50,000 2,000
124
Spring/Fall (+1 00 C)
10,000
10,000
modulus values for subgrade were obtained from Alaska DOT & PF (39).
Table 5.1 shows the surface and subgrade resilient modulus for rubberized
asphalt and conventional asphalt in four different conditions.
The procedure used to determine the layer equivalency of the rubber
modified asphalt is outlined in the flow chart in Figure 5.2. The laboratory
determined fatigue curves normally indicate expected pavement lives less than
field experience would indicate. To adjust these curves, a shift factor was
determined by comparing the conventional mix laboratory fatigue life curves to
the fatigue curves developed by Monismith (40) shown in Figure 5.3.
After the fatigue curves were shifted, representative lives were selected
(105 , 106 , 107 ) and the allowable strains determined. These strain values
were input to a plot of Eac versus thickness, and the thicknesses required for
the conventional and rubber-modified mixes were determined. The ratio of the
required thicknesses is the layer equivalency for rubberized asphalt.
5.1.2 Estimation of Shift Factor
As described in Section 5.1.1, a "shift" factor was developed using a
typical fatigue life curve from the Monismith and laboratory results shown in
Table 5.2 (40). This shift factor was determined by averaging the ratio of
fatigue life from Monismith to control mix life at both the 100 and 200
micros train levels. The shift factor of 90 corresponds to an average shift
factor in the +lO°C and -6°C fatigue curves.
5.1.3 Results
The results obtained from the ELSYM5 analysis, utilizing the cross sec
tions shown in Figure 5.1, are summarized by Table 5.3. Laboratory fatigue
life curves were developed for both rubber-modified and control mixes at +lO°C
and -6°C and shifted by a factor of 90 (Table 5.4). The shifted fatigue lives
for rubber-modified and control asphaltic concrete were plotted against ten
sile strain for the different seaSOns in Figure 5.4. To determine the layer
equivalency of rubber-modified asphalt, a value of repetitions
was input to Figures 5.4a and b. The Nf values used were 105 ,
to failure (Nf ) 6 7 10 , and 10 •
These allowable tensile strain for conventional and rubber-modified mixes for
each season was thereby determined. The allowable strains were used in
125

Data Input to ELSYM5
... II""
Compare conventional asphalt laboratory
fatigue curves to typical fatigue
relationships to determine shift ,
factor. Apply this shift factor
to rubber and control mix to
estimate repetitions to failure
in the field.
" P-
Use repetition levels at 105 , 106 , and 107 to
determine allowable tensile strains.
... l.-
From plot of thickness verSus
tensile strain, determine necessary
thickness for conventional asphalt
and rubber-modified mixes.
... II""
Ratio of pavement thickness yields layer
equivalence factor.
Figure 5.2. Flow Chart for Determination of Layer Equivalencies.
126
.s -.s ~ , s .! .s • t ~
~ • c • ... " ~
-~ .s ~ , S .! .s • " ~
• · c • .. " w
1E3
5
2 ... .... .... .... .... 1E2 Ccrntrol Mix ....
5
2
Typical Fatigue Curve (After Monismith)
Stiffnesa • 1%106 psi
.... .... .... ....
.... .... .... .... .... .....
1E1~~~~~--~~~~~~~~~~~--~~
1E2 2 5 1E3 2 5 1E4 2 5 1E5 2 5 1E6 2 5 .1E7 Nf • Nuaber of Repetitions to Failure
a) Fatigue Curves at +10°C 1E3r----------------------------------------.
5
Typical Fat1sue Curve (After Honismith)
2 Stiffness - 4%106 psi
1E2 Control H.b:
5
2
Nf
• Number of RepetitioDs to failure
b) Fatigue Curves at -6 DC
Figure 5.3. Comparison of Laboratory and Field Fatigue Curve.
127 .
Table 5.2. Summary of Data for Shift Factor Determination.
Source of Data Strain
a) @ +lOoe (E = lxl0 6 psi)
Yoder and Witzak (40) 100
200
400
Laboratory Data @ +10o e 85
100
150
b) @ -6°e (E = 4xl0 6 psi)
Yoder and Witzak 100
200
400
Laboratory Data @ _6°e 70
100
130
128
Fatigue Life
1,000,000
601,000
2,000
12,997
9,323
2,826
800,000
20,000
300
14,250
8,526
2,526
Table 5.3. Tensile Strains from ELSYMS Runs.
Max. Tensile Strain
Surface Surface Base Subgrade .. E ac ' in Thickness Asphalt Modulus Modulus Modulus Layer 1
(in. ) Type* (psi) Season (psi) (psi) 10-6. /. l.n. l.n.
2 AC 3,200,000 Winter 75,000 50,000 91
4 AC 3,200,000 Winter 75,000 50,000 53
6 AC 3,200,000 Winter 75,000 50,000 34
2 AR 1,900,000 Winter 75,000 50,000 114
4 AR 1,900,000 Winter 75,000 50,000 73
6 AR 1,900,000 Winter 75,000 50,000 48
2 AC 3,200,000 Spr. Thaw 3,000 2,000 320
4 AC 3,200,000 Spr. Thaw 3,000 2,000 129
6 AC 3,200,000 Spr. Thaw 3,000 2,000 69
2 AR 1,900,000 Spr. Thaw 3,000 2,000 461
4 AR 1,900,000 Spr. Thaw 3,000 2,000 197
6 AR 1,900,000 Spr. Thaw 3,000 2,000 108
2 AC 1,100,000 Spr./Fall 15,000 10,000 348
4 AC 1,100 ,000 Spr./Fall 15,000 10,000 187
6 AC 1,100,000 Spr./Fall 15,000 10,000 118
2 AR 350,000 Spr./Fall 15,000 10,000 591
4 AR 350,000 Spr ./Fall 15,000 10,000 380
6 AR 350,000 Spr./ Fall 15,000 10,000 254
*AC = Asphalt Concrete, AR = Rubber Modified Asphalt Concrete
129
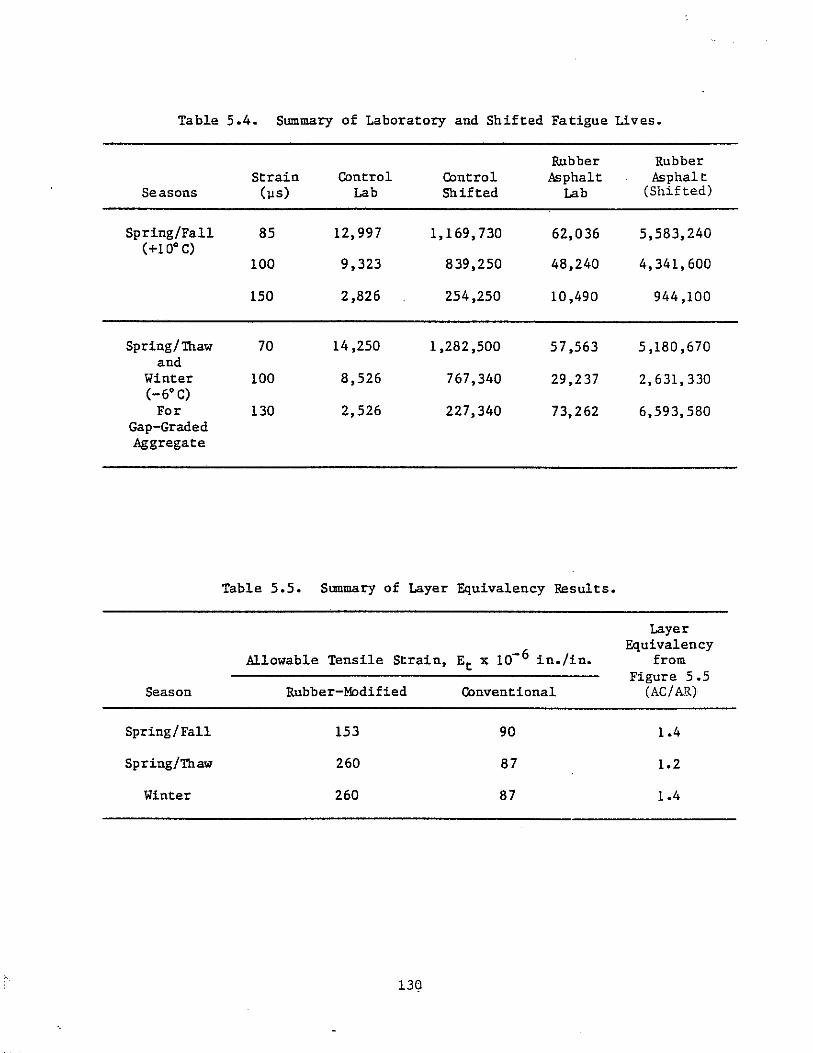
Table 5.4. Summary of Laboratory and Shifted Fatigue Lives.
Rubber Rubber Strain Control Control Asphalt Asphal t
Seasons (Ils) Lab Shifted Lab (Shifted)
Spring/Fall 85 12,997 1,169,730 62,036 5,583,240 (+10·C)
100 9,323 839,250 48,240 4,341,600
150 2,826 254,250 10,490 944,100
Spring/Thaw 70 14,250 1,282,500 57,563 5,180,670 and
Winter 100 8,526 767,340 29,237 2,631,330 (-6·C)
For 130 2,526 227,340 73,262 6,593,580 Gap-Graded Aggregate
Table 5.5. Summary of Layer Equivalency Results.
Layer
-6 / Equivalency
Allowable Tensile Strain, Et x 10 in. in. from Figure 5.5
Season Rubber-Modified Conventional (Ae! Ail)
Spring/Fall 153 90 1.4
Spring/Thaw 260 87 1.2
Winter 260 87 1.4
130

-~ c
'0 x
c
~ ~
~ .. c • ... -" ~
~
"" ~ , ;; • c .. " ~
! • c {!.
~
1E3
5
2
1E2
5
2
1E1 1E4
1E3
5
2
1E2
5
2
1E1 1E5
~"""'.-. ......... Rubber-Modified Mix ----------.-. ................
.-....--.... ---Centrol Mix --."
2 5 1E5 2 5 1E6 2 5 1E7 Nf • Number of Repeclt10ns to Failure
a) Spring/ Fall (+l0° C)
ubber-Mod1f1ed Mix
Control Mix
2 5 1E6 2 5 1E7 2 5 1EB N
f• Huaber of Repetltltons to Failure
b) Spring Thaw and Winter (_6 0 C)
Figure 5.4. Shifted Laboratory Fatigue Curves.
131
Figure 5.5 to obtain the required thickness for the respective mixes. The
ratio of the conventional to rubber-modified mix thickness yields a layer
equivalency (Table 5.5).
The layer equivalency ratios correspond to an approximately 20 to 30%
reduction in surface thickness versus that of conventional asphaltic concrete
surface.
5.2 Material Costs
The purpose of this section is to identify the cost of the rubber
modified asphalt pavements, which have been placed in various areas throughout
Alaska, as compared with the conventional form of asphalt surfacing. The
total mix price and the price for the asphalt binder material, as shown in
Tables 5.6, 5.7, and 5.8, were supplied by ADOTPF personnel from actual con
tract unit prices on projects in the Anchorage, Fairbanks, and Juneau areas
(41). The binder costs already include a general contractor's markup for
overhead and profit.
The rubber material used on all the projects was furnished according to
Plus ride specifications and supplied by Rubber Granulators of Everett, Wash
ington (42). The quote used for rubber came directly from Rubber Granulators
and was based on the equivalent price for an 80% coarse and 20% fine blend.
The blend cost for materials is approximately 11.5 cents per pound with 8.5
cents per pound added for shipping to Alaska. The royalty quote of $4.50 for
the rubber was obtained from All Seasons Surfacing Corporation of Bellevue,
Washington (43).
Tables 5.6, 5.7, and 5.8 also show the relative component percentages of
the total mix cost. The values shown for the conventional asphalt cement
(dollars per ton column) were estimated from the given values for binder and
total mix cost and typical component percentages which were supplied by a
Corvallis, Oregon paving contractor (44). The component percentages for the
Plus ride material were determined by using the given cost information for
binder, rubber, royalty, and total mix, and by transferring the remaining
component costs from the respective conventional mix to the rubber-modified
cost column. Some of the transferred costs include a price adjustment to
reflect estimated cost increases. By using these tables, the engineer can
focus attention on the components of the rubber-modified process which, if
132
/
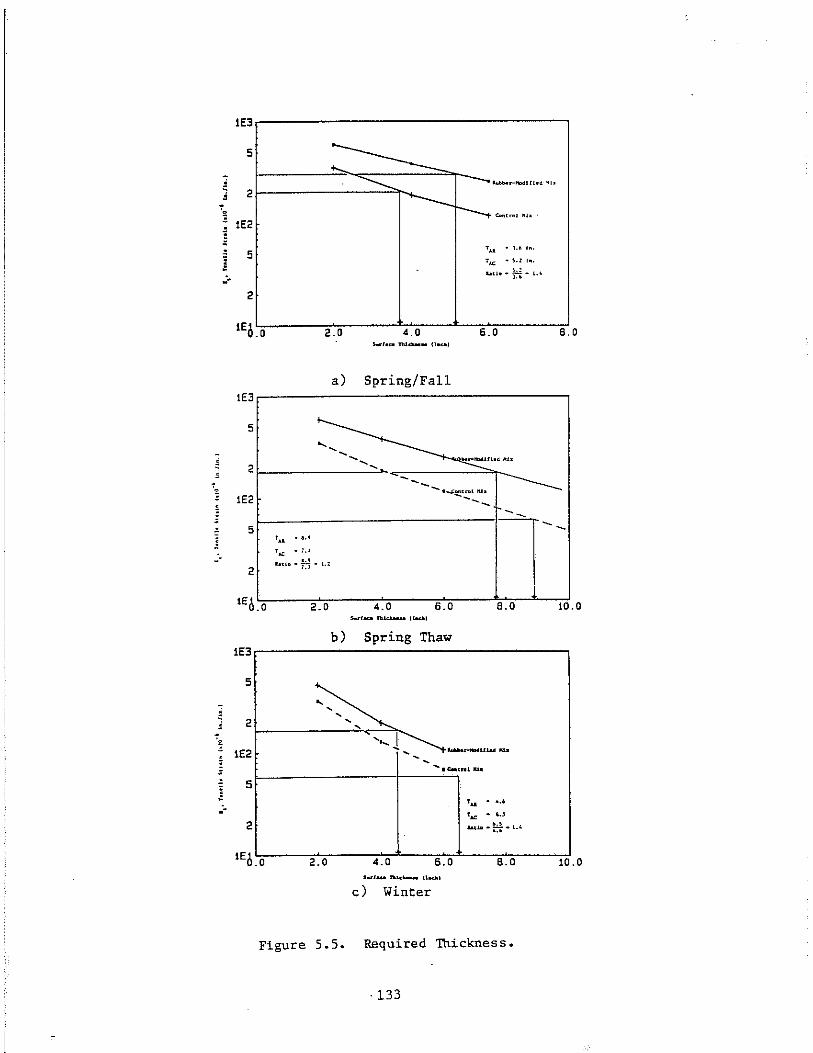
IE3
5 ::------.; 2 ~
- IE2
---- ~l>u-I""nfl.d ~I.
'-----I----.. ~.,~, " .. ~
5 ! . -
'u • l.~ 'ft.
,~ • ~.: I ••
. ... tI·~H-l ..
2
2.D 4.D 6.D 8.D
a) Spring/Fall IE3
5
~ 2 , - IE2
~"'''''' -- ----------- .-J'~t.:::: --. 5
~ .--
2
' .. . .. , l--,~ • 1.1
... " .. H . l.~
1 2_D 4.0 6.0 8.0 10.0
b) Spring Thaw IE3
5
~ 2 - ~
'3 IE2
' ... 1 ........... _Ul..aollll. , , ,
..... C..nl JI1a . 5
~ 'u . ~ .. . - ,~ ... , 2 1,IoC10 _ ~ _ 1.4
'.'
IEO.O 2.0 4.0 6.0 B.O 10.0
c) Winter
Figure 5.5. Required Thickness.
·133
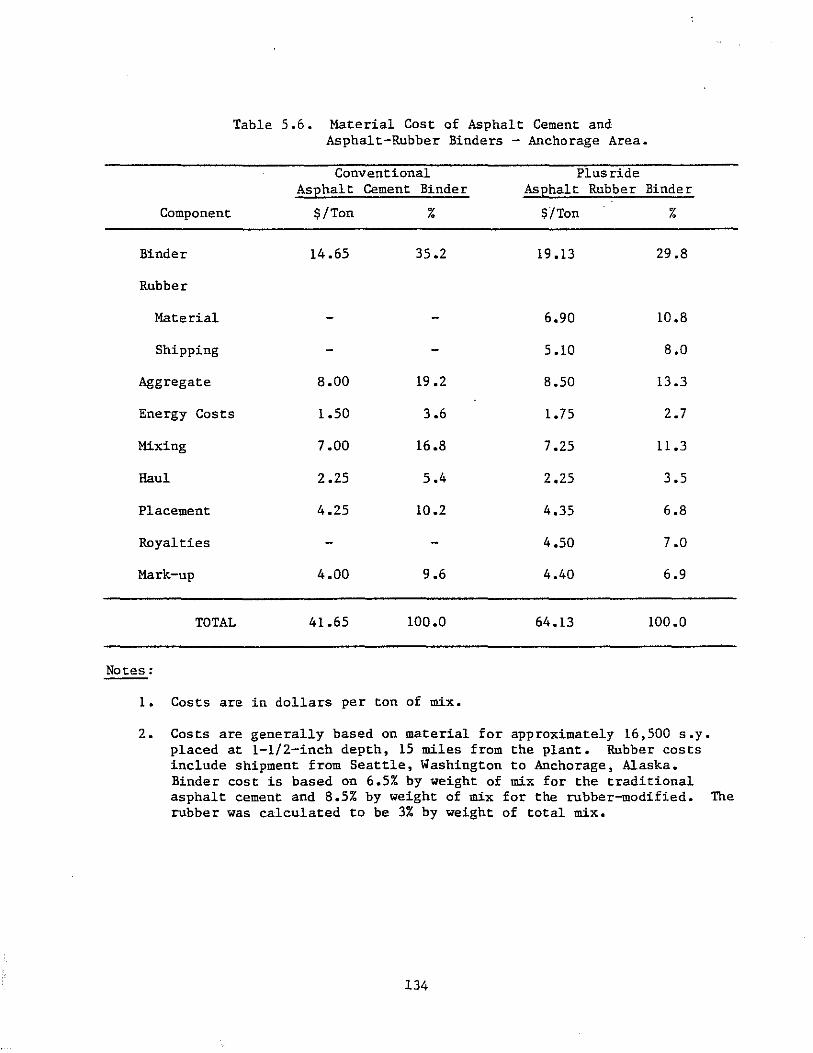
Table 5.6. Material Cost of Asphalt Cement and Asphalt-Rubber Binders - Anchorage Area.
Conventional Plus ride ASEhalt Cement Binder AsEhalt Rubber Binder
Component $/Ton % $/Ton %
Binder 14.65 35.2 19.13 29.8
Rubber
Material 6.90 10.8
Shipping 5.10 8.0
Aggregate 8.00 19.2 8.50 13.3
Energy Costs 1.50 3.6 1.75 2.7
Mixing 7.00 16.8 7.25 11.3
Haul 2.25 5.4 Z.25 3.5
Placement 4.Z5 1O.Z 4.35 6.8
Royalties 4.50 7.0
Mark-up 4.00 9.6 4.40 6.9
TOTAL 41.65 100.0 64.13 100.0
Notes:
1. Costs are in dollars per ton of mix.
2. Costs are generally based on material for approximately 16,500 s.y. placed at l-l/Z-inch depth, 15 miles from the plant. Rubber costs include shipment from Seattle, Washington to Anchorage, Alaska. Binder cost is based on 6.5% by weight of mix for the traditional asphalt cement and 8.5% by weight of mix for the rubber-modified. The rubber was calculated to be 3% by weight of total mix.
134
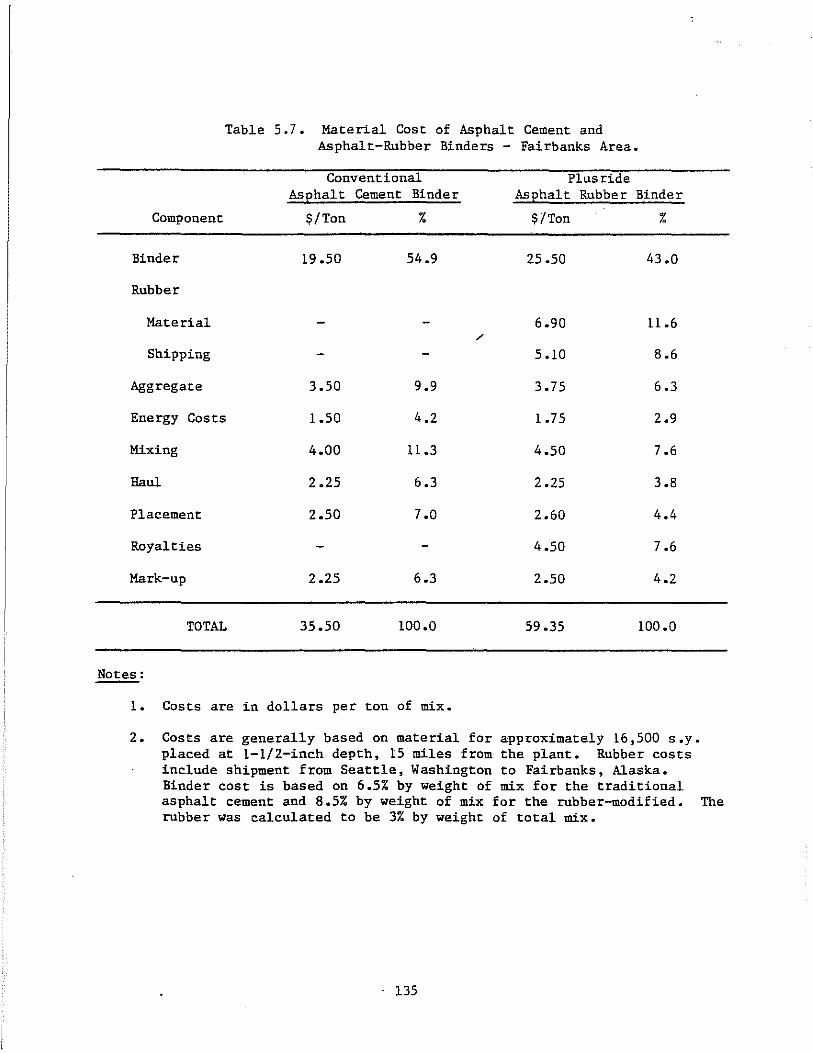
Table 5.7. Material Cost of Asphalt Cement and Asphalt-Rubber Binders - Fairbanks Area.
Conventional Plus ride AsEhalt Cement Binder AsEhalt Rubber Binder
Component $/Ton % $/Ton %
Binder 19.50 54.9 25.50 43.0
Rubber
Material 6.90 11.6 /
Shipping 5.lO 8.6
Aggregate 3.50 9.9 3.75 6.3
Energy Costs 1.50 4.2 1.75 2.9
Mixing 4.00 11.3 4.50 7.6
Haul 2.25 6.3 2.25 3.8
Placement 2.50 7.0 2.60 4.4
Royalties 4.50 7.6
Mark-up 2.25 6.3 2.50 4.2
TOTAL 35.50 lOO.O 59.35 100.0
Notes:
1. Costs are in dollars per ton of mix.
2. Costs are generally based on material for approximately 16,500 s.y. placed at 1-1/2-inch depth, 15 miles from the plant. Rubber costs include shipment from Seattle, Washington to Fairbanks, Alaska. Binder cost is based on 6.5% by weight of mix for the traditional asphalt cement and 8.5% by weight of mix for the rubber-modified. The rubber was calculated to be 3% by weight of total mix •
. 135
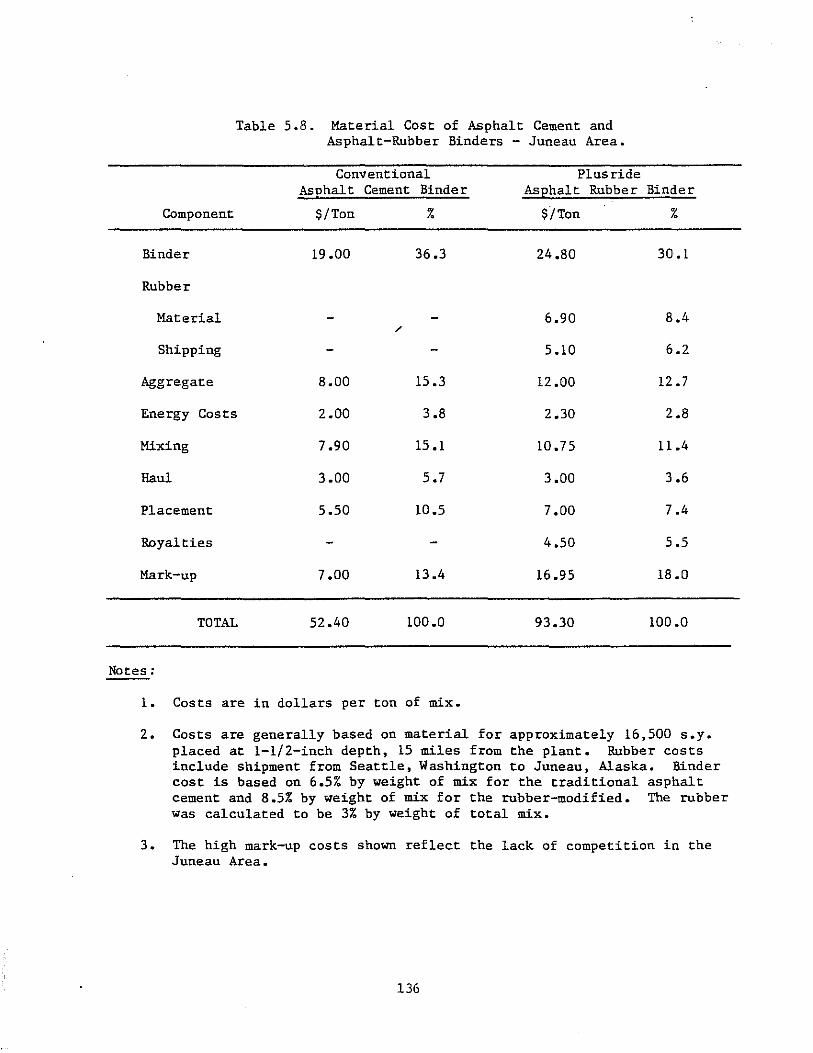
Table 5.8. Material Cost of Asphalt Cement and Asphalt-Rubber Binders - Juneau Area.
Conventional Plus ride As)2halt Cement Binder As)2halt Rubber Binder
Component $/Ton % $/Ton %
Binder 19.00 36.3 24.80 30.1
Rubber
Material 6.90 8.4 /
Shipping 5.10 6.2
Aggregate 8.00 15.3 12.00 12.7
Energy Costs 2.00 3.8 2.30 2.8
Mixing 7.90 15.1 10.75 11.4
Haul 3.00 5.7 3.00 3.6
Placement 5.50 10.5 7.00 7.4
Royalties 4.50 5.5
Mark-up 7.00 13.4 16.95 18.0
TOTAL 52.40 100.0 93.30 100.0
Notes:
1. Costs are in dollars per ton of mix.
2. Costs are generally based on material for approximately 16,500 s.y. placed at 1-1/2-inch depth, 15 miles from the plant. Rubber costs include shipment from Seattle, Washington to Juneau, Alaska. Binder cost is based on 6.5% by weight of mix for the traditional asphalt cement and 8.5% by weight of mix for the rubber-modified. The rubber Was calculated to be 3% by weight of total mix.
3. The high mark-up costs shown reflect the lack of competition in the Juneau Area.
136
improved, might produce the greatest cost savings to placement of rubber
modified pavements.
Based on the assumptions and the given information discussed above,
Tables 5.6, 5.7, and 5.8 clearly show the increase in component costs for
rubber-modified pavements as compared with the conventional asphalt materi
al. Most of the cost increases shown for a component are due to the extra
work or increased material costs required in mix production. For example, in
creasing the oil content from 6.5% to 8.5% naturally raises the mix binder
cost. Aggregate costs have been inflated because of the gap grading require
ment which typically causes upward price adjustments of 5% to 50% over normal
gradings. Energy costs are slightly higher to compensate for the added mixing
time recommended in rubber-modified production. Mixing expenses are higher in
rubber-modified production due to the additional manpower and equipment re
quired for introducing the rubber into the batch. Reducing the additional
price for these components in rubber-modified pavements would require modifi
cation to the materials and/or production processes currently in use.
The increase in placement expense and contractor's markup may be ex
plained by assuming the contractor perceives a higher risk is involved with
production and placement of rubber-modified pavements versus the conventional
pavement. Perceived risk values will either increase or decrease depending on
the success or failure of rubber-modified projects, and the degree to which
the risk of pavement failure is shared by the State.
The cost of the Plus ride material has not been adjusted to compensate for
the difference in the specific gravity of the conventional asphaltic concrete
as compared to the rubber-modified material. The gap-graded Plus ride material
studied on the Lemon Road project had core bulk specific gravities averaging
approximately 8% less than that of the conventional material. This means a
ton of the asphalt-rubber material would cover about 8% more area than a ton
of conventional mix. A cost reduction based on lower unit weights for rubber
modified, as compared to conventional mix, was not taken into account, how
ever, because this information was not consistent with in-place density re
sults from the FEWA Mt. St. Helen's Plus ride project (11). The St. Helen's
project showed no bulk specific gravity reduction for 1-3/4-inch and
2-1/2-inch lifts for rubber-modified mixes as compared to conventional. Since
the information is conflicting, no price adjustment was made. A price adjust-
137
ment would also not be applicable if the State chose to use a dense-graded,
rubber-modified mix because its bulk specific gravity should be approximately
the same as the conventional mix. However, the patent holder, All Seasons
Surfacing Corporation, has suggested using a minimum 5% .additiqnal yield to
estimate quantities to avoid purchase of more rubber granules than necessary.
The price of the rubber also has some variability which should be taken
into consideration. The rubber cost is dependent upon the specified rubber
gradation. Fine rubber (100% passing the No. 20 screen) costs approximately
17 cents per pound versus 10.5 cents per pound. for coarse rubber (less than 4%
passing the No. 20 screen). The price increase for a 3% mix versus 3% of a
80/20 rubber blend mix is approximately $3.30 per ton of mix. The rubber
component cost is completed by adding 8.5 cents per pound ($5.10 per ton) for
shipping to Alaska.
Tables 5.9, 5.10, 5.11, and 5.12 contrast conventional asphalt mix prices
to prices for four of the rubber-modified mixes evaluated in the OSU labora
tory. The rubber-modified mix described in each of the table headings is
identical to one of the mixes used to produce the unshifted fatigue curves
shown in Figure 4.27. The component prices shown in each of the tables for
the conventional mix were for the Anchorage area. The rubber-modified compo
nent costs for energy, mixing, haul, placement, royalties, and markup are also
identical to the costs stated in Table 5.6 for the Anchorage area. The
rubber-modified mix prices for Tables 5.9, 5.10, 5.11, and 5.12 were
determined by calculating the appropriate binder, rubber, and/or aggregate
costs from the percentages used in the laboratory mix. For example, in
Table 5.9, the only component cost change from the prices given in Table 5.6
was for the binder material. The binder cost was increased from 8.5% per ton
($19.13) for ADOTPF typical mix to 9.3% per ton ($20.93) for the laboratory
developed mix.
5.3 Life Cycle Cost Analysis
This section presents three different methods of comparing the costs of
rubber-modified mixes to a conventional mix. The first analysis uses an
assumed maintenance scenario and equal surfacing thicknesses to calculate the
life required for equivalent annual costs. The second analysis method uses
equal surfacing thicknesses of rubber-modified and conventional asphalt pave-
138
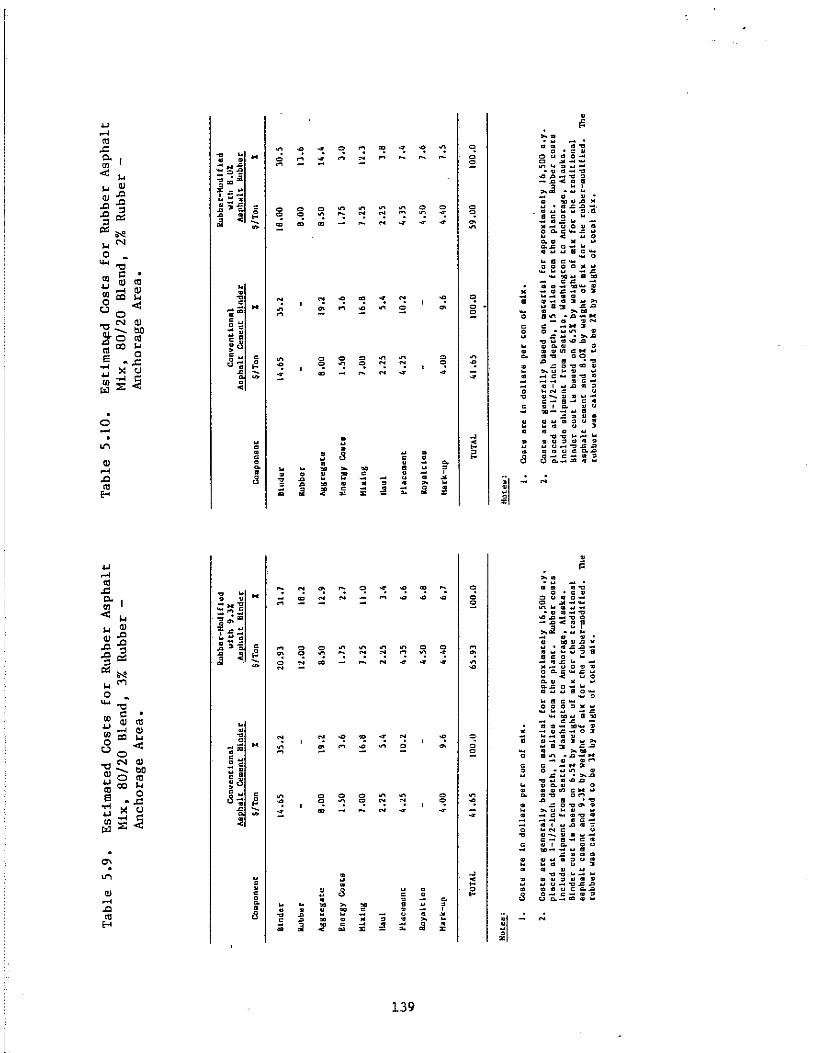
o -
.... .... ., J: c. '" < ... ... Q) Q).c .c.c .c :> :>'"
"' ... .... '" o
.... "" " til ....
til Q) '" .... Q) '" .... < o
U o ""N Q)-.... 0 .,ex>
Q) OD
'" ... o 13 .... ....
" '"
Q) .... ..c
'" H
oJ: >: OJ
.... " :.:<
. <
• • • o ~ • 8
" ;:;
" • ~
" '! N
Q
")
Q Q
'! '! =
N
" ;; • • o ! ~
" ;; • • o .:: ~
139
• ! " • i
· ! " • i ~I
~ •
• ..
· " .3
~!: 1;1 ~ • ~ 1l o t.I 0=1 0 .... o ""' ... ... ." .. 21 ... _
• 'V "' ... 'a
~~:<-g~ ::o.a .!:: t.. - . . QI '>II QI.a ,. ... OJ.:=.a ... , til ........ =L II II CO"
.... IlI,:: ..... 111_ tI 0::1 .,
~CI..a""fi(; Q, III 1C ... a..=Q_w "' ...... !lO ...
_ 0
.. II c'" a 0 0 0 )C ... .......... _.c ... 'JIII .... :>11 C ~ _
.. co_ 'JIII"':11 ... 1II.c'" 0:' .. _ ell 0:1
1/1 .... III :II ... >.... 3 .coD · ~~ ."" _.a_M ... III :UN C ..oM:J o .... ." 1:1
,/; .... :oo..a ."",..,,g.a III g" II 0 '" CI O'l C" ... "" "a 00 D I! ''0:1
.= 0'" <13 '" :100,<.110041 ... ... c ... co." OJ _.... 01 c_ 011 ... ..c1ll:% ...... c U Q;l-..:II'lII ...... C _ II .... e "' ~.!.= ... ~ u
.c '" :II III III .. '" :. u ~ .. '" u ]I · . " .".,,100 ...... 1'1 !II ;I '" '" ~ .. U_-::I'::.:;I CQ .. UC::"'.,CI
8~;;;i:~
N
~. · " CllIII 01"0 o • C II;! o U CI 0_ a""' ... ... "'Iooal .. ....
• V <11_ "0 -.I:I.c_"I:IO
:j -: S ! ... QI "' • QI 'JIll 'II A IC .. o "..c:.a-'" ....... :::I 8 II CO" "'01'=1.0 _ l'I ... U 0 'V .,
:;:c..a""''S(; Cl.QI >C ... CI..c Q ..... 111 .... 80 .... _ 0
wile ... o 0 0 :I IC ... ........... ..c
... '>II" II '>!I C~ _
OJ III_ '>II .... 31 .... 4I.c:; ... 0 JI .. ...... .. III'" '" :II .. >.. 0, '=...1:1 • ~=
.'" _.<:I_M ... GI III'" C _ .. :I o ... .., 'II
Z:: ... • ,.,a '0:1 ...... ,g..CI QI C. III 0 <It al O'l eM" .. ." 0'"
..Q II • ." .c 0 "1:1 '" '" >oU"111 ..
... C ... "''1:1 '" _.... .. c_ o:Il .. .QCII::I "N C ... GI_ ...... _ C _ I!I'" C ., "I r Co "I U l1li-'" U ell .c ... 01 .. U oJ .. 0 U III .. <:II U :t: . . " "'~ ....... '*' ... :I 01 III ..
UU"'''I;I..c..:> <II ., U C Co"::' C ... C ..... :I
I;,l Co ... 11:1 III ..
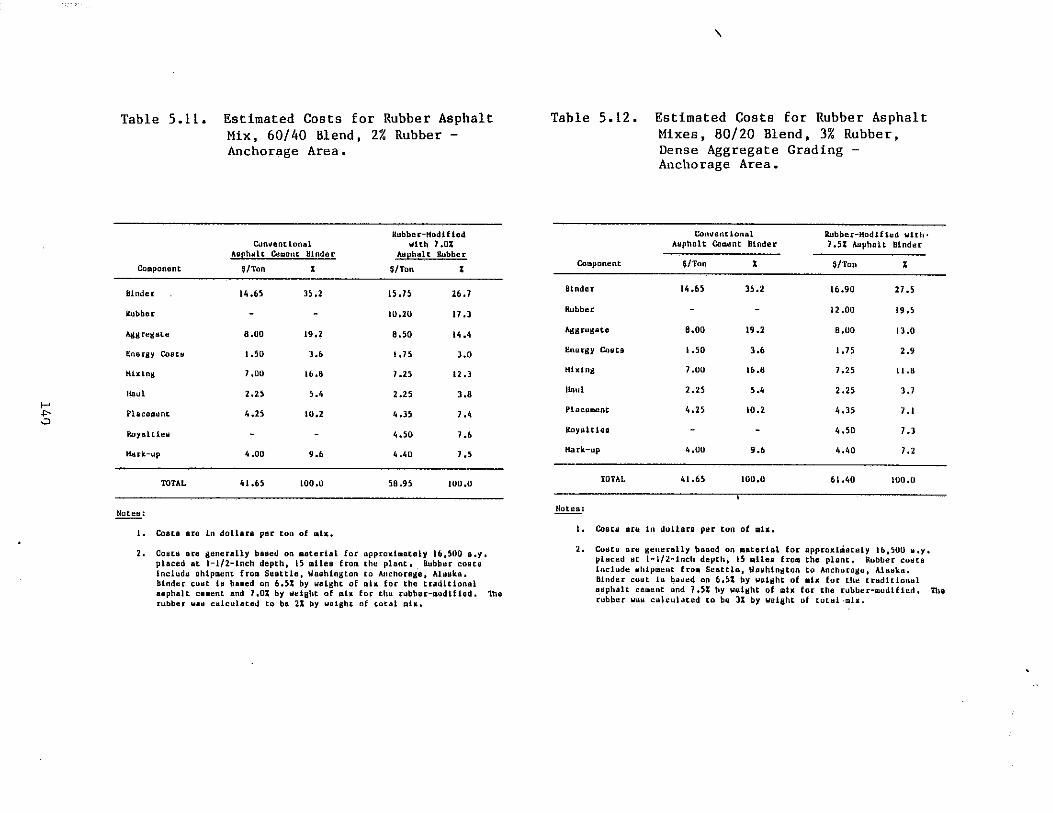
I-'
'" .::>
Table 5.11.
Component
Binder
.ll.ubber
~gregate
Energy Coatll
H1:dng
lIaul
PlacCl1l1nt
lWyolt1eu
Hark-up
'l'OTAL
NotclI:
Estimated Costs for Rubber Asphalt Mix, 60/40 Blend, 2% Rubber -Anchorage Area.
Hubbe r-Hodt f ted Cunllentloolll wlth 7,0%
Auphult cement Hinder A.IIph"lt !lubber
OlTon , $/Ton , 14.65 H.2 15.15 26.1
10.20 11.3
8.00 19.2 8.50 14 .~
1.50 3.' 1.15 3.0
7.00 16.8 1.25 12 .3
2.25 , ., 2.25 3.8
4.25 10.2 4.3S l.'
4.50 l.b
4.00 .. , 4.40 l.S
41.65 100.0 58.95 100.0
I. Coata Dfe 1n dol1an per' tOil of 1I&1r;.
2. Covtl are gdoerally based 00 80teriol for approximately 16,~OO a.y. placed at 1-1/2-1nch depth, 15 l111eo froll thll plant. Rubber COli to Includu ohlp~nt froll Seattle, ~ashlnHton to Nlchoroge, Alaska. Hindllr' COdt Id baaed on 6.51 by weight of mix for the traditional a .. phalt CII.ent lind 1.0% by wdHllt of !IIh for thll rubbllr-lIudlfhd. The rubber wad calculatad to be 21 by weight of total mix.
Table 5.12.
Component
Binder
Rubber
Aggrllgate
EnertIY Couts
Hhing
llaul
Placement
KoYBltlea
Kark.-up
TOTAL
Notell:
,
Estimated Costs for Rubber Asphalt Mixes, 80/20 Blend, 3% Rubber, Dense Aggregate Grading -Anchorage Area.
Conventional B.ubber-HodUhd w1th· AtiphBlt Cecrwnt Bindel:' 7.5% IuIptJalt Binder
SITan , $ITon , 14.65 35.2 16.90 27.S
12,00 19,5
8.00 19.2 B.OO 13.0
1.50 3.b 1.75 2.'
7.00 16.8 1.25 II.B
2.25 ,., Z.25 3. 1
4.25 10.2 4.35 7.1
4.50 7.3
4.00 '.b 4.40 l.2
41.65 100.0 61.40 100,0
I. Costs are in dullara per' ton of ml~.
2. Costa arll generally booed on .aterial for approximately 16,500 w.y. placed at l-I/2-inch depth, 15 lalles frO!ll the plant. Rubber CUllta include shiplIIllllt frolll Seattle, WOlihinl!lton to Anchorage, Alaska. Binder COdt is badl!d on 6.51 by weight of mix for thl! ttRd1tlonlll asphalt cellent and 7.5% by we1Hht of mix for the rubber-mudlfied. nle rubber wall clilcolated to be JI by weiHht of lortal·mix.
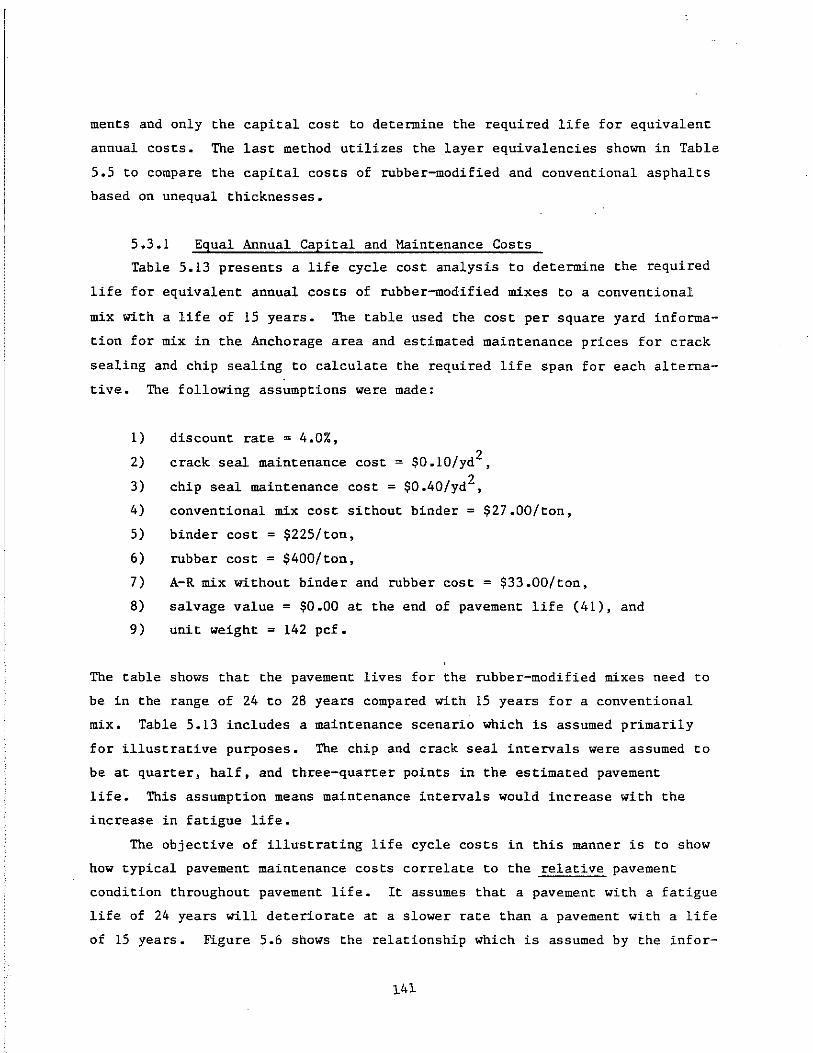
ments and only the capital cost to determine the required life for equivalent
annual costs. The last method utilizes the layer equivalencies shown in Table
5.5 to compare the capital costs of rubber-modified and conventional asphalts
based on unequal thicknesses.
5.3.1 Equal Annual Capital and Maintenance Costs
Table 5.13 presents a life cycle cost analysis to determine the required
life for equivalent annual costs of rubber-modified mixes to a conventional
mix with a life of 15 years. The table used the cost per square yard informa
tion for mix in the Anchorage area and estimated maintenance prices for crack
sealing and chip sealing to calculate the required life span for each alterna
tive. The following assumptions were made:
1) discount rate = 4.0%,
2) crack seal maintenance cost = $0.10/yd2 ,
3) chip seal maintenance cost = $0.40/yd2 ,
4) conventional mix cost sithout binder = $27.00/ton,
5) binder cost = $225/ton,
6) rubber cost = $400/ton,
7) A-R mix without binder and rubber cost = $33.00/ton,
8) salvage value = $0.00 at the end of pavement life (41), and
9) unit weight = 142 pcf.
The table shows that the pavement lives for the rubber-modified mixes need to
be in the range of 24 to 28 years compared with 15 years for a conventional
mix. Table 5.13 includes a maintenance scenario which is assumed primarily
for illustrative purposes. The chip and crack seal intervals were assumed to
be at quarter, half, and three-quarter points in the estimated pavement
life. This assumption means maintenance intervals would increase with the
increase in fatigue life.
The objective of illustrating life cycle costs in this manner is to show
how typical pavement maintenance costs correlate to the relative pavement
condition throughout pavement life. It assumes that a pavement with a fatigue
life of 24 years will deteriorate at a slower rate than a pavement with a life
of 15 years. Figure 5.6 shows the relationship which is assumed by the infor-
141
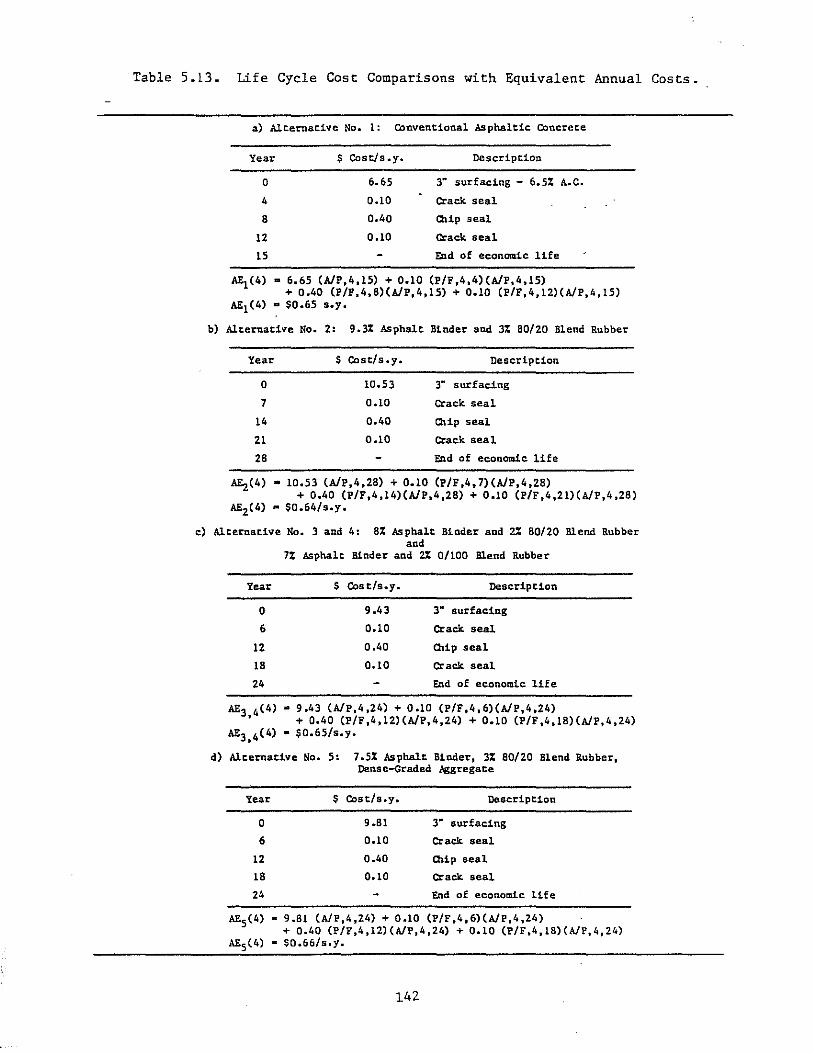
Table 5.13. Life Cycle Cost Comparisons with Equivalent Annual Costs.
a) Alternative No.1: Conventional Asphaltic Concrete
Year S Cost/s.y. Description
o 4
8
12
15
6.65 3" surfacing - 6.5% A.C.
0.10 Crack seal
0.40 Clip seal
0.10 Crack seal
End of economic life
- 6.65 (A/P,4,15) + 0.10 (P/F,4,4)(A/P,4,15) + 0.40 (P/F,4,8)(A/P,4,15) + 0.10 (P/F,4,12)(A/P,4,15)
- SO.65 s.y.
b) Alteruatl~e No.2: 9.3% Asphalt Binder and 3% 80/20 Blend Rubber
Year S <Ast/s.y. Description
o 7
14
21
28
AEz(4)
AE2(4)
10.53 3" surfadng
0.10 Crack seal
0.40 Clip seal
0.10 Crack seal
End of economic life
• 10.53 (A/P,4,28) + 0.10 (P/F,4,7)(A/P,4,28) + 0.40 (P/F,4,14)(A/P,4,28) + 0.10 (P/F,4,21)(A/P,4,28)
- SO.64/s.y.
c) Alternative No. 3 and 4; 8% Asphalt Binder and Z% 80/20 Blend Rubber and
Year
o 6
12
18
24
7% Asphalt Binder and 2% a/lOa Blend Rubber
S <As t/s.y.
9.43
0.10
0.40
0.10
Description
3" surfacing
Crack seal
Chip seal
Crack. seal
End of economic life
- 9.43 (A/P,4,24) + 0.10 (P/F,4,6)(A/P,4,24) + 0.40 (P/F,4,12)(A/P,4,24) + 0.10 (P/F,4,18)(A/P,4,24)
- SO.65/s.y.
d) Alternative No.5: 7.5% Asphalt Binder, 3% 80/20 Blend Rubber.
Year
o 6
12
18
24
Dense-Graded Aggregate
S Cost/Sey. Description
9.81 3" 8urfaei.ng
0.10 Crack. seal
0.40 Cllip seal
0.10 Crack seal
End of economic life
·9.81 (A/P,4,24) + 0.10 (P/F,4,6)(A/P,4,24) + 0.40 (P/F,4,12)(A/P,4,24) + 0.10 (P/F,4,18)(A/P,4,24)
- SO.66/s.y.
142
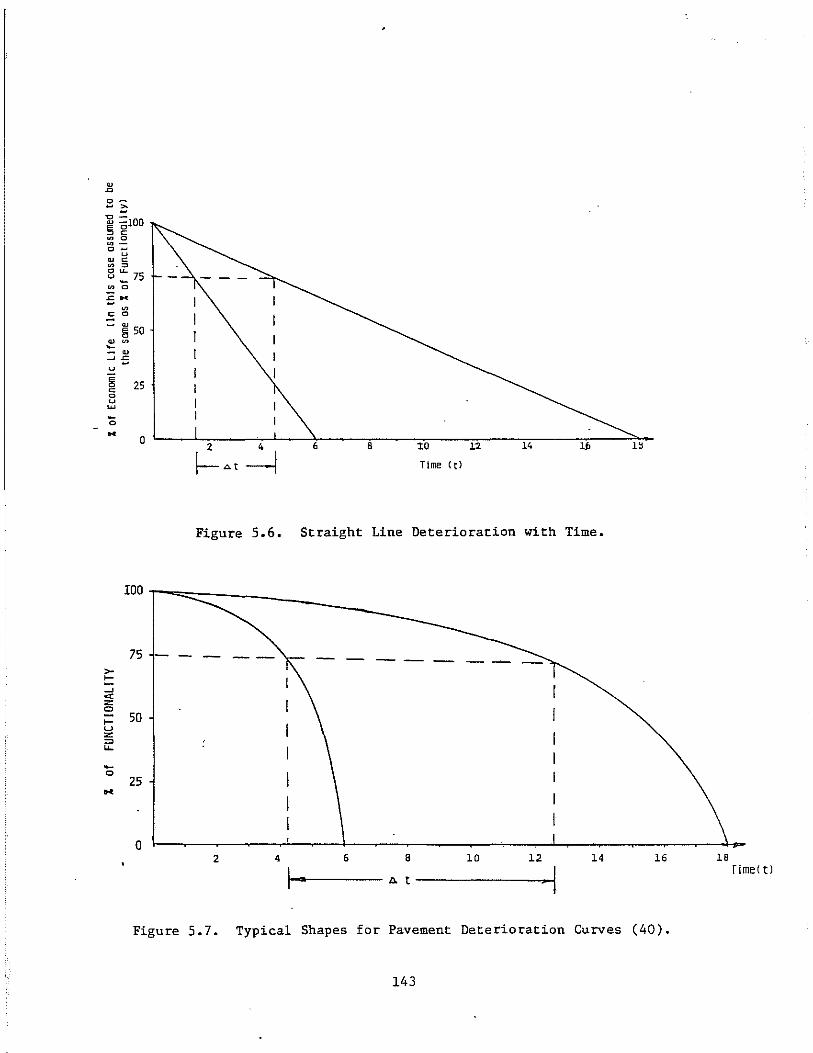
~ .0
0-- ;:; "0 -~ glOD ~ 0 ~ -0_
u " CO ~ :>
8 ::: 7S ~ 0
ZM ~
co 0
- ~ 50 " ~ -- ~ ~z u
~ 25 o u
'" -o M o
6 B :to ~"
Time (t)
Figure 5.6. Straight Line Deterioration with Time.
roo f""""::::::::::::::::--------_
75 - - -->-:: --' « z 0
.... 50 u Z ::0 u.. -0
25 .. o
2 4 6 B 10 12 14
11---- Il. t ------I. I 16
Figure 5.7. Typical Shapes for Pavement Deterioration Curves (40).
143
18 rime! ti
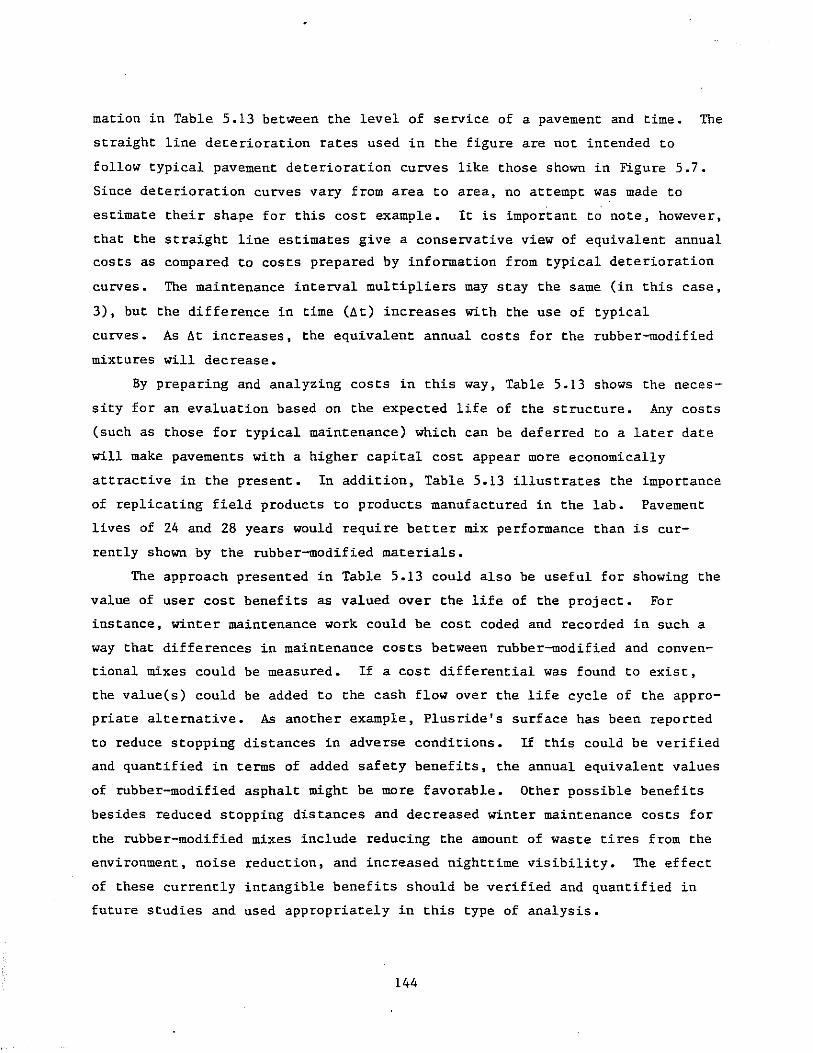
mation in Table 5.13 between the level of service of a pavement and time. The
straight line deterioration rates used in the figure are not intended to
follow typical pavement deterioration curves like those shown in Figure 5.7.
Since deterioration curves vary from area to area, no attempt was made to
estimate their shape for this cost example. It is important to note, however,
that the straight line estimates give a conservative view of equivalent annual
costs as compared to costs prepared by information from typical deterioration
curves. The maintenance interval multipliers may stay the same (in this case,
3), but the difference in time (~t) increases with the use of typical
curves. As ~t increases, the equivalent annual costs for the rubber-modified
mixtures will decrease.
By preparing and analyzing costs in this way, Table 5.13 shows the neces
sity for an evaluation based on the expected life of the structure. Any costs
(such as those for typical maintenance) which can be deferred to a later date
will make pavements with a higher capital cost appear more economically
attractive in the present. In addition, Table 5.13 illustrates the importance
of replicating field products to products manufactured in the lab. Pavement
lives of 24 and 28 years would require better mix performance than is cur
rently shown by the rubber-modified materials.
The approach presented in Table 5.13 could also be useful for showing the
value of user cost benefits as valued over the life of the project. For
instance, winter maintenance work could be cost coded and recorded in such a
way that differences in maintenance costs between rubber-modified and conven
tional mixes could be measured. If a cost differential was found to exist,
the value(s) could be added to the cash flow over the life cycle of the appro
priate alternative. As another example, Plusride's surface has been reported
to reduce stopping distances in adverse conditions. If this could be verified
and quantified in terms of added safety benefits, the annual equivalent values
of rubber-modified asphalt might be more favorable. Other possible benefits
besides reduced stopping distances and decreased winter maintenance costs for
the rubber-modified mixes include reducing the amount of waste tires from the
environment, noise reduction, and increased nighttime visibility. The effect
of these currently intangible benefits should be verified and quantified in
future studies and used appropriately in this type of analysis.
144
5.3.2 Equal Annual Capital Cost
There is a more conservative approach to evaluating costs for conven
tional and asphalt rubber-modified pavements over the life of the structure.
The method is conservative because it does not take into account the pos
sibility of reduced long-term maintenance and user costs. It only considers
the capital cost of the pavement system. With the capital costs of both
pavement systems known and the life of the conventional system assumed, the
life of the rubber-modified system to provide equivalent costs is determined
by using the following:
X(CRF, n) = Y(CRF, n')
where: X* = cost of conventional pavement in $/ton or $/s.y.,
Y* = cost of rubber-modified pavement in $/ton or $/s .y.,
n = life of the conventional pavement in years,
n' = asphalt rubber pavement life in years,
CRF = Capital Recovery Factor = i(l+i)n
By substitution: (1+i)n-1
where i = discount rate in decimal form.
If we define D as follows:
D = X [i( 1+i)n 1 Y (1+i)n-1
and
and then solve for n', we obtain the relation for asphalt-rubber life
Of =
D In (D=i)
In(l+i)
(5.1)
(5.2)
(5.3)
(5.4)
Table 5.14 shows the average cost per ton for the mix and design life
times for the conventional asphaltic pavement ranging from 2 to 20 years. The
table also includes the effect of using a discount rate of 3.5%, 4.0%, and
4.5%. The discount rate was based on the real cost of capital as used in
*x and Y must be in the same units.
145
Table 5.14. Comparison of Pavement Life for Equivalent Annual Capital Costs of Conventional and Asphalt Rubber-Modified Mixes.
Surfacing Discount Life Required for Alternative Rate Equivalent Annual Capital Cost
Conventional - 2.0 5.0 10.0 15.0 20.0 Asphaltic Concrete
(assumed)
Rubber-modified 3.5% 3.2 8.3 17.7 28.9 43.8 Asphaltic Concrete
Rubber-modified 4.0% 3.2 8.3 18.1 30.3 48.4 Asphaltic Concrete
Rubber-modified 4.5% 3.2 8;4 18.5 32.0 56.2 Asphaltic Concrete
Notes:
1. Average cost per ton of conventional asphaltic concrete = $43.25 from Tables 5.6, 5.7, and 5.8.
2. Average cost per ton of rubber-modified asphaltic concrete = $67.65 from Tables 5.6, 5.7, and 5.8.
3. Equal Surface Thickness
146
constant dollar studies. The real cost of capital essentially reflects the
difference between the market rate of return and inflation. This difference
has historically been between 3.7% and 4.4% nationally (45).
Table 5.14 can become considerably more useful as information concerning
pavement life becomes more readily available. In its present form, the table
can be used as a simple tool for determining the equivalent life of rubber
modified mixes versus conventional mixes. If an HP-41 system is available, a
program has been included in Appendix D for easing the computation of equi
valent pavement lives.
5.3.3 Capital Cost Comparison Considering Layer Equivalencies
In Table 5.5, the required thickness of a rubber-modified mix was reduced
by 1.2 to 1.4 times compared with a conventional mix using the equivalency
factors developed earlier. This implies a rubber-modified mixture could be
placed with a thickness ranging from approximately 2 to 2-1/2 in. and the
expected fatigue life would be the same as a 3-in. conventional surfacing.
Table 5.15 presents the capital cost per square yard based on varying
thickness for each of the alternatives discussed in the previous section,
5.3.2.
Table 5.15 shows that the capital cost of a rubber-modified surfacing
becomes advantageous only when the layer equivalency is at least in the range
of 1.4 to 1.5. Therefore, by this comparison, the rubber-modified mixes would
not be economically acceptable since the laboratory results showed a layer
equivalency range of only 1.2 to 1.4. Like the life cycle cost analysis
presented in the previous section, this capital cost comparison does not take
into account possible benefits of the rubber-modified mix which have not been
verified and/or quantified to date. A small increase in the capital cost may
be justified if benefits such as increased de-icing capabilities, reduced
adverse weather stopping distances, noise reduction, etc., could be shown to
have a quantifiable positive effect on user and maintenance costs.
5.3.4 Summary Discussion
The information presented in this section shows rubber-modified asphalt
mixes would require a life-span of approximately 24 to 28 years to provide the
same life cost as an equivalent thickness of conventional asphalt concrete
147
Table 5.15. Capitol Cost Comparison Considering Layer Equivalencies.
Surfacing Capitol Cost for Given Thickness ($/sy) Alternative 3" 2-1/2"* 2-1/4"** 2"***
A. Conventional 6.65 N/A N/A N/A Asphaltic Concrete
B. 9.3% Asphalt and 10.53 8.78 7.90 7.02 3% of 80/20 Rubber Blend
C. 8.0% Asphalt and 9.43 7.86 7.07 6.29 2% of 80/20 Rubber Blend
D. 7.0% Asphalt and 9.42 7.85 7.06 6.28 2% Fine Rubber
E. 7.5% Asphalt, 3% of 9.81 8.18 7.36 6.54 80/20 Rubber Blend, and Dense Graded Aggregate
*Equivalency of 1.2: 1 **Equivalency of 1.33: 1
***Equivalency of 1.5: 1
148
surface which lasts 15 years. In a comparison of capital costs, thickness of
the rubber-modified mix must be reduced by a factor of at least 1.4 to 1.5 for
the cost to be equivalent to a conventional asphalt surface.
The rubber-modified mixes could become more economically feasible by
reducing life cycle and/or capital costs. The life cycle costs ·could be
reduced by including intangibles, such as those discussed in the previous
sections. Capital costs could also be reduced in many ways. For example,
Tables 5.9, 5.10, 5.11, and 5.12 show the relationship between the total mix
cost and the cost for each of the mix components. Cost reductions in the mix
are most sensitive to items which have the highest component percentage of
cost as compared to the total mix. As an example, if the rubber components
were obtained locally, up to an 8.0% savings to the total cost of the mix
could result. However, if the mixing time for the rubber-modified material
was made equivalent to the mixing time for a conventional mix, the cost of the
mix would only be reduced by 0.4%. The effort spent in changing these factors
may be the same, but the payoffs favor one cost-cutting effort more than the
other. By evaluating the sensitivity of the mix price in relation to the
component prices, areas which will produce the greatest cost savings to the
total mix are readily identified.
5.4 Guidelines for Use of Rubber-Modified Mixes
Based on results of this study, the following guidelines are recommended
for use of rubber-modified mixes:
1) Since pavements in Alaska rarely fatigue in the winter (when
pavement temperatures are below freezing), the gap-graded mix
is still recommended for fatigue resistance during the spring
and summer times of the year.
2) The rubber-modified mixes have fatigue lives which range from
2 to 7 times longer than conventional mixes evaluated at +10°C
and -6°C. This results in layer equivalencies of 1.2 to 1.4
for conventional asphalt to rubber-modified thickness. These
values should be considered for use in Alaska's pavement
design procedure.
3) Based on the questionnaire survey in Appendix A, most rubber
modified surface failures appear to be due to raveling. Until
149
the construction techniques are modified to preclude failure
due to early raveling, rubber-modified mixtures should con
tinue to be placed adjacent to a control section of a conven
tional surfacing. Continuing to place both mix types in
adjacent locations will aid the research effor't and perform
ance evaluations because each mix can be examined under like
conditions.
4) Rubber-modified mixes could be used as a crack relief layer or
cushion course in overlays or two-phase surface construction.
The advantage of such a use is that the rubber-modified
material is placed in a position to take advantage of its high
allowable tensile strain value, which correlates to its in
creased fatigue life. The conventional asphalt surfacing then
acts as a seal and eliminates the chances for raveling of the
rubber mix.
5) Though the use of the 0/100 and 60/40 blends of rubber reduced
the fatigue life at both +lO°C and -6°C, the resulting mixes
also required less asphalt cement. The cost data in Table
5.13 would indicate this mix was nearly as cost effective as
the coarse rubber blend (80/20). Alaska DOTPF should be
encouraged to try some of these blends in order to reduce the
total asphalt requirements and reduce early raveling.
6) Reducing the rubber content from 3 to 2% had little effect on
fatigue life at +lO°C, but increased fatigue life at -6°C.
Alaska DOTPF should consider reducing the rubber content to
2%.
7) Use of dense graded aggregate with the 80/20 rubber blend also
greatly reduces the asphalt content that is needed for the
gap-graded mix. Though the fatigue life is reduced at +lO°C,
it is greatly increased at -6°C. Alaska DOTPF should consider
its use in future test sections.
8) Currently intangible benefits of rubber-modified asphalt mixes
such as reduced winter maintenance costs and reduced stopping
distances need further study. If these can be
150

quancified and they prove Co be posicive, rubber asphalt mixes
may become more economically aCtraccive.
5.5 Summary
This chapcer presented the layered elascic analysis· of data. The layered
elastic theory was used wich che material propercies decermined in the labora
cory and projecC informacion supplied by ADOTPF. The theory was used to
evaluace che effecc of mix variations on pavement life and to escablish layer
equivalencies for the rubber mixes. The laboratory and field data were also
used to evaluate che economics of rubber-modified and conventional mixes. The
chapter concludes with developmenc of use guidelines.
The layer equivalencies were calculated for three different seasons. The
ratio of conventional asphalc to rubber-modified thickness for winter, spring
thaw, and spring/fall was ranged between 1.2 and 1.4 to 1.
The economic analysis shows rubber-modified asphalt mixes to be slighcly
less cost effeccive than conventional asphalt mixes. Additional study is
recommended to quancify currently incangible benefits such as lower winter
maintenance costs and reduced stopping discances. If these can be quantified,
inclusion of these benefits could improve the cost effectiveness of rubber
asphalt mixes and justify their increased use.
Finally, guidelines for use of rubber asphalt mixes in Alaska are de
veloped. These guidelines are in the form of suggescions of cypes of mixes to
be used by Alaska to reduce life cycle costs and potential short and long term
raveling problems.
151
6.0 CONCLUSIONS AND RECOMMENDATIONS
6.1 Conclusions
This chapter summarizes the findings of a field performance questionnaire
and a laboratory study. The goal was to optimize ingredients for rubber
modified asphalt pavement in terms of the selected mix properties of resilient
modulus and diametral fatigue resistance at two different test temperatures.
This has been done by developing mix design recommendations for rubber
modified asphalt mix for use in Alaska. Based on the results of this study,
the following conclusions appear warranted:
1) The 1984 field survey indicated that most rubber-modified
pavements placed to date have not failed in fatigue. Where
problems have been reported, they have generally been early
raveling and attributed to excessive voids resulting from poor
compaction and/or low asphalt content. Intangible benefits,
such as ice control and noise reduction, still need further
quantification.
2) The laboratory mix design results show that the required
asphalt content to reach a certain minimum voids level for
rubber-modified mixes depends on rubber and aggregate grada
tion, and rubber content. The mixture with gap-graded aggre
gate and 3% coarse rubber" required the highest design asphalt
content (9.3%). The mixture with 3% coarse rubber* and dense
aggregate grading required 7.5%, and the conventional asphalt
mix (no rubber) had the lowest design asphalt content
(5.5%). The asphalt contents reported were for 2% air voids.
3) The resilient modulus for rubber mixes at +100 and -6a C was
generally higher for dense-graded aggregates than for gap
graded aggregates.
4) The gap-graded mix had a higher (by 40%) fatigue life at +10a C
than the dense-graded mix. However, at -6a C, the dense-graded
mix had the highest fatigue life (by 300%).
*Based on dry aggregate weights.
152
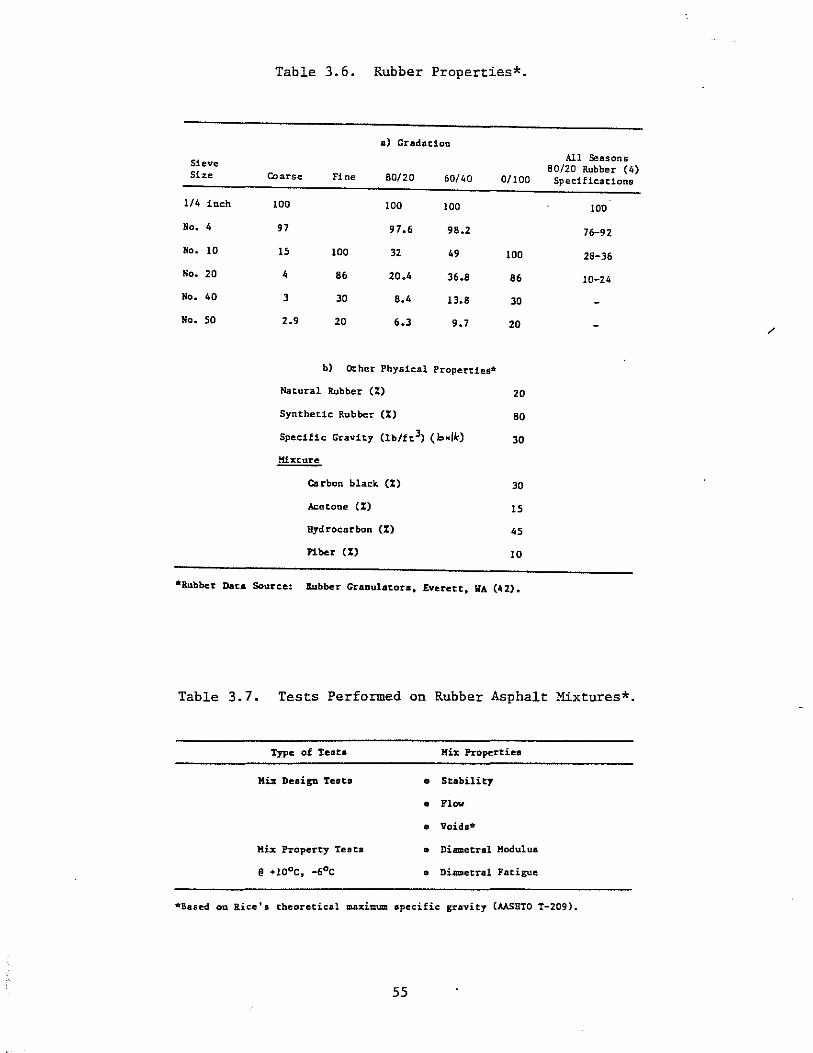
Table 3.6. Rubber Properties*.
.) Gradation
Sieve All Seasons 80/20 Rubber (4)
Size Coarse Fine 80/20 60/40 0/100 Spec:1f1c.atlons
1/4 inch 100 100 100 100
No. 4 97 97.6 98.2 76-92
No. 10 15 100 32 49 100 28-36
No. 20 4 86 20.4 36.8 86 10-24
No. 40 3 30 8.4 13.8 30
No. 50 2.9 20 6.3 9.7 20 /
b) Other Physic.al Properties·
Natural Rubber (%) 20
Synthetic Rubber (%) 80
Specific Gravity {lb/ft3) ( b.lkj 30
Mixture
Carbon black (%) 30
Acetone (%) 15
Hydrocarbon (%) 45
Fiber (%) 10
*Rubber Data Source: Rubber Granulator., Everett, WA (42).
Table 3.7. Tests Performed on Rubber Asphalt Mixtures*.
Type of Teata Mix Propertiu
Kiz Design Testa • Scability
• Flow
• Void.*
Mix Property Testa • DimDetral Hodulull
• Diametral Fatigue
*Sased on Rice'. theoretical maximum apecific: gravity (AASRTO T-209).
55

5) The resilient modulus values for gap-graded and dense-graded
aggregates increased at +10° and -6°C as the rubber gradation
became finer. The fatigue lives were reduced by about 20% as
the rubber gradation got finer. These results correlate with
values obtained by ADOTPF for modulus but not for fatigue.
6) As the percent rubber by dry weight of aggregate increased
from 2 to 3% the modulus values generally decreased at +10°C
and were unaffected at -6°C for gap-graded mixes. The fatigue
life of gap-graded mixes was not significantly affected at
+10°C by increasing the rubber content. At -6°C, the fatigue
life of gap-graded mixes was greatly increased by reducing the
rubber content.
7) Gap-graded aggregate mixtures with a blend of 80% coarse and
20% fine rubber had the lowest modulus and highest fatigue
life at both testing temperatures.
8) A high mixing temperature slightly increased the modulus and
the fatigue life for gap-graded mixes tested at +10°C. Dense
graded mixes tested at +10°C showed an increase in modulus,
but a decrease in fatigue life with higher mixing tempera
tures. The high mixing temperature had little effect on the
modulus but reduced the fatigue life of all mixes tested at
-6°C.
9) The effect of cure time after mixing on resilient modulus and
fatigue life at both testing temperatures was not significant.
10) The 5-pound surcharge weight, which was applied after compac
tion, increased the fatigue life and decreased the resilient
modulus at +10°C. At -6°C, the fatigue life was slightly
reduced and the modulus not significantly affected with the
application of the surcharge.
11) The fatigue life generally increased as the air void content
increased from 2 to 4%, regardless of the testing tempera
ture. However, tests were not performed at higher voids (6-
8%) which have often been reported in the field trials. This
is contrary to the conventional relationship between air voids
and fatigue life. The resilient modulus values at both tem-
153
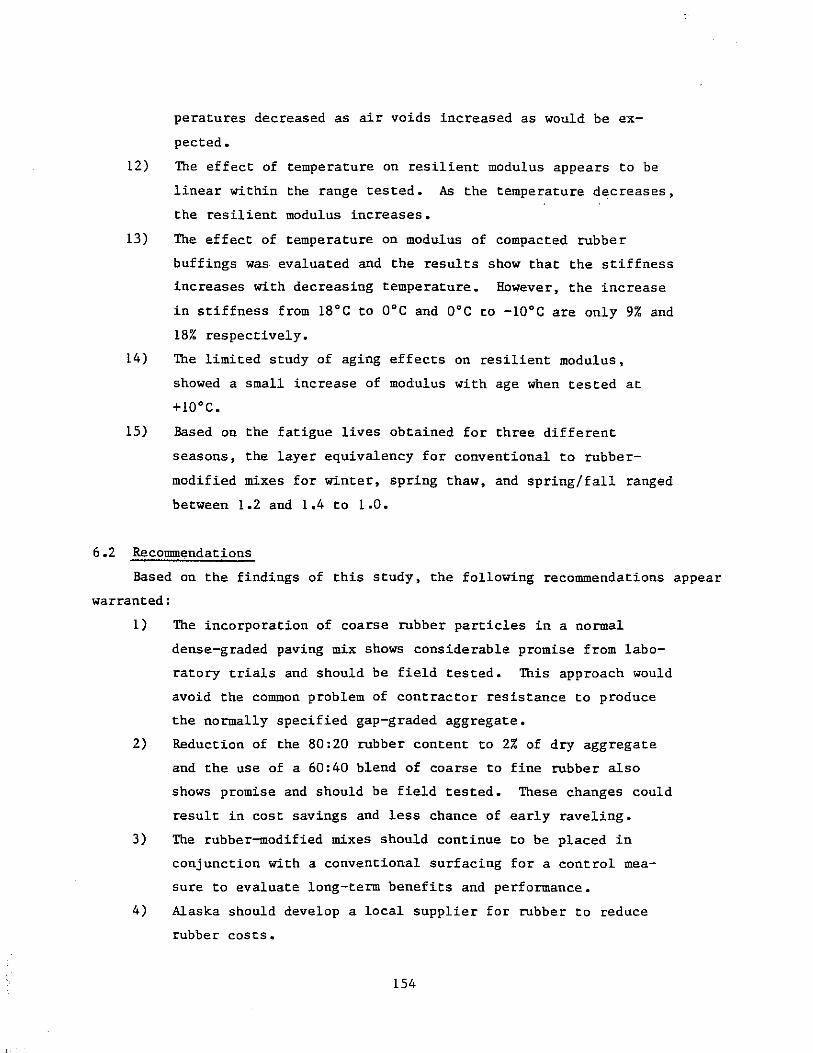
peratures decreased as air voids increased as would be ex
pected.
12) The effect of temperature on resilient modulus appears to be
linear within the range tested. As the temperature decreases,
the resilient modulus increases.
13) The effect of temperature on modulus of compacted rubber
buffings was evaluated and the results show that the stiffness
increases with decreasing temperature. However, the increase
in stiffness from 18°e to oOe and ooe to -10 oe are only 9% and
18% respectively.
14) The limited study of aging effects on resilient modulus,
showed a small increase of modulus with age when tested at
+10 o e.
15) Based on the fatigue lives obtained for three different
seasons, the layer equivalency for conventional to rubber
modified mixes for winter, spring thaw, and spring/fall ranged
between 1.2 and 1.4 to 1.0.
6.2 Recommendations
Based on the findings of this study, the following recommendations appear
warranted:
1) The incorporation of coarse rubber particles in a normal
dense-graded paving mix shows considerable promise from labo
ratory trials and should be field tested. This approach would
avoid the common problem of contractor resistance to produce
the normally specified gap-graded aggregate.
2) Reduction of the 80:20 rubber content to 2% of dry aggregate
and the use of a 60:40 blend of coarse to fine rubber also
shows promise and should be field tested. These changes could
result in cost savings and less chance of early raveling.
3) The rubber-modified mixes should continue to be placed in
conjunction with a conventional surfacing for a control mea
sure to evaluate long-term benefits and performance.
4) Alaska should develop a local supplier for rubber to reduce
rubber costs.
154
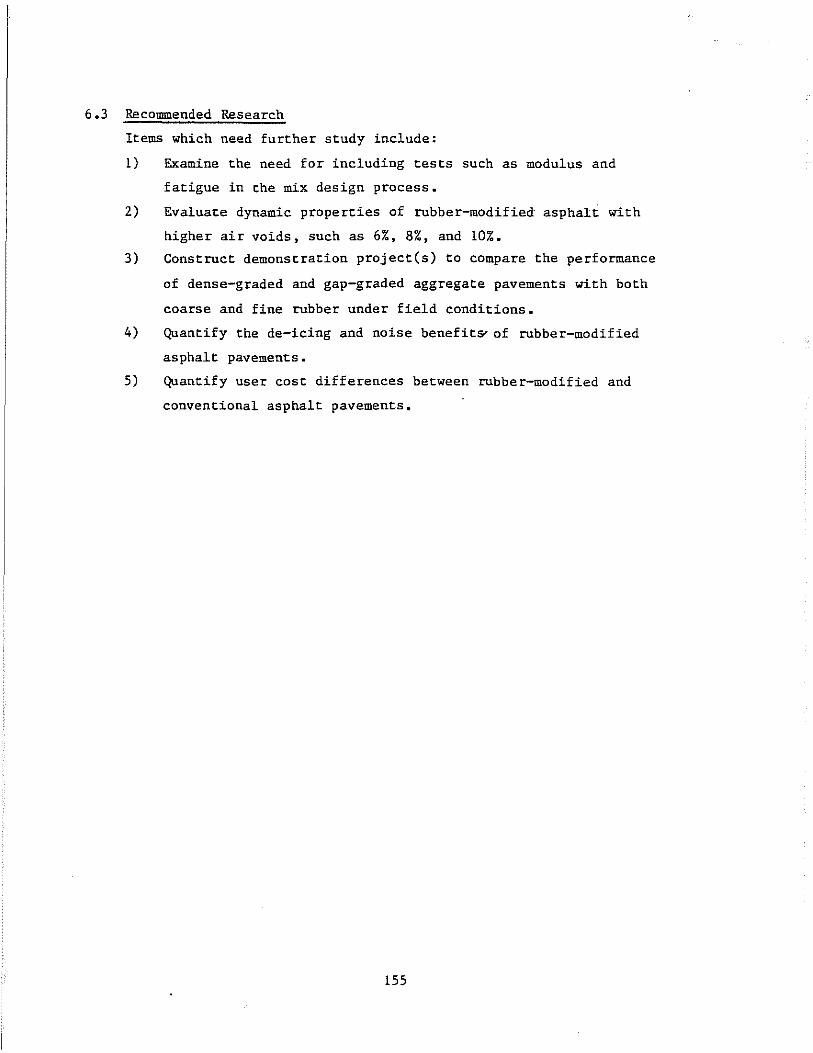
6.3 Recommended Research
Items which need further study include:
1) Examine the need for including tests such as modulus and
fatigue in the mix design process.
2) Evaluate dynamic properties of rubber-modified- asphalt with
higher air voids, such as 6%, 8%, and 10%.
3) Construct demonstration project(s) to compare the performance
of dense-graded and gap-graded aggregate pavements with both
coarse and fine rubber under field conditions.
4) Quantify the de-icing and noise benefit~ of rubber-modified
asphalt pavements.
5) Quantify user cost differences between rubber-modified and
conventional asphalt pavements.
155
7.0 REFERENCES
1. Esch, David C" "Rubber in Pavements for Ice Control," The Northern Engineer,
Vol. 12, No.4, University of Alaska, Winter 1980.
2. Esch, David C" "Construction and Benefits of Rubber-Modified Asphalt Pave
ment," TRB Record 860, Transportation Research Board, 1982.
3. Esch, David C" "Asphalt Pavements Modified with Coarse Rubber Particles,"
FHWA-AK-RD-85-07, Alaska Department of Transportation, August 1984.
4. Bj orklund, Anders, "Rubber Granules in Wearing Courses," Proceedings, XVI
World Road Congress, Vienna, September 1979.
5. Technical Data on PLUSRIDE ASPHALT, All Seasons Surfacing Corporation,
Bellevue, WA, 1981.
6. Morris, G.R. and McDonald, Charles H., "Asphalt-Rubber Stress-Absorbing
Membranes: Field Performance and State of the Art;' TRB Record 595,
Transportation Research Board, 1976.
7. Huf fman, J. E., "The Use of Ground Vulcanized Rubber in Asphal t," ASTM STP
724, line rican So ciety of Te sting and Ma terials, 1979.
8. Schnormier, R.H., "Eleven-Year Pavement Condition History of Asphalt-Rubber
Se als in Phoenix, Ar izona," ibid.
9. Proceedings, National Seminar on Asphalt Rubber, US DOT, Federal Highway
Administration, San Antonio, TX, October 1981.
10. Ford, Nyla, "Rubber-modified Asphalt Concrete Pavement," presented at 121s t
Meeting of the Rubber Division, Bellevue, WA, May 1982.
11. wndy, J .R., Hicks, R.G., and Richardson, E., "Evaluation of Rubberized
Asphalt Surfacing Material: Mt. st. Helens Study," Final Report to
Federal Highway Administration, June 1984.
12. Deese, P.L., Hudson, J.F., Innes, R.C. and Funkhouser, D., "200,000,000 Tires
Per Year: Options for Resource Recovery and Disposal," report prepared
by Urban Systems Research and Engineering, Inc., for U.S. Environmental
Protection Agency, November 1979.
13. LaGrone, B.D., "What is Reclaimed Rubber," Proceedings, First Asphalt-Rubber
User Producer Workshop, Scottsdale, Arizona, May 7-8, 1980.
14. Oliver, J.W.H., "Research on Asphalt Rubber at the Australian Road Research
Board;' Proceedings, National Seminar on Asphalt Rubber, October 1981,
pp. 241-256.
156
15. Piggott, M.R., Woodhams, R.T., "Recycling of Rubber Tires in Asphalt Paving
Materials," Department of Chemical Engineering and Applied Chemistry,
University of To ranta, Toronto, Canada.
16. LaGrone, Bobby D., "Rubber Used in Asphalt Rubber .Applic~tions," Proceedings,
National Seminar on Asphalt Rubber, October 1981, pp. 225.
17. Takallou, H., "Rubberized Asphalt Mix Design," unpublished proj ect report,
Department of Civil Engineering, Oregon State University, October 1983.
18. Patrick, J.E., "Rubber in Bitumen," Report No. 6-8212, Ministry of Works and
Development, Central Laboratories, Lower Hutt, New Zealand, January
1983.
19. Rostler, F.S., "Rubber in Asphalt Pavements," Proceedings, International
Symposium on the Use of Rubber in Asphalt Pavements, Salt Lake City,
Utah, 1970.
20. !luff, Bobby J., "Process of Producing a Rubberized Asphalt Composition Suit
able for Use in Road and Highway Cosntruction and Repair and Produc t,"
U.S. Patent No. 4,166,049, August 28, 1979.
21. Van Beem, F.S., Brasser, P., "Bituminous Binders of Improved Quality Contain
ing "Cartiflex" Thermoplastic Rubbers," J. Inst. Pet., Vol. 59, No. 566,
1973.
22. Svensson, A.N., "Me thod of Producing a Paving Mass and a Paving Mass Produced
by the Method," U.S. Patent No. 4,086,291, April 25, 1978.
23. Narusch, F.P., "Alaska Experience with Rubberized Asphalt Concrete Pavements,
1979-1982," State of Alaska Department of Transportation and Public
Facilities, Division of Design and Construction. Central Region, August
1982.
24. Takallou, H., "Rubberized Asphalt Mix Evaluation, All Seasons Surfacings
Study," unpublished project report, Department of Civil Engineering,
Oregon State University, October 1983.
25. Hicks, R.G., "Effect of Material Variables on Mix Modulus and Fatigue,"
unpublished project report, Department of Civil Engineering, Oregon
State University, July 1983.
26. Oliver, J.W.H., Bethune, J.D., "Road Trials of Scrap-Rubber-Modified Bitumi
nous Surfacings Laid in Victoria, 1975-1977," Australian Road Research
Bo ard In ternal Re port, Fe bruary 1978.
157
27. Hicks, R.G., "Project Report on Rubberized Asphalt Concrete for Lemon Road
(Project RS-09441l) ," unpublished project report, Department of Civil
Engineering, Oregon State University, October 1983.
28. "Plusride Road Report," All Seasons Surfacing Corp., Winter 1982-83
29. "Project SR 3437(00) 75, Plusride Rubberized Road Service Compound," Research
and Special Assignments South Dakota Department of Transportation,
September 1982, pp. 13-15.
30. "Victoria Paves the Way with Plusride, ,. Civil Public Works, January 1983.
31. -' Montrose, Jack, "Plus ride Asphalt Rubber-modified Asphaltic Concrete in the
St ate of Nevada," Nevada Department of Transportation, October 1982.
32. Epps, Jon, "Rubber History," Proceedings, National Seminar on Asphalt-Rubber,
October 1981, pp. 1-23.
33. "Mix Design Methods for Asphalt Concrete and Other Hot-Mix Types," The
Asphalt Institute, Manual Series No.2, March 1979.
34. "Alaska Test Methods," State of Alaska Department of Transportation and
Public Facilities Division of Highway Design and Construction, January
1980.
35. Walter, J., et al., "Installation, Operation and Maintenance Procedures for
Repeated Load Triaxial and Diametral Test Equipment," Transportation
Research Report: 84-1, Oregon State University, January 1984.
36. Lundy, J.R., "Rubberized Asphalt Mix Performance," unpublished project
report, Oregon State University, December 1983.
37. Ruhut, B.J., Kennedy, T.W., "Characterizing Fatigue Life for Asphalt Concrete
Pavement," TRB, 1982 Annual Meeting.
38. Hicks, R.G., "Use of Layered Tbeory in the Design and Evaluation of Pavemen t
Systems ," FIlWk-AK-RD-83-8, Alaska Department of Transportation and
Public Facilities, July 1982.
39. McHattie, R., personal correspondence, September 1984.
40. Yoder, E.J. and Witzak, M.W., Principles of Pavement Design, 2nd Edition,
John Wiley and Sons, Inc., 1975, pp. 285-286.
41. Conversation with Mr. Dave Esch, P.E., Highway Research Manager, ADOTPF,
Fairbanks, Alaska, November 1984.
42. Conversation with Mr. Milt Chryst, General Manager, Rubber Granulators,
Everett, Washington, November 1984.
158
"
43. Conversation with Mr. fub Linden, P.E., Technical Advisor, All Season Sur
facing Corporation, Bellevue, Washington, November 1984.
44. Conversation with Mr. Stan Barton, !lead Estimator, Morse Brothers, Tangent,
Oregon, November 1984.
45. Epps, J. A. and Wootan, C.V., "Economic ilnalysis of Airport Pavement Rehabili
tation Alternatives," DOT/FAA/RD-81/78, an Engineering Manual prepared
for U.S. Dept. of Transportation, Federal Aviation Administration,
October 1981, pp. 10.
/ 46. Marker, Vaughn, "Tender Mixes: The Causes and the Cures," The Asphalt Insti-
tute, Information Series No. 168, June, 1977.
47. ilnderson, D.A. and Dukatz, E.L., "Relationship Between Asphalt Flow Prop
erties and Asphalt Composition," Proceedings, Association of Asphal t
Paving Technologists, Vol. 54, 1984.
48. Dukatz, E.L., "A Characterization of Asphalt by Composition and Mechanical
Properties," Ph.D. Dissertation, Department of Civil Engineering, Penn
sylvania State University, May 1984.
49. Rostler, F.S., Rostler, K.S., Halstead, W.J., and Oglio, E.R., "Fingerprint
ing of Highway Asphalts," Proceedings, Association of Asphal t Paving
Technologists, Vol. 41, 1972.
50. Rostler, F.S. and Rostler, K.S., "Basic Considerations in Asphalt Research
Pertaining to Durability," Proceedings, Association of Asphalt Paving
Technologists, Vol. 50, 1981.
51. Rostler, F.S. and White, R.M., "Composition and Changes in Composition of
Highway Asphalt, 85-100 Penetration," Proceedings, Association of
Asphalt Paving Technologists, Vol. 31, 1962.
52. White, R.M., Mitten, W.R. and Skog, J.B., "Fractional Components of Asphalts
- Compatibility and Interchangeability of Fractions Produced from
Different Asphalts," Proceedings, Association of Asphalt Paving Techno
logists, Vol. 39, 1970.
53. Hussein, C.J., "Experimental Project No. MT 83-01, Construction Project No.
FB-2(22)28, U2 MacDonald Pass-East and West," Montana Department of
Highways, Butte District, November 1983.
54. Personal correspondence, "Experimental AC Rubber Mixtures on Route 395
(RAVENDALE)," California Department of Transportation, May 1984.
159

55. "Bi tunen-Rubber, It s Introduction and Developnent in South Africa," Pro
ceedings, Annual Transportation Convention, National Institute for
Transport and Road Research, Republic of South Africa, August 1984.
56. All Seasons Surfacing Corporation, Personal Communication; April 26, 1985.
160
APPENDIX A
SUMMARY OF INITIAL (1983) AND FOLLOW-UP QUESTIONNAIRE SURVEY (1984)
A-I
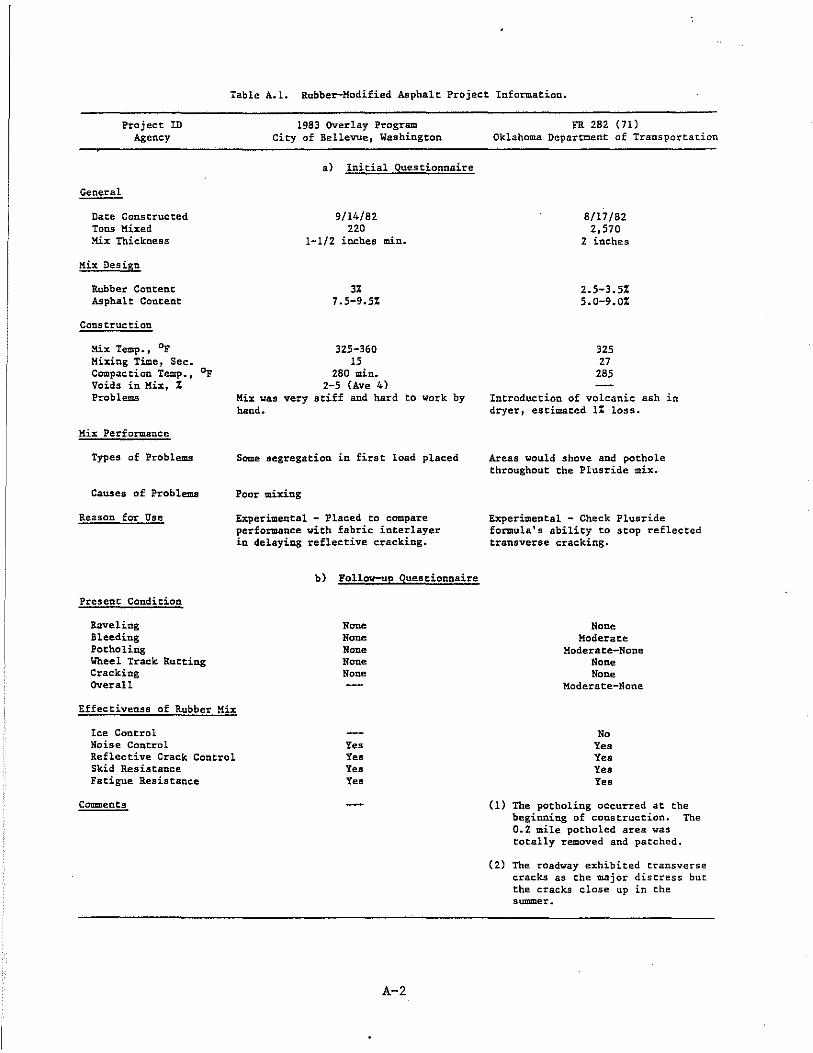
Table A.I. Rubber-Modified Asphalt Project Information.
General
Project ID Agency
Date Constructed Tons Mixed Mix Thickness
Mix Design
Rubber Content Asphalt Content
Const.ruction
Mix Temp., or Mixing Time, Sec. Compaction Temp., ~ Voids in Mix, % Problems
Mix Performance
Types of Problems
Causes of Problems
Reason Ear Use
Present Condit.ion
Raveling Bleeding Potholing Wheel Track Rutt.ing Cracking Overall
1983 Overlay Program City of Bellevue, Washington
a) Initial Questionnaire
9/14/82 220
1-1/2 inches min.
3% 7.5-9.5%
325-360 15
280 min. 2-5 (Ave 4)
Mix was very stiff and hard to work by hand.
Some segregation in first load placed
Poor mixing
Experimental - Placed to compare performance with fabric inter layer in delaying reflective cracking.
b) Follow-up Quest.ionnaire
None None None None None
Effectivenss of Rubber Mix
Ice Control Noise Control Reflective Crack Control Skid Resistance Fatigue Resist.ance
Comments
Yes Yes Yes Yes
A-2
FR 282 Oil Oklahoma Department of Transportation
8/17/82 2,570
2 inches
2.5-3.5% 5.0-9.0%
325 27
285
Introduction of volcanic ash in dryer, estimated 1% loss.
Areas would shove and pothole throughout the Plusride mix.
Experimental - Check Plus ride formula's ability to stop reflected transverse cracking.
None Moderate
Moderate-None None None
Moderate-None
No Yes Yes Yes Yes
(1) The potholing occurred at the beginning of construction. The 0.2 mile potholed area was totally removed and patched.
(2) The roadway exhibited transverse cracks as the major distress but the cracks close up in the summer.

Table A.2. Rubber-Modified Asphalt Project Information.
General
Project ID Agency
Date Constructed Tons Mixed Mix Thickness
Mix Design
Rubber Content Asphalt Content
Construction
Mix Temp. f or Mixing Time, Sec. Compaction Temp., of Voids in Mix Problems
Mix Performance Types of Probl~
Causes of Problems
Reason for Use
Present Condition
Raveling Bleeding Potheling Wheel Track Rutting Cracking Overall
Pavement Performance
Ice Control Noise Control Reflective Crack Control Skid Resistance Fatigue Resistance
Comments
SR 3437 (00) 75 South Dakota DOT
a) Initial Questionnaire
9/1/82 to 4/8/82 44B
1-1/2 inches
3% 6.5-6.B%
320-335
3%
Raveling (moderate to severe).
Poor bond between RA and underlying pavement. Cool loads, lack of density, high voids?
Experimental, de-icing.
b) Follow-up Questionnaire
Severe None
Moderate-None None None
Severe
Effective
No No No No No
Poor performance has been attributed to asphalt content being too low.
A-3
SPI-080-1 (8) Nevada DOT
B/B2 1,778
1-1/2 inches
3% B.6%
330 15 dry-IS wet
320-330 7.5% (range 0.5-12.0%)
Asphalt draining in trucks, rubber tire roller left marks which did not iron out.
Raveling, mix too coarse.
Open mix allowed excess water intrusion which separated and lifted the pad.
De-icing, performance evaluation.
Moderate Moderate-None
Moderate None None
No No
Asphalt failures in the pavement occurred immediately after the first rain. Maintenance is scheduled to remove the Plus ride from the roadway and replace it with a conventional Type 2 plant mix.
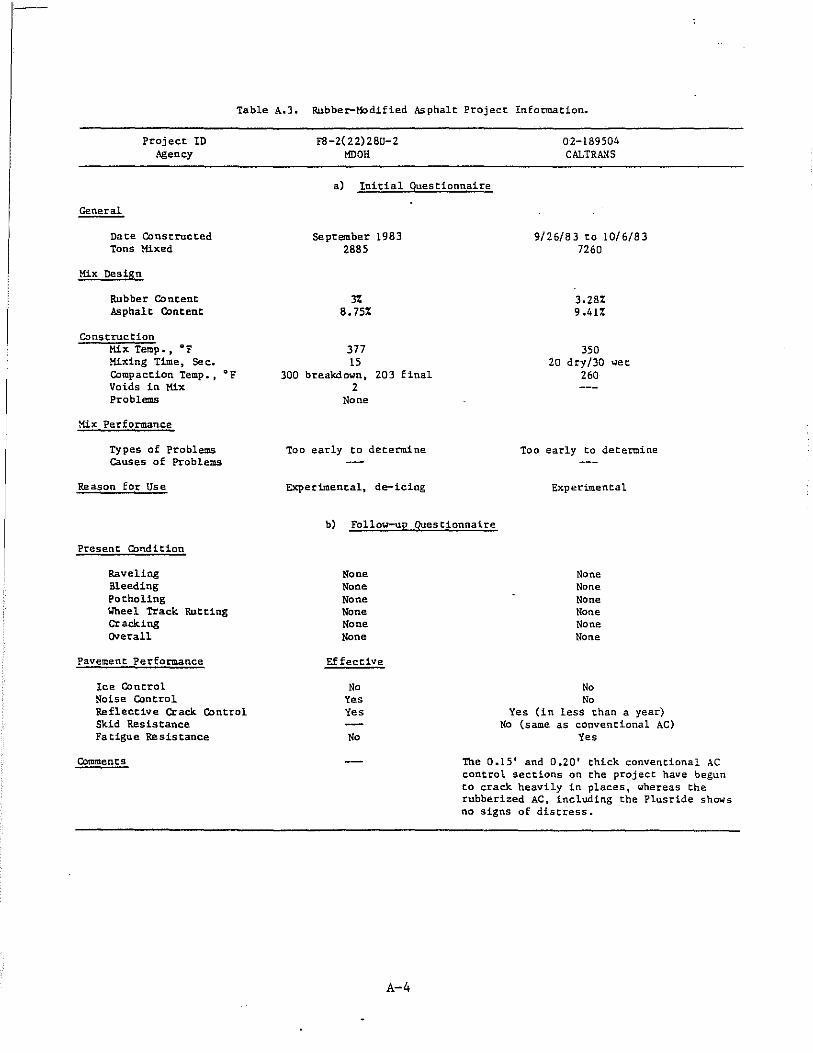
Table A.3. Rubber-Modified Asphalt Project Information.
General
Project ID Agency
Date Constructed Tons Mixed
Mix Design
Rubber Content Asphalt Content
Construction Mix Temp_, DF Mixing Time, Sec. Compaction Temp., of Voids in Mix Problems
!-tilt Performance
Types of Problems Causes of Problems
Reason for Use
Present Condition
Raveling Bleeding Pocholing Wheel Track Rutting Cracking OVerall
Pavement Performance
Ice Control Noise Control Reflective Crack Control Skid Res is tance Fatigue Resistance
Comments
FS-2(22)28U-2 MIlOR
02-189504 CALTRA.~S
a) Initial Questionnaire
September 1983 2885
3% 8.75%
377 15
300 breakdown, 203 final 2
None
Too early to determine
Experimental, de-icing
9/26/83 to 10/6/83 7260
3.28% 9.41%
350 20 dry/30 wet
260
Too early to determine
Experimental
b) Follow-up questionnaire
None None None None None None
Effective
No
Yes Yes
No
A-4
None None None None None None
No No
Yes (in less than a year) No (same as conventional AC)
Yes
The 0.15' and 0.20' thick conventional AC control sections on the project have begun to crack heavily in places, whereas the rubberized AC. including the Plus ride shows no signs of distress.
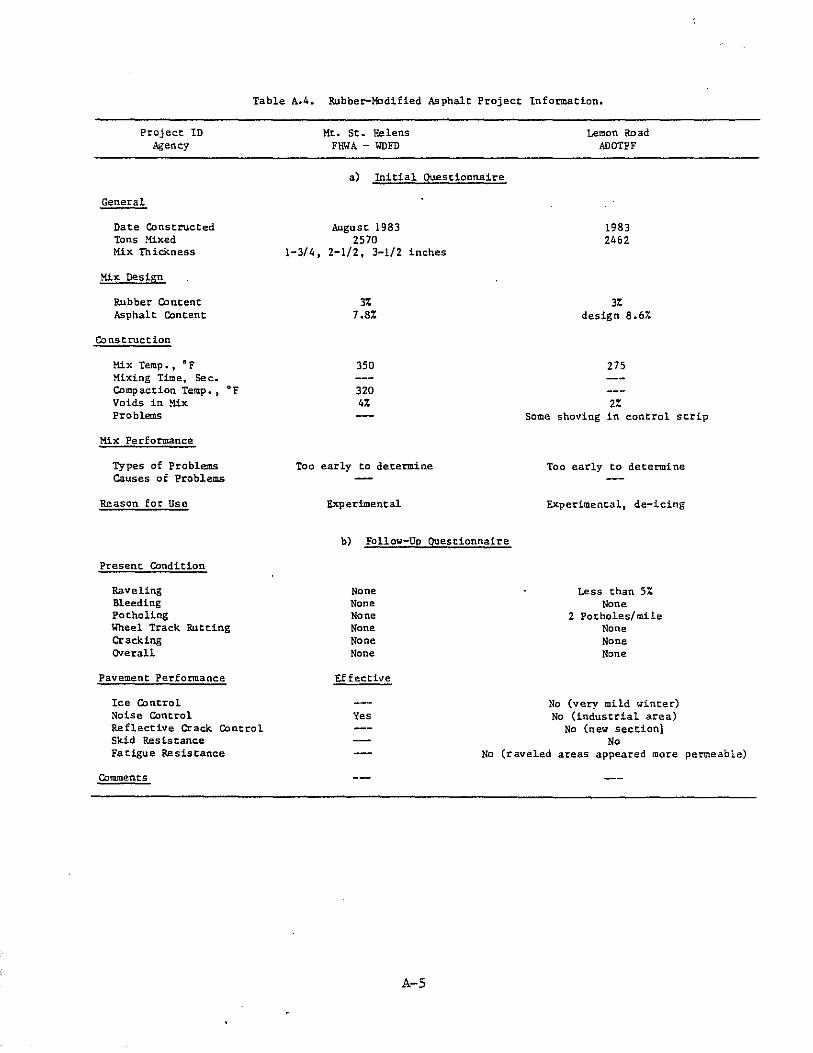
Table A.4. Rubber-Modified Asphalc Project Information.
Project ID Agency
General
Date Constructed Tons Mixed Mix Th ickness
Mix Design
Rubber Content Asphalt Content
Construction
Mix temp., "F Mixing Time, Sec. Compaction Temp., OF Voids in Mix P'I'oblems
Mix Performance
Types of Problems Causes of Problems
Reason for Use
Present Condition
Raveling Bleeding Potholing Wheel Track Rutting Cracking Overall
Pavement Performance
Ice Control Noise Control Reflective Crack. Control Skid Res is tance Fatigue Resistance
Co1tl\Uents
Me. St. Helens FHI/ A - lIDFD
a) Initial Questionnaire
August 1983 2570
1-3/4, 2-1/2, 3-1/2 inches
3% 7.8%
350
320 4%
Too early to determine
Experimental
b) Follow-Up Questionnaire
None None None None None None
Ef fective
Yes
Lemon Road ADOTPF
1983 2462
3% design 8.6%
275
2% Some shoving in control strip
Too early to determine
Experimental, de-icing
Less than 5% None
2 Potholes/mile None None None
No (very mild winter) No (industrial area)
No (new sec cion) No
No (raveled areas appeared more permeable)
A-S
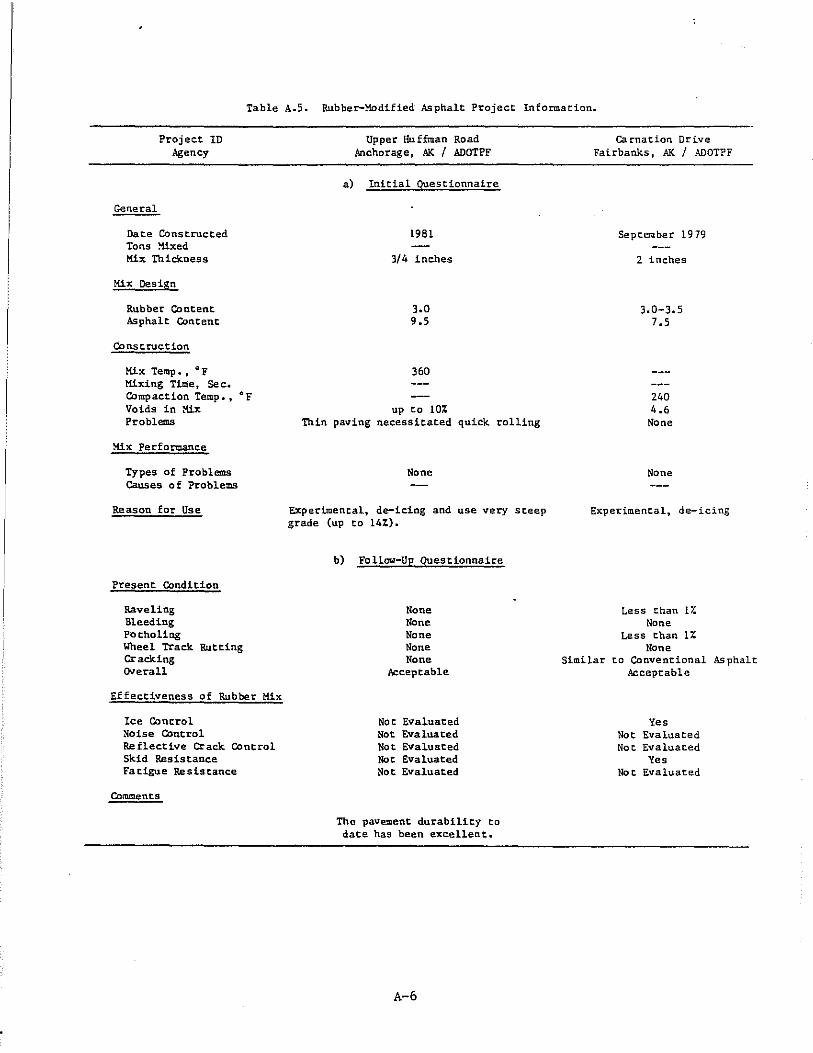
I·
Table A.5. Rubber-Modified Asphalt Project Information.
General
Project ID Agency
Da~e Constructed Tons !'11xed Mix Thiclc.ness
Mix Design
Rubber Content Asphalt Content
Construction
Mix Temp •• of Mixing Time, Se c. Compaction Temp_, of Voids in Mix Problems
Mix Performance
Types of Problems Causes 0 f Problems
Reason for Use
Present Condition
Raveling Bleeding Potholiag Wheel Track Rutting Cracking Overall
Effectiveness of Rubber Mix
Ice Control Noise Control Reflective Crack Control Skid Resis tance Fatigue Resls~ance
Commen~s
Upper Huffman Road Anchorage, AK / ADOTPF
a) Initial Questionnaire
1981
3/4 inches
3.0 9.5
360
up to 10% Thin paving necessitated quick rolling
None
Experimental, de-icing and use very steep grade (up to 14%).
b) Follow-Up Questionnaire
None None None None None
Acceptable
Not Evaluated Not Evaluated Not Evaluated Not Evaluated Not Evaluated
The pavement durability to date has been excellent.
A-6
ca rnation Drive Fairbanks, AK / ADOTPF
September 1979
2 inches
3.0-3.5 7.5
240 4.6
None
None
Experimental, de-icing
Less than 17-None
Less ~han 1% None
Similar to Conven~ional Asphalt. Acceptable
Yes Not Evaluated Not Evaluaced
Yes Not Evaluated
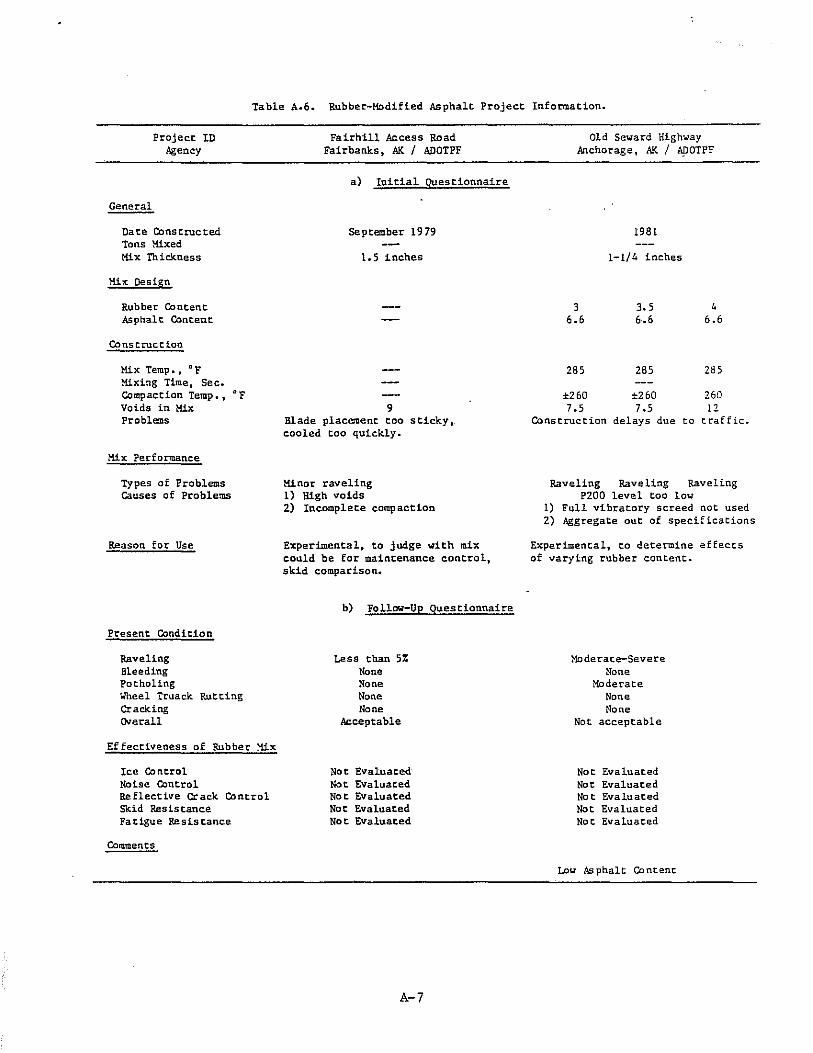
Table A.6. Rubber-Modified Asphalt Project Information.
General
Project ID Agency
Date Constructed Tons Mixed Mix Th ickness
Mix Design
Rubber Content Asphalt Content
Co ns t ruc t ion
Mix Temp •• ClF ~xing Time. Sec. Compaction Temp., of Voids in Mix Problems
Mix Performance
Types of Problems Causes of Problems
Reason for Use
Present Condition
Raveling Bleeding potholing Wheel Truack Rutting Cracking <Herall
Effectiveness of Rubber ~x
Ice Control Noise Control Reflective Crack Control Skid Res is tance Fatigue Resistance
Comments
Fairhill Access Road Fairbanks, AX. J ADOTPF
a) Initial Questionnaire
September 1979
1.5 inches
9 Blade placement too sticky. cooled too quickly.
Minor raveling 1) High voids 2) Incomplete camp action
Experimental, to judge \o1i.th mix could be for maintenance control, skid comparison.
b) Follow-Up Questionnaire
Less than 5% None None None None
Acceptable
Not Evaluated Not Evaluated Not Evaluated Not Evaluated Not Evaluated
A-7
Old Seward Highway Anchorage, AK I ApOTPF
3 6.6
285
±260 7.5
1981
1-1/4 inches
3.5 6.6
285
::260 7.5
4
6.6
285
260 12
Construction delays due to traffic.
Raveling Raveling Raveling P200 level too low
1) Full vibratory screed not used 2) Aggregate out of specifications
Experimental, to determine effects of varying rubber content.
Moderate-Severe None
Moderate None None
Not acceptable
No t Evaluated Not Evaluated No t Evaluated Not Evaluated Not Evaluated
Low Asphalt Content
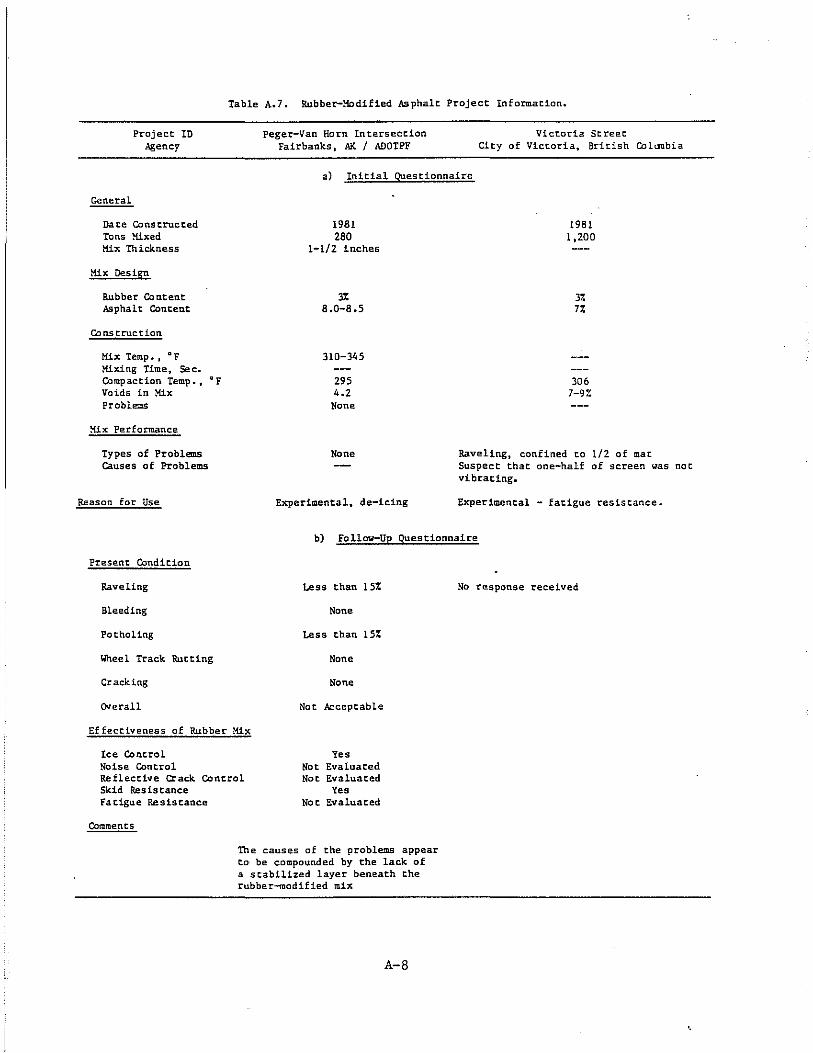
General
Project ID Agency
Date Constructed Tons Mixed Mix Thickness
Mix Design
Rubber Content A9phalt Content.
Co os t ruc t ion
Mix Temp •• "F Mixing Time, See. Compaet.ion Temp., "F Voids in Mix Problems
!1ix Performanee
Types of Problems causes of Problems
Reason for Use
Present Condition
Raveling
Bleeding
Potholing
Wheel Track Rutting
Cracking
OIIerall
Table A.7. Rubber-Modified Asphalt Project Information.
Peger-Van Horn Intersection Fairbanks. AK / ADOTPF
Victoria St. reet. Cit.y of Victoria. British Collitibia
a) Initial Questionnaire
1981 280
1-1/2 inches
3% 8.0-8.5
310-345
295 4.2 None
None
Experimental, de-icing
1981 1.200
3% 7%
306 7-97.
Raveling, confined to 1/2 of mat Suspect. that one-half of screen yas not. vibrating.
Experimental - fatigue resistance.
b) Follow-Up Questionnaire
Less than 15% No response received
None
Less than 15%
None
None
Not Accept.able
Effectiveness of Rubber Mix
Ice Control Noise Control Not
Yes Evaluated
Reflective Crack. Concrol Skid Res is tance
Not Evaluated Yes
Fatigue Resiscance
Comments
Not Evaluaced
The causes of the problems appear to be compounded by the lack of a stabilized layer beneath the rubber-modified mix
A-8
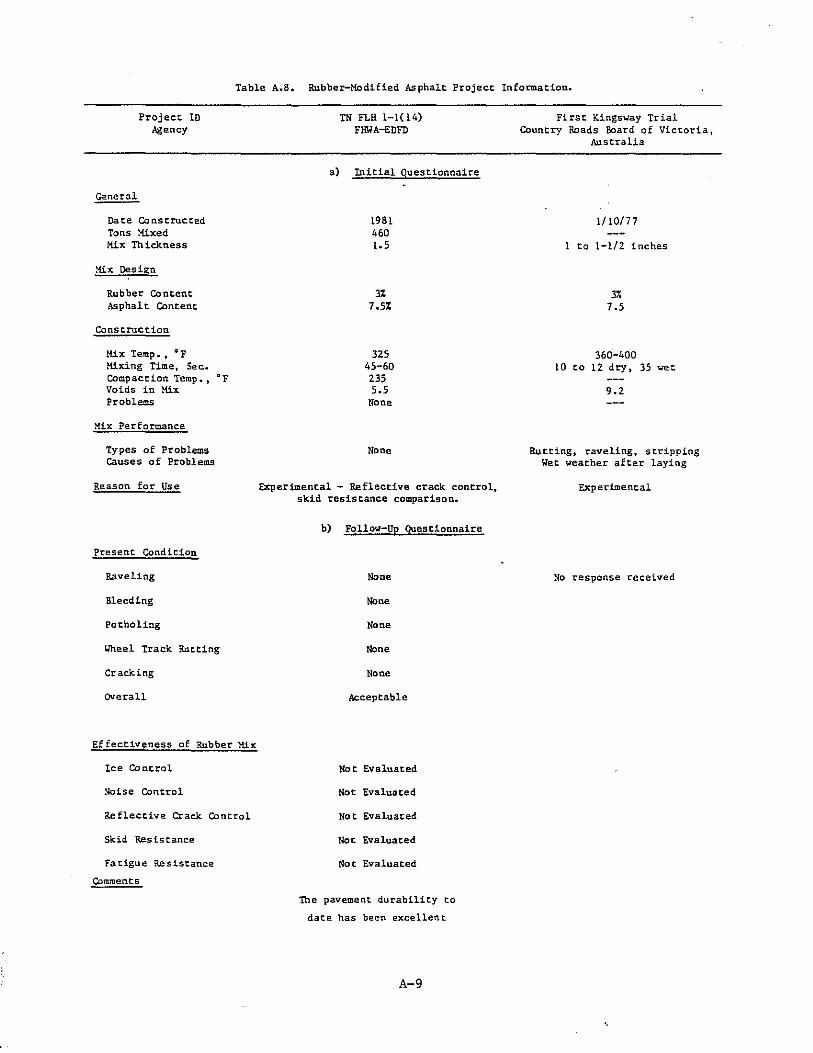
Table A.B. Rubber-Modified Asphalt Project Information.
G<!neral
Project ID Agency
Date Constructed Tons !tilted Mix Thickness
:-tilt Design
Rubber Content Asphal t Content
Construction
Mix Temp .. , 0' F Mixing Time, Sec. Compaction Temp.) of Voids in Mix Problems
Mix Performance
Types of Problems Causes of Problems
Reason for Use
Present Condition
Raveling
Bleeding
Potholing
Uheel Track Rutting
Cracking
Overall
Ef fectiveneS5 of Rubber Mix
Ice Control
90ise Control
Refleccive Crack Control
Skid Resistance
Facigue Resistance
Commencs
TN FLH 1-1(14) FHIIA-EDFD
a) Initial Questionnaire
1981 460 1.5
3% 7.5%
325 45-60 235 5.5
None
None
Experimental - Reflective crack control, skid resistance comparison.
b) Follow-Up Questionnaire
None
None
None
None
None
Acceptable
Not Evaluated
Not Evaluated
No t Evaluated
Not Evaluated
No t Evaluated
The pavement durability to
dace has been excellent
A-9
First Kingsway Trial Country Roads Board of Victoria,
Australia
1/10/77
1 to 1-1/2 inches
3. 7.5
360-400 10 to 12 dry, 35 wet
9.2
Rutting, raveling, stripping Wet weather after laying
Experimental
No response received
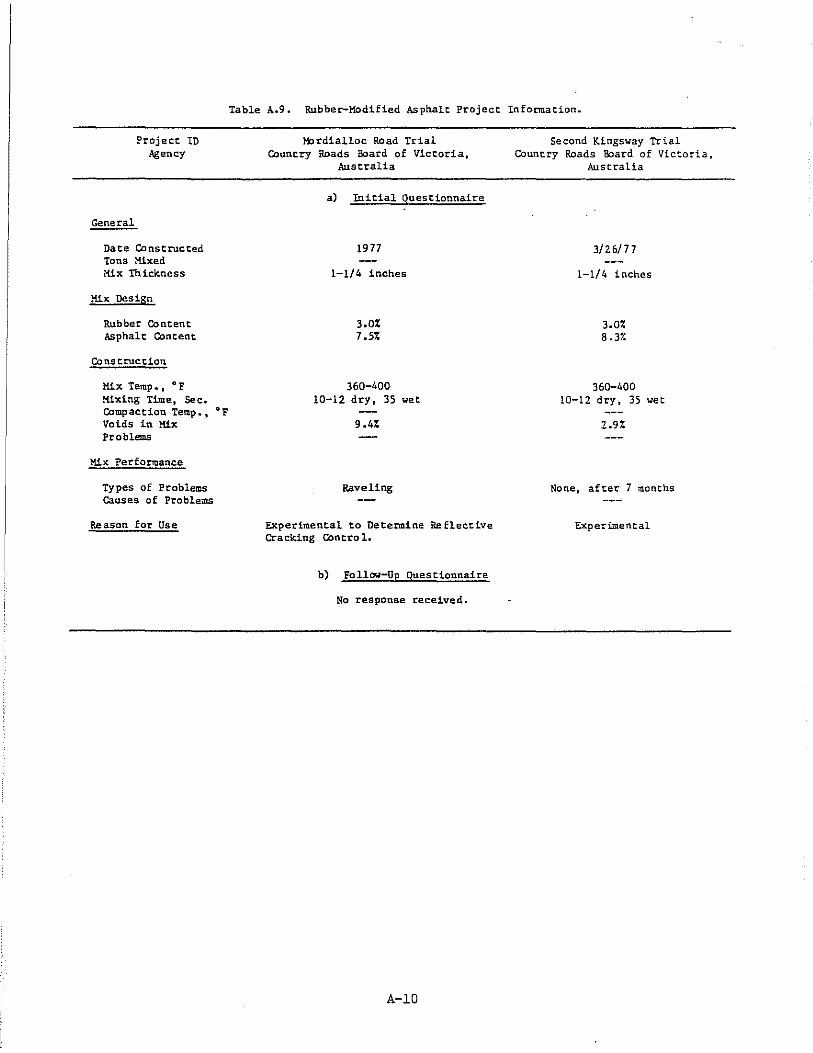
General
Project 10 Agency
Date Constructed Tons Mixed Mix Th ickness
Mix Design
Rubber Content Asphalt Content
Construction
Mix Temp". OF Mixing Time, Sec. Camp ac t ion Temp., ° F 1/0 i.ds 1n Mix Problems
Mix Performance
Types of Problems Causes of Problems
Reason Ear Use
Table A.9. Rubber-Modified Asphalt Project Information.
Ii:Irdialloc Road Trial Country Roads Board of Victoria,
Australia
a) Initial Questionnaire
1977
1-1/4 inches
3.0% 7.5%
360-400 10-12 dry, 35 wet
9.4%
Raveling
Experimental to Determine Re flective Cracking Contra 1.
b) Follow-Up Questionnaire
No response received.
A-10
Second Kingsway Trial Country Roads Board of Victoria.
Australia
3/26/77
1-1/4 inches
3.0% 8.37.
360-400 10-12 dry. 3S wet
2.9%
None, after 7 months
Experimental
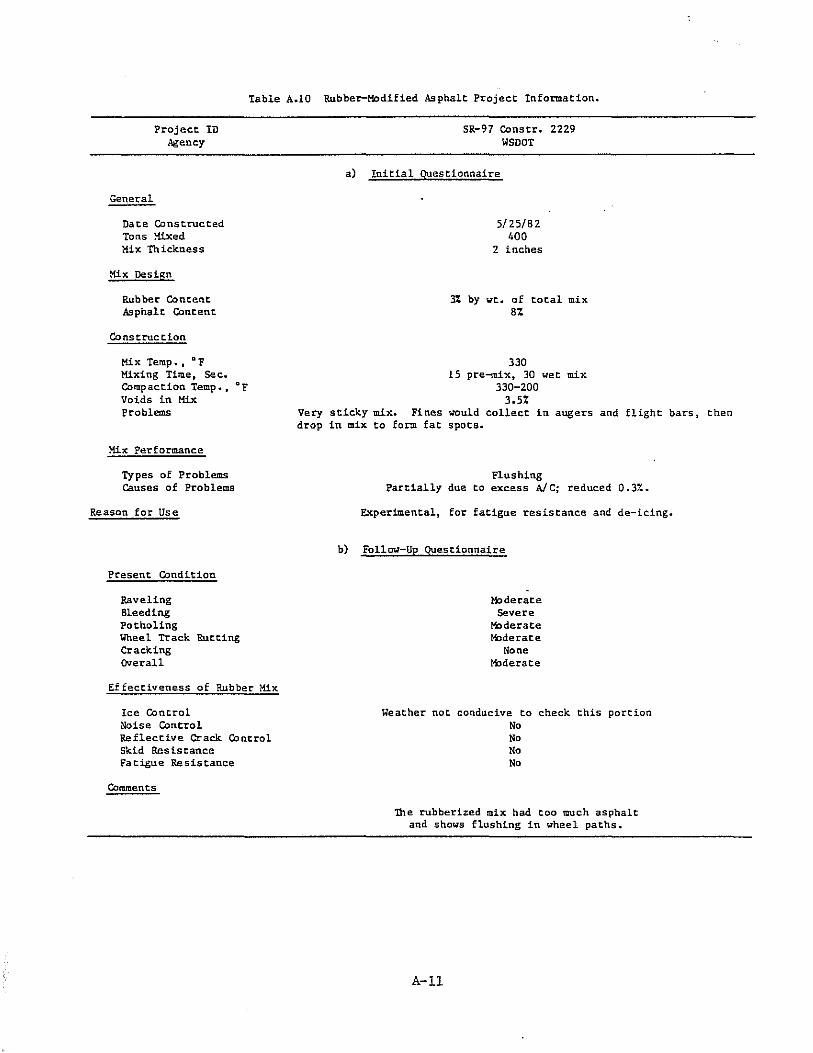
Table A.10 Rubber-Modified As phalt Project Information.
General
Project ID Agency
Date Constructed Tons }tixed Mix Th ickness
Mix Design
Rubber Content Asphalt Content
Construction
Mix Temp •• <I F Mixing Time, Sec. Compaction Temp •• <IF Voids in Mix Problems
Mix Performance
Types of Problems Causes of Problems
Reason for Use
Present Condition
Raveling Bleeding Pothollng Yheel Track Rutting Cracking Overall
Ef fectiveness of Rubber Mix
Ice Control Noise Control Reflective Crack Control Skid Resistance Fatigue Resistance
Comments
SR-97 Constr. 2229 WSDOT
a) Initial questionnaire
5/25/82 400
2 inches
3% by wt. of total mix 8%
330 15 pre-mix, 30 wet mix
330-200 3.5%
Very sticky mix. Fines would collect in augers and flight bars, then drop in mix to form fat spots.
b)
Flushing Partially due to excess Ale; reduced 0.3%.
Experimenta17 for fatigue resistance and de-icing.
Follow-Up Questionnaire
Mlderate Severe
Mlderate tbderate
None M:Jderate
Weather not conducive to check this pore ion No No No No
The rubberized mix had too much asphalt and shows flushing in wheel paths.
A-ll
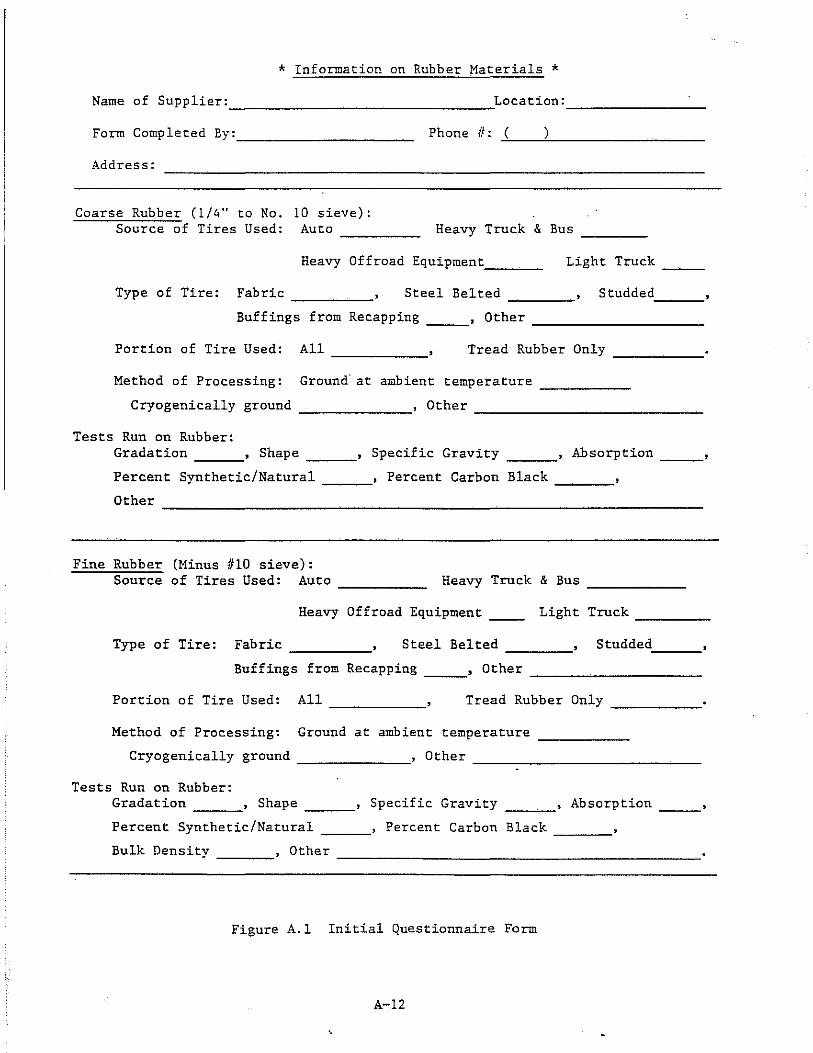
* Information on Rubber Materials * Name of Supplier: __________________________________ ~Location: ________________ __
Form Completed By: ---------------- Phone 1/: ( ) ~-~---------
Address:
Coarse Rubber (l/4" to No. 10 sieve): Source of Tires Used: Auto ---- Heavy Truck & Bus
Heavy Offroad Equipment '----
Light Truck --Type of Tire: Fabric ____ _ Steel Belted ___ _ S tuddedc-__
Buffings from Recapping ___ , Other ____________________ _
Portion of Tire Used: All _____ __ Tread Rubber Only
Method of Processing: Ground' at ambient temperature ----Cryogenically ground , Other ____________________________ _
Tests Run on Rubber: Gradation , Shape _______ , Specific Gravity , Absorption ____ _
Percent Synthetic/Natural , Percent Carbon Black ______ __ Other _______________________________ _
Fine Rubber (Minus #10 sieve): Source of Tires Used: Auto ______ _ Heavy Truck & Bus ______ _
Heavy Offroad Equipment __ Light Truck _____ _
Type of Tire: Fabric ____ _ Steel Belted ---- Studded. __ __
Buffings from Recapping ___ , Other ____________________ _
Portion of Tire Used: All ------ Tread Rubber Only -----Method of Processing: Ground at ambient temperature -----
Cryogenically ground , Other ___________________________ _
Tests Run on Rubber: Gradation , Shape , Specific Gravity , Absorption --- --- --- ---Percent Synthetic/Natural ___ , Percent Carbon Black ___ _
Bulk Density ___ , Other _____________________ __
Figure A.I Initial Questionnaire Form
A-12
"
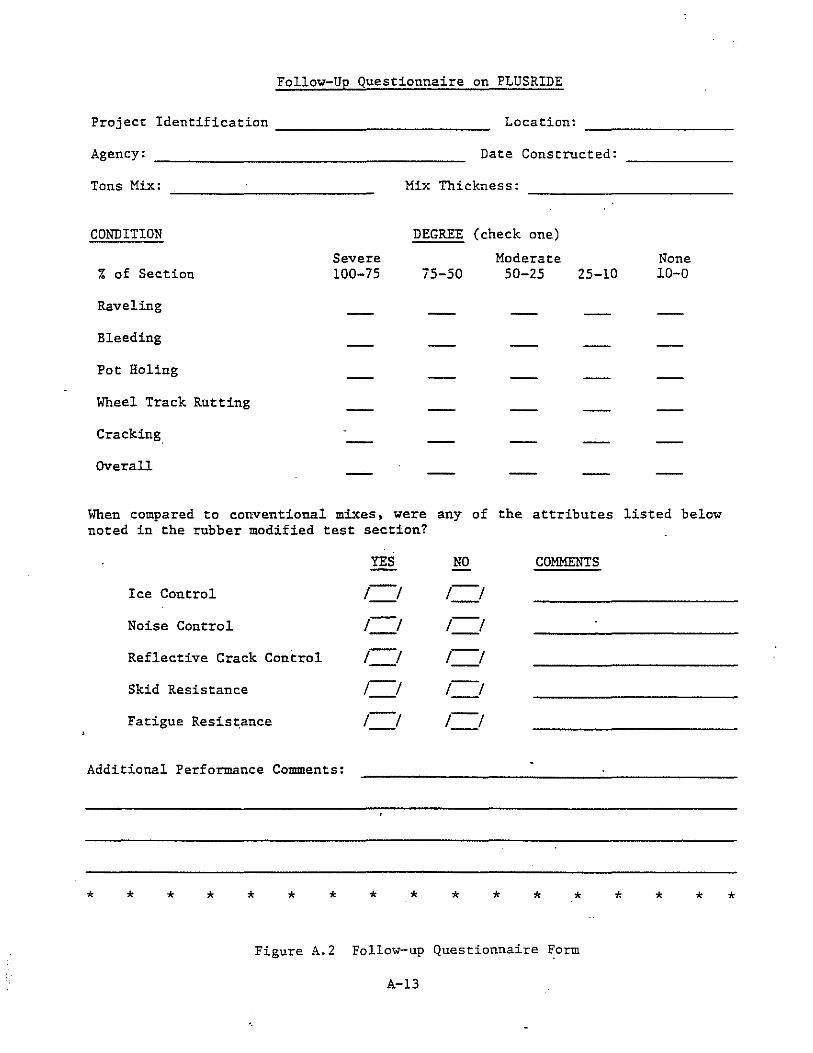
Follow-Up Questionnaire on PLUS RIDE
Project Identification ________________________ ___ Location:
Agency:
Tons Mix:
CONDITION
r. of Section
Raveling
Bleeding
Pot Holing
Wheel Track Rutting
Cracking
Overall
Severe 100-75
Date Constructed:
Mix Thickness:
DEGREE (check one)
Moderate is-50 50-25 25-10
None 10-0
When compared to conventional mixes, were any of the attributes listed below noted in the rubber modified test section?
Ice Control
Noise Control
Reflective Crack Control
Skid Resistance
Fatigue Resis~ance
Additional Performance Comments:
* * * * * * *
YES
/ /
/ /
/ /
/ /
/ /
* *
NO
/ /
/ /
/ /
/ /
/ /
*
COMMENTS
* * *
Figure A.2 Follow-up Questionnaire Form
A-13
* * * *
APPENDIX B
DESCRIPTION OF LEMON ROAD PROJECT (RS-0955(1))
B-1
1 • 0 WORK PLAN
1.1 Objective
The objective of this project is to evaluate the performance of an
asphalt concrete pavement constructed with the addition of 3% o'f 1/4-inch
minus-sized rubber particles produced from ground-up waste tires. The
addition of the rubber particles is expected to provide: 1) a benefit from
reduced roadway surface ice deposits as a result of flexure and ice bonding
action, 2) improved skid resistance, and 3) increased pavement life as a
result of improved fatigue failure resistance.
1.2 Project Description
The Lemon Road project is located approximately 5-1/2 miles northwest of
Juneau within the flood plain of Lemon Creek. A quantity of 2,279 tons of
rubberized asphalt pavement was incorporated into the project as a 48-foot
wide interim finish course pavement between stations "L" 260+75 and
"L" 311+50. The approximate mat thickness was 1-1/2 inches. Testing, evalua
tion, and reporting was performed by personnel from the Southeast Region
Materials Section with the assistance of mix design and evaluation by staff of
the Central Region Materials Laboratory.
1.3 Observations
The performance of the rubber section is compared to the adjacent new
conventional asphalt concrete pavement placed under the general paving
project. Observation includes skid testing with a "Tapley" decelerometer
mounted in a light passenger vehicle, Benkleman Beam deflection testing,
laboratory testing of cored samples for density and resilient properties, and
repeated visual observation for surface de-icing characteristics.
Information derived from this project is reported along with updated data
on previously constructed rubberized asphalt concrete projects within the
State. Expected construction staging and a minimum of one winter's observa
tions delayed completion of this appendix until January 1985. Final recommen
dations for the future uSe of rubberized asphalt concrete in Alaska will be
presented in a follow-up report.
B-2
1.4 Rubber-Asphalt Cost
The cost for supply and placement of the rubberized asphalt paving mix
and binder was $82.30 per ton, with the quantity approximately 2,279 tons.
AC-5 asphalt cement for the mix had been determined to be approximately 8.5%
(195 tons) of total mix at $280.00 per ton.
2.0 MIX DESIGN RESULTS
A Marshall (method T-17) mix design was prepared on the aggregates ob
tained from Lemon Road. The results given below show the optimum asphalt
content to be 8.6% by weight of aggregate. The Plusride criteria was used for
selecting the mix characteristics. The target values for the mix are as
follows:
Gradation, % Passin~ Tar~et Value Ran~e
5/8 inch 100 100
1/2 inch
3/8 inch 69 62-76
1/4 inch 39 32-42
No. 10 28 22-32
No. 30 24 20-25
No. 200 9 8-12
Asphalt content, 8.6 8.1-9.1 % Dry Wt. Agg.
Rubber content 3.0 2.85-3.15 % Total Mix
The rubber gradation specification for the project was as follows:
Gradation, % Passing
1/4
No.4
No. 10
No. 20
&-3
Specifications
100
76-100
28-36
10-24
Mix design information for the target value asphalt content of 8.6% was:
Characteristic
Unit weight (pcf)
St ability (1 bs)
now 0/100 inch)
Voids filled (%)
Voids total mix (%)
Aggregate blend specific gravity
Mixing Temperature
Value
144.1
820
19
94
1.1
2.757
350° to 375°F
3.0 CONSTRUCTION OPERATIONS AND JOB CONTROL
3.1 Construction Operations
The contract for the project was awarded to:
TRI State Construction Box 3-600, Suite 34 Juneau, Alaska 99807
A project meeting was held on August 10, 1983 between the ADOTPF, the
contractor, and representatives from All Seasons Surfacing Corporation. Items
discussed included:
1) Mix Temperatures. The mix temperature at the paver should be
300°F.
2) Compaction Procedures. The contractor should use vibratory
compactors for breakdown and not use rubber-tired rollers.
3) Test Strip. The contractor believes his gradation will be
within specifications after a run through the plant. Specific
questions raised were:
a) What happens if the test strip is out of specifications?
b) What happens if the rubber shows up as oil in the nuclear
gauge?
c) The rubber asphalt portion of the project should be
completed as early as possible before the cutoff date.
A 100-ton test strip was placed on August 19, 1983. The first truckload
looked dry; hence, the oil content was increased 0.2%. The laydown went
B-4
fairly well, but compaction did not. The mix was tender and shoved on both
the treated and untreated bases. This resulted in limiting the passes of the
vibratory compactor to two maximum. There was concern on the part of the
engineer that even though the material was in specification, the mix behavior
was not acceptable. Paving was temporarily stopped.
Another meeting was held on August 22, 1983 with representatives of the
state and the contractor. The results were as follows:
1) The minimum mix discharge temperature should be reduced to
275°F for use of a drum dryer plant.
2) A 10-ton Eyster roller should be used for breakdown.
3) An 8-ton Dynapac roller should be used as the finish roller.
4) The asphalt content should be increased to 9.5% to fill air
voids.
5) The CSS-1 tack coat should have an application rate of .05
gal/yd2 (residual).
On August 24, 1983, All Seasons Surfacing personnel indicated the asphalt
content should not be increased; therefore, the initial value of 8.6% was
continued.
3.2 Construction Observations
The project engineer made several remarks concerning project construction
in his report. The remarks are summarized below:
1) The production of gap-graded aggregates was difficult for the
contractor, because the stockpiles used for blending contained
a considerable amount of fines.
2) The drum-dryer plant used by the contractor produced an ex
tremely opaque smoke which cased the Department of Environ
mental Control to shut the project down for a short time
period.
3) Raking the mix on the longitudinal joint proved to be more
difficult than normal.
4) Rubberized mix placed around concrete manhole adjustment rings
caused the ring joint to separate.
5) Typical paint pavement stripes appeared to weaken in intensity
more quickly than normal.
~s
6) Mat shoving was most noticeable when the base was primed and
was not strengthened by chips or sand.
7) The contractor must be required to use a wetting agent on
roller drums.
3.3 Project COntrol
Tables B.1 and B.2 summarize results of ADOT/PF tests taken from the
project. Note the circled sample properties indicate the value does not meet
the project specifications. Both samples exhibited low voids.
4.0 PERFORMANCE
The Lemon Road performance evaluation consists of "Tapley" skid testing,
Benkleman Beam deflection testing, visual observation of surface de-icing
characteristics, and laboratory testing of control and rubber-modified core
samples for bulk specific gravity and resilient properties. Part of the
laboratory testing (resilient properties) was to be performed at Oregon State
University. The sections which follow in this appendix summarize the results
of those tests.
Upon receipt at OSU, the Lemon Road cores were measured for overall
dimensions and top lift thickness. The measurements are summarized in Table
B.3.
4.1 Test Summary and Economic AnalYSis of Fatigue Results
Table B.4 presents the average resilient modulus and fatigue test results
from the Lemon Road cores. The fatigue life versus tensile strain is shown in
Figure B.1. Evaluating the curves at 100 and 200 microstrain values gives
fatigue lives for the rubber asphalt mixes 3 times and 2 times (respectively)
greater than the conventional asphalt pavement.
The economic impact of the increased fatigue life and the 8% reduction in
bulk specific gravity is approximated in Table B.S. This table was con-
structed using the same assumptions as section 5.2.1 in the report. No
B-6
Table B.lo Properties for the Rubber Asphalt Mix - Lemon Road (Dat~ Tested 8/30/83).
Propercy
Aspha.lt content, % Dry Ye. Aggregate
Gradation, % passing
5/8 inch 1/2 inch J/B incb 1/4 inch No. 10 No. 30
No. 200
Rubber content. % Total Mix
Voids, total mix, %
Unit weight, pcf
Lab No. 83A-1455 Field No. 3
100 91
~ 27
8 1.3
142.5
Lab No. 83-1456 Field No. 4
8.9
100 91 64 42 29 25 8
0 1.9
143.1
Project Specification
8.1-9.1
100
62-76 32-42 22-32 20-25
8-12
2.85-3.15
Note the circled sample properties which mean the value does not meet the project specification.
Table B.Z. Lemon Road Conformance Sampling.
Sample Location Sample Location Sample Location Sta. 269+70 Rt. Sta. 264+20 Lt. Sta. 264+20 Lt. Project
Property Date: 8/29/83 Dace: 8/30/83 Date: 8/30/83 Specification
Asphalt content, % 8.79 G 9. II 8.1-9.1
Gradacion, % passing
5/8 inch 100 100 100 3/8 inch 62 66 62-76 1/4 inch 41 ~ 32-42 No. 10 28 22-32 No. 30 24 24 20-25 No. 100 15 16 No. 200 9 9 8-12
Rubber content. % 8 G {3 2.85-3.15
Voids total mix, % 2.4 1.4 1.8
Voids filled., % 73.0 77.3 75.5
Stability, lb. 600 540 595
Flow, 1/100 inch 23 26 30
Unit. weight., pof 141.0 141.5 141.3
Aggregat.e fracture 87 70 min.
B-7
Table B.3. Lemon Road Core Sample Identification.
Top Lift Sample Core Diameter Core Length Thickness
Sample Identification Number (inches) (inches) (inches)
R-C (rubber asphalt from 1 3-1/2 5-1/2 1-3/4 the center of lane) 2 3-1/2 10 1-3/4
3 3-1/2 5 1-3/4 4 3-1/2 5 1-3/4
R-W (rubber asphal t from 5 3-1/2 5-3/4 1-1/2 the wheel path) 6 3-1/2 1-1/2 1-1/2
7 3-1/2 3-1/4 1-1/2 8 3-1/2 10 1-3/4
W-R Control (Class II 9 3-1/2 6-1/2 1-3/4 asphalt from the 10 3-1/2 6-1/2 2 wheel path) 11 3-1/2 6-3/4 1-3/4
12 3-1/2 6-1/2 1-3/4
C Control (Class II 13 3-1/2 6-1/2 2 asphalt from the 14 3-1/2 6-1/2 2 center of the lane) 15 3-1/2 6-1/2 1-1/2
16 3-1/2 6-1/2 1-3/4
Note: Testing by asu was performed on the top lift of each core sample.
Table B.4. Bulk Specific Gravity, Modulus, and Fatigue Test Results of Lemon Road Cores.
Bulk Resilient* Sample Strain Specific Modulus Fatigue*
Identification (~s ) Gravity (ksi) Life
Class II asphalt 100 2.451 922 8,345
150 2.447 817 2,939
200 2.454 919 1,589
Rubberized asphalt 100 2.293 357 15,556
150 2.283 328 7,750
200 2.262 402 3,752
*Test Temperature = lOoC Load Duration = 0.1 5
Load Frequency = 1 Hz
B-8
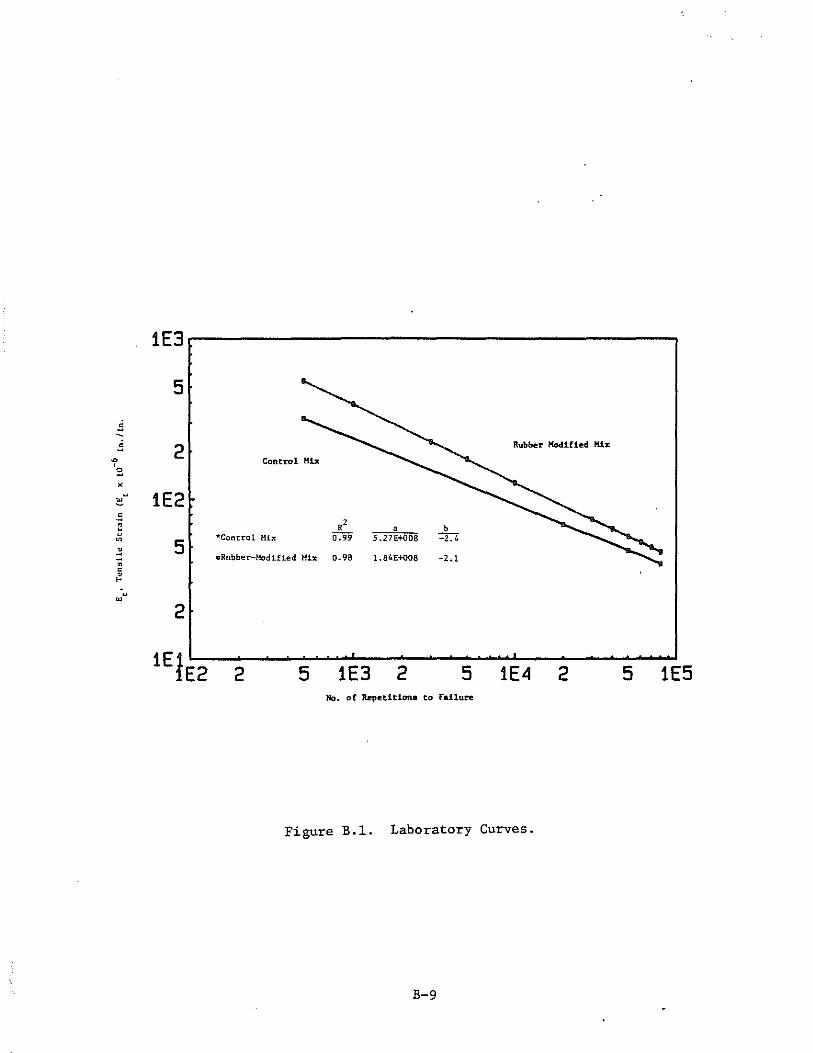
2! • c • ~
1E3.-------------------------------~
5
2 Control Mb
Rubber Modified Mix
1E2 .' • b
5 *Control Hix G.99 S.Z7E+<lOB ::z:4
.Rubber-Modified Hix 0.98 1. 84E-+Q08 -2.1
2
2 5 1E3 2 5 1E4 2 5 1E5 No. of Repetition. to Failure
Figure B.l. Laboratory Curves.
B-9
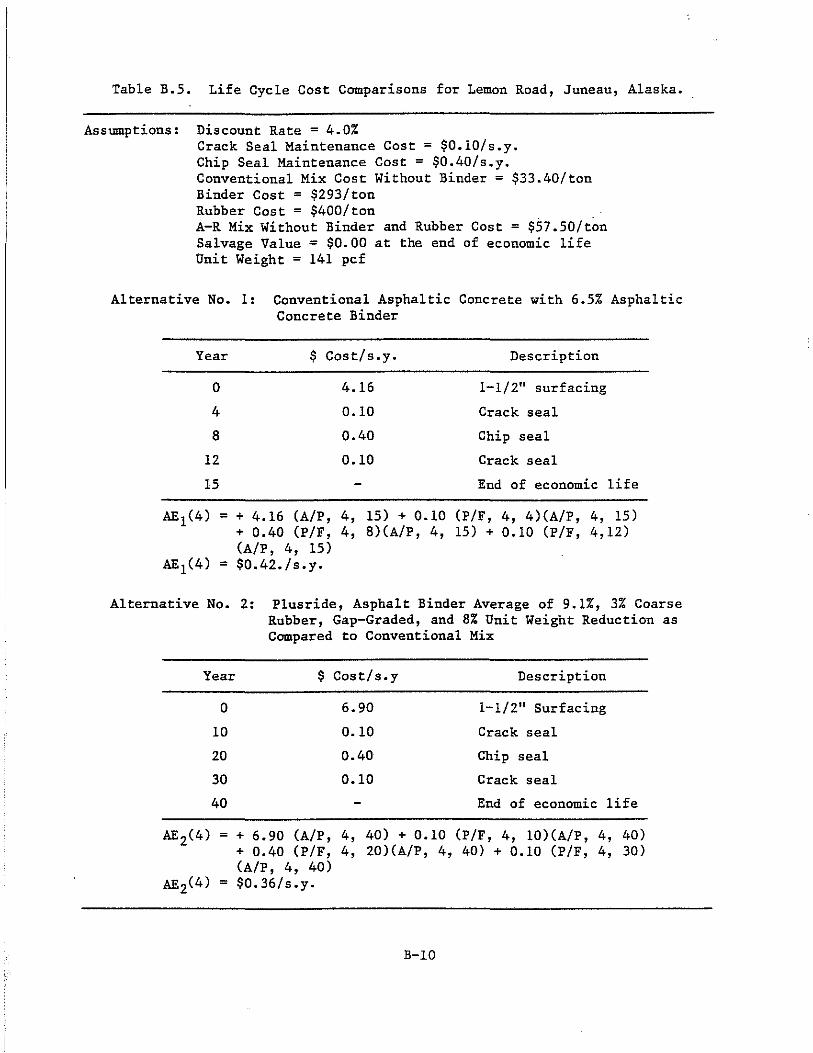
Table B.S. Life Cycle Cost Comparisons for Lemon Road, Juneau, Alaska.
Assumptions: Discount Rate = 4.0% Crack Seal Maintenance Cost = $0.10/s.y. Chip Seal Maintenance Cost = $0.40/s.y. Conventional Mix Cost Without Binder = $33.40/ton Binder Cost = $293/ton Rubber Cost = $400/ton A-R Mix Without Binder and Rubber Cost = $S7.50/t~n Salvage Value = $0.00 at the end of economic life Unit Weight = 141 pcf
Alternative No.1: Conventional Asphaltic Concrete with 6.5% Asphaltic Concrete Binder
Year $ Cost/s.y. Description
0 4.16 1-1/2" surfacing
4 0.10 Crack seal
8 0.40 Chip seal
12 0.10 Crack seal
15 End of economic life
AE 1(4) = + 4.16 (A/P, 4, 15) + 0.10 (P/F, 4, 4)(A/P, 4, 15) + 0.40 (P/F, 4, 8)(A/P, 4, 15) + 0.10 (P/F, 4,12) (A/P, 4, 15)
AE 1(4) = $0.42./s.y.
Alternative No.2: Plusride, Asphalt Binder Average of 9.1%, 3% Coarse Rubber, Gap-Graded, and 8% Unit Weight Reduction as Compared to Conventional Mix
Year $ Cost/s.y Description
0 6.90 1-1/2" Surfacing
10 0.10 Crack seal
20 0.40 Chip seal
30 0.10 Crack seal
40 End of economic life
AE 2(4) = + 6.90 (AlP, 4, 40) + 0.10 (P/F, 4, 10)(A/P, 4, 40) + 0.40 (P/F, 4, 20)(A/P, 4, 40) + 0.10 (P/F, 4, 30) (A/P, 4, 40)
AEZ(4) = $0.36/s.y.
B-IO
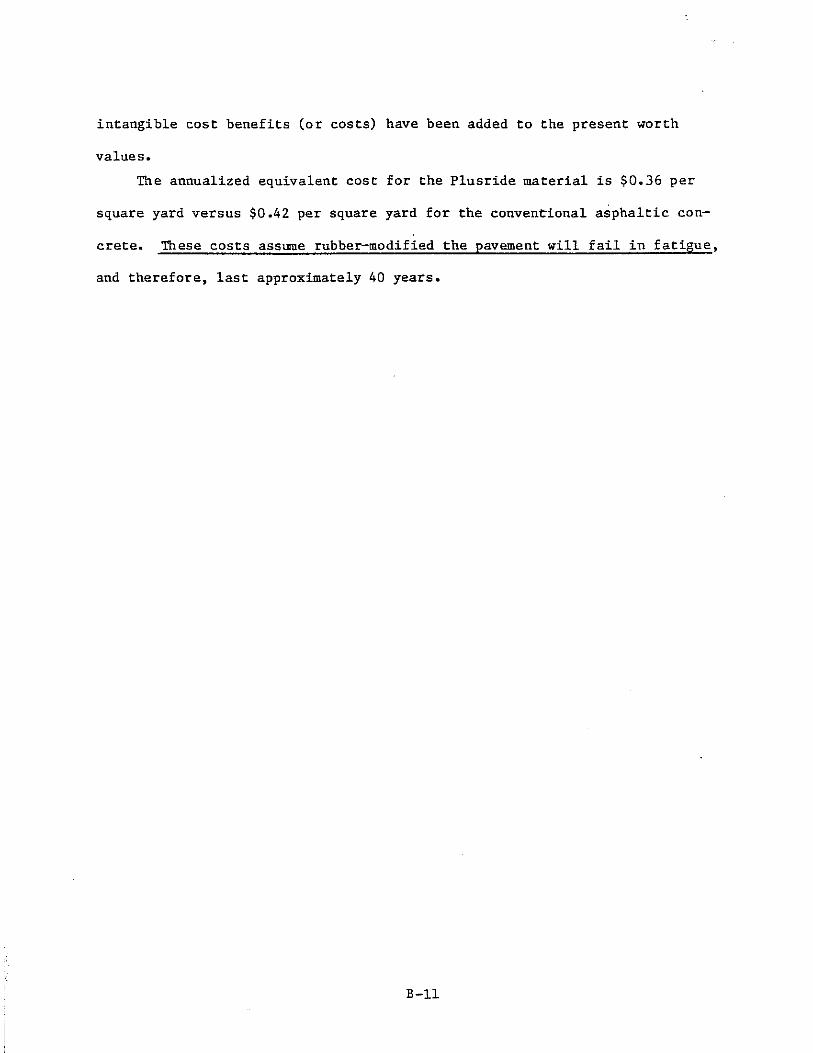
intangible cost benefits (or costs) have been added to the present worth
values.
The annualized equivalent cost for the Plusride material is $0.36 per
square yard versus $0.42 per square yard for the conventional asphaltic con
crete. These costs aSsume rubber-modified the pavement will fail in fatigue,
and therefore, last approximately 40 years.
B-ll
APPENDIX C
TEST DATA
C-l
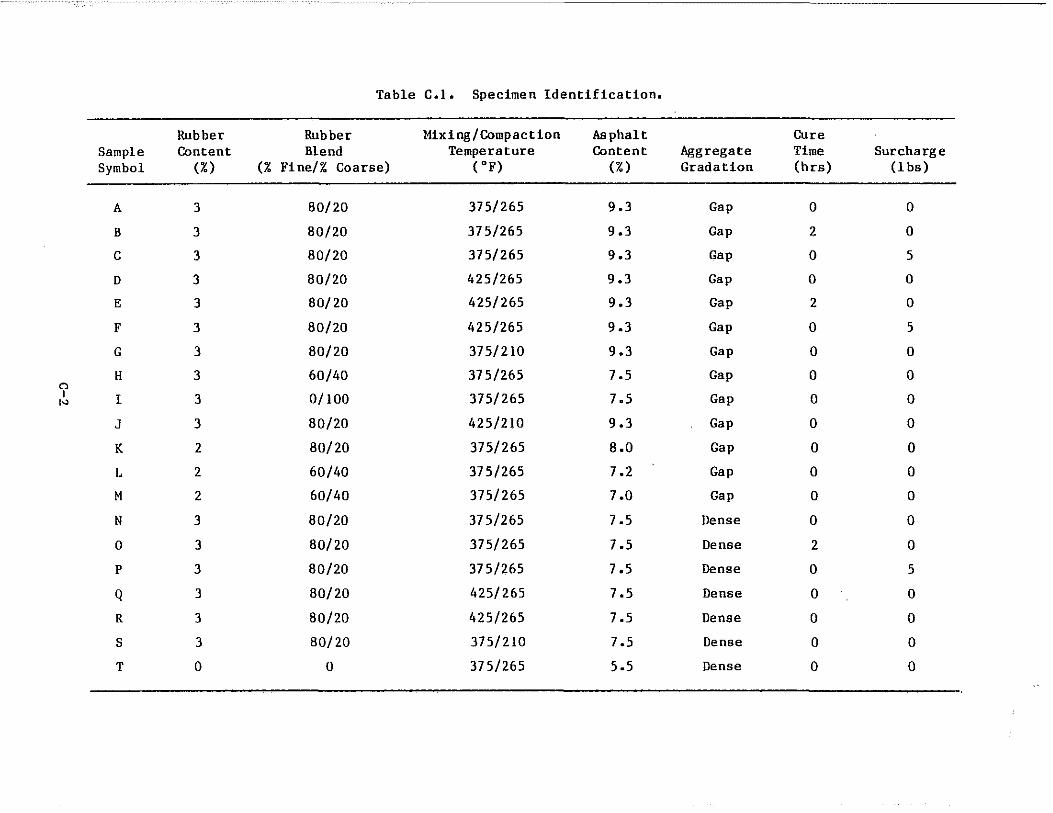
Table C.l. Specimen Identification.
Rubber Rubber Mixing/Compaction Asphalt Cure Sample Content Blend Temperature Content Aggregate Time Surcharge Symbol (%) (% Fi ne/% Coarse) ( OF) (%) Gradation (hrs) (1 bs)
A 3 BO/20 375/265 9.3 Gap 0 0
B 3 BO/20 375/265 9.3 Gap 2 0
C 3 BO/20 375/265 9.3 Gap 0 5
D 3 80/20 425/265 9.3 Gap 0 0
E 3 80/20 425/265 9.3 Gap 2 0
F 3 80/20 425/265 9.3 Gap 0 5
G 3 80/20 375/210 9.3 Gap 0 0
H 3 60/40 375/265 7.5 Gap 0 0 n I I 3 0/100 375/265 7.5 Gap 0 0 N
J 3 80/20 425/210 9.3 Gap 0 0
K 2 80/20 375/265 8.0 Gap 0 0
L 2 60/40 375/265 7.2 Gap 0 0
M 2 60/40 375/265 7.0 Gap 0 0
N 3 80/20 375/265 7.5 Dense 0 0
0 3 80/20 375/265 7.5 Dense 2 0
P 3 80/20 375/265 7.5 Dense 0 5
Q 3 80/20 425/265 7.5 Dense 0 0
R 3 80/20 425/265 7.5 Dense 0 0
S 3 80/20 375/210 7.5 Dense 0 0
T 0 0 375/265 5.5 Dense 0 0
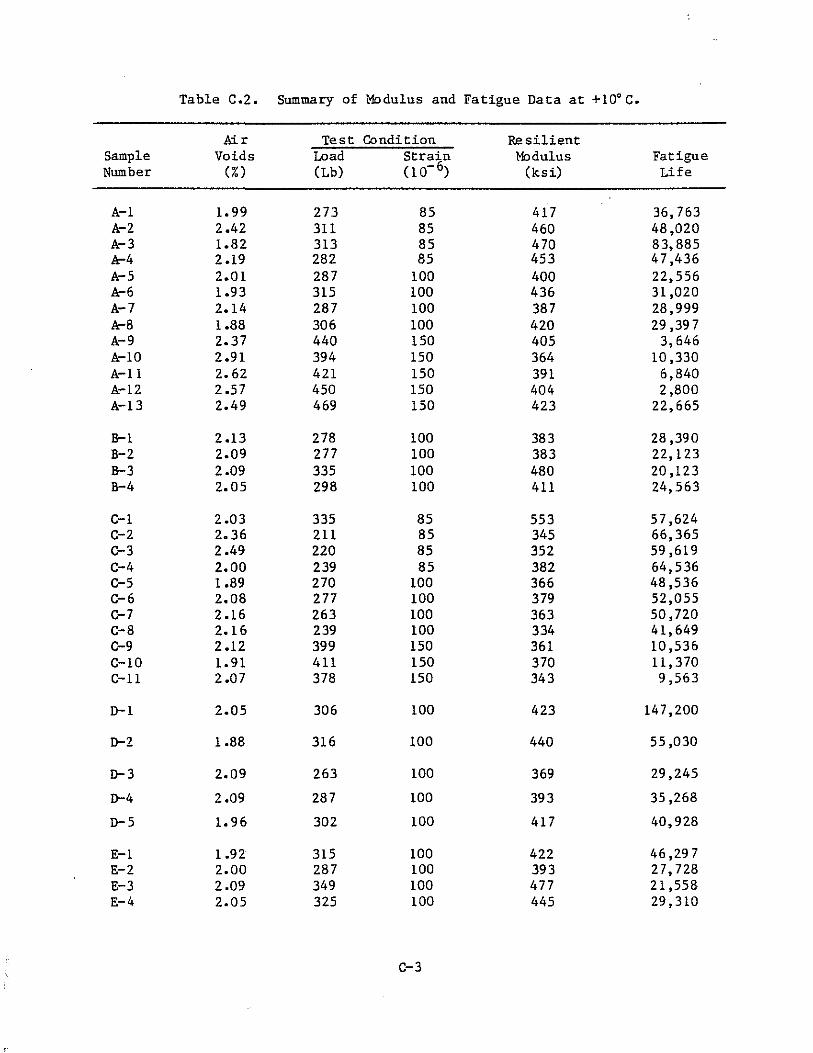
Table C.2. Summary of Modulus and Fatigue Data at +10· C.
Air Test Condition Resilient Sample Voids Load Strain Modulus Fatigue Number (%) (Lb) (l0-6) (ksi) Life
A-I 1.99 273 85 417 36,763 ~2 2.42 311 85 460 48,020 A-3 1.82 313 85 470 83,885 ~4 2.19 282 85 453 47,436 ~5 2.01 287 100 400 22,556 ~6 1.93 315 100 436 31,020 A-7 2.14 287 100 387 28,999 ~8 1.88 306 100 420 29,397 A-9 2.37 440 150 405 3,646 ~10 2.91 394 150 364 10,330 A-ll 2.62 421 150 391 6,840 A-12 2.57 450 150 404 2,800 A-13 2.49 469 150 423 22,665
B-1 2.13 278 100 383 28,390 B-2 2.09 277 100 383 22,123 B-3 2.09 335 100 480 20,123 B-4 2.05 298 100 411 24,563
C-1 2.03 335 85 553 57,624 C-2 2.36 211 85 345 66,365 C-3 2.49 220 85 352 59,619 C-4 2.00 239 85 382 64,536 C-5 1.89 270 100 366 48,536 C-6 2.08 277 100 379 52,055 C-7 2.16 263 100 363 50,720 C-8 2.16 239 100 334 41,649 C-9 2.12 399 150 361 10,536 C-10 1.91 411 150 370 11,370 C-ll 2.07 378 150 343 9,563
D-1 2.05 306 100 423 147,200
D-2 1.88 316 100 440 55,030
D-3 2.09 263 100 369 29,245
D-4 2.09 287 100 393 35,268
D-5 1.96 302 100 417 40,928
E-1 1.92 315 100 422 46,297 E-2 2.00 287 100 393 27,728 E-3 2.09 349 100 477 21,558 E-4 2.05 325 100 445 29,310
C-3
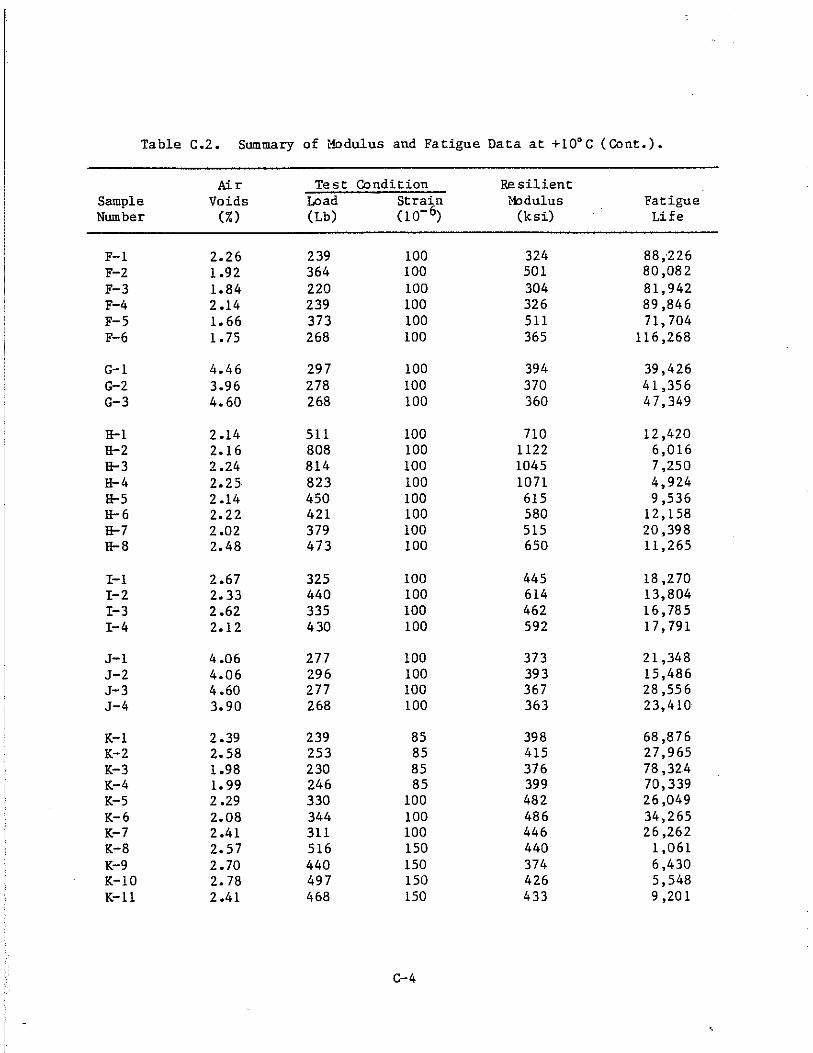
Table C.Z. Summary of Modulus and Fatigue Data at +10°C (Cont.).
Air Test Condition Resilient Sample Voids Load Strain Modulus Fatigue Number (%) (Lb) (10- 6) (ksi) Life
F-1 2.26 239 100 324 88,.226 F-2 1.92 364 100 501 80,082 F-3 1.84 220 100 304 81,942 F-4 2.14 239 100 326 89,846 F-5 1.66 373 100 511 71,704 F-6 1.75 268 100 365 116,268
G-1 4.46 297 100 394 39,426 G-2 3.96 278 100 370 41,356 G-3 4.60 268 100 360 47,349
&-1 2.14 511 100 710 12,420 &-2 2.16 808 100 1122 6,016 &-3 2.24 814 100 1045 7,250 &-4 2.25 823 100 1071 4,924 &-5 2.14 450 100 615 9,536 &-6 2.22 421 100 580 12,158 &-7 2.02 379 100 515 20,398 &-8 2.48 473 100 650 11,265
I-I 2.67 325 100 445 18,270 1-2 2.33 440 100 614 13,804 1-3 2.62 335 100 462 16,785 1-4 2.12 430 100 592 17,791
J-1 4.06 277 100 373 21,348 J-2 4.06 296 100 393 15,486 J-3 4.60 277 100 367 28,556 J-4 3.90 268 100 363 23,410
K-1 2.39 239 85 398 68,876 K-2 2.58 253 85 415 27,965 K-3 1.98 230 85 376 78,324 K-4 1.99 246 85 399 70,339 K-5 2.29 330 100 482 26,049 K-6 2.08 344 100 486 34,265 K-7 2.41 311 100 446 26,262 K-8 2.57 516 150 440 1,061 K-9 2.70 440 150 374 6,430 K-10 2.78 497 150 426 5,548 K-11 2.41 468 150 433 9,201
C-4
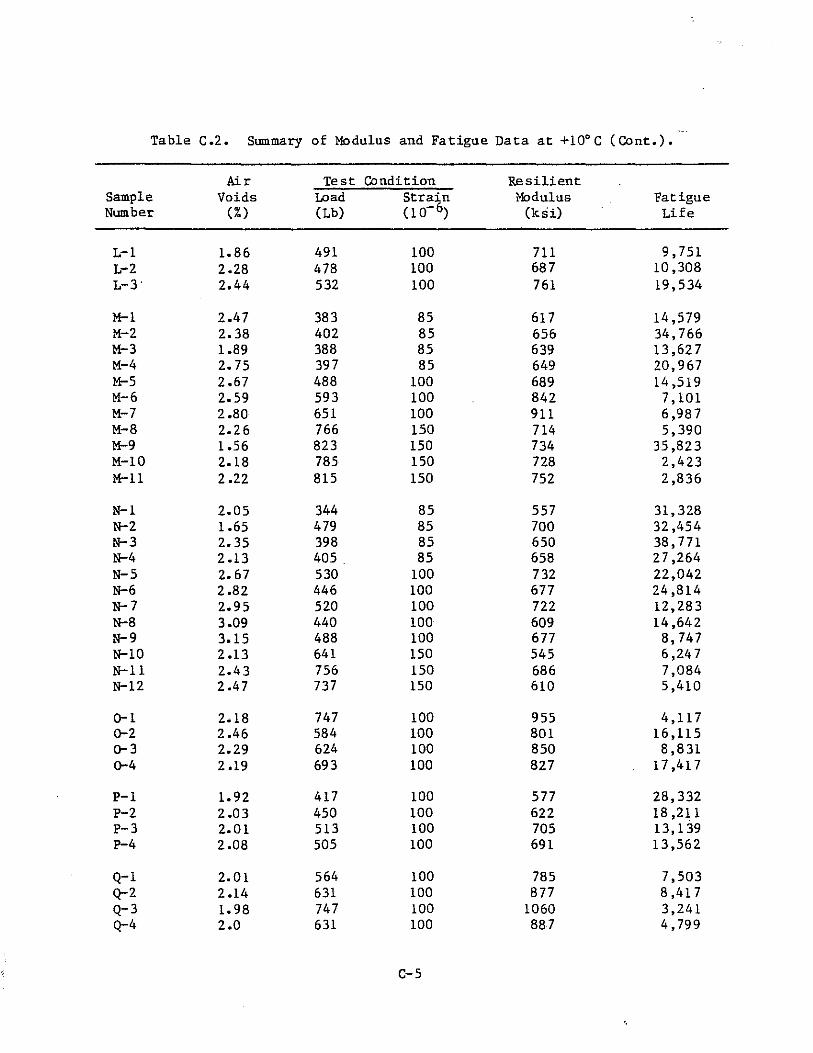
Table C.2. Summary of Modulus and Fatigue Data at +10°C (Cont.) •
Air Test Condition Resilient Sample Voids Load Strain Modulus Fatigue Number (%) (Lb) (10- 6) (ksi) Life
L-1 1.86 491 100 711 9,751 L-2 2.28 478 100 687 10,308 L-3' 2.44 532 100 761 19,534
M-l 2.47 383 85 617 14,579 M-2 2.38 402 85 656 34,766 M-3 1.89 388 85 639 13,627 M-4 2.75 397 85 649 20,967 M-5 2.67 488 100 689 14,519 M-6 2.59 593 100 842 7,101 M-7 2.80 651 100 911 6,987 M-8 2.26 766 150 714 5,390 M-9 1.56 823 150 734 35,823 M-l0 2.18 785 150 728 2,423 M-11 2.22 815 150 752 2,836
N-l 2.05 344 85 557 31,328 N-2 1.65 479 85 700 32,454 N-3 2.35 398 85 650 38,771 N-4 2.13 405, 85 658 27,264 N-5 2.67 530 100 732 22,042 N-6 2.82 446 100 677 24,814 N-7 2.95 520 100 722 12,283 N-8 3.09 440 100 609 14,642 N-9 3.15 488 100 677 8,747 N-l0 2.13 641 150 545 6,247 N-ll 2.43 756 150 686 7,084 N-12 2.47 737 150 610 5,410
0-1 2.18 747 100 955 4,117 0-2 2.46 584 100 801 16,115 0-3 2.29 624 100 850 8,831 0-4 2.19 693 100 827 17,417
P-l 1.92 417 100 577 28,332 P-2 2.03 450 100 622 18,211 P-3 2.01 513 100 705 13,139 p-4 2.08 505 100 691 13,562
Q-l 2.01 564 100 785 7,503 Q-2 2.14 631 100 877 8,417 Q-3 1.98 747 100 1060 3,241 Q-4 2.0 631 100 887 4,799
C-5
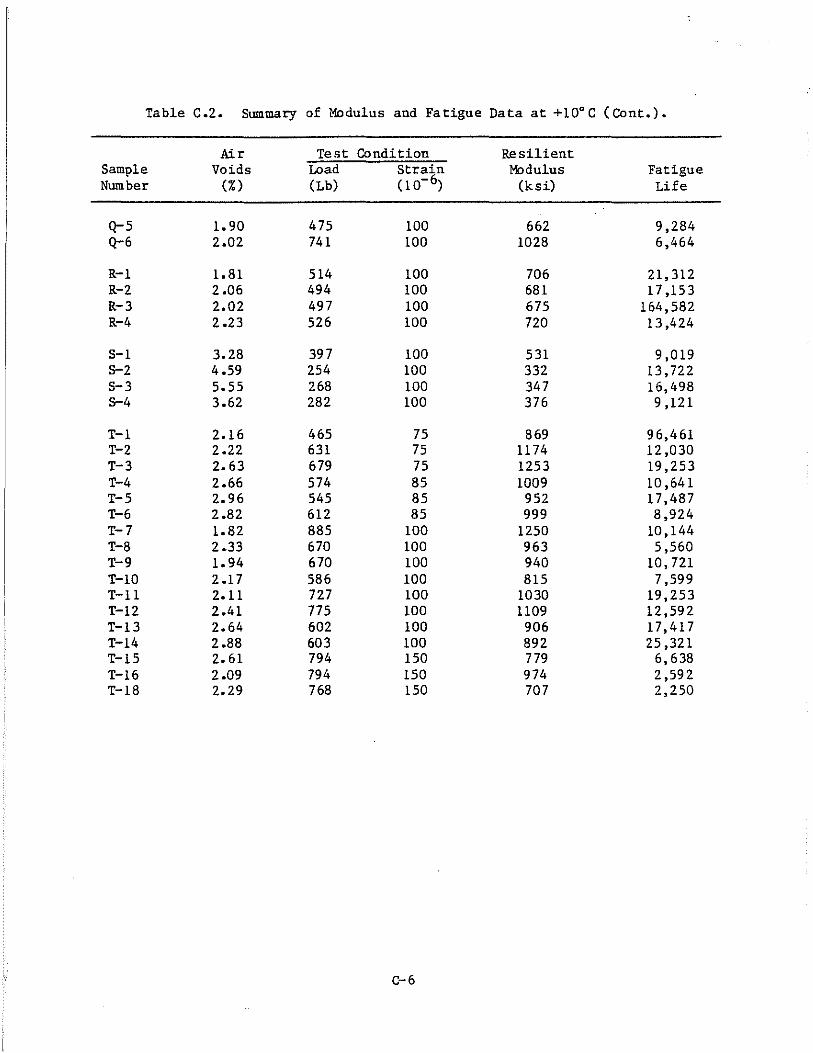
Table C.2. Summary of Modulus and Fatigue Data at +10°C (Cont.) •
Air Test Condition Resilient Sample Voids Load Strain Modulus Fatigue Number (%) (Lb) (10- 6) (ksi) Life
Q-5 1.90 475 100 662 9,284 Q-6 2.02 741 100 1028 6,464
R-1 1.81 514 100 706 21,312 R-2 2.06 494 100 681 17,153 R-3 2.02 497 100 675 164,582 R-4 2.23 526 100 720 13,424
S-l 3.28 397 100 531 9,019 8-2 4.59 254 100 332 13,722 S-3 5.55 268 100 347 16,498 8-4 3.62 282 100 376 9,121
T-l 2.16 465 75 869 96,461 T-2 2.22 631 75 1174 12,030 T-3 2.63 679 75 1253 19,253 T-4 2.66 574 85 1009 10,641 T-5 2.96 545 85 952 17,487 T-6 2.82 612 85 999 8,924 T-7 1.82 885 100 1250 10,144 T-8 2.33 670 100 963 5,560 T-9 1.94 670 100 940 10,721 T-I0 2.17 586 100 815 7,599 T-ll 2.11 727 100 1030 19,253 T-12 2.41 775 100 1109 12,592 T-13 2.64 602 100 906 17,417 T-14 2.88 603 100 892 25,321 T-15 2.61 794 150 779 6,638 T-16 2.09 794 150 974 2,592 T-18 2.29 768 150 707 2,250
C-6
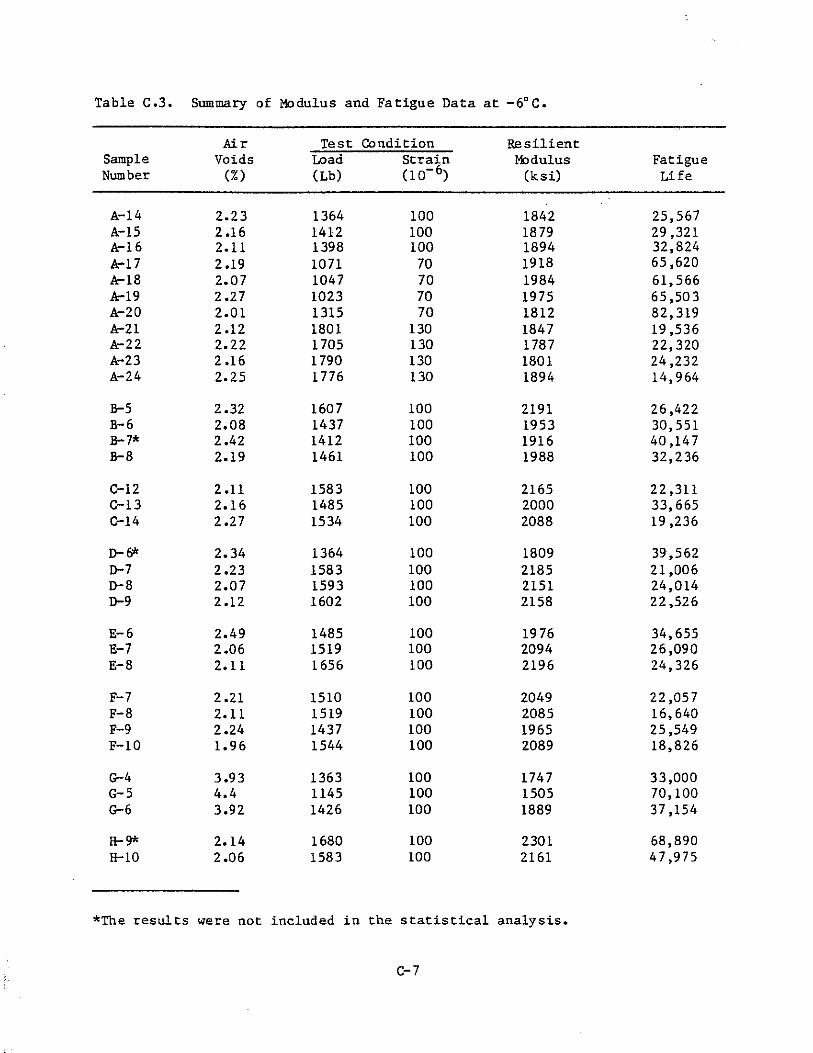
Table C.3. Summary of Modulus and Fatigue Data at -6a C.
Air Test Condition Resilient Sample Voids Load Strain Modulus Fatigue Number (%) (Lb) (10- 6) (ksi) Life
A-14 2.23 1364 100 1842 25,567 A-15 2.16 1412 100 1879 29,321 A-16 2.ll 1398 100 1894 32,824 A:-17 2.19 1071 70 1918 65,620 A:-18 2.07 1047 70 1984 61,566 A:-19 2.27 1023 70 1975 65,50 3 A-20 2.01 1315 70 1812 82,319 A:-21 2.12 1801 130 1847 19,536 A-22 2.22 1705 130 1787 22,320 A:-23 2.16 1790 130 1801 24,232 A-24 2.25 1776 130 1894 14,964
B-5 2.32 1607 100 2191 26,422 B-6 2.08 1437 100 1953 30,551 B-7* 2.42 1412 100 1916 40,147 B-8 2.19 1461 100 1988 32,236
C-12 2.ll 1583 100 2165 22,311 C-13 2.16 1485 100 2000 33,665 C-14 2.27 1534 100 2088 19,236
n-6* 2.34 1364 100 1809 39,562 n-7 2.23 1583 100 2185 21,006 n-8 2.07 1593 100 2151 24,014 n-9 2.12 1602 100 2158 22,526
E-6 2.49 1485 100 1976 34,655 E-7 2.06 1519 100 2094 26,090 E-8 2.ll 1656 100 2196 24,326
F-7 2.21 1510 100 2049 22,057 F-8 2.ll 1519 100 2085 16,640 F-9 2.24 1437 100 1965 25,549 F-I0 1.96 1544 100 2089 18,826
G-4 3.93 1363 100 1747 33,000 G-5 4.4 1145 100 1505 70,100 G-6 3.92 1426 100 1889 37,154
11-9* 2.14 1680 100 2301 68,890 B-I0 2.06 1583 100 2161 47,975
*The results were not included in the statistical analysis.
C-7
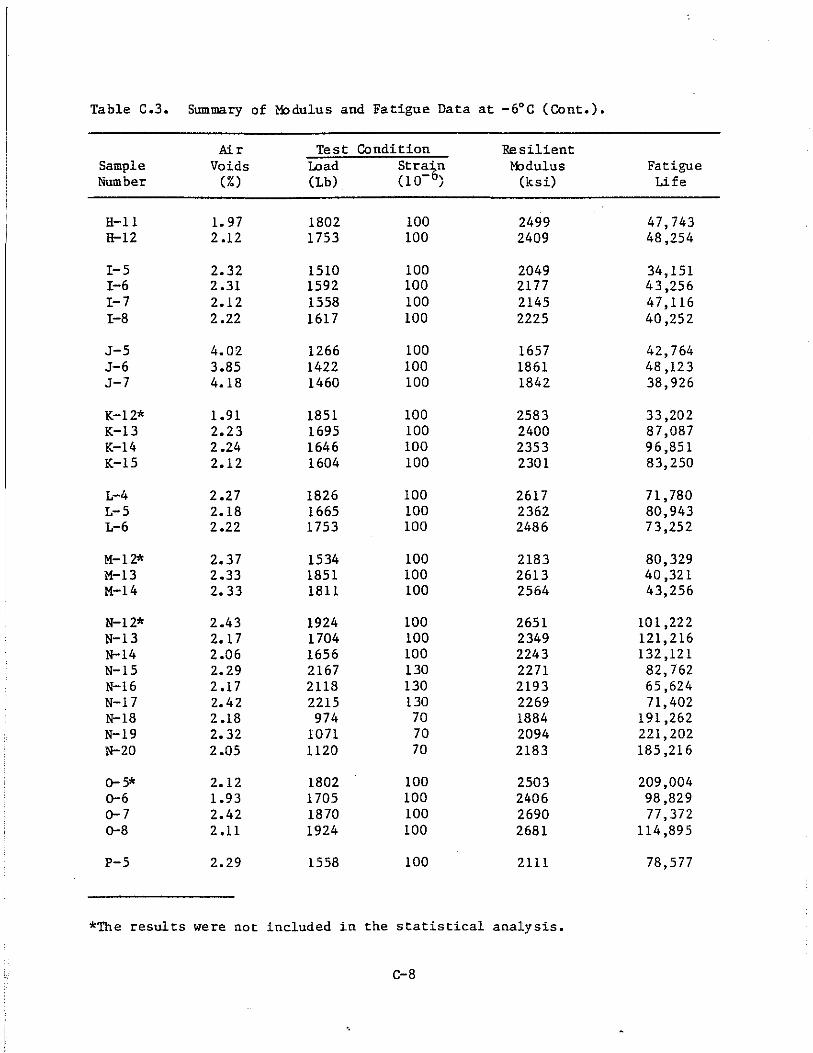
Table C.3. Summary of Modulus and Fatigue Data at -6°C (Cant.).
Air Test Condition Resilient Sample Voids wad Stra~n Modulus Fatigue Number (%) (Lb) (10- ) (ksi) Life
H-ll 1.97 1802 100 2499 47,743 ll-12 2.12 1753 100 2409 48,254
1-5 2.32 1510 100 2049 34,151 1-6 2.31 1592 100 2177 43,256 1-7 2.12 1558 100 2145 47,116 1-8 2.22 1617 100 2225 40,252
J-5 4.02 1266 100 1657 42,764 J-6 3.85 1422 100 1861 48,123 J-7 4.18 1460 100 1842 38,926
K-12* 1.91 1851 100 2583 33,202 K-13 2.23 1695 100 2400 87,087 K-14 2.24 1646 100 2353 96,851 K-15 2.12 1604 100 2301 83,250
L-4 2.27 1826 100 2617 71,780 L-5 2.18 1665 100 2362 80,943 L-6 2.22 1753 100 2486 73,252
M-l2* 2.37 1534 100 2183 80,329 M-13 2.33 1851 100 2613 40,321 M-14 2.33 1811 100 2564 43,256
N-12* 2.43 1924 100 2651 101,222 N-13 2.17 1704 100 2349 121,216 N-14 2.06 1656 100 2243 132,121 N-15 2.29 2167 130 2271 82,762 N-16 2.17 2118 130 2193 65,624 N-17 2.42 2215 130 2269 71,402 N-18 2.18 974 70 1884 191,262 N-19 2.32 1071 70 2094 221,202 N-20 2.05 1120 70 2183 185,216
0-5* 2.12 1802 100 2503 209,004 0-6 1.93 1705 100 2406 98,829 0-7 2.42 1870 100 2690 77,372 0-8 2.11 1924 100 2681 114,895
P-5 2.29 1558 100 2111 78,577
*The results were not included in the statistical analysis.
C-8
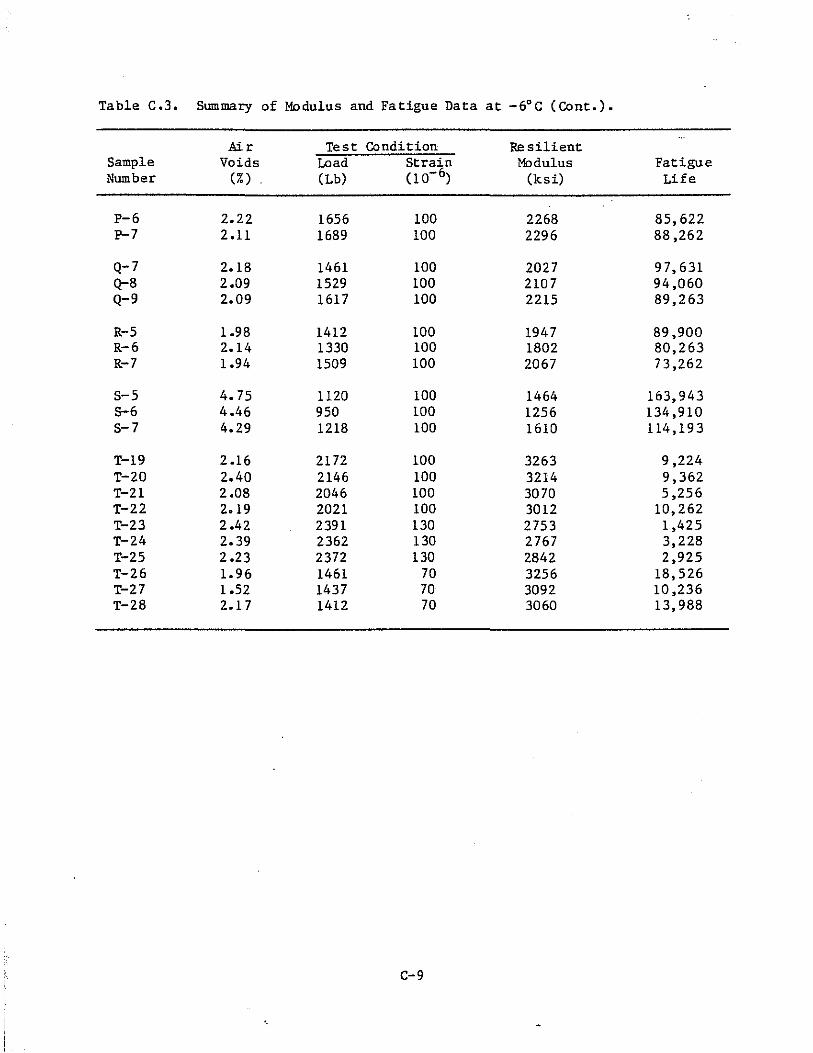
Table C.3. Summary of Modulus and Fatigue Data at -6°C (Cont.).
Air Test Condition Resilient Sample Voids Load Strain Modulus Fatigue Number (%) (Lb) (10- 6) (ksi) Life
P-6 2.22 1656 100 2268 85,622 P-7 2.11 1689 100 2296 88,262
Q-7 2.18 1461 100 2027 97,631 Q-8 2.09 1529 100 2107 94,060 Q-9 2.09 1617 100 2215 89,263
R-5 1.98 1412 100 1947 89,900 R-6 2.14 1330 100 1802 80,263 R-7 1.94 1509 100 2067 73,262
S-5 4.75 1120 100 1464 163,943 5-6 4.46 950 100 1256 134,910 S-7 4.29 1218 100 1610 114,193
T-19 2.16 2172 100 3263 9,224 T-20 2.40 2146 100 3214 9,362 T-21 2.08 2046 100 3070 5,256 T-22 2.19 2021 100 3012 10,262 T-23 2.42 2391 130 2753 1,425 T-24 2.39 2362 130 2767 3,228 T-25 2.23 2372 130 2842 2,925 T-26 1.96 1461 70 3256 18,526 T-27 1.52 1437 70 3092 10,236 T-28 2.17 1412 70 3060 13,988
C-9
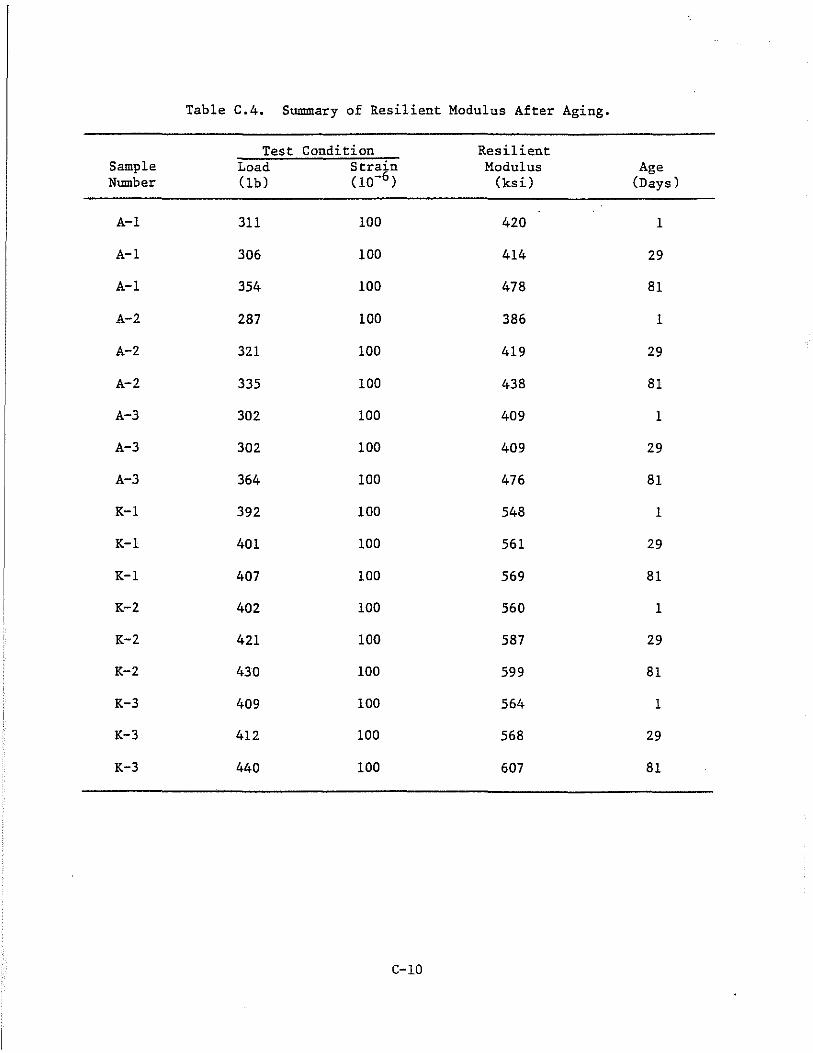
Table C.4. Summary of Resilient Modulus After Aging.
Test Condition Resilient Sample Load Strain Modulus Age Number (lb) (10-6 ) (ksi) (Days)
A-I 311 100 420 1
A-I 306 100 414 29
A-I 354 100 478 81
A-2 287 100 386 1
A-2 321 100 419 29
A-2 335 100 438 81
A-3 302 100 409 1
A-3 302 100 409 29
A-3 364 100 476 81
K-l 392 100 548 1
K-l 401 100 561 29
K-1 407 100 569 81
K-2 402 100 560 1
K-2 421 100 587 29
K-2 430 100 599 81
K-3 409 100 564 1
K-3 412 100 568 29
K-3 440 100 607 81
C-IO
APPENDIX D
PROGRAM FOR ECONOMICALLY DETERMINING THE MODIFIED PAVEMENT LIFE
VERSUS CONVENTIONAL PAVEMENT LIFE
D-l
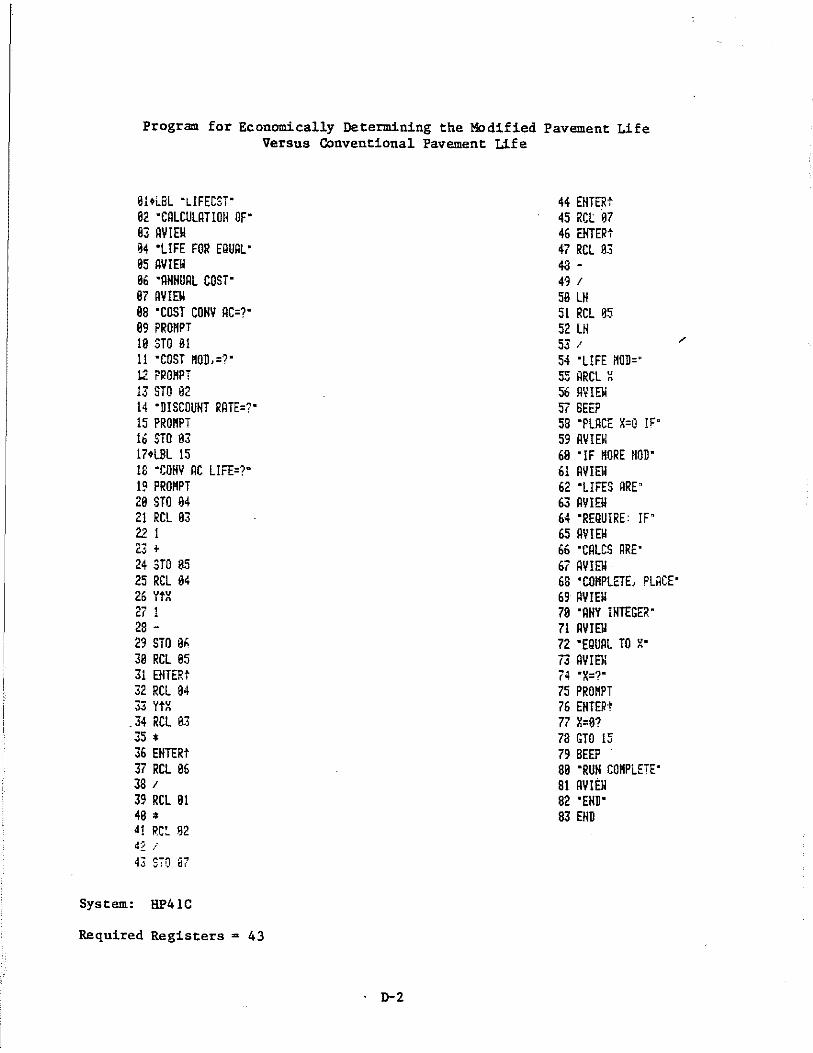
Program for Economically Determining the Modified Pavement Life Versus Conventional Pavement Life
81*LBL "LIFECST" 82 "CALCULRTIOll OF" 83 AYIEW 94 "LIFE FOR EQUAL" 85 AVIEW 86 "ANNUAL COSio 87 AYIEW 88 "COST CONY AC=?" 89 PROMPT 19 STO 8! II "COST MOD,=?" 12 ?~O"PT 13 STO 82 14 "DISCOUNT RATE=?" 15 PROMPT 16 STO 93 17*LBL 15 18 "COHY RC LIFE=?-19 PROMPT 29 STO 84 21 RCL 93 221 23 t
24 STO 05 25 RCL 84 26 VfX 27 1 28 -29 STO e" 38 RCL 85 31 EHTERt 32 RCL 84 33 'It X
.34 RCL 83 35 * 36 EHTERt 37 RCL 86 38 / 39 RCL 91 4B • 41 RC~ 92
43 870 a7
System: HP41C
Required Registers a 43
. D-2
44 ENTERt 45 RCl 87 46 EHTERt 47 RCL 93 48 -49 / 58 LN 51 RCL as 52 LN 53 / 54 "LIFE HOD=" 55 RRCL X 56 Rm. 57 BEEP 58 "PLRCE x=o !~" 59 AYIEW 68 "IF MORE HOD" 61 RYIEW 62 "LIFES RRE" 63 AYIEW 64 "REQUIRE: IF" 65 AYIEW 66 "CRLCS RRE" 67 RYIEW 68 "COMPLETE, PLACE" 69 RYIEW 78 "ANY INTEGE~" 71 AYIEW 72 "EQUAL TO x" 73 AYIEW 74 "X=?" 75 PROMPT 76 ENTER'; 77 X=9? 7a GTO 15 79 BEEP 89 "RUH COMPLETE" 8! AYIEW 82 "END" 83 END
"
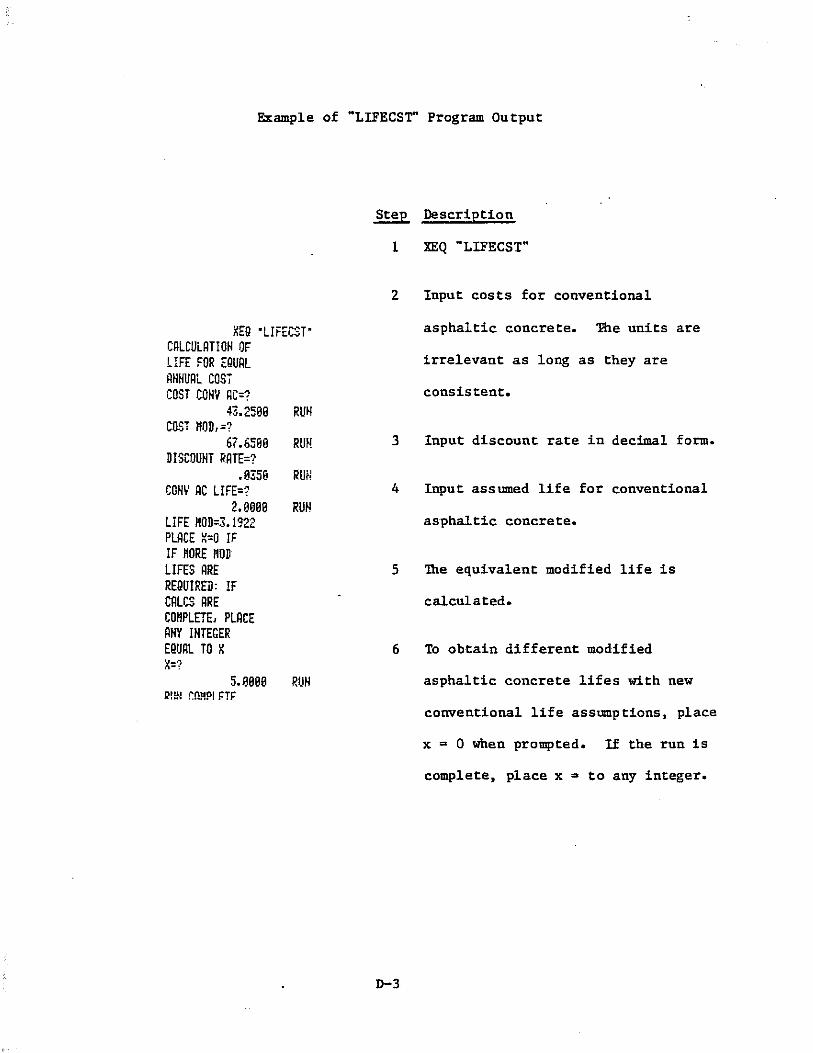
Example of "LIFECST" Program Output
XEQ -LIFECSrCALCULATION OF LIFE FOR EQURL ANNURL COSi COST CONY RG=?
43.2588 RU~ COST 110DI=?
67.6590 DISCOUNT RRTE=?
.8ZS0 CONI' RC LIFE=?
2.0099 LIFE "OD=3.1922 PLACE ~=O IF IF MORE MOD LIFES ARE REQUIRED: IF CALCS ARE COMPLETE, PLRCE RNY INTEGER EQURL TO X X=?
5.9999 P!!N ~nMPI FTF
RUH
RUt!
RUN
RUN
Step Description
1 XEQ "LIFECST"
2 Input costs for conventional
asphaltic concrete. 1he units are
irrelevant as long as they are
consis tent.
3 Input discount rate in decimal form.
4 Input assumed life for conventional
asphaltic concrete.
5 The equivalent modified life is
calculated.
6 To obtain different modified
asphaltic concrete lifes with new
conventional life assumptions, place
It = 0 when prompted. If the run is
complete, place It 2 to any integer.
D-3