effect of crumb rubber and warm mix additives on asphalt
TRANSCRIPT
Effect of Crumb Rubber and Warm Mix Additives on
Asphalt Aging, Rheological, and Failure Properties
by
PRASHANT AGRAWAL
A thesis submitted to the Department of Chemistry
In conformity with the requirements for
the degree of Master of Science
Queen’s University
Kingston, Ontario, Canada
(January, 2014)
Copyright ©Prashant Agrawal, 2014
Abstract
Asphalt-rubber mixtures have been shown to have useful properties with respect to distresses
observed in asphalt concrete pavements. The most notable change in properties is a large
increase in viscosity and improved low-temperature cracking resistance. Warm mix additives
can lower production and compaction temperatures. Lower temperatures reduce harmful
emissions and lower energy consumption, and thus provide environmental benefits and cut
costs.
In this study, the effects of crumb rubber modification on various asphalts such as
California Valley, Boscan, Alaska North Slope, Laguna and Cold Lake were also studied. The
materials used for warm mix modification were obtained from various commercial sources. The
RAF binder was produced by Imperial Oil in their Nanticoke, Ontario, refinery on Lake Erie. A
second commercial PG 52-34 (hereafter denoted as NER) was obtained/sampled during the
construction of a northern Ontario MTO contract.
Some regular tests such as Dynamic Shear Rheometer (DSR) and Bending Beam
Rheometer (BBR), Multiple Stress Creep Recovery (MSCR) and some modified new protocols
such as the extended BBR test (LS-308) and the Double-Edge Notched Tension (DENT) test (LS-
299) are used to study, the effect of warm mix and a host of other additives on rheological,
aging and failure properties.
A comparison in the properties of RAF and NER asphalts has also been made as RAF is
good quality asphalt and NER is bad quality asphalt.

From the studies the effect of additives on chemical and physical hardening tendencies was
found to be significant. The asphalt samples tested in this study showed a range of tendencies
for chemical and physical hardening.

Acknowledgements
I am thankful to my supervisor, Professor Simon Hesp, for providing me with the opportunity to
study at Queen's University and to work on this project.
I also thank my Supervisory Committee members Dr. Gary vanLoon and Dr. Donal Macartney
for helping me to successfully complete my degree requirements.
I hereby wish to thank Scott Ritchie, Ross McEwan, Kelli-Anne Johnson and Michaela Thomas
for their assistance with various parts of the data collection for this thesis.
I would also like to thank fellow graduate students Abioden Samuel and Paul Samy Senthil in
the Hesp Research Group and all faculty, staff and students of the Department of Chemistry.
I thank my friends Nausheen Sadiq, Danielle Macoretta, Fahim Imam, Hassan Nouri, Shadi
Khalifa, Dima Liashenko and Moahammed Sami Ismail for their love and moral support during
my studies.
Most importantly, I thank my parents, Mr. Kanhaiya Agrawal and Mrs. Usha Agrawal and for
their evergreen love, encouragement and support.
Table of Contents
Abstract ......................................................................................................................................................... ii
Acknowledgements ...................................................................................................................................... iv
Table of Contents .......................................................................................................................................... v
List of Figures ............................................................................................................................................... ix
List of Tables ............................................................................................................................................... xii
Abbreviations and Acronyms ......................................................................................................................xiii
CHAPTER 1 .................................................................................................................................................... 1
INTRODUCTION ............................................................................................................................................. 1
1.1 Asphalt Sources ................................................................................................................................... 1
1.1.1 Lake Asphalt ..................................................................................................................................... 1
1.1.2 Rock Asphalt ..................................................................................................................................... 1
1.1.3 Gilsonite ........................................................................................................................................... 2
1.1.4 Tar .................................................................................................................................................... 2
1.1.5 Refined Bitumen .............................................................................................................................. 2
1.2 Manufacture of Bitumen using Fractional Distillation of Crude Oil .................................................... 3
1.3 Constitution of Bitumen ...................................................................................................................... 3
1.3.1 Asphaltenes ...................................................................................................................................... 4
1.3.2 Resins ............................................................................................................................................... 4
1.3.3 Aromatics ......................................................................................................................................... 4
1.3.4 Saturates .......................................................................................................................................... 4
1.4 Structural Aspects of an Asphalt Pavement ........................................................................................ 5
1.4.1 Foundation ....................................................................................................................................... 5
1.4.2 Base .................................................................................................................................................. 5
1.4.3 Surfacing .......................................................................................................................................... 5
1.5 Asphalt Distress Types ........................................................................................................................ 6
1.5.1 Rutting .............................................................................................................................................. 6
1.5.2 Fatigue Cracking ............................................................................................................................... 7
1.5.3 Thermal Cracking ............................................................................................................................. 7
1.5.4 Moisture Damage (Stripping) ........................................................................................................... 8
1.6 Asphalt Modification ........................................................................................................................... 9
1.7 Rheology of Asphalt .......................................................................................................................... 10
1.7.1 Conventional testing of asphalt ..................................................................................................... 11
1.7.2 SuperpaveTM Testing ...................................................................................................................... 11
1.7.3 Ontario Ministry of Transportation (MTO) Test Standards ........................................................... 12
1.8 Scope and Objectives ........................................................................................................................ 12
CHAPTER 2 .................................................................................................................................................. 14
BACKGROUND ............................................................................................................................................. 14
2.1 Asphalt History .................................................................................................................................. 14
2.2 Impacts of Asphalt Paving and Production ....................................................................................... 14
2.2.1 Energy Use ..................................................................................................................................... 14
2.2.2 Emissions and Fumes ..................................................................................................................... 15
2.2.3 Human Health Impacts .................................................................................................................. 18
2.3 Strategies for Minimizing the Impacts of Asphalt Paving ................................................................. 18
2.3.1 Lower the Mix Temperatures ........................................................................................................ 18
2.3.1.1 Warm Mix Asphalt ...................................................................................................................... 19
2.3.1.2 Cold-mix Asphalt ......................................................................................................................... 21
2.3.2 Recycled Tire Aggregate ................................................................................................................. 22
2.4 Conventional Testing Methods ......................................................................................................... 23
2.4.1 Penetration Test............................................................................................................................. 24
2.4.2 Softening Point Test ....................................................................................................................... 26
2.4.3 Viscosity Test .................................................................................................................................. 28
2.5 Asphalt Cement Aging and Durability ............................................................................................... 29
2.6 Superpave® Specification Tests ........................................................................................................ 31
2.6.1 Laboratory Aging of Asphalt Cement ............................................................................................. 32
2.6.1.1 Rolling Thin Film Oven Test ......................................................................................................... 33
2.6.1.2 Pressure Aging Vessel ................................................................................................................. 34
2.6.2 Dynamic Shear Rheometer (DSR) Method .................................................................................... 35
2.6.3 Bending Beam Rheometer (BBR) Method ..................................................................................... 38
2.6.4 Multiple Stress Creep Recovery (MSCR) Test ................................................................................ 40
2.6.5 MSCR Test and Specification .......................................................................................................... 41
2.7 Improved Ministry of Transportation of Ontario (MTO) Test Methods ........................................... 43
2.7.1 Extended Bending Beam Rheometer (eBBR) Method LS-308 ....................................................... 44
2.7.2 Double-Edge Notched Tension (DENT) Test LS-299 ....................................................................... 44
2.7.3 Modified Pressure Aging Vessel Method LS-228 ........................................................................... 48
CHAPTER 3 .................................................................................................................................................. 49
MATERIALS AND EXPERIMENTAL PROCEDURES ......................................................................................... 49
3.1 Materials ........................................................................................................................................... 49
3.2 Preparation of Modified Asphalt Binders ......................................................................................... 52
3.2.1 Mixing............................................................................................................................................. 52
3.3 Asphalt Cement Aging ....................................................................................................................... 53
3.3.1 Rolling Thin Film Oven (RFTO) Test ................................................................................................ 53
3.3.2 Pressure Aging Vessel Test ............................................................................................................. 54
3.3.3 Modified Pressure Aging Vessel Method LS-228 ........................................................................... 55
3.4 Dynamic Shear Rheometer (DSR) Method........................................................................................ 55
3.4 Bending Beam Rheometer (BBR) Method ........................................................................................ 60
3.5 Extended Bending Beam Rheometer (eBBR) Method LS-308 .......................................................... 62
3.6 Double-Edge Notched Tension (DENT) Test LS-299 .......................................................................... 62
CHAPTER 4 .................................................................................................................................................. 65
RESULTS AND DISCUSSION.......................................................................................................................... 65
4.1 Dynamic Shear Analysis .................................................................................................................... 65
4.1.1 High Temperature Grading ............................................................................................................ 65
4.1.2 Intermediate Temperature Superpave® Grading .......................................................................... 68
4.1.3 Black Space Diagrams .................................................................................................................... 69
4.2 Regular BBR Analysis ......................................................................................................................... 76
4.2.1 Low Temperature Grades .............................................................................................................. 76
4.2.2 Grade Spans ................................................................................................................................... 78
4.2.3 Bending Beam Rheometer Grading of Modified PAV residue ....................................................... 79
4.2.4 Grade Loss ...................................................................................................................................... 80
4.3 Extended BBR Data Analysis ............................................................................................................. 81
4.3.1 LS- 308 Grades ............................................................................................................................... 81
4.3.2 LS-308 Grade Losses....................................................................................................................... 83
4.3.3 LS-308 Grade Spans ....................................................................................................................... 84
4.4 Double Edge Notched Tension (DENT) Testing ................................................................................. 85
4.4.1 Essential Works of Failure .............................................................................................................. 86
4.4.2 Approximate Critical Crack Tip Opening Displacements ............................................................... 88
4.4.3 Dent Results Using Extended PAV ................................................................................................. 89
4.5 MSCR Binder Specification ................................................................................................................ 91
CHAPTER 5 .............................................................................................................................................. 93
SUMMARY AND CONCLUSIONS .............................................................................................................. 93
References .................................................................................................................................................. 96
List of Figures
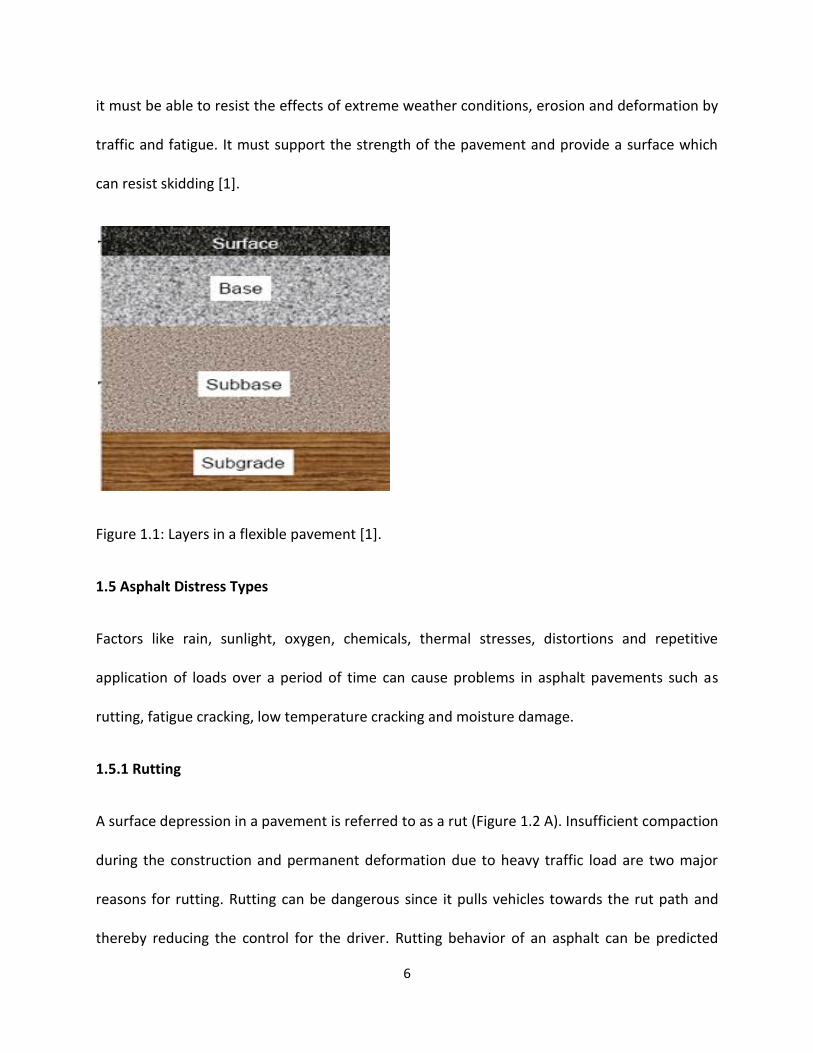
Figure 1.1: Layers in a flexible pavement [1]. ................................................................................. 6
Figure 1.2: (A) Severe rutting and (B) fatigue cracking. .................................................................. 7
Figure 1.3: (A) Thermal cracking and (B) moisture damage. .......................................................... 8
Figure 2.1 Two trucks preparing mix asphalt are side by side, left one containing typical hot-mix
asphalt and the right one containing warm mix. It is easily visible that emissions are greater
from the hot-mix truck compared to warm mix truck [14]. ......................................................... 21
Figure 2.3: Softening point test set up [25]. ................................................................................. 27
Figure 2.4: Brookfield viscometer and capillary viscometer [29, 30]. .......................................... 29
Figure 2.5: Aging of asphalt during mixing, storage, transportation, application and in service
[6]. ................................................................................................................................................. 31
Figure 2.6: Rolling Thin Film Oven (RTFO) [39]. ............................................................................ 33
Figure 2.7 Pressure Aging Vessel (PAV) [41]. ................................................................................ 35
Figure 2.8: Dynamic Shear Rheometer (DSR) [43]. ....................................................................... 36
Figure 2.10: Bending Beam Rheometer (BBR) [46]. ..................................................................... 38
Figure 2.11: BBR asphalt binder beam sample [46]...................................................................... 40
Figure 2.12: Example of modified asphalt binder response to repeated loading [47]. ................ 42
Figure 2.13: DENT test setup [52]. ................................................................................................ 45
Figure 2.14: DENT specimen showing the typical dimensions with process and plastic zones [54].
....................................................................................................................................................... 45
Figure 3.1: RTFO equipment [64]. ................................................................................................. 54
Figure 3.2 a) PAV pan (with a quarter for scale), b) pan holder with one PAV sample inserted, c)
PAV viewed from the top with the pan holder inserted [66]. ...................................................... 55
Figure 3.3 (A) DSR sample and (B) spindles [67]. .......................................................................... 58
Figure 3.4 (A) BBR mold and (B) test set up [46, 68]. ................................................................... 61
Figure 3.5 DENT sample preparation [5]. ..................................................................................... 63
Figure 4.1 High temperature grades for rubber modified samples compared with their
respective unmodified samples. ................................................................................................... 66
Figure 4.2 High temperature grades for RAF compared to RAF with warm mix additives. ......... 66
Figure 4.3 High temperature grades for NER compared to NER with warm mix additives. ........ 67
Figure 4.4 Intermediate temperature grades for all tested samples. .......................................... 69
Figure 4.5 Black space diagram for Unaged, RTFO-aged and PAV-aged unmodified AAG sample
AAG sample. .................................................................................................................................. 71
Figure 4.6 Black space diagrams for unaged, RTFO-aged and PAV-aged tested binders. ............ 75
Figure 4.7 Low temperature grades using regular BBR for all the tested samples. ..................... 77
Figure 4.8 Grade spans for all the tested samples. ...................................................................... 78
Figure 4.10 Grade losses due to PAV (50 g @ 40 hr) and PAV (50 g @ 20 hr) treatment for all
binders and their compositions. ................................................................................................... 81
Figure 4.11 LS-308 grades for all the tested samples. .................................................................. 82
Figure 4.12 LS-308 grade losses for all the tested samples. ......................................................... 84
Figure 4.13 LS-308 grade spans for all the tested samples. ......................................................... 84
Figure 4.14 Raw force-displacement traces for duplicate DENT tests on NER sample modified
with additive A at 50 mm/min and 15°C. ..................................................................................... 86

Figure 4.15 Determination of the essential work of failure for NER sample modified with
additive A at 50 mm/min and 15°C. .............................................................................................. 86
Figure 4.16 Essential works of failure (we) for all binders and their compositions. ..................... 87
Figure 4.17 CTOD (mm) investigations for all binders and their compositions............................ 88

List of Tables
Table 2.1 Energy and Carbon Comparison of One Cubic Meter of Asphalt Concrete and Portland
Cement Concrete Pavement Mixes [13] ........................................................................... 15
Table 2.2 Emissions from Typical HMA Facilities [15]. ..................................................... 17
Table 3.1 Base Asphalt Cements Used in the Study ......................................................... 50
Table 3.2 Warm Mix Additives Used in the Study ............................................................ 50
Table 3.3 Modified Binders ............................................................................................... 51
Table 3.4 PAV Test Temperatures [65] ............................................................................. 54
Table 3.5: DSR Test Parameters [55] ................................................................................ 57
Table 3.6: DSR Test Geometry .......................................................................................... 57
Table 3.7: Performance Graded Asphalt Binder DSR ........................................................ 59
Table 4.1 Dent Results Using Extended PAV ..................................................................... 90
Table 4.2: MSCR Grades for RAF and NER Samples with Different Warm Mix Additives 92
Abbreviations and Acronyms
AASHTO American Association of State and Highway Transportation
Officials
AC Asphalt Cement
ASTM American Society for Testing and Materials
BBR Bending Beam Rheometer
CTOD Crack Tip Opening Displacement, m
DENT Double-Edge-Notched Tension
DSR Dynamic Shear Rheometer
eBBR Extended Bending Beam Rheometer
EWF Essential Work of Fracture
HMA Hot Mix Asphalt
LS Laboratory Standard Test Method
LTPPBind® Long Term Pavement Performance Binder Selection Software
m(t) Slope of the Creep Stiffness Master Curve (m-value)
S(t) Time-dependent Flexural Creep Stiffness, MPa
MPa Mega Pascal ( Pa)
MTO Ministry of Transportation of Ontario
NSERC Natural Sciences and Engineering Research Council of Canada
PG (PGAC) Performance Grade (Performance Graded Asphalt Cement)
PMA Polymer Modified Asphalt

PPA Polyphosphoric acid
SBR Styrene-Butadiene-Rubber
SBS Styrene-Butadiene-Styrene
SHRP Strategic Highway Research Program
TFOT Thin Film Oven Test
PAV Pressure Aging Vessel
PI Penetration Index
RTFO Rolling Thin Film Oven
SUPERPAVETM SUperior PERforming Asphalt PAVEment
WEO Waste Engine Oil
3D Three-Dimensional
ESAL Equivalent Single Axle Loads
MSCR Multiple Stress Creep Recovery
VOC Volatile Organic Compound
CAP Criteria Air Pollutants
HAP Hazardous Air Pollutants
Symbols
A Temperature susceptibility parameter (Penetration test)
a Length of a sharp crack, m
b Beam width, 12.5mm
B Specimen Thickness, m
G* Complex shear modulus, Pa
G’ Storage modulus, Pa
G” Loss modulus, Pa
h Beam thickness, 6.25 mm
K Stress intensity factor, N
L Ligament length, m
L Distance between beam supports, 102 mm (BBR)
N Number of load repetitions
P Load applied, N (BBR)
t Loading time, s
T Temperature, K
We Essential fracture energy, J

we Specific essential work of fracture, J.m-2
Wp Plastic or non essential work of fracture, J
wp Specific plastic work of fracture, J.m-2
Wt Total energy, J
wt Specific total work of fracture, J.m-2
β Plastic zone shape factor
δ Phase angle, °C
τ Shear stress, Pa
γ Shear strain
δt CTOD, mm
σn Net section stress or yield stress, N/m2
1
CHAPTER 1
INTRODUCTION
1.1 Asphalt Sources
1.1.1 Lake Asphalt
Lake asphalt is found in well-defined surface deposits located in Trinidad, Venezuela, Iraq,
Southern California and a few other locations. Asphalt deposits on the lake in southern Trinidad
are one of the largest in the world. The lake consists of about 10 million tonnes of material with
an area of 35 hectares [1]. Refining of this material is done by heating it at 160°C which
evaporates the water and then molten material is passed through fine screens to remove
coarse, foreign and vegetable matter. This residue is called ‘refined TLA’ and has a penetration
of about 2 dmm and a softening point of about 95°C [1].
1.1.2 Rock Asphalt
Rock asphalt or natural asphalt is bitumen impregnated rock. Rock asphalt is formed when
bitumen, which is formed by the same concentration processes as occur during refining of oil, is
trapped in impervious rock formations.
Most sites for rock asphalt in Europe were found at Seyssel in France, Ragusa in Italy and
Val de Travers in Switzerland [1]. Composition of these natural asphalts is limestone
impregnated with bitumen at concentrations of up to 12%. In the twentieth century, vast
2
bituminous sandstone and schist deposits were mined in Utah and Kentucky. For example the
Sunnyside sandstone deposit in Utah contains approximately 800 million tonnes of rock asphalt
with a bitumen concentration in the range of 8 to 13 %. Rock asphalt was used in the
construction of the very first waterproof asphaltic material surfaced roads in Paris in 1854 and
in New York City in 1872 [1].
1.1.3 Gilsonite
This very hard material having penetration of zero with a softening point between 115 and
190°C was first found by Samuel H. Gilson in 1880 in Utah. Due to the expense of the mining
process, this material is not widely used for paving but it is used for roofing and other general
waterproofing materials to alter the stiffness and softening point of the asphalt [1].
1.1.4 Tar
When coal or wood, which are natural organic materials, are carbonized in the absence of air,
they produce a liquid called ‘Tar’ or ‘Coal Tar’ [2]. In the mid 1960s almost half of the annual
production of coal tar was produced as a by-product of the operation of carbonization ovens
and the total annual production was over 2 million tons.
1.1.5 Refined Bitumen
Bitumen is manufactured from crude oil. It is a general belief that crude oil comes from the
conversion of the remains of marine organisms and vegetable matter which has been deposited
on the ocean bed with rock fragments over millions of years. It is believed that the application
of heat from within the earth’s crust, pressure applied by the upper layers of sediments, the
3
effects of bacterial action and radioactive bombardment results in the conversion of organisms
into hydrocarbons to gradually form crude oil [1].
There are about 1500 different crude oil producing locations around the world but the
main ones are in the United States, in countries of the Middle East, in Russia and some
Caribbean nations. Depending on quality of resultant product only a few of the 1500 producers
are suitable for bitumen production [1].
1.2 Manufacture of Bitumen using Fractional Distillation of Crude Oil
Long residue is a complex mixture of high molecular weight hydrocarbons and it is the heaviest
fraction taken from the crude oil distillation process. It requires further processing before it can
be used as a feedstock for bitumen manufacture. Distillation of long residue is done at reduced
pressure in a vacuum distillation column. The conditions used were a vacuum of 10 to 100 mm
Hg at a temperature between 350 and 425°C which produces gas oil, distillates, and short
residue. Finally short residue is the feedstock used in the manufacture of over 20 different
grades of bitumen [1].
1.3 Constitution of Bitumen
Bitumen basically constitutes of a mixture of mostly hydrocarbons with a small amount of
structurally analogous heterocyclic species with functional groups as sulphur, oxygen and
nitrogen atoms [3]. Bitumens can be separated into four groups named asphaltenes, resins, and
aromatics and saturates.
4
1.3.1 Asphaltenes
These contain some nitrogen, sulphur and oxygen in addition to carbon and hydrogen. They are
insoluble in n-heptane and are highly polar possessing complex aromatic materials of high
molecular weight. Molecular weight of asphaltenes ranges from 1000 to 100,000 g/mol. The
amount of asphaltenes can change rheological properties of bitumen. Harder and more viscous
bitumen can be produced by increasing the asphaltene content [1].
1.3.2 Resins
They are soluble in n-heptane. They are polar in nature and like asphaltenes are composed of
hydrogen, carbon and a small amount of oxygen, sulphur and nitrogen. Resins have a molecular
weight ranging from 500 to 50,000 g/mol. They work as peptisers for asphaltenes and their
ratio to asphaltenes in bitumen governs the sol-gel behavior of bitumen [1].
1.3.3 Aromatics
They are naphthenic aromatic compounds with average molecular weight in the range from
300 to 2,000 g/mol. They provide a dispersion medium for peptized asphaltenes [1].
1.3.4 Saturates
This fraction forms 5 to 20% of the bitumen. These are non - polar in nature and their average
molecular weight is similar to that of aromatics. Their chemical composition contains straight
and branched chain aliphatic hydrocarbons with alkyl naphthenes and alkyl aromatics [1].
5
1.4 Structural Aspects of an Asphalt Pavement
1.4.1 Foundation
A combination of the sub-grade and sub-base form the foundation for a pavement, see figure
1.1. After its formation more expensive layers can be formed over it. A foundation basically
transmits stresses generated by traffic loading to the sub-grade without causing any distress to
it [1].
1.4.2 Base
The base is usually a dense asphalt material. This is a very important part of the structure of a
pavement. The base evenly distributes the load imposed by the vehicles such that the
underlying materials do not suffer damage due to overloading. A good base must be able to
resist permanent deformation, fatigue cracking, and withstand stresses caused by temperature
gradients (Figure 1.1) [1].
1.4.3 Surfacing
The road surface is usually made up of several layers. The upper layer is usually called ‘surface
course’ or ‘wearing course’ and the lower layer called ‘binder course’ (Figure 1.1). The surface
course is visible to the road user while the binder course is not. The main function of the binder
course is simply to distribute the stresses from the surface course to the base without
overstressing. The surface course has a number of additional responsibilities such as:
6
it must be able to resist the effects of extreme weather conditions, erosion and deformation by
traffic and fatigue. It must support the strength of the pavement and provide a surface which
can resist skidding [1].
Figure 1.1: Layers in a flexible pavement [1].
1.5 Asphalt Distress Types
Factors like rain, sunlight, oxygen, chemicals, thermal stresses, distortions and repetitive
application of loads over a period of time can cause problems in asphalt pavements such as
rutting, fatigue cracking, low temperature cracking and moisture damage.
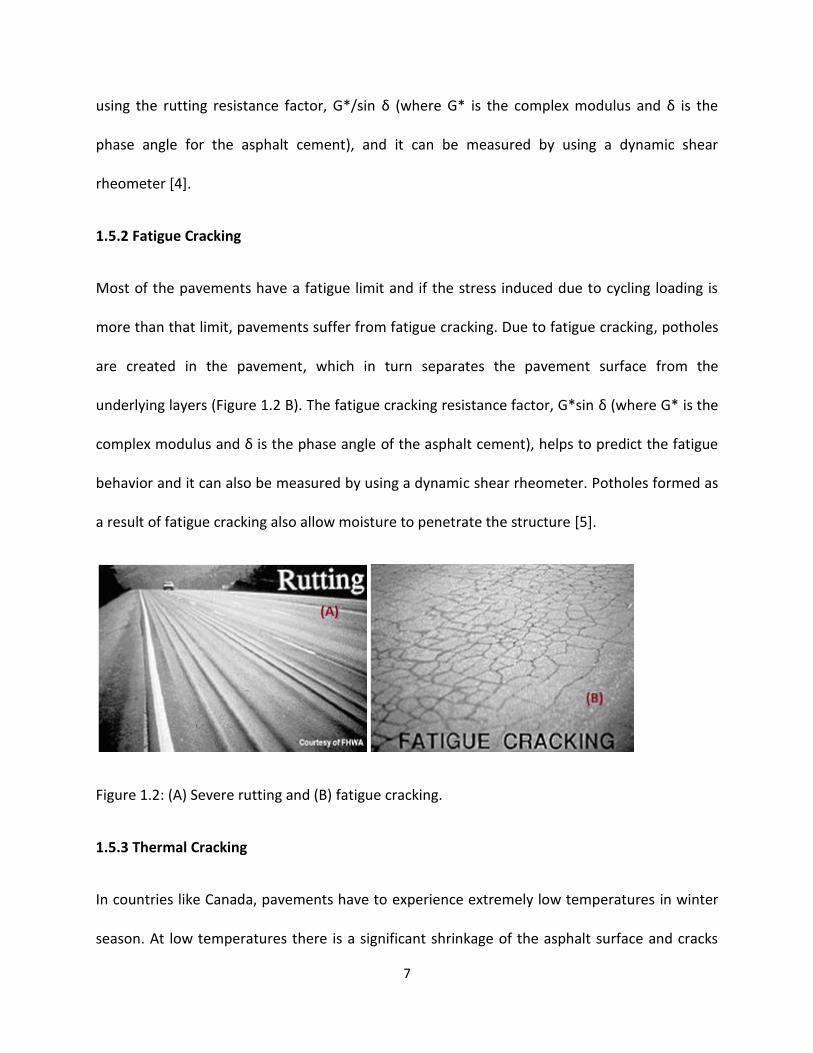
1.5.1 Rutting
A surface depression in a pavement is referred to as a rut (Figure 1.2 A). Insufficient compaction
during the construction and permanent deformation due to heavy traffic load are two major
reasons for rutting. Rutting can be dangerous since it pulls vehicles towards the rut path and
thereby reducing the control for the driver. Rutting behavior of an asphalt can be predicted
7
using the rutting resistance factor, G*/sin δ (where G* is the complex modulus and δ is the
phase angle for the asphalt cement), and it can be measured by using a dynamic shear
rheometer [4].
1.5.2 Fatigue Cracking
Most of the pavements have a fatigue limit and if the stress induced due to cycling loading is
more than that limit, pavements suffer from fatigue cracking. Due to fatigue cracking, potholes
are created in the pavement, which in turn separates the pavement surface from the
underlying layers (Figure 1.2 B). The fatigue cracking resistance factor, G*sin δ (where G* is the
complex modulus and δ is the phase angle of the asphalt cement), helps to predict the fatigue
behavior and it can also be measured by using a dynamic shear rheometer. Potholes formed as
a result of fatigue cracking also allow moisture to penetrate the structure [5].
Figure 1.2: (A) Severe rutting and (B) fatigue cracking.
1.5.3 Thermal Cracking
In countries like Canada, pavements have to experience extremely low temperatures in winter
season. At low temperatures there is a significant shrinkage of the asphalt surface and cracks

8
are formed in the pavement (Figure 1.3 A). This type of cracking is observed perpendicular to
the pavement’s centerline or lay down direction. Initially when stress build-up is above the
strength of the mix, single-event cracking occurs at a temperature below the temperature limit.
Secondly, thermal fatigue cracking happens, which is a result of the loss of strength of asphalt
mix which is a result of repeated thermal stresses below the temperature limit [4, 6].
1.5.4 Moisture Damage (Stripping)
The stripping of asphalt pavements is a result of a decrease in adhesion of the asphalt cement
to the aggregates as primarily caused by moisture. Basically cracks and ruts formed by fatigue
cracking and rutting facilitates enough space for moisture to enter the structure of the
pavement (Figure 1.3 B). As moisture disrupts the chemistry between the aggregate and the
binder in the surface course, this eventually damages the base structure. Poor drainage can also
be a cause of stripping. Anti-stripping agents, proper drainage, and proper compaction can
avoid moisture damage [7].
Figure 1.3: (A) Thermal cracking and (B) moisture damage.
9
1.6 Asphalt Modification
Modification of asphalt to improve the overall performance of pavements has been the
focus of numerous researchers over the past few decades. Use of waste tires from vehicles in
pavement construction was one of the steps taken in this direction as disposal of waste tires is
a serious environmental concern in many countries. Crumb rubber, which is the recycled rubber
obtained by mechanical shearing or grinding of tires into small particles is used to modify
asphalt [8]. Asphalt-rubber mixtures have been shown to have useful properties with respect to
distresses observed in asphalt concrete pavements. The most notable change in properties is a
large increase in viscosity and improved low-temperature cracking resistance [9].
To use conventional rubberized asphalt cement (RAC) increased mixing and compaction
temperatures are required which in turn raise emissions of harmful fumes and also increase
energy costs. Hence, it is important that this technology is also used together with warm mix
additives for long-term viability of RAC in Ontario and elsewhere in Canada [10].
Warm mix additives are based on waxes and/or surfactants and other proprietary
modifiers. The main use of WMA is to lower production and compaction temperatures. Lower
temperatures reduce harmful emissions and lower energy consumption, and thus provide
environmental benefits and cut costs. Warm mix additives can also facilitate longer haul
distances which will improve production and shorten the construction period, thus reducing the
delays associated with traffic congestion. Reduction of compaction temperatures using
chemical WMA can be explained using various mechanisms.
10
Additives which are based on surfactants are designed to lower the surface tension of
the asphalt binder and hence facilitate the stabilization of entrapped air bubbles. Now as
entrapped air is stabilized, viscosity of the binder is significantly reduced. In addition to the
stabilization of air bubbles, surfactant type systems are believed to aid in the wetting of the
aggregate at lower temperatures, which may help to prevent moisture damage. Hence, based
on the type of aggregate used, exact type of surfactant can be modeled [11].
With the use of wax-based additives the viscosity of the binder above the melting point
of the wax is lowered. In addition, there are no deleterious effects on rutting at lower
temperatures because wax solidifies when cooled. It is very likely that there are other unknown
mechanisms for compaction temperature lowering as actual decreases in the measured
viscosity are rather modest compared to the impressive reductions in compaction
temperatures that are reported for such technologies. As during compaction very high shear
force is used, it is most likely that waxes introduce a significant degree of shear thinning in
asphalt by lowering its viscosity. These mechanisms allow for reductions in paving
temperatures by anywhere from 10°C to 50°C [11].
1.7 Rheology of Asphalt
Bitumen deforms when subjected to loads and the properties of bitumen change with change
of temperatures during day and night. It has been well established that the rheological
properties of the bitumen binder affect the asphalt pavement performance. Rheology is the
characterization of the mechanical properties for different materials under various deformation
conditions. Rheological properties can be used as indicator for the pavement performance. At
11
high temperature the rheological properties are related to the rutting performance of
pavements. The rheology at intermediate temperatures relates to the fatigue cracking of
pavements. The low temperature properties of the binder are related to the low-temperature
thermal cracking of the pavement. Reduced rutting, improved fatigue life, and lower low-
temperature stiffness values have been measured in asphalt mixtures made with binders with
improved rheological properties. The properties of asphalt binder play an important role in
asphalt concrete pavement performance. There are many asphalt pavement distresses, which
are believed to be related to the rheological properties of asphalt binder.
1.7.1 Conventional testing of asphalt
Usually asphalts are classified in different asphalt grades, and to find grades of different
asphalts conventional testing is done. Penetration grade, oxidized grade, hard grade, and
cutback grade, are different grades of asphalts used under conventional specifications.
Penetration test at 25°C, softening point test, and viscosity tests, like dynamic viscosity test at
60°C, kinematic viscosity test at 135°C, specific gravity test, storage stability test, ductility test,
force-ductility test and elastic recovery test fall under conventional tests.
1.7.2 SuperpaveTM Testing
SuperpaveTM testing methods were developed in 1987 by the Strategic Highway Research
Program (SHRP) in the USA. These methods were supposed to allow for the construction of
SUperior PERforming PAVEments. Based on their performance with simulated aging and
physical properties determinations, this method helped to classify grades of asphalts. It

12
involved aging asphalt samples using RTFO and PAV followed by measuring their properties
using the DSR and BBR [1].
1.7.3 Ontario Ministry of Transportation (MTO) Test Standards
While the basic foundation of the American Association of State and Highway Transportation
Officials (AASHTO) M320 specification for thermal cracking is sound, it has been recognized for
some time that several aspects need improvement.
Hence the collaboration work of the Ontario Ministry of Transportation with Queen’s University
has developed the following set of new and improved test methods:
1. Extended Bending Beam Rheometer (eBBR) test (LS-308);
2. Double-Edge-Notched Tension (DENT) test (LS-299); and
3. Modified Pressure Aging Vessel protocols (LS 228).
1.8 Scope and Objectives
Asphalt pavement contractors have been looking for ways to reduce the energy consumption,
making compaction easier and getting rid of the problems like rutting, fatigue cracking, thermal
cracking and damage by moisture associated with asphalt for a while now. These issues
motivated asphalt manufactures to develop warm mix asphalt technology which involves the
use of chemical additives in the asphalt cement [12].
In this study, the effects of crumb rubber modification on various asphalts such as
California Valley, Boscan, Alaska North Slope, Laguna and Cold Lake are studied. Asphalt-rubber
13
mixtures have been shown to have useful properties with respect to distresses observed in
asphalt concrete pavements. The most notable change in properties is a large increase in
viscosity and improved low-temperature cracking resistance.
The materials used for warm mix modification were obtained from various commercial
sources. The RAF binder was produced by Imperial Oil in their Nanticoke, Ontario, refinery on
Lake Erie. A second commercial PG 52-34 (hereafter denoted as NER) was obtained/sampled
during the construction of a northern Ontario MTO contract. By lowering the high shear
viscosity during compaction, by providing lubrication, and by stabilization of limited amounts of
air bubbles in the hot asphalt cement, warm mix additives have been able to reduce the
compaction temperature of the pavements by as much as 30°C to 50°C. Usually these additives
are based on waxes and surfactants. They can improve pavements phase stability, make them
durable by reducing hardening, and at the same time fit in the Superpave™ specification.
A comparison in the properties of RAF and NER asphalts has also been made as RAF is
good quality asphalt and NER is bad quality asphalt.
In this study, the effect of warm mix and a host of other additives on rheological, aging
and failure properties are investigated. The properties of samples are measured by regular tests
such as DSR and BBR and by modified new protocols such as the extended BBR test (LS-308)
and the DENT test (LS-299).
14
CHAPTER 2
BACKGROUND
2.1 Asphalt History
As explained in the Oxford English Reference Dictionary, bitumen is a ”tar like mixture of
hydrocarbons derived from petroleum naturally or by distillation, and used for road surfacing
and roofing”. The term ‘bitumen’ is believed to be originated from Sanskrit, a sacred language
of Hindus, in which ‘jatu’ means pitch and ‘jatu-krit’ means pitch creating [1].
2.2 Impacts of Asphalt Paving and Production
2.2.1 Energy Use
Hot-mix asphalt (HMA) is usually prepared by heating aggregate and asphalt at temperatures
ranging from 120°C to 180°C for mixing and they are supposed to be kept at same temperatures
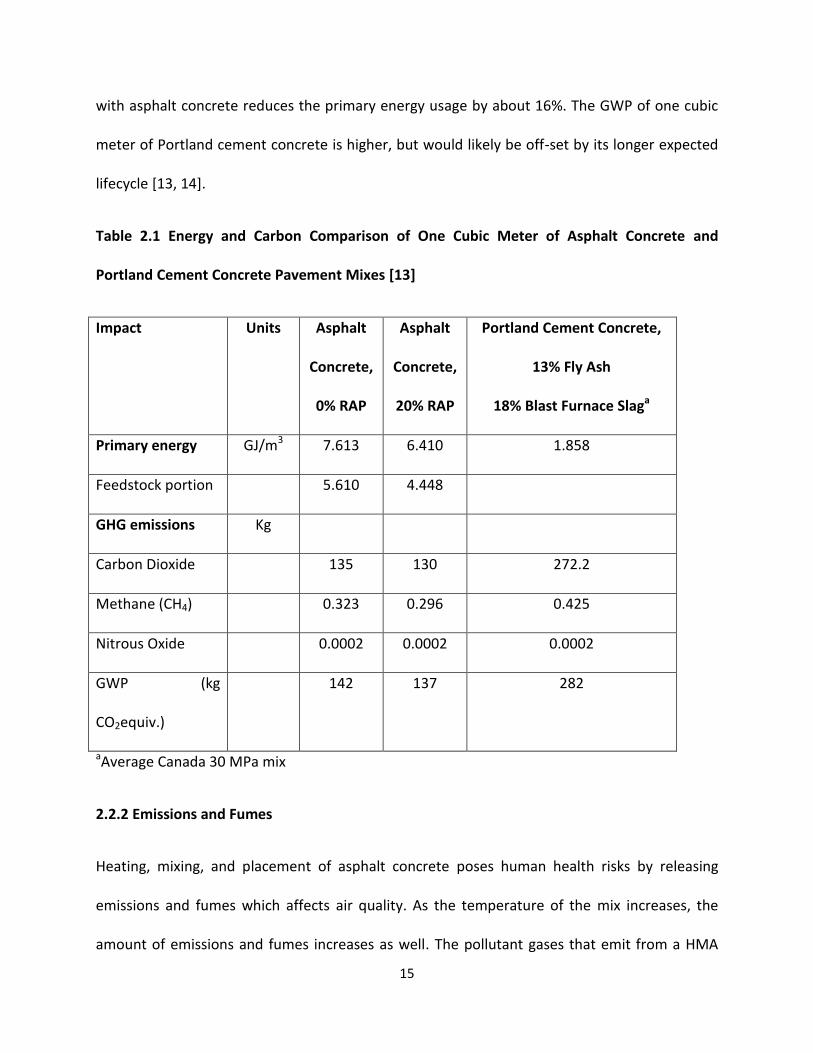
so that it can be transported to the site. The energy and GWP (global warming potential) data
shown in table 2.1 were derived from a 2006 study by the Athena Institute for Canadian
roadway pavements [13]. The figures, based on Canadian average mixes for arterial roadways
and highways, compare concrete pavement and asphalt pavement with no recycled asphalt
pavement (RAP) and 20% RAP. The figures show that the higher primary embodied energy of
one cubic meter of asphalt concrete is largely due to the feedstock portion. Use of 20% RAP
15
with asphalt concrete reduces the primary energy usage by about 16%. The GWP of one cubic
meter of Portland cement concrete is higher, but would likely be off-set by its longer expected
lifecycle [13, 14].
Table 2.1 Energy and Carbon Comparison of One Cubic Meter of Asphalt Concrete and
Portland Cement Concrete Pavement Mixes [13]
Impact Units Asphalt
Concrete,
0% RAP
Asphalt
Concrete,
20% RAP
Portland Cement Concrete,
13% Fly Ash
18% Blast Furnace Slaga
Primary energy GJ/m3 7.613 6.410 1.858
Feedstock portion 5.610 4.448
GHG emissions Kg
Carbon Dioxide 135 130 272.2
Methane (CH4) 0.323 0.296 0.425
Nitrous Oxide 0.0002 0.0002 0.0002
GWP (kg
CO2equiv.)
142 137 282
aAverage Canada 30 MPa mix
2.2.2 Emissions and Fumes
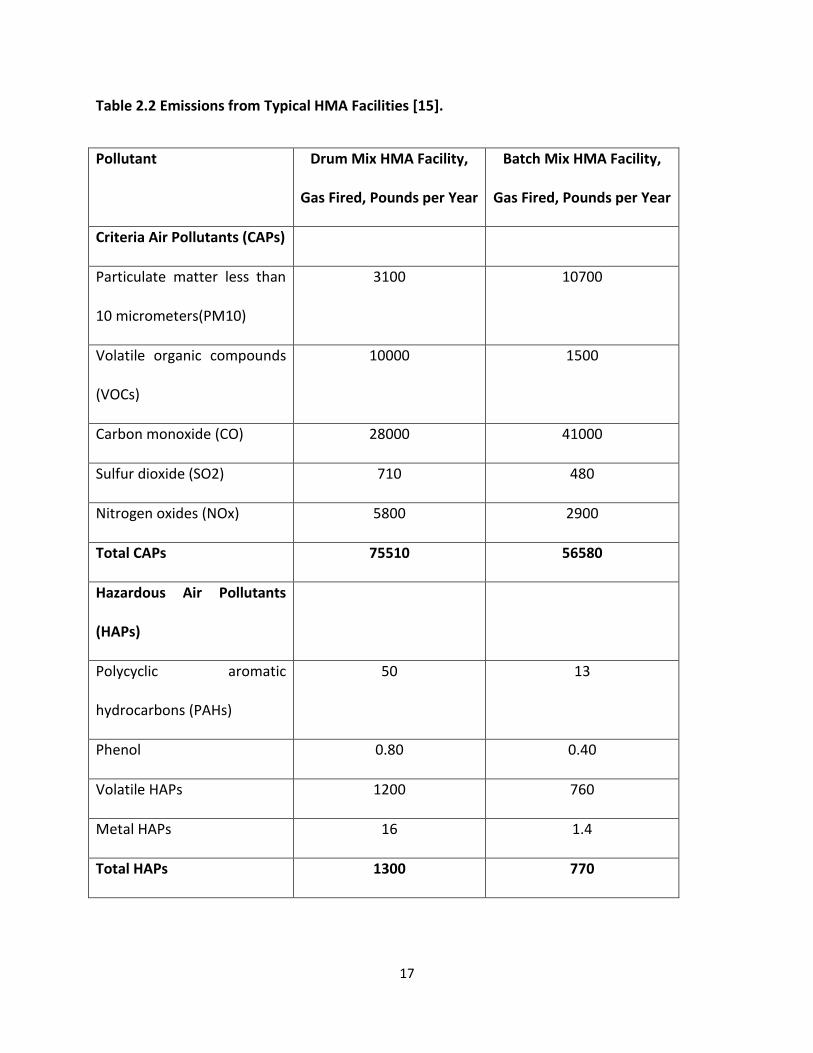
Heating, mixing, and placement of asphalt concrete poses human health risks by releasing
emissions and fumes which affects air quality. As the temperature of the mix increases, the
amount of emissions and fumes increases as well. The pollutant gases that emit from a HMA

16
production plant include sulfur dioxide (SO2), nitrogen oxides (NOx), carbon monoxide (CO), and
volatile organic compounds (VOCs), as well as hazardous air pollutant (HAP) organic compounds
[15]. Depending upon plant design and fuel used the total amount of HAP emission from a
typical plant ranges from 0.4 tons per year to 1 ton per year. Table 2.2 shows estimated
emissions from an average asphalt plant. The table does not include emissions occurring during
transport or placement of HMA. The data was developed and published in the EPA report
mentioned above [15].
17
Table 2.2 Emissions from Typical HMA Facilities [15].
Pollutant Drum Mix HMA Facility,
Gas Fired, Pounds per Year
Batch Mix HMA Facility,
Gas Fired, Pounds per Year
Criteria Air Pollutants (CAPs)
Particulate matter less than
10 micrometers(PM10)
3100 10700
Volatile organic compounds
(VOCs)
10000 1500
Carbon monoxide (CO) 28000 41000
Sulfur dioxide (SO2) 710 480
Nitrogen oxides (NOx) 5800 2900
Total CAPs 75510 56580
Hazardous Air Pollutants
(HAPs)
Polycyclic aromatic
hydrocarbons (PAHs)
50 13
Phenol 0.80 0.40
Volatile HAPs 1200 760
Metal HAPs 16 1.4
Total HAPs 1300 770
18
2.2.3 Human Health Impacts
Fumes and emissions from heating asphalt can cause adverse health effects for workers during
plant mixing and asphalt placement. The impact by the amount of exposure to fumes is still in
debate. A 2000 National Institute for Occupational Safety and Health (NIOSH) report entitled
Hazard Review: Health Effects of Occupational Exposure to Asphalt sates that the following:
“Asphalt fumes which are generated at worksites are known to have carcinogens in them.
Observation of acute irritation in workers from airborne and dermal exposures to asphalt fumes
and the potential for chronic health effects demands attention towards control of fumes.
Workers exposed to asphalt have been reported to have symptoms of nausea, stomach pain,
decreased appetite, headaches, and fatigue. It is more likely that asphalt fumes generated at
high temperatures will generate more carcinogenic PAHs and therefore are supposed to be
potentially more hazardous than fumes generated at lower temperatures” [14].
2.3 Strategies for Minimizing the Impacts of Asphalt Paving
2.3.1 Lower the Mix Temperatures
If the required temperature to mix the asphalt can be brought down, many environmental and
health problems associated with asphalt mixing can be dealt with. Benefits of lowering the
production and placement temperature of asphalt mixing include the following:
Energy savings;
Reduced emissions;
Decreased fumes;

19
Reduced aging of the asphalt binder; and
Decreased wear of equipment.
Lowering of mix temperature can be achieved using the techniques described next.
2.3.1.1 Warm Mix Asphalt
Warm-mix asphalt can bring down mixing temperatures to anywhere from 100 to 140°C
compared to mixing temperatures of 150 to 180°C for regular hot mix asphalt. Increased
workability of the asphalt at lower temperatures is achieved through use of asphalt emulsions,
foam processes, or additives.
Currently, there are four different processes of warm-mix asphalt. They are as follows:
Foam Process – In this process a stream of cold water is injected into the warm asphalt
cement. This process makes small steam bubbles inside the asphalt binder, increasing
the volume of the asphalt binder. This result in an increase of asphalt wettability and
hence coating onto the aggregate and sand becomes easier. This also lowers high shear
viscosity of asphalt. WAM foam is a type of foaming process. This process was patented
and developed jointly by Shell Global Solutions and Kolo Veidekke in Norway. Using this
process production of the asphalt mixture can be done at temperatures between 100°C
and 120°C and compaction can be done at 80 to 110°C [16]. WAM foam process is done
in two steps. In the first step, a softer binder is mixed with aggregates to provide good
fluidity at lower temperatures. In the second step, foaming of a harder binder is done.

20
Now, this foamed asphalt formed in second step is mixed with the aggregates pre-mixed
with the softer binder [16].
Organic Additives – To lower the viscosity of asphalt while maintaining stiffness,
additives like paraffin and low molecular weight ester compounds are used to modify
the properties of asphalt. Above temperatures of 80 to 120°C, paraffins are generally
soluble in the asphalt and the final mixture has less viscosity than the initial one.
Sasobit® is a type of paraffin which has a long chain aliphatic hydrocarbon with chain
lengths of 40 to 115 carbon atoms, melts in the asphalt binder at temperatures of 85 to
115°C to reduce the mixing and handling temperatures by 30 to 50°C. They are
manufactured from coal gasification by using the Fischer-Tropsch process [17].
Chemical Modification- One example of chemical modification is addition of water-
bearing agents with the asphalt in the mixing process which as a result releases the
water chemically bound with asphalt. Aspha-Min® is a type of water-bearing agent,
chemically which is a sodium aluminum silicate, physically it is a hydro-thermally
crystallized fine powder. When aggregate and asphalt mix are heated, the released
water turns into a finely dispersed steam. Release of water as steam helps in improving
workability and reduction in compaction temperature. Using this technique the mixture
compaction temperatures reduces by about 20 to 30°C [18].
21
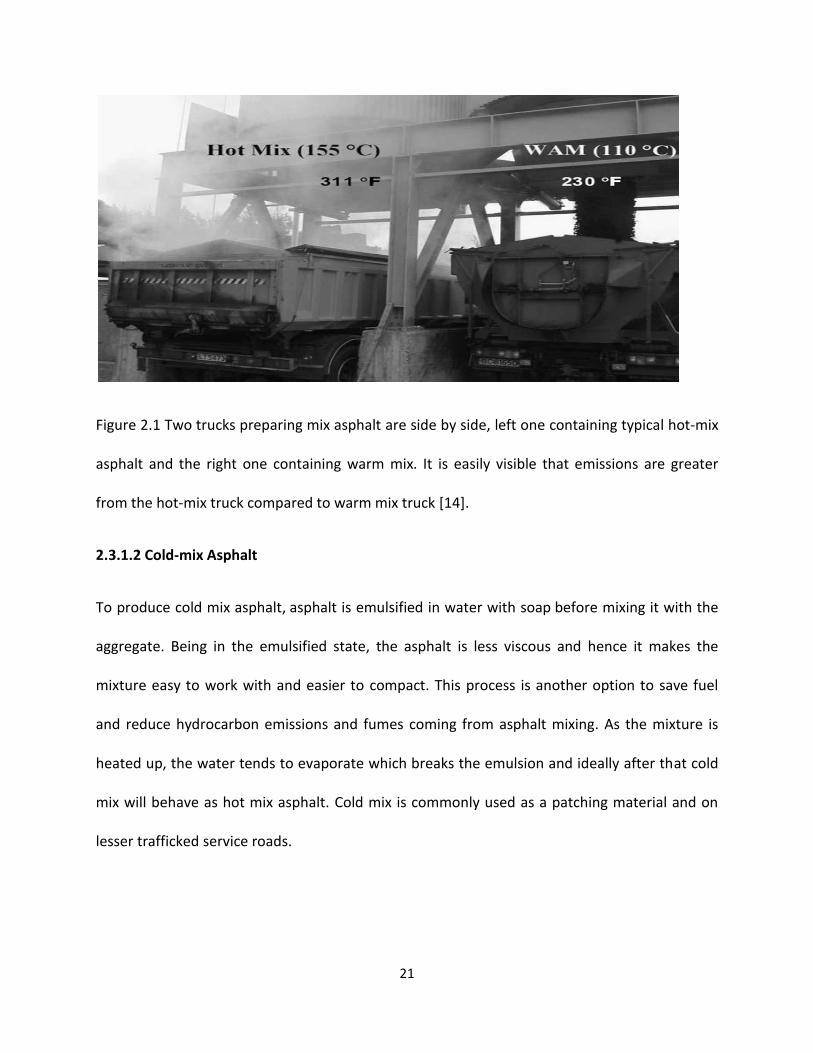
Figure 2.1 Two trucks preparing mix asphalt are side by side, left one containing typical hot-mix
asphalt and the right one containing warm mix. It is easily visible that emissions are greater
from the hot-mix truck compared to warm mix truck [14].
2.3.1.2 Cold-mix Asphalt
To produce cold mix asphalt, asphalt is emulsified in water with soap before mixing it with the
aggregate. Being in the emulsified state, the asphalt is less viscous and hence it makes the
mixture easy to work with and easier to compact. This process is another option to save fuel
and reduce hydrocarbon emissions and fumes coming from asphalt mixing. As the mixture is
heated up, the water tends to evaporate which breaks the emulsion and ideally after that cold
mix will behave as hot mix asphalt. Cold mix is commonly used as a patching material and on
lesser trafficked service roads.

22
2.3.2 Recycled Tire Aggregate
As tires are not biodegradable they are an abundant waste product for recycling. According to
statistics there are nearly 300 million discarded tires in the United States each year. These tires
can be recycled into rubberized asphalt concrete (RAC). As there were a lot of health and
environmental concerns with tires like burning tire dumps and groundwater contamination
from tires in landfills, it motivated the development of other applications of waste tires.
Asphalt rubber (AR) is a way of recycling waste tires into rubberized asphalt concrete. In
this process, before mixing asphalt with the aggregates it is heated to a certain temperature
and blended with the crumb rubber having size ranges from the 30 to 100 mesh sieve. It is
defined as “a blend of asphalt cement, reclaimed tire rubber, and certain additives in which the
rubber content is at least 15% by weight of the total blend and has reacted in the hot asphalt
cement sufficiently to cause swelling of the rubber particles” [19]. Arizona, California, and Texas
commonly use 18%-25% rubber in their asphalt rubber mixes.
Crumb rubber particles have rough surfaces and the interface between particles and
asphalt is indistinct under SEM. Particles of crumb rubber and asphalt are found to be cohesive
with each other and hence crumb rubber particles are wrapped up evenly by asphalt.
Therefore, it can be said that modification of asphalt with crumb rubber will affect performance
characteristics of asphalt [19].
Rubber concentrations significantly increase the viscosity of the binder due to the
cohesive force between these materials. The loading dependence test on modified binder
shows that binder stiffness increases with increase in rubber content, and this change is more

23
visible at lower loading frequencies. This means that the effect of rubber contents changes with
the loading rate.
The use of crumb rubber as a modifier is found to have good effects on rheological
properties of the asphalt; these improvements include improvement in penetration resistance
and less potential to permanent deformation. The temperature dependence test indicates that
adding rubber to the virgin binder increased the complex modulus at higher temperatures, and
lowered the phase angle at lower temperatures. Further study with many other binder sources
and CRM types is needed to generalize these findings [20].
2.4 Conventional Testing Methods
Instead of treating as a macromolecule with visco-elastic properties, civil engineers have
treated asphalt as a construction material due to its numerous uses in paving and roofing.
Grading of asphalt is usually done based on needle penetration, viscosity and softening point,
which in nature are purely empirical tests. Each test method measures an empirical property of
the asphalt cement usually at a single temperature. These test methods never focus on two
distinct properties of asphalt at the same time. The most common old test methods are the
following:
Penetration test (Pen);
Ring and Ball Softening Point (T R & B) test; and
Viscosity.
24
Based on grades, asphalt is divided in four different types, namely penetration grade, oxidized
grade, hard grade and cutback grade. Of these four grades, only penetration grade is used for
paving roads. For determining grades of the asphalts a combination of any of the above two
test methods or just one test can be used. Penetration grade is decided from the test by both
needle penetration and ring and ball softening point method. Cutback bitumen is decided by
the viscosity method, while the oxidized and hard grades are decided by the combination of
both viscosity and softening point method. Hard and oxidized asphalts are used for roofing and
painting purposes while the cut back bitumen is used for blending and also for surface coating
applications that are mostly industrial in nature. All these conventional methods are described
below in detail [21].
2.4.1 Penetration Test
This is the most widely used method of measuring the consistency of a bituminous material at a
given temperature. Rather than a measure of quality, it is a means of classification. (The
engineering term consistency means, empirical measure of the resistance offered by a fluid to
continuous deformation when it is subjected to shearing stress). The consistency is a function
of the chemical constituents of bitumen that means the relative amounts of asphaltenes (high
molecular weight, responsible for strength and stiffness), resins (responsible for adhesion and
ductility) and oils (low molecular weight, responsible for viscosity and fluidity). The type and
amount of these constituents of bitumen depend on the source petroleum and the method
used for processing at the refinery. If penetration is measured over a range of temperatures,
the temperature susceptibility of the bitumen can be established.
25
As per the ASTM method [22], the penetration test is the measurement of the distance
moved by the specified dimension needle into the asphalt under the known load (100 g) at
constant temperature (25°C) for a specified time (5 s). Usually three individual penetration
measurement readings are recorded for each sample and their difference should not exceed
the specified limit. The average of three measurements is reported to the nearest whole
number. The measurement of penetration is done in tenths of a millimeter (decimillimetre,
dmm).The lower value of penetration measurements represents the harder asphalt and vice
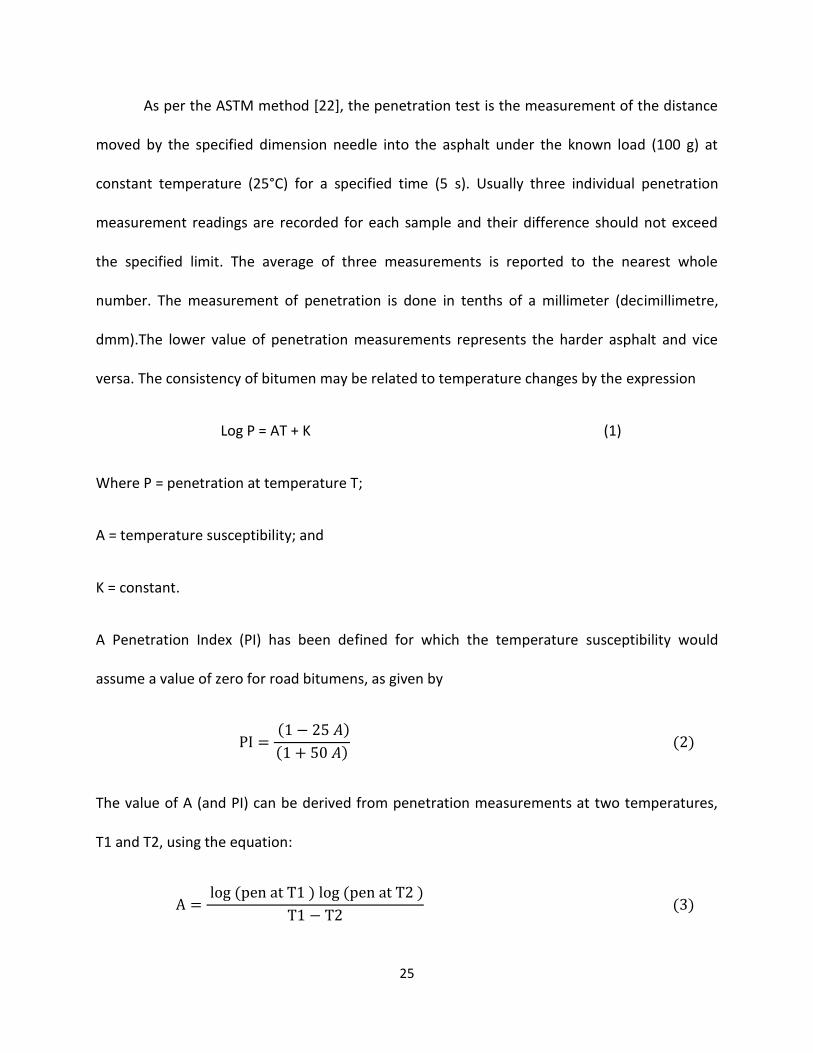
versa. The consistency of bitumen may be related to temperature changes by the expression
Log P = AT + K (1)
Where P = penetration at temperature T;
A = temperature susceptibility; and
K = constant.
A Penetration Index (PI) has been defined for which the temperature susceptibility would
assume a value of zero for road bitumens, as given by
The value of A (and PI) can be derived from penetration measurements at two temperatures,
T1 and T2, using the equation:
26
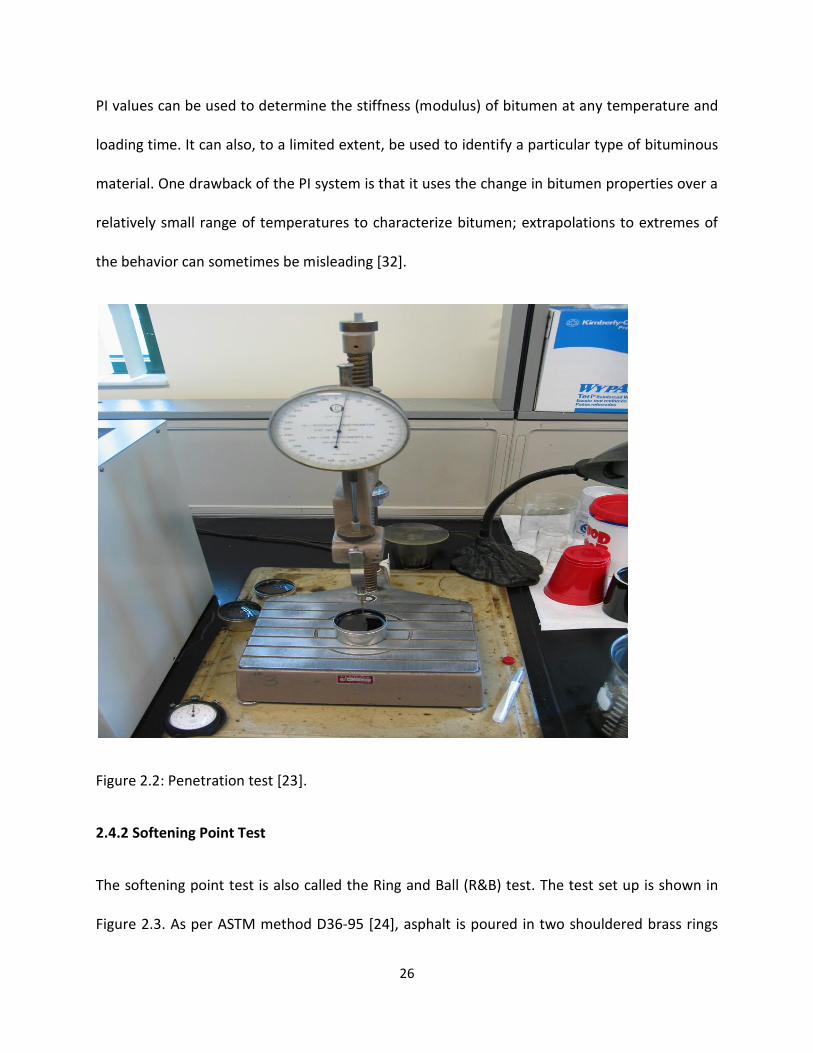
PI values can be used to determine the stiffness (modulus) of bitumen at any temperature and
loading time. It can also, to a limited extent, be used to identify a particular type of bituminous
material. One drawback of the PI system is that it uses the change in bitumen properties over a
relatively small range of temperatures to characterize bitumen; extrapolations to extremes of
the behavior can sometimes be misleading [32].
Figure 2.2: Penetration test [23].
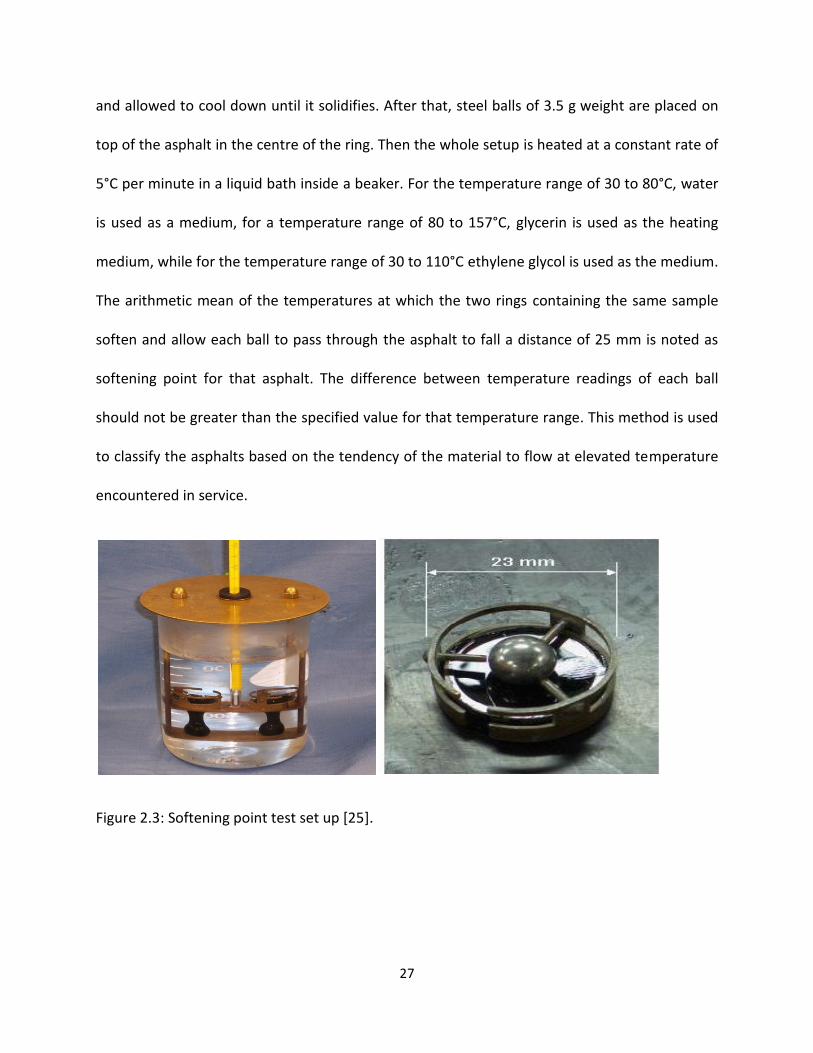
2.4.2 Softening Point Test
The softening point test is also called the Ring and Ball (R&B) test. The test set up is shown in
Figure 2.3. As per ASTM method D36-95 [24], asphalt is poured in two shouldered brass rings
27
and allowed to cool down until it solidifies. After that, steel balls of 3.5 g weight are placed on
top of the asphalt in the centre of the ring. Then the whole setup is heated at a constant rate of
5°C per minute in a liquid bath inside a beaker. For the temperature range of 30 to 80°C, water
is used as a medium, for a temperature range of 80 to 157°C, glycerin is used as the heating
medium, while for the temperature range of 30 to 110°C ethylene glycol is used as the medium.
The arithmetic mean of the temperatures at which the two rings containing the same sample
soften and allow each ball to pass through the asphalt to fall a distance of 25 mm is noted as
softening point for that asphalt. The difference between temperature readings of each ball
should not be greater than the specified value for that temperature range. This method is used
to classify the asphalts based on the tendency of the material to flow at elevated temperature
encountered in service.
Figure 2.3: Softening point test set up [25].
28
2.4.3 Viscosity Test
The viscosity of a fluid is a measure of its resistance to gradual deformation by shear
stress or tensile stress. For liquids, it corresponds to the informal notion of "thickness". For
example, honey has a higher viscosity than water [26]. Asphalts are graded according to their
viscosity like VG-10, VG-20, VG-30, and VG-40, by viscosity measurements particularly in
eastern countries like India based on the specifications of Indian Standards IS-73-1992 (viscosity
at 60°C), along with other qualification tests like specific gravity, water content, ductility, loss
on heating and Fraass breaking point, etc. Asphalt’s absolute viscosity is usually measured at a
temperature of 60°C. This temperature is used as it is related to the maximum surface
temperature of a pavement during summer. The kinematic viscosity of a liquid the ratio of the
absolute viscosity and the density of the liquid at the temperature of measurement at 135°C
and these temperatures are related to mixing and lay down temperatures of the pavement[27].
Asphalt viscosities are usually measured by Brookfield viscometers and capillary viscometers
based on the specification requirements [28] as shown in Figure 2.5. Graphs depicting variation
of viscosity with change in temperature are used to estimate mixing and compaction
temperatures for the asphalt mix design. The Bitumen Test Data Chart (BTDC) is also used to
predict mixing and compaction temperatures based on the correlation between penetration,
softening point, Fraass breaking point, and Brookfield viscosity test results.

29
Figure 2.4: Brookfield viscometer and capillary viscometer [29, 30].
2.5 Asphalt Cement Aging and Durability
Change of asphalt physical properties as an effect of aging is called age hardening. Durability is
the determination of change of these physical properties. Age hardening is caused by following
factors;
Oxidation - This occurs when oxygen reacts with the asphalt binder [33].
Volatilization - Volatilization occurs when lighter constituents of asphalt evaporate.
Volatilization primarily depends on temperature and occurs principally during HMA
production [33].
Polymerization - When two or more like molecules combine to form a larger molecule,
polymerization happens. These larger molecules are thought to be a cause of hardening
of asphalt [33].
30
Thixotropy - The asphalt binder if unagitated “sets”. This property of asphalt is called
thixotropy. This process usually causes an increase in viscosity and thus, hardening the
binder. If the binder is heated and agitated at regular intervals effects of Thixotropy can
be somewhat reversed. HMA pavements with little or no traffic are generally affected
by hardening due to thixotropy [33].
Separation - The removal of the oily constituents, resins or asphaltenes from the asphalt
binder by selective absorption of some porous aggregates [33].
Short term aging - When asphalt binder is mixed with hot aggregates in the hot mix
facility; the asphalt is subjected to short term aging.
Long term aging - When asphalt is exposed to environment for a long amount of time it
goes through long term aging and it usually occurs after HMA pavement construction.
It is difficult to measure durability but it can be done by simulated aging using RTFO and
PAV and measure the properties before and after aging with standard physical tests like
viscosity, DSR, BBR and Direct Tension Test (DTT).
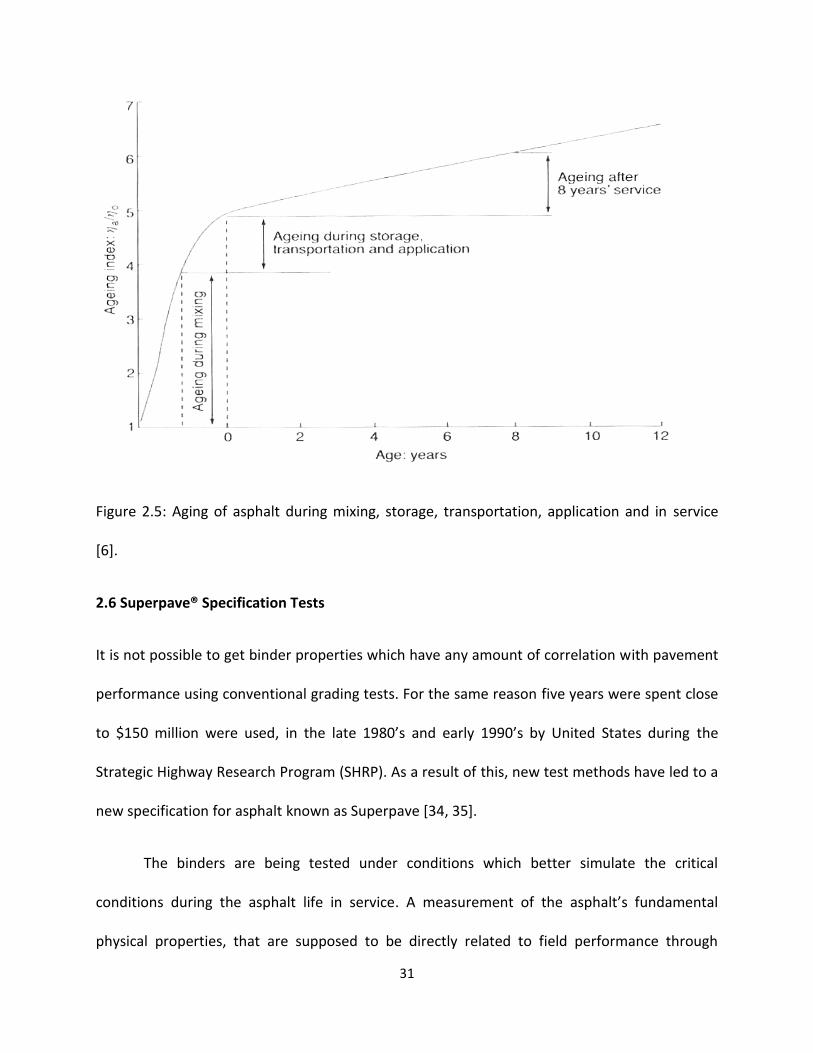
To evaluate aging of asphalt measuring the change from unaged to aged asphalt in physical
properties like stiffness, viscosity and penetration with time are to be measured. Aging index is
the ratio of two values like stiffness, viscosity or penetration measured at different times and it
is not a fundamental parameter. For example, aging index based on viscosity (ηa/ηo) is the ratio
of viscosity of aged asphalt, ηa, to the viscosity of original asphalt, ηo. Figure 2.5 shows the aging
index graph.
RTFO and PAV tests are described in the SuperpaveTM testing standards.
31
Figure 2.5: Aging of asphalt during mixing, storage, transportation, application and in service
[6].
2.6 Superpave® Specification Tests
It is not possible to get binder properties which have any amount of correlation with pavement
performance using conventional grading tests. For the same reason five years were spent close
to $150 million were used, in the late 1980’s and early 1990’s by United States during the
Strategic Highway Research Program (SHRP). As a result of this, new test methods have led to a
new specification for asphalt known as Superpave [34, 35].
The binders are being tested under conditions which better simulate the critical
conditions during the asphalt life in service. A measurement of the asphalt’s fundamental
physical properties, that are supposed to be directly related to field performance through

32
sound engineering principles as a result of these tests under Superpave, was observed. Grades
for asphalt are written in a way such as PG (or PGAC) XX-YY, where XX represents the high
temperature working limit of the asphalt cement and -YY the low temperature limit based on
the Superpave test methods. For an example, PGAC 60-22 asphalt cement is expected to
perform without any significant amount of either rutting or thermal cracking at a high
temperature limit of 60°C and low temperature limit of -22°C. Moreover, in the past readings
from high temperature grading tests have been able to correlate well with rutting performance
without any problems. For low temperature testing of asphalt an inadequate amount of time is
given for sample conditioning. As a result, in northern regions where winter is very cold
pavements is not properly designed [36].
In Superpave testing to determine XX and –YY, two important test methods applied are
[37]: the Dynamic Shear Rheometer (DSR) test for XX, and the Bending Beam Rheometer (BBR)
test for -YY. DSR usually gives quite reasonable values at medium and high temperatures for
failure properties like rutting and fatigue. Moreover, BBR method is used to get results for low
temperature cracking of asphalt, but this method still has a lot of problems like premature and
excessive cracking associated with it, and hence this method needs some improvements.
2.6.1 Laboratory Aging of Asphalt Cement
As discussed above PAV test done in the lab simulates 8-10 years of aging of pavement in
service while aging during mixing and laying is simulated by RTFO test. Therefore, the asphalt
binder tests such as the DSR, BBR and DTT which characterize in-service performance of asphalt
are carried out on samples first aged in the RTFO and then in the PAV while the asphalt binder

33
tests involved with mix and placement properties namely the DSR are done on RTFO aged
samples.
2.6.1.1 Rolling Thin Film Oven Test
In this test a moving film of asphalt which is paced in a jar, is heated in an oven for 85 minutes
at 163°C (325°F). This test simulates short term aging of asphalt (Figure 2.6). The moving film is
created by placing the asphalt binder sample in a small jar and then placing the jar in a circular
metal carriage that rotates within the oven. The oven is preheated at an aging temperature of
163°C. Amount of sample used is 35 g which is then poured into each cylindrical bottle used for
RTFO. The carriages which hold RTFO tubes inside the instrument rotates at a rate of 15 rpm for
85 min and the air flow is maintained at 4000 mL/min as shown in Figure 2.6. After aging, the
mass change is calculated and the physical properties changes are measured [38].
Figure 2.6: Rolling Thin Film Oven (RTFO) [39].
34
The rolling action used in RTFO helps in:
Allowing asphalt binder modifiers, to remain dispersed in the sample.
Allowing continuous exposure of fresh asphalt binder to heat and air flow
Preventing the formation of a surface skin on the sample, this may inhibit aging.
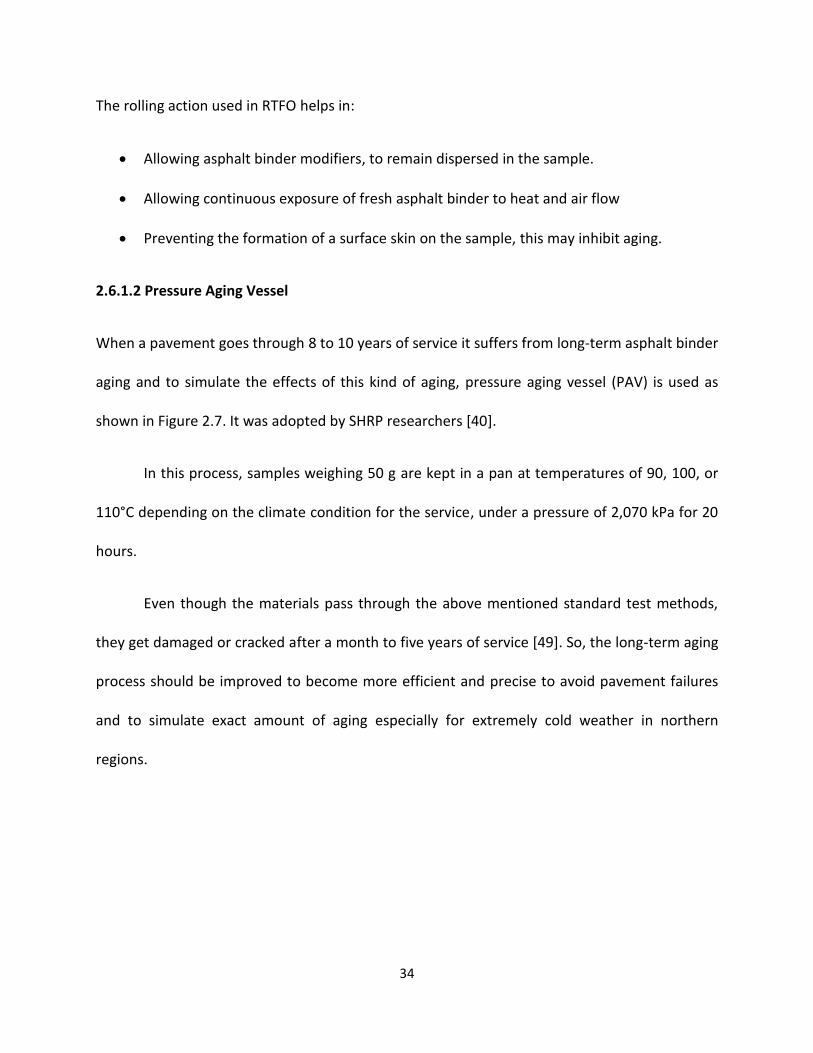
2.6.1.2 Pressure Aging Vessel
When a pavement goes through 8 to 10 years of service it suffers from long-term asphalt binder
aging and to simulate the effects of this kind of aging, pressure aging vessel (PAV) is used as
shown in Figure 2.7. It was adopted by SHRP researchers [40].
In this process, samples weighing 50 g are kept in a pan at temperatures of 90, 100, or
110°C depending on the climate condition for the service, under a pressure of 2,070 kPa for 20
hours.
Even though the materials pass through the above mentioned standard test methods,
they get damaged or cracked after a month to five years of service [49]. So, the long-term aging
process should be improved to become more efficient and precise to avoid pavement failures
and to simulate exact amount of aging especially for extremely cold weather in northern
regions.
35
Figure 2.7 Pressure Aging Vessel (PAV) [41].
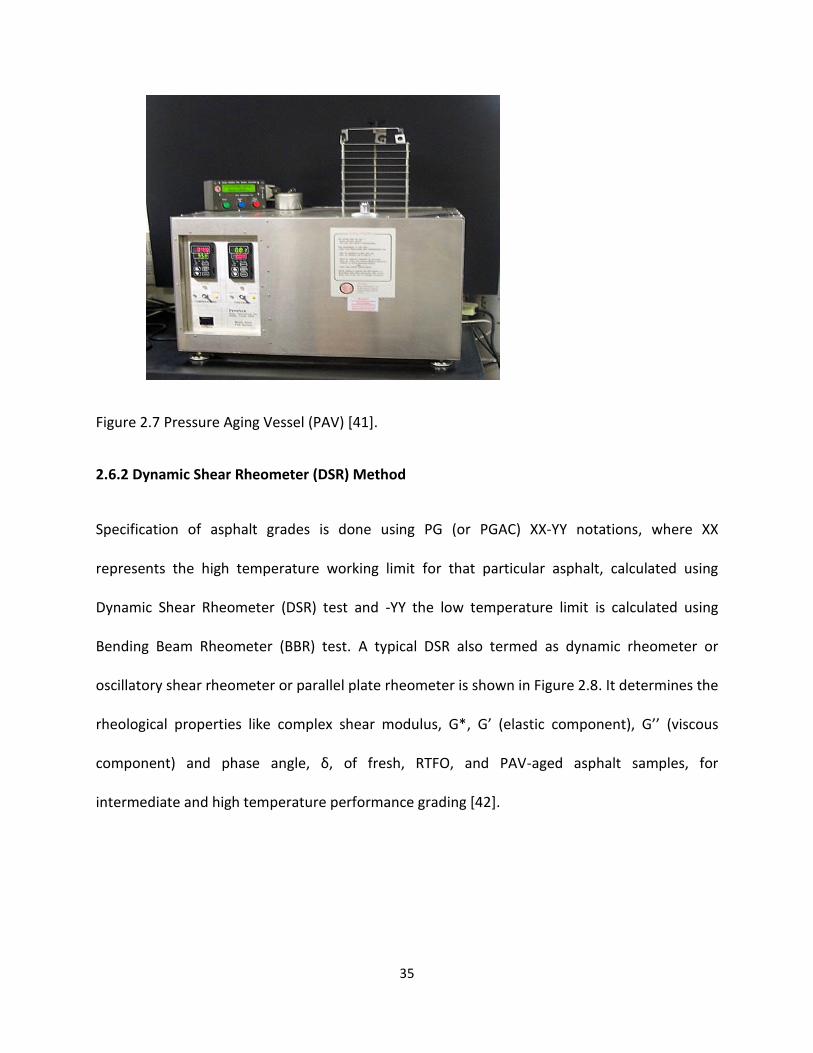
2.6.2 Dynamic Shear Rheometer (DSR) Method
Specification of asphalt grades is done using PG (or PGAC) XX-YY notations, where XX
represents the high temperature working limit for that particular asphalt, calculated using
Dynamic Shear Rheometer (DSR) test and -YY the low temperature limit is calculated using
Bending Beam Rheometer (BBR) test. A typical DSR also termed as dynamic rheometer or
oscillatory shear rheometer or parallel plate rheometer is shown in Figure 2.8. It determines the
rheological properties like complex shear modulus, G*, G’ (elastic component), G’’ (viscous
component) and phase angle, δ, of fresh, RTFO, and PAV-aged asphalt samples, for
intermediate and high temperature performance grading [42].
36
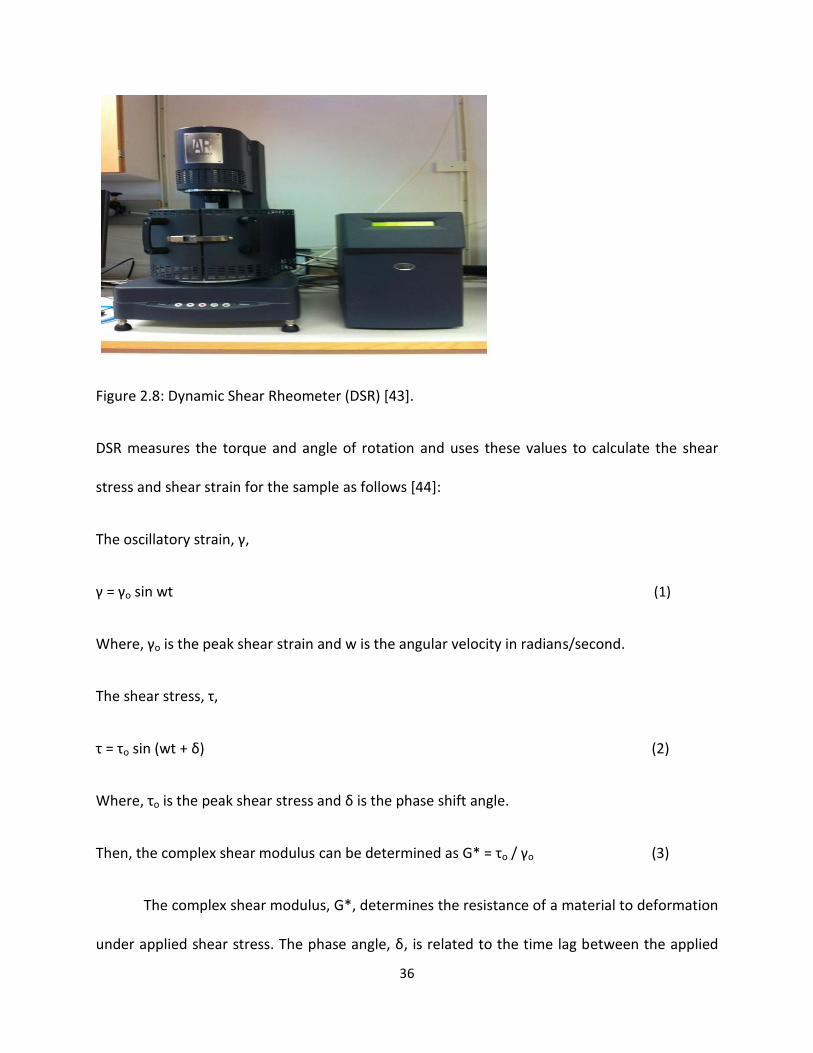
Figure 2.8: Dynamic Shear Rheometer (DSR) [43].
DSR measures the torque and angle of rotation and uses these values to calculate the shear
stress and shear strain for the sample as follows [44]:
The oscillatory strain, γ,
γ = γo sin wt (1)
Where, γo is the peak shear strain and w is the angular velocity in radians/second.
The shear stress, τ,
τ = τo sin (wt + δ) (2)
Where, τo is the peak shear stress and δ is the phase shift angle.
Then, the complex shear modulus can be determined as G* = τo / γo (3)
The complex shear modulus, G*, determines the resistance of a material to deformation
under applied shear stress. The phase angle, δ, is related to the time lag between the applied

37
stress and the resulting strain, and it can be expressed as the ratio of viscous or loss modulus,
G”, to the storage or elastic modulus, G’. To decide the high temperature PG grade according to
the AASHTO specification, G*/sin δ should be greater than 1.00 kPa for an unaged sample and
greater than 2.20 kPa for an RTFO-aged sample [42].

38
2.6.3 Bending Beam Rheometer (BBR) Method
Low temperature cracking is a major distress type for asphalt pavements. The bending beam
rheometer (BBR) is used to identify critical temperatures causing low temperature cracking for
asphalt. The BBR was developed under the Strategic Highway Research Program (SHRP).
AASHTO standard M320 [45] provides the specification criteria for passing/failing the BBR test.
This method measures creep stiffness S(t) and the m-value of the asphalt cement as defined by
the slope of the creep stiffness master curve and then uses these values to find a critical
temperature. Hence, it can be said that the low temperature thermal cracking performances of
the asphalt pavement are related to the S(t) and m(t) value.
Figure 2.10: Bending Beam Rheometer (BBR) [46].
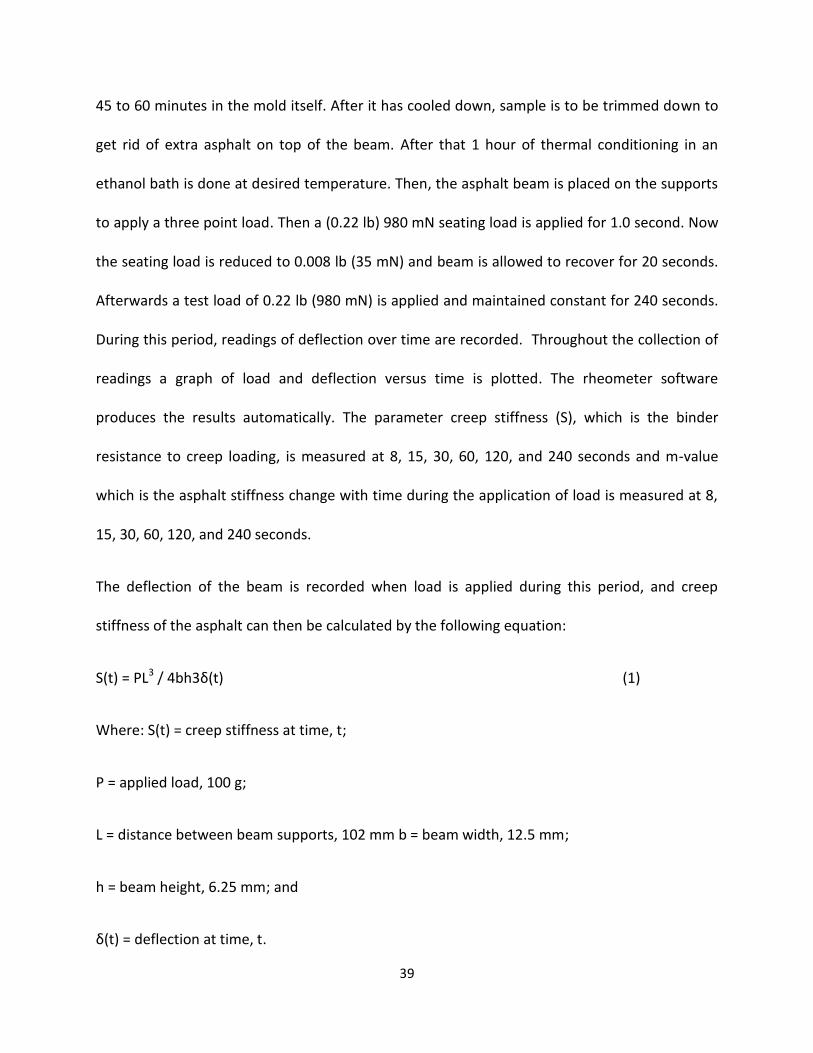
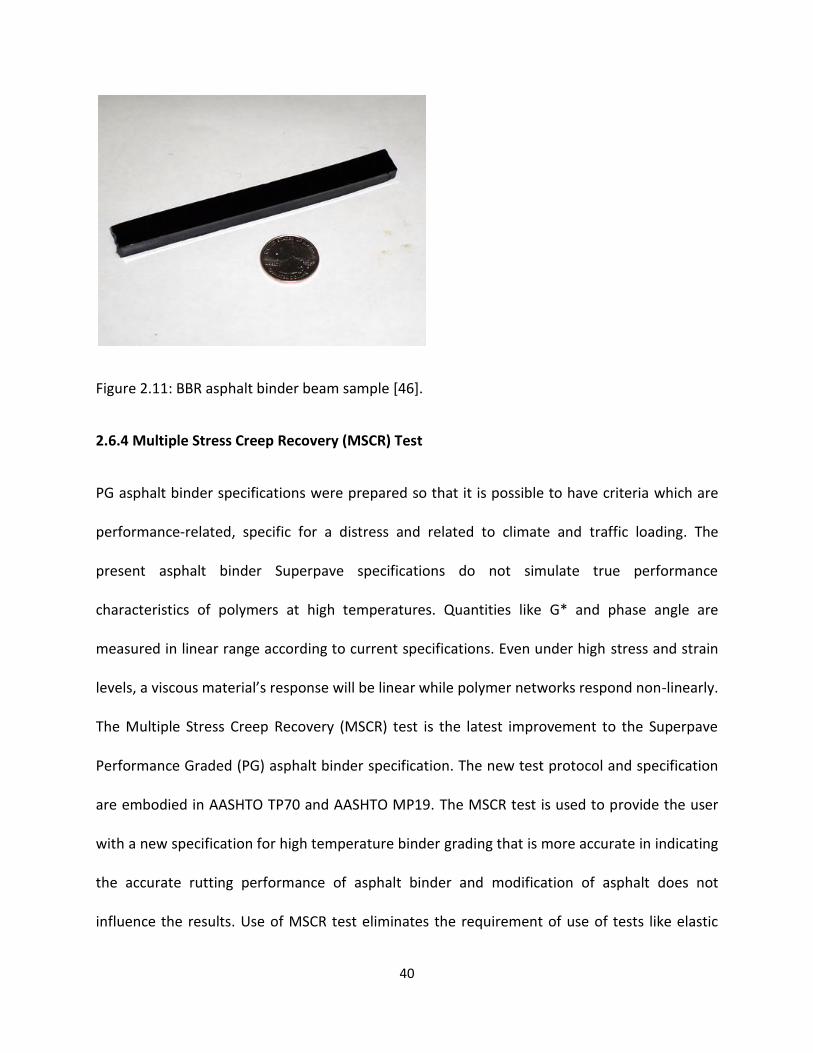
BBR uses PAV aged samples. The asphalt binder is heated and poured into the mold
which is shaped as beams as shown in Figure 2.11. The measure of the beam is 0.246 x 0.492 x
5.000 inches (6.25 x 12.5 x 127 mm) (Figure 2.11). After pouring, sample is left to cool down for
39
45 to 60 minutes in the mold itself. After it has cooled down, sample is to be trimmed down to
get rid of extra asphalt on top of the beam. After that 1 hour of thermal conditioning in an
ethanol bath is done at desired temperature. Then, the asphalt beam is placed on the supports
to apply a three point load. Then a (0.22 lb) 980 mN seating load is applied for 1.0 second. Now
the seating load is reduced to 0.008 lb (35 mN) and beam is allowed to recover for 20 seconds.
Afterwards a test load of 0.22 lb (980 mN) is applied and maintained constant for 240 seconds.
During this period, readings of deflection over time are recorded. Throughout the collection of
readings a graph of load and deflection versus time is plotted. The rheometer software
produces the results automatically. The parameter creep stiffness (S), which is the binder
resistance to creep loading, is measured at 8, 15, 30, 60, 120, and 240 seconds and m-value
which is the asphalt stiffness change with time during the application of load is measured at 8,
15, 30, 60, 120, and 240 seconds.
The deflection of the beam is recorded when load is applied during this period, and creep
stiffness of the asphalt can then be calculated by the following equation:
S(t) = PL3 / 4bh3δ(t) (1)
Where: S(t) = creep stiffness at time, t;
P = applied load, 100 g;
L = distance between beam supports, 102 mm b = beam width, 12.5 mm;
h = beam height, 6.25 mm; and
δ(t) = deflection at time, t.
40
Figure 2.11: BBR asphalt binder beam sample [46].
2.6.4 Multiple Stress Creep Recovery (MSCR) Test
PG asphalt binder specifications were prepared so that it is possible to have criteria which are
performance-related, specific for a distress and related to climate and traffic loading. The
present asphalt binder Superpave specifications do not simulate true performance
characteristics of polymers at high temperatures. Quantities like G* and phase angle are
measured in linear range according to current specifications. Even under high stress and strain
levels, a viscous material’s response will be linear while polymer networks respond non-linearly.
The Multiple Stress Creep Recovery (MSCR) test is the latest improvement to the Superpave
Performance Graded (PG) asphalt binder specification. The new test protocol and specification
are embodied in AASHTO TP70 and AASHTO MP19. The MSCR test is used to provide the user
with a new specification for high temperature binder grading that is more accurate in indicating
the accurate rutting performance of asphalt binder and modification of asphalt does not
influence the results. Use of MSCR test eliminates the requirement of use of tests like elastic
41
recovery, toughness and tenacity, and force ductility, procedures designed specifically to
indicate polymer modification of asphalt binders. Using single MSCR test information on both
performance and formulation of the asphalt binder can be gathered [4, 47].
2.6.5 MSCR Test and Specification
By means of Multiple Stress Creep recovery, determination of percent recovery and non-
recoverable compliance of asphalt binders is covered. The sample preparation for the MSCR
test is same as DSR sample preparation for high temperature which uses 25-mm plates. The
MSCR test can be performed at the sample prepared sample which was used before to run
another DSR test on a RTFO residue as specified in M 320. If using the previously used sample
to run the MSCR test, a one minute relaxation should be given between these two tests while
there is no need for this relaxation period for an unused sample. This test uses a constant stress
creep of 1.0 s duration followed by a zero stress recovery of 9.0 s duration. Two different stress
levels, 0.1 kPa and 3.2 kPa are used to perform the test. For each of these two strains ten cycles
of creep and recovery are performed which totals up to be 20 cycles. For creep cycle stress and
strain values are recorded at least every 0.1 s and for the recovery cycle this date is recorded at
least every 0.45 s for complete duration of the test. This data accumulation is done such that, in
addition to other data points, data points at 1.0s and 10.0s for each cycle are recorded
explicitly. Between creep and recovery cycles there are no rest periods or changes in stress
level. Total amount of time taken to complete the two stress level creep and recovery test is
200 s [4].

42
Two separate parameters, namely the non-recoverable creep compliance (Jnr) and the
percentage recovery (MSCR recovery) of the sample during each loading cycle, can be
determined in the MSCR test. At each stress level, an average of ten loading cycles is recorded.
Through a good amount of laboratory and field tests a better correlation with rutting potential
than G*/sin δ, especially for modified asphalt binders, has been established [48].
For the standard traffic load, the Jnr value determined at 3.2 kPa shear stress should
have a maximum value of 4.0 kPa-1. As the traffic increases to heavy and very heavy loading, the
Jnr value of the asphalt binder is required to be lowered with the required maximum values of
2.0 and 1.0 kPa, respectively,. The data determined at 0.1 kPa shear stress is also important for
lower traffic zone whereas the main requirement for Jnr is determined at 3.2 kPa shear stress.
AASHTO MP19 maintains a requirement that the difference in Jnr values between 0.1 kPa and
3.2 kPa shear stress should not exceed a ratio of 0.75 so as to minimize concerns that some
asphalt binders may be sensitive to changes in shear stress [4].
Figure 2.12: Example of modified asphalt binder response to repeated loading [47].
43
2.7 Improved Ministry of Transportation of Ontario (MTO) Test Methods
As tests for properties such as creep and stress relaxation conditions the samples only for one
hour prior to testing according to AASHTO M320 (American Association of State Highway
Officials) specification, it is important to take physical aging into account [49] Low strain testing
methods and insufficient aging and conditioning time is followed according to Superpave
specifications to predict asphalt performance. The collaboration work of the Ontario Ministry of
Transportation with Queen’s University has developed the following set of new test methods:
1. Extended Bending Beam Rheometer (eBBR) test (LS-308);
2. Double Edge Notched Tension (DENT) test (LS-299); and
3. Modified Pressure Aging Vessel protocols (LS-228).
When compared to Superpave methods these methods were found to show more
effective asphalt performance prediction. Compared to good quality asphalts, poor quality
asphalts are penalized more during aging for longer times, or in thinner films, and/or in the
presence of moisture [50]. Hence it can be said that these new tests help a lot in selecting
quality asphalts rather than guessing as is currently done with the Superpave specification.
44
2.7.1 Extended Bending Beam Rheometer (eBBR) Method LS-308
Physical hardening of asphalt at low temperature can increase over time and can vary at
different temperatures. As the regular BBR protocol only covers one hour conditioning of the
asphalt it cannot deal with the gradual hardening phenomenon which typically occurs over
periods of days, weeks and months. In the extended BBR method, a sample is conditioned for
one hour, one day, and 3 days, so that it can cause severe grade losses in the asphalt, especially
in poor quality asphalt cements which contain large quantities of wax and unstable asphaltene
dispersions. In the extended BBR, the conditioning temperatures T1 and T2 are fixed as follows:
T1 = Tdesign + 10; and
T2 = Tdesign + 20.
In order to determine an exact grade according to AASHTO M320 criteria both pass and
fail temperatures are selected by interpolation. The grade temperature and subsequent grade
losses are calculated at the end of each conditioning period. The warmest minus the coldest
limiting temperature (where S reaches 300 MPa or m reaches 0.3) is the worst grade loss. This
method is designed not to perfectly correlate with low temperature cracking distress but to
provide a high degree of confidence that thermal cracking is largely avoided [4].
2.7.2 Double-Edge Notched Tension (DENT) Test LS-299
The test measures the essential work of failure, the plastic work of failure, and an
approximate critical crack tip opening displacement (CTOD), at a specified temperature and

45
rate of loading [51]. The samples are thermally conditioned at a specified temperature before
running any tests.
Figure 2.13: DENT test setup [52].
The DENT test is based on the Essential Work of Fracture (EWF) method. This method is
a thermodynamic analysis and was initially proposed by Cotterell and Reddel [53]. This method
divides the energy consumed during the post-yielding fracture of a pre-cracked specimen, Wt,
in two different parts and these two different energies are related with two different zones
(inner and outer as depicted in Fig. 2.14).
Figure 2.14: DENT specimen showing the typical dimensions with process and plastic zones [54].
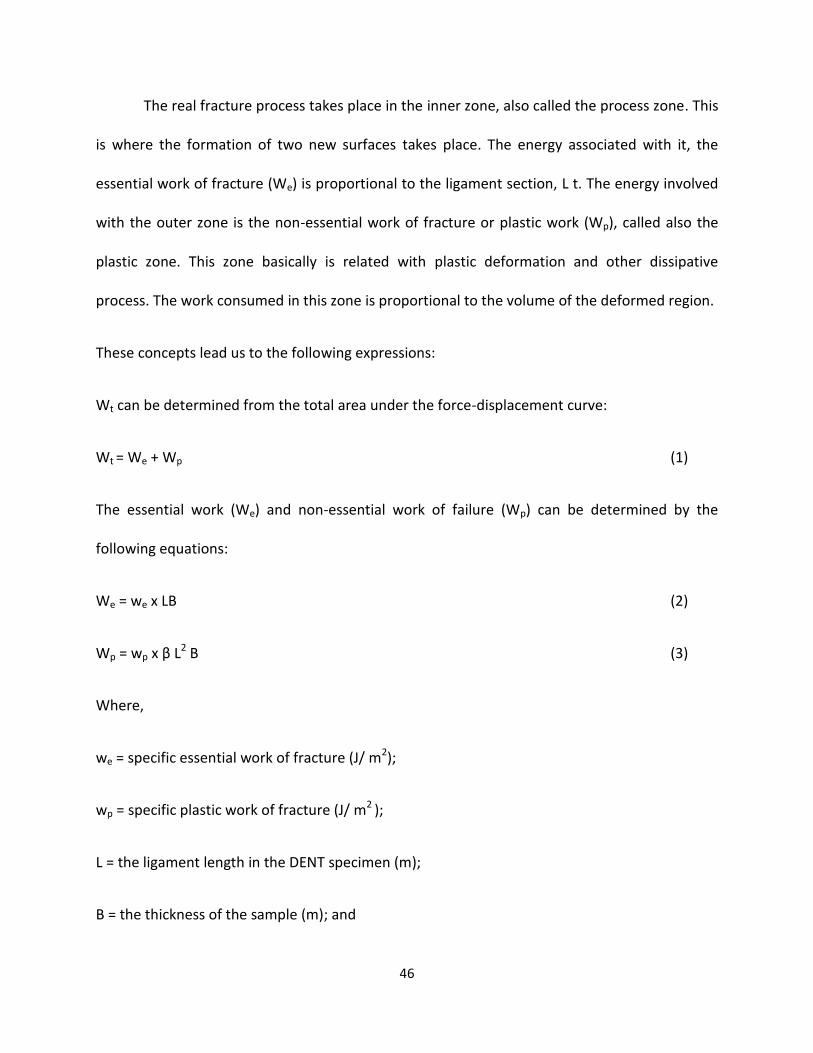
46
The real fracture process takes place in the inner zone, also called the process zone. This
is where the formation of two new surfaces takes place. The energy associated with it, the
essential work of fracture (We) is proportional to the ligament section, L t. The energy involved
with the outer zone is the non-essential work of fracture or plastic work (Wp), called also the
plastic zone. This zone basically is related with plastic deformation and other dissipative
process. The work consumed in this zone is proportional to the volume of the deformed region.
These concepts lead us to the following expressions:
Wt can be determined from the total area under the force-displacement curve:
Wt = We + Wp (1)
The essential work (We) and non-essential work of failure (Wp) can be determined by the
following equations:
We = we x LB (2)
Wp = wp x β L2 B (3)
Where,
we = specific essential work of fracture (J/ m2);
wp = specific plastic work of fracture (J/ m2 );
L = the ligament length in the DENT specimen (m);
B = the thickness of the sample (m); and

47
β = the shape factor of the plastic zone, which is geometry dependent.
If we substitute equations 2 and 3 in 1,
Wt = (we x LB) + (wp x β L2 B) (4)
By dividing equation (4) by the cross-sectional area of the plastic zone (LB),
= wt = we + wp x β L (5)
where, wt = specific total work of fracture (J/ m2).
The specific total work of failure, wt, versus the ligament length, L in equation (5), gives a
straight line with slope and intercept on the wt axis. The we value helps to predict fatigue
cracking resistance and to determine the CTOD [47]:
δt =
σ (6)
where, δt = the crack tip opening displacement parameter (m), and
σn = the net section stress or yield stress (N/m2), determined from the 5 mm ligament length of
the DENT mould.
High correlations exist between the CTOD and the fatigue properties of the asphalt cement.
CTOD can be used to rank the performance and determine a high correlation with cracking
distress.
48
2.7.3 Modified Pressure Aging Vessel Method LS-228
As the present PAV aging method does not help efficiently in predicting fatigue and thermal
cracking, this new and improved aging method accelerates aging of asphalt to help and get rid
of these problems [55-59].
This can be done using two methods. In the first method, the film thickness is reduced to
approximately 0.8 mm by reducing the weight of 50 +/- 0.5 grams to 12.5 +/- 0.5 grams. The
presence of moisture is achieved by loading one empty TFOT stainless steel pan with 50 grams
of distilled water. In the second method, as compared to the old PAV method, the aging time is
increased from 20 h to 40 h with the presence of moisture by loading one empty TFOT stainless
steel pan with 50 grams of distilled water. The standard film thickness is maintained [60]. Once
aging is done, the physical property changes are measured running different tests on the aged
samples.
Poor quality asphalts are penalized during aging for longer times, or in thinner films, and/or in
the presence of moisture compared to good asphalts [50]. So, this new test method makes it
easier to find good quality asphalts.
49
CHAPTER 3
MATERIALS AND EXPERIMENTAL PROCEDURES
3.1 Materials
The materials used in this study were obtained from various commercial sources. The RAF
binder was produced by Imperial Oil in their Nanticoke, Ontario, refinery on Lake Erie. The NER
binder was obtained from a commercial PG 52-34 sampled during the construction of a
northern Ontario MTO contract.
The recycled tire used in the lab studies was ground passenger tire (styrene-butadiene rubber
or SBR).
The source and grade information of different asphalt used is shown in Table 3.1. As per the
AASHTO specification, the high temperature PG grades are decided based on the following
values, G*/ sin δ > 1.00 kPa for fresh and G*/ sin δ > 2.20 kPa for RTFO residue, the
intermediate temperature PG grades is decided on G* sin δ less than 5000 kPa for PAV residue,
and the low temperature PG grade is decided on < 300 MPa and m-value > 0.300 for PAV
residue [61].
More information about base asphalt cements and warm mix additives are provided in Tables
3.2 and 3.3 respectively.

50
Table 3.1 Base Asphalt Cements Used in the Study
Binder Source PG, °C
RAF Imperial Oil, Nanticoke, Ontario 51-34
NER MTO, Northern Ontario 52-34
AAG California Valley, United States 58-16
AAK Boscan, Venezuela 64-22
AAV Alaska North Slope 52-22
ABG Laguna, Venezuela 64-28
CL Cold Lake, Alberta 58-28
Table 3.2 Warm Mix Additives Used in the Study
Additive Content
(wt.%)
Description
A 1 Tall Oil-Amine Surfactant
B 1 Hydrocarbon Blend
D1 1 Amine-type Surfactant
D2 1 Surfactant/Rheology Modifier
E 1 Long Chain Aliphatic Hydrocarbon
All binders were mixed with 18% crumb rubber to prepare asphalt rubber samples.
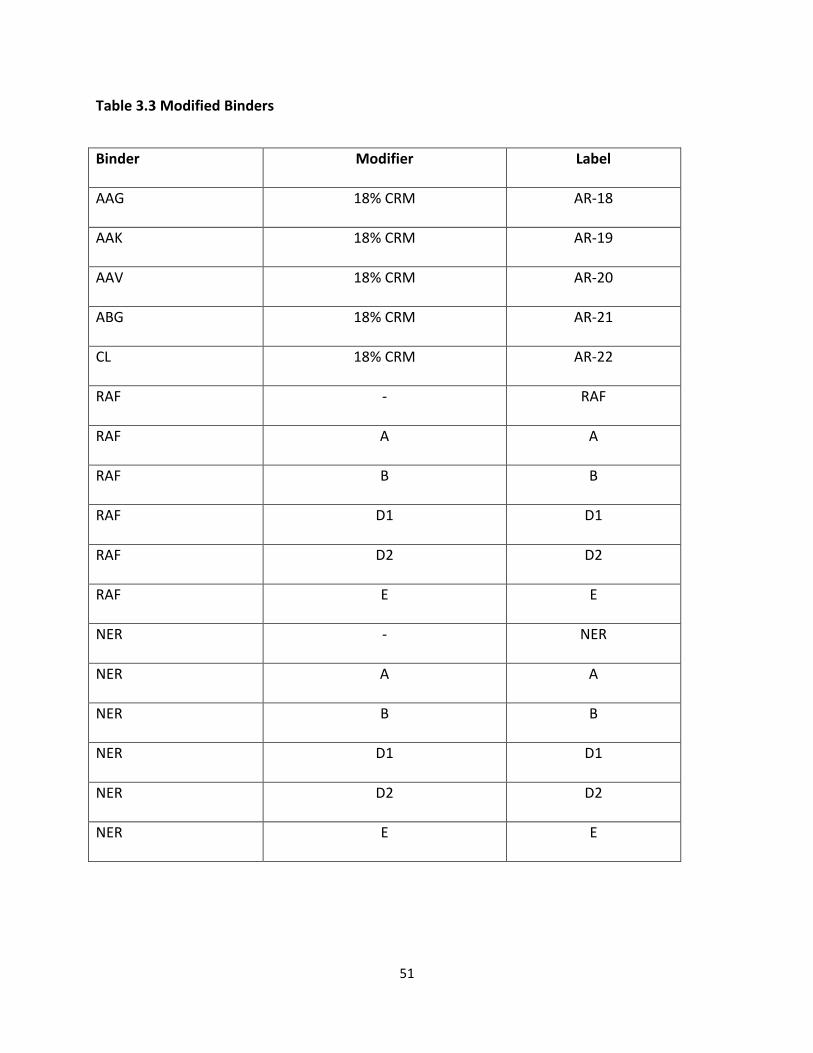
51
Table 3.3 Modified Binders
Binder Modifier Label
AAG 18% CRM AR-18
AAK 18% CRM AR-19
AAV 18% CRM AR-20
ABG 18% CRM AR-21
CL 18% CRM AR-22
RAF - RAF
RAF A A
RAF B B
RAF D1 D1
RAF D2 D2
RAF E E
NER - NER
NER A A
NER B B
NER D1 D1
NER D2 D2
NER E E
52
3.2 Preparation of Modified Asphalt Binders
3.2.1 Mixing
Crumb rubber modifier (CRM) passing the 600 micron (30 Mesh) screen was obtained from
Liberty Tire Recycling in Brantford, Ontario, and added at 18% by weight of different asphalt
binders. The 1% warm asphalt additives were added to asphalts. Batches were prepared by
mixing the base asphalt, warm additives, and CRM at temperatures between 180°C and 190°C
for a minimum of one hour under moderate shear.
When rubber modified asphalt is produced it interacts and affects asphalt by two
different ways. These two ways are particle swelling and degradation (devulcanization and
depolymerization). As asphalt interacts with rubber, rubber particle swell as much as two to
three times their original volume. This swelling occurs as the asphalt’s oily phase is absorbed by
the rubber at high temperatures to form a gel-like material. As the rubber starts swelling there
is a huge increase in the viscosity of the system as compared to the neat asphalt or the asphalt
with unswollen rubber.
After a certain point, swelling of the rubber stops and the rubber starts to degrade and
disperse in the asphalt binder. The dispersion can be due to devulcanization and
depolymerization. Both of these chemical reactions break the bonds present in the rubber and
decrease its molecular weight [62].
53
3.3 Asphalt Cement Aging
An aging procedure was proposed to simulate short and long term field oxidative aging of
asphalt binders in order to understand the failure mechanism of asphalt pavement as per the
Strategic Highway Research Project that was concluded in the early 1990s. The development of
the Rolling Thin Film Oven (RTFO) and the Pressure Aging Vessel (PAV) was included in this
proposal. As a result of the effect of time, temperature, traffic load and environment the PAV
asphalt sample were used to simulate “in service” aging of binders whereas the RTFO samples
of asphalt binder is used to simulate short term aging (hot mixing of asphalt and aggregate)
[63].
3.3.1 Rolling Thin Film Oven (RFTO) Test
In this test a moving film of asphalt which is paced in a jar, is heated in an oven for 85 minutes
at 163°C (325°F). This test simulates short term aging of asphalt (Figure 3.1). The moving film is
created by placing the asphalt binder sample in a small jar and then placing the jar in a circular
metal carriage that rotates within the oven. The oven is preheated at an aging temperature of
163°C. Amount of sample used is 35 g which is then poured into each cylindrical bottle used for
RTFO. The carriages which hold RTFO tubes inside the instrument rotates at a rate of 15 rpm for
85 min and the air flow is maintained at 4000 mL/min as shown in Figure 3.1. After aging, the
mass change is calculated and the physical properties changes are measured [4].
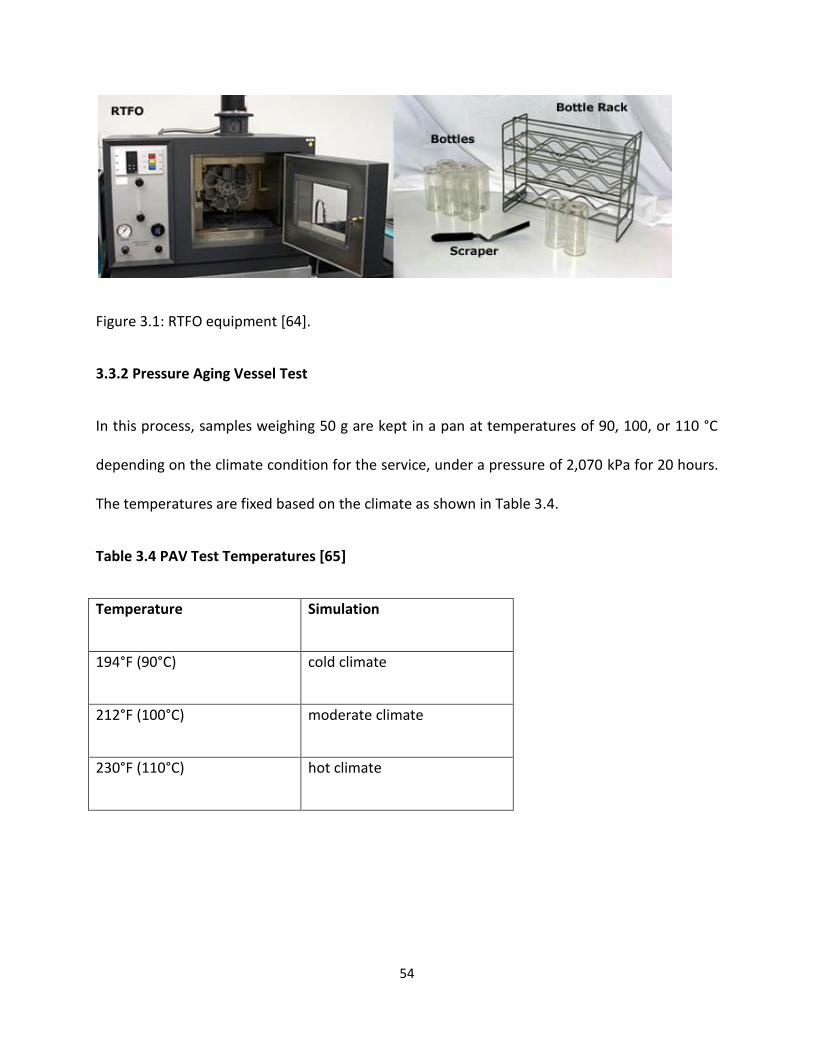
54
Figure 3.1: RTFO equipment [64].
3.3.2 Pressure Aging Vessel Test
In this process, samples weighing 50 g are kept in a pan at temperatures of 90, 100, or 110 °C
depending on the climate condition for the service, under a pressure of 2,070 kPa for 20 hours.
The temperatures are fixed based on the climate as shown in Table 3.4.
Table 3.4 PAV Test Temperatures [65]
Temperature Simulation
194°F (90°C) cold climate
212°F (100°C) moderate climate
230°F (110°C) hot climate
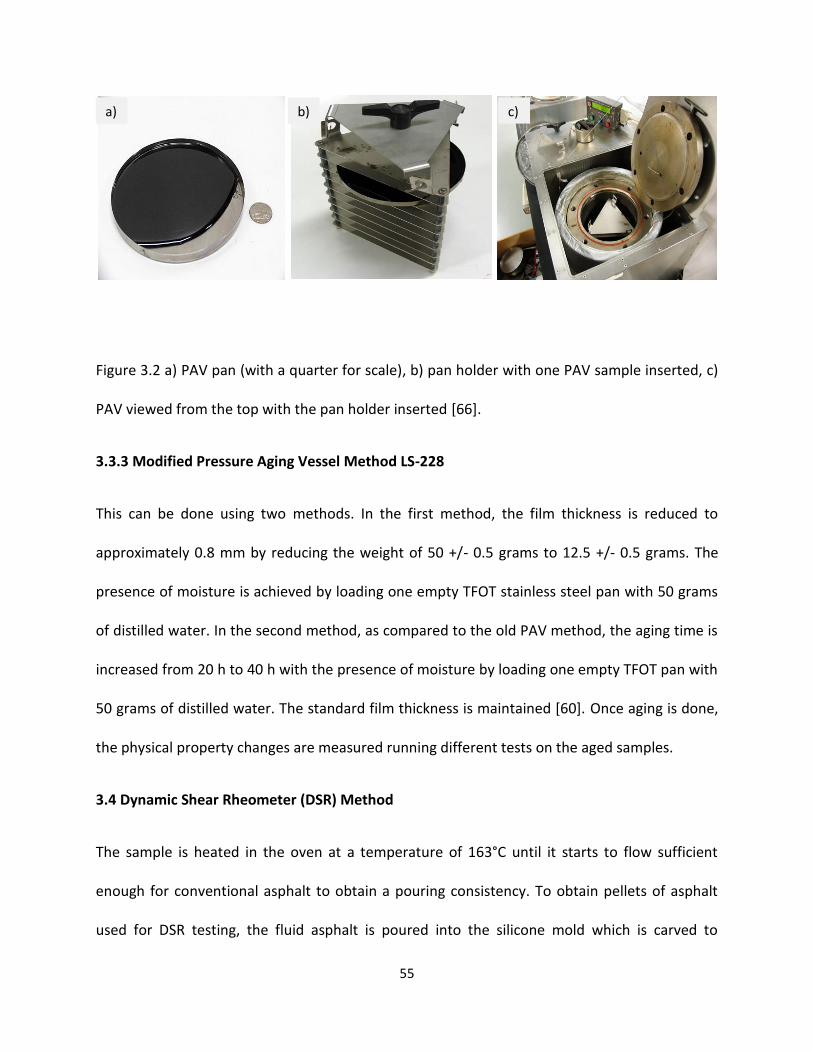
55
Figure 3.2 a) PAV pan (with a quarter for scale), b) pan holder with one PAV sample inserted, c)
PAV viewed from the top with the pan holder inserted [66].
3.3.3 Modified Pressure Aging Vessel Method LS-228
This can be done using two methods. In the first method, the film thickness is reduced to
approximately 0.8 mm by reducing the weight of 50 +/- 0.5 grams to 12.5 +/- 0.5 grams. The
presence of moisture is achieved by loading one empty TFOT stainless steel pan with 50 grams
of distilled water. In the second method, as compared to the old PAV method, the aging time is
increased from 20 h to 40 h with the presence of moisture by loading one empty TFOT pan with
50 grams of distilled water. The standard film thickness is maintained [60]. Once aging is done,
the physical property changes are measured running different tests on the aged samples.
3.4 Dynamic Shear Rheometer (DSR) Method
The sample is heated in the oven at a temperature of 163°C until it starts to flow sufficient
enough for conventional asphalt to obtain a pouring consistency. To obtain pellets of asphalt
used for DSR testing, the fluid asphalt is poured into the silicone mold which is carved to
a) b) c)

56
different diameters as shown in Figure 3.3. Proper geometry for the test is selected according
to the used sample once the instrument and computer are switched on as mentioned in Table
3.6. The instrument has two plates, one is called the movable plate which can do up and down
movements which holds the spindle and the other is a fixed plate to hold the sample. Before
putting the sample onto the fixed plate a zero gap setting is done between the fixed and the
moving plate by moving the spindle in the moveable plate downwards till it touches the fixed
plate, at the zero gap position the system detects and marks this setup as ‘zero gap’ when the
plates are just touching together. Now the plates are moved away at a random distance so that
sample can be placed at the bottom plate. After this temperature required for trimming is set in
the system and then the sample is placed on the bottom fixed plate. After placing the sample
the movable plate is brought close to the fixed plate to the trimming position. Then the excess
sample is trimmed at trimming position with movement of top plate by a hot spatula. Then
plates are reached to the measuring gap position which is mentioned in the table depending on
the type of sample used. This creates a slight bulge in the asphalt binder specimen’s perimeter.
Then testing is done at the required strain, frequency and measuring points details in the
testing window as per the method, depending on the sample used which is described below
[12].
The following Table 3.5 shows the typical DSR test parameters
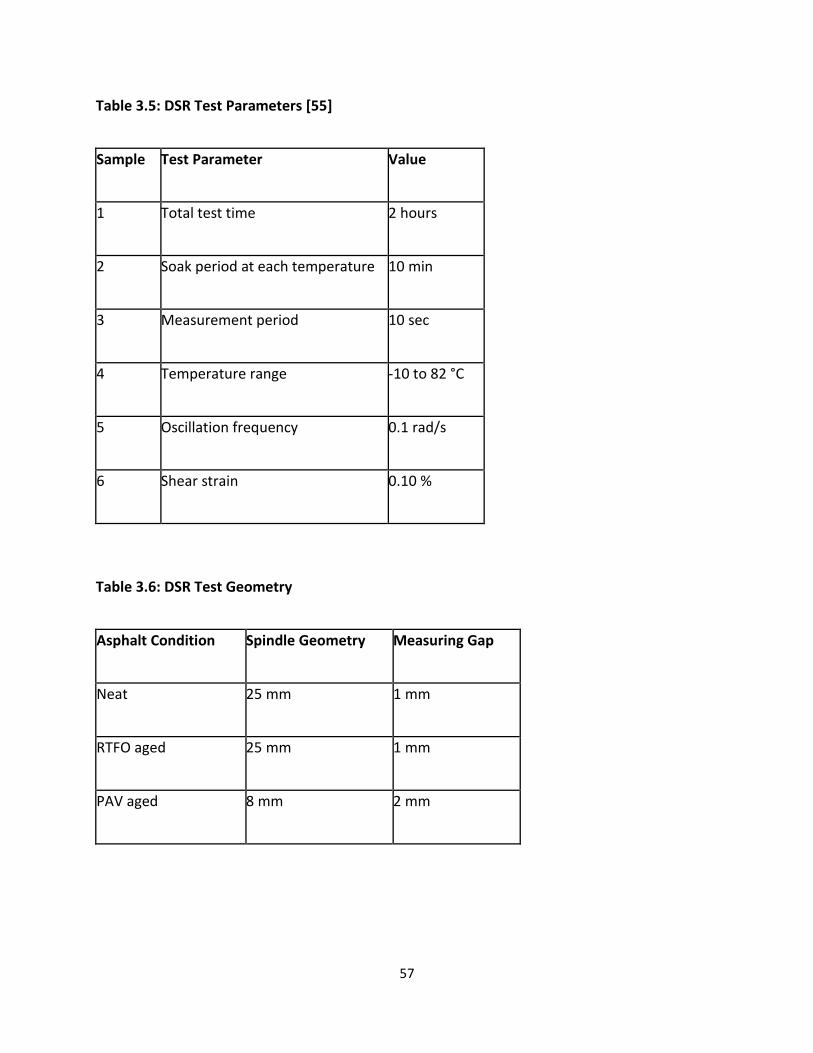
57
Table 3.5: DSR Test Parameters [55]
Sample Test Parameter Value
1 Total test time 2 hours
2 Soak period at each temperature 10 min
3 Measurement period 10 sec
4 Temperature range -10 to 82 °C
5 Oscillation frequency 0.1 rad/s
6 Shear strain 0.10 %
Table 3.6: DSR Test Geometry
Asphalt Condition Spindle Geometry Measuring Gap
Neat 25 mm 1 mm
RTFO aged 25 mm 1 mm
PAV aged 8 mm 2 mm

58
Figure 3.3 (A) DSR sample and (B) spindles [67].
The fresh and RTFO samples are used to find the high temperature grade (XX) for
determining the temperature to control rutting of the pavement. For these samples the 25 mm
diameter spindle is used and a 1 mm gap is maintained between the fixed and the moving plate
to run the test. Sample poured in the silicon mold is allowed to cool down and solidify before
placing to the bottom plate. Trimming tool is used to trim the excess sample. Based on the
material being tested (e.g., unaged binder, RTFO residue or PAV residue) the DSR software
determines a target torque at which the spindle is to be rotated. This torque is chosen to
ensure that measurements are within the specimen’s region of linear behavior. Hence for these
samples testing parameters like frequency, which is speed of oscillation (one cycle), generally
10 radians/second, loading time, and test temperature, etc., are given to the software to run
the testing as shown in Table 3.5. Results from the rheometer are produced automatically by
using the software. As per the AASHTO M320 specification, the high temperature PG grades are
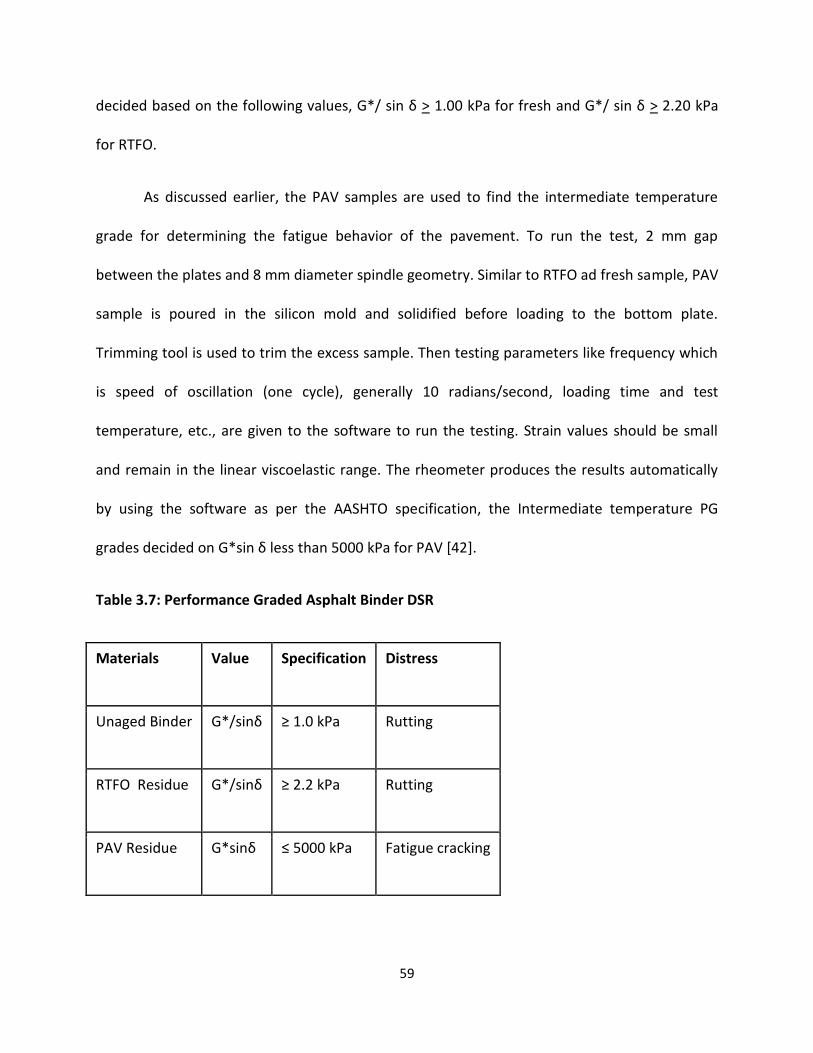
59
decided based on the following values, G*/ sin δ > 1.00 kPa for fresh and G*/ sin δ > 2.20 kPa
for RTFO.
As discussed earlier, the PAV samples are used to find the intermediate temperature
grade for determining the fatigue behavior of the pavement. To run the test, 2 mm gap
between the plates and 8 mm diameter spindle geometry. Similar to RTFO ad fresh sample, PAV
sample is poured in the silicon mold and solidified before loading to the bottom plate.
Trimming tool is used to trim the excess sample. Then testing parameters like frequency which
is speed of oscillation (one cycle), generally 10 radians/second, loading time and test
temperature, etc., are given to the software to run the testing. Strain values should be small
and remain in the linear viscoelastic range. The rheometer produces the results automatically
by using the software as per the AASHTO specification, the Intermediate temperature PG
grades decided on G*sin δ less than 5000 kPa for PAV [42].
Table 3.7: Performance Graded Asphalt Binder DSR
Materials Value Specification Distress
Unaged Binder G*/sinδ ≥ 1.0 kPa Rutting
RTFO Residue G*/sinδ ≥ 2.2 kPa Rutting
PAV Residue G*sinδ ≤ 5000 kPa Fatigue cracking

60
All data collected from DSR is exported to an Excel sheet and a template is used to find
the desired temperature. The test frequency and temperature, the values of complex shear
modulus (|G*|), in Pa, to three significant figures, values of |G*|sin δ and |G*|/sinδ were
reported using the template formed in the excl sheet.
3.4 Bending Beam Rheometer (BBR) Method
The BBR method uses PAV aged samples. The asphalt binder is heated and poured into the
mold which is shaped as beams as shown in Figure 2.12 A. The measure of the beam is 0.246 x
0.492 x 5.000 inches (6.25 x 12.5 x 127 mm) (Figure 2.11). After pouring, sample is left to cool
down for 45 to 60 minutes in the mold itself. After it has cooled down, sample is to be trimmed
down to get rid of extra asphalt on top of the beam. After that 1 hour of thermal conditioning in
an ethanol bath is done at desired temperature. Then, the asphalt beam is placed on the
supports to apply a three point load. Then a (0.22 lb) 980 mN seating load is applied for 1.0
second. Now the seating load is reduced to 0.008 lb (35 mN) and beam is allowed to recover for
20 seconds. Afterwards a test load of 0.22 lb (980 mN) is applied and maintained constant for
240 seconds. During this period, readings of deflection over time are recorded. Throughout the
collection of readings a graph of load and deflection versus time is plotted. The rheometer
software produces the results automatically. Parameters creep stiffness (S) which is the binder
resistance to creep loading is measured at 8, 15, 30, 60, 120, and 240 seconds and m-value
which is the asphalt stiffness change with time during the application of load is measured at 8,
15, 30, 60, 120, and 240 seconds [12].
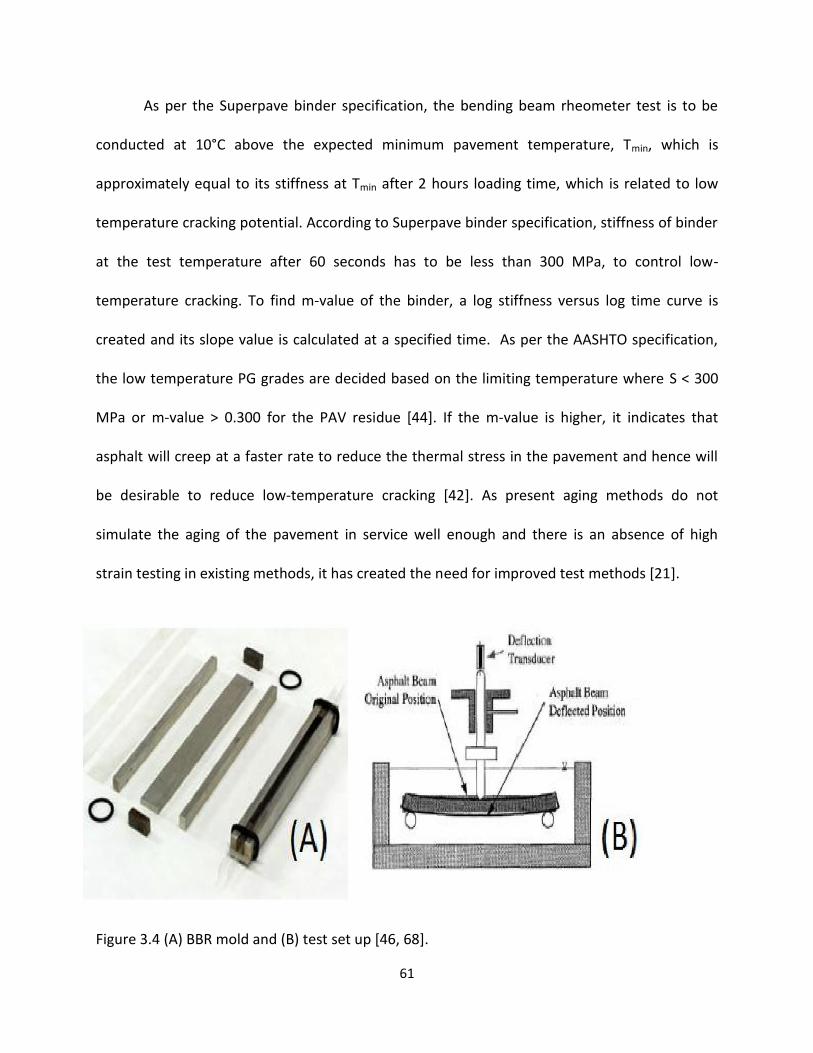
61
As per the Superpave binder specification, the bending beam rheometer test is to be
conducted at 10°C above the expected minimum pavement temperature, Tmin, which is
approximately equal to its stiffness at Tmin after 2 hours loading time, which is related to low
temperature cracking potential. According to Superpave binder specification, stiffness of binder
at the test temperature after 60 seconds has to be less than 300 MPa, to control low-
temperature cracking. To find m-value of the binder, a log stiffness versus log time curve is
created and its slope value is calculated at a specified time. As per the AASHTO specification,
the low temperature PG grades are decided based on the limiting temperature where S < 300
MPa or m-value > 0.300 for the PAV residue [44]. If the m-value is higher, it indicates that
asphalt will creep at a faster rate to reduce the thermal stress in the pavement and hence will
be desirable to reduce low-temperature cracking [42]. As present aging methods do not
simulate the aging of the pavement in service well enough and there is an absence of high
strain testing in existing methods, it has created the need for improved test methods [21].
Figure 3.4 (A) BBR mold and (B) test set up [46, 68].

62
3.5 Extended Bending Beam Rheometer (eBBR) Method LS-308
Physical hardening of asphalt at low temperature can increase over time and can vary at
different temperatures. As the regular BBR protocol only covers one hour conditioning of the
asphalt it cannot deal with the gradual hardening phenomenon which typically occurs over
periods of days, weeks and months. In the extended BBR method, a sample is conditioned for
one hour, one day, and 3 days, so that it can cause severe grade losses in the asphalt, especially
in poor quality asphalt cements which contain large quantities of wax and unstable asphaltene
dispersions. In the extended BBR, the conditioning temperatures T1 and T2 are fixed as follows:
T1 = Tdesign + 10; and
T2 = Tdesign + 20.
In order to determine an exact grade according to AASHTO M320 criteria both pass and
fail temperatures are selected by interpolation. The grade temperature and subsequent grade
losses are calculated at the end of each conditioning period. The warmest minus the coldest
limiting temperature (where S reaches 300 MPa or m reaches 0.3) is the worst grade loss. This
method is designed not to perfectly correlate with low temperature cracking distress but to
provide a high degree of confidence that thermal cracking is largely avoided [4].
3.6 Double-Edge Notched Tension (DENT) Test LS-299
The test measures the essential work of failure, the plastic work of failure, and an approximate
critical crack tip opening displacement (CTOD), at a specified temperature and rate of loading
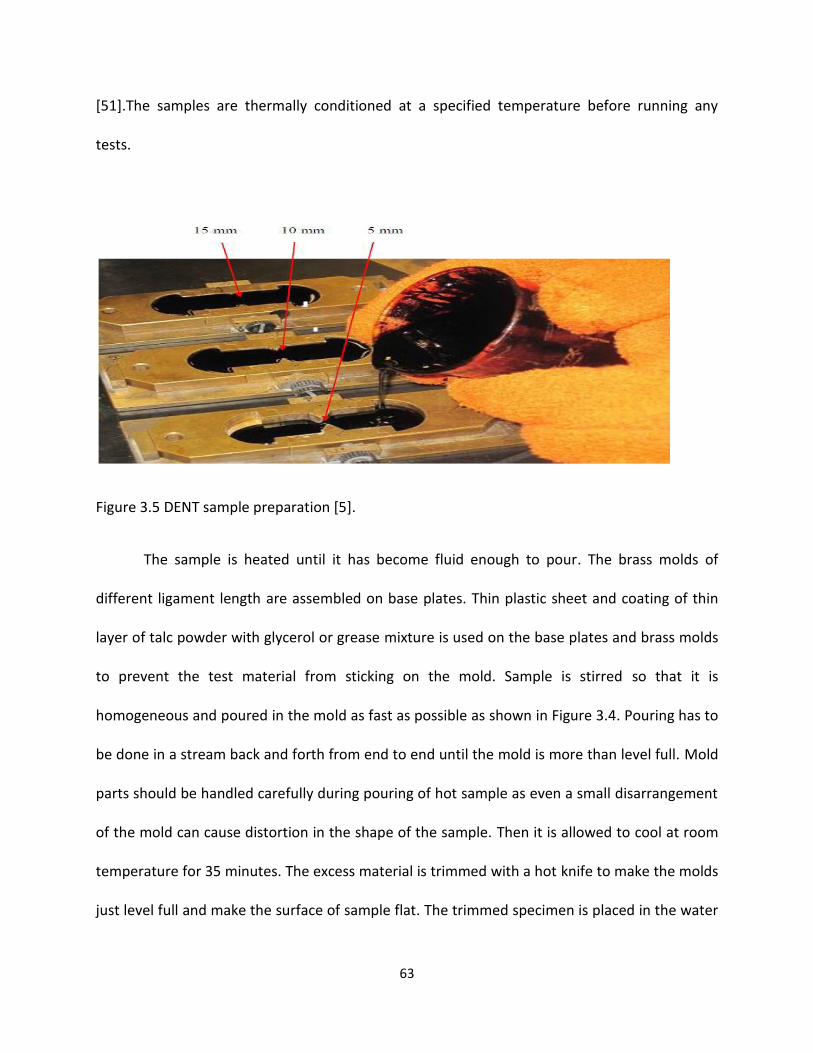
63
[51].The samples are thermally conditioned at a specified temperature before running any
tests.
Figure 3.5 DENT sample preparation [5].
The sample is heated until it has become fluid enough to pour. The brass molds of
different ligament length are assembled on base plates. Thin plastic sheet and coating of thin
layer of talc powder with glycerol or grease mixture is used on the base plates and brass molds
to prevent the test material from sticking on the mold. Sample is stirred so that it is
homogeneous and poured in the mold as fast as possible as shown in Figure 3.4. Pouring has to
be done in a stream back and forth from end to end until the mold is more than level full. Mold
parts should be handled carefully during pouring of hot sample as even a small disarrangement
of the mold can cause distortion in the shape of the sample. Then it is allowed to cool at room
temperature for 35 minutes. The excess material is trimmed with a hot knife to make the molds
just level full and make the surface of sample flat. The trimmed specimen is placed in the water
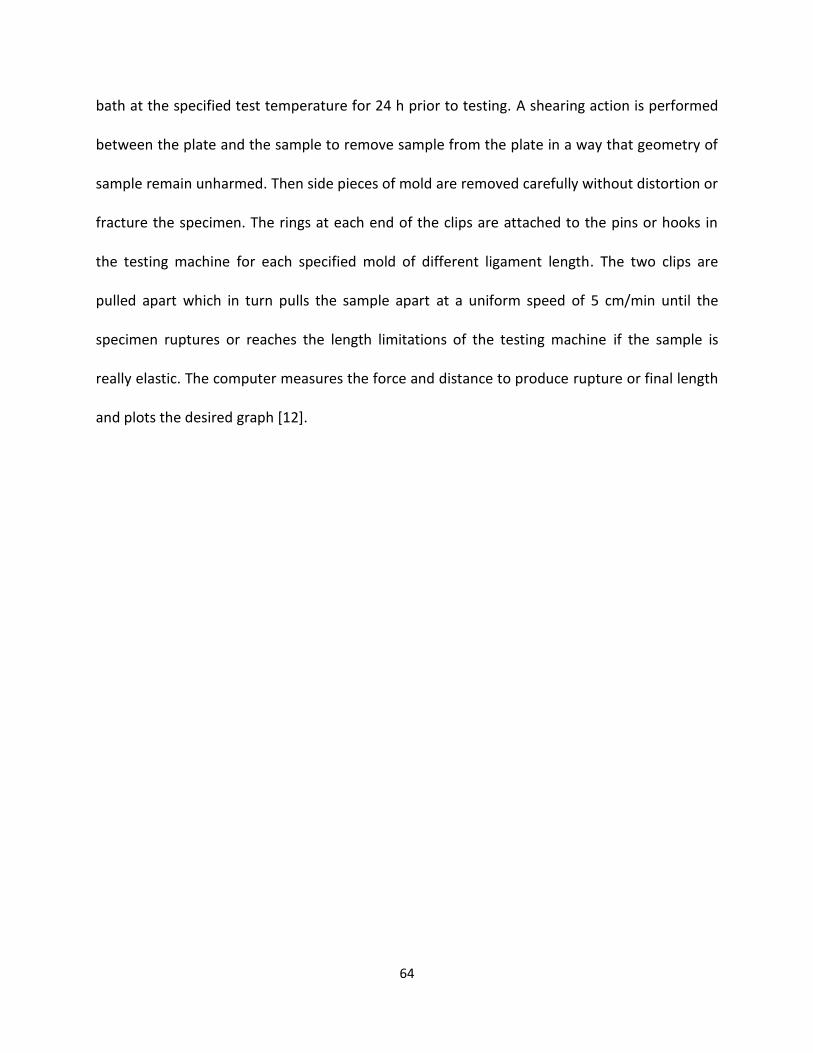
64
bath at the specified test temperature for 24 h prior to testing. A shearing action is performed
between the plate and the sample to remove sample from the plate in a way that geometry of
sample remain unharmed. Then side pieces of mold are removed carefully without distortion or
fracture the specimen. The rings at each end of the clips are attached to the pins or hooks in
the testing machine for each specified mold of different ligament length. The two clips are
pulled apart which in turn pulls the sample apart at a uniform speed of 5 cm/min until the
specimen ruptures or reaches the length limitations of the testing machine if the sample is
really elastic. The computer measures the force and distance to produce rupture or final length
and plots the desired graph [12].

65
CHAPTER 4
RESULTS AND DISCUSSION
4.1 Dynamic Shear Analysis
4.1.1 High Temperature Grading
California Valley, Boscan, Alaska North Slope, Laguna and Cold Lake, RAF and NER binders and
their compositions with various warm mix additives and crumb rubber were aged in both the
rolling thin film oven (RTFO) and pressure aging vessel (PAV) as per standard protocols. All the
SuperpaveTM grading properties and other properties of interest were determined on the
residues obtained from RTFO and PAV. All the unaged and RTFO residues were tested by using a
TA Instruments AR2000ex DSR to determine their high temperature grades. Similarly,
intermediate grades were determined for the PAV residue in the DSR.
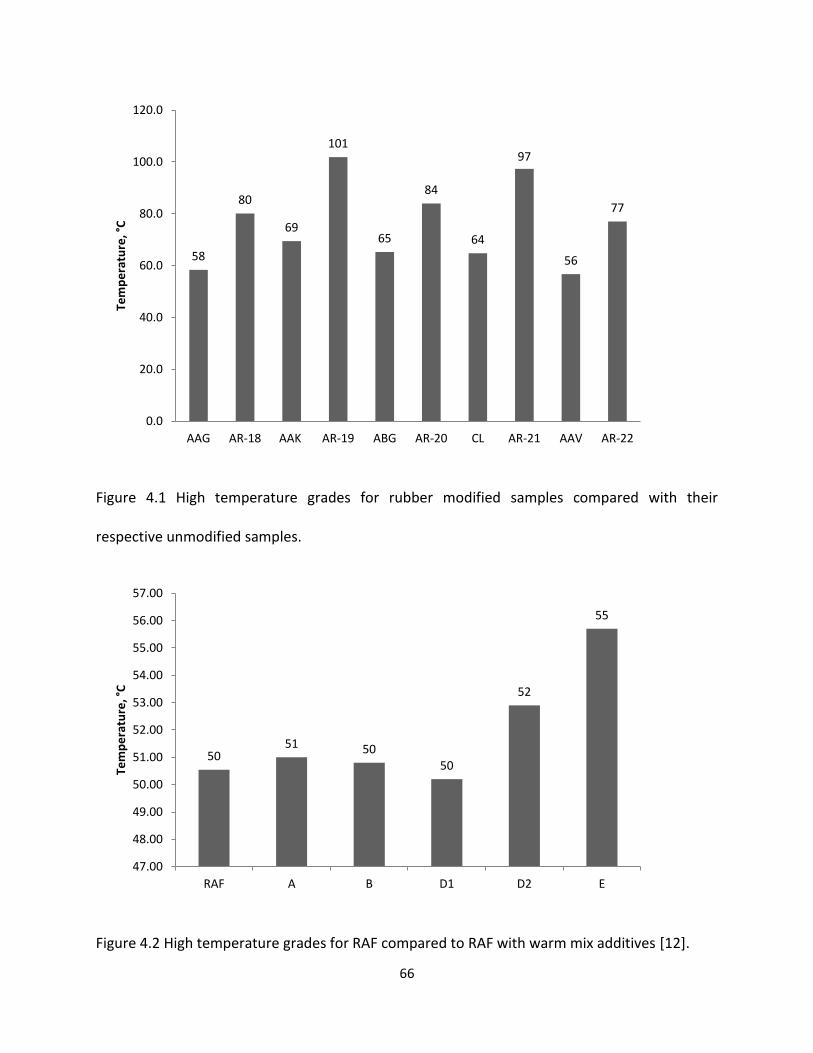
66
Figure 4.1 High temperature grades for rubber modified samples compared with their
respective unmodified samples.
Figure 4.2 High temperature grades for RAF compared to RAF with warm mix additives [12].
58
80
69
101
65
84
64
97
56
77
0.0
20.0
40.0
60.0
80.0
100.0
120.0
AAG AR-18 AAK AR-19 ABG AR-20 CL AR-21 AAV AR-22
Tem
pe
ratu
re, °
C
50 51 50
50
52
55
47.00
48.00
49.00
50.00
51.00
52.00
53.00
54.00
55.00
56.00
57.00
RAF A B D1 D2 E
Tem
pe
ratu
re, °
C
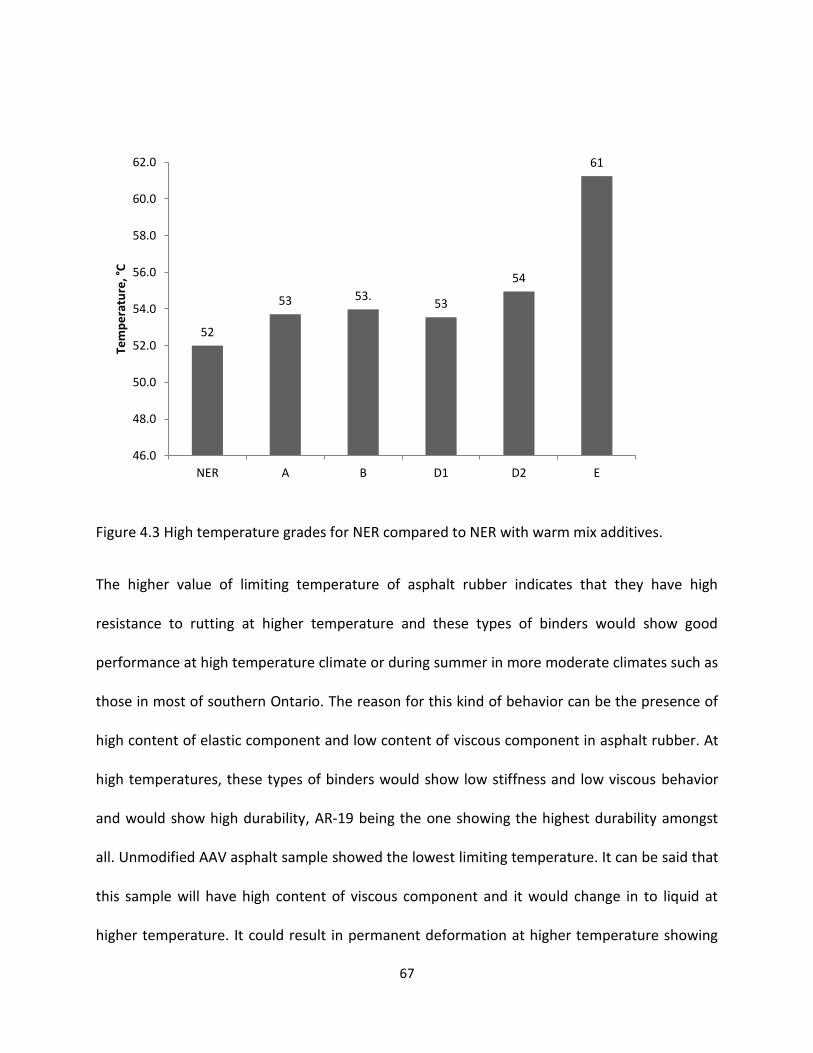
67
Figure 4.3 High temperature grades for NER compared to NER with warm mix additives.
The higher value of limiting temperature of asphalt rubber indicates that they have high
resistance to rutting at higher temperature and these types of binders would show good
performance at high temperature climate or during summer in more moderate climates such as
those in most of southern Ontario. The reason for this kind of behavior can be the presence of
high content of elastic component and low content of viscous component in asphalt rubber. At
high temperatures, these types of binders would show low stiffness and low viscous behavior
and would show high durability, AR-19 being the one showing the highest durability amongst
all. Unmodified AAV asphalt sample showed the lowest limiting temperature. It can be said that
this sample will have high content of viscous component and it would change in to liquid at
higher temperature. It could result in permanent deformation at higher temperature showing
52
53 53. 53
54
61
46.0
48.0
50.0
52.0
54.0
56.0
58.0
60.0
62.0
NER A B D1 D2 E
Tem
pe
ratu
re, °
C
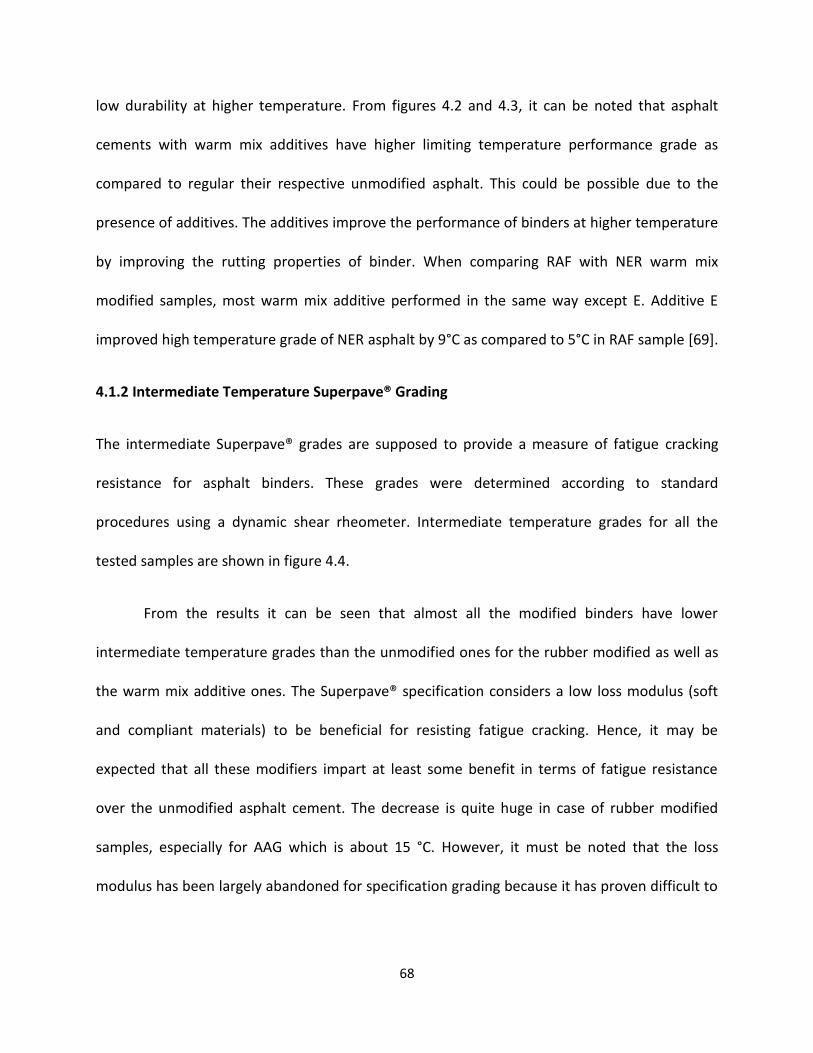
68
low durability at higher temperature. From figures 4.2 and 4.3, it can be noted that asphalt
cements with warm mix additives have higher limiting temperature performance grade as
compared to regular their respective unmodified asphalt. This could be possible due to the
presence of additives. The additives improve the performance of binders at higher temperature
by improving the rutting properties of binder. When comparing RAF with NER warm mix
modified samples, most warm mix additive performed in the same way except E. Additive E
improved high temperature grade of NER asphalt by 9°C as compared to 5°C in RAF sample [69].
4.1.2 Intermediate Temperature Superpave® Grading
The intermediate Superpave® grades are supposed to provide a measure of fatigue cracking
resistance for asphalt binders. These grades were determined according to standard
procedures using a dynamic shear rheometer. Intermediate temperature grades for all the
tested samples are shown in figure 4.4.
From the results it can be seen that almost all the modified binders have lower
intermediate temperature grades than the unmodified ones for the rubber modified as well as
the warm mix additive ones. The Superpave® specification considers a low loss modulus (soft
and compliant materials) to be beneficial for resisting fatigue cracking. Hence, it may be
expected that all these modifiers impart at least some benefit in terms of fatigue resistance
over the unmodified asphalt cement. The decrease is quite huge in case of rubber modified
samples, especially for AAG which is about 15 °C. However, it must be noted that the loss
modulus has been largely abandoned for specification grading because it has proven difficult to
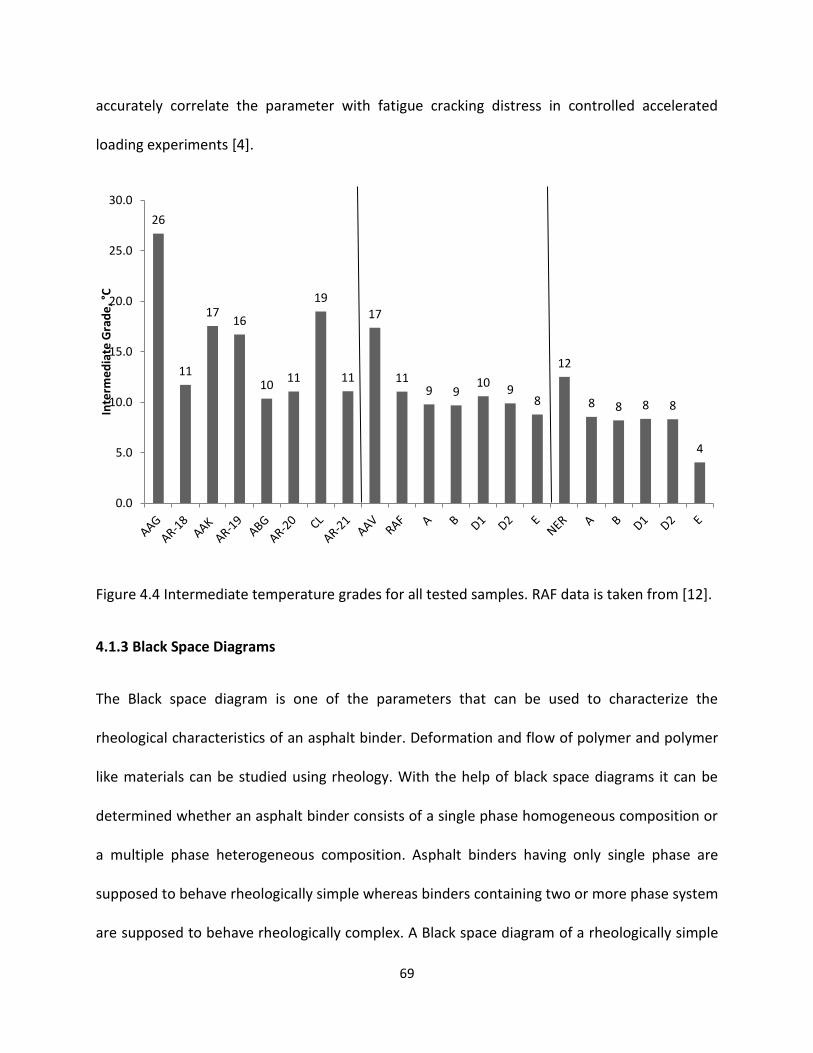
69
accurately correlate the parameter with fatigue cracking distress in controlled accelerated
loading experiments [4].
Figure 4.4 Intermediate temperature grades for all tested samples. RAF data is taken from [12].
4.1.3 Black Space Diagrams
The Black space diagram is one of the parameters that can be used to characterize the
rheological characteristics of an asphalt binder. Deformation and flow of polymer and polymer
like materials can be studied using rheology. With the help of black space diagrams it can be
determined whether an asphalt binder consists of a single phase homogeneous composition or
a multiple phase heterogeneous composition. Asphalt binders having only single phase are
supposed to behave rheologically simple whereas binders containing two or more phase system
are supposed to behave rheologically complex. A Black space diagram of a rheologically simple
26
11
17 16
10 11
19
11
17
11 9 9
10 9
8
12
8 8 8 8
4
0.0
5.0
10.0
15.0
20.0
25.0
30.0
Inte
rme
dia
te G
rad
e, °
C
70
binder has a smooth progression of curves at different temperatures and there is no any
anomalous behavior in the curve. On the other hand, for a rheologically complex binder, black
space diagram does not have a smooth progression of curves at different temperatures, and
can be discontinuous at different temperatures. A phase separation is supposed to take place in
these types of binders. A Black space diagram basically uses the change in phase angle with
respect to the complex modulus at different temperatures to find some rheological conclusions
about the binder. It is easy to predict and quantify the rheological simple material but very
difficult for rheologically complex asphalt binders because their behavior does not resemble
conventional viscoelastic materials [69].
A Black space diagram is obtained by plotting the phase angle versus the complex
modulus in a log scale graph plotted according to a frequency sweep done at various
temperatures. In our study, the frequency sweep is done from 0.1 to 10 rad/s at various
temperatures from 34 to 82°C. Phase angle values at high temperatures show the viscous
behavior of binders, which in turn relates to their rutting behavior. Complex modulus (stiffness)
values at low temperatures shows the elastic behavior of binders, which in turn related to
cracking behavior. Generally, asphalt cement can be considered as good quality if it has a high
phase angle at high stiffness which means that it is resistible to thermal cracking due to stress
relaxation and a low phase angle at low stiffness which means that it is more resistible to
rutting [12].
The black space diagrams for unaged, RTFO-aged and PAV-aged unmodified AAG sample
is shown in figure 4.5 which is acquired by the frequency sweep done at various temperatures

71
from 34 to 82°C. It is clear that the data follows a smooth line within the Black space and this
suggests that the material is rheologically simple.
Figure 4.5 Black space diagram for Unaged, RTFO-aged and PAV-aged unmodified AAG sample
AAG sample.
50
60
70
80
90
100
110
0 2 4 6
Ph
ase
An
gle,
°
log(G*)
Unaged - 34 degrees Celsius Unaged - 46 degrees Celsius Unaged - 58 degrees Celsius Unaged - 70 degrees Celsius Unaged - 82 degrees Celsius RTFO - 34 degrees Celsius RTFO - 46 degrees Celsius RTFO - 58 degrees Celsius RTFO - 70 degrees Celsius RTFO - 82 degrees Celsius PAV - 34 degrees Celsius PAV - 46 degrees Celsius PAV - 58 degrees Celsius
0
20
40
60
80
0 2 4 6
Ph
ase
An
gle
, °
log(G*)
Black Space Diagram: AR-18
Unaged RTFO PAV
50.00
70.00
90.00
110.00
0 2 4 6 8
Ph
ase
An
gle
, °
log(G*)
Black Space Diagram: AAK
Unaged RTFO PAV
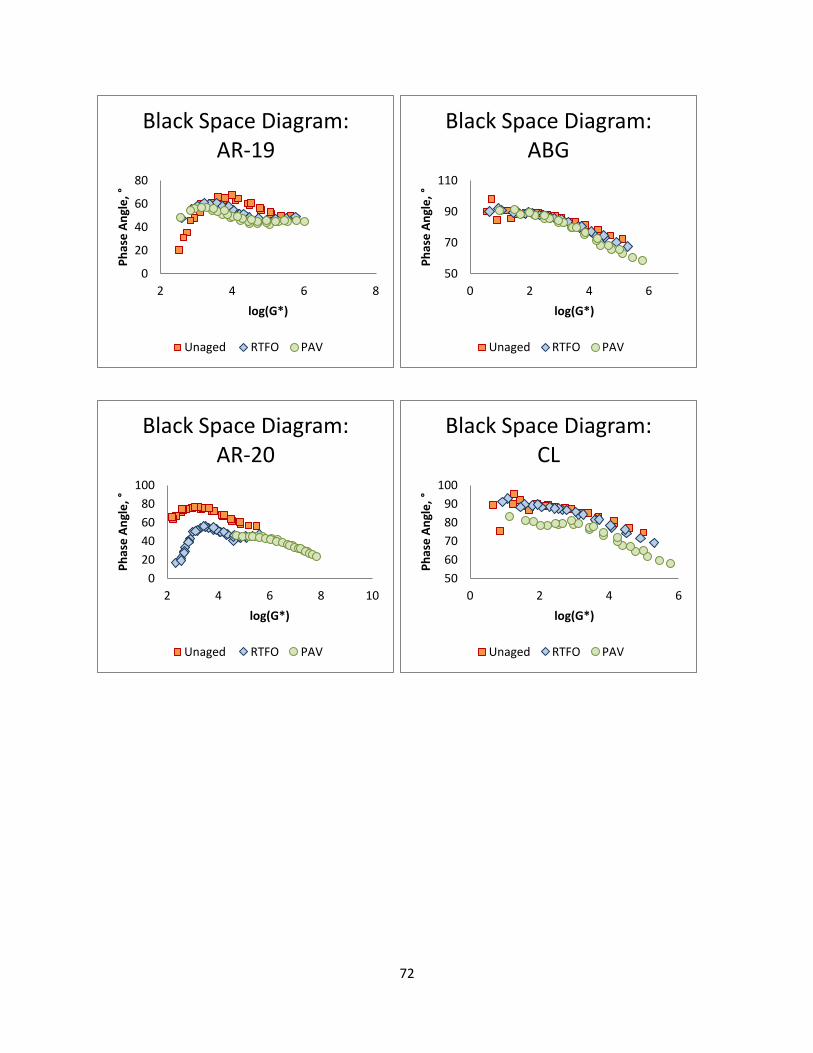
72
0
20
40
60
80
2 4 6 8
Ph
ase
An
gle
, °
log(G*)
Black Space Diagram: AR-19
Unaged RTFO PAV
50
70
90
110
0 2 4 6
Ph
ase
An
gle
, °
log(G*)
Black Space Diagram: ABG
Unaged RTFO PAV
0
20
40
60
80
100
2 4 6 8 10
Ph
ase
An
gle
, °
log(G*)
Black Space Diagram: AR-20
Unaged RTFO PAV
50
60
70
80
90
100
0 2 4 6
Ph
ase
An
gle
, °
log(G*)
Black Space Diagram: CL
Unaged RTFO PAV

73
0
20
40
60
80
0 5 10
Ph
ase
An
gle
, °
log(G*)
Black Space Diagram: AR-21
Unaged RTFO PAV
70
75
80
85
90
95
100
0 2 4 6
Ph
ase
An
gle
, °
log(G*)
Black Space Diagram: AAV
Unaged
RTFO
PAV
0
20
40
60
80
0 2 4 6
Ph
ase
An
gle
, °
log(G*)
Black Space Diagram: AR-22
Unaged RTFO
50
60
70
80
90
100
0 2 4 6
Ph
ase
An
gle
, °
log(G*)
Black Space Diagram: NER
Unaged RTFO PAV
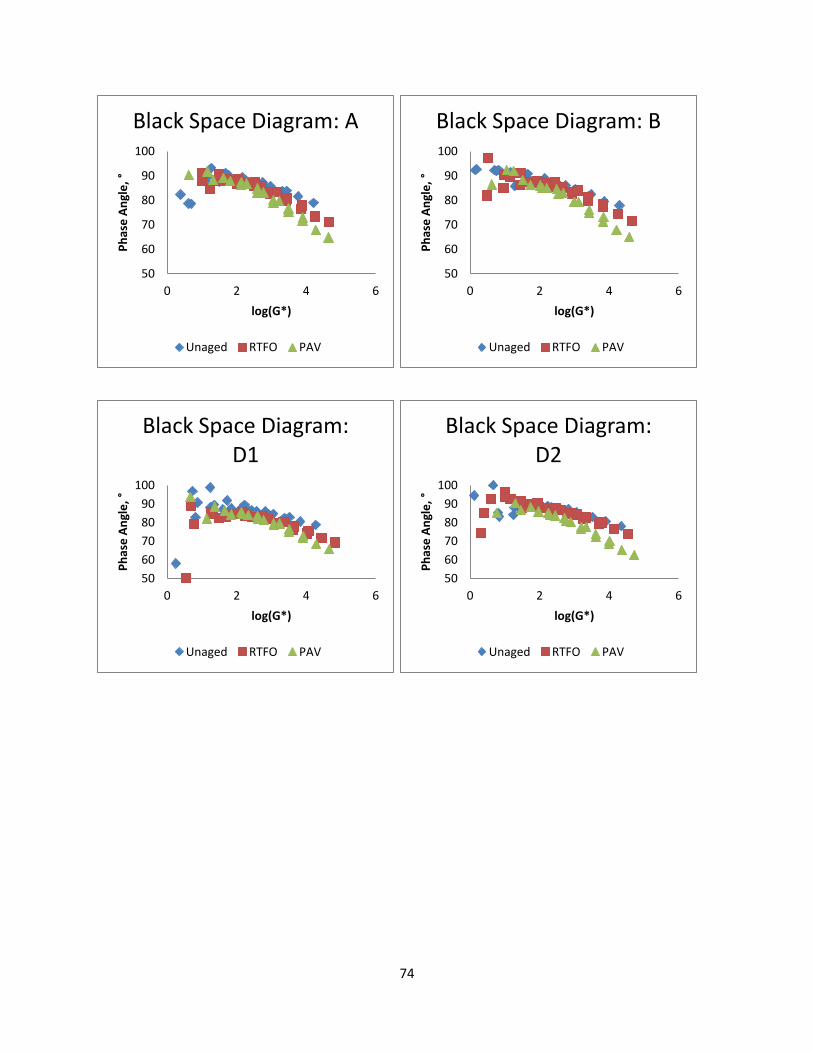
74
50
60
70
80
90
100
0 2 4 6
Ph
ase
An
gle
, °
log(G*)
Black Space Diagram: A
Unaged RTFO PAV
50
60
70
80
90
100
0 2 4 6
Ph
ase
An
gle
, °
log(G*)
Black Space Diagram: B
Unaged RTFO PAV
50
60
70
80
90
100
0 2 4 6
Ph
ase
An
gle
, °
log(G*)
Black Space Diagram: D1
Unaged RTFO PAV
50
60
70
80
90
100
0 2 4 6
Ph
ase
An
gle
, °
log(G*)
Black Space Diagram: D2
Unaged RTFO PAV
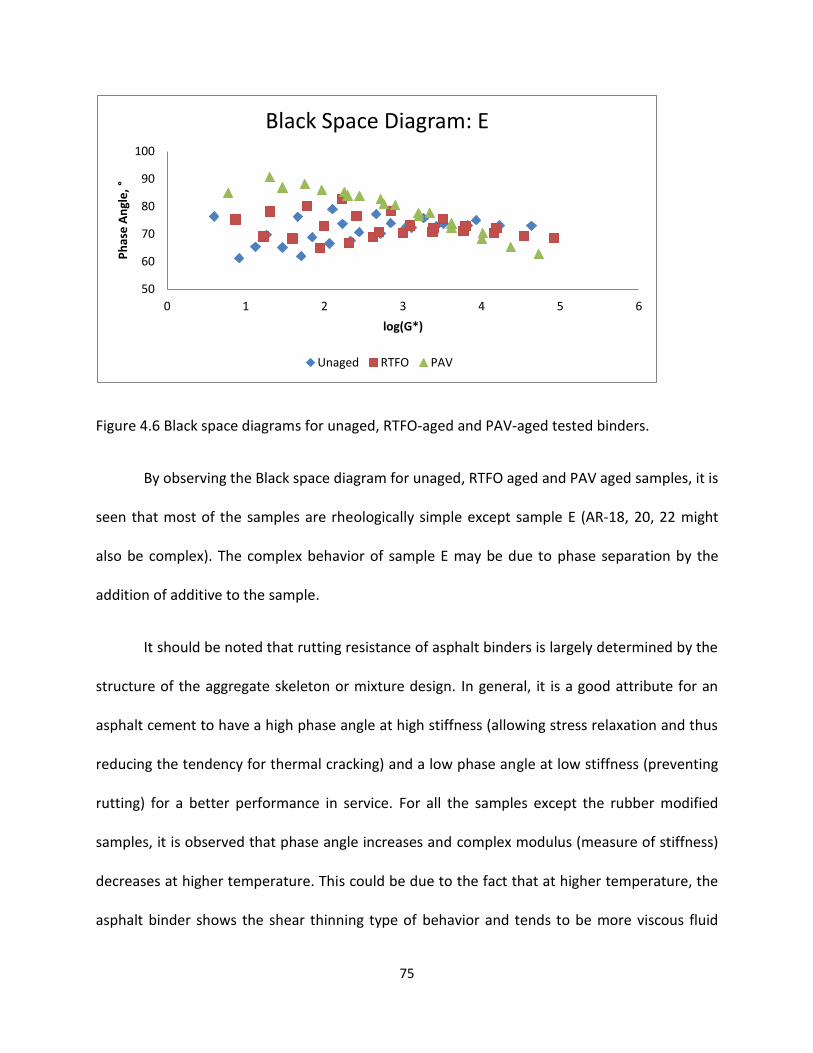
75
Figure 4.6 Black space diagrams for unaged, RTFO-aged and PAV-aged tested binders.
By observing the Black space diagram for unaged, RTFO aged and PAV aged samples, it is
seen that most of the samples are rheologically simple except sample E (AR-18, 20, 22 might
also be complex). The complex behavior of sample E may be due to phase separation by the
addition of additive to the sample.
It should be noted that rutting resistance of asphalt binders is largely determined by the
structure of the aggregate skeleton or mixture design. In general, it is a good attribute for an
asphalt cement to have a high phase angle at high stiffness (allowing stress relaxation and thus
reducing the tendency for thermal cracking) and a low phase angle at low stiffness (preventing
rutting) for a better performance in service. For all the samples except the rubber modified
samples, it is observed that phase angle increases and complex modulus (measure of stiffness)
decreases at higher temperature. This could be due to the fact that at higher temperature, the
asphalt binder shows the shear thinning type of behavior and tends to be more viscous fluid
50
60
70
80
90
100
0 1 2 3 4 5 6
Ph
ase
An
gle
, °
log(G*)
Black Space Diagram: E
Unaged RTFO PAV
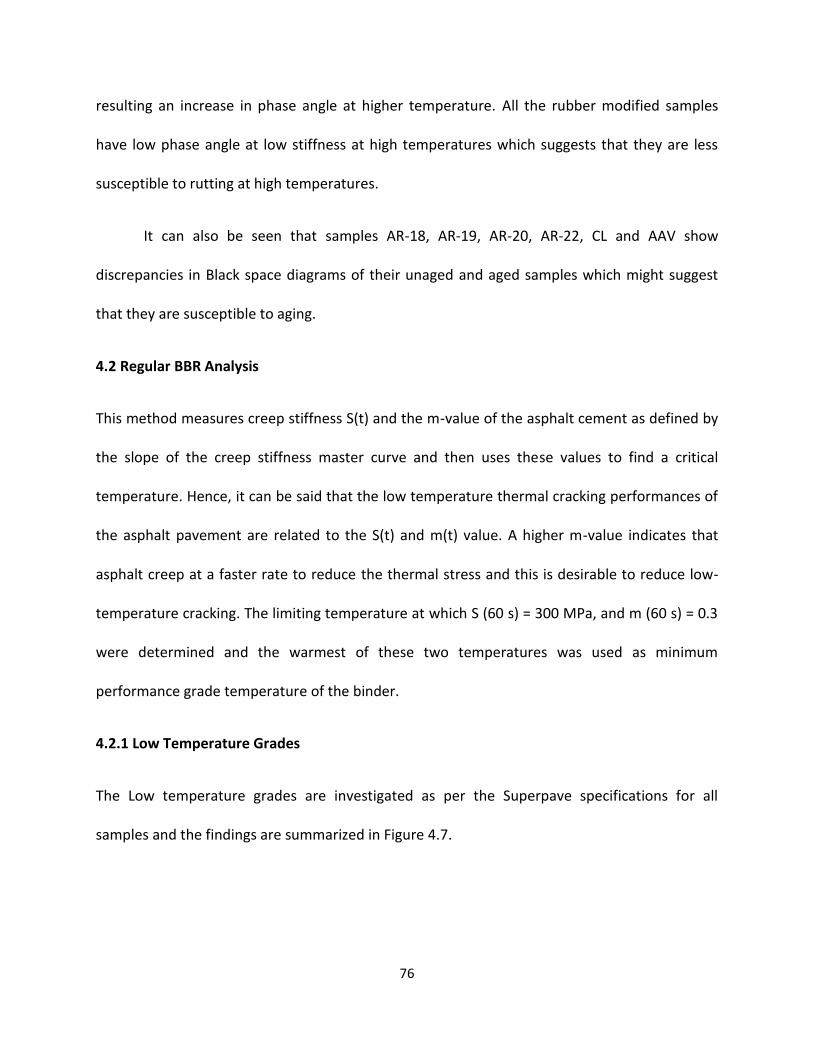
76
resulting an increase in phase angle at higher temperature. All the rubber modified samples
have low phase angle at low stiffness at high temperatures which suggests that they are less
susceptible to rutting at high temperatures.
It can also be seen that samples AR-18, AR-19, AR-20, AR-22, CL and AAV show
discrepancies in Black space diagrams of their unaged and aged samples which might suggest
that they are susceptible to aging.
4.2 Regular BBR Analysis
This method measures creep stiffness S(t) and the m-value of the asphalt cement as defined by
the slope of the creep stiffness master curve and then uses these values to find a critical
temperature. Hence, it can be said that the low temperature thermal cracking performances of
the asphalt pavement are related to the S(t) and m(t) value. A higher m-value indicates that
asphalt creep at a faster rate to reduce the thermal stress and this is desirable to reduce low-
temperature cracking. The limiting temperature at which S (60 s) = 300 MPa, and m (60 s) = 0.3
were determined and the warmest of these two temperatures was used as minimum
performance grade temperature of the binder.
4.2.1 Low Temperature Grades
The Low temperature grades are investigated as per the Superpave specifications for all
samples and the findings are summarized in Figure 4.7.
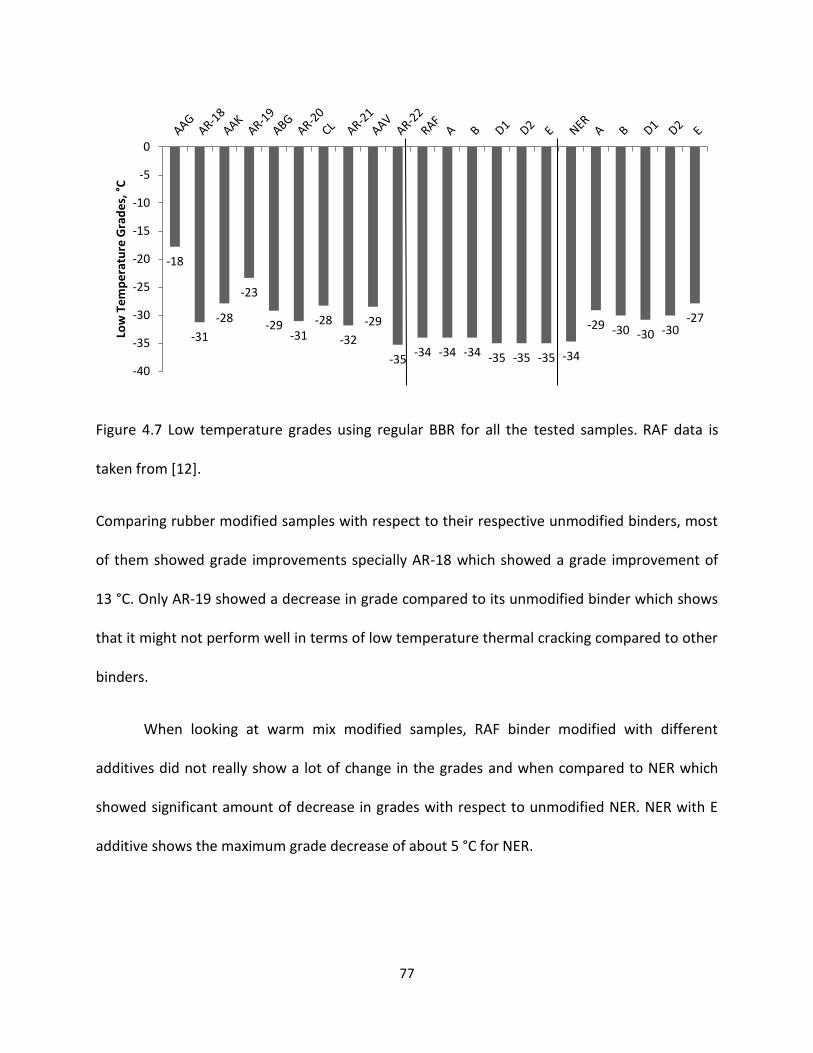
77
Figure 4.7 Low temperature grades using regular BBR for all the tested samples. RAF data is
taken from [12].
Comparing rubber modified samples with respect to their respective unmodified binders, most
of them showed grade improvements specially AR-18 which showed a grade improvement of
13 °C. Only AR-19 showed a decrease in grade compared to its unmodified binder which shows
that it might not perform well in terms of low temperature thermal cracking compared to other
binders.
When looking at warm mix modified samples, RAF binder modified with different
additives did not really show a lot of change in the grades and when compared to NER which
showed significant amount of decrease in grades with respect to unmodified NER. NER with E
additive shows the maximum grade decrease of about 5 °C for NER.
-18
-31
-28
-23
-29 -31
-28
-32
-29
-35 -34 -34 -34 -35 -35 -35 -34
-29 -30 -30 -30 -27
-40
-35
-30
-25
-20
-15
-10
-5
0
Low
Te
mp
era
ture
Gra
de
s, °
C
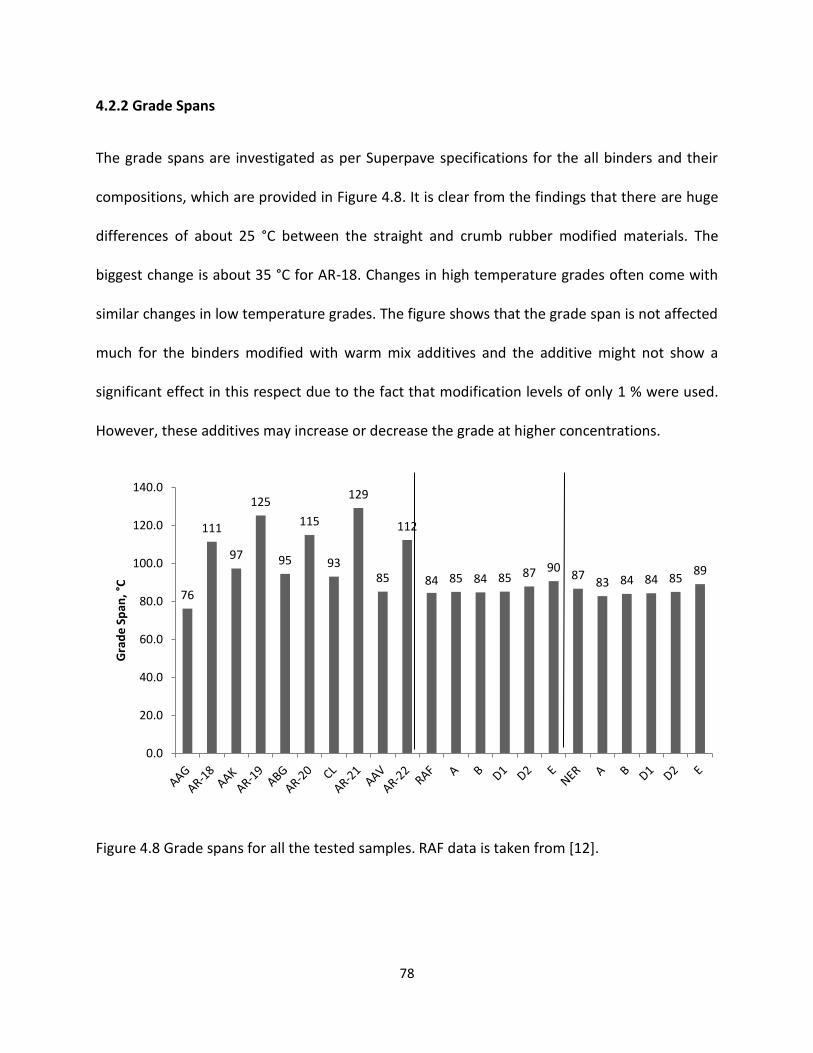
78
4.2.2 Grade Spans
The grade spans are investigated as per Superpave specifications for the all binders and their
compositions, which are provided in Figure 4.8. It is clear from the findings that there are huge
differences of about 25 °C between the straight and crumb rubber modified materials. The
biggest change is about 35 °C for AR-18. Changes in high temperature grades often come with
similar changes in low temperature grades. The figure shows that the grade span is not affected
much for the binders modified with warm mix additives and the additive might not show a
significant effect in this respect due to the fact that modification levels of only 1 % were used.
However, these additives may increase or decrease the grade at higher concentrations.
Figure 4.8 Grade spans for all the tested samples. RAF data is taken from [12].
76
111
97
125
95
115
93
129
85
112
84 85 84 85 87 90 87
83 84 84 85 89
0.0
20.0
40.0
60.0
80.0
100.0
120.0
140.0
Gra
de
Sp
an,
°C
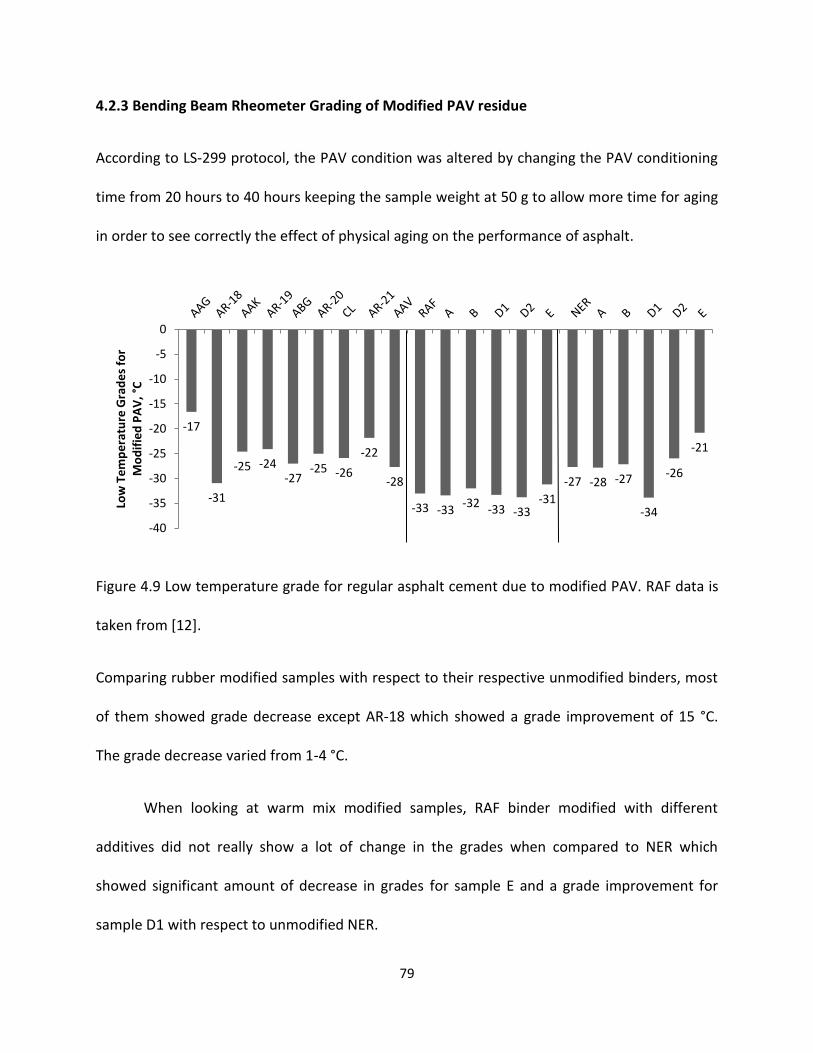
79
4.2.3 Bending Beam Rheometer Grading of Modified PAV residue
According to LS-299 protocol, the PAV condition was altered by changing the PAV conditioning
time from 20 hours to 40 hours keeping the sample weight at 50 g to allow more time for aging
in order to see correctly the effect of physical aging on the performance of asphalt.
Figure 4.9 Low temperature grade for regular asphalt cement due to modified PAV. RAF data is
taken from [12].
Comparing rubber modified samples with respect to their respective unmodified binders, most
of them showed grade decrease except AR-18 which showed a grade improvement of 15 °C.
The grade decrease varied from 1-4 °C.
When looking at warm mix modified samples, RAF binder modified with different
additives did not really show a lot of change in the grades when compared to NER which
showed significant amount of decrease in grades for sample E and a grade improvement for
sample D1 with respect to unmodified NER.
-17
-31
-25 -24 -27
-25 -26
-22
-28
-33 -33 -32 -33 -33
-31
-27 -28 -27
-34
-26
-21
-40
-35
-30
-25
-20
-15
-10
-5
0
Low
Te
mp
era
ture
Gra
de
s fo
r M
od
ifie
d P
AV
, °C
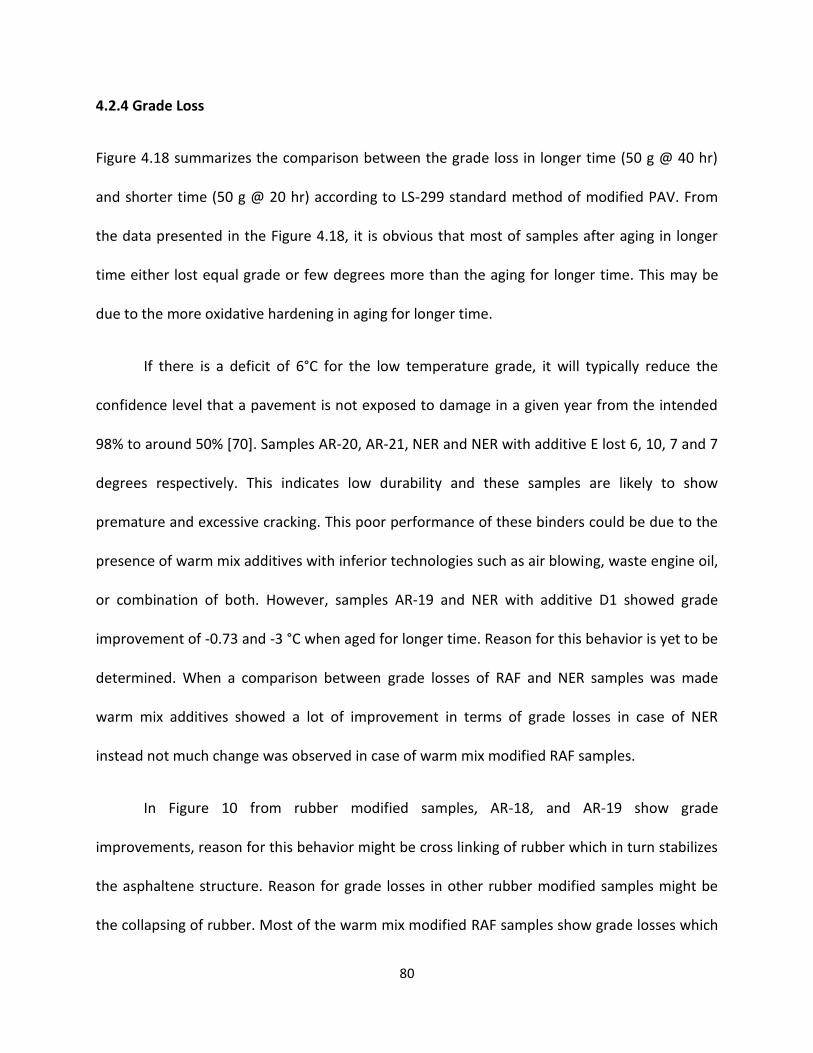
80
4.2.4 Grade Loss
Figure 4.18 summarizes the comparison between the grade loss in longer time (50 g @ 40 hr)
and shorter time (50 g @ 20 hr) according to LS-299 standard method of modified PAV. From
the data presented in the Figure 4.18, it is obvious that most of samples after aging in longer
time either lost equal grade or few degrees more than the aging for longer time. This may be
due to the more oxidative hardening in aging for longer time.
If there is a deficit of 6°C for the low temperature grade, it will typically reduce the
confidence level that a pavement is not exposed to damage in a given year from the intended
98% to around 50% [70]. Samples AR-20, AR-21, NER and NER with additive E lost 6, 10, 7 and 7
degrees respectively. This indicates low durability and these samples are likely to show
premature and excessive cracking. This poor performance of these binders could be due to the
presence of warm mix additives with inferior technologies such as air blowing, waste engine oil,
or combination of both. However, samples AR-19 and NER with additive D1 showed grade
improvement of -0.73 and -3 °C when aged for longer time. Reason for this behavior is yet to be
determined. When a comparison between grade losses of RAF and NER samples was made
warm mix additives showed a lot of improvement in terms of grade losses in case of NER
instead not much change was observed in case of warm mix modified RAF samples.
In Figure 10 from rubber modified samples, AR-18, and AR-19 show grade
improvements, reason for this behavior might be cross linking of rubber which in turn stabilizes
the asphaltene structure. Reason for grade losses in other rubber modified samples might be
the collapsing of rubber. Most of the warm mix modified RAF samples show grade losses which
81
can be due to collapse of the additive. Most of the warm mix modified samples show grade
improvements. Reason for this kind of behavior can be stabilization of asphaltene due to waste
engine oil present in the NER binder.
Figure 4.10 Grade losses due to PAV (50 g @ 40 hr) and PAV (50 g @ 20 hr) treatment for all
binders and their compositions. RAF data is taken from [12].
4.3 Extended BBR Data Analysis
4.3.1 LS- 308 Grades
The asphalt samples after regular BBR test were further tested according to Ontario’s extended
BBR protocol as described in the MTO standard test methods LS-308. This gives the significant
differences in the performance pavements in low temperatures. The asphalt binders were
conditioned for 72 hours not just for one hour at isothermal conditions, i.e. at temperature 10
°C and 20 °C above the pavement minimum low temperature grade and the binders were
tested in the same temperature. The limiting temperature where m (60) = 0.3 and S (60) = 300
1.2 0.3
3.3
-0.7
2.2
6.0
2.4
10.0
1 0.6
2 1.7 1.2
3.8
7.0
1.3
2.9
-3.0
4.1
7.1
-4
-2
0
2
4
6
8
10
12
Gra
de
Lo
sse
s, °
C
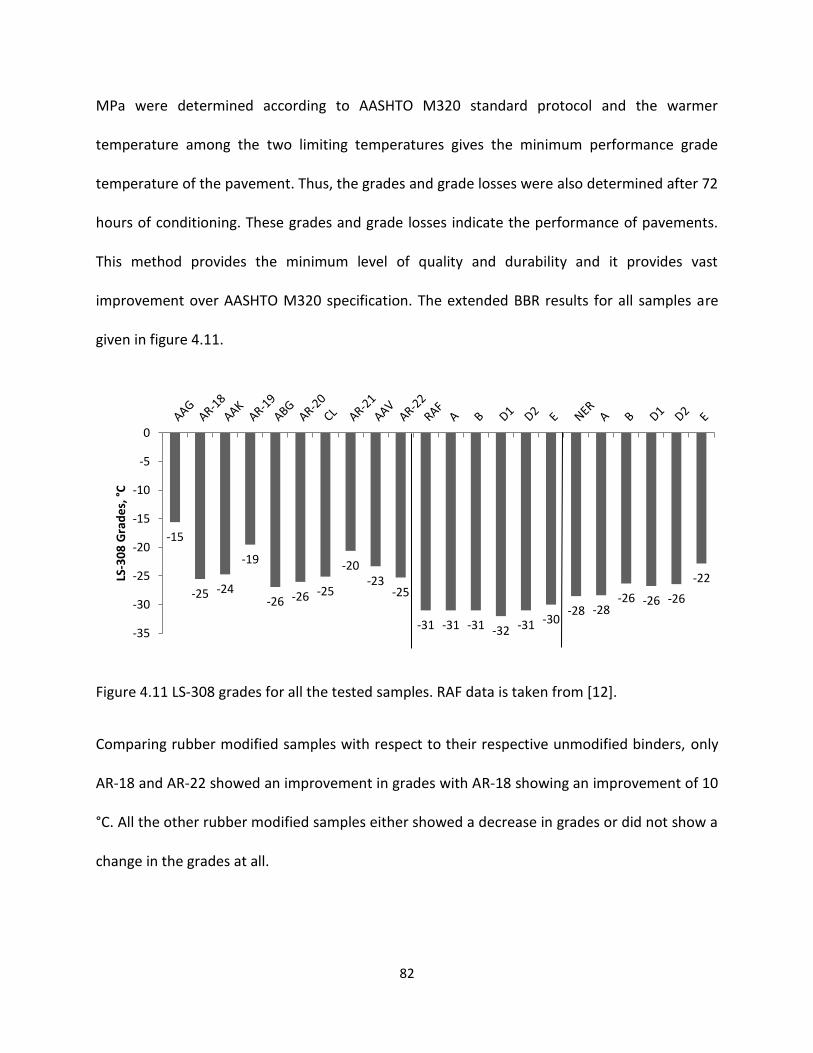
82
MPa were determined according to AASHTO M320 standard protocol and the warmer
temperature among the two limiting temperatures gives the minimum performance grade
temperature of the pavement. Thus, the grades and grade losses were also determined after 72
hours of conditioning. These grades and grade losses indicate the performance of pavements.
This method provides the minimum level of quality and durability and it provides vast
improvement over AASHTO M320 specification. The extended BBR results for all samples are
given in figure 4.11.
Figure 4.11 LS-308 grades for all the tested samples. RAF data is taken from [12].
Comparing rubber modified samples with respect to their respective unmodified binders, only
AR-18 and AR-22 showed an improvement in grades with AR-18 showing an improvement of 10
°C. All the other rubber modified samples either showed a decrease in grades or did not show a
change in the grades at all.
-15
-25 -24
-19
-26 -26 -25
-20 -23
-25
-31 -31 -31 -32 -31 -30 -28 -28
-26 -26 -26
-22
-35
-30
-25
-20
-15
-10
-5
0
LS-3
08
Gra
de
s, °
C

83
When looking at warm mix modified samples, RAF binder modified with different
additives did not really show a lot of change in the grades. When these samples were compared
to NER modifies with different warm mix additives, it did not show significant amount of grade
change as well except for NER with E additive which shows the maximum grade decrease of
about 6 °C for NER.
4.3.2 LS-308 Grade Losses
Grade loss for all the binders tested according to LS-308 protocol. If there is a deficit of 6°C for
the low temperature grade, it will typically reduce the confidence level that a pavement is not
exposed to damage in a given year from the intended 98% to around 50% [70]. Samples AR-21
and AR-22 showed huge grade losses of 11.2 °C and 10.02 °C respectively. This indicates that
these samples have several cracking problem and are likely to show low durability in
performance perspective. Grade loss improvement was seen for NER binder for samples with
warm mix additives. For NER binder with additive A, grade loss was reduced to 0.76 from 6.2 for
the unmodified NER. This indicates a low possibility or lower tendency to physical hardening at
the conditioning temperature for this sample.
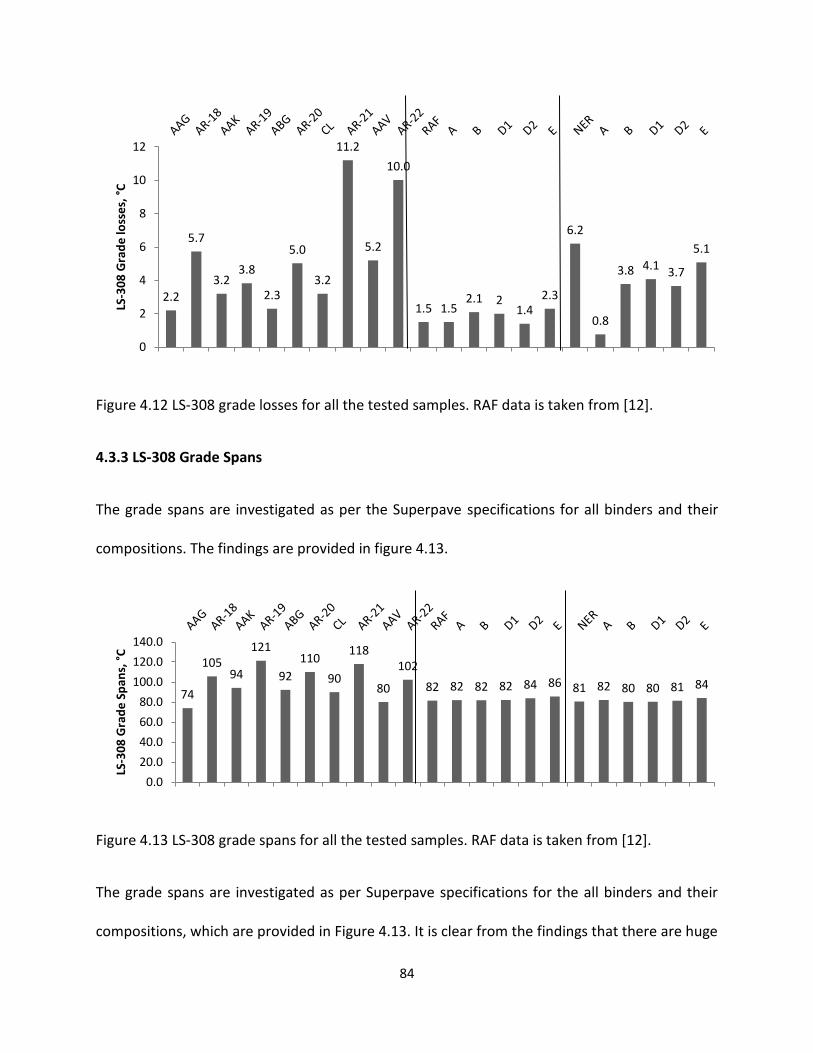
84
Figure 4.12 LS-308 grade losses for all the tested samples. RAF data is taken from [12].
4.3.3 LS-308 Grade Spans
The grade spans are investigated as per the Superpave specifications for all binders and their
compositions. The findings are provided in figure 4.13.
Figure 4.13 LS-308 grade spans for all the tested samples. RAF data is taken from [12].
The grade spans are investigated as per Superpave specifications for the all binders and their
compositions, which are provided in Figure 4.13. It is clear from the findings that there are huge
2.2
5.7
3.2 3.8
2.3
5.0
3.2
11.2
5.2
10.0
1.5 1.5 2.1 2
1.4 2.3
6.2
0.8
3.8 4.1 3.7
5.1
0
2
4
6
8
10
12
LS-3
08
Gra
de
loss
es,
°C
74
105 94
121
92
110
90
118
80
102
82 82 82 82 84 86 81 82 80 80 81 84
0.0
20.0
40.0
60.0
80.0
100.0
120.0
140.0
LS-3
08
Gra
de
Sp
ans,
°C
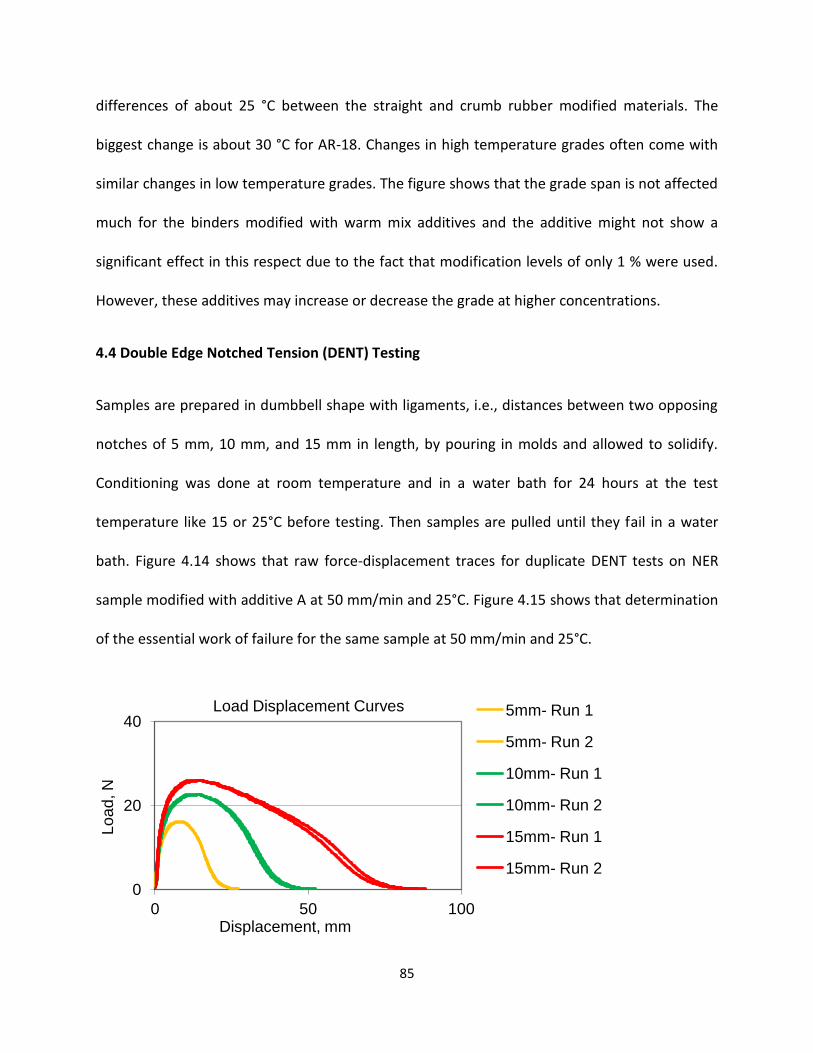
85
differences of about 25 °C between the straight and crumb rubber modified materials. The
biggest change is about 30 °C for AR-18. Changes in high temperature grades often come with
similar changes in low temperature grades. The figure shows that the grade span is not affected
much for the binders modified with warm mix additives and the additive might not show a
significant effect in this respect due to the fact that modification levels of only 1 % were used.
However, these additives may increase or decrease the grade at higher concentrations.
4.4 Double Edge Notched Tension (DENT) Testing
Samples are prepared in dumbbell shape with ligaments, i.e., distances between two opposing
notches of 5 mm, 10 mm, and 15 mm in length, by pouring in molds and allowed to solidify.
Conditioning was done at room temperature and in a water bath for 24 hours at the test
temperature like 15 or 25°C before testing. Then samples are pulled until they fail in a water
bath. Figure 4.14 shows that raw force-displacement traces for duplicate DENT tests on NER
sample modified with additive A at 50 mm/min and 25°C. Figure 4.15 shows that determination
of the essential work of failure for the same sample at 50 mm/min and 25°C.
0
20
40
0 50 100
Lo
ad
, N
Displacement, mm
Load Displacement Curves 5mm- Run 1
5mm- Run 2
10mm- Run 1
10mm- Run 2
15mm- Run 1
15mm- Run 2

86
Figure 4.14 Raw force-displacement traces for duplicate DENT tests on NER sample modified
with additive A at 50 mm/min and 15°C.
Figure 4.15 Determination of the essential work of failure for NER sample modified with
additive A at 50 mm/min and 15°C.
The intercept for this graph provides an accurate essential work of failure and this is then used
together with the peak loads in the 5 mm ligament specimens to calculate a critical crack tip
opening displacement. The graph clearly shows the highly reproducible results and accuracy of
works of failure, essential works of failure, and CTODs.
4.4.1 Essential Works of Failure
The essential work of failure (we) is a material property, because it is not depend on the
geometry of the asphalt cement sample. Generally, the EWF model is used to determine the
resistance of fatigue cracking and low temperature cracking distresses in asphalt cement
pavement. Usually, this EWF model concept is suitable to apply when the essential work of
y = 0.35x + 2.97 R² = 1.00
0
2
4
6
8
10
0 5 10 15 20
Spec
ific
To
tal W
ork
s, k
J/m
2
Ligament Length, mm
Specific Total Works of Fracture
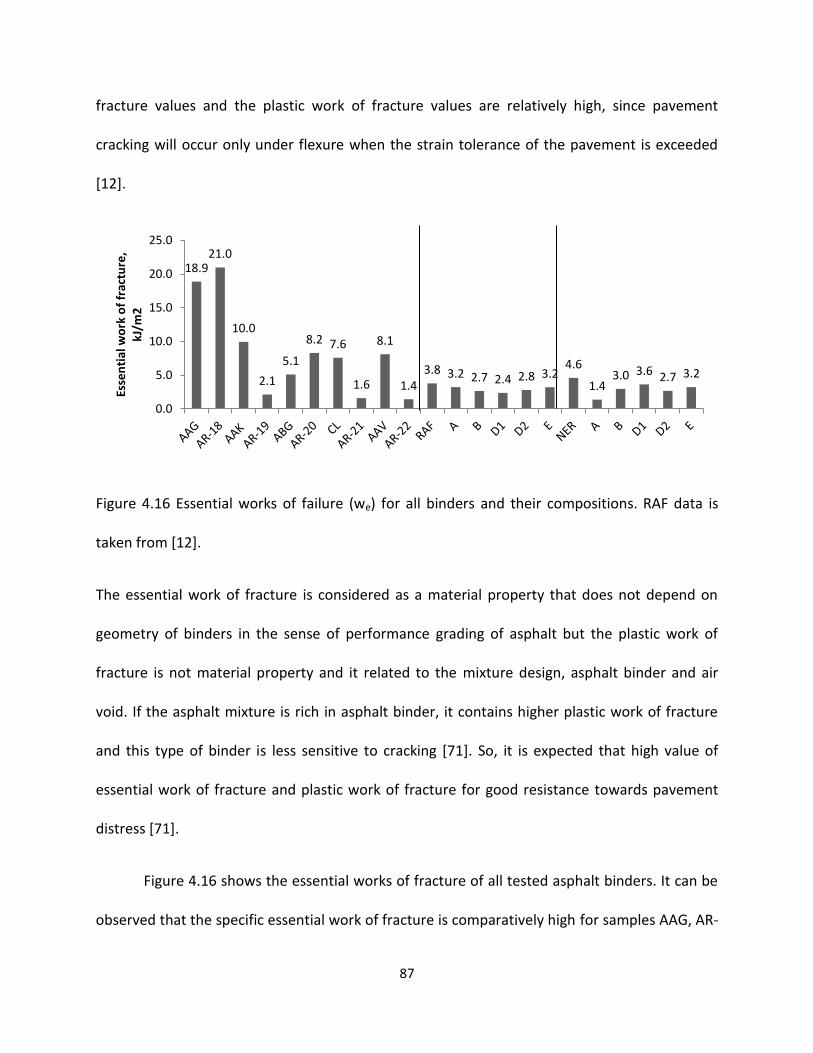
87
fracture values and the plastic work of fracture values are relatively high, since pavement
cracking will occur only under flexure when the strain tolerance of the pavement is exceeded
[12].
Figure 4.16 Essential works of failure (we) for all binders and their compositions. RAF data is
taken from [12].
The essential work of fracture is considered as a material property that does not depend on
geometry of binders in the sense of performance grading of asphalt but the plastic work of
fracture is not material property and it related to the mixture design, asphalt binder and air
void. If the asphalt mixture is rich in asphalt binder, it contains higher plastic work of fracture
and this type of binder is less sensitive to cracking [71]. So, it is expected that high value of
essential work of fracture and plastic work of fracture for good resistance towards pavement
distress [71].
Figure 4.16 shows the essential works of fracture of all tested asphalt binders. It can be
observed that the specific essential work of fracture is comparatively high for samples AAG, AR-
18.9 21.0
10.0
2.1
5.1
8.2 7.6
1.6
8.1
1.4 3.8 3.2 2.7 2.4 2.8 3.2
4.6
1.4 3.0 3.6 2.7 3.2
0.0
5.0
10.0
15.0
20.0
25.0
Esse
nti
al w
ork
of
frac
ture
, kJ
/m2
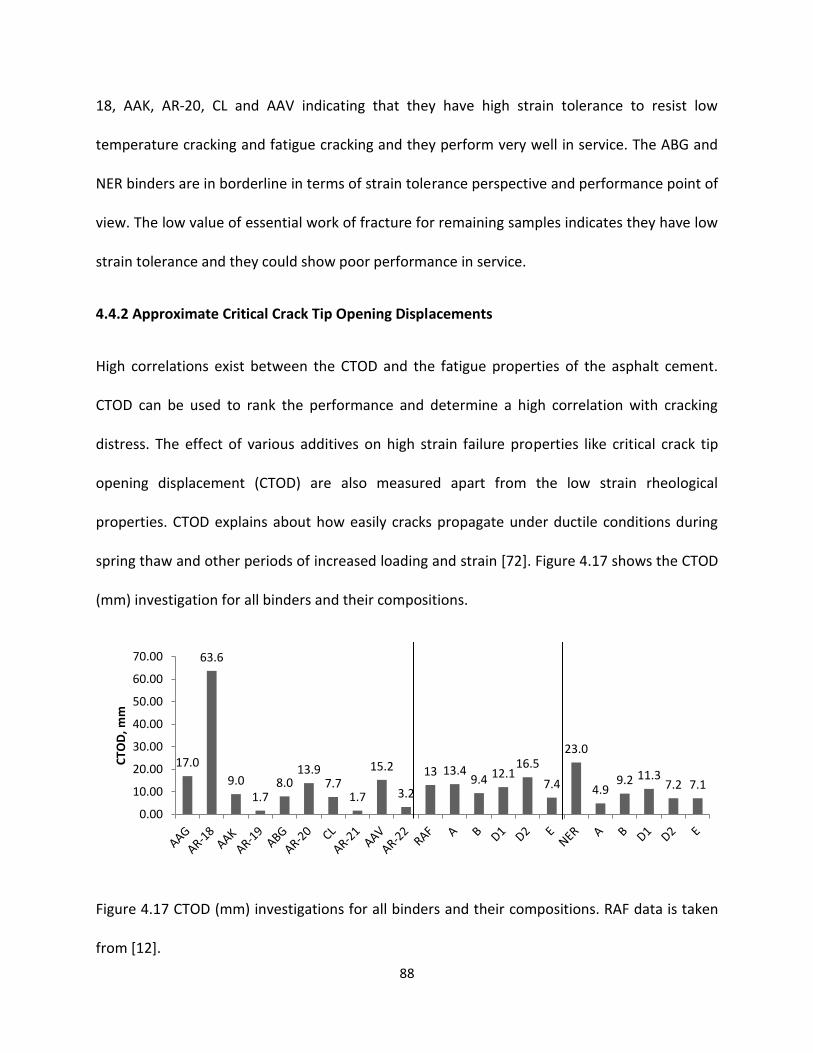
88
18, AAK, AR-20, CL and AAV indicating that they have high strain tolerance to resist low
temperature cracking and fatigue cracking and they perform very well in service. The ABG and
NER binders are in borderline in terms of strain tolerance perspective and performance point of
view. The low value of essential work of fracture for remaining samples indicates they have low
strain tolerance and they could show poor performance in service.
4.4.2 Approximate Critical Crack Tip Opening Displacements
High correlations exist between the CTOD and the fatigue properties of the asphalt cement.
CTOD can be used to rank the performance and determine a high correlation with cracking
distress. The effect of various additives on high strain failure properties like critical crack tip
opening displacement (CTOD) are also measured apart from the low strain rheological
properties. CTOD explains about how easily cracks propagate under ductile conditions during
spring thaw and other periods of increased loading and strain [72]. Figure 4.17 shows the CTOD
(mm) investigation for all binders and their compositions.
Figure 4.17 CTOD (mm) investigations for all binders and their compositions. RAF data is taken
from [12].
17.0
63.6
9.0 1.7
8.0 13.9
7.7 1.7
15.2
3.2
13 13.4 9.4 12.1
16.5
7.4
23.0
4.9 9.2 11.3
7.2 7.1
0.00
10.00
20.00
30.00
40.00
50.00
60.00
70.00
CTO
D, m
m

89
Sample AR-18 shows extremely high value of CTOD. The reason for this behavior might be a
rapid and uniform dispersion of rubber particles when they are exposed to asphalt during
mixing resulting in formation of a reinforced network structure. Other samples like AAG, AR-20,
AAV RAF, D2, NER show reasonably high values of CTOD indicating high strain tolerance in the
ductile state, which is likely to show resistance in premature and/or excessive cracking in
service. Addition of rubber decreases CTOD for AAK, CL and AAV but increases CTOD for ABG
which shows that CTOD values when it comes to rubber addition are not predictable.
For rubber modified samples AR-19, AR-21 and AR-22 showed a negative effect on CTOD
values when compared to their unmodified binders suggesting a the negative effect on the
strain tolerance in the ductile state, which is likely to show up as premature and/or excessive
cracking in service. When a comparison between warm mix modified RAF and NER samples was
made, it suggested that additives do not affect CTOD values of RAF binder but they show a
negative effect on CTOD values of NER binder.
4.4.3 Dent Results Using Extended PAV
Dent test was performed on some samples which were aged using extended PAV method for 40
hours and this data was compared to regular PAV samples. Tests on all the samples are
performed twice and an average of both the readings is taken. Table 4.1 lists all the results.
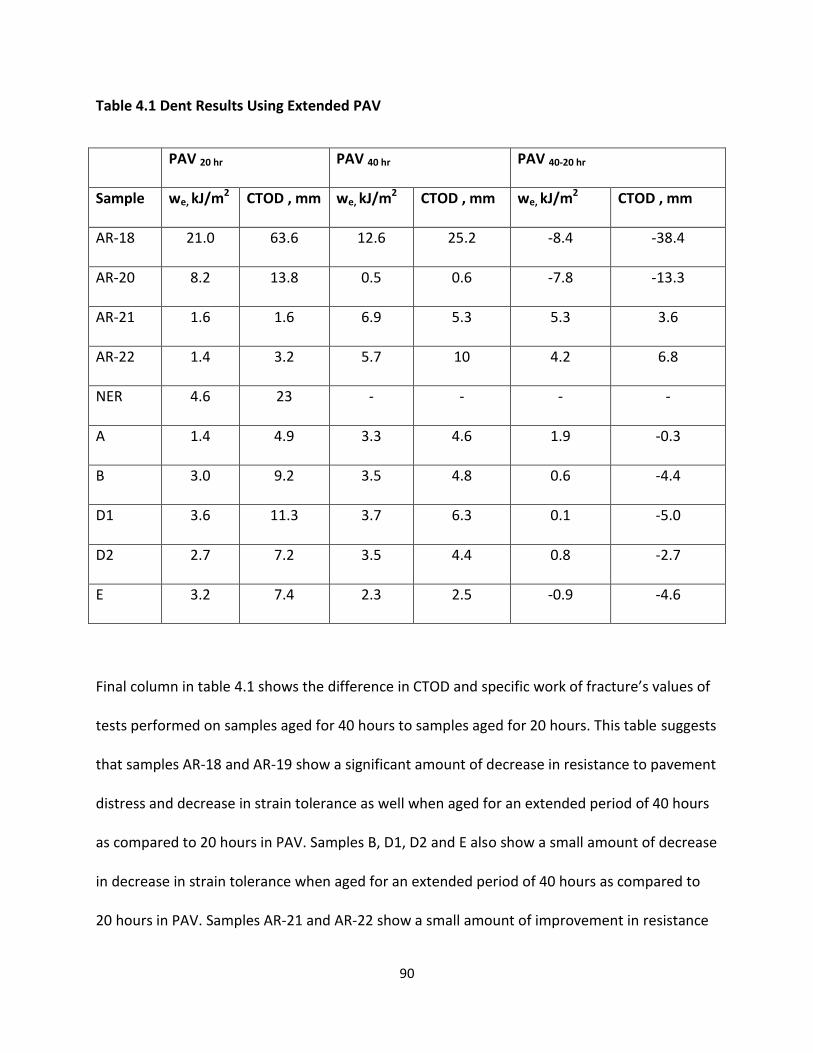
90
Table 4.1 Dent Results Using Extended PAV
PAV 20 hr PAV 40 hr PAV 40-20 hr
Sample we, kJ/m2 CTOD , mm we, kJ/m2 CTOD , mm we, kJ/m2 CTOD , mm
AR-18 21.0 63.6 12.6 25.2 -8.4 -38.4
AR-20 8.2 13.8 0.5 0.6 -7.8 -13.3
AR-21 1.6 1.6 6.9 5.3 5.3 3.6
AR-22 1.4 3.2 5.7 10 4.2 6.8
NER 4.6 23 - - - -
A 1.4 4.9 3.3 4.6 1.9 -0.3
B 3.0 9.2 3.5 4.8 0.6 -4.4
D1 3.6 11.3 3.7 6.3 0.1 -5.0
D2 2.7 7.2 3.5 4.4 0.8 -2.7
E 3.2 7.4 2.3 2.5 -0.9 -4.6
Final column in table 4.1 shows the difference in CTOD and specific work of fracture’s values of
tests performed on samples aged for 40 hours to samples aged for 20 hours. This table suggests
that samples AR-18 and AR-19 show a significant amount of decrease in resistance to pavement
distress and decrease in strain tolerance as well when aged for an extended period of 40 hours
as compared to 20 hours in PAV. Samples B, D1, D2 and E also show a small amount of decrease
in decrease in strain tolerance when aged for an extended period of 40 hours as compared to
20 hours in PAV. Samples AR-21 and AR-22 show a small amount of improvement in resistance
91
to pavement distress and strain tolerance when aged for an extended period of 40 hours as
compared to 20 hours in PAV.
4.5 MSCR Binder Specification
For the standard traffic load (S), the Jnr value determined at 3.2 kPa shear stress should have a
maximum value of 4.0 kPa-1. As the traffic increases to heavy loading and very heavy loading,
the Jnr value of the asphalt binder is required to be lowered with the required maximum values
of 2.0 and 1.0 kPa-1, respectively,. The data determined at 0.1 kPa shear stress is also important
for lower traffic zone whereas the main requirement for Jnr is determined at 3.2 kPa shear
stress. AASHTO MP19 maintains a requirement that the difference in Jnr values between 0.1 kPa
and 3.2 kPa shear stress should not exceed a ratio of 0.75 so as to minimize concerns that some
asphalt binders may be sensitive to changes in shear stress [4]. The corresponding values of
Equivalent Single Axle Loads (ESAL) for various type of traffic i.e Standard (S), Heavy (H) and
Very heavy (V) under which the asphalt sample can be used at a particular temperature are:
S = Standard < 10 million ESALs and standard traffic loading
H = Heavy 10 – 30 million ESALs or slow moving traffic loading
V = Very Heavy > 30 million ESALs or standing traffic loading
Table 4.1 lists MSCR grades for RAF and NER samples with different warm mix additives.

92
Table 4.2: MSCR Grades for RAF and NER Samples with Different Warm Mix Additives
Sample MSCR Grade, °C
RAF 46-34 S
A 46-34 H
B 46-34 H
D1 46-35 S
D2 46-35 H
E 46-35 H
NER NA
A NA
B 52 -30 S
D1 52 -31 S
D2 52 -30 S
E 52 -28 H
These results show that for NER binder only sample E can be used for heavy traffic
loading at 52 °C and all the other samples are suitable only for standard traffic loading whereas
for RAF samples A, B, D2 and E can be used for heavy traffic loading at 46 °C.
93
CHAPTER 5
SUMMARY AND CONCLUSIONS
Based on the background, experimental procedures, results and discussions of this thesis, the
following summary and conclusions are given:
The higher value of limiting temperature of asphalt rubber indicates that they have high
resistance to rutting at higher temperature and these types of binders would show good
performance at high temperature climate or during summer in more moderate climates
such as those in most of southern Ontario.
Asphalt cements with warm mix additives have higher limiting temperature
performance grade as compared to regular their respective unmodified asphalt.
By observing the Black space diagram for unaged, RTFO aged and PAV aged samples, it is
seen that most of the samples are rheologically simple except samples E. The complex
behavior of sample E may be due to phase separation by the addition of additive to the
sample.
Comparing rubber modified samples with respect to their respective unmodified
binders, most of them showed grade improvements specially AR-18 which showed a
grade improvement of 13 °C.
When looking at warm mix modified samples, RAF binder modified with different
additives did not really show a lot of change in the grades and when compared to NER

94
which showed significant amount of decrease in grades with respect to unmodified NER.
NER with E additive shows the maximum grade decrease of about 5 °C for NER.
The asphalt samples tested in this study showed a range of tendencies for chemical and
physical hardening. Many binders failed AASHTO M320 specification criteria for low
temperature performance after modified PAV aging or extended conditioning in the BBR
test. Samples AR-20, AR-21, NER and NER with additive E lost 6, 10, 7 and 7 degrees
respectively after extended PAV aging. This indicates low durability and these samples
are likely to show premature and excessive cracking.
Comparing rubber modified samples with respect to their respective unmodified
binders, only AR-18 and AR-22 showed an improvement in grades with AR-18 showing
an improvement of 10 °C. When looking at warm mix modified samples, RAF binder
modified with different additives did not really show a lot of change in the grades. When
these samples were compared to NER modifies with different warm mix additives, it did
not show significant amount of grade change as well except for NER with E additive
which shows the maximum grade decrease of about 6 °C for NER.
Samples AR-21 and AR-22 showed huge grade losses of 11.2 °C and 10.02 °C respectively
for extended BBR. This indicates that these samples have several cracking problem and
are likely to show low durability in performance perspective. Grade loss improvement
was seen for NER binder for samples with warm mix additives. For NER binder with
additive A, grade loss was reduced to 0.76 from 6.2 for the unmodified NER.
It can be observed that the specific essential work of fracture is comparatively high for
samples AAG, AR-18, AAK, AR-20, CL and AAV indicating that they have high strain
95
tolerance to resist low temperature cracking and fatigue cracking and they perform very
well in service.
Sample AR-18 shows extremely high value of CTOD and other samples like AAG, AR-20,
AAV RAF, D2, NER show reasonably high values of CTOD indicating high strain tolerance
in the ductile state, which is likely to show resistance in premature and/or excessive
cracking in service. For rubber modified samples AR-19, AR-21 and AR-22 showed a
negative effect on CTOD values when compared to their unmodified binders suggesting
a negative effect on the strain tolerance in the ductile state.
MSCR results show that for NER binder only sample E can be used for heavy traffic
loading at 52 °C and all the other samples are suitable only for standard traffic loading
whereas for RAF samples A, B, D2 and E can be used for heavy traffic loading at 46 °C.
The effect of additives on chemical and physical hardening tendencies was found to be
significant.
96
References
1. John R, and David W. The Shell bitumen hand book. Thomas Telford Services Limited,
2010.
2. Abraham H. Asphalts and Allied Substances, Their Occurrence, Modes of Production,
Uses in the Arts and Methods of Testing, 5th edition, volume 1, 1945. Van Nostrand, New
York.
3. Traxler, R N. The Physical Chemistry of Asphaltic Bitumen, Chem. Rev., volume 19, no 2,
1936.
4. Kanabar, N., Comparison of Ethylene Terpolymer, Styrene Butadiene, and Polyphosphoric
Acid Type Modifiers for Asphalt Cement, Queen’s University Kingston, Ontario, Canada,
2010.
5. Henry, K A. Effects of Low Temperatures, Repetitive Stresses and Chemical Aging on
Thermal and Fatigue Cracking in Asphalt Cement Pavements on Highway 417. MSc.
Thesis, Department of Chemistry, Queen’s University, Kingston, Ontario, Canada, 2012.
6. Yee P, Aida B, Hesp S., Marks P, and Tam K. Analysis of Three Premature Pavement
Failures. Transportation Research Record: Journal of the Transportation Research Board,
No. 1962, Transportation Research Board of the National Academies, Washington, D.C.,
2006, pp. 44-51.
7. Brown ER, Kandhal PS, and Zhang J. Performance Testing for Hot Mix Asphalt. National
Center for Asphalt Technology Report 2001, pp. 01-05.
97
8. Palit, S, Reddy, K, and Pandey, B. (2004). Laboratory Evaluation of Crumb Rubber
Modified Asphalt Mixes. J. Mater. Civ. Eng., 16(1), pp. 45–53.
9. L. H. Lewandowski (1994). Polymer Modification of Paving Asphalt Binders. Rubber
Chemistry and Technology: July 1994, Vol. 67, No. 3, pp. 447-480.
10. Hattie Xu, Andrew McIntyre, Tham Adhikari, and Simon A.M. Hesp, Quality and
Durability of Warm Rubberized Asphalt Cement in Ontario. Submitted for Presentation
and Publication 92nd Annual meeting transportation research board January, 2013.
11. Simon A.M. Hesp, Kelli-Anne N. Johnson, Ross G. McEwan, Senthil Kumar Paul Samy,
Scott Ritchie, and Michaela Thomas. Effect of Ten Commercial Warm Mix Additives on
the Quality and Durability of Cold Lake Asphalt Cement. Submitted for Presentation and
Publication 93rd Annual Meeting Transportation Research Board January, 2014.
12. Senthil, KP. EFFECTS OF WARM MIX ADDITIVES AND DISPERSANTS ON RHEOLOGICAL,
AGING AND FAILURE PROPERTIES OF ASPHALT CEMENTS. M.Sc. Thesis, Department of
Chemistry, Queen’s University, Kingston, Ontario, Canada, 2013.
13. Athena Sustainable Materials Institute. “A Life Cycle Perspective on Concrete and
Asphalt Roadways: Embodied Primary Energy and Global Warming Potential.”
Submitted to Cement Association of Canada. Merrickville, ON: Athena Sustainable
Materials Institute, 2006.
14. Calkins, M. Materials for Sustainable Sites: A Complete Guide to the Evaluation,
Selection, and Use of Sustainable Construction Materials, John Wiley & Sons, Inc., 2009
98
15. U.S. Environmental Protection Agency (EPA). “Hot Mix Asphalt Plants Emission
Assessment Report.” Report EPA-454/R-00–019. http://www.epa.gov/
ttn/chief/ap42/ch11/related/ea-report.pdf, December 2000.
16. Koenders, BG., Stoker, DA., Brown, P., Groot, PC., Larsen, O., Hardy, D. and Wilms, KP.
Innovative Process in Asphalt Production and Application to Obtain Lower Operating
Temperature, 2nd Eurasphalt & Eurobitumen Congress, Barcelona, Spain, 2000.
17. Sasol Wax, Website: http://www.sasolwax.com/Sasobit_Technology.html, Accessed:
October 2013.
18. Eurovia Services, Website: http://www.eurovia.com/en/produit/135.aspx, Accessed:
October 2013.
19. Lan, W., Chunqing, C., Yongming, X. Creep Characteristics of Crumb Rubber Modified
Asphalt Binder, College of Civil Engineering, Inner Mongolia University of Technology,
August 2010
20. Kim, HS., Lee, SJ. and Amirkhanian, S. Rheology Investigation of Crumb Rubber Modified
Asphalt Binders, KSCE Journal of Civil Engineering Vol. 14, No. 6, 2010, pp. 839-843.
21. Subramani, SK. Validation of New Asphalt Cement Specification Test Methods using
Eastern Northeastern Ontario Contracts and Trial Sections, MSc. Thesis, Department of
Chemistry, Queen’s University, Kingston, Ontario, Canada, 2009.
22. American Society for Testing and Materials, Standard Test Method for Penetration of
Bituminous Materials, 1997, ASTM, D5-97.
23. Penetration test, http://www.pavementinteractive.org/article/penetration-test/,
Accessed: October 2013.
99
24. American Society for Testing and Materials, Standard Test Method for Softening Point of
Bitumen (Ring and Ball method), 1995, ASTM, D36-95.
25. PRI Asphalt technologies inc, Website: http://www.priasphalt.com/
testingandspecifications.aspx?id=733, Accessed : October 2013.
26. Keith, S. Mechanics (Third ed.). Addison-Wesley. ISBN 0-201-07392-7, 1971 .
27. Viscosity Grading, Website: http://www.pavementinteractive.org/article/viscosity-
grading/, Accessed : October 2013.
28. Benzene International, Website: http://www.benzeneinternational.com/
viscosity_grade_bitumen.html, Accessed : October 2013.
29. Busy Trade, Website: http://www.busytrade.com/products/719073/Ndj-1d-Brookfield-
Rotating- Viscometer.html, Accessed: October 2013.
30. 30. Transportation Engineering Lab, Website: http://www.iitk.ac.in/transEL/
tests_details/viscosity%20test.htm, Accessed: October 2013.
31. Van Gooswilligen, G., De Bats, F.Th, and Harrison T. Quality of Paving Grade Bitumen – A
Practical Approach in Terms of Functional Tests. Proceedings of The Fourth Eurobitume
Symposium, Madrid, October, 1989, pp. 290–297.
32. Pavement Materials Penetration of Bituminous Materials, Nanyang Technological
University, School of Civil and Structural Engineering LABORATORY -
33. Asphalt Durability, http://www.pavementinteractive.org/article/durability/, Accessed:
October 2013.
34. Anderson, D. A.; Christensen, D. W.; Bahia, H. U.; Dongré, R.; Sharma, M. G.; Antle, C. E.;
Button, J. Binder Characterization and Evaluation. Volume 3: Physical Characterization

100
Report SHRP-A-369, Strategic Highway Research Program, National Research Council,
Washington, D.C., 1994.
35. Anderson, D.A. & Kennedy, T.W. 1993. Development of SHRP binder specification.
Journal of the Association of Asphalt Paving Technologists 62: 481-507.
36. Hesp, S. A. M.; Genin, S. N.; Scafe, D.; Shurvell, H. F.; Subramani, S. Five Year
Performance Review of a Northern Ontario Pavement Trial: Validation of Ontario’s
Double-Edge-Notched Tension (DENT) and Extended Bending Beam Rheometer (BBR)
Test Methods Transportation Research Record: Journal of the Transportation Research
Board, 2009, 99.
37. Design of Hot Asphalt Mixtures, ES-3, Lexington, Kentucky: The Asphalt Institute, 1990.
38. Asphalt Institute, Performance Graded Asphalt Binder Specification and Testing, 2003,
Superpave Series No. 1 (SP-1), pp. 18-19.
39. North Central Superpave Center, Website: https://engineering.purdue.edu/
NCSC/about/facilities.htm, Accessed: October 2013.
40. Anderson, DA., Christensen, DW., Bahi, HU., Dongré, R., Sharma, MG., Antle, CE., and
Button, J. SHRP Report A-369: Binder Characterization, and Evaluation.: Physical
Characterization, National Research Council, Washington, D.C., Volume 3, 1994.
41. Pressure Aging Vessel, http://www.pavementinteractive.org/article/pressure-aging-
vessel/, Accessed: October, 2013.
42. Asphalt Institute, Performance Graded Asphalt Binder Specification and Testing, 2003,
Superpave Series No. 1 (SP-1), pp. 22-28.
101
43. Asphalt Institute, Website: http://www.asphaltinstitute.org/lab_services/ indiv_binder_
tests_list_new.asp, Accessed: October, 2013.
44. Tia, M. Bituminous materials, University of Florida. Website: http://nersp.nerdc.ufl.edu
/~tia/Bituminous-Materials.pdf, Accessed: October, 2013.
45. AASHTO M320, Standard Specification for Performance-Graded Asphalt Binder,
American Association of State Highway and Transportation Officials, 2002.
46. Bending Beam Rheometer, http://www.pavementinteractive.org/article/bending-beam-
rheometer/, Accessed: October, 2013.
47. The Multiple Stress Creep Recovery (MSCR) Procedure, Website: http://www.fhwa.dot.gov/
pavement/materials/pubs/hif11038/tb00.cfm, Accessed: October, 2013.
48. Asphalt Institute, http://www.asphaltinstitute.org/Upload/MSCR_Implementation_
Guidance_1058794596_542010142630.pdf, Accessed: October, 2013.
49. Struik, LCE. Physical Aging in Amorphous Polymers and other Material. Elsevier Scientific
Publishing Co. Amsterdam, 1978, pp. xiv, 229 p.
50. Erskine, J., Hesp, SAM., and Kaveh, F. Another Look at Accelerated Aging of Asphalt
Cements in The Pressure Aging Vessel. Proceedings, Fifth Eurasphalt and Eurobitumen
Congress, Istanbul, Turkey, June 13-15, 2012.
51. Ministry of Transportation of Ontario; LS-299 – Determination of Asphalt Cement’s
Resistance to Ductile Failure Using Double-Edge-Notched Tension Test (DENT), Revision
to Laboratory Testing Manual, 2007.
52. Double-Edge-Notched Tension Test (LS-299),
http://www.hespresearchgroup.ca/facilities.html, Accessed: October 2013.
102
53. Cotterell, B., Reddel, JK. The Essential Work of Plane Stress Ductile Fracture.
International Journal of Fracture 1977, Vol. 13, pp. 267-277.
54. Martinez, A.B., Gamez-Perez, J., Sanchez-Soto, M., Velasco, J.I., Santana, O.O., Maspoch,
M. Ll., The Essential Work of Fracture (EWF) method – Analyzing the Post-Yielding
Fracture Mechanics of polymers, Engineering Failure Analysis, Vol. 16, 2009,pp. 2604–
2617
55. Hesp, SAM., Genin, SN., Scafe, D., Shurvell, HF., and Subramani, S. Five Year
Performance Review of A Northern Ontario Pavement Trial. Proceedings, Canadian
Technical Asphalt Association, Moncton, NB, November 2009, pp. 99-126.
56. Hesp, SAM., Soleimani, A., Subramani, S., Phillips, T., Smith, D., Marks, P., and Tam, K.
Asphalt Pavement Cracking: Analysis of Extraordinary Life Cycle Variability In Eastern
and Northeastern Ontario. International Journal of Pavement Engineering, Vol. 10(3),
2009, pp. 209-227.
57. Hesp, SAM., and Shurvell, HF. X-ray Fluorescence Detection of Waste Engine Oil
Residues in Asphalt and Its Effect on Cracking in Service. International Journal of
Pavement Engineering, Vol. 11(6), 2010, pp. 541-553.
58. Kaveh, F. and Hesp, SAM. Spectroscopic Analysis of Pressure Aging Vessel Protocols for
The Accelerated Laboratory Aging of Asphalt Cements. Proceedings, First Conference of
Transportation Research Group of India, Bangalore, India, December 2011, pp. 11-20.
59. Zhao, MO., and Hesp, SAM. Performance Grading of the Lamont, Alberta C-SHRP
Pavement Trial Binders. International Journal of Pavement Engineering, Vol. 7(3), 2006,
pp. 199-211.

103
60. Ministry of Transportation of Ontario; LS-228 – Accelerated Aging of Asphalt cement
Using Modified Pressure Aging Vessel Protocols, Revision to Laboratory Testing Manual,
2012.
61. Asphalt Institute, Performance Graded Asphalt Binder Specification and Testing, 2003,
Superpave Series No. 1 (SP-1), pp. 33-38.
62. Abdelrahman, MA., Carpenter, SH. Mechanism of Interaction of Asphalt Cement with
Crumb Rubber Modifier. Transportation Research Record: Journal of the Transportation
Research Board, pp. 106-113.
63. Bahia, H. U.; Anderson, D. A. Physical Properties of Asphalt Binders ASTM STP 1241
American Society for Testing Materials, Philadelphia, 1995.
64. Rolling Thin Film Oven Test, http://www.pavementinteractive.org/article/rolling-thin-
film-oven/, Accessed: October 2013.
65. Amit, K. Physical And Chemical Aging Behaviour of Asphalt Cements from Two Northern
Ontario Pavement Trials, MSc. Thesis, Department of Chemistry, Queen’s University,
Kingston, Ontario, Canada, 2010.
66. Pressure Aging Vessel, http://www.pavementinteractive.org/article/pressure-aging-
vessel/#sthash.W7HGHP3K.dpuf, Accessed: October 2013.
67. Pavement Interactive guide, Website: http://www.pavementinteractive.org/
article/dynamic-shear-rheometer/ , Accessed: October 2013.
68. US Department of Transportation: Federal Highway Administration; Background of
Superpave Asphalt Binder Test Methods, Publication No. FHWA-SA-94-069, 1994.
104
69. Adhikari, T. Quality And Durability Of Rubberized Asphalt Cement And Warm Rubberized
Asphalt Cement, MSc. Thesis, Department of Chemistry, Queen’s University, Kingston,
Ontario, Canada, 2013.
70. LTPPBind® Software, V. 2.1, Federal Highway Administration, McLean, Virginia, 1999.
71. Agbovi KH. Effect of Low temperatures, repetitive stresses and chemical aging on
thermal and fatigue cracking in asphalt cement pavement on high 417, M.Sc. Thesis,
Department of Chemistry, Queen’s University, Kingston, Canada, 2012.
72. Andriescu A, Gibson N, Hesp SAM, Qi X, and Youtcheff, JS. Validation of The Essential
Work of Fracture Approach to Fatigue Grading of Asphalt Binders. Journal of the
Association of Asphalt Paving Technologists, Vol. 75E, pp. 1-37, 2006.