effect of macro economic variables on financial ...€¦ · unimpressive mutual funds are therefore...
TRANSCRIPT
EFFECT OF MACRO ECONOMIC VARIABLES ON FINANCIAL
PERFORMANCE OF MUTUAL FUNDS INDUSTRY IN KENYA
EMILY CHELANGAT KARIUKI
A RESEARCH PROJECT REPORT SUBMITTED IN PARTIAL
FULFILLMENT OF THE REQUIREMENTS FOR THE AWARD OF THE
DEGREE OF MASTER OF BUSINESS ADMINISTRATION, SCHOOL OF
BUSINESS, UNIVERSITY OF NAIROBI
NOVEMBER 2014

ii
DECLARATION
STUDENT’S DECLARATION
I declare that this Research Project is my original work and has never been submitted
for a degree in any other university or college for examination/academic purposes.
Signature: ……………………… Date:…………………………………
EMILY CHELANGAT KARIUKI
REG: D61/63775/2011
This Research Project has been submitted for examination with my approval as
University Supervisor.
Signature…………………………………….….Date………………………………….
.
MRS. WINNIE NYAMUTE
LECTURER, DEPARTMENT OF FINANCE AND ACCOUNTING:
UNIVERSITY OF NAIROBI

iii
DEDICATION
I dedicate this work to my family and all those who supported me in the completion of
this project.

iv
ACKNOWLEDGEMENTS
It is my sincere gratitude to acknowledge the efforts of all who participated in this
noble exercise to help me to achieve my goal of becoming an MBA graduate.
To start with may I recognize the efforts and input from my colleagues who
encouraged me during tough times of class work and meeting tight deadlines. Your
encouragement made me feel like a part of a strong army which was about to win a
war.
May I dedicate my gratitude to my husband, daughter and son whom I denied their
time as I was away during those crucial times of this project.
I also remember my work mates who spared their important time and guided me in
one way or the other in this course. Without their immense cooperation I would not
have reached this far.
I am greatly indebted to my supervisor Ms Winnie Nyamute for her professional
guidance and advice in every part of this project and made it a success, my profound
appreciation to you.
Finally my sincere gratitude goes to the MBA students, staff, lecturers and the entire
University of Nairobi fraternity for changing me from what I was to what I am.

v
ABSTRACT
The financial sector today is an important part of the social infrastructure. For a long
time, mutual fund investment has played an important role in the financial market and
its popularity has increased dramatically over the past decade. Mutual funds are
managed pools of financial assets that can be invested in by retail or institutional
investors. The mutual fund industry in Kenya is very young having started with the
passage of the Capital Markets Amendment Act (2000), which recognizes specific
investment vehicles and especially mutual funds. The continued poor performance of
mutual funds in the presence of increased investments in intellectual assets raises
questions on the substance of macroeconomic variables in addressing the challenges
facing the mutual funds in Kenya. Unimpressive mutual funds are therefore facing
competition from newer alternatives, including exchange-traded funds (ETFs), folios
and separately managed accounts. These alternatives offer certain advantages over
mutual funds. The study sought to establish the effect of macroeconomic variables on
financial performance of mutual funds industry in Kenya.
This study took a causal research design approach. The study solely used annual
report data sources available at the companies‟ books of account, Kenya national
bureau of statistics and the NSE or Capital Market Authority offices. The study used
data analysis software such as, Microsoft Excel and SPSS version 21 to analyse the
data. The study used multiple linear regression equation and the method of estimation
was Ordinary Least Squares (OLS) so as to establish the relationship between
macroeconomic variables and mutual fund performance. The analyses entailed the
computation of the various coefficients of the independent variables correlated against
the ROI. The macroeconomic variables coefficients are denoted as “β” in the model.
Regression was employed to examine the effect of selected determinant variables on
the performance of mutual firms.
From the regression model, the study found out that there were macroeconomic
variables influencing fund performance among mutual funds operating in Kenya with
equity portfolios licensed by the Capital Markets Authority, which are money supply,
interest rate, inflation rate, GDP and exchange rates. They either influenced it
positively or negatively. The study found out that the intercept was 0.478 for all years.
The five independent variables that were studied (money supply, interest rate,
inflation rate, GDP and exchange rates) explain a substantial 70.9% of fund
performance among mutual funds operating in Kenya with equity portfolios licensed
by the Capital Markets Authority as represented by adjusted R2 (0.709). The study
concluded that money supply, interest rate, inflation rate and GDP positively and
significantly influence fund performance among mutual funds operating in Kenya
with equity portfolios licensed by the Capital Markets Authority while exchange rate
negatively but significantly influence fund performance among mutual funds
operating in Kenya with equity portfolios licensed by the Capital Markets Authority.

vi
TABLE OF CONTENTS
DECLARATION.................................................................................................... ii
DEDICATION............................................................................................................ iii
ACKNOWLEDGEMENTS ...................................................................................... iv
ABSTRACT ..................................................................................................................v
LIST OF TABLES ................................................................................................... viii
ABBREVIATIONS AND ACRONYMS .................................................................. ix
CHAPTER ONE ..........................................................................................................1
INTRODUCTION........................................................................................................1
1.1 Background of the Study .....................................................................................1
1.1.1 Macroeconomic Variables ............................................................................3
1.1.2 Financial Performance of Mutual Funds Industry ........................................3
1.1.3 Macroeconomic variables and Financial Performance .................................6
1.1.4 Mutual Funds Industry in Kenya ..................................................................7
1.2 Research Problem ..............................................................................................10
1.3 Research Objective ............................................................................................12
1.4 Value of the Study .............................................................................................12
CHAPTER TWO .......................................................................................................14
LITERATURE REVIEW .........................................................................................14
2.1 Introduction ........................................................................................................14
2.2 Theoretical Review ............................................................................................14
2.2.1 Portfolio Theory ..........................................................................................14
2.2.2 Capital Assets Pricing Model (CAPM).......................................................17
2.2.3 Arbitrage Pricing Theory (APT) .................................................................20
2.3 Determinants of Performance of Mutual Funds.................................................22
2.4 Empirical Review...............................................................................................24
2.5 Summary of the Literature .................................................................................32
CHAPTER THREE ...................................................................................................33
RESEARCH METHODOLOGY .............................................................................33
3.1 Introduction ........................................................................................................33

vii
3.2 Research Design.................................................................................................33
3.3 Target Population ...............................................................................................33
3.4 Data Collection Procedure .................................................................................34
3.5 Data Analysis .....................................................................................................34
3.5.1 Analytical Model ........................................................................................35
CHAPTER FOUR ......................................................................................................37
DATA ANALYSIS, RESULTS AND DISCUSSION ..............................................37
4.1 Introduction ........................................................................................................37
4.2 Descriptive statistics ..........................................................................................37
4.3 Regression Results .............................................................................................38
4.4 Summary and Interpretation of Findings ...........................................................41
CHAPTER FIVE .......................................................................................................44
SUMMARY, CONCLUSION AND RECOMMENDATIONS .............................44
5.1 Introduction ......................................................................................................44
5.2 Summary of Findings .........................................................................................44
5.3 Conclusions ........................................................................................................46
5.4 Limitation of the Study ......................................................................................48
5.5 Recommendations ..............................................................................................48
5.5.1 Policy Recommendations............................................................................48
5.5.2 Suggestions for Further Research ...............................................................49
REFERENCES ...........................................................................................................50
APPENDICES ............................................................................................................57
Appendix I: List of Mutual Funds companies In Kenya..........................................57
Appendix II: Raw Data ............................................................................................58

viii
LIST OF TABLES
Table 4. 1: Summary of the study variables for the study period ................................37
Table 4.2: Results of multiple regression between fund performance and the combined
effect of the selected predictors .................................................................38
Table 4.3: Summary of One-Way ANOVA results of the regression analysis between
fund performance and predictor variables .................................................39
Table 4. 4: Regression coefficients of the relationship between fund performance and
the five predictive variables .......................................................................40

ix
ABBREVIATIONS AND ACRONYMS
ANOVA - Analysis of Variance
APT - Arbitrage Pricing Theory
CAPM - Capital Assets Pricing Model
CMA - Capital Markets Authority
CMA - Capital Market Authority
EMH - Efficient Market Hypothesis
ETFs - Exchange-Traded Funds
FMC - Fund Management Company
GDP - Gross Domestic Product
IPOs - Initial Public Offer
MF - Mutual Funds
MPT - Modern Portfolio Theory
NPV - Net Present Value
NSE - Nairobi Securities Exchange
OLS - Ordinary Least Squares
OMAM - Old Mutual Asset Management
OMAM - Old Mutual Asset Managers
PE - Private Equity
PEVC - Private Equity and Venture Capital
ROA - Return on Assets
ROI - Return on Investment
SI - Sharpe Index

x
SPSS - Statistical Package for Social Sciences
Tl - Treynor Index
US - United States

1
CHAPTER ONE
INTRODUCTION
1.1 Background of the Study
The financial sector today is an important part of the social infrastructure. For a long
time, mutual fund investment has played an important role in the financial market and
its popularity has increased dramatically over the past decade. This can be seen from
the sharp rise in worldwide mutual fund assets from $14 trillion in 2003 to $26 trillion
in 2007 (ICI, 2008). Mutual funds have become one of the largest financial
intermediaries in the leading world economies, currently controlling about 7 trillion
dollars in assets in the US and over 3 trillion Euros in assets in Europe (Investment
Company Institute, 2002). Currently, investors can choose from thousands of funds
offering a wide range of investment profiles, from relatively safe short-term debt
instruments to relatively risky stocks and derivatives. Mutual funds are one of the
most important vehicles through which households invest and save for retirement,
either directly as part of their (non-pension) individual registered saving plans, or
indirectly, through employer-sponsored pension plans. In addition, mutual fund
investment is important to the equity market and to the growth of the economy, since
they are held by institutional investors who hold a significant portion of capital assets.
Mutual funds are managed pools of financial assets that can be invested in by retail or
institutional investors. Mutual funds pool money from many investors and invest the
money in stocks, bonds, short-term money-market instruments, or other securities.
Knowing whether there is persistence in mutual fund performance is of concern both
to investors and to fund managers. The existence of performance persistence tells us

2
whether fund managers add value and whether past fund performance information
should be taken into account by investors when making their investment decisions.
The literature on performance persistence is extensive; one question that has not been
asked to date is whether past performance information is equally useful for predicting
fund performance across different sectors. Knowing whether this is the case could be
of interest to those on both the demand and supply side of the fund management
industry (Hendricks, Patel, and Zechhauser, 2008).
A mutual fund is an investment vehicle that pools capital from clients purchasing its
shares to invest in a portfolio of securities, with purchasing and selling of securities
being decided by a fund manager (Reilly et al, 2003). Three parties are involved in a
mutual fund: board of directors, a fund management company (FMC) and
shareholders. Independent from the FMC, the board of directors is responsible for
safeguarding interests of client shareholders by ensuring the FMC complies with
contractual regulations regarding duties and compensation. Duties of an FMC include
investment research, portfolio management and issuing dividends. As for
compensation, management fee is stated as a percentage of total fund value.
Shareholders are investors seeking dividend income and capital gains from shares of
the fund. When shares are sold at a higher price, shareholders can earn a capital gain.
Alternatively, shareholders may incur capital loss with selling price lower than
purchase price (Kon, 2006).
The Board of Directors appoints a fund manager to generate returns for shareholders
while satisfying the fund‟s investment objectives. To achieve economies of scale and
appeal to investors with different risk-return preferences, each FMC manages a family
of funds with different characteristics, promoting flexibility by letting shareholders
switch funds in response to different financial conditions (Reilly et al, 2003).
3
However, Unit Funds face competition from alternative investment products.
1.1.1 Macroeconomic Variables
Brinson et al (2009) defined macro economic variables as those that are pertinent to a
broad economy at the regional or national level and affect a large population rather
than a few selected individuals. The variables indentified as having major influence
include; inflation, gross domestic product (GDP), currency exchange rate, interest
rates, legal and regulatory environment and risk.
These variables are closely observed by business, governments and consumers and by
extension PE firms since they have an impact on their financial performance. Kwon &
Shin (2008) observe that; a country‟s economy affects the performance of its
organizations and by extension the most influential macro economic variables are
GDP, currency exchange rate, interest rates, inflation and market risk. Sharma and
Singh (2011) found out that many PE firms, which normally carry out their
investment over a long duration of time and usually they have an expectation that
macro-economic variables will remain stable and favorable to their operations over
the entire duration of their investment.
1.1.2 Financial Performance of Mutual Funds Industry
Financial performance refers to the act of performing financial activity. In broader
sense, financial performance refers to the degree to which financial objectives being
or has been accomplished. It is the process of measuring the results of a firm's policies
and operations in monetary terms. It is used to measure firm's overall financial health
over a given period of time and can also be used to compare similar firms across the
same industry or to compare industries or sectors in aggregation (Prasanna, 2002). In
financial performance analysis the financial strengths and weaknesses of the firm are

4
established by properly looking at the relationships between the items of the balance
sheet and profit and loss account. The first task is to select the information relevant to
the decision under consideration from the total information contained in the financial
statements. The second step is to arrange the information in a way to highlight
significant relationships and finally interpretation and drawing of inferences and
conclusions. In short, financial performance analysis is the process of collecting,
analyzing and/or reporting information regarding the performance of an individual,
group, organization, system or component.
Despite the popularity and importance of mutual fund investment, the notion of
Modern Portfolio Theory (MPT), which explains the relationship between risk and
expected returns and also the famous efficient market hypothesis (EMH), which
suggests that stock prices fully reflect information are also a challenge to the studies
in mutual funds and shift the fund performance measurement from the calculation of
crude returns to detailed explorations of the risk and returns methods.
There are several studies that have examined the performance of the investment funds
in terms of strong form tests of the EMH (Hallahan 2008; Malkiel 2005). Jensen
(1968) studied the performance of mutual funds in the US from 1945-2004. The
evidence indicates that mutual funds were not able to predict security prices to
outperform the market. There is little evidence that any individual fund was able to do
significantly better than that which was expected from mere random chance. They
also noted that these conclusions hold even when the fund returns gross of
management expenses is measured. Thus on average the funds apparently were not
quite successful enough in their trading activities to recoup even their brokerage
expenses. According to the authors the evidence, reported elsewhere, indicates the
funds on average have done an excellent job of minimizing the insurable risk borne by

5
their shareholders. According to Fama (1995), mutual funds usually make two basic
claims: (i) because funds pool the resources of many individuals, a fund can diversify
more effectively than the small investor; and (ii) because of fund management‟s
closeness to the market, the fund is better able to detect good stocks in individual
securities. In most cases the first claim is probably true. The second, however, implies
that mutual funds provide a higher return than would be earned by a portfolio of
randomly selected securities.
Fama (1995) further reported that if the initial loading charges of mutual funds are
ignored, on the average the funds do about as well as a randomly selected portfolio. If
one takes into account the higher initial loading charges of the funds, however, on the
average the random investment policy outperforms the funds. An Australian study by
Hallahan (2008) examined the performance of Australian investment funds. Four
categories of funds are examined: fixed interest; multi-sector yield; multi-sector
balanced; and multi-sector growth. This study extended the performance literature
through the use of three methodologies i) regression analysis; ii) non-parametric
contingency tables; and iii) top (and bottom) quartile rankings, to explore the
information content of fund performance for groups of funds differentiated by
investment objective. The results of the regression analysis suggest that there is
evidence in support of persistence in performance for the fixed interest funds
(particularly when performance is measured in terms of Jensen Alpha) but the
evidence in much more ambiguous evidence in relation to the multi-sector funds.
Contingency table analysis of fund performance histories of varying lengths reveals
quite different results depending upon whether raw or risk-adjusted returns are used.
Use of raw returns creates an overall impression of performance reversals, whereas
use of risk-adjusted returns suggests the existence of performance persistence. Finally,

6
the use of prior period top-quartile and bottom-quartile ranking is found to show
strong evidence of persistence in respect to the risk-adjusted performance of fixed-
interest funds.
According to Malkiel (2005), financial economists have increasingly questioned the
EMH. If market prices were irrational and if market returns were as predictable as
some critics have claimed, then professionally managed investment funds should
easily outperform a passive index fund. However, Malkiel‟s paper shows that
professional investment managers, both in the US and elsewhere, do not outperform
their index benchmarks, and provides evidence that market prices seem to reflect all
available information. Malkiel (2005) further states that there is overwhelming
evidence that active equity management is a "loser's game". Switching from security
to security does not increase return but increases transactions costs and decreases
return. Thus, even if markets are less than fully efficient, stock indices are likely to
outperform the active portfolio management. One of the successful investors, Warren
Buffett, advised in Malkiel (2005) most investors, both institutional and individual,
will find that the best way to own common stocks is through an index fund that
charges minimal fees. Those following this path are sure to beat the net results (after
fees and expenses) of the great majority of investment professionals (Malkiel, 2005).
1.1.3 Macroeconomic variables and Financial Performance
Macroeconomic variables have systematic effects on stock market returns. Asset
prices depend on their exposure to the fundamental variables describing the economy.
Recently, there have been advances made, however, in respect of how researchers
incorporate the potential impact of environmental, economic and regulatory factors on
organizational performance (Akhigbe and McNulty, 2003). The external variables

7
(which are added as control variables to the functional form equation) are assumed to
have a direct effect on the production/cost structure. The external factor variables are
typically introduced as non-discretionary inputs and/or outputs, having a direct effect
on the efficient production frontier. The effect of macroeconomic factors on
organizational could be different across countries (Drake et al, 2006).
MF performance is also heavily influenced by the performance cycle and the
intervention of macroeconomic variables within the industries or the ventures in
which the funds invest, such as technology versus manufacturing, or venture capital
versus buyout. Time duration also has notable effect on the returns realized.
Generally, MF investments usually take an average time period of ten to twelve years
to recoup back their initial investment outlay and generate considerable returns for the
managers to consider the exit option (Jensen and Smith, 2000).
1.1.4 Mutual Funds Industry in Kenya
The mutual fund industry in Kenya is very young having started with the passage of
the Capital Markets Amendment Act (2000), which recognizes specific investment
vehicles and especially mutual funds. Despite "the enactment of the Act, the mutual
fund industry did not take off until December 2011 when African Alliance Kenya was
licensed by the Capital Markets Authority (CMA) to set up the very first regulated
mutual fund. It currently offers three different investment alternatives to both
institutional and individual investors namely the managed fund, Shilling Fund and
Fixed Income Fund. The trustee and custodian of the funds is Stanbic Bank Kenya
Limited, auditors are KPMG Kenya, and the Fund Administrators are African
Alliance Kenya Management Company Limited. This was later followed by Old
Mutual Asset Managers (OMAM) Kenya Limited that launched both the Old Mutual

8
Equity Fund and the Old Mutual Money Market Fund that started operations on 1st
April 2003. The trustee and custodian of the funds is Kenya Commercial Bank
Limited, auditors are PricewaterhouseCoopers Kenya, and the Fund Manager is Old
Mutual Investment Services Kenya Limited. The latest entrant to the mutual fund
industry is the British American Investment Group which in July 2005 launched an
investment advisory and asset management company known as British American
Asset Managers that will offer a comprehensive range of domestic investment
products. These include an Equity Fund, Balanced Fund, Money Market Fund and an
Income Fund. The trustee and custodian of the funds is Kenya Commercial Bank
Limited, auditors are PricewaterhouseCoopers Kenya, and the Fund Manager is
Britam Asset Managers Company.
Ochieng (2005) observed that Old Mutual Asset Management Kenya was established
in 2007 and started operations in April 2008. As at April 2005, the total assets under
management were over Kshs 49 billion and of this, the Equity fund that started
operations on 1st April 2003 had an approximate net asset value of Kshs 2.0 billion.
Gitman and Joehnk (2011) observed that one of the critical costs of mutual funds is
the tax paid on transaction of securities. To avoid double taxation, most mutual funds
world over operate as regulated investment companies. This means that all (or nearly
all) of the dividend and interest income is passed on to the investor, as are any capital
gains realized when securities are sold. The mutual fund therefore passes the tax
liability on to its shareholders.
The Kenyan capital markets offer an array of investment products in the form of
shares, bonds and unit trusts. The type of products chosen by the investor to commit
his capital depends largely on his financial goals, time frame, and amount of capital
available. Unit trusts have grown in acceptance and popularity in recent years. This is

9
evidenced by the growth in the number of approved unit trust funds from virtually
zero in 2011 to 11 in 2008. Unit trusts are the small investor‟s answer to achieving
wide investment diversification without the need of prohibitive sums of money. As a
market becomes sophisticated and more volatile, unit trusts become safe havens for
less sophisticated and less capitalized, conservative individuals in the market place.
According to the CMA Regulation of Unit Trusts, Only unit trusts schemes that are
approved by the Capital Markets Authority may be offered for sale to the Kenyan
public. Such schemes must comply with the Capital Markets Act Cap 485 A and also
the Capital Markets (Collective Investment Schemes) Regulations, 2011. An
approved fund can easily be identified by the cover of its prospectus which contains a
statement that a copy of the prospectus has been lodged and approved by the Capital
Markets Authority (Capital Markets Auhority, 2011).
Although there are laws and guidelines to aid investor protection, it is ultimately
investor‟s responsibility to evaluate the suitability, profitability and viability of an
investment. An investor must read the information which is required to be provided in
the prospectus and make the decision whether to invest or not, based on their own
circumstance and attitude to risk.
In 2011, the Capital Markets (Collective Investment Schemes) Regulations, 2011
were enacted to provide a framework for the regulation of Collective Investment
Schemes which included; Pooled funds where Investors contributions are pooled to
purchase financial securities and the investors are the owners of the Fund‟s assets.
Since 2003, investors have invested over KShs 10 billion (US$ 145 million) in unit
trusts in Kenya. Recent Performance of Kenya‟s Investment Markets indicates that
Kenya‟s capital and equity markets has continued to deepen and has posted attractive

10
returns over the last couple of years. During 2005, the NSE index was up 34%, while
in 2007 the index is up 37%. The NSE index also crossed the 5,000 point in Oct 2007,
previous cross over was on 7 March 2009, over 12 years ago. In 2007, there were 3
new IPOs (KenGen, Scan Group and Eveready). During the period 2003 to date,
market capitalization of the NSE increased from KShs 100 billion to the current KShs
800 billion, an 8 fold increase in 3 years (Capital Markets Authority, 2011).
1.2 Research Problem
Studies done on mutual fund performance have reported that most funds did not
match performance of comparable market indexes (Fortin and Michelson, 2005,
Goetzmann and Ibbotson, 2009). According to these studies, slightly more than 50
percent of mutual funds outperformed their targeted markets before considering
transaction costs. After considering such costs, more than 60 percent of funds did not
match their market performance, with the remainder performing inconsistently.
Besides, the extent to which individual macroeconomic variables elements contribute
to financial performance give mixed results with some (Wang and Chang, 2005;
Edvinsson and Malone, 2010) showing a significant and others insignificant
relationship (Goh, 2005).
The continued poor performance of mutual funds in the presence of increased
investments in intellectual assets raises questions on the substance of macroeconomic
variables in addressing the challenges facing the mutual funds in Kenya.
Unimpressive mutual funds are therefore facing competition from newer alternatives,
including exchange-traded funds (ETFs), folios and separately managed accounts.
These alternatives offer certain advantages over mutual funds. For example, ETFs
combine features of index funds with low expenses for trading stocks; folios let

11
investors customize diversified stock portfolios; while separately managed accounts
give investors access to professional managers who choose stocks for multiple
accounts to achieve diversification.
Locally, Wagacha (2011) outlined that with the passage of the Capital Markets
Authority Amendment Act (2000), which recognizes specific investment vehicles and
especially mutual funds and unit trusts, then more opportunities for diversification by
both institutional and retail investors would emerge in Kenya. Further, Mutua (2006)
did an assessment of performance of active mutual fund management & passive fund
management, Muriira (2010) also conducted an assessment of marketing and
advertising strategies among insurance firms and their impact of performance: A case
of Old Mutual Life Assurance Company, Kamanu (2011) did a study on the influence
of board attributes on firm value a case study of mutual funds in Kenya. Although a
number of limited studies have been done locally on effect of macroeconomic
variables, macroeconomic factors vary from one jurisdiction to the other. An
understanding on macroeconomic variables affecting the financial performance of MF
is necessary which the previous local studies in MF done in Kenya such as Tuimising
(2012), Murithi (2012) and Njau (2013) have left unaddressed. Many Mutual Fund
investors have little or no knowledge at all on what affects their returns. This study
therefore seeks to find out how Mutual Fund performance is affected by various
macroeconomic determinants. This study therefore seeks to fill this research gap by
answering the following question; what are the effects of the selected macroeconomic
variables on the financial performance of MF in Kenya?
12
1.3 Research Objective
The objective of this study is to establish the effect of macroeconomic variables on
financial performance of mutual funds industry in Kenya.
1.4 Value of the Study
In developed and developing leading countries, capital market is considered as the
main source of financing and absorbing saving resources. On the other hand, this
market has created the logical relationship between average income groups and the
body of the economy, and has provided the possibility of people‟s presence and
attachment to the economy. Thus, investigating the effect of economic variables on
return can be very helpful on investment. Investors and managers of mutual funds
reflecting on the studies conducted and the results of this study could have significant
measures in their decisions. Thus, the fund managers, by understanding the causes of
return change, and the investor's tolerance for risk taking, can make the best portfolio
for investors that have maximum return, and on the other hand, investors need to
know when to buy which share and when to sell which share. All these form the
specialized knowledge of Stock portfolio Management in which ordinary people are
not expert, so the best way is to entrust our savings to professional managers of
mutual funds. Fund managers make investment decisions for the investors. They seek
to increase the penetration ratio in the market. Fund performance is therefore affected
by the decisions made by these managers. This study will therefore, be of help to
them execute their role effectively.
Information on mutual funds will guide the authorities in formulating proper policies
and legal mechanisms to guide the operations and foster the growth of this fledgling

13
industry. This will widen the government tax base through attraction of both local and
foreign players to mutual funds. The study also aims at shedding light on how mutual
funds are influenced by various macroeconomic factors which will aid practitioners in
making concrete policies to guide the industry and promote good corporate
governance.
The information that will be obtained will be useful to the Government and research
institutions that may want to advance the knowledge and literature on macroeconomic
variables. It will also add to literature on the subject as reference material and
stimulate further research in the area.
14
CHAPTER TWO
LITERATURE REVIEW
2.1 Introduction
In this second chapter, relevant literature information that is related and consistent
with the objectives of the study is reviewed. Important issues and practical problems
are brought out and critically examined so as to determine the current facts. This
section is vital as it determines the information that link the current study with past
studies and what future studies will still need to explore so as to improve knowledge.
2.2 Theoretical Review
This section looks at the theories under which the study is hinged. It specifically
focuses on portfolio theory, capital assets pricing model (CAPM) and arbitrage
pricing theory (APT).
2.2.1 Portfolio Theory
Portfolio theory, created by economists, was a breakthrough in financial economics.
This theory looks at the stock market as a whole and analyses how, for a given rate of
expected return, assets can be invested efficiently and how risk can be minimized. An
effectively diversified portfolio minimizes the unsystematic risk which is affected by
factors that are specific to the individual firms and, to some extent, the industry in
which the firm operates. The unsystematic risk is, therefore, manageable by
diversification. The systematic risk, however, cannot be managed by a simple
approach of diversification. Despite the fact that there are many other factors
15
contributing to the systematic risk of a portfolio, the risk and return of a diversified
portfolio is mainly affected by domestic and overseas economic factors.
Portfolio theory, developed in the 1950s by Harry Markowitz, and complemented by
Tobin (1958), was a revolution in financial economics. This theory analyses how, for
a given rate of expected return, assets can be combined to minimize total risk,
comprising unsystematic and systematic risk. Unsystematic risk can be minimized by
diversification but systematic risk cannot be minimized by diversification. Consistent
with the diversification and risk minimization essentials of the portfolio theory,
modern financial theory has focused on macroeconomic variables as the likely
sources of systematic risk.
Portfolio Theory was a very significant contribution in financial economics
developed, in the early 1950s, by Harry Markowitz and contributed to by Tobin
(1958). This theory analyses how assets can be invested optimally and how risk can
be minimized under a set of assumptions. Modern portfolio theory is the philosophical
opposite of traditional stock picking. It is based on principle which attempt to
understand the market as a whole. It provides a broad context for the interactions of
systematic risk and return. An effectively diversified portfolio minimizes the
unsystematic risk, which is affected by microeconomic factors specific to the
individual firms. The systematic risk, which is mainly created by macroeconomic
factors, cannot be eliminated by diversification. Therefore, one can say that risk and
return on a diversified portfolio depend on domestic and foreign economic and
financial variables. This is the area of concentration for this thesis.
Modern portfolio theory was introduced by Markowitz (1952). This article covers the
highlights of portfolio theory. It describes how risk and its effects on return are

16
measured. While investors before then knew intuitively that it was smart to diversify
(i.e. don‟t put all your eggs in one basket), Markowitz was among the first to attempt
to quantify risk and demonstrate quantitatively why and how portfolio diversification
reduces risk. He formulated the theory of optimal portfolio selection in the context of
trade-offs between risk and return, focusing on diversification as a method of
reducing risk. Markowitz (1952) realized that, as the fundamentalist notion relied on
expectations of the future, then the element of risk must come into play and thus
profitable use could be made of the newly developed expected utility theory.
It was a logical step for James Tobin (1958) to add money to Markowitz's story and
thus obtain the famous "two-fund separation theorem". Effectively, Tobin argued that
agents would diversify their savings between a risk-free asset (money) and a single
portfolio of risky assets (which would be the same for everyone). Tobin contended
that different attitudes towards risk would merely result in different combinations of
money and that unique portfolio of risky assets.
Portfolio theory of Markowitz (1952) and Tobin (1958) has strongly shaped how
institutional portfolios are managed, and motivated the use of passive investment
management techniques. The mathematics of portfolio theory is used extensively in
financial risk management and was a theoretical precursor for today's value-at-risk
measures.
Performance of portfolios has been tested empirically. Fama and MacBeth (1973)
tested the relationship between average return and risk for New York Stock Exchange
common stocks. The basis of the test is the two-parameter portfolio model of
Markowitz (1952) and Tobin (1958), and models of market equilibrium derived from
the two-parameter portfolio model. They concluded that the pricing of common stocks
17
reflects the attempts of risk-averse investors to hold portfolios that are efficient in
terms of expected value and dispersion of return. Specifically, there seems to be a
positive trade-off between risk and return, with risk measured from the portfolio
viewpoint. Moreover, the observed "fair game" properties of the coefficients and
residuals of the risk-return regressions are consistent with an efficient capital market;
that is, a market where prices of securities fully reflect available information. In the
two-parameter portfolio model, the capital market is assumed to be perfect.
Investment funds use all theoretical and technical measures including portfolio theory
and it is expected they will outperform the market. However, there are empirical
studies reporting the opposite. For example Elton, Gruber and Blake (2008) reported
that there is overwhelming evidence that, post expenses, mutual fund managers on
average underperform a combination of passive portfolios of similar risk. This article
examines mutual fund predictability for common stock funds and measures
performance using risk-adjusted returns. A more recent study by Low (2007) found
similar results studying the Malaysian unit trust performance.
2.2.2 Capital Assets Pricing Model (CAPM)
Subsequent developments in financial theory have resulted in rigorous economic and
financial theories including the market equilibrium models such as, the Capital Assets
Pricing Model (CAPM). The CAPM is called the single factor model and the APT the
multifactor model. These two theories integrate portfolio theory (risk and return) to
the macroeconomic variables which are systematic risk factors. They are used to
determine the market price for risk and the appropriate measure of risk for a single
asset or portfolio.

18
The Capital Asset Pricing Model (CAPM) was developed by Sharpe (2004), and
contributed to by Lintner (1965) and Mossin (1966). However, William Sharpe was
the leading figure. The CAPM is known as the single factor (or single index) asset
pricing model which integrates only one macroeconomic variable, the return on the
market, to the return on individual stock through the value of the beta (β).
Portfolio theory was not very practical to minimize the systematic risk and it required
too many calculations to estimate the benefits of diversification. Diversification
minimizes the unsystematic risk however; it cannot minimize the systematic risk
generated by macroeconomic variables. Therefore, the CAPM is an attempt to
minimize systematic risk by using the market return.
Because of these calculation difficulties Sharpe (2004) extended Markowitz‟s
portfolio theory by developing a simplified portfolio selection model on the second
stages of the portfolio selection process. The model developed in Sharpe (2004) is
also called the Market Model or Single Index Model. He suggested abandoning the
covariance between each security and related each security to the market. This model,
to obtain the same results with much larger relationships between securities, uses
relatively few parameters. Benefits are low cost and less information is needed to
establish an effective portfolio.
Blume and Friend (1973) examined the CAPM both theoretically and empirically in
greater depth what was done previously by the authors. The reason for this is the
market line theory does not adequately explain differential returns on financial assets.
The empirical results cast serious doubt on the validity of the market line theory in
either its original form or as recently modified. On the other hand, their results show
the linearity of the relationship for NYSE stocks. Blume and Friend (1973) concluded

19
that the evidence in their paper seems to require a rejection of the CAPM as an
explanation of the observed returns on all financial assets, if return generating process
for common stocks takes the general form.
Fama and MacBeth (1973), using a cross-sectional regression between 1935 to 1968,
developed a model to test CAPM. Their results support the testable implications of the
two-parameter model. They cannot reject the hypothesis that average returns on
common stocks reflect the attempts of risk averse investors to hold efficient
portfolios. Specifically, on average there seems to be a positive trade-off between risk
and return. In addition, although there are stochastic non-linearities from period to
period, they cannot reject the hypothesis that on average their effects are zero and
unpredictable, different from zero from one period to the next. Thus, they cannot
reject the hypothesis that in making a portfolio decision, an investor should assume
that the relationship between a security‟s portfolio risk and its expected return is
linear, as implied by the two-parameter model. They also cannot reject the hypothesis
that the two-parameter model that has no measure of risk, in addition to portfolio risk,
systematically affects average returns. Finally, the observed fair game properties of
the coefficients and residuals of the risk return regressions are consistent with
efficient capital markets.
Durack et al (2004), using Australian data, tested the Conditional Capital Asset
Pricing Model (betas and the market risk premium vary over time). Their results
support the model, which performs well compared to a number of different asset
pricing models. However, they found that the inclusion of the market for human
capital does not save the concept of the time-independent market beta (it remains
insignificant). They found support for the role of a small-minus-big factor in pricing

20
the cross-section of returns and find grounds to disagree with the argument that this
factor proxies for misspecified market risk.
2.2.3 Arbitrage Pricing Theory (APT)
Ross (2008) developed the APT and Roll and Ross (1995) provided a more intuitive
explanation of the APT and discussed its merits for portfolio management. The APT
is an alternative approach to the CAPM that has become the major analytic tool for
explaining the phenomena observed in capital markets.
The model begins with the assumption that actual return on any security is equal to its
expected return plus a series of impacts on return (i.e. macroeconomic variables). It
breaks up the single factor CAPM into several components. The CAPM predicts that
security rates of return are linearly related to a single common factor, the rate of
return on the market portfolio (Sharpe, 2004). The APT is based on a similar intuition
but is much more general. The CAPM is viewed as a special case of the APT when
the market rate of return is the single relevant factor.
The APT is an alternative asset-pricing model to the CAPM differing in its
assumptions and explanation of risk factors associated with the risk of an asset. The
CAPM specifies returns as a linear function of only systematic risk. The APT
specifies returns as a linear function of more than a single factor. It predicts a
relationship between the returns of portfolio and the returns of a single asset through a
linear combination of variables. The APT approach moved away from the risk versus
return logic of the CAPM, and exploited the notion of "pricing by arbitrage" to its
fullest possible extent. As Ross (2008) himself has noted, arbitrage-theoretic

21
reasoning is not unique to his particular theory but is in fact the underlying logic and
methodology of virtually all of finance theory.
There are many multifactor asset pricing models developed in the literature. There are
multifactor assets pricing models used to manage the systematic risk which is created
by the macroeconomic variables. Among these models, the Arbitrage Pricing Theory
(APT) is the most widely used risk management model. This model has been
developed to minimize the total risk using macroeconomic variables. Many
multifactor assets pricing models developed in the literature are different versions of
the APT theory. According to Sinclair (2004), many of them can be treated as special
theoretical cases of the APT. However, the APT is yet to address the issues of the
magnitude of factors and the identification of the common sources of risk.
The APT has been intensively investigated in the US by Priestly, (2002). According
to Sinclair (1989) overall acceptance of the APT has been tentative. There are serious
unresolved methodological issues involved in testing the APT and the identification
of the macroeconomic variables. Unless the number of factors and their identity are
universally established, practical application of the APT will be difficult.
Later studies questioned the validity of the APT. Qi and Maddala (2008) argued that
stock market prediction is problematic and many of the multifactor models developed
are inefficient. According to Nawalkha (2007) from the very beginning many
researchers were skeptical, and believed that APT offered too much for too little.
Beenstock and Chan (2007) presented a study proposing an alternative methodology
for testing Arbitrage Pricing Theory (APT) in the context of the market for British
securities. Using the macro variable model, they identified four macroeconomic

22
variables for the UK market: Interest rates; Fuel and material costs; Money supply
and Inflation.
The arbitrage pricing theory (APT) with macroeconomic factors, put forward by Chen
et al. (2004), was tested by Groenewold and Fraser (2010) using monthly Australian
sectorial share-price indexes for the period 1980-1994. The inflation rate was found to
be consistently priced. The significance of other factors was found to depend on their
choice of sample period and estimation model. They found that; the rate of inflation,
the short-term interest rate, and the money growth rate are priced factors. They found
less support for output, employment, exchange rates and balance of payments.
2.3 Determinants of Performance of Mutual Funds
Many authors have tried to explain the performance of mutual funds, which is a
critical aspect in investor fund selection. Several fund characteristics have been
analyzed as potential determinants of future fund performance, including fund size,
age, fees and expenses, loads, turnover, flows, and returns. Most authors conclude that
mutual funds underperform the market, but some others find that managers display
some skill. In particular, there is evidence of short-term persistence in funds
performance and that money flows to past good performers. Investors display some
fund selection ability as they tend to invest in funds with subsequent good
performance. There is also evidence that fund performance worsens with fund size
and fees (Boudoukh and Richardson, 2008).
Controlling for fund size, fund performance actually improves with the size of its fund
family as large fund families‟ benefit from substantial economies in trading
commissions and lending fees. Gay (2008) find similar evidence for US funds. It is

23
also clear that organizational diseconomies, in particular hierarchy costs, erode fund
performance. Large organizations with hierarchies are particularly inefficient in
processing soft information, which is pivotal in the case of mutual funds as managers
may have a hard time convincing others to implement their ideas. Consistent with this
view, solo-managed funds perform better than team-managed funds in a worldwide
sample of funds.
Other fund characteristics have a variety of effects on performance. Fund age is
negatively related to fund performance in the sample of non-US funds, but this
relation is statistically insignificant in the sample of US funds. This indicates that
younger funds are better able to detect good investment opportunities outside the USA
(Groenewold and Fraser, 2010).
Hasan (2008) also examine the effects on fund performance of past performance and
flows. He found evidence of short-run persistence in fund performance but only in the
case of US funds. The evidence on persistence is consistent with the US evidence
(Hasan, 2008).
Investors outside the USA seem to have some ability to select funds as money flows
to funds with good future performance. They find, however, that the „„smart money‟‟
effect is statistically insignificant in the sample of US funds. This is consistent with
the US evidence in Jaffe and Mandelker (2008) that the smart money effect is
explained by momentum. The performance of the funds is also affected by various
factors in the external environment such as money supply, interest rate, inflation rate,
GDP and exchange rates. This study sought to establish the effect of these
macroeconomic variables on the performance of mutual funds in Kenya.

24
2.4 Empirical Review
Several studies have been carried out on the impact of economic variables on stock
returns and also fund returns in Kenya and other countries: Miller and Show fang
(2001), in an article examined the falling exchange rates and stock markets in South
Korea, which the results suggested that the decrease in exchange rate has a negative
effect on stock return and exchange rate fluctuations leads to the fluctuation in the
stock market.
Chen et al (2004) chose a set of economic state variables as candidates for sources of
systematic asset risk. Several of these economic variables were found to be significant
in explaining expected stock returns. The authors did not completely investigate the
significant macroeconomic variables but selected some variables that showed some
significance compared to other possible macro variables.
Bigdlou and Safari (2005), in his research came to the conclusion that by increasing
the number of stocks in the portfolio the unsystematic risk can be reduced, and the
fact that if the baskets are quite varied, the rankings of performance based on
indicators of Sharp and Trainer will be closer together.
Gay (2008) investigated the impact of macroeconomic variables on stock return for
four emerging economies, including Brazil, Russia, India and China. Some of his
desired macroeconomic variables were exchange rate and oil price that concluded that
there is no significant relationship between relative exchange rate and oil prices on the
index of stock market.
Dash and Dinesh Kumar (2008) examined the impact of macroeconomic variables
such as exchange rate, inflation rate, oil price, interest rate and market return by
25
observing high volatility in Indian financial markets, the results indicated that return
and variance of some of the funds return is affected by macroeconomic variables, and
also 35.29% of the desired funds were not sensitive to any of the macroeconomic
variables.
Tursoy et al., (2008) tested the APT in the Istanbul Stock Exchange (Turkey) using
monthly data between February 2001 and September 2005. In this paper, various
macroeconomic variables which represent the basics of an economy were employed.
They are; money supply, industrial production, oil price, consumer price index,
import, export, gold price, exchange rate, interest rate, GDP, foreign reserve,
unemployment rate and a market pressure index which is built by the authors. They
tested these macroeconomic variables against 11 industry portfolios using ordinary
least square technique. Their result indicates that there is not a significant relationship
between stock return and these macroeconomic variables. However, each
macroeconomic variable affects different industry portfolios to a different degree.
Humpe and Macmillan (2009) studied the effect of several macroeconomic variables
on the stock prices in the US and Japan using monthly data between 1965 and 2005.
They studied the relationship within the framework of a standard discounted value
model and they applied co-integration analysis between industrial production, the
consumer price index, money supply, long term interest rates and stock prices in the
US and Japan. Using the US data they found a single co-integrating vector, between
stock prices, industrial production, inflation and the long term interest rate. Stock
prices are positively related to industrial production and negatively related to both the
consumer price index and a long term interest rate. They also found an insignificant
but positive relationship between US stock prices and the money supply. Using the

26
Japanese data Humpe and Macmillan (2009) found two co-integrating vectors. For the
first vector, stock prices were influenced positively by industrial production and
negatively by the money supply. For the second co-integrating vector, industrial
production was negatively influenced by the consumer price index and a long term
interest rate. This study gives contrasting results and they explained these contrasting
results by the slump in the Japanese economy during the 1990s and consequent
liquidity trap in the late 1990s and early 2000s.
Brinson et al. (2009) presented a framework for determining the contributions of
different aspects of the investment management process-asset allocation policy, active
asset allocation, and security‟s election to the total return of investment portfolios.
Data from 82 large pension plans - the main PE fund contributors sampled in the
study indicated that asset allocation policy, however determined, is the
overwhelmingly dominant contributor to total return and financial performance of PE.
Najarzadeh et al (2009) argue that the long-term equilibrium relationship between the
of the Tehran Stock Exchange stock price index and variables of the real exchange
rate and inflation rate is significant and shocks resulting from inflation and exchange
rate have a negative impact on stock prices index in the long term and have a positive
impact in the short term. However, the impact of shocks resulting from inflation rate
on the real return of stocks is stronger than shocks caused by exchange rate.
In another study carried out by Mashayekh and Haji Moradkhani (2009) indicated that
the inflation rate in the long-run has a positive relationship with the variables of the
Tehran Stock Exchange and when the interest rates of one-year bank deposits were
used as the index of guaranteed interest rate an inverse and significant relationship
was observed. But when the interest rate of securities was used as an index of

27
guaranteed interest rate a positive and significant relationship was found. About the
relationship between gold‟s return and return and volume of stock trading, the results
showed that in the short term gold market is a substitute market for the stock market,
although in the long run this relationship is not significant.
Pourzamani et al (2010) examined the impact of some management and
environmental factors on the return of 13 mutual funds, which showed there is a
significant positive correlation between volatility of fund return up to prior period,
fund return of prior period, fund age, asset turnover rate managed by fund up to prior
period and return earned by the fund, and also there is a significant difference
between the asset turnover rate managed by fund up to prior period, fund expenses
and new money growth rate compared to the previous period, and the fund return.
Sajjadi et al (2010) examined the long-run relationship between the growth rate of
stock cash return index and a set of macroeconomic variables such as inflation rate,
money supply growth rate, exchange rate and oil revenues. The co-integration test
indicated a long-term relationship that there is a positive relationship between
inflation rate and growth rate of cash return index of stock and there is a negative
relationship between exchange rate and oil revenues, with growth rates of cash return
index.
Saeedi et al. (2010), in his research investigated factors affecting the performance of
20 payment funds that the results showed a significant linear correlation between the
6 variables (in priority order) of the market return, rate of the fund value growth, the
absolute deviation from mean of fund return, the value of the issuance of investment
units, the ratio of fund activity, the value of cancellation of investment units with the
return of investment funds.

28
Karimzadeh and Sultani (2010) found a long-run relationship between the index of
stock prices of financial intermediation industry and macroeconomic variables of
money that cash had a significant positive impact on the index of stock prices of
financial intermediation industry and exchange rate and interest rate had a
meaningless negative impact on index of stock prices of financial intermediation
industry. Shahbazi (2011) in his research concluded that the average of funds return
has meaningful relationship with market return.
Siqueira et al (2011) investigated the macro economic variables on financial
performance of PE and venture capital (PEVC) funds in Brazil. They used data
covering the period between 2008 and 2007. Their results indicated that the factors
influencing the performance of investments are: size of the fund, number of
investments, the practice of co-investment, experience and foreign origin of the
managing organization, focus on late stage, intensity of contact between managers
and portfolio companies and the number of seats on the boards of the invested
companies. The success grows with the number of investments at a declining rate.
Cheung and Ng (2011), using data from Canada, Germany, Italy, Japan and America,
examined the relationship between indexes of the stock market and macro-economic
variables. They showed that the change in the total stock index is convergent with the
change in macroeconomic variables.
Singh et al. (2011) in their study found that the unemployment rate, inflation and
money supply have a negative relationship with stock return for all six portfolios of
large and medium companies, and on the other hand, GDP and exchange rate have a
positive relationship with stock return. For small companies, the result is a little
different. For P / E portfolio only the exchange rate has a positive relationship with

29
return. In the Yield portfolio, exchange rate and unemployment rate are positively
correlated, while for PBR portfolio, exchange rate and inflation rate are positively
correlated with stock return.
Bialkowski and Roger (2011) tested the performance and durability of the Polish
mutual funds with a consistent controlled sample of 140 funds in the years 2000-2008
using a two-factor model of Carhart, and found that weaker legal institutions and
underdeveloped capital markets may negatively affect the performance of mutual
funds.
Murithi (2012) did a study on the risk return assessment among PE firms in Kenya.
He analyzed data using the Fama and French model to measure risk and return of PE
investments. Out of a population of 14 firms he sampled, he established that low risk
experienced in the period of his study was as a result of high Treasury bill rate during
this period. Another factor is that the financial sector was not immediately affected
during the financial crisis in Europe and. At the onset some commentators were
pessimistic about the prospects for PE-backed buyouts in Kenya. The study also
established that the PE industry being young in Kenya was attracting many
international firms to invest because he argued that Kenya has a lot of potential in PE
which is unexploited. The risk free rate was higher than the return in some years. It is
also known that PE companies generally have higher financial leverage which the
author established that it is often in parallel with stronger productivity growth. PE
portfolio firms take advantage of the young market in Kenya to mobilize capital
through advertising and encouraging pension funds managers to participate.
Illo (2012) carried out a study to establish the effect of macroeconomic factors
affecting commercial banks financial performance in Kenya. The author identified

30
interest rates, GDP growth rate, currency exchange rate, money supply and inflation
as the main macroeconomic factors affecting commercial banks financial
performance. A total of 10 commercial banks were sampled in the study for a 10 year
period from 2002 to 2012. Regression analysis was used with the factors taken as the
independent variables and Return on Assets (ROA) taken to be the dependent
variable. Commercial banks financial performance was found to be positively
correlated with money supply, interest rates and GDP growth. On the other hand a
negative relationship was established between inflation and depreciation of the local
currency. Though this study was carried out among commercial banks, macro-
economic variables remain the same and they affect every economic activity albeit
with varying degree of proportions.
Mohammadreza and Esmaeel (2013) examined the impact of macroeconomic
variables (exchange rate and inflation rate) on the return of mutual funds in Iran.
Hypotheses of this study are tested by investigating panel data of all the mutual funds
since 2008 to 2011 with monthly data. GlS procedure by Eviews7 software was used
for data analysis. The results of the study showed a significant positive relationship
between the fund return, the exchange rate and inflation rate. Also there is a
significant positive relationship between fund assets and fund age with the fund
return.
Njau (2013) did a study on the effect of selected macroeconomic variables on the
financial performance of private equity firms in Kenya. The variables selected were
those that were perceived by the researcher and supported by previous empirical
studies, to have the highest effect on financial performance of PE firms as measured
by Return on investment (ROI). These are inflation rate, GDP growth rate, bank

31
lending rates, exchange rate of dollar versus KSH and systematic risks. ROI was
taken to be the dependent variable while inflation, GDP growth rate, bank lending
rates, exchange rate and systematic risk were taken to be the independent or predictor
variables. The study also considered an error term as a representative of other non key
variables which had not been included in the model. The study period ranged from
2005 to 2012 within every quarter of a year, therefore consisting of 32 observations.
The data was analyzed using SPSS version 11 for Windows. Multivariate regression
model was employed in the study. To further ensure the model‟s significance and
goodness of fit, an F test and Analysis of Variance (ANOVA) were used. Out of the
private equity (PE) firms sampled, the study established that PE firms‟ in Kenya ROI
was heavily influenced by the selected macroeconomic variables with GDP having
the largest influence and systematic risk having the least impact. The computed R2
was established to be of 0.728 which shows there is a positive and strong correlation
between the selected macroeconomic variables and ROI. 72.80% of ROI is influenced
by the selected variables while 18.2% shows ROI affected by other variables not
included in the regression, more specifically the error term. The study also established
positive correlation between the dependent and independent variables albeit to
varying degrees. Gross domestic product, inflation and banks‟ lending interest rates in
that respective order were established to be the macroeconomic factors that had the
greatest positive effect on PE firms‟ financial performance while exchange rate of the
dollar against the Kenya Shilling showed a negative relationship albeit to a small
extent. Hence, these macro-economic variables should be carefully be considered by
all stakeholders in the PE industry. Therefore this study proves, lends credence and
confirms the researcher‟s theory that the financial performance of PE firms is affected

32
by fundamental macroeconomic factors such as GDP, inflation, currency exchange
rate, interest lending rates and market risk.
2.5 Summary of the Literature
This chapter examined the studies done which relate to macroeconomic variables and
financial performance of mutual funds. It also looked into portfolio theory, capital
assets pricing model (CAPM) and arbitrage pricing theory (APT). Most of these
theories are in general organization or stock market performance with no specific
focus on mutual funds whose operation is different.
Most of the reviewed studies have been conducted in developed countries whose
strategic approach and financial footing is different from that of Kenya. This
discussion clearly shows the information gap on how funds‟ performance is affected
by various external/ macroeconomic factors or determinants. Integration of
performance measures and macroeconomic determinants of mutual fund helps bridge
this gap.

33
CHAPTER THREE
RESEARCH METHODOLOGY
3.1 Introduction
This chapter describes the procedures and methodologies that were undertaken in
conducting the study to arrive at conclusions regarding the effect of macroeconomic
variables on financial performance of mutual funds in Kenya. Specifically, the chapter
covers: research design, population, data collection, data analysis and model
specification.
3.2 Research Design
This study took a causal research design approach. Causal Research explores the
effect of one thing on another and more specifically, the effect of one variable on
another, that is, concerned with cause-and-effect relationships between two or more
variables. Being that the study sought to find out the effect of the macroeconomic
variables of mutual fund on performance, a causal research design was deemed
appropriate.
3.3 Population
The study entailed a census of all the mutual funds operating in Kenya with equity
portfolios licensed by the Capital Markets Authority. This took into consideration all
mutual fund companies listed in Nairobi stock exchange both bank and non-bank
companies. These are the Balanced Fund under African Alliance Kenya and the
Equity Fund under Old Mutual Asset Management (OMAM) Kenya. The study also
covered banking institutions with mutual funds.

34
3.4 Data Collection
The study solely used annual report data sources available at the companies‟ books of
account, Kenya national bureau of statistics and the NSE or Capital Market Authority
offices. The Secondary data sources were chosen owing to the fact that they are
cheaper and more quickly available than primary data and help clarify and answer
research question. From Central Bank of Kenya the following reports were obtained
for the respective variables: Monthly money supply report for money supply data,
Average bank deposit interest rates on a monthly basis and Average Foreign
Exchange rate for the USD on a monthly basis. Data on GDP ratios were obtained
from Kenya National Bureau of Statistics on monthly basis as well as monthly
inflation rates. Return on Investment was computed by dividing Net Income with
Total Investments per Mutual Fund by use of Annual Balance sheet reports as every
listed company is required to report the extent to which they complied with the
performance principles in their annual reports, Assets Under Management Reports
and cumulative fund performance per fund information about corporate governance
was readily accessible at the CMA. The study covered the period 1st January 2009 to
30th December 2013 this study sought to evaluate annual report data. This is the
period in which Mutual Fund industry started to have a phenomenal growth in Kenya.
3.5 Data Analysis
The study used data analysis software such as, Microsoft Excel and SPSS version 21
to analyse the data. The study used multiple linear regression equation and the method
of estimation was Ordinary Least Squares (OLS) so as to establish the relationship
between macroeconomic variables and mutual fund performance. The analyses
entailed the computation of the various coefficients of the independent variables
correlated against the ROI. The macroeconomic variables coefficients are denoted as

35
“β” in the model.
3.5.1 Analytical Model
Regression was employed to examine the effect of selected determinant variables on
the performance of mutual firms. The regression equation is a multivariate function.
The independent variables of the study comprised of Money supply, Interest rate,
Inflation rate, GDP and Exchange rates. The dependent variable which was the
performance of mutual funds in Kenya was expressed as ROI. Thus, the regression
equation appeared as follows:
Y = β0 + β1X1+ β2X2+ β3X3 + β4X4 + β5X5 + ε
Where:
γ – Fund performance (Return on Investment (ROI))
β0 - Constant/Y intercept
X1 - Money supply
X2 - Interest rate
X3 - Inflation rate
X4 - GDP
X5 - Exchange rates
ε - Error term
In computing the regression model, the fund performance was measured using the
Return on Investment (ROI) which is computed by dividing net profit with investment
and then multiply by 100; the Money supply was measured using the monthly money
supply; Interest rate was measured using the monthly Interest rate; Inflation rate was
measured using the monthly inflation rate; GDP was measured using the monthly

36
GDP ratio; exchange rates was measured using the monthly exchange rates for the
USD.
The coefficient of determination (R2) was used to measure the extent to which the
variation in efficiency is explained by the variations in its determinants. F-statistic
was also computed at 95% confidence level to test whether there is any significant
relationship between financial performance and macroeconomic variables. The
findings were presented in form of a tables and graphs to aid in the analysis and ease
with which the inferential statistics was drawn.

37
CHAPTER FOUR
DATA ANALYSIS, RESULTS AND DISCUSSION
4.1 Introduction
This chapter presents the information processed from the data collected during the
study on the effect of macroeconomic variables on financial performance of mutual
funds industry in Kenya. The sample composed of all the 11 mutual funds operating
in Kenya with equity portfolios licensed by the Capital Markets Authority.
4.2 Descriptive statistics
Table 4. 1: Summary of the study variables for the study period
2009 2010 2011 2012 2013 Average
Money
supply
Mean 1197.5 1375.8 1513.1 1676.0 1839.0 1520.3
SD 291.2506 260.5685 367.2286 459.5848 553.4298 386.4
Interest
rate
Mean 0.8545 0.8507 0.588 0.5673 0.4756 0.66722
Std.
Dev. 0.13625 0.13327 0.31595 0.31015 0.39946 0.259016
Inflation
rate
Mean 10.5 4.1 9.4408 10.9617 10.4917 9.09884
Std.
Dev. 1.97346 1.90167 6.54112 5.62948 1.53295 3.515736
GDP
Mean 2.625 5.5667 4.475 3.9083 3.7833 4.07166
Std.
Dev. 0.45151 0.42283 0.50475 0.33967 0.46677 0.437106
Exchange
rates
Mean 77.3508 79.2333 88.2292 91.1342 90.6342 85.31634
Std.
Dev. 1.92643 2.03398 6.07122 7.48854 5.45019 4.594072
Table 4.1 shows the trend of the various variable of the study for the study period.
The findings depict that money supply improved over the years with a mean score of
1520.3. It was also clear that the interest rate decreased steadily over the study period.
This is not the case for inflation rate which was highest in 2012(10.9617) and lowest
in 2010 (4.1) and GDP which had slight changes with a high of 5.5667 in 2010.
Exchange rates recorded slight increments every year with an average of 85.31634.

38
4.3 Regression Results
The study conducted a cross-sectional multiple regression to examine the effect of
selected determinant variables on the performance of mutual firms. Coefficient of
determination explains the extent to which changes in the dependent variable can be
explained by the change in the independent variables or the percentage of variation in
the dependent variable (fund performance) that is explained by all the five
independent variables (money supply, interest rate, inflation rate, GDP and exchange
rates).
Table 4.2: Results of multiple regression between fund performance and the
combined effect of the selected predictors
Model R R Square Adjusted R Square Std. Error of the
Estimate
1 0.865 0.748 0.709 0.379
Source: Author (2014)
The five independent variables that were studied, explain 70.9% of the fund
performance as represented by the adjusted R2. This therefore means the five
variables contribute to 70.9% of fund performance, while other factors not studied in
this research contributes 29.1% of fund performance among mutual funds operating in
Kenya with equity portfolios licensed by the Capital Markets Authority. Therefore,
further research should be conducted to investigate the other (29.1%) factors
influencing fund performance among mutual funds operating in Kenya with equity
portfolios licensed by the Capital Markets Authority.
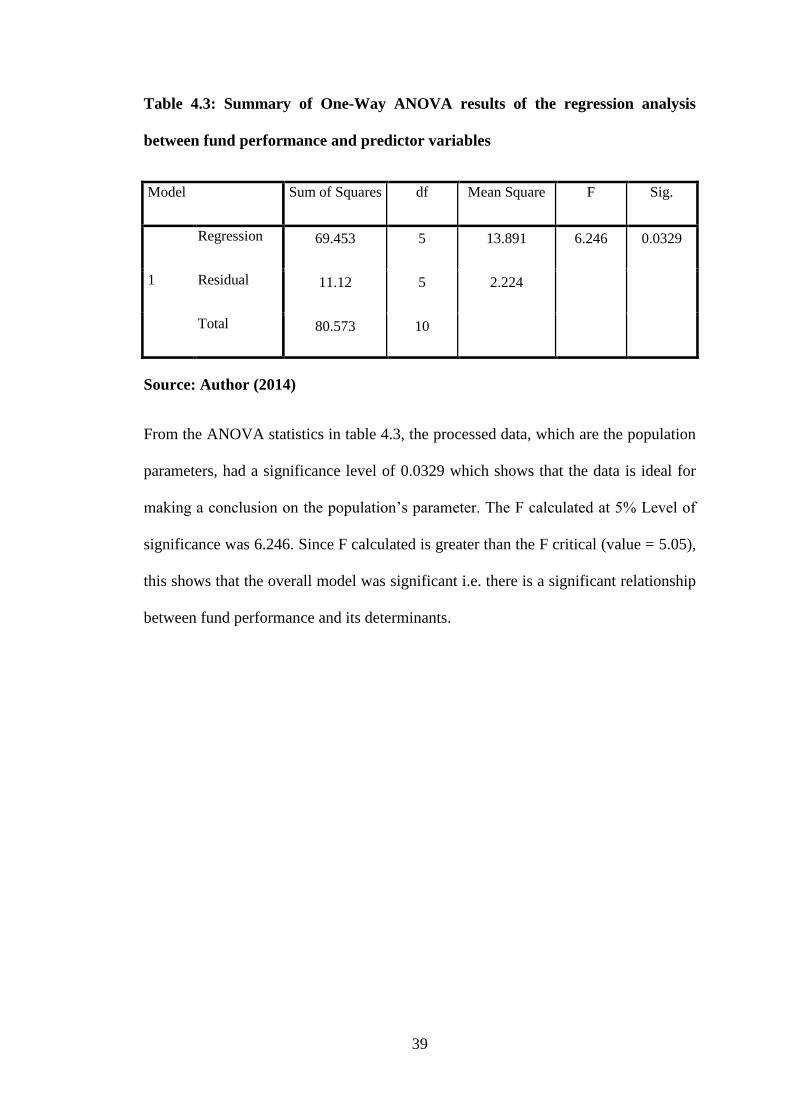
39
Table 4.3: Summary of One-Way ANOVA results of the regression analysis
between fund performance and predictor variables
Model Sum of Squares df Mean Square F Sig.
1
Regression 69.453 5 13.891 6.246 0.0329
Residual 11.12 5 2.224
Total 80.573 10
Source: Author (2014)
From the ANOVA statistics in table 4.3, the processed data, which are the population
parameters, had a significance level of 0.0329 which shows that the data is ideal for
making a conclusion on the population‟s parameter. The F calculated at 5% Level of
significance was 6.246. Since F calculated is greater than the F critical (value = 5.05),
this shows that the overall model was significant i.e. there is a significant relationship
between fund performance and its determinants.

40
Table 4. 4: Regression coefficients of the relationship between fund performance
and the five predictive variables
Model
Unstandardized
Coefficients
Standardized
Coefficients
t Sig. B Std. Error Beta
1 (Constant) 0.478 0.172 2.074 0.039
Money supply 0.649 0.115 0.584 3.593 0.026
Interest rate 0.431 0.145 0.304 3.556 0.032
Inflation rate 0.372 0.138 0.229 4.874 0.016
GDP 0.547 0.143 0.493 3.825 0.0360
Exchange rates -0.448 0.109 0.393 3.825 0.031
Dependent variable: Fund performance
Source: Author (2014)
The coefficient of regression in Table 4.4 above was used in coming up with the
model below:
FP = 0.478+ 0.649 MS + 0.431 IR + 0.372 I + 0.547GDP - 0.448 ER
Where FP is firm performance, MS is money supply, IR is interest rate, I is inflation
rate, GDP is Gross Domestic Product and ER is exchange rate. From the model,
taking all factors (money supply, interest rate, inflation rate, GDP and exchange rates)

41
constant at zero, earnings management was 0.478. The data findings analyzed also
shows that taking all other independent variables at zero, a unit increase in money
supply will lead to a 0.649 increase in fund performance; unit increase in interest rate
will lead to a 0.431 increase in fund performance; a unit increase in inflation rate will
lead to a 0.372 increase in fund performance; a unit increase in GDP will lead to a
0.547 increase in fund performance while a unit increase in exchange rate will lead to
a 0.448 decrease in fund performance.
According to the model, all the variables were significant as their significance value
was less than 0.05. However, exchange rate was negatively correlated with fund
performance while money supply, interest rate, inflation rate and GDP were positively
correlated with fund performance.
4.4 Summary and Interpretation of Findings
From the above regression model, the study found out that there were macroeconomic
variables influencing fund performance among mutual funds operating in Kenya with
equity portfolios licensed by the Capital Markets Authority, which are money supply,
interest rate, inflation rate, GDP and exchange rates. They either influenced it
positively or negatively. The study found out that the intercept was 0.478 for all years.
The five independent variables that were studied (money supply, interest rate,
inflation rate, GDP and exchange rates) explain a substantial 70.9% of fund
performance among mutual funds operating in Kenya with equity portfolios licensed
by the Capital Markets Authority as represented by adjusted R2
(0.709). This therefore
means that the five independent variables contributes 70.9% of the fund performance
among mutual funds operating in Kenya with equity portfolios licensed by the Capital

42
Markets Authority while other factors and random variations not studied in this
research contributes a measly 29.1% of the fund performance among mutual funds
operating in Kenya with equity portfolios licensed by the Capital Markets Authority.
The study established that the coefficient for money supply was 0.649, meaning that
money supply positively and significantly influenced the fund performance among
mutual funds operating in Kenya with equity portfolios licensed by the Capital
Markets Authority. These findings are in line with Humpe and Macmillan (2009) who
found out that there is a significant but positive relationship between US firm‟s
performance and the money supply. Illo (2012) on a study to establish the effect of
macroeconomic factors affecting commercial banks financial performance in Kenya
found out that financial performance of Commercial banks in Kenya was positively
correlated with money supply.
The study established that the coefficient interest rate was 0.431, meaning that interest
rate positively but significantly influenced the fund performance among mutual funds
operating in Kenya with equity portfolios licensed by the Capital Markets Authority.
These findings correlate with Dash and Dinesh Kumar (2008) who examined the
impact of macroeconomic variables such as exchange rate, inflation rate, oil price,
interest rate and market return by observing high volatility in Indian financial
markets, the results indicated that return and variance of some of the funds return is
affected by macroeconomic variables. On the other hand Humpe and Macmillan
(2009) found interest rate to have a negative significant relationship with industrial
production.
The study also deduced that the coefficient for inflation rate was 0.372, meaning that
inflation rate positively but significantly influenced the fund performance among

43
mutual funds operating in Kenya with equity portfolios licensed by the Capital
Markets Authority. These findings contradict the findings of Najarzadeh et al (2009)
who found out that inflation rate have a negative impact on fund performance in the
long term and have a positive impact in the short term. In another study carried out by
Mashayekh and Haji Moradkhani (2009) indicated that the inflation rate in the long-
run has a positive relationship with the variables of the Tehran Stock Exchange.
The coefficient of GDP was found to be 0.547, this means that GDP positively and
significantly influence the fund performance among mutual funds operating in Kenya
with equity portfolios licensed by the Capital Markets Authority. The findings
correlate with Illo (2012) who found out that financial performance of commercial
banks in Kenya was found to be positively correlated with GDP. Njau (2013) found
out that PE firms‟ in Kenya ROI was heavily influenced by the selected
macroeconomic variables with GDP having the largest influence and systematic risk
having the least impact.
Finally the study found out that the coefficient for exchange rate was -0.448, this
means that exchange rate negatively and significantly influence fund performance
among mutual funds operating in Kenya with equity portfolios licensed by the Capital
Markets Authority. The findings are in line with Njau (2013) who established that the
exchange rate of the dollar against the Kenya Shilling showed a negative relationship
albeit to a small extent on the ROI of PE firms‟ in Kenya. Sajjadi et al (2010)
examined the long-run relationship between the growth rate of stock cash return index
and a set of macroeconomic variables such as inflation rate, money supply growth
rate, exchange rate and oil revenues. The co-integration test indicated a negative
relationship between exchange rate and oil revenues.
44
CHAPTER FIVE
SUMMARY, CONCLUSION AND RECOMMENDATIONS
5.1 Introduction
This chapter provides a summary, conclusion and recommendations of the main
findings on the effect of macroeconomic variables on financial performance of mutual
funds industry in Kenya.
5.2 Summary of Findings and Discussions
The financial sector today is an important part of the social infrastructure. For a long
time, mutual fund investment has played an important role in the financial market and
its popularity has increased dramatically over the past decade. Mutual funds are
managed pools of financial assets that can be invested in by retail or institutional
investors. The mutual fund industry in Kenya is very young having started with the
passage of the Capital Markets Amendment Act (2000), which recognizes specific
investment vehicles and especially mutual funds. The continued poor performance of
mutual funds in the presence of increased investments in intellectual assets raises
questions on the substance of macroeconomic variables in addressing the challenges
facing the mutual funds in Kenya. Unimpressive mutual funds are therefore facing
competition from newer alternatives, including exchange-traded funds (ETFs), folios
and separately managed accounts. These alternatives offer certain advantages over
mutual funds. The study sought to establish the effect of macroeconomic variables on
financial performance of mutual funds industry in Kenya. This study took a causal
research design approach. The study solely used annual report data sources available
at the companies‟ books of account, Kenya national bureau of statistics and the NSE

45
or Capital Market Authority offices. The study used data analysis software such as,
Microsoft Excel and SPSS version 21 to analyze the data. The study used multiple
linear regression equation and the method of estimation was Ordinary Least Squares
(OLS) so as to establish the relationship between macroeconomic variables and
mutual fund performance. The analyses entailed the computation of the various
coefficients of the independent variables correlated against the ROI. The
macroeconomic variables coefficients are denoted as “β” in the model. Regression
was employed to examine the effect of selected determinant variables on the
performance of mutual firms.
From the regression model, the study found out that there were macroeconomic
variables influencing fund performance among mutual funds operating in Kenya with
equity portfolios licensed by the Capital Markets Authority, which are money supply,
interest rate, inflation rate, GDP and exchange rates. They either influenced it
positively or negatively. The study found out that the intercept was 0.478 for all years.
The five independent variables that were studied (money supply, interest rate,
inflation rate, GDP and exchange rates) explain a substantial 70.9% of fund
performance among mutual funds operating in Kenya with equity portfolios licensed
by the Capital Markets Authority as represented by adjusted R2
(0.709). The study
therefore concludes that money supply, interest rate, inflation rate and GDP positively
and significantly influence fund performance among mutual funds operating in Kenya
with equity portfolios licensed by the Capital Markets Authority while exchange rate
negatively but significantly influence fund performance among mutual funds
operating in Kenya with equity portfolios licensed by the Capital Markets Authority.

46
5.3 Conclusions
This study examined the effect of macroeconomic variables on financial performance
of mutual funds industry in Kenya. The five independent variables that were studied
(money supply, interest rate, inflation rate, GDP and exchange rates) explain a
substantial 70.9% of fund performance among mutual funds operating in Kenya with
equity portfolios licensed by the Capital Markets Authority.
Based on the findings, the study concludes that money supply positively and
significantly influences the fund performance among mutual funds operating in Kenya
with equity portfolios licensed by the Capital Markets Authority. This is in line with
Humpe and Macmillan (2009) who found out that there is a significant but positive
relationship between US firm‟s performance and the money supply. Illo (2012) on a
study to establish the effect of macroeconomic factors affecting commercial banks
financial performance in Kenya found out that financial performance of Commercial
banks in Kenya was positively correlated with money supply.
The study also concludes interest rate positively and significantly influences the fund
performance among mutual funds operating in Kenya with equity portfolios licensed
by the Capital Markets Authority. This correlate with Dash and Dinesh Kumar (2008)
who examined the impact of macroeconomic variables such as exchange rate,
inflation rate, oil price, interest rate and market return by observing high volatility in
Indian financial markets, the results indicated that return and variance of some of the
funds return is affected by macroeconomic variables. On the other hand Humpe and
Macmillan (2009) found interest rate to have a negative significant relationship with
industrial production.

47
In addition, the study concludes that inflation rate positively and significantly
influences the fund performance among mutual funds operating in Kenya with equity
portfolios licensed by the Capital Markets Authority. This contradict the findings of
Najarzadeh et al (2009) who found out that inflation rate have a negative impact on
fund performance in the long term and have a positive impact in the short term. In
another study carried out by Mashayekh and Haji Moradkhani (2009) indicated that
the inflation rate in the long-run has a positive relationship with the variables of the
Tehran Stock Exchange.
Further, the study concludes that GDP positively and significantly influence the fund
performance among mutual funds operating in Kenya with equity portfolios licensed
by the Capital Markets Authority. This correlates with Illo (2012) who found out that
financial performance of commercial banks in Kenya was found to be positively
correlated with GDP. Njau (2013) found out that PE firms‟ in Kenya ROI was heavily
influenced by the selected macroeconomic variables with GDP having the largest
influence and systematic risk having the least impact.
Finally, the study concludes that exchange rate negatively and significantly influence
fund performance among mutual funds operating in Kenya with equity portfolios
licensed by the Capital Markets Authority. This is in line with Njau (2013) who
established that the exchange rate of the dollar against the Kenya Shilling showed a
negative relationship albeit to a small extent on the ROI of PE firms‟ in Kenya.
Sajjadi et al (2010) examined the long-run relationship between the growth rate of
stock cash return index and a set of macroeconomic variables such as inflation rate,
money supply growth rate, exchange rate and oil revenues. The co-integration test
indicated a negative relationship between exchange rate and oil revenues.
48
5.4 Limitation of the Study
In attaining its objective the study was limited to mutual fund companies in Kenya.
Secondary data was collected from the firm financial reports. The study was also
limited to the degree of precision of the data obtained from the secondary source.
While the data was verifiable since it came from the Nairobi Securities Exchange
publications, it nonetheless could still be prone to these shortcomings.
The study was limited to establishing establish the effect of macroeconomic variables
on financial performance of mutual funds industry in Kenya. For this reason the firm
that were not dealing with mutual funds were excluded in the study.
The study was based on a five year study period from the year 2009 to 2013. A longer
duration of the study will have captured periods of various economic significances
such as booms and recessions. This may have probably given a longer time focus
hence given a broader dimension to the problem.
5.5 Recommendations
5.5.1 Policy Recommendations
The study established that the selected macroeconomic variables had an effect on the
fund performance. Future forecasts should take into account money supply and GDP
in particular as having the greatest influence on the direction taken by mutual funds in
Kenya. Four of the variables had a positive correlation with ROI though exchange rate
had a negative correlation.
Money supply, GDP, interest rate and inflation rate in that respective order were
established to be the macroeconomic factors that had the greatest positive effect on

49
mutual funds fund performance while exchange rate of the dollar against the Kenya
Shilling showed a negative relationship to a small extent. Hence, these macro-
economic variables should be carefully be considered by all stakeholders in the
mutual funds industry.
5.5.2 Suggestions for Further Research
A study can be designed to find out the impact of country economic growth on the
firm value of mutual funds companies. This will give an indication on the effects of
country economic growth on mutual funds.
It would be important to carry out a study with a bias to determining the relationship
between market development and fund performance. This will assist more knowledge
on the strength of impact of market development on fund performance.
In order to better understand the effects of legislation on fund performance, it would
be interesting to carry out a study to determine effects of fund legislation on the
performance of mutual fund in Kenya.

50
REFERENCES
Adler, M. & Dumas, B. (2004). Exposure to Currency Risk: Definition and
Measurement', Financial Management, 13(2), 41-49.
Akhigbe, A., and McNulty, J. (2005). Profit efficiency sources and differences among
small and large US commercial banks. Journal of Economics and Finance,
29(3), 289-299.
Beenstock, M. and Chan, K.F. (2007). Testing the Arbitrage Pricing Theory in the
United Kingdom, Oxford Bulletin of Economics and Statistics, 48, (2), 121-
141.
Bialkowski J, Otten R. (2011). Emerging market mutual fund performance:evidence
for Poland. North american journal of economics and finance 22: 118-130
Blume, M.E. and Friend, I. (1973). A New Look at the Capital Asset Pricing Model,
Journal of Finance, 28, (1), 19-33.
Boudoukh, J., Richardson, M., Subrahmanyan, M., et al. (2002). Stale prices and
strategies for trading mutual funds. Financial Analysts Journal, 58 (4), 53
Brinson, G. P., Singer, B. D. and Beebower, G. L. (2009). Determinants of Portfolio
Performance II: An Update. Financial Analysts Journal, 47(3), 40–48.
Brinson, G. P., Singer, B. D., and Beebower, G. L. (2009). Determinants of Portfolio
Performance II: An Update. Financial Analysts Journal, 47(3), 40–48.
Carlson, R. (2007). Aggregate Performance of Mutual Funds,1948-1967.Journal of
Financial and Quantitative Analysis 5,1-32.
Chen, N.-F., Roll, R. and Ross, S.A. (2004). Economic Forces and the Stock Market.
Journal of Business, 59, (3),383-403.

51
Cheung YW, Ng LK. (2011). International evidence on the stock market and
aggregate economic activity. Journal of empirical finance, 5, 66-281
Clare, A.D. and Thomas, S.H. (1994). Macroeconomic Factors, the APT and the UK
Stock Market. Journal of Business Finance and Accounting, 21(3), 309-330.
Dash, M. Dinesh, K. G. (2008). A study on the effect of macroeconomic variables on
Indian Mutual Funds Retrieved from :http://ssrn.com/abstract=1316442
Accessed on July, 2014.
Drake, L., Hall, M.J.B. and Simper, R. (2006). The Impact of Macroeconomic and
Regulatory Factors on Bank Efficiency: A Non-Parametric Analysis of Hong
Kong‟s Banking System. Journal of Banking and Finance, 30, 1443-1466
Durack, N., Durand, R.B. and Maller, R.A. (2004). A Best Choice Among Asset
Pricing Models? The Conditional Capital Asset Pricing Model in Australia,
Accounting and Finance, 44(2),139-162.
Edvinsson, L., and Malone, M. S. (2010). Intellectual Capital: Realizing Your
Company's True Value by Finding Its Hidden Brainpower. Journal of
Banking and Finance, 31, 124-186
Elton, E. J., Gruber, M. J. and Blake, C. R. (2008). The persistence of risk-adjusted
mutual fund performance. Journal of Business, 69 (2), 133-157
Fama, E. (1995). Random Walks in Stock Market Prices, Financial Analysts Journal,
51 (1), 75-80.
Fama, E.F. and MacBeth, J.D. (1973). Risk, Return, and Equilibrium: Empirical
Tests', Journal of Political Economy, 81(3), 607-636.
Gay, R. D. (2008). Effect of macroeconomic variables on stock market returns for
four emerging economies: Brazil. Russia, India and China, International
business & economics research journal 7(3), 42-56.
52
Gitman, L., Joehnk, M., and Billingsley, R. (2011). PFIN 2. Cengage Learning.
Goh, P. C. (2005). Intellectual capital performance of commercial banks in Malaysia.
Journal of Intellectual Capital, 6(3), 385-396.
Groenewold, N. & Fraser, P. (2010). Share Prices and Macroeconomic Factors,
Journal of Business Finance and Accounting, 24, (9/10), 1367-1383.
Gultekin, N.B. (2006). Stock Market Returns and Inflation: Evidence from Other
Countries, Journal of Finance, 38, (1), 49-65.
Hallahan, T.A. (2008). The Information Content of Portfolio Performance History and
Persistence in Fund Performance: An Examination of Rollover Funds,
Accounting and Finance, 39, (3), 255-274.
Hasan, M.S. (2008). Stock Returns, Inflation and Interest rates in the United
Kingdom, European Journal of Finance, 14(8), 687-699.
Hendricks, D., Patel, J. and Zeckhauser, R. (2008). Hot hands in mutual funds: Short-
run persistence of relative performance, 1974-2007. Journal of Finance, 48
(1), 93-130
Humpe, A. and Macmillan, P. (2007). Can macroeconomic variables explain long
term stock market movmenets? A comparison of the US and Japan.
Castlecliffe, School of economics & finance, University of st Andrews. Center
for dynamic macroeconomic analysis working paper series, JEL
classifications:C22, G12, E44
Illo, A. D. (2012). The effect of macroeconomic factors on financial performance of
commercial banks in Kenya. Unpublished Master of science Research Project.
University of Nairobi.

53
Investment Company Institute (2008). Mutual fund fact book Retrieved from
http://www.ici.org/stats/mf/ww_03_08.html#TopOfPage Accessed on
February, 2009
Jaffe, J.F. and Mandelker, G. (2008). The 'Fisher Effect' for Risky Assets: An
Empirical Investigation, Journal of Finance, 31, (2), 447-458.
Jensen, M. (1968). The Performance of Mutual Funds in the Period 1945-1954.
Journal of Finance ,42, 389-416.
Jensen, M., & Smith, C. (2000). The Theory of Corporate Finance: A Historical
Overview. New York: Rochester.
Jensen, M.C. (1968). The Performance of Mutual Funds in the Period 1945-2004,
Journal of Finance, 23, (2), 389-416.
Kamanu, H. M. (2011). The influence of board attributes on firm value. a case study
of mutual funds in Kenya. Unpublished MBA Project, University of Nairobi.
Kon, S. J. (2006. The market-timing performance of mutual fund managers. Journal
of Business, 56 (3), 323-347
Kwon, C. S., and Shin, T. S. (2008). Cointegration and causality between
macroeconomic variables and stock market returns. Global Finance Journal,
10(1), 71–81.
Lintner, J. (1965). The valuation of risk assets and the selection of risky investments
in stock portfolios and capital budgets. Review of Economics and Statistics, 47
(1), 13-37
Malkiel, B.G. (2005). Reflections on the Efficient Market Hypothesis: 30 Years
Later', Financial Review, 40, (1), 1-9.

54
Markowitz, H. (1952). Portfolio selection. Journal of Finance, 7 (1), 77-91.
Miller, K. and Fang, G. (2001). Is there a long-run relationship between stock returns
and monetary variables: evidence from an emerging market. Applied financial
economics. 11, 641-649
Mohammadreza, M. and Esmaeel, R. (2013). The Effect of Economic Factors on the
Efficiency of Mutual Funds in Iran. Technical Journal of Engineering and
Applied Sciences. 3, 2051-0853
Mossin, J. (1966). Equilibrium in a Capital Asset Market', Econometrica, 34(4),768-
83.
Muriira, C. (2010). An assessment of marketing and advertising strategies among
insurance firms and their impact of performance: A case of Old Mutual Life
Assurance Company. Unpublished MBA Project, University of Nairobi.
Murithi, G. N. (2012). The assessment of risk - return trade off among private equity
firms in Kenya. Unpublished Master of Science Research Project. University
of Nairobi.
Mutua M. M. (2006). An assessment of performance of active mutual fund
management & passive fund management. Unpublished MBA Project,
University of Nairobi.
Nawalkha, S. (2007). Is the Arbitrage Pricing Theory Dead? Retrieved from
http://ssrn.com/paper=984734 Accessed on December, 2007.
Nissim, D. and Penman, S.H. (2003). The Association between Changes in Interest
Rates, Earnings, and Equity Values, Contemporary Accounting Research,
20(4), 775-804.
Njau, J. (2013). The effect of selected macroeconomic variables on the financial
performance of private equity firms in Kenya. Unpublished MBA Project,
University of Nairobi.

55
Ochieng O. (2005). Old Mutual: Why We Had to Size Up. Market intelligence,
Nairobi,18-24.
Prasanna C. (2002). Financial Management. New Delhi: Tata Mc Graw Hill
Publication.
Qi, M. and Maddala, G.S. (2008). Economic Factors and the Stock Market, Journal of
Forecasting, 18, (3), 151-66.
Reilly et al. (2003). Investment Analysis and Portfolio Management. 7th ed., South-
Western.
Ross, S. A. (2008). The arbitrage theory of capital asset pricing. Journal of Economic
Theory, 13, 341-360
Schwert, G.W. (1990). The Adjustment of Stock Prices to Information about Inflation.
Journal of Finance, 36(1), 15-29.
Sharma, G. D., Singh, S., and Gurvinder, S. (2011). Impact of Macroeconomic
Variables on Economic Performance: An Empirical Study of India and Sri
Lanka. New York: Rochester.
Sharpe, W. F. (2004). Capital asset prices: A theory of market equilibrium under
conditions of risk. Journal of Finance, 19 (3), 425-442
Sharpe,William F. (2009). Mutual Fund Performance. Journal of Business, 39,119-
138.
Sinclair, N.A. (2004). Aspects of the Factor Structure Implicit in the Australian
Industrial Equity Market: February 1958 to August 1977, Australian Journal
of Management, 9, (1), 23-36.
Singh T, Mehta S and Varsha, S. (2011). Macroeconomic factors and stock returns:
Evidence from Taiwan. Journal of economics and international finance. 2(4),
217-227

56
Siqueira, E. M. R., de Carvalho, A. G. and Gallucci, N. H. (2011). Determinants of
Success in Private Equity-Venture Capital Investments. Brazilian Review of
Finance, 9(2), 189–208.
Tobin, J. 1958, 'Liquidity Preference as Behaviour Towards Risk', Review of
Economic Studies, vol. 25, February, pp. 65-86.
Treynor, J. L. (2007). How to rate management of investment funds. Harvard
Business Review, 43 (1), 63-75
Tuimising, N. (2012). Private Equity in Kenya: A survey of emerging legal and
institutional issues. (Unpublished PhD Dissertation). University of Warwick.
Tursoy, T., Gunsel, N.and Rjoub, H. (2008). Macroeconomic Factors, the APT and
the Istanbul Stock Market', International Research Journal of Finance and
Economics, 22, 49-57.
Wang, W. Y., and Chang, C. (2005). Intellectual capital and performance in causal
models: evidence from the information technology industry in Taiwan.
Journal of Intellectual Capital, 6(2), 222-236.

57
APPENDICES
Appendix I: List of Mutual Funds companies registered with Capital Market
Authorities in Kenya
1. African Alliance Kenya Unit Trust Scheme
2. Old Mutual Unit Trust Scheme
3. British American Unit Trust Scheme
4. Stanbic Unit Trust Scheme
5. Commercial Bank of Africa Unit Trust Scheme
6. Zimele Unit Trust Scheme
7. Suntra Unit Trust Scheme
8. ICEA Unit Trust Scheme
9. CFC Unit trust
10. Dyer and Blair unit trust
11. Standard unit trust
Source: Capital Markets Authority (2013)
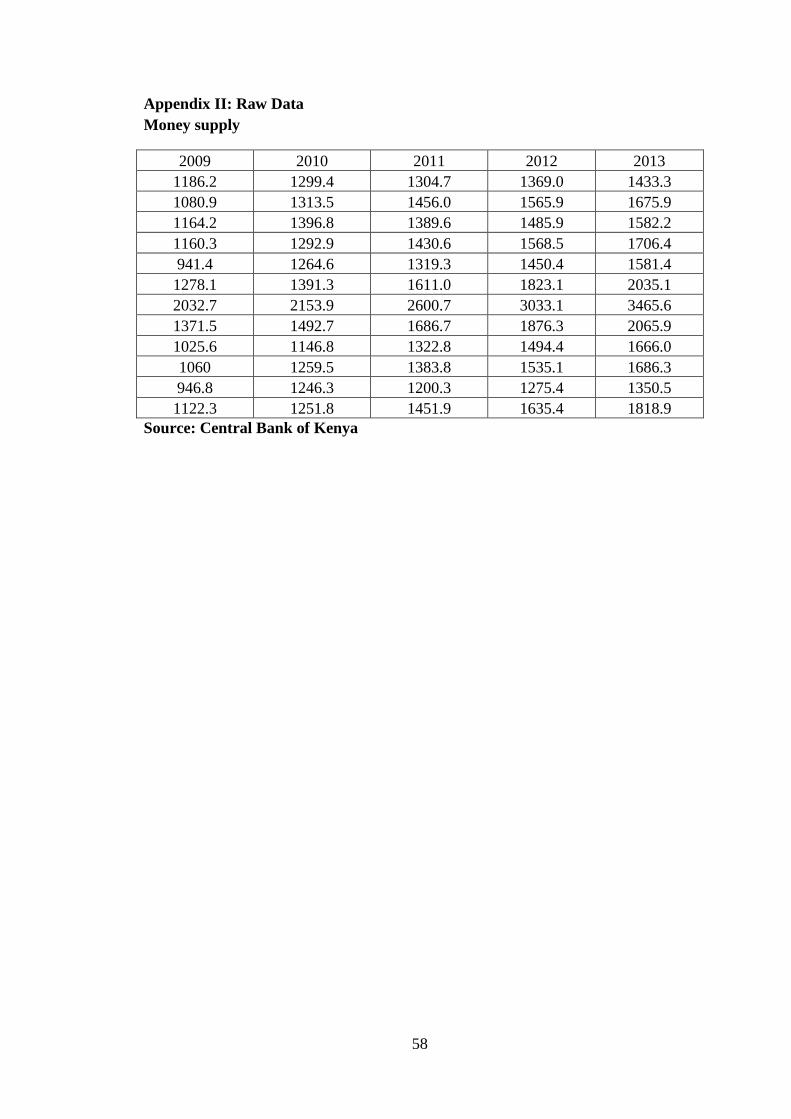
58
Appendix II: Raw Data
Money supply
2009 2010 2011 2012 2013
1186.2 1299.4 1304.7 1369.0 1433.3
1080.9 1313.5 1456.0 1565.9 1675.9
1164.2 1396.8 1389.6 1485.9 1582.2
1160.3 1292.9 1430.6 1568.5 1706.4
941.4 1264.6 1319.3 1450.4 1581.4
1278.1 1391.3 1611.0 1823.1 2035.1
2032.7 2153.9 2600.7 3033.1 3465.6
1371.5 1492.7 1686.7 1876.3 2065.9
1025.6 1146.8 1322.8 1494.4 1666.0
1060 1259.5 1383.8 1535.1 1686.3
946.8 1246.3 1200.3 1275.4 1350.5
1122.3 1251.8 1451.9 1635.4 1818.9
Source: Central Bank of Kenya

59
Interest rate
2009 2010 2011 2012 2013
14.78 14.98 14.03 19.54 18.37
14.67 14.98 13.92 17.87 18.42
14.87 14.80 13.92 17.92 18.46
14.71 14.58 13.92 17.96 18.51
14.85 14.46 13.88 21.01 20.55
15.09 14.39 13.91 18.05 18.60
14.79 14.29 14.14 18.10 18.64
14.76 14.18 14.32 18.14 18.69
14.74 13.98 14.79 18.19 19.73
14.78 13.85 15.21 18.23 18.78
14.85 13.95 18.51 18.28 21.82
14.76 13.87 20.04 20.33 18.87
Source: Central Bank of Kenya

60
Inflation rate
2009 2010 2011 2012 2013
12.1 9.1 4.7 18.9 13.5
11.9 5.9 4.1 18.3 12.3
10.5 5.3 3.6 16.7 11.1
7.8 4.1 4.2 15.6 10.2
9.9 2.7 3.9 13.1 8.7
6.2 3.2 4.7 12.2 8.0
12.8 4.3 4.5 10.1 9.1
12.1 3.3 14.49 7.7 11.1
10.5 2.6 16.6 6.1 9.8
9.9 3.1 15.5 5.4 10.0
12.4 2.9 17.3 4.14 11.0
9.9 2.7 19.7 3.3 11.1
Source: Kenya National Bureau of Statistics

61
GDP
2009 2010 2011 2012 2013
2.2 4.9 5.4 4.2 4.2
2.1 5.2 5.2 4.3 4.4
2.6 5.1 4.9 3.9 3.8
1.9 5.4 4.4 4.0 4.0
2.7 5.3 4.3 3.6 3.4
2.9 6.1 4.2 4.2 4.2
2.6 5.6 3.9 3.3 3.0
2.4 5.8 4.1 3.6 3.3
2.6 6.1 3.9 3.6 3.3
2.8 6.2 4.4 4.3 4.3
3.2 5.7 4.1 3.7 3.5
3.5 5.4 4.9 4.2 4.0
Source: Kenya National Bureau of Statistics

62
Exchange rates
2009 2010 2011 2012 2013
78.95 75.79 81.03 84.89 88.45
79.53 76.73 81.47 84.53 87.50
80.26 76.95 84.24 87.71 91.90
79.63 77.25 83.89 84.52 86.65
77.86 78.54 85.43 88.18 91.97
77.85 81.02 89.05 93.84 99.44
76.75 81.43 89.90 95.84 82.42
76.37 80.44 92.79 89.62 87.83
75.60 80.91 96.36 88.05 85.43
75.24 80.71 101.27 111.77 89.79
74.74 80.46 86.66 92.54 98.50
75.43 80.57 86.66 92.12 97.73
Source: Central Bank of Kenya