vanguard wholesale domestic equities funds and etfs …
TRANSCRIPT

Vanguard Wholesale Australian Equities Funds and ETFs
Annual report | 30 June 2021
Responsible Entity
Vanguard Investments Australia Ltd. ABN 72 072 881 086 AFSL 227263
Level 13 130 Lonsdale Street Melbourne VIC 3000 Australia
Telephone: (03) 8888 3888 Facsimile: 1300 765 712
vanguard.com.au

Vanguard Wholesale Australian Equities Funds and ETFs
Fund ASX ARSN ABN
Vanguard MSCI Australian Large Companies Index ETF VLC 147 936 105 17 468 108 459
Vanguard MSCI Australian Small Companies Index ETF VSO 147 936 570 73 969 263 897
Vanguard Australian Property Securities Index Fund VAP 090 939 549 27 186 332 271
Vanguard Australian Shares High Yield Fund VHY 091 751 807 61 324 061 551
Vanguard Australian Shares Index Fund VAS 090 939 718 65 759 271 740
Vanguard Ethically Conscious Australian Shares Fund VETH 632 655 620 30 223 971 715
ContentsAbout Vanguard 1
Directors’ report 2
Auditor’s independence declaration 7
Statements of comprehensive income 8
Balance sheets 10
Statements of changes in equity 12
Statements of cash flows 13
Notes to the financial statements 15
Directors’ declaration 41
Independent auditor’s report 42

About Vanguard
Vanguard Wholesale Australian Equities Funds and ETFs 1
Since our establishment in 1975, Vanguard has strived to be the world’s highest-value provider of investment products and services. We have an unwavering focus on our clients with a commitment to champion what’s best for investors by offering outstanding service, while keeping costs low.
Over the years Vanguard has built a reputation as a global leader in client advocacy and earned the trust of millions of investors along the way. Our sole purpose has been to align our interest with those of our investors to ensure they have the best chance for investment success.
With over AUD $10.6 trillion in assets under management as of 30 June 2021, including more than AUD $2.6 trillion in ETFs, Vanguard is one of the world’s largest global investment management companies.
In Australia, Vanguard has been serving financial advisers, retail clients and institutional investors for more than 25 years.
Our unique structure — putting investors’ interests firstWhat sets Vanguard apart — and allows Vanguard to put investors first around the world — is the ownership structure of The Vanguard Group, Inc., in the United States.
Rather than being publicly traded or owned by a small group of individuals, the Vanguard Group is owned by Vanguard’s US-domiciled funds and ETFs. Those funds, in turn, are owned by their investors.
This mutual structure aligns our interests with those of our investors and drives the culture, philosophy and policies throughout the Vanguard organisation worldwide. As a result, Australian investors benefit from Vanguard’s stability and experience, low costs and client focus.
Our investment expertiseWhen you invest with Vanguard, you have more than 40 years of investing experience behind you. So no matter which investment products suit your needs, you can feel confident that Vanguard investments are built on a rigorous investment philosophy that stands the test of time.
Low-cost investingWe know we can’t control the markets, but we can control the costs of investing. To that end, providing low-cost investments isn’t a pricing strategy for us. It’s how we do business.
We can keep costs low because of our unique ownership structure in the United States, which allows us to return profits to investors through lower costs.

Directors’ reportThe Responsible Entity of the Vanguard Wholesale Australian Equities Funds and ETFs (the “Funds”) for the year ended 30June 2021 was Vanguard Investments Australia Ltd (the “Responsible Entity”).
The directors of Vanguard Investments Australia Ltd present their report together with the financial statements for the yearended 30 June 2021.
Principal activities
The Funds invest in accordance with the investment policy of the Funds as set out in their respective Product DisclosureStatements (PDSs) and in accordance with the Funds’ Constitution. The Funds seek to track the returns of the Funds’respective indices, before taking into account fees, expenses and tax.
The registration date of Vanguard Ethically Conscious Australian Shares Fund was 15 April 2019. The Fund remaineddormant until the inception date which was 12 August 2020, the date on which the Fund commenced trading.
The ETF Class units of the Funds operate as Exchange Traded Funds (ETFs) listed on the Australian Securities Exchange(ASX).
The Funds did not have any employees during the year.
There were no significant changes in the nature of the activities of the Funds during the year.
Directors
The following persons held office as directors of the Responsible Entity during the year and up to the date of this report:
J M Norris (Resigned 21 September 2020)
C Lui (Resigned 31 December 2020)
J Platt
F Kolimago
C McIsaac (Appointed 25 September 2020)
C Cosby (Appointed 21 May 2021)
D Shrimski (Appointed 21 May 2021)
Review and results of operations
The Funds invest in listed equity securities, listed unit trusts, derivatives and cash and cash equivalents. The investmentpolicy of the Funds continues to be in accordance with the provisions of the Funds’ Constitution.
Results
The results of the operations of the Funds were as follows:
Vanguard MSCIAustralian Large
Companies Index ETF
Vanguard MSCIAustralian Small
Companies Index ETF
Vanguard AustralianProperty Securities
Index Fund
30 Jun2021
30 Jun2020
30 Jun2021
30 Jun2020
30 Jun2021
30 Jun2020
Operating profit/(loss) before finance costsattributable to unitholders ($’000) 31,653 (8,198) 127,579 (7,476) 1,586,493 (1,278,764)
Distributions - Wholesale Class
Distribution paid and payable ($’000) - - - - 226,693 210,565
Distribution (cents per unit) - - - - 5.5233 5.3990
Distributions - ETF Class
Distribution paid and payable ($’000) 3,657 3,621 21,764 25,783 97,640 55,726
Distribution (cents per unit) 206.6811 244.0345 266.5467 400.5724 415.5882 280.5130
2 Vanguard Annual report

Directors’ report (continued)
Review and results of operations (continued)
Results (continued)
VanguardAustralian SharesHigh Yield Fund
VanguardAustralian Shares
Index Fund
Vanguard EthicallyConscious Australian
Shares Fund
30 Jun2021
30 Jun2020
30 Jun2021
30 Jun2020
30 Jun2021
30 Jun2020
Operating profit/(loss) before finance costsattributable to unitholders ($’000) 754,130 (285,867) 5,374,496 (1,238,305) 43,994 -
Distributions - Wholesale Class
Distribution paid and payable ($’000) 35,655 42,949 507,030 421,816 3,710 -
Distribution (cents per unit) 5.4062 6.4207 8.3001 7.6469 2.4636 -
Distributions - ETF Class
Distribution paid and payable ($’000) 57,968 58,329 200,964 150,850 952 -
Distribution (cents per unit) 215.3508 255.2475 232.8981 267.1005 96.8991 -
Performance
The tables below detail the performance of the Funds as represented by the total return, net of fees, which is calculated as theaggregation of the percentage capital growth and percentage distribution of income. The total return is shown for the past fiveyears to 30 June 2021 and assumes that all distributions were re-invested during that period. These are calculated inaccordance with FSC Standard 6.0 Product Performance - calculation and presentation of returns. The directors assess theperformance of the Funds by comparing each Fund’s total return with the corresponding Index (the “Benchmark”) gross offees.
2021 2020 2019 2018 2017% % % % %
Vanguard MSCI Australian Large Companies Index ETF
Capital growth 26.44 (12.69) 8.35 5.81 8.13
Distribution of income 3.95 3.41 6.10 4.78 4.63
Total return 30.39 (9.28) 14.45 10.59 12.76
Benchmark
MSCI Australian Shares Large Cap Index 30.66 (9.18) 14.71 10.86 13.02
2021 2020 2019 2018 2017% % % % %
Vanguard MSCI Australian Small Companies Index ETF
Capital growth 28.51 (8.25) 1.13 16.59 6.47
Distribution of income 5.16 6.85 3.37 2.34 4.76
Total return 33.67 (1.40) 4.50 18.93 11.23
Benchmark
MSCI Australian Shares Small Cap Index 33.85 (1.44) 4.78 19.28 11.61
2021 2020 2019 2018 2017% % % % %
Vanguard Australian Property Securities Index Fund
Capital growth 26.42 (25.58) 11.60 3.92 (9.67)
Distribution of income 7.25 4.86 7.65 9.09 4.12
Total return 33.67 (20.72) 19.25 13.01 (5.55)
Benchmark
S&P/ASX 300 A-REIT Index 33.91 (20.71) 19.39 13.20 (5.64)
Vanguard Wholesale Australian Equities Funds and ETFs 3
Directors’ report (continued)
Review and results of operations (continued)
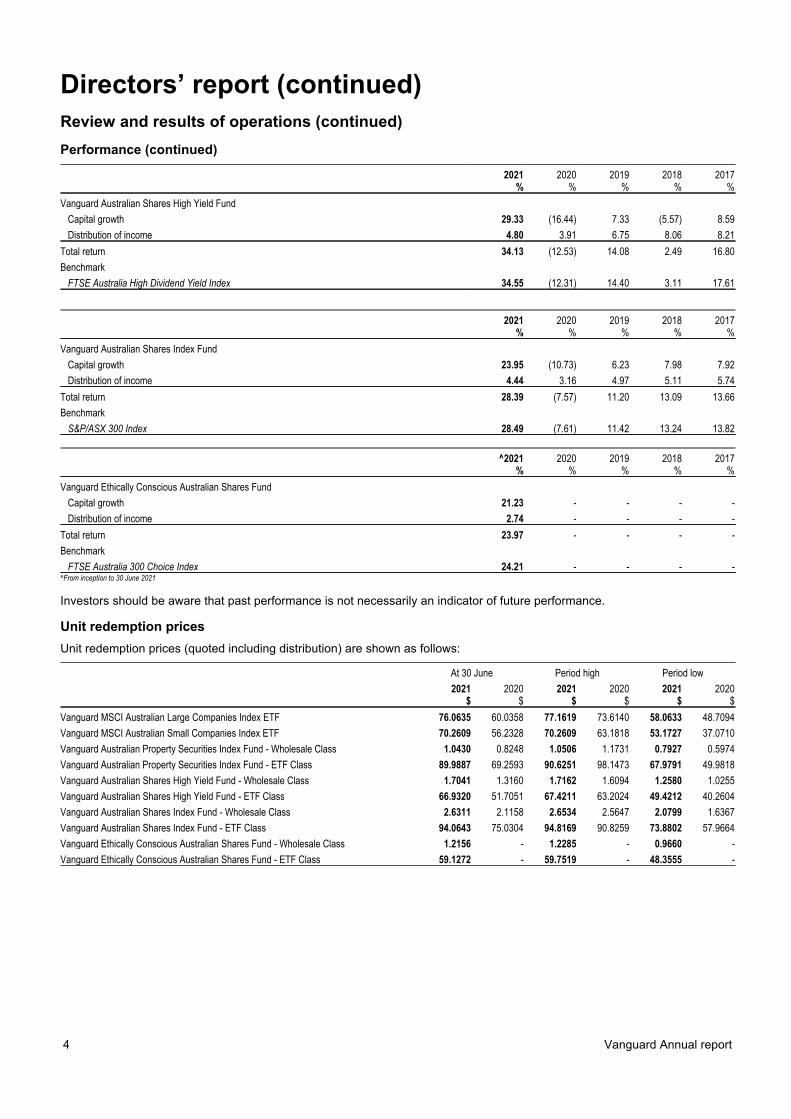
Performance (continued)
2021 2020 2019 2018 2017% % % % %
Vanguard Australian Shares High Yield Fund
Capital growth 29.33 (16.44) 7.33 (5.57) 8.59
Distribution of income 4.80 3.91 6.75 8.06 8.21
Total return 34.13 (12.53) 14.08 2.49 16.80
Benchmark
FTSE Australia High Dividend Yield Index 34.55 (12.31) 14.40 3.11 17.61
2021 2020 2019 2018 2017% % % % %
Vanguard Australian Shares Index Fund
Capital growth 23.95 (10.73) 6.23 7.98 7.92
Distribution of income 4.44 3.16 4.97 5.11 5.74
Total return 28.39 (7.57) 11.20 13.09 13.66
Benchmark
S&P/ASX 300 Index 28.49 (7.61) 11.42 13.24 13.82
^2021 2020 2019 2018 2017% % % % %
Vanguard Ethically Conscious Australian Shares Fund
Capital growth 21.23 - - - -
Distribution of income 2.74 - - - -
Total return 23.97 - - - -
Benchmark
FTSE Australia 300 Choice Index 24.21 - - - -^From inception to 30 June 2021
Investors should be aware that past performance is not necessarily an indicator of future performance.
Unit redemption prices
Unit redemption prices (quoted including distribution) are shown as follows:
At 30 June Period high Period low
2021 2020 2021 2020 2021 2020$ $ $ $ $ $
Vanguard MSCI Australian Large Companies Index ETF 76.0635 60.0358 77.1619 73.6140 58.0633 48.7094
Vanguard MSCI Australian Small Companies Index ETF 70.2609 56.2328 70.2609 63.1818 53.1727 37.0710
Vanguard Australian Property Securities Index Fund - Wholesale Class 1.0430 0.8248 1.0506 1.1731 0.7927 0.5974
Vanguard Australian Property Securities Index Fund - ETF Class 89.9887 69.2593 90.6251 98.1473 67.9791 49.9818
Vanguard Australian Shares High Yield Fund - Wholesale Class 1.7041 1.3160 1.7162 1.6094 1.2580 1.0255
Vanguard Australian Shares High Yield Fund - ETF Class 66.9320 51.7051 67.4211 63.2024 49.4212 40.2604
Vanguard Australian Shares Index Fund - Wholesale Class 2.6311 2.1158 2.6534 2.5647 2.0799 1.6367
Vanguard Australian Shares Index Fund - ETF Class 94.0643 75.0304 94.8169 90.8259 73.8802 57.9664
Vanguard Ethically Conscious Australian Shares Fund - Wholesale Class 1.2156 - 1.2285 - 0.9660 -
Vanguard Ethically Conscious Australian Shares Fund - ETF Class 59.1272 - 59.7519 - 48.3555 -
4 Vanguard Annual report

Directors’ report (continued)
Significant changes in state of affairs
The Vanguard Ethically Conscious Australian Shares inception date was 12 August 2020. The Wholesale Class unitscommenced trading on 12 August 2020. The ETF Class units were listed and commenced trading on the ASX on 14 October2020.
Jim Norris resigned as a Director of Vanguard Investments Australia Ltd on 21 September 2020.
Chris McIsaac was appointed as a Director of Vanguard Investments Australia Ltd on 25 September 2020.
Cynthia Lui resigned as a Director of Vanguard Investments Australia Ltd on 31 December 2020.
Caroline Cosby was appointed as a Director of Vanguard Investments Australia Ltd on 21 May 2021.
Daniel Shrimski was appointed as a Director of Vanguard Investments Australia Ltd on 21 May 2021.
Market disruptions associated with the COVID-19 pandemic have had a global impact, and uncertainty exists as to the long-term implications. Such disruptions can adversely affect assets of the Funds and thus performance of the Funds.
In the opinion of the directors, there were no other significant changes in the state of affairs of the Funds that occurred duringthe financial year.
Matters subsequent to the end of the financial year
No matter or circumstance has arisen since 30 June 2021 that has significantly affected, or may significantly affect:
(i) the operations of the Funds in future financial years; or
(ii) the results of those operations in future financial years; or
(iii) the state of affairs of the Funds in future financial years.
Likely developments and expected results of operations
The Funds will continue to be managed in accordance with the investment objectives and guidelines as set out in thegoverning documents of the Funds and in accordance with the provisions of the Funds’ Constitution.
The results of the Funds’ operations will be affected by a number of factors, including the performance of investment marketsin which the Funds invest. Investment performance is not guaranteed and future returns may differ from past returns. Asinvestment conditions change over time, past returns should not be used to predict future returns.
Indemnity and insurance of officers and auditors
No insurance premiums were paid for out of the assets of the Funds in regards to insurance cover provided to either theofficers of Vanguard Investments Australia Ltd or the auditors of the Funds. So long as the officers of Vanguard InvestmentsAustralia Ltd act in accordance with the Funds’ Constitution and the Law, the officers remain indemnified out of the assets ofthe Funds against losses incurred while acting on behalf of the Funds. The auditors of the Funds are in no way indemnifiedout of the assets of the Funds.
Fees paid to and interests held in the Funds by the Responsible Entity or its associates
Fees paid to the Responsible Entity and its associates out of the Funds’ property during the year are disclosed in note 14 ofthe financial statements.
No fees were paid out of the Funds’ property to the directors of the Responsible Entity during the year.
The number of interests in the Funds held by the Responsible Entity or its associates as at the end of the financial year aredisclosed in note 14 of the financial statements.
Interests in the Funds
The movement in units on issue in the Funds during the year is disclosed in note 9 of the financial statements.
The value of the Funds’ assets and liabilities are disclosed on the balance sheet and derived using the basis set out in note 2of the financial statements.
Vanguard Wholesale Australian Equities Funds and ETFs 5

Directors’ report (continued)
Environmental regulation
The operations of the Funds are not subject to any particular or significant environmental regulations under eitherCommonwealth, State or Territory law.
Rounding of amounts to the nearest thousand dollars
Amounts in the directors’ report have been rounded to the nearest thousand dollars in accordance with ASIC Corporations(Rounding in Financial/Directors’ Report) Instrument 2016/191, unless otherwise indicated.
Auditor’s independence declaration
A copy of the auditor's independence declaration as required under Section 307C of the Corporations Act 2001 is set out onpage 7.
This report is made in accordance with a resolution of the directors.
F Kolimago
Managing Director
Melbourne
9 September 2021
6 Vanguard Annual report
PricewaterhouseCoopers, ABN 52 780 433 757 2 Riverside Quay, SOUTHBANK VIC 3006, GPO Box 1331, MELBOURNE VIC 3001 T: 61 3 8603 1000, F: 61 3 8603 1999, www.pwc.com.au
Liability limited by a scheme approved under Professional Standards Legislation.
Auditor’s Independence Declaration Vanguard MSCI Australian Large Companies Index ETF* Vanguard MSCI Australian Small Companies Index ETF* Vanguard Australian Property Securities Index Fund* Vanguard Australian Shares High Yield Fund* Vanguard Australian Shares Index Fund* Vanguard Ethically Conscious Australian Shares Fund*
referred to collectively as Vanguard Wholesale Australian Equities Funds and ETFs.
* denotes listed Funds
As lead auditor for the audit of Vanguard Wholesale Australian Equities Funds and ETFs for the year ended 30 June 2021, I declare that to the best of my knowledge and belief, there have been:
(a) no contraventions of the auditor independence requirements of the Corporations Act 2001 in relation to the audit; and
(b) no contraventions of any applicable code of professional conduct in relation to the audit.
Britt Hawkins Melbourne Partner PricewaterhouseCoopers
9 September 2021

Statements of comprehensive incomeFor the year ended 30 June 2021
Vanguard MSCIAustralian Large
Companies Index ETF
Vanguard MSCIAustralian Small
Companies Index ETF
Vanguard AustralianProperty Securities
Index Fund
30 Jun2021
30 Jun2020
30 Jun2021
30 Jun2020
30 Jun2021
30 Jun2020
Notes $’000 $’000 $’000 $’000 $’000 $’000
Investment income
Dividend income 4,024 3,487 8,173 7,569 - 10,823
Distribution income 161 334 2,938 2,159 221,543 230,610
Net gains/(losses) on financial instrumentsat fair value through profit or loss 5 27,709 (11,821) 117,487 (16,491) 1,377,255 (1,505,374)
Other operating income 6 9 406 326 566 424
Total net investment income/(loss) 31,900 (7,991) 129,004 (6,437) 1,599,364 (1,263,517)
Expenses
Responsible Entity’s fees 14 237 196 1,365 959 12,591 12,660
Custody fees 5 5 31 40 24 33
Transaction costs 3 4 28 38 192 345
Other operating expenses 2 2 1 2 64 2,209
Total operating expenses 247 207 1,425 1,039 12,871 15,247
Operating profit/(loss) 31,653 (8,198) 127,579 (7,476) 1,586,493 (1,278,764)
Finance costs attributable to unitholders
Distributions to unitholders 10 - - - - (324,333) (266,291)
(Increase)/decrease in net assetsattributable to unitholders 9 - - - - (1,262,160) 1,545,055
Profit/(loss) for the year 31,653 (8,198) 127,579 (7,476) - -
Other comprehensive income - - - - - -
Total comprehensive income for the year 31,653 (8,198) 127,579 (7,476) - -
The above statements of comprehensive income should be read in conjunction with the accompanying notes.
8 Vanguard Annual report
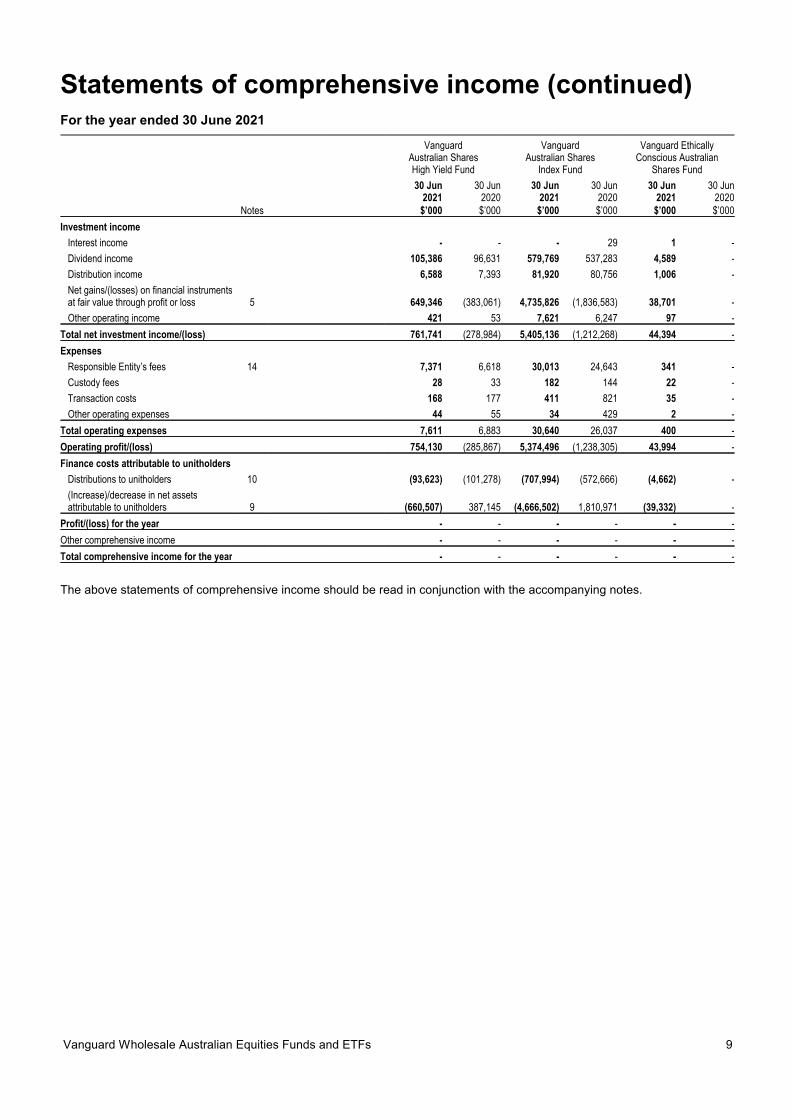
Statements of comprehensive income (continued)For the year ended 30 June 2021
VanguardAustralian SharesHigh Yield Fund
VanguardAustralian Shares
Index Fund
Vanguard EthicallyConscious Australian
Shares Fund
30 Jun2021
30 Jun2020
30 Jun2021
30 Jun2020
30 Jun2021
30 Jun2020
Notes $’000 $’000 $’000 $’000 $’000 $’000
Investment income
Interest income - - - 29 1 -
Dividend income 105,386 96,631 579,769 537,283 4,589 -
Distribution income 6,588 7,393 81,920 80,756 1,006 -
Net gains/(losses) on financial instrumentsat fair value through profit or loss 5 649,346 (383,061) 4,735,826 (1,836,583) 38,701 -
Other operating income 421 53 7,621 6,247 97 -
Total net investment income/(loss) 761,741 (278,984) 5,405,136 (1,212,268) 44,394 -
Expenses
Responsible Entity’s fees 14 7,371 6,618 30,013 24,643 341 -
Custody fees 28 33 182 144 22 -
Transaction costs 168 177 411 821 35 -
Other operating expenses 44 55 34 429 2 -
Total operating expenses 7,611 6,883 30,640 26,037 400 -
Operating profit/(loss) 754,130 (285,867) 5,374,496 (1,238,305) 43,994 -
Finance costs attributable to unitholders
Distributions to unitholders 10 (93,623) (101,278) (707,994) (572,666) (4,662) -
(Increase)/decrease in net assetsattributable to unitholders 9 (660,507) 387,145 (4,666,502) 1,810,971 (39,332) -
Profit/(loss) for the year - - - - - -
Other comprehensive income - - - - - -
Total comprehensive income for the year - - - - - -
The above statements of comprehensive income should be read in conjunction with the accompanying notes.
Vanguard Wholesale Australian Equities Funds and ETFs 9

Balance sheetsAs at 30 June 2021
Vanguard MSCIAustralian Large
Companies Index ETF
Vanguard MSCIAustralian Small
Companies Index ETF
Vanguard AustralianProperty Securities
Index Fund
30 Jun2021
30 Jun2020
30 Jun2021
30 Jun2020
30 Jun2021
30 Jun2020
Notes $’000 $’000 $’000 $’000 $’000 $’000
Assets
Cash and cash equivalents 11 - 314 2,238 1,006 15,539 -
Margin accounts 226 68 584 153 1,417 1,401
Receivables 4 3 5,960 17 27,601 2,284
Accrued income 638 214 1,520 1,431 89,642 65,575
Due from brokers - receivable for securitiessold - - 11,797 16,221 31,769 54,742
Financial assets at fair value through profitor loss 6 136,535 105,073 578,475 347,628 6,331,462 4,685,002
Total assets 137,403 105,672 600,574 366,456 6,497,430 4,809,004
Liabilities
Bank overdraft 11 88 - - - - 15,333
Distribution payable 10 638 270 17,005 20,366 201,877 118,461
Payables 45 18 143 91 5,218 3,723
Due to brokers - payables for securitiespurchased - - 5,853 - - 5,562
Financial liabilities at fair value throughprofit or loss 7 - - - - - 131
Total liabilities 771 288 23,001 20,457 207,095 143,210
Net assets attributable to unitholders(equity) 9 136,632 105,384 577,573 345,999 - -
Net assets attributable to unitholders(liability) 9 - - - - 6,290,335 4,665,794
The above balance sheets should be read in conjunction with the accompanying notes.
10 Vanguard Annual report

Balance sheets (continued)As at 30 June 2021
VanguardAustralian SharesHigh Yield Fund
VanguardAustralian Shares
Index Fund
Vanguard EthicallyConscious Australian
Shares Fund
30 Jun2021
30 Jun2020
30 Jun2021
30 Jun2020
30 Jun2021
30 Jun2020
Notes $’000 $’000 $’000 $’000 $’000 $’000
Assets
Cash and cash equivalents 11 14,511 2,847 146,988 51,945 1,652 -
Margin accounts 2,157 702 19,030 8,456 328 -
Receivables 6,506 233 77,124 3,628 181 -
Accrued income 15,741 6,228 99,592 47,982 1,516 -
Due from brokers - receivable for securitiessold - - 40,133 108 733 -
Financial assets at fair value through profitor loss 6 2,967,621 2,229,512 25,082,721 18,186,703 358,373 -
Total assets 3,006,536 2,239,522 25,465,588 18,298,822 362,783 -
Liabilities
Distribution payable 10 14,666 9,547 150,655 49,424 1,331 -
Payables 1,591 954 126,422 100,428 54 -
Due to brokers - payables for securitiespurchased 5,324 - 24,681 434 42 -
Financial liabilities at fair value throughprofit or loss 7 100 - - - 10 -
Total liabilities 21,681 10,501 301,758 150,286 1,437 -
Net assets attributable to unitholders(liability) 9 2,984,855 2,229,021 25,163,830 18,148,536 361,346 -
The above balance sheets should be read in conjunction with the accompanying notes.
Vanguard Wholesale Australian Equities Funds and ETFs 11
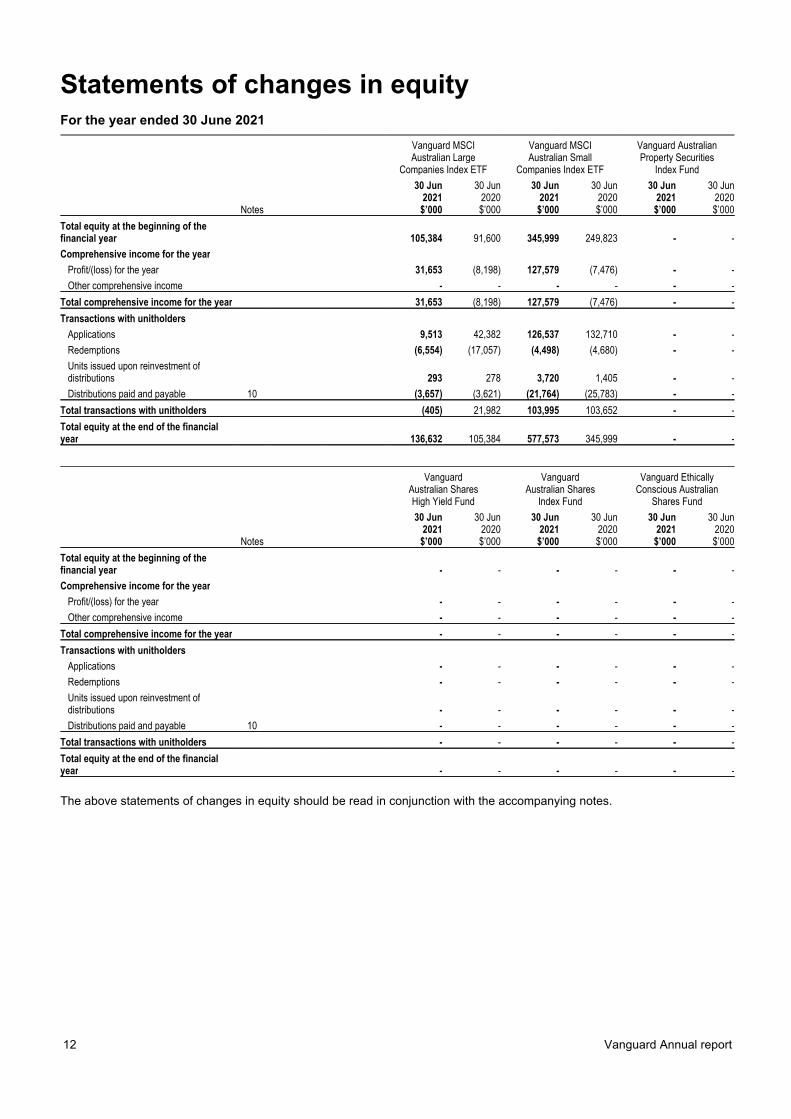
Statements of changes in equityFor the year ended 30 June 2021
Vanguard MSCIAustralian Large
Companies Index ETF
Vanguard MSCIAustralian Small
Companies Index ETF
Vanguard AustralianProperty Securities
Index Fund
30 Jun2021
30 Jun2020
30 Jun2021
30 Jun2020
30 Jun2021
30 Jun2020
Notes $’000 $’000 $’000 $’000 $’000 $’000
Total equity at the beginning of thefinancial year 105,384 91,600 345,999 249,823 - -
Comprehensive income for the year
Profit/(loss) for the year 31,653 (8,198) 127,579 (7,476) - -
Other comprehensive income - - - - - -
Total comprehensive income for the year 31,653 (8,198) 127,579 (7,476) - -
Transactions with unitholders
Applications 9,513 42,382 126,537 132,710 - -
Redemptions (6,554) (17,057) (4,498) (4,680) - -
Units issued upon reinvestment ofdistributions 293 278 3,720 1,405 - -
Distributions paid and payable 10 (3,657) (3,621) (21,764) (25,783) - -
Total transactions with unitholders (405) 21,982 103,995 103,652 - -
Total equity at the end of the financialyear 136,632 105,384 577,573 345,999 - -
VanguardAustralian SharesHigh Yield Fund
VanguardAustralian Shares
Index Fund
Vanguard EthicallyConscious Australian
Shares Fund
30 Jun2021
30 Jun2020
30 Jun2021
30 Jun2020
30 Jun2021
30 Jun2020
Notes $’000 $’000 $’000 $’000 $’000 $’000
Total equity at the beginning of thefinancial year - - - - - -
Comprehensive income for the year
Profit/(loss) for the year - - - - - -
Other comprehensive income - - - - - -
Total comprehensive income for the year - - - - - -
Transactions with unitholders
Applications - - - - - -
Redemptions - - - - - -
Units issued upon reinvestment ofdistributions - - - - - -
Distributions paid and payable 10 - - - - - -
Total transactions with unitholders - - - - - -
Total equity at the end of the financialyear - - - - - -
The above statements of changes in equity should be read in conjunction with the accompanying notes.
12 Vanguard Annual report
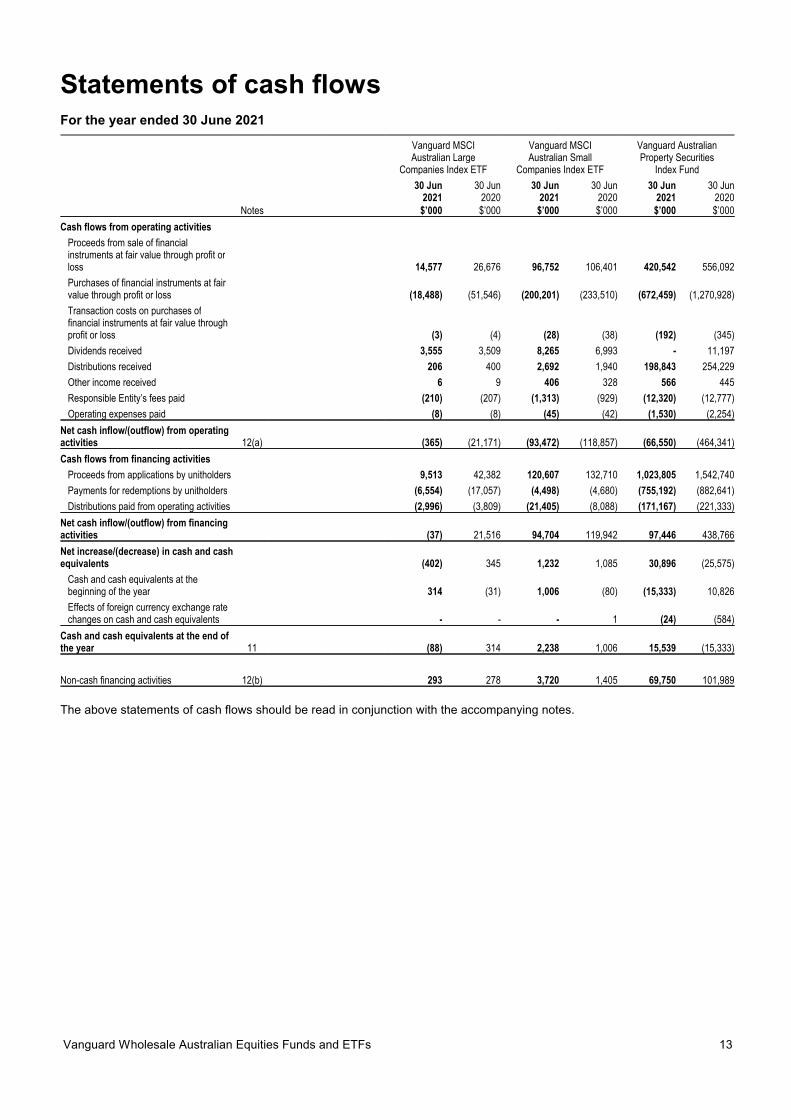
Statements of cash flowsFor the year ended 30 June 2021
Vanguard MSCIAustralian Large
Companies Index ETF
Vanguard MSCIAustralian Small
Companies Index ETF
Vanguard AustralianProperty Securities
Index Fund
30 Jun2021
30 Jun2020
30 Jun2021
30 Jun2020
30 Jun2021
30 Jun2020
Notes $’000 $’000 $’000 $’000 $’000 $’000
Cash flows from operating activities
Proceeds from sale of financialinstruments at fair value through profit orloss 14,577 26,676 96,752 106,401 420,542 556,092
Purchases of financial instruments at fairvalue through profit or loss (18,488) (51,546) (200,201) (233,510) (672,459) (1,270,928)
Transaction costs on purchases offinancial instruments at fair value throughprofit or loss (3) (4) (28) (38) (192) (345)
Dividends received 3,555 3,509 8,265 6,993 - 11,197
Distributions received 206 400 2,692 1,940 198,843 254,229
Other income received 6 9 406 328 566 445
Responsible Entity’s fees paid (210) (207) (1,313) (929) (12,320) (12,777)
Operating expenses paid (8) (8) (45) (42) (1,530) (2,254)
Net cash inflow/(outflow) from operatingactivities 12(a) (365) (21,171) (93,472) (118,857) (66,550) (464,341)
Cash flows from financing activities
Proceeds from applications by unitholders 9,513 42,382 120,607 132,710 1,023,805 1,542,740
Payments for redemptions by unitholders (6,554) (17,057) (4,498) (4,680) (755,192) (882,641)
Distributions paid from operating activities (2,996) (3,809) (21,405) (8,088) (171,167) (221,333)
Net cash inflow/(outflow) from financingactivities (37) 21,516 94,704 119,942 97,446 438,766
Net increase/(decrease) in cash and cashequivalents (402) 345 1,232 1,085 30,896 (25,575)
Cash and cash equivalents at thebeginning of the year 314 (31) 1,006 (80) (15,333) 10,826
Effects of foreign currency exchange ratechanges on cash and cash equivalents - - - 1 (24) (584)
Cash and cash equivalents at the end ofthe year 11 (88) 314 2,238 1,006 15,539 (15,333)
Non-cash financing activities 12(b) 293 278 3,720 1,405 69,750 101,989
The above statements of cash flows should be read in conjunction with the accompanying notes.
Vanguard Wholesale Australian Equities Funds and ETFs 13
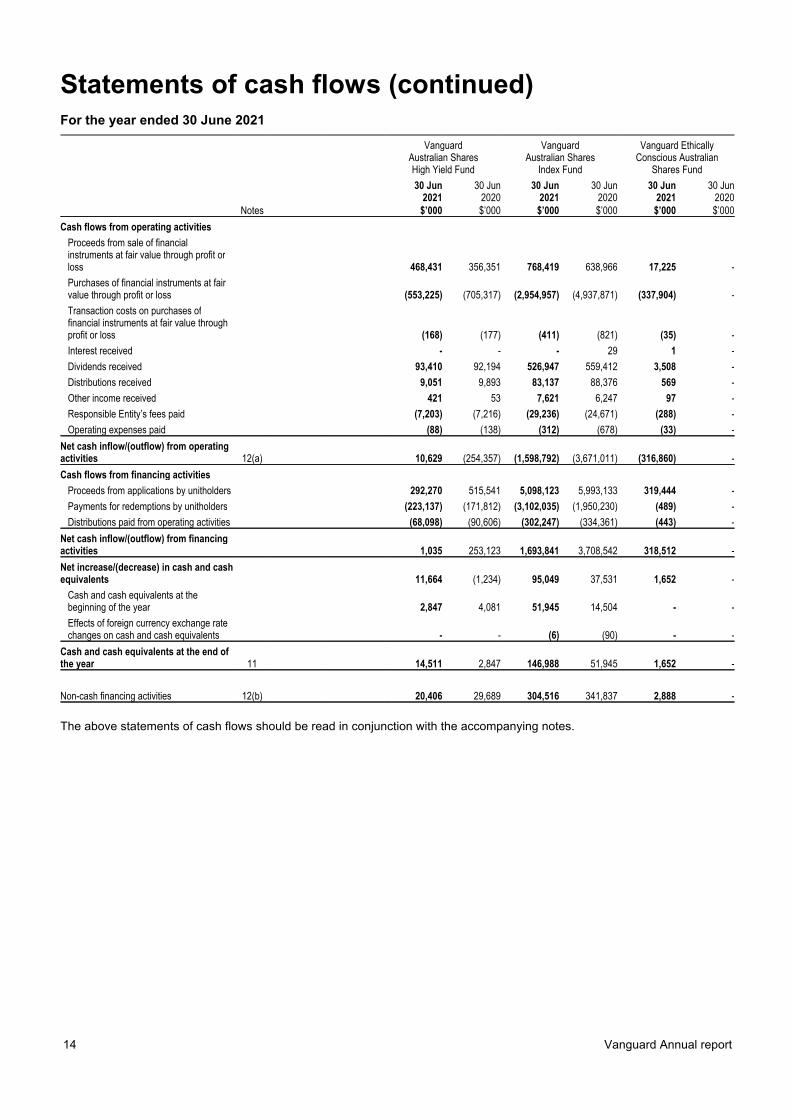
Statements of cash flows (continued)For the year ended 30 June 2021
VanguardAustralian SharesHigh Yield Fund
VanguardAustralian Shares
Index Fund
Vanguard EthicallyConscious Australian
Shares Fund
30 Jun2021
30 Jun2020
30 Jun2021
30 Jun2020
30 Jun2021
30 Jun2020
Notes $’000 $’000 $’000 $’000 $’000 $’000
Cash flows from operating activities
Proceeds from sale of financialinstruments at fair value through profit orloss 468,431 356,351 768,419 638,966 17,225 -
Purchases of financial instruments at fairvalue through profit or loss (553,225) (705,317) (2,954,957) (4,937,871) (337,904) -
Transaction costs on purchases offinancial instruments at fair value throughprofit or loss (168) (177) (411) (821) (35) -
Interest received - - - 29 1 -
Dividends received 93,410 92,194 526,947 559,412 3,508 -
Distributions received 9,051 9,893 83,137 88,376 569 -
Other income received 421 53 7,621 6,247 97 -
Responsible Entity’s fees paid (7,203) (7,216) (29,236) (24,671) (288) -
Operating expenses paid (88) (138) (312) (678) (33) -
Net cash inflow/(outflow) from operatingactivities 12(a) 10,629 (254,357) (1,598,792) (3,671,011) (316,860) -
Cash flows from financing activities
Proceeds from applications by unitholders 292,270 515,541 5,098,123 5,993,133 319,444 -
Payments for redemptions by unitholders (223,137) (171,812) (3,102,035) (1,950,230) (489) -
Distributions paid from operating activities (68,098) (90,606) (302,247) (334,361) (443) -
Net cash inflow/(outflow) from financingactivities 1,035 253,123 1,693,841 3,708,542 318,512 -
Net increase/(decrease) in cash and cashequivalents 11,664 (1,234) 95,049 37,531 1,652 -
Cash and cash equivalents at thebeginning of the year 2,847 4,081 51,945 14,504 - -
Effects of foreign currency exchange ratechanges on cash and cash equivalents - - (6) (90) - -
Cash and cash equivalents at the end ofthe year 11 14,511 2,847 146,988 51,945 1,652 -
Non-cash financing activities 12(b) 20,406 29,689 304,516 341,837 2,888 -
The above statements of cash flows should be read in conjunction with the accompanying notes.
14 Vanguard Annual report

Notes to the financial statementsFor the year ended 30 June 2021
1 General informationThese financial statements cover the Vanguard Wholesale Australian Equities Funds and ETFs (the “Funds”) as registeredmanaged investment schemes. The respective constitution dates are as follows:
Vanguard MSCI Australian Large Companies Index ETF 17 December 2010
Vanguard MSCI Australian Small Companies Index ETF 17 December 2010
Vanguard Australian Property Securities Index Fund 6 December 1996
Vanguard Australian Shares High Yield Fund 21 February 2000
Vanguard Australian Shares Index Fund 6 December 1996
Vanguard Ethically Conscious Australian Shares Fund 1 April 2019
The Responsible Entity of the Vanguard Wholesale Australian Equities Funds and ETFs is Vanguard Investments AustraliaLtd (the “Responsible Entity”). The Responsible Entity’s registered office is Level 13, 130 Lonsdale Street, Melbourne VIC3000.
The Funds invest in accordance with the investment policy of the Funds as set out in their respective Product DisclosureStatements (PDSs) and in accordance with the Funds’ Constitution. The Funds seek to track the returns of the Funds’respective indices, before taking into account fees, expenses and tax.
The ETF Class units of the Funds operate as Exchange Traded Funds (ETFs) listed on the Australian Securities Exchange(ASX).
The registration date of Vanguard Ethically Conscious Australian Shares Fund was 15 April 2019. The Fund remaineddormant until the inception date which was 12 August 2020, the date on which the Fund commenced trading. The ETF Classunits were listed and commenced trading on the ASX on 14 October 2020.
The financial statements were authorised for issue by the directors on 9 September 2021. The directors of the ResponsibleEntity have the power to amend and reissue the financial statements.
2 Summary of significant accounting policiesThe principal accounting policies applied in the preparation of these financial statements are set out below. These policieshave been consistently applied to all periods presented, unless otherwise stated in the following text.
(a) Basis of preparation
These general purpose financial statements have been prepared in accordance with Australian Accounting Standards andInterpretations issued by the Accounting Standards Board and the Corporations Act 2001 in Australia. The Funds are for-profitunit trusts for the purpose of preparing the financial statements.
The financial statements are prepared on the basis of fair value measurement of assets and liabilities except where otherwisestated.
The balance sheet is presented on a liquidity basis. Assets and liabilities are presented in decreasing order of liquidity and donot distinguish between current and non-current. All material balances are expected to be recovered or settled within twelvemonths, except for investments in financial assets at fair value through profit or loss and net assets attributable to unitholders.The amount expected to be recovered or settled within twelve months after the end of each reporting period cannot be reliablydetermined.
The Funds manage financial assets at fair value through profit or loss based on the economic circumstances at any givenpoint in time, as well as to meet any liquidity requirements. As such it is expected that a portion of the portfolio will be realisedwithin 12 months, however, an estimate of that amount cannot be determined as at balance date.
In the case of net assets attributable to unitholders, the units are redeemed on demand at the unitholder’s option. However,holders of these instruments typically retain them for the medium to long term. As such, the amount expected to be settledwithin 12 months cannot be reliably determined.
Vanguard Wholesale Australian Equities Funds and ETFs 15
Notes to the financial statements (continued)For the year ended 30 June 2021
2 Summary of significant accounting policies (continued)
(a) Basis of preparation (continued)
(i) Compliance with International Financial Reporting Standards
The financial statements of the Funds also comply with International Financial Reporting Standards as issued by theInternational Accounting Standards Board.
(ii) New and amended standards adopted by the Funds
There are no standards, interpretations or amendments to existing standards that are effective for the first time for thefinancial year beginning 1 July 2020 that have a material impact on the amounts recognised in the prior periods or will affectthe current or future periods.
(iii) New standards, amendments and interpretations effective after 1 July 2021 and have not been earlyadopted
A number of new standards, amendments to standards and interpretations are effective for annual periods beginning after 1July 2021, and have not been early adopted in preparing these financial statements. None of these are expected to have amaterial effect on the financial statements of the Funds.
(b) Financial instruments
(i) Classification
The Funds classify their investments based on their business model for managing those financial assets and the contractualcash flow characteristics of the financial assets. The Funds’ portfolio of financial assets is managed and performance isevaluated on a fair value basis in accordance with the Funds’ documented investment strategy. The Funds’ policy is for theResponsible Entity to evaluate the information about these financial assets on a fair value basis together with other relatedfinancial information.
Equity securities and derivatives are measured at fair value through profit or loss.
(ii) Recognition/derecognition
The Funds recognise financial assets and financial liabilities on the date they become party to the contractual agreement(trade date) and recognise changes in fair value of the financial assets or financial liabilities from this date.
Investments are derecognised when the right to receive cash flows from the investments has expired or the Funds havetransferred substantially all risks and rewards of ownership.
(iii) Measurement
At initial recognition, the Funds measure financial assets and financial liabilities at fair value. Transaction costs of financialassets carried at fair value through profit and loss are expensed in the statement of comprehensive income.
Subsequent to initial recognition, all financial assets and financial liabilities at fair value through profit or loss are measured atfair value. Gains and losses arising from changes in the fair value of the ‘financial assets or financial liabilities at fair valuethrough profit or loss’ category are presented in the statement of comprehensive income within net gains/(losses) on financialinstruments at fair value through profit or loss in the period in which they arise.
For further details on how the fair value of the financial instruments is determined are disclosed in note 4.
(iv) Offsetting financial instruments
Financial assets and liabilities are offset and the net amount reported in the balance sheet when there is a legally enforceableright to offset the recognised amounts and there is an intention to settle on a net basis, or realise the asset and settle theliability simultaneously.
16 Vanguard Annual report
Notes to the financial statements (continued)For the year ended 30 June 2021
2 Summary of significant accounting policies (continued)
(c) Net assets attributable to unitholders
Units are redeemable at the unitholders’ option, however, applications and redemptions may be suspended by theResponsible Entity if it is in the best interests of the unitholders.
The units can be put back to the Funds at any time for cash based on the redemption price, which is equal to a proportionateshare of the Funds’ net asset value attributable to the unitholders.
The units are carried at the redemption amount that is payable at balance sheet date if the holder exercises the right to put theunits back to the Funds. This amount represents the expected cash flows on redemption of these units.
Units are classified as equity when they satisfy the following criteria under AASB 132 Financial instruments: Presentation:
the puttable financial instrument entitles the holder to a pro-rata share of net assets in the event of the Fund’s liquidation
the puttable financial instrument is in the class of instruments that is subordinate to all other classes of instruments and
class features are identical
apart from the contractual obligation to redeem the units, the puttable financial instrument does not include any contractual
obligations to deliver cash or another financial asset, or to exchange financial instruments with another entity under
potentially unfavourable conditions to the Fund, and it is not a contract settled in the Fund’s own equity instruments; and
the total expected cash flows attributable to the puttable financial instrument over the life are based substantially on the
profit or loss.
(d) Cash and cash equivalents
For the purpose of presentation in the statement of cash flows, cash and cash equivalents includes cash on hand, depositsheld at call with financial institutions, other short term, highly liquid investments with original maturities of three months or lessfrom the date of acquisition that are readily convertible to known amounts of cash and which are subject to an insignificant riskof changes in value, and bank overdrafts. Bank overdrafts are shown as a liability in the balance sheet.
Payments and receipts relating to the purchase and sale of investment securities are classified as cash flows from operatingactivities, as movements in the fair value of these securities represent the Funds’ main income generating activity.
(e) Margin accounts
Margin accounts comprise of cash held with brokers for derivative transactions to meet margin calls. It is not included as acomponent of cash and cash equivalents.
(f) Investment income
Dividend and distribution income from financial assets at fair value through profit or loss is recognised in the statement ofcomprehensive income within dividend income and distribution income when the Fund’s right to receive payments isestablished.
Other changes in fair value for such instruments are recorded in accordance with the policies described in note 2(b) to thefinancial statements.
(g) Expenses
All expenses, including Responsible Entity’s fees and custodian fees, are recognised in the statement of comprehensiveincome on an accruals basis.
(h) Income tax
Under current legislation, Funds that have elected into the AMIT tax regime are not subject to income tax provided theyattribute the entirety of their taxable income to their unitholders.
The benefits of imputation credits and foreign tax paid are passed on to unitholders.
Vanguard Wholesale Australian Equities Funds and ETFs 17

Notes to the financial statements (continued)For the year ended 30 June 2021
2 Summary of significant accounting policies (continued)
(i) Distributions
Distributions are payable as set out in the Funds’ Product Disclosure Statement and/or Funds’ Constitution. Such distributionsare recognised as payable when they are determined by the Responsible Entity of the Funds.
(j) Increase/decrease in net assets attributable to unitholders
Income not distributed is included in net assets attributable to unitholders. Where the Funds’ units are classified as liabilities,movements in net assets attributable to unitholders are recognised in the statement of comprehensive income as financecosts.
(k) Functional and presentation currency
(i) Functional and presentation currency
Items included in the Funds’ financial statements are measured using the currency of the primary economic environment inwhich it operates (the ‘functional currency’). This is the Australian dollar, which reflects the currency of the economy in whichthe Funds compete for funds and is regulated. The Australian dollar is also the Funds’ presentation currency.
(ii) Transactions and balances
Foreign currency transactions are translated into the functional currency using the exchange rates prevailing at the dates ofthe transactions. Foreign exchange gains and losses resulting from the settlement of such transactions and from thetranslations at year end exchange rates of monetary assets and liabilities denominated in foreign currencies are recognised inprofit or loss.
Non-monetary items that are measured at fair value in a foreign currency are translated using the exchange rates at the datewhen fair value was determined. Translation differences on assets and liabilities carried at fair value are reported in thestatement of comprehensive income on a net basis within net gains/(losses) on financial instruments at fair value throughprofit or loss.
(l) Due from/to brokers
Amounts due from/to brokers represent receivables for securities sold and payables for securities purchased that have beencontracted for but not yet delivered by the end of the year.
These amounts are recognised initially at fair value and subsequently measured at amortised cost. At each reporting date, theFunds shall measure the loss allowance on amounts due from broker at an amount equal to the lifetime expected credit lossesif the credit risk has increased significantly since initial recognition. If, at the reporting date, the credit risk has not increasedsignificantly since initial recognition, the Funds shall measure the loss allowance at an amount equal to 12-month expectedcredit losses. Significant financial difficulties of the broker, probability that the broker will enter bankruptcy or financialreorganisation, and default in payments are all considered indicators that a loss allowance may be required. If the credit riskincreases to the point that it is considered to be credit impaired, interest income will be calculated based on the gross carryingamount adjusted for the loss allowance.
(m) Receivables and accrued income
Receivables may include amounts for dividends, interest and trust distributions. Dividends and trust distributions are accruedwhen the right to receive payment is established. Interest is accrued at the end of each reporting period from the time of lastpayment in accordance with the policy set out in note 2(f) above. Amounts are generally received within 30 days of beingrecorded as receivables.
(n) Payables
Payables include liabilities and accrued expenses owing by the Funds which are unpaid as at the end of the reporting period.
As the Funds have a contractual obligation to distribute their distributable income, a separate distribution payable isrecognised in the balance sheet as at the end of each reporting period where this amount remains unpaid as at the end of thereporting period.
(o) Applications and redemptions
Applications received for units in the Funds are recorded net of any entry fees payable prior to the issue of units in the Funds.Redemptions from the Funds are recorded gross of any exit fees payable after the cancellation of units redeemed.
18 Vanguard Annual report
Notes to the financial statements (continued)For the year ended 30 June 2021
2 Summary of significant accounting policies (continued)
(p) Goods and Services Tax (GST)
The GST incurred on the costs of various services provided to the Responsible Entity by third parties have been passed ontothe Funds. The Funds qualify for Reduced Input Tax Credit recovery rate of between 55% and 100%, hence ResponsibleEntity’s fees, custodial fees and other expenses have been recognised in the statement of comprehensive income net of theamount of GST recoverable from the Australian Taxation Office (ATO). Accounts payable are inclusive of GST. The netamount of GST recoverable from the ATO is included in receivables in the balance sheet. Cash flows relating to GST areincluded in the statement of cash flows on a gross basis.
(q) Comparative revisions
Comparative information has been revised where appropriate to enhance comparability. Where necessary, comparativefigures have been adjusted to conform with changes in presentation in the current year.
(r) Use of estimates
The Funds make estimates and assumptions that affect the reported amounts of assets and liabilities within the next financialyear. Estimates are continually evaluated and based on historical experience and other factors, including expectations offuture events that are believed to be reasonable under the circumstances.
For the majority of the Funds’ financial instruments, quoted market prices are readily available. However, certain financialinstruments, for example, over-the-counter derivatives or unquoted securities, are fair valued using valuation techniques. Where valuation techniques (for example, pricing models) are used to determine fair values, they are validated andperiodically reviewed by experienced personnel of the Responsible Entity, independent of the area that created them.
Models use observable data, to the extent practicable. However, areas such as credit risk (both own and counterparty),volatilities and correlations require management to make estimates. Changes in assumptions about these factors could affectthe reported fair value of financial instruments.
For certain other financial instruments, including amounts due from/to brokers and payables, the carrying amountsapproximate fair value due to the immediate or short-term nature of these financial instruments.
(s) Investment entity exception
The Funds have determined that they are investment entities under the definition in AASB 10, as they meet the followingcriteria:
(a) the Funds have obtained funds from unitholders for the purpose of providing them with investment management services;
(b) the Funds’ business purpose, which is communicated directly to unitholders, is investing solely for returns from capitalappreciation and investment income; and
(c) the performance of investments made by the Funds are measured and evaluated on a fair value basis.
The Funds also meet all of the typical characteristics of an investment entity.
The Funds do not control any of the entities where they have an investment and therefore do not prepare consolidatedfinancial statements. Instead, the Funds’ investments are accounted for at fair value through profit or loss as disclosed in note 2(b).
(t) Securities lending arrangements
The Vanguard MSCI Australian Small Companies Index ETF, Vanguard Australian Property Securities Index Fund, VanguardAustralian Shares Index Fund and Vanguard Ethically Conscious Australian Shares Fund have entered into securities lendingarrangements under which legal title to some of the Funds’ assets may be transferred to another entity. The securities areloaned by JPM Chase Bank, N.A., Sydney Branch as agent of the Responsible Entity, to a limited number of pre-approvedbrokers and other financial institutions (the “Borrowers”). The Borrowers provide collateral against loans to an amount of 105%of the fair value of the loaned securities. The earnings on securities lending arrangements have been recognised in thestatement of comprehensive income as other income. All securities lending revenue, with the exception of a minimal lendingagent fee, are received directly into the Funds.
The risks and benefits of ownership of the loaned assets remain with the Funds, because the Funds continue to enjoy therisks and benefits of ownership, assets that have been loaned have not been derecognised (i.e. treated as having been sold).JPM Chase Bank, N.A., Sydney Branch, as lending agent, indemnifies the Funds for replacement of any loaned securities (or,in certain circumstances, return of equivalent cash value) due to a Borrower default on a security loan.
Details of all open transactions at year end are disclosed in note 16.
Vanguard Wholesale Australian Equities Funds and ETFs 19

Notes to the financial statements (continued)For the year ended 30 June 2021
2 Summary of significant accounting policies (continued)
(u) Rounding of amounts
The Funds are registered schemes of the kind referred to in ASIC Corporations (Rounding in Financial/Directors’ Reports)Instrument 2016/191, relating to the “rounding off” amounts in the financial statements. Amounts in the financial statementshave been rounded off to the nearest thousand dollars, unless otherwise indicated.
3 Financial risk managementThe Funds’ activities expose them to a variety of financial risks: market risk (including price risk, foreign exchange risk andinterest rate risk), credit risk and liquidity risk.
The Funds’ overall risk management program focuses on ensuring compliance with the Funds’ Product Disclosure Statementand seeks to maximise the returns derived for the level of risk to which the Funds are exposed. The Funds use derivativefinancial instruments to moderate and create certain risk exposures. Financial risk management is carried out by theinvestment management department of the Responsible Entity under policies approved by the Board of Directors of theResponsible Entity (the “Board”).
The Funds use different methods to measure different types of risks to which they are exposed. These methods are explainedon the following pages.
Market disruptions associated with the COVID-19 pandemic have had a global impact, and uncertainty exists as to the long-term implications. Such disruptions can adversely affect assets of the Funds and thus performance of the Funds.
(a) Market risk
(i) Price risk
The Funds are exposed to equity securities and derivative price risk. This arises from investments held by the Funds for whichprices in the future are uncertain. Where non-monetary financial instruments are denominated in currencies other than theAustralian dollar, the price in the future will also fluctuate because of changes in foreign exchange rates. Paragraph (ii)‘Foreign exchange risk’ below sets out how this component of price risk is managed and measured.
In any asset sector the returns of individual securities are a combination of the market returns and returns specific to eachsecurity. By diversifying their holdings across the market, index funds are generally well protected from the specific risk ofindividual securities. Vanguard employs an indexing investment strategy in all asset classes in which the Funds invest.
At 30 June, the fair value of equities and related derivatives exposed to price risk were as follows:
Vanguard MSCIAustralian Large
Companies Index ETF
Vanguard MSCIAustralian Small
Companies Index ETF
Vanguard AustralianProperty Securities
Index Fund
30 Jun2021
30 Jun2020
30 Jun2021
30 Jun2020
30 Jun2021
30 Jun2020
$’000 $’000 $’000 $’000 $’000 $’000
Derivative assets - 2 1 19 38 -
Equity securities 126,703 96,945 506,475 299,949 54,473 46,749
Listed unit trusts 9,832 8,126 71,999 47,660 6,276,951 4,638,253
Derivative liabilities - - - - - (131)
Net total 136,535 105,073 578,475 347,628 6,331,462 4,684,871
VanguardAustralian SharesHigh Yield Fund
VanguardAustralian Shares
Index Fund
Vanguard EthicallyConscious Australian
Shares Fund
30 Jun2021
30 Jun2020
30 Jun2021
30 Jun2020
30 Jun2021
30 Jun2020
$’000 $’000 $’000 $’000 $’000 $’000
Derivative assets - - 463 520 - -
Equity securities 2,754,592 2,019,861 22,462,977 16,099,959 311,036 -
Listed unit trusts 213,029 209,651 2,619,281 2,038,025 47,337 -
Derivative liabilities (100) - - - (10) -
Net total 2,967,521 2,229,512 25,082,721 18,138,504 358,363 -
20 Vanguard Annual report

Notes to the financial statements (continued)For the year ended 30 June 2021
3 Financial risk management (continued)
(a) Market risk (continued)
(i) Price risk (continued)
The table presented in note 3(b) summarises the impact on operating profit before finance costs attributable to unitholders andliabilities attributable to unitholders from possible changes in market prices that were reasonably based on the risk that theFunds were exposed to at reporting date.
(ii) Cash flow and fair value interest rate risk
Interest rate risk is the risk that the fair value of a financial instrument will fluctuate because of changes in market interestrates.
The Funds have insufficient direct exposure to interest rate risk to be material. All financial liabilities are non-interest bearing.
(b) Summarised sensitivity analysis
The following table summarises the sensitivity of the Funds’ operating profit and net assets attributable to unitholders to pricerisk. The reasonably possible movements in the risk variables have been determined based on management’s best estimate,having regard to a number of factors, including historical levels of changes in interest rates and foreign exchange rates as wellas the indices that the individual Funds are designed to track. However, actual movements in the risk variables may be greateror less than anticipated due to a number of factors, including unusually large market shocks resulting from changes in theperformance of the economies, markets and securities in which the Funds invest. As a result, historic variations in riskvariables are not a definitive indicator of future variations in the risk variables.
The Funds have revised the assumptions used to determine their sensitivity to price risk compared to the comparative periodas a result of increases in market volatility in the recent period. Price risk movement represents the range of historical indexreturns from the average return based on the minimum suggested investment time frames indicated within the Funds’respective PDS minus one standard deviation to average return plus one standard deviation. The Funds have not made anyother changes to the methods used to determine its sensitivity to the market risk compared to the comparative period.
Impact on operating profit/(loss) and net assets attributable to unitholders
Vanguard MSCIAustralian Large
Companies Index ETF
Vanguard MSCIAustralian Small
Companies Index ETF
Vanguard AustralianProperty Securities
Index Fund
VanguardAustralian SharesHigh Yield Fund
VanguardAustralian Shares
Index Fund
Vanguard EthicallyConscious Australian
Shares Fund
Price risk Price risk Price risk Price risk Price risk Price risk$’000 $’000 $’000 $’000 $’000 $’000 $’000 $’000 $’000 $’000 $’000 $’000
Low High Low High Low High Low High Low High Low High
-3% +5% -4% +6% -5% +7% -4% +5% -3% +5% -3% +5%
30 Jun 2021 (4,096) 6,827 (23,139) 34,708 (316,574) 443,203 (118,701) 148,376 (752,481) 1,254,136 (10,751) 17,919
-3% +5% -4% +5% -4% +5% -3% +5% -3% +5% 0% 0%
30 Jun 2020 (3,152) 5,253 (13,905) 17,381 (187,395) 234,243 (66,886) 111,476 (544,156) 906,925 - -
Vanguard Wholesale Australian Equities Funds and ETFs 21

Notes to the financial statements (continued)For the year ended 30 June 2021
3 Financial risk management (continued)
(c) Credit risk
The Funds are exposed to credit risk, which is the risk that a counterparty will be unable to pay amounts in full when they falldue.
The Funds are exposed to counterparty credit risk on derivative financial instruments, cash and cash equivalents, amountsdue from brokers and other receivables. No loss allowance has been recognised based on 12-month expected credit lossesas any such impairment would be wholly insignificant to the Funds.
The maximum exposure to credit risk at the reporting date is the carrying amount of the financial assets. There were nosignificant concentrations of credit risk to counterparties at 30 June 2021 or 30 June 2020.
(i) Derivatives
The Responsible Entity has established counterparty limits such that, at any time, exposure to derivative financial instrumentsequivalent to less than 5% of the value of a Fund are with any individual counterparty, and all contracts are with counterpartiesincluded in the Board’s Approved Counterparties list.
The Funds also restrict their exposure to credit losses on derivative instruments they hold by entering into master nettingarrangements with counterparts with whom they undertake a significant volume of transactions. Master netting arrangementsdo not result in an offset of balance sheet assets and liabilities unless transactions are settled on a net basis. However, thecredit risk associated with favourable contracts is reduced by master netting arrangements to the extent that if an event ofdefault occurs, all amounts with the counterparty are closed and settled on a net basis. The Funds’ overall exposure to creditrisk on derivative instruments subject to master netting arrangements can change substantially within a short period, as it isaffected by each transaction subject to the arrangements. The Funds’ agreements with derivative counterparties are based onthe ISDA Master Agreement. Under the terms of these arrangements, only where certain credit events occur (such as default),the net position owing/receivable to a single counterparty in the same currency will be taken as owing and all the relevantarrangements terminated. As the Funds do not presently have a legally enforceable right of set-off, these amounts have notbeen offset in the balance sheet.
During the year, the Funds could enter into collateral arrangements for repurchase agreements and reverse repurchaseagreements to assist in enhancing returns in a risk controlled environment for the cash flow management of the Funds. Referto note 6 for the balances in relation to these arrangements as of year end.
(ii) Settlement of securities transactions
All transactions in listed securities are settled/paid for upon delivery using approved brokers. The risk of default is consideredlow, as delivery of securities sold is only made once the broker has made payment. Payment is made on purchase once thesecurities have been received by the Fund. The trade will fail if either party fails to meet its obligations.
(iii) Cash and cash equivalents
The exposure to credit risk for cash and cash equivalents is low as all counterparties have a rating of A-1 or higher short-termStandard & Poor’s credit ratings (or Moody’s equivalent).
In accordance with the Responsible Entity’s derivatives policy, the Responsible Entity monitors the Funds’ exposures on adaily basis, which the Board of Directors reviews quarterly. The derivatives policy is subject to annual review.
(iv) Other
The Funds are not materially exposed to credit risk on other financial assets. The maximum exposure to credit risk at the endof the reporting period is the carrying amount of the financial assets.
The clearing and depository operations for the Funds’ security transactions are mainly concentrated with one counterparty,namely JPM Chase Bank, N.A., Sydney Branch. JPM Chase Bank, N.A., Sydney Branch, is a member of a major securitiesexchange, and at 30 June 2021 had a credit rating of A-1 (30 June 2020: A-1). At 30 June 2021, substantially all cash andcash equivalents, balances due from brokers and investments are held in custody by JPM Chase Bank, N.A., Sydney Branch.
22 Vanguard Annual report

Notes to the financial statements (continued)For the year ended 30 June 2021
3 Financial risk management (continued)
(d) Liquidity risk
Liquidity risk is the risk that the Funds may not be able to generate sufficient cash resources to settle its obligations in full asthey fall due or can only do so on terms that are materially disadvantageous.
The Funds are exposed to daily cash redemptions of redeemable units. The Funds primarily hold investments that are tradedin active markets and can be readily disposed. The Funds’ financial instruments include investments in equity investments,fixed interest securities and derivative contracts traded over-the-counter and on an exchange. The Funds’ listed securities areconsidered to be readily realisable as they are all listed on major stock exchanges. The Funds may use futures to gain marketexposure without investing directly in the securities. This allows the Funds to maintain liquidity without being under-invested intheir respective investment policies. The derivatives are not used to leverage the Funds’ portfolios.
The tables below analyses the Funds’ non-derivative financial liabilities into relevant maturity groupings based on theremaining period at balance sheet date to the contractual maturity date. The amounts in the tables are the contractualundiscounted cash flows.
Vanguard MSCI Australian Large Companies Index ETF
30 Jun 2021 30 Jun 2020
Less than1 month
1-6months
6-12months
1-2years Total
Less than1 month
1-6months
6-12months
1-2years Total
$’000 $’000 $’000 $’000 $’000 $’000 $’000 $’000 $’000 $’000
Bank overdraft 88 - - - 88 - - - - -
Distribution payable 638 - - - 638 270 - - - 270
Payables 45 - - - 45 18 - - - 18
Total liabilities 771 - - - 771 288 - - - 288
Vanguard MSCI Australian Small Companies Index ETF
30 Jun 2021 30 Jun 2020
Less than1 month
1-6months
6-12months
1-2years Total
Less than1 month
1-6months
6-12months
1-2years Total
$’000 $’000 $’000 $’000 $’000 $’000 $’000 $’000 $’000 $’000
Distribution payable 17,005 - - - 17,005 20,366 - - - 20,366
Payables 143 - - - 143 91 - - - 91
Due to brokers - payables for securitiespurchased 5,853 - - - 5,853 - - - - -
Total liabilities 23,001 - - - 23,001 20,457 - - - 20,457
Vanguard Australian Property Securities Index Fund
30 Jun 2021 30 Jun 2020
Less than1 month
1-6months
6-12months
1-2years Total
Less than1 month
1-6months
6-12months
1-2years Total
$’000 $’000 $’000 $’000 $’000 $’000 $’000 $’000 $’000 $’000
Financial liabilities at fair value throughprofit or loss - - - - - - 131 - - 131
Bank overdraft - - - - - 15,333 - - - 15,333
Distribution payable 201,877 - - - 201,877 118,461 - - - 118,461
Payables 5,218 - - - 5,218 3,723 - - - 3,723
Due to brokers - payables for securitiespurchased - - - - - 5,562 - - - 5,562
Net assets attributable to unitholders 6,290,335 - - - 6,290,335 4,665,794 - - - 4,665,794
Total liabilities 6,497,430 - - - 6,497,430 4,808,873 131 - - 4,809,004
Vanguard Wholesale Australian Equities Funds and ETFs 23

Notes to the financial statements (continued)For the year ended 30 June 2021
3 Financial risk management (continued)
(d) Liquidity risk (continued)
Vanguard Australian Shares High Yield Fund
30 Jun 2021 30 Jun 2020
Less than1 month
1-6months
6-12months
1-2years Total
Less than1 month
1-6months
6-12months
1-2years Total
$’000 $’000 $’000 $’000 $’000 $’000 $’000 $’000 $’000 $’000
Financial liabilities at fair value throughprofit or loss - 100 - - 100 - - - - -
Distribution payable 14,666 - - - 14,666 9,547 - - - 9,547
Payables 1,591 - - - 1,591 954 - - - 954
Due to brokers - payables for securitiespurchased 5,324 - - - 5,324 - - - - -
Net assets attributable to unitholders 2,984,855 - - - 2,984,855 2,229,021 - - - 2,229,021
Total liabilities 3,006,436 100 - - 3,006,536 2,239,522 - - - 2,239,522
Vanguard Australian Shares Index Fund
30 Jun 2021 30 Jun 2020
Less than1 month
1-6months
6-12months
1-2years Total
Less than1 month
1-6months
6-12months
1-2years Total
$’000 $’000 $’000 $’000 $’000 $’000 $’000 $’000 $’000 $’000
Distribution payable 150,655 - - - 150,655 49,424 - - - 49,424
Payables 126,422 - - - 126,422 100,428 - - - 100,428
Due to brokers - payables for securitiespurchased 24,681 - - - 24,681 434 - - - 434
Net assets attributable to unitholders 25,163,830 - - - 25,163,830 18,148,536 - - - 18,148,536
Total liabilities 25,465,588 - - - 25,465,588 18,298,822 - - - 18,298,822
Vanguard Ethically Conscious Australian Shares Fund
30 Jun 2021 30 Jun 2020
Less than1 month
1-6months
6-12months
1-2years Total
Less than1 month
1-6months
6-12months
1-2years Total
$’000 $’000 $’000 $’000 $’000 $’000 $’000 $’000 $’000 $’000
Financial liabilities at fair value throughprofit or loss - 10 - - 10 - - - - -
Distribution payable 1,331 - - - 1,331 - - - - -
Payables 54 - - - 54 - - - - -
Due to brokers - payables for securitiespurchased 42 - - - 42 - - - - -
Net assets attributable to unitholders 361,346 - - - 361,346 - - - - -
Total liabilities 362,773 10 - - 362,783 - - - - -
4 Fair value measurementThe Funds measure and recognise the following assets and liabilities at fair value on a recurring basis:
Financial assets / liabilities at fair value through profit or loss (FVPL) (see note 6 and 7)
Derivative financial instruments (see note 8)
The Funds have no assets or liabilities at fair value on a non-recurring basis in the current reporting period.
AASB 13 requires disclosure of fair value measurements by level of the following fair value hierarchy:
(a) quoted prices (unadjusted) in active markets for identical assets or liabilities (level 1);
(b) inputs other than quoted prices included within level 1 that are observable for the asset or liability, either directly orindirectly (level 2); and
(c) inputs for the asset or liability that are not based on observable market data (unobservable inputs) (level 3).
24 Vanguard Annual report

Notes to the financial statements (continued)For the year ended 30 June 2021
4 Fair value measurement (continued)
(i) Fair value in an active market (level 1)
The fair value of financial assets and liabilities traded in active markets is based on their quoted market prices at the end ofthe reporting period without any deduction for estimated future selling costs.
The Funds value their investments in accordance with the accounting policies set out in note 2(b) to the financial statements.For the majority of investments, the Funds rely on information provided by independent pricing services for the valuation ofinvestments.
The quoted market price used for financial assets held by the Funds is the current bid price; the appropriate quoted marketprice for financial liabilities is the current asking price. When the Funds hold derivatives with offsetting market risks, they usemid-market prices as a basis for establishing fair values for the offsetting risk positions and applies this bid or asking price tothe net open position, as appropriate.
A financial instrument is regarded as quoted in an active market if quoted prices are readily and regularly available from anexchange, dealer, broker, industry group, pricing service, or regulatory agency, and those prices represent actual andregularly occurring market transactions on an arm’s length basis.
(ii) Fair value in an inactive or unquoted market (level 2 and level 3)
The fair value of financial assets and liabilities that are not traded in an active market is determined using valuationtechniques. These include the use of recent arm’s length market transactions, reference to the current fair value of asubstantially similar other instrument, discounted cash flow techniques, option pricing models or any other valuation techniquethat provides a reliable estimate of prices obtained in actual market transactions. The carrying amounts of the Funds’ assetsand liabilities at the balance sheet date approximate their fair values.
Where discounted cash flow techniques are used, estimated future cash flows are based on management’s best estimatesand the discount rate used is a market rate at the end of the reporting period applicable for an instrument with similar termsand conditions.
For other pricing models, inputs are based on market data at the end of the reporting period. Fair values for unquoted equityinvestments are estimated, if possible, using applicable price/earnings ratios for similar listed companies adjusted to reflectthe specific circumstances of the issuer.
The fair value of derivatives that are not exchange traded is estimated at the amount that the Funds would receive or pay toterminate the contract at the balance sheet date taking into account current market conditions (volatility and appropriate yieldcurve) and the current creditworthiness of the counterparties. The fair value of a forward contract is determined as a netpresent value of estimated future cash flows, discounted at appropriate market rates as at the valuation date. The fair value ofan option contract is determined by applying the Black-Scholes option valuation model.
Investments in other unlisted unit trusts are recorded at the redemption value per unit as reported by the investment managersof such funds.
Some of the inputs to these models may not be market observable and are therefore estimated based on assumptions.
The output of a model is always an estimate or approximation of a value that cannot be determined with certainty, andvaluation techniques employed may not fully reflect all factors relevant to the positions the Funds hold. Valuations aretherefore adjusted, where appropriate, to allow for additional factors including liquidity risk and counterparty risk.
The carrying value less impairment provision of other receivables and payables are assumed to approximate their fair values.The fair value of financial liabilities for disclosure purposes is estimated by discounting the future contractual cash flows at thecurrent market interest rate that is available to the Fund for similar financial instruments.
Vanguard Wholesale Australian Equities Funds and ETFs 25

Notes to the financial statements (continued)For the year ended 30 June 2021
4 Fair value measurement (continued)
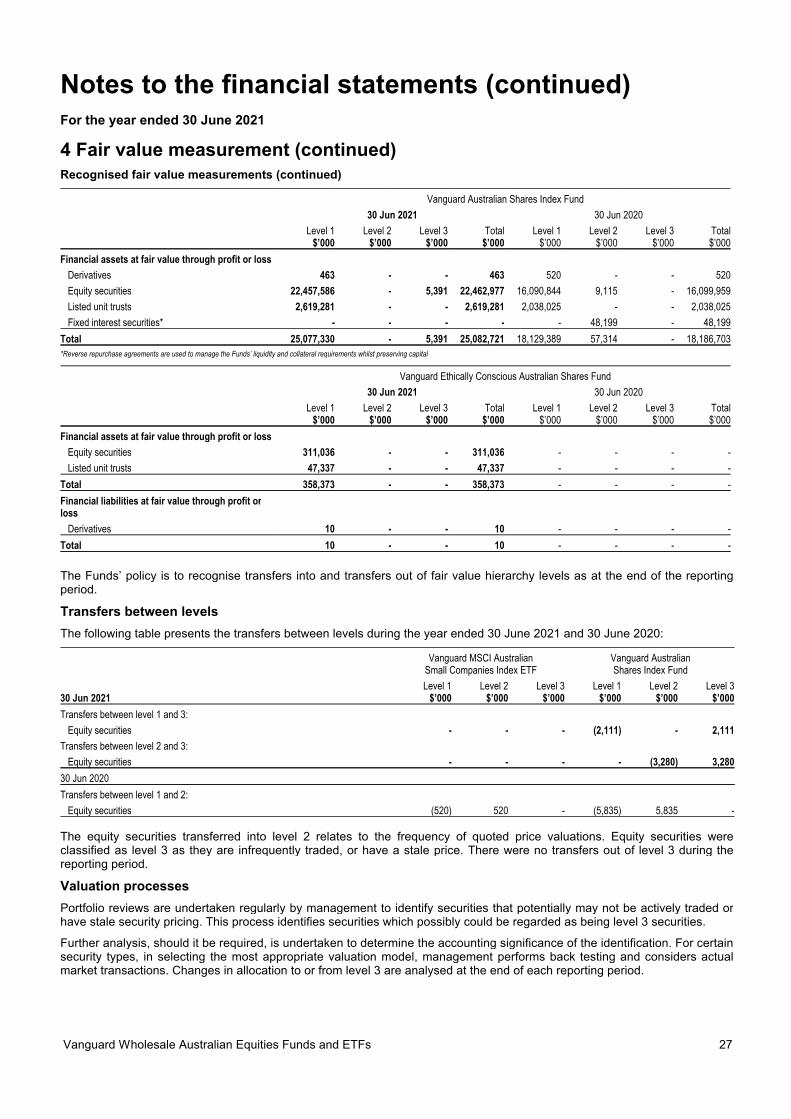
Recognised fair value measurements
The following tables present the Funds’ financial assets and liabilities (by asset class) measured at fair value according to thefair value hierarchy at 30 June 2021 and 30 June 2020.
Vanguard MSCI Australian Large Companies Index ETF
30 Jun 2021 30 Jun 2020
Level 1 Level 2 Level 3 Total Level 1 Level 2 Level 3 Total$’000 $’000 $’000 $’000 $’000 $’000 $’000 $’000
Financial assets at fair value through profit or loss
Derivatives - - - - 2 - - 2
Equity securities 126,703 - - 126,703 96,945 - - 96,945
Listed unit trusts 9,832 - - 9,832 8,126 - - 8,126
Total 136,535 - - 136,535 105,073 - - 105,073
Vanguard MSCI Australian Small Companies Index ETF
30 Jun 2021 30 Jun 2020
Level 1 Level 2 Level 3 Total Level 1 Level 2 Level 3 Total$’000 $’000 $’000 $’000 $’000 $’000 $’000 $’000
Financial assets at fair value through profit or loss
Derivatives 1 - - 1 19 - - 19
Equity securities 506,475 - - 506,475 299,429 520 - 299,949
Listed unit trusts 71,999 - - 71,999 47,660 - - 47,660
Total 578,475 - - 578,475 347,108 520 - 347,628
Vanguard Australian Property Securities Index Fund
30 Jun 2021 30 Jun 2020
Level 1 Level 2 Level 3 Total Level 1 Level 2 Level 3 Total$’000 $’000 $’000 $’000 $’000 $’000 $’000 $’000
Financial assets at fair value through profit or loss
Derivatives 38 - - 38 - - - -
Equity securities 54,473 - - 54,473 46,749 - - 46,749
Listed unit trusts 6,276,951 - - 6,276,951 4,638,253 - - 4,638,253
Total 6,331,462 - - 6,331,462 4,685,002 - - 4,685,002
Financial liabilities at fair value through profit orloss
Derivatives - - - - 131 - - 131
Total - - - - 131 - - 131
Vanguard Australian Shares High Yield Fund
30 Jun 2021 30 Jun 2020
Level 1 Level 2 Level 3 Total Level 1 Level 2 Level 3 Total$’000 $’000 $’000 $’000 $’000 $’000 $’000 $’000
Financial assets at fair value through profit or loss
Equity securities 2,754,592 - - 2,754,592 2,019,861 - - 2,019,861
Listed unit trusts 213,029 - - 213,029 209,651 - - 209,651
Total 2,967,621 - - 2,967,621 2,229,512 - - 2,229,512
Financial liabilities at fair value through profit orloss
Derivatives 100 - - 100 - - - -
Total 100 - - 100 - - - -
26 Vanguard Annual report
Notes to the financial statements (continued)For the year ended 30 June 2021
4 Fair value measurement (continued)Recognised fair value measurements (continued)
Vanguard Australian Shares Index Fund
30 Jun 2021 30 Jun 2020
Level 1 Level 2 Level 3 Total Level 1 Level 2 Level 3 Total$’000 $’000 $’000 $’000 $’000 $’000 $’000 $’000
Financial assets at fair value through profit or loss
Derivatives 463 - - 463 520 - - 520
Equity securities 22,457,586 - 5,391 22,462,977 16,090,844 9,115 - 16,099,959
Listed unit trusts 2,619,281 - - 2,619,281 2,038,025 - - 2,038,025
Fixed interest securities* - - - - - 48,199 - 48,199
Total 25,077,330 - 5,391 25,082,721 18,129,389 57,314 - 18,186,703
*Reverse repurchase agreements are used to manage the Funds’ liquidity and collateral requirements whilst preserving capital
Vanguard Ethically Conscious Australian Shares Fund
30 Jun 2021 30 Jun 2020
Level 1 Level 2 Level 3 Total Level 1 Level 2 Level 3 Total$’000 $’000 $’000 $’000 $’000 $’000 $’000 $’000
Financial assets at fair value through profit or loss
Equity securities 311,036 - - 311,036 - - - -
Listed unit trusts 47,337 - - 47,337 - - - -
Total 358,373 - - 358,373 - - - -
Financial liabilities at fair value through profit orloss
Derivatives 10 - - 10 - - - -
Total 10 - - 10 - - - -
The Funds’ policy is to recognise transfers into and transfers out of fair value hierarchy levels as at the end of the reportingperiod.
Transfers between levels
The following table presents the transfers between levels during the year ended 30 June 2021 and 30 June 2020:
Vanguard MSCI AustralianSmall Companies Index ETF
Vanguard AustralianShares Index Fund
Level 1 Level 2 Level 3 Level 1 Level 2 Level 330 Jun 2021 $’000 $’000 $’000 $’000 $’000 $’000
Transfers between level 1 and 3:
Equity securities - - - (2,111) - 2,111
Transfers between level 2 and 3:
Equity securities - - - - (3,280) 3,280
30 Jun 2020
Transfers between level 1 and 2:
Equity securities (520) 520 - (5,835) 5,835 -
The equity securities transferred into level 2 relates to the frequency of quoted price valuations. Equity securities wereclassified as level 3 as they are infrequently traded, or have a stale price. There were no transfers out of level 3 during thereporting period.
Valuation processes
Portfolio reviews are undertaken regularly by management to identify securities that potentially may not be actively traded orhave stale security pricing. This process identifies securities which possibly could be regarded as being level 3 securities.
Further analysis, should it be required, is undertaken to determine the accounting significance of the identification. For certainsecurity types, in selecting the most appropriate valuation model, management performs back testing and considers actualmarket transactions. Changes in allocation to or from level 3 are analysed at the end of each reporting period.
Vanguard Wholesale Australian Equities Funds and ETFs 27

Notes to the financial statements (continued)For the year ended 30 June 2021
5 Net gains/(losses) on financial instruments at fair value through profit orlossNet gains/(losses) recognised in relation to financial assets and financial liabilities at fair value through profit or loss:
Vanguard MSCIAustralian Large
Companies Index ETF
Vanguard MSCIAustralian Small
Companies Index ETF
Vanguard AustralianProperty Securities
Index Fund
30 Jun2021
30 Jun2020
30 Jun2021
30 Jun2020
30 Jun2021
30 Jun2020
$’000 $’000 $’000 $’000 $’000 $’000
Net unrealised gain/(loss) on financial instrumentsat fair value through profit or loss 27,018 (11,816) 101,709 (34,775) 1,359,087 (1,492,879)
Net realised gain/(loss) on financial instruments atfair value through profit or loss 691 (5) 15,778 18,284 18,168 (12,495)
Total net gains/(losses) on financial instrumentsat fair value through profit or loss 27,709 (11,821) 117,487 (16,491) 1,377,255 (1,505,374)
VanguardAustralian SharesHigh Yield Fund
VanguardAustralian Shares
Index Fund
Vanguard EthicallyConscious Australian
Shares Fund
30 Jun2021
30 Jun2020
30 Jun2021
30 Jun2020
30 Jun2021
30 Jun2020
$’000 $’000 $’000 $’000 $’000 $’000
Net unrealised gain/(loss) on financial instrumentsat fair value through profit or loss 634,988 (346,297) 4,668,633 (1,796,732) 37,670 -
Net realised gain/(loss) on financial instruments atfair value through profit or loss 14,358 (36,764) 67,193 (39,851) 1,031 -
Total net gains/(losses) on financial instrumentsat fair value through profit or loss 649,346 (383,061) 4,735,826 (1,836,583) 38,701 -
6 Financial assets at fair value through profit or loss
Vanguard MSCIAustralian Large
Companies Index ETF
Vanguard MSCIAustralian Small
Companies Index ETF
Vanguard AustralianProperty Securities
Index Fund
30 Jun2021
30 Jun2020
30 Jun2021
30 Jun2020
30 Jun2021
30 Jun2020
Fair value Fair value Fair value Fair value Fair value Fair value$’000 $’000 $’000 $’000 $’000 $’000
Financial assets at fair value through profit orloss
Derivatives - 2 1 19 38 -
Equity securities 126,703 96,945 506,475 299,949 54,473 46,749
Listed unit trusts 9,832 8,126 71,999 47,660 6,276,951 4,638,253
Total financial assets at fair value through profitor loss 136,535 105,073 578,475 347,628 6,331,462 4,685,002
Comprising:
Derivatives
Australian share price futures - 2 1 19 38 -
Total derivatives - 2 1 19 38 -
Equity securities
Australian equity securities 126,703 96,945 506,475 299,949 54,473 46,749
Total equity securities 126,703 96,945 506,475 299,949 54,473 46,749
Listed units trusts
Australian listed trusts 9,832 8,126 71,999 47,660 6,276,951 4,638,253
Total listed unit trusts 9,832 8,126 71,999 47,660 6,276,951 4,638,253
Total financial assets at fair value through profitor loss 136,535 105,073 578,475 347,628 6,331,462 4,685,002
28 Vanguard Annual report

Notes to the financial statements (continued)For the year ended 30 June 2021
6 Financial assets at fair value through profit or loss (continued)
VanguardAustralian SharesHigh Yield Fund
VanguardAustralian Shares
Index Fund
Vanguard EthicallyConscious Australian
Shares Fund
30 Jun2021
30 Jun2020
30 Jun2021
30 Jun2020
30 Jun2021
30 Jun2020
Fair value Fair value Fair value Fair value Fair value Fair value$’000 $’000 $’000 $’000 $’000 $’000
Financial assets at fair value through profit orloss
Derivatives - - 463 520 - -
Equity securities 2,754,592 2,019,861 22,462,977 16,099,959 311,036 -
Listed unit trusts 213,029 209,651 2,619,281 2,038,025 47,337 -
Fixed interest securities - - - 48,199 - -
Total financial assets at fair value through profitor loss 2,967,621 2,229,512 25,082,721 18,186,703 358,373 -
Comprising:
Derivatives
Australian share price futures - - 463 520 - -
Total derivatives - - 463 520 - -
Equity securities
Australian equity securities 2,754,592 2,019,861 22,462,977 16,099,959 311,036 -
Total equity securities 2,754,592 2,019,861 22,462,977 16,099,959 311,036 -
Listed units trusts
Australian listed trusts 213,029 209,651 2,619,281 2,038,025 47,337 -
Total listed unit trusts 213,029 209,651 2,619,281 2,038,025 47,337 -
Fixed interest securities
Australian reverse repurchase agreements* - - - 48,199 - -
Total fixed interest securities - - - 48,199 - -
Total financial assets at fair value through profitor loss 2,967,621 2,229,512 25,082,721 18,186,703 358,373 -
*Reverse repurchase agreements are used to manage the Funds’ liquidity and collateral requirements whilst preserving capital.
An overview of the risk exposures relating to financial assets at fair value through profit or loss is included in note 3.
7 Financial liabilities at fair value through profit or loss
Vanguard AustralianProperty Securities
Index Fund
VanguardAustralian SharesHigh Yield Fund
Vanguard EthicallyConscious Australian
Shares Fund
30 Jun2021
30 Jun2020
30 Jun2021
30 Jun2020
30 Jun2021
30 Jun2020
Fair value Fair value Fair value Fair value Fair value Fair value$’000 $’000 $’000 $’000 $’000 $’000
Financial liabilities at fair value through profit orloss
Derivatives - 131 100 - 10 -
Total financial liabilities at fair value throughprofit or loss - 131 100 - 10 -
Comprising:
Derivatives
Australian share price futures - 131 100 - 10 -
Total derivatives - 131 100 - 10 -
Total financial liabilities at fair value throughprofit or loss - 131 100 - 10 -
An overview of the risk exposures relating to financial liabilities at fair value through profit or loss is included in note 3.
Vanguard Wholesale Australian Equities Funds and ETFs 29

Notes to the financial statements (continued)For the year ended 30 June 2021
8 Derivative financial instrumentsIn the normal course of business the Funds enter into transactions in various derivative financial instruments with certain risks.A derivative is a financial instrument or other contract which is settled at a future date and whose value changes in responseto the change in a specified interest rate, financial instrument price, commodity price, foreign exchange rate, index of prices orrates, credit rating or credit index or other variable.
Derivative financial instruments require no initial net investment or an initial net investment that is smaller than would berequired for other types of contracts that would be expected to have a similar response to changes in market factors.
Derivative transactions include a wide assortment of instruments, such as forwards, futures and options. Derivatives areconsidered to be part of the investment process. The use of derivatives is an essential part of the Funds’ portfoliomanagement. Derivatives are not managed in isolation. Consequently, the use of derivatives is multifaceted and includes:
hedging to protect an asset or liability of a Fund against a fluctuation in market values or to reduce volatility
a substitution for trading of physical securities
adjusting asset exposures within the parameters set in the investment strategy, and adjusting the duration of fixed interest
portfolios or the weighted average maturity of cash portfolios.
While derivatives are used for trading purposes, they are not used to gear (leverage) a portfolio. Gearing a portfolio wouldoccur if the level of exposure to the markets exceeds the underlying value of the Funds.
The Funds hold the following derivative instruments:
Futures
Futures are contractual obligations to buy or sell financial instruments on a future date at a specified price established in anorganised market. The futures contracts are collateralised by cash or marketable securities. Changes in futures contracts'values are usually settled net daily with the exchange. Interest rate futures are contractual obligations to receive or pay a netamount based on changes in interest rates at a future date at a specified price, established in an organised financial market.
The Funds’ derivative financial instruments at year end are detailed below:
Vanguard MSCI Australian Large Companies Index ETF
2021 2020
Contract/ Fair value Contract/ Fair value
Notional Assets Liabilities Notional Assets Liabilities$’000 $’000 $’000 $’000 $’000 $’000
Australian share price index futures - - - 295 2 -
Total - - - 295 2 -
Vanguard MSCI Australian Small Companies Index ETF
2021 2020
Contract/ Fair value Contract/ Fair value
Notional Assets Liabilities Notional Assets Liabilities$’000 $’000 $’000 $’000 $’000 $’000
Australian share price index futures 1,264 1 - 1,031 19 -
Total 1,264 1 - 1,031 19 -
Vanguard Australian Property Securities Index Fund
2021 2020
Contract/ Fair value Contract/ Fair value
Notional Assets Liabilities Notional Assets Liabilities$’000 $’000 $’000 $’000 $’000 $’000
Australian share price index futures 12,299 38 - 3,715 - 131
Total 12,299 38 - 3,715 - 131
30 Vanguard Annual report

Notes to the financial statements (continued)For the year ended 30 June 2021
8 Derivative financial instruments (continued)
Vanguard Australian Shares High Yield Fund
2021 2020
Contract/ Fair value Contract/ Fair value
Notional Assets Liabilities Notional Assets Liabilities$’000 $’000 $’000 $’000 $’000 $’000
Australian share price index futures 19,502 - 100 - - -
Total 19,502 - 100 - - -
Vanguard Australian Shares Index Fund
2021 2020
Contract/ Fair value Contract/ Fair value
Notional Assets Liabilities Notional Assets Liabilities$’000 $’000 $’000 $’000 $’000 $’000
Australian share price index futures 140,668 463 - 23,863 520 -
Total 140,668 463 - 23,863 520 -
Vanguard Ethically Conscious Australian Shares Fund
2021 2020
Contract/ Fair value Contract/ Fair value
Notional Assets Liabilities Notional Assets Liabilities$’000 $’000 $’000 $’000 $’000 $’000
Australian share price index futures 3,431 - 10 - - -
Total 3,431 - 10 - - -
Risk exposures and fair value measurements
Information about the Funds’ exposure to credit risk and foreign exchange risk and about the methods and assumptions usedin determining fair values is provided in note 3 to the financial statements. The maximum exposure to credit risk at the end ofthe reporting period is the carrying amount of each class of derivative financial instruments disclosed above.
9 Net assets attributable to unitholdersUnder AASB 132 Financial instruments: Presentation, puttable financial instruments meet the definition of a financial liability tobe classified as equity where certain strict criteria are met. The Funds shall classify a financial instrument as an equityinstrument from the date when the instrument has all the features and meets the conditions. Otherwise the financialinstrument should be disclosed as a liability.
Movement in number of units and net assets attributable to unitholders during the year were as follows:
Vanguard MSCI AustralianLarge Companies Index ETF
Vanguard MSCI AustralianSmall Companies Index ETF
30 Jun2021
30 Jun2020
30 Jun2021
30 Jun2020
30 Jun2021
30 Jun2020
30 Jun2021
30 Jun2020
No. ’000 No. ’000 $’000 $’000 No. ’000 No. ’000 $’000 $’000
Balance as at 1 July 1,760 1,336 105,384 91,600 6,525 4,321 345,999 249,823
Applications 140 660 9,513 42,382 1,965 2,260 126,537 132,710
Redemptions (100) (240) (6,554) (17,057) (80) (80) (4,498) (4,680)
Units issued upon reinvestment of distributions 4 4 293 278 68 24 3,720 1,405
Distributions paid and payable - - (3,657) (3,621) - - (21,764) (25,783)
Profit/(loss) for the year - - 31,653 (8,198) - - 127,579 (7,476)
Closing balance as at 30 June 1,804 1,760 136,632 105,384 8,478 6,525 577,573 345,999
Vanguard Wholesale Australian Equities Funds and ETFs 31

Notes to the financial statements (continued)For the year ended 30 June 2021
9 Net assets attributable to unitholders (continued)
Vanguard Australian Property Securities Index Fund
Wholesale Class ETF Class
30 Jun2021
30 Jun2020
30 Jun2021
30 Jun2020
30 Jun2021
30 Jun2020
30 Jun2021
30 Jun2020
No. ’000 No. ’000 $’000 $’000 No. ’000 No. ’000 $’000 $’000
Balance as at 1 July 3,943,155 3,781,814 3,149,160 4,058,221 22,160 15,524 1,516,634 1,391,899
Applications 844,763 1,036,221 777,043 998,345 3,336 6,540 272,038 542,012
Redemptions (715,467) (969,413) (649,594) (881,617) (1,460) - (106,856) -
Units issued upon reinvestment of distributions 75,186 94,533 65,283 94,138 58 96 4,467 7,851
Increase/(decrease) in net assets attributable to unitholders - - 847,353 (1,119,927) - - 414,807 (425,128)
Closing balance as at 30 June 4,147,637 3,943,155 4,189,245 3,149,160 24,094 22,160 2,101,090 1,516,634
Vanguard Australian Shares High Yield Fund
Wholesale Class ETF Class
30 Jun2021
30 Jun2020
30 Jun2021
30 Jun2020
30 Jun2021
30 Jun2020
30 Jun2021
30 Jun2020
No. ’000 No. ’000 $’000 $’000 No. ’000 No. ’000 $’000 $’000
Balance as at 1 July 680,238 652,790 891,455 1,023,809 26,001 19,788 1,337,566 1,217,630
Applications 113,804 123,945 169,326 174,395 2,160 6,200 129,200 340,959
Redemptions (139,990) (112,701) (203,341) (164,058) (340) (100) (20,264) (6,258)
Units issued upon reinvestment of distributions 10,333 16,204 14,819 23,398 99 113 5,587 6,291
Increase/(decrease) in net assets attributable to unitholders - - 254,010 (166,089) - - 406,497 (221,056)
Closing balance as at 30 June 664,385 680,238 1,126,269 891,455 27,920 26,001 1,858,586 1,337,566
Vanguard Australian Shares Index Fund
Wholesale Class ETF Class
30 Jun2021
30 Jun2020
30 Jun2021
30 Jun2020
30 Jun2021
30 Jun2020
30 Jun2021
30 Jun2020
No. ’000 No. ’000 $’000 $’000 No. ’000 No. ’000 $’000 $’000
Balance as at 1 July 5,978,546 4,985,861 12,610,902 11,782,480 74,076 45,919 5,537,634 3,841,137
Applications 1,511,566 1,691,124 3,548,106 3,763,528 19,335 29,580 1,623,426 2,227,714
Redemptions (1,332,325) (840,926) (3,113,526) (1,863,464) (180) (1,760) (13,730) (133,725)
Units issued upon reinvestment of distributions 120,811 142,487 275,432 315,574 357 337 29,084 26,263
Increase/(decrease) in net assets attributable to unitholders - - 3,098,091 (1,387,216) - - 1,568,411 (423,755)
Closing balance as at 30 June 6,278,598 5,978,546 16,419,005 12,610,902 93,588 74,076 8,744,825 5,537,634
Vanguard Ethically Conscious Australian Shares Fund
Wholesale Class ETF Class
30 Jun2021
30 Jun2020
30 Jun2021
30 Jun2020
30 Jun2021
30 Jun2020
30 Jun2021
30 Jun2020
No. ’000 No. ’000 $’000 $’000 No. ’000 No. ’000 $’000 $’000
Balance as at 1 July - - - - - - - -
Applications 176,534 - 182,956 - 2,460 - 136,659 -
Redemptions (426) - (489) - - - - -
Units issued upon reinvestment of distributions 2,628 - 2,833 - 1 - 55 -
Increase/(decrease) in net assets attributable to unitholders - - 31,199 - - - 8,133 -
Closing balance as at 30 June 178,736 - 216,499 - 2,461 - 144,847 -
Each unit represents a right to an individual share in the Funds and does not extend to a right to the underlying assets of theFunds. The Vanguard MSCI Australian Large Companies Index ETF and Vanguard MSCI Australian Small Companies IndexETF have no separate classes of units and each unit has the same rights attaching to it as all other units of the Funds.
32 Vanguard Annual report
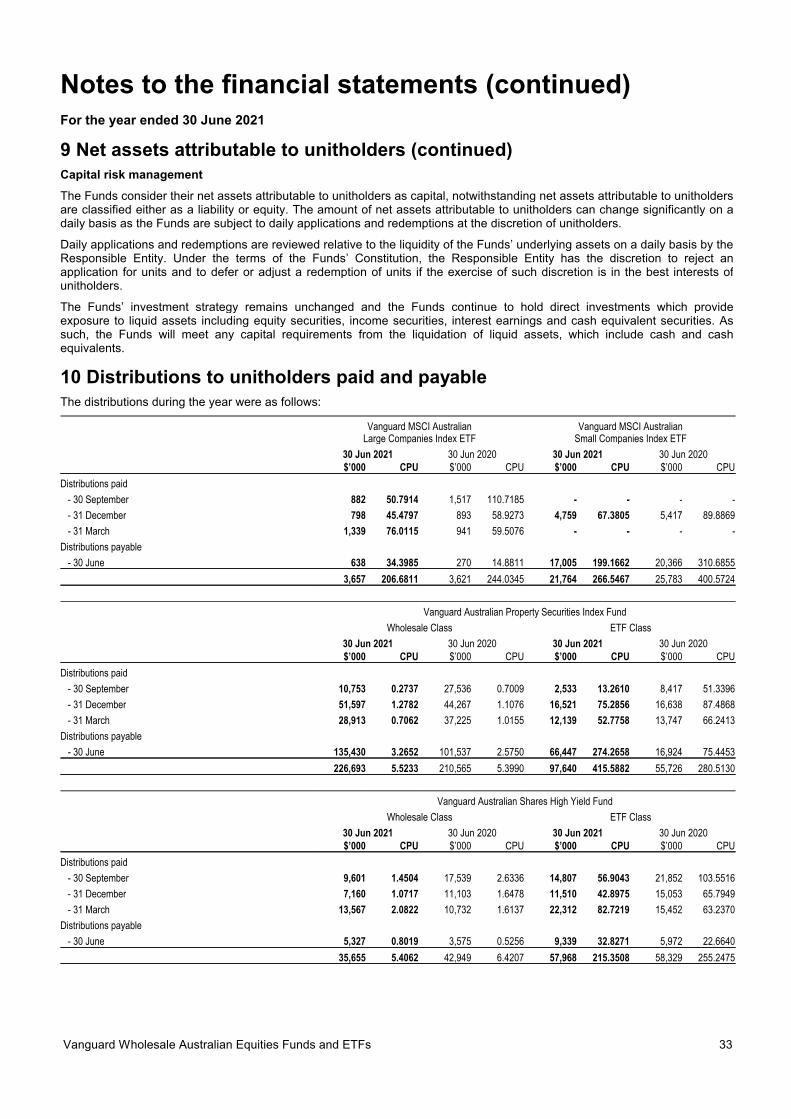
Notes to the financial statements (continued)For the year ended 30 June 2021
9 Net assets attributable to unitholders (continued)Capital risk management
The Funds consider their net assets attributable to unitholders as capital, notwithstanding net assets attributable to unitholdersare classified either as a liability or equity. The amount of net assets attributable to unitholders can change significantly on adaily basis as the Funds are subject to daily applications and redemptions at the discretion of unitholders.
Daily applications and redemptions are reviewed relative to the liquidity of the Funds’ underlying assets on a daily basis by theResponsible Entity. Under the terms of the Funds’ Constitution, the Responsible Entity has the discretion to reject anapplication for units and to defer or adjust a redemption of units if the exercise of such discretion is in the best interests ofunitholders.
The Funds’ investment strategy remains unchanged and the Funds continue to hold direct investments which provideexposure to liquid assets including equity securities, income securities, interest earnings and cash equivalent securities. Assuch, the Funds will meet any capital requirements from the liquidation of liquid assets, which include cash and cashequivalents.
10 Distributions to unitholders paid and payableThe distributions during the year were as follows:
Vanguard MSCI AustralianLarge Companies Index ETF
Vanguard MSCI AustralianSmall Companies Index ETF
30 Jun 2021 30 Jun 2020 30 Jun 2021 30 Jun 2020$’000 CPU $’000 CPU $’000 CPU $’000 CPU
Distributions paid
- 30 September 882 50.7914 1,517 110.7185 - - - -
- 31 December 798 45.4797 893 58.9273 4,759 67.3805 5,417 89.8869
- 31 March 1,339 76.0115 941 59.5076 - - - -
Distributions payable
- 30 June 638 34.3985 270 14.8811 17,005 199.1662 20,366 310.6855
3,657 206.6811 3,621 244.0345 21,764 266.5467 25,783 400.5724
Vanguard Australian Property Securities Index Fund
Wholesale Class ETF Class
30 Jun 2021 30 Jun 2020 30 Jun 2021 30 Jun 2020$’000 CPU $’000 CPU $’000 CPU $’000 CPU
Distributions paid
- 30 September 10,753 0.2737 27,536 0.7009 2,533 13.2610 8,417 51.3396
- 31 December 51,597 1.2782 44,267 1.1076 16,521 75.2856 16,638 87.4868
- 31 March 28,913 0.7062 37,225 1.0155 12,139 52.7758 13,747 66.2413
Distributions payable
- 30 June 135,430 3.2652 101,537 2.5750 66,447 274.2658 16,924 75.4453
226,693 5.5233 210,565 5.3990 97,640 415.5882 55,726 280.5130
Vanguard Australian Shares High Yield Fund
Wholesale Class ETF Class
30 Jun 2021 30 Jun 2020 30 Jun 2021 30 Jun 2020$’000 CPU $’000 CPU $’000 CPU $’000 CPU
Distributions paid
- 30 September 9,601 1.4504 17,539 2.6336 14,807 56.9043 21,852 103.5516
- 31 December 7,160 1.0717 11,103 1.6478 11,510 42.8975 15,053 65.7949
- 31 March 13,567 2.0822 10,732 1.6137 22,312 82.7219 15,452 63.2370
Distributions payable
- 30 June 5,327 0.8019 3,575 0.5256 9,339 32.8271 5,972 22.6640
35,655 5.4062 42,949 6.4207 57,968 215.3508 58,329 255.2475
Vanguard Wholesale Australian Equities Funds and ETFs 33

Notes to the financial statements (continued)For the year ended 30 June 2021
10 Distributions to unitholders paid and payable (continued)
Vanguard Australian Shares Index Fund
Wholesale Class ETF Class
30 Jun 2021 30 Jun 2020 30 Jun 2021 30 Jun 2020$’000 CPU $’000 CPU $’000 CPU $’000 CPU
Distributions paid
- 30 September 123,713 2.0587 158,999 3.0714 42,554 56.8418 52,569 107.0957
- 31 December 114,483 1.9046 110,915 2.0122 36,529 43.4171 38,840 72.1369
- 31 March 172,055 2.7954 118,456 2.0039 68,005 76.9961 43,463 67.2656
Distributions payable
- 30 June 96,779 1.5414 33,446 0.5594 53,876 55.6431 15,978 20.6023
507,030 8.3001 421,816 7.6469 200,964 232.8981 150,850 267.1005
Vanguard Ethically Conscious Australian Shares Fund
Wholesale Class ETF Class
30 Jun 2021 30 Jun 2020 30 Jun 2021 30 Jun 2020$’000 CPU $’000 CPU $’000 CPU $’000 CPU
Distributions paid
- 30 September 539 0.4115 - - - - - -
- 31 December 962 0.6897 - - 134 31.4438 - -
- 31 March 1,434 0.9286 - - 262 43.3642 - -
Distributions payable
- 30 June 775 0.4338 - - 556 22.0911 - -
3,710 2.4636 - - 952 96.8991 - -
11 Cash and cash equivalents
Vanguard MSCIAustralian Large
Companies Index ETF
Vanguard MSCIAustralian Small
Companies Index ETF
Vanguard AustralianProperty Securities
Index Fund
30 Jun2021
30 Jun2020
30 Jun2021
30 Jun2020
30 Jun2021
30 Jun2020
$’000 $’000 $’000 $’000 $’000 $’000
Domestic cash at bank - 314 2,238 1,006 15,537 (15,335)
Foreign cash at bank - - - - 2 2
Bank overdraft (88) - - - - -
Total cash and cash equivalents (88) 314 2,238 1,006 15,539 (15,333)
VanguardAustralian SharesHigh Yield Fund
VanguardAustralian Shares
Index Fund
Vanguard EthicallyConscious Australian
Shares Fund
30 Jun2021
30 Jun2020
30 Jun2021
30 Jun2020
30 Jun2021
30 Jun2020
$’000 $’000 $’000 $’000 $’000 $’000
Domestic cash at bank 14,511 2,847 146,988 51,945 1,652 -
Total cash and cash equivalents 14,511 2,847 146,988 51,945 1,652 -
34 Vanguard Annual report
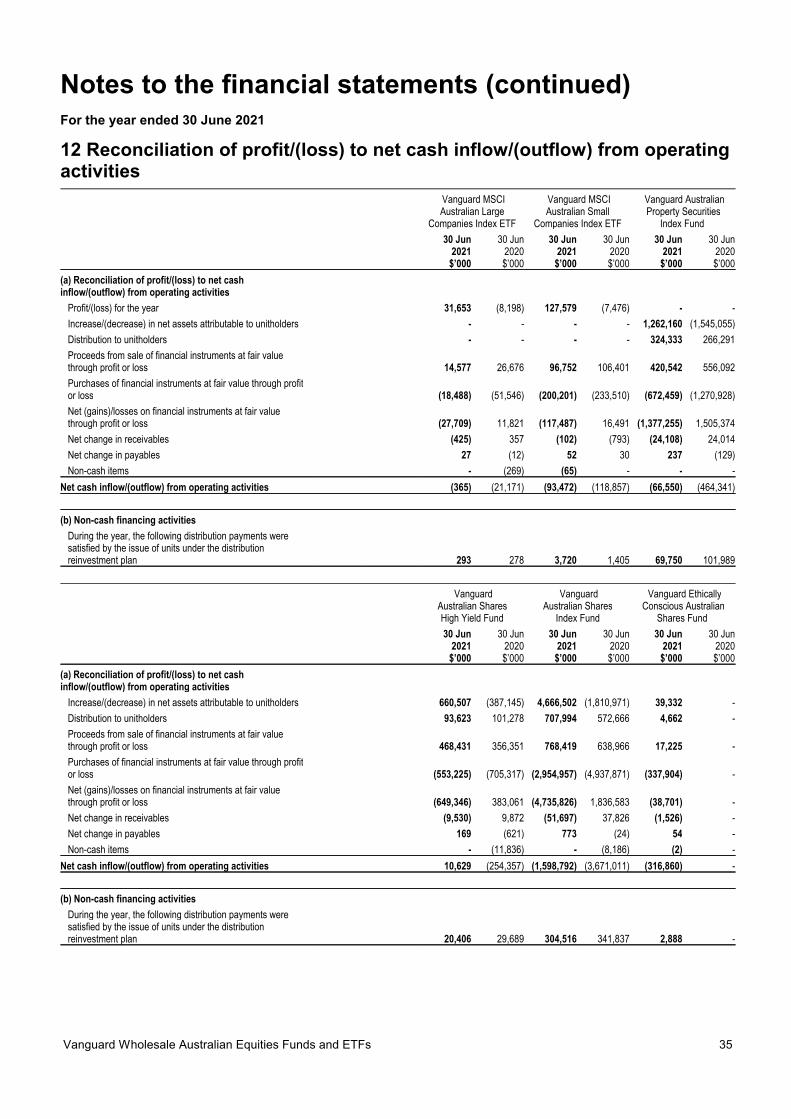
Notes to the financial statements (continued)For the year ended 30 June 2021
12 Reconciliation of profit/(loss) to net cash inflow/(outflow) from operatingactivities
Vanguard MSCIAustralian Large
Companies Index ETF
Vanguard MSCIAustralian Small
Companies Index ETF
Vanguard AustralianProperty Securities
Index Fund
30 Jun2021
30 Jun2020
30 Jun2021
30 Jun2020
30 Jun2021
30 Jun2020
$’000 $’000 $’000 $’000 $’000 $’000
(a) Reconciliation of profit/(loss) to net cashinflow/(outflow) from operating activities
Profit/(loss) for the year 31,653 (8,198) 127,579 (7,476) - -
Increase/(decrease) in net assets attributable to unitholders - - - - 1,262,160 (1,545,055)
Distribution to unitholders - - - - 324,333 266,291
Proceeds from sale of financial instruments at fair valuethrough profit or loss 14,577 26,676 96,752 106,401 420,542 556,092
Purchases of financial instruments at fair value through profitor loss (18,488) (51,546) (200,201) (233,510) (672,459) (1,270,928)
Net (gains)/losses on financial instruments at fair valuethrough profit or loss (27,709) 11,821 (117,487) 16,491 (1,377,255) 1,505,374
Net change in receivables (425) 357 (102) (793) (24,108) 24,014
Net change in payables 27 (12) 52 30 237 (129)
Non-cash items - (269) (65) - - -
Net cash inflow/(outflow) from operating activities (365) (21,171) (93,472) (118,857) (66,550) (464,341)
(b) Non-cash financing activities
During the year, the following distribution payments weresatisfied by the issue of units under the distributionreinvestment plan 293 278 3,720 1,405 69,750 101,989
VanguardAustralian SharesHigh Yield Fund
VanguardAustralian Shares
Index Fund
Vanguard EthicallyConscious Australian
Shares Fund
30 Jun2021
30 Jun2020
30 Jun2021
30 Jun2020
30 Jun2021
30 Jun2020
$’000 $’000 $’000 $’000 $’000 $’000
(a) Reconciliation of profit/(loss) to net cashinflow/(outflow) from operating activities
Increase/(decrease) in net assets attributable to unitholders 660,507 (387,145) 4,666,502 (1,810,971) 39,332 -
Distribution to unitholders 93,623 101,278 707,994 572,666 4,662 -
Proceeds from sale of financial instruments at fair valuethrough profit or loss 468,431 356,351 768,419 638,966 17,225 -
Purchases of financial instruments at fair value through profitor loss (553,225) (705,317) (2,954,957) (4,937,871) (337,904) -
Net (gains)/losses on financial instruments at fair valuethrough profit or loss (649,346) 383,061 (4,735,826) 1,836,583 (38,701) -
Net change in receivables (9,530) 9,872 (51,697) 37,826 (1,526) -
Net change in payables 169 (621) 773 (24) 54 -
Non-cash items - (11,836) - (8,186) (2) -
Net cash inflow/(outflow) from operating activities 10,629 (254,357) (1,598,792) (3,671,011) (316,860) -
(b) Non-cash financing activities
During the year, the following distribution payments weresatisfied by the issue of units under the distributionreinvestment plan 20,406 29,689 304,516 341,837 2,888 -
Vanguard Wholesale Australian Equities Funds and ETFs 35

Notes to the financial statements (continued)For the year ended 30 June 2021
13 Remuneration of auditorsThe auditor's remuneration is borne by the Responsible Entity. During the year, the following fees were paid or payable forservices provided by the auditor of the Funds.
Vanguard MSCIAustralian Large
Companies Index ETF
Vanguard MSCIAustralian Small
Companies Index ETF
30 Jun2021
30 Jun2020
30 Jun2021
30 Jun2020
$ $ $ $
Auditors of the Funds - PwC
Audit and review of financial statements 20,265 18,000 20,265 18,000
Other assurance services
Audit of compliance plan and specified assertions report 3,388 3,699 3,388 3,699
Other non-audit services
Tax compliance services 10,020 9,490 10,020 9,490
Total services provided by PwC 33,673 31,189 33,673 31,189
Vanguard AustralianProperty Securities
Index Fund
VanguardAustralian SharesHigh Yield Fund
VanguardAustralian Shares
Index Fund
Vanguard EthicallyConscious Australian
Shares Fund
30 Jun2021
30 Jun2020
30 Jun2021
30 Jun2020
30 Jun2021
30 Jun2020
30 Jun2021
30 Jun2020
$ $ $ $ $ $ $ $
Auditors of the Funds - PwC
Audit and review of financial statements 21,265 19,000 21,265 19,000 21,265 19,000 21,265 500
Other assurance services
Audit of compliance plan, specified assertions report andinternal controls report 10,451 9,324 10,451 9,324 10,451 9,324 10,451 1,968
Other non-audit services
Tax compliance services 10,020 9,490 10,020 9,490 10,020 9,490 10,020 -
Total services provided by PwC 41,736 37,814 41,736 37,814 41,736 37,814 41,736 2,468
14 Related party transactions
Responsible Entity
The Responsible Entity of the Vanguard Wholesale Australian Equities Funds and ETFs is Vanguard Investments AustraliaLtd (ABN 72 072 881 086 AFSL 227263), which is a wholly owned subsidiary of The Vanguard Group, Inc.
Key management personnel
Key management personnel includes persons who were directors of Responsible Entity at any time during the financial yearas follows:
J M Norris (Resigned 21 September 2020)
C Lui (Resigned 31 December 2020)
J Platt
F Kolimago
C McIsaac (Appointed 25 September 2020)
C Cosby (Appointed 21 May 2021)
D Shrimski (Appointed 21 May 2021)
No other person had authority and responsibility for planning, directing and controlling the activities of the Funds, directly orindirectly during the financial year.
36 Vanguard Annual report

Notes to the financial statements (continued)For the year ended 30 June 2021
14 Related party transactions (continued)
Transactions with key management personnel
Key management personnel services are provided by Vanguard Investments Australia Ltd and included in the managementfees. There is no separate charge for these services. There was no compensation paid directly by the Funds to any of the keymanagement personnel.
Key management personnel unitholdings
The key management personnel of Vanguard Investments Australia Ltd (VIA) did not hold any units in the Funds during thefinancial year ended 30 June 2021 and 30 June 2020.
Key management personnel remuneration
Key management personnel are paid by the Responsible Entity. Payments made from the Funds do not include any amountsdirectly attributable to key management personnel remuneration.
Key management personnel loan disclosures
The Funds have not made, guaranteed or secured, directly or indirectly, any loans to the key management personnel or theirpersonally related entities at any time during the reporting period.
Responsible Entity’s fees and other transactions
During the year ended 30 June 2021, the Responsible Entity received an all-inclusive management fee (inclusive of GST, netof RITC available to the Funds) over the Funds’ average net assets attributable to unitholders for the year as follows:
Management costs
2021 2020% per
annum% per
annum
Vanguard MSCI Australian Large Companies Index ETF 0.20 0.20
Vanguard MSCI Australian Small Companies Index ETF 0.30 0.30
Vanguard Australian Property Securities Index Fund - Wholesale Class 0.23 0.23
Vanguard Australian Property Securities Index Fund - ETF Class 0.23 0.23
Vanguard Australian Shares High Yield Fund - Wholesale Class 0.35 0.38
Vanguard Australian Shares High Yield Fund - ETF Class 0.25 0.25
Vanguard Australian Shares Index Fund - Wholesale Class 0.16 0.18
Vanguard Australian Shares Index Fund - ETF Class 0.10 0.14
Vanguard Ethically Conscious Australian Shares Fund - Wholesale Class 0.20 -
Vanguard Ethically Conscious Australian Shares Fund - ETF Class 0.16 -
All related party transactions are conducted on normal commercial terms and conditions. The transactions during the year andamounts payable at year end between the Funds and the Responsible Entity are as follows:
Vanguard MSCIAustralian Large
Companies Index ETF
Vanguard MSCIAustralian Small
Companies Index ETF
Vanguard AustralianProperty Securities
Index Fund
30 Jun2021
30 Jun2020
30 Jun2021
30 Jun2020
30 Jun2021
30 Jun2020
$ $ $ $ $ $
Responsible Entity’s fees for the year 237,118 196,417 1,364,790 958,514 12,590,903 12,660,469
Total fees payable to the Responsible Entity at year end 44,981 17,183 142,577 91,251 1,203,809 932,828
VanguardAustralian SharesHigh Yield Fund
VanguardAustralian Shares
Index Fund
Vanguard EthicallyConscious Australian
Shares Fund
30 Jun2021
30 Jun2020
30 Jun2021
30 Jun2020
30 Jun2021
30 Jun2020
$ $ $ $ $ $
Responsible Entity’s fees for the year 7,370,539 6,618,363 30,012,517 24,642,585 341,498 -
Total fees payable to the Responsible Entity at year end 702,206 534,266 2,893,700 2,117,391 53,032 -
Vanguard Wholesale Australian Equities Funds and ETFs 37

Notes to the financial statements (continued)For the year ended 30 June 2021
14 Related party transactions (continued)
Related party unitholdings
Parties related to the Funds including the Responsible Entity, its affiliates or other schemes managed by the ResponsibleEntity held units in the Funds as follows:
Vanguard Australian Property Securities Index Fund
30 Jun 2021
Number ofunits held
opening
Number ofunits held
closingFair value ofinvestments
Interestheld at
year end
Numberof units
acquired
Numberof units
disposed
Distributionspaid/payableby the Fund
Unitholder Units Units $ % Units Units $
Vanguard Index Australian Property Securities Fund 127,703,820 126,594,163 127,898,083 3.05 11,970,705 13,080,362 7,041,267
Vanguard Managed Payout Fund 714,255 - - - 141,301 855,556 -
Vanguard Australian Property Securities Index Fund
30 Jun 2020
Number ofunits held
opening
Number ofunits held
closingFair value ofinvestments
Interestheld at
year end
Numberof units
acquired
Numberof units
disposed
Distributionspaid/payableby the Fund
Unitholder Units Units $ % Units Units $
Vanguard Index Australian Property Securities Fund 111,751,312 127,703,820 102,035,352 3.24 29,508,753 13,556,245 6,881,624
Vanguard Managed Payout Fund 437,884 714,255 570,690 0.02 412,872 136,501 35,556
Vanguard Australian Shares High Yield Fund
30 Jun 2021
Number ofunits held
opening
Number ofunits held
closingFair value ofinvestments
Interestheld at
year end
Numberof units
acquired
Numberof units
disposed
Distributionspaid/payableby the Fund
Unitholder Units Units $ % Units Units $
Vanguard High Yield Australian Shares Fund 91,853,849 89,622,530 152,008,773 13.49 6,008,105 8,239,424 4,830,613
Vanguard Australian Shares High Yield Fund
30 Jun 2020
Number ofunits held
opening
Number ofunits held
closingFair value ofinvestments
Interestheld at
year end
Numberof units
acquired
Numberof units
disposed
Distributionspaid/payableby the Fund
Unitholder Units Units $ % Units Units $
Vanguard High Yield Australian Shares Fund 87,629,724 91,853,849 120,392,840 13.50 14,717,575 10,493,450 5,781,994
Vanguard Australian Shares Index Fund
30 Jun 2021
Number ofunits held
opening
Number ofunits held
closingFair value ofinvestments
Interestheld at
year end
Numberof units
acquired
Numberof units
disposed
Distributionspaid/payableby the Fund
Unitholder Units Units $ % Units Units $
Vanguard Index Australian Shares Fund 271,956,425 277,312,984 725,367,572 4.42 18,726,512 13,369,953 22,706,120
Vanguard LifeStrategy® Conservative Fund 3,254,168 2,536,135 6,633,769 0.04 989,610 1,707,643 237,033
Vanguard LifeStrategy® Balanced Fund 14,918,274 13,831,779 36,179,784 0.22 3,796,204 4,882,699 1,203,242
Vanguard LifeStrategy® Growth Fund 30,776,518 30,215,722 79,035,264 0.48 6,632,405 7,193,201 2,551,323
Vanguard LifeStrategy® High Growth Fund 46,608,076 49,691,359 129,977,688 0.79 11,737,141 8,653,858 4,059,126
Vanguard Conservative Index Fund 148,142,834 141,551,340 370,255,841 2.25 54,461,234 61,052,728 12,244,727
Vanguard Balanced Index Fund 509,669,109 538,170,836 1,407,693,454 8.57 175,687,999 147,186,272 43,945,279
Vanguard Growth Index Fund 723,674,062 798,889,755 2,089,655,931 12.72 284,830,330 209,614,637 63,560,496
Vanguard High Growth Index Fund 572,615,126 721,412,670 1,886,999,121 11.49 319,450,189 170,652,645 54,486,880
Vanguard Managed Payout Fund 2,137,029 - - - 103,551 2,240,580 -
38 Vanguard Annual report

Notes to the financial statements (continued)For the year ended 30 June 2021
14 Related party transactions (continued)
Related party unitholdings (continued)
Vanguard Australian Shares Index Fund
30 Jun 2020
Number ofunits held
opening
Number ofunits held
closingFair value ofinvestments
Interestheld at
year end
Numberof units
acquired
Numberof units
disposed
Distributionspaid/payableby the Fund
Unitholder Units Units $ % Units Units $
Vanguard Index Australian Shares Fund 253,739,656 271,956,425 573,882,449 4.55 34,541,188 16,324,419 19,807,139
Vanguard LifeStrategy® Conservative Fund 2,195,664 3,254,168 6,866,945 0.05 4,291,732 3,233,228 234,013
Vanguard LifeStrategy® Balanced Fund 11,228,453 14,918,274 31,480,542 0.25 7,359,752 3,669,931 1,042,638
Vanguard LifeStrategy® Growth Fund 26,549,935 30,776,518 64,944,609 0.51 8,368,157 4,141,574 2,170,557
Vanguard LifeStrategy® High Growth Fund 38,620,104 46,608,076 98,352,362 0.78 13,865,996 5,878,024 3,212,181
Vanguard Conservative Index Fund 98,844,308 148,142,834 312,611,009 2.48 69,669,788 20,371,262 9,889,308
Vanguard Balanced Index Fund 361,112,547 509,669,109 1,075,503,753 8.52 211,957,893 63,401,331 34,320,915
Vanguard Growth Index Fund 564,676,075 723,674,062 1,527,097,006 12.10 315,140,418 156,142,431 53,438,728
Vanguard High Growth Index Fund 400,080,347 572,615,126 1,208,332,438 9.58 226,605,131 54,070,352 37,900,353
Vanguard Managed Payout Fund 1,541,200 2,137,029 4,509,558 0.04 1,093,681 497,852 150,172
Investments
The Funds did not hold any investments in Vanguard Investments Australia Ltd during the year.
The Funds did not hold any investments in other schemes managed by the Responsible Entity or its related parties.
Other transactions within the Funds
Apart from those details disclosed in this note, no directors have entered into a material contract with the Funds during thefinancial year and there were no material contracts involving directors’ interests subsisting at year end.
15 Responsible Entity’s fees
Vanguard MSCIAustralian Large
Companies Index ETF
Vanguard MSCIAustralian Small
Companies Index ETF
30 Jun2021
30 Jun2020
30 Jun2021
30 Jun2020
$'000 $'000 $'000 $'000
Responsible Entity's fees incurred by the Funds 237 196 1,365 959
Management costs per annum %0.20 %0.20 %0.30 %0.30
Vanguard Australian PropertySecurities Index Fund
Vanguard Australian SharesHigh Yield Fund
Wholesale Class ETF Class Wholesale Class ETF Class
30 Jun2021
30 Jun2020
30 Jun2021
30 Jun2020
30 Jun2021
30 Jun2020
30 Jun2021
30 Jun2020
$'000 $'000 $'000 $'000 $'000 $'000 $'000 $'000
Responsible Entity's fees incurred by the Funds 8,535 9,063 4,056 3,597 3,456 3,540 3,915 3,078
Management costs per annum %0.23 %0.23 %0.23 %0.23 %0.35 %0.38 %0.25 %0.25
Vanguard AustralianShares Index Fund
Vanguard Ethically ConsciousAustralian Shares Fund
Wholesale Class ETF Class Wholesale Class ETF Class
30 Jun2021
30 Jun2020
30 Jun2021
30 Jun2020
30 Jun2021
30 Jun2020
30 Jun2021
30 Jun2020
$'000 $'000 $'000 $'000 $'000 $'000 $'000 $'000
Responsible Entity's fees incurred by the Funds 22,979 20,107 7,034 4,536 285 - 56 -
Management costs per annum %0.16 %0.18 %0.10 %0.14 %0.20 %- %0.16 %-
Vanguard Wholesale Australian Equities Funds and ETFs 39

Notes to the financial statements (continued)For the year ended 30 June 2021
16 Securities LendingThe aggregate amount of securities on loan by the Funds and the value of collateral held by the Funds in respect of thesesecurities are set out below. There was no cash collateral received.
30 Jun 2021 30 Jun 2020
Value of outstandingsecurities on loan
Value ofcollateral
Value of outstandingsecurities on loan
Value ofcollateral
$’000 $’000 $’000 $’000
Vanguard MSCI Australian Small Companies Index ETF 22,922 25,041 10,649 11,389
Vanguard Australian Property Securities Index Fund 16,389 17,533 7,635 8,302
Vanguard Australian Shares Index Fund 266,593 289,425 261,145 286,860
Vanguard Ethically Conscious Australian Shares Fund 4,121 4,551 - -
17 Events occurring after the reporting periodThere are no significant events that have occurred since balance date which would impact on the financial position of theFunds as disclosed in the balance sheet as at 30 June 2021 or on the results and cash flows of the Funds for the year endedon that date.
18 Contingent assets, contingent liabilities and commitmentsThere are no outstanding contingent assets, liabilities or commitments as at 30 June 2021 (30 June 2020: Nil).
40 Vanguard Annual report

Directors’ declarationIn the opinion of the directors of the Responsible Entity:
(a) the financial statements and notes set out on pages 8 to 40 are in accordance with the Corporations Act 2001, including:
(i) complying with Accounting Standards, the Corporations Regulations 2001 and other mandatory professional reportingrequirements; and
(ii) giving a true and fair view of the Funds’ financial position as at 30 June 2021 and of their performance, asrepresented by the results of their operations for the financial year ended on that date.
(b) there are reasonable grounds to believe that the Funds will be able to pay their debts as and when they become due andpayable.
(c) Note 2(a) confirms that the financial statements comply with International Financial Reporting Standards as issued by theInternational Accounting Standards Board.
This declaration is made in accordance with a resolution of the directors.
F Kolimago
Managing Director
Melbourne
9 September 2021
Vanguard Wholesale Australian Equities Funds and ETFs 41

PricewaterhouseCoopers, ABN 52 780 433 757 2 Riverside Quay, SOUTHBANK VIC 3006, GPO Box 1331, MELBOURNE VIC 3001 T: 61 3 8603 1000, F: 61 3 8603 1999, www.pwc.com.au
Liability limited by a scheme approved under Professional Standards Legislation.
Independent auditor’s report To the unitholders of:
Vanguard MSCI Australian Large Companies Index ETF* Vanguard MSCI Australian Small Companies Index ETF* Vanguard Australian Property Securities Index Fund* Vanguard Australian Shares High Yield Fund* Vanguard Australian Shares Index Fund* Vanguard Ethically Conscious Australian Shares Fund*
referred to collectively as Vanguard Wholesale Australian Equities Funds and ETFs.
* denotes listed Funds
Report on the audit of the financial report
Our opinion
In our opinion:
The accompanying financial report of Vanguard Wholesale Australian Equities Funds and ETFs (the Funds) is in accordance with the Corporations Act 2001, including:
(a) giving a true and fair view of the Funds’ financial positions as at 30 June 2021 and of their financial performance for the year then ended
(b) complying with Australian Accounting Standards and the Corporations Regulations 2001.
What we have audited The financial report comprises:
the balance sheets as at 30 June 2021
the statements of comprehensive income for the year then ended
the statements of changes in equity for the year then ended
the statements of cash flows for the year then ended
the notes to the financial statements, which include significant accounting policies and other explanatory information
the directors’ declaration.
Basis for opinion
We conducted our audit in accordance with Australian Auditing Standards. Our responsibilities under those standards are further described in the Auditor’s responsibilities for the audit of the financial report section of our report.
We believe that the audit evidence we have obtained is sufficient and appropriate to provide a basis for our opinion.

Independence We are independent of the Funds in accordance with the auditor independence requirements of the Corporations Act 2001 and the ethical requirements of the Accounting Professional & Ethical Standards Board’s APES 110 Code of Ethics for Professional Accountants (including Independence Standards) (the Code) that are relevant to our audit of the financial report in Australia. We have also fulfilled our other ethical responsibilities in accordance with the Code.
Our audit approach
An audit is designed to provide reasonable assurance about whether the financial report is free from material misstatement. Misstatements may arise due to fraud or error. They are considered material if individually or in aggregate, they could reasonably be expected to influence the economic decisions of users taken on the basis of the financial report.
We tailored the scope of our audit in order to perform sufficient work to enable us to provide an opinion on the financial report as a whole, taking into account the structure of the Funds, the accounting processes and controls and the industry in which the Funds operate.
Materiality
For the purpose of our audit, we used approximately 1% of each Fund’s net assets to set our overall materiality for each Fund.
We applied this threshold, together with qualitative considerations, to determine the scope of our audit and the nature, timing and extent of our audit procedures and to evaluate the effect of misstatements on the financial report as a whole.
We chose net assets because, in our view, it is the metric against which the performance of the Funds are most commonly measured and is a generally accepted benchmark in the fund industry.
We utilised 1% as the threshold based on our professional judgement, noting it is within the range of commonly acceptable thresholds.
Audit Scope
Our audit focused on where the Funds made subjective judgements; for example, significant accounting estimates involving assumptions and inherently uncertain future events.
Our audit approach reflects the nature of the investments held by the Funds and the consideration of the work undertaken by third-party service providers. The key service provider relevant to our audit is the

administrator and custodian, who maintains the accounting records of the Funds and provides custodian services for the investments.
Key audit matters
Key audit matters are those matters that, in our professional judgement, were of most significance in our audit of the financial report for the current period. The key audit matters were addressed in the context of our audit of the financial report as a whole, and in forming our opinion thereon, and we do not provide a separate opinion on these matters. Further, any commentary on the outcomes of a particular audit procedure is made in that context. We communicated the key audit matters to the Audit Committee.
Key audit matter How our audit addressed the key audit matter
Investments in financial assets at fair value through profit or loss Refer to note 2 (Summary of significant accounting policies) and note 4 (Fair value measurement)
At 30 June 2021, investments in financial assets at fair value through profit or loss comprised primarily of investments in listed equity securities and listed unit trusts.
Investments in financial assets at fair value through profit or loss was a key audit matter because investments represent the principal element of the balance sheet. A discrepancy in the valuation or existence of investments could cause the net asset value to be materially misstated which would also impact the Funds' reported performance as the valuation of investments is the main driver of movements in the profit of the Funds.
To assess the design and operating effectiveness of the service providers' relevant controls, we:
inspected the most recent reports provided to Vanguard Investments Australia Ltd (the Responsible Entity) by the service providers setting out the controls in place at that service provider, and that included an independent audit opinion over the design and operating effectiveness of those controls.
developed an understanding of the control objectives and associated control activities and evaluated the results of the tests undertaken and the conclusions formed by the auditor on the design and operating effectiveness of controls, to the extent relevant to our audit of the Funds.
We obtained an independent audit report from the third-party service provider's auditors on the valuation and existence of the Funds' investments as at balance sheet date. We compared the number and value of the investments at 30 June 2021 as recorded in the Funds' financial report and underlying accounting records to this report.

Other information
The directors of the Responsible Entity are responsible for the other information. The other information comprises the information included in the annual report for the year ended 30 June 2021, but does not include the financial report and our auditor’s report thereon.
Our opinion on the financial report does not cover the other information and accordingly we do not express any form of assurance conclusion thereon.
In connection with our audit of the financial report, our responsibility is to read the other information and, in doing so, consider whether the other information is materially inconsistent with the financial report or our knowledge obtained in the audit, or otherwise appears to be materially misstated.
If, based on the work we have performed on the other information that we obtained prior to the date of this auditor’s report, we conclude that there is a material misstatement of this other information, we are required to report that fact. We have nothing to report in this regard.
Responsibilities of the directors of the Responsible Entity for the financial report
The directors of the Responsible Entity are responsible for the preparation of the financial report that gives a true and fair view in accordance with Australian Accounting Standards and the Corporations Act 2001 and for such internal control as the directors of the Responsible Entity determines is necessary to enable the preparation of the financial report that gives a true and fair view and is free from material misstatement, whether due to fraud or error.
In preparing the financial report, the directors of the Responsible Entity are responsible for assessing the ability of the Funds to continue as a going concern, disclosing, as applicable, matters related to going concern and using the going concern basis of accounting unless the directors of the Responsible Entity either intends to liquidate the Funds or to cease operations, or have no realistic alternative but to do so.
Auditor’s responsibilities for the audit of the financial report
Our objectives are to obtain reasonable assurance about whether the financial report as a whole is free from material misstatement, whether due to fraud or error, and to issue an auditor’s report that includes our opinion. Reasonable assurance is a high level of assurance, but is not a guarantee that an audit conducted in accordance with the Australian Auditing Standards will always detect a material misstatement when it exists. Misstatements can arise from fraud or error and are considered material if, individually or in the aggregate, they could reasonably be expected to influence the economic decisions of users taken on the basis of the financial report.
A further description of our responsibilities for the audit of the financial report is located at the Auditing and Assurance Standards Board website at: https://www.auasb.gov.au/admin/file/content102/c3/ar2_2020.pdf. This description forms part of our auditor's report.
PricewaterhouseCoopers
Britt Hawkins Melbourne Partner 9 September 2021

Vanguard Investments Australia Ltd (ABN 72 072 881 086 / AFSL 227263) (“Vanguard”) is the product issuer andResponsible Entity of the interests in the Vanguard Wholesale Funds and Australian ETFs. Interests in the VanguardWholesale Funds are offered through a Product Disclosure Statement (“PDS”) only. Vanguard ETFs will only be issued toAuthorised Participants. That is, persons who have entered into an Authorised Participant Agreement with Vanguard (“EligibleInvestors”). Retail investors can transact in Vanguard ETFs through a stockbroker or financial adviser on the secondarymarket. You can access the relevant PDS at www.vanguard.com.au or by calling 1300 655 102.
Past performance is not an indication of future performance. In preparing this Annual report, individual circumstances, forexample tax implications, have not been taken into account and it may, therefore, not be applicable to an individual’s situation.Before making an investment decision, you should consider your circumstances and whether the information contained in theAnnual report is applicable to your situation. This Annual report was prepared in good faith and we accept no liability for anyerrors or omissions. All marks are the exclusive property of their respective owners.
The funds or securities referred to herein are not sponsored, endorsed, or promoted by MSCI, and MSCI bears no liability withrespect to any such funds or securities. The PDS contains a more detailed description of the limited relationship MSCI haswith Vanguard and any related funds.
London Stock Exchange Group companies include FTSE International Limited (‘FTSE’), Frank Russell Company (‘Russell’),MTS Next Limited (‘MTS’), and FTSE TMX Global Debt Capital Markets Inc. (‘FTSE TMX’). All rights reserved. ‘FTSE®’,‘Russell®’, ‘MTS®’, ‘FTSE TMX®’ and ‘FTSE Russell’ and other service marks and trademarks related to the FTSE or Russellindexes are trademarks of the London Stock Exchange Group companies and are used by FTSE, MTS, FTSE TMX andRussell under licence. All information is provided for information purposes only. No responsibility or liability can be acceptedby the London Stock Exchange Group companies nor its licensors for any errors or for any loss from use of this publication.Neither the London Stock Exchange Group companies nor any of their licensors make any claim, prediction, warranty orrepresentation whatsoever, expressly or impliedly, either as to the results to be obtained from the use of the FTSE Indices orthe fitness or suitability of the Indices for any particular purpose to which they might be put.
The S&P Index is a product of S&P Dow Jones Indices LLC, a division of S&P Global, or its affiliates (“SPDJI”) and ASXOperations Pty Limited and has been licensed for use by Vanguard. Standard & Poor’s® and S&P® are registered trademarksof Standard & Poor’s Financial Services LLC, a division of S&P Global (“S&P”); Dow Jones® is a registered trademark of DowJones Trademark Holdings LLC (“Dow Jones”); and these trademarks have been licensed for use by SPDJI and sublicensedfor certain purposes by Vanguard. ASX is a trademark of the ASX Operations Pty Limited and has been licensed for use bySPDJI and Vanguard. Vanguard Product is not sponsored, endorsed, sold or promoted by SPDJI, Dow Jones, S&P, theirrespective affiliates, or ASX Operations Pty Limited and none of such parties make any representation regarding theadvisability of investing in such product(s) nor do they have any liability for any errors, omissions, or interruptions of the S&PIndex.
©2021 Vanguard Investments Australia Ltd. All rights reserved.
Responsible EntityVanguard Investments Australia LtdABN 72 072 881 086AFSL 227263
Level 13130 Lonsdale StreetMelbourne VIC 3000
Telephone: (03) 8888 3888Facsimile: 1300 765 712
vanguard.com.au

vanguard.com.au1300 655 101
Vanguard Investments Australia Ltd (ABN 72 072 881 086 / AFS Licence 227263) is the product issuer. We have not taken yours or your clients’ circumstances into account when preparing the information so it may not be applicable to the particular situation you are considering. You should consider yours and your clients’ circumstances, and our Product Disclosure Statements (“PDSs”), before making any investment decision or recommendation. You can access our PDSs at vanguard.com.au or by calling 1300 655 205. Past performance is not an indication of future performance. This publication was prepared in good faith and we accept no liability for any errors or omissions. © 2021 Vanguard Investments Australia Ltd. All rights reserved.ARDEQ_092021