effect of elections on stock market returns at the …...effect of elections on stock market returns...
TRANSCRIPT

EFFECT OF ELECTIONS ON STOCK MARKET RETURNS AT THE NAIROBI
SECURITIES EXCHANGE
ROBERT NYAMWEYA MENGE
REG NO: D61/67105/2011
A RESEARCH PROJECT SUBMITTED IN PARTIAL FULFILLMENT FOR
THE AWARD OF DEGREE IN MASTER OF BUSINESS ADMINISTRATION,
UNIVERSITY OF NAIROBI
OCTOBER, 2013

ii
DECLARATION
This research project is my original work and has not been submitted for a degree award
at the University of Nairobi or any other university.
Signature ……………………………………………Date ………………………….
Robert Nyamweya Menge
Reg No: D61/67105/2011
This Research project has been submitted for presentation with my approval as
University Supervisor.
Signed………………………………………….. Date ……………………………………
Mirie Mwangi
Supervisor:

iii
ACKNOWLEDGEMENTS
I wish to thank The Almighty God for giving me a gift of life to write this work. I wish to
express my gratitude to my supervisor Mr. Mirie Mwangi for his professional guidance in
research methodology and motivation that enabled me to compile this project. I also
extend gratitude to my classmates whose presence offered me the psychological
motivation and need to learn.
Finally, I thank my family for supporting me throughout my studies. I can’t express my
gratitude in words for my family, whose unconditional love has been my greatest
strength.

iv
DEDICATION
I dedicate this project to my wife and children and the school of business and
administration at the University of Nairobi for being a strong pillar stone throughout my
MBA course. I have been deeply humbled by the knowledge acquired and support
accorded to me during my studies at the university.

v
ABSTRACT
Country’s politics can exert significant influence on its income distribution and prosperity hence affect the activities in a stock market as voters in democratic states elect parties which best represent their personal beliefs and interests. Election results may affect post-election corporate performance either by influencing a country’s overall economy, like through changes in government spending either through fiscal changes, or company or sector-specific decisions such as changes in the regulatory environment after the new administration has been established. This study sought to examine the effects of the general elections on the stock market return of companies listed in the Nairobi Securities Exchange. The study adopted an event study methodology since the study was concerned with the establishment of the information content of election results announcement on share performance at the NSE. The population of this study was 56 companies listed in the NSE. The study used secondary data to gather information. Data obtained from the NSE covered the period before and after 31st December 2002, 27th December 2007 and 4th March, 2013 elections. The collected secondary data was coded and entered into Statistical Package for Social Sciences (SPSS, Version 20) for analysis. Study findings from the market model indicated that the market return is a good predictor of stock returns. ANOVA results indicated that abnormal returns before elections were significantly higher than abnormal returns after the elections. ANOVA results also indicated that actual stock returns were significantly higher before elections than after election periods. Finally, ANOVA results revealed that the expected returns as well as the market returns were significantly higher before elections than after the elections. It is recommended that investors should factor in elections effect when making investment decisions. Specifically, investors should buy stocks after elections and sell them when their returns are high, that is, before elections. It is recommended that the Government should maintain stability after elections as instability brings about drops in stock returns.

vi
TABLE OF CONTENTS
DECLARATION............................................................................................................... ii
ACKNOWLEDGEMENTS ............................................................................................ iii
DEDICATION.................................................................................................................. iv
ABSTRACT........................................................................................................................v
LIST OF FIGURES ....................................................................................................... viii
LIST OF TABLES ........................................................................................................... ix
LIST OF ABBREVIATIONS ...........................................................................................x
CHAPTER ONE ................................................................................................................1
INTRODUCTION..............................................................................................................1
1.1 Background of the Study ......................................................................................... 1
1.2 Problem Statement ................................................................................................... 7
1.3 Objective .................................................................................................................. 9
1.4 Value of the Study ................................................................................................... 9
CHAPTER TWO .............................................................................................................11
LITERATURE REVIEW ...............................................................................................11
2.1 Introduction............................................................................................................ 11
2.2 Theoretical Framework.......................................................................................... 11
2.3 Event Study Methodology ..................................................................................... 15
2.4 Empirical Review................................................................................................... 16
2.5 Summary of Literature Review.............................................................................. 23
CHAPTER THREE.........................................................................................................25
RESEARCH METHODOLOGY ...................................................................................25

vii
3.1 Introduction............................................................................................................ 25
3.2 Research Design..................................................................................................... 25
3.3 Population and Sample of the Study...................................................................... 26
3.4 Data Collection ...................................................................................................... 26
3.5 Data Analysis ......................................................................................................... 26
CHAPTER FOUR............................................................................................................29
DATA ANALYSIS AND FINDINGS.............................................................................29
4.1 Introduction............................................................................................................ 29
4.2 Annual Trends of Returns...................................................................................... 29
4.3 Regression Analysis.............................................................................................. 32
4.4 Analysis of variance Between Groups and t-test Analysis of Abnormal Returns 34
4.5 Summary of Findings............................................................................................ 36
CHAPTER FIVE .............................................................................................................39
SUMMARY, CONCLUSION AND RECOMMENDATIONS ...................................39
5.1 Introduction............................................................................................................ 39
5.2 Summary................................................................................................................ 39
5.3 Conclusions............................................................................................................ 40
5.4 Recommendation ................................................................................................... 41
5.5 Limitations of the Study......................................................................................... 42
REFERENCES.................................................................................................................44
APPENDICES..................................................................................................................49
Appendix 1: List of Companies ........................................................................................ 49
Appendix II: Data Input .................................................................................................... 53

viii
LIST OF FIGURES
Figure 4.1: Trend Analysis of Abnormal Return .............................................................. 30
Figure 4.2: Trend Analysis in Actual returns.................................................................... 31
Figure 4.3: Trend Analysis in Market Returns ................................................................. 32

ix
LIST OF TABLES
Table 4.1: Fitness of Model .............................................................................................. 33
Table 4.2:Analysis of Variance(ANOVA) ....................................................................... 33
Table 4.3: Linear Regression of Coefficients ................................................................... 34
Table 4.4: Descriptive Statistics for Returns .................................................................... 35
Table 4.5: Analysis of Variance (ANOVA) Between Groups.......................................... 36

x
LIST OF ABBREVIATIONS
AAR -Average Abnormal Return
ANOVA - Analysis of Variance
ATS -Automated Trading System
CAAR -Cumulative Average Abnormal Returns
CBK - Central Bank of Kenya
CPRA - Comparison Period Return Approach
EMH - Efficient Market hypothesis
EVA - Economic value Analysis
IPOs - Initial Public Offerings
MPT - Modern Portfolio Theory
MRT - Mean Reversion Theory
NASI -Nairobi All Share Index
NSE - Nairobi Security Exchange
ROA - Return on Assets
ROE - Return on Equity
RWH - Random Walk Hypothesis
SPSS - Statistical Package for Social Sciences
U.S. - United States

1
CHAPTER ONE
INTRODUCTION
1.1 Background of the Study
Country’s politics can exert significant influence on its income distribution and
prosperity hence affect the activities in a stock market as voters in democratic states elect
parties which best represent their personal beliefs and interests (Alesina & Jeffrey,1987).
According to partisan theory propounded by Hibbs (1977), leftist governments tend to
prioritize the reduction of unemployment, whereas right-wing governments attribute
higher social costs to inflation. Another influential theory presented by Nordhaus (1975)
postulates that, irrespective of their political orientation, incumbents will pursue policies
that maximize their chances of re-election. As a result, they will try to self-servingly
attune the business cycle to the timing of elections. The economy will be stimulated by
unsustainable expansionary policies before the elections, and harsh actions aimed at
curbing the resultant inflation will have to follow at the beginning of the new term of
office. It has to be noted, however, that any policy induced cycles in real activity will be
ephemeral if the economic agents and voters have rational expectations (Rogoff, 1990).
Election results may influence corporate performance by general changes in government
spending and tax changes as some companies or sectors benefit or suffer from sector-
specific governmental decisions (Bloomberg and Hess, 2001). Stock market participants
incorporate expectations about political change into stock prices prior to an election and

2
adjust their opinion according to the actual decision making following the election
(Oehler, Walker and Wendt, 2009). Election results may affect post-election corporate
performance either by influencing a country’s overall economy, like through changes in
government spending either through fiscal changes, or company or sector-specific
decisions such as changes in the regulatory environment after the new administration has
been established (Fiorina, 1991). Prices are the outcomes of volatile human expectations,
shifting the supply and demand lines, and causing prices to oscillate. Fluctuations in
prices are a natural process of changing expectations, thereby leading to cyclical patterns.
There are many kinds of cycles, with the combined effect of driving movements in stock
prices and hence returns on a security exchange (Leblang and Mukherjee, 2005).
Stock markets in the world individually and collectively play a critical role in their
economies as they provide an avenue for raising funds, for trading in securities including
futures, options and other derivatives which provide opportunities for investors to
generate returns (Alesina and Rodrik, 1994). The markets perform a wide range of
economic and political functions while offering trading, investment, speculation,
hedging, and arbitrage opportunities. In addition they serve as a mechanism for price
discovery and information dissemination while providing vehicles for raising finances for
companies. Stock markets are used to implement privatization programs, and they often
play an important role in the development of emerging economies (Lee, 1998). The
performance of a stock market of an economy is of interest to various parties including
investors, capital markets, the stock exchange and government among others.

3
Stock market performance is influenced by a number of factors key among them being
the activities of governments and the general performance of the economy. Other factors
that affect stock markets performance include, availability of other investment assets,
change in composition of investors, and market sentiments among many other factors
(Siegel, 1998).
1.1.1 Elections
Alesina and Rodrik (1994) argue that politics can shape economic outcomes, affect asset
prices, and change financial risk. Political scientists and economists alike are increasingly
interested in the interplay between politics and stock markets (Schneider and Tröger
2006). One reason for this increased attention can be seen in the opportunity to test the
explanatory power of established politico-economic models. If different parties
strategically manipulate the economy to optimally benefit their voter base, their economic
policies should produce distinct reactions by stock markets.
Election periods more often than not, lead to a significant decrease in stock returns of a
firm. This is mainly because investors are afraid of investing at the time when there is a
likelihood of political and economical instability (Black, 1988). Factors related to growth
potential indicate the probability for faster (or slower) than average future growth in
stock earnings and dividends. Based on the assumption that firms that are currently
relatively profitable have greater potential for future growth, we include several measures
of profitability as predictive factors. Differences in the liquidity of stocks is a major
factor in rebalancing their portfolios, traders must buy at asked prices and sell at bid

4
prices. Individual stocks have widely differing degrees of liquidity. To keep the expected
rates of return, net of trading costs, commensurate, stocks must have gross expected
returns that reflect the relative cost of trading (Stoll and Whaley, 1983; Amihud and
Mendelson, 1986).
1.1.2 Market Stock Returns
A stock return is a monetary gain or loss on an investment which is highly sensitive to
both fundamentals and expectations in a market (Lee, 1998). It’s the gain or loss of a
security in a particular period consisting of the income and the capital gains relative on an
investment usually quoted as a percentage (Gartner, 1995). Stock returns are affected by
a number of factors including elections, growth potential, market liquidity, information,
and financial system structure.
The performance of the stock market is influenced by a number of factors the main ones
being the activities of governments’ policies, political process and the general
performance of the economy. Other factors that affect the stock markets performance
include availability of other investments assets, change in composition of investors,
Economic activities and markets sentiments among other factors (Mishkin and White
Eugene, 2002).
1.1.3 Effects of Elections on Market Stock Returns
The performance of the stock market is influenced by a number of factors the main ones
among them being the activities of governments and the general performance of the

5
economy. Several studies have reviewed the relationship at whether security returns are
impacted by politics. Booth and Booth (2003) report that the U.S. stock market tends to
perform better in the second half of the presidential term. They however argued that this
phenomenon could be a reflection of the political business cycle although it could also be
explained behaviorally. This could be attributed to the uncertainty about the election
outcome which has important implications for risk averse investors. The sole event of
elections could have serious implications for the risk level of investment portfolios.
Market-wide fluctuations in response to election shocks will augment the systematic
volatility of all stocks listed on a stock exchange. It is therefore conceivable that
investment prices could increase around the time when voters cast their ballots.
It is well documented that political violence is an impediment to economic activity. Stock
exchanges provide an avenue for raising funds, for trading in securities including futures,
options and other derivatives which provide opportunities for investors to generate
returns. The behavior of stock market around election periods has been investigated for
several decades. It has been found that stock markets generate positive abnormal returns
fifteen-day period before and after the presidential elections, and that the magnitude of
abnormal return is greatest in the presidential elections held in less-free countries when
an incumbent loses. In addition, other financial and political factors have been found to
play an important role in influencing the return pattern around presidential elections
(Foerster, 1997).

6
1.1.4 Nairobi Securities Exchange
The Nairobi Securities Exchange was constituted as a voluntary association of stock
brokers registered under the societies Act in 1954 and in 1991 the Nairobi Security
Exchange was incorporated under the companies Act of Kenya as a company limited
by guarantee and without a share capital (Kibuthu, 2005). Subsequent development of
the market has seen an increase in the number of stockbrokers, introduction of investment
banks, establishment of custodial institutions and credit rating agencies and the number
of listed companies have increased over time. Securities traded include, equities, bonds
and preference shares (NSE, 2013).
In 1996, the largest share issue in the history of NSE, the privatization of Kenya Airways,
came to the market. In May 2006, NSE formed a demutualization committee to spearhead
the process of demutualization. In September 2006 live trading on the automated trading
systems of the Nairobi Securities Exchange was implemented. In July 2007 NSE
reviewed the Index and announced the companies that would constitute the NSE Share
Index. The review of the NSE 20‐share index was aimed at ensuring it is a true
barometer of the market. In 2008, the NSE All Share Index (NASI) was introduced as an
alternative index (NSE, 2012). Its measure is an overall indicator of market performance.
The Index incorporates all the traded shares of the day. Its attention is therefore on the
overall market capitalization rather than the price movements of select counters.

7
The Nairobi Securities Exchange marked the first day of automated trading in
government bonds through the Automated Trading System (ATS) in November 2009.
The automated trading in government bonds marked a significant step in the efforts by
the NSE and CBK towards creating depth in the capital markets by providing the
necessary liquidity (NSE, 2013).
In July 2011, the Nairobi Security Exchange Limited changed its name to the Nairobi
Securities Exchange Limited. The change of name reflected the strategic plan of the
Nairobi Securities Exchange to evolve into a full service securities exchange which
supports trading, clearing and settlement of equities, debt, derivatives and other
associated instruments. In September 2011 the Nairobi Securities Exchange converted
from a company limited by guarantee to a company limited by shares and adopted a new
Memorandum and Articles of Association reflecting the change. In October 2011, the
Broker Back Office commenced operations. The system has the capability to facilitate
internet trading which improved the integrity of the Exchange trading systems and
facilitates greater access to our securities market (NSE, 2013).
1.2 Problem Statement
Elections do matter for the markets because politics can shape economic outcomes, affect
asset prices, and change financial risk. Activities of governments continue to affect the
performance of the stock market and the general performance of the economy. Election
results may influence corporate performance by general changes in government spending
and tax changes as some companies or sectors benefit or suffer from sector-specific

8
governmental decisions (Bloomberg and Hess, 2001). The economy is still a major factor
in determining financial security or whether investments rise or fall in value at the stock
exchange but the outcome of key elections are likely to have a bigger impact on money-
related issues for the rest of the year and beyond on a stock exchange.
The 2002 general election in Kenya was a transitional one after the term of service of
President Moi came to an end after he had served two terms after 1992 and 1997 election
and was constitutionally barred from any further term in office (Kibuthu, 2005). In 2008,
the presidential election resulted in protests that rapidly descended into a spate of ethnic
violence Irungu (2012). The Nairobi Security Exchange indicated a loss of USD 591
million on 2008′s first day of trading. During the elections held on March 4th 2013,
Kenyan stocks defied election jitters and gave the highest return globally in the first
quarter of this year, making the Nairobi Securities Exchange the best performing in the
world (Irungu, 2012).
A number of studies have been undertaken establishing the relationship between the
performance of stock exchanges and political activities in various countries. For example,
a study conducted by James (2006) focused on the effect of partisanship, policy risk, and
electoral processes on the performance of stock markets. The study found that
partisanship and electoral processes had an effect on the overall performance of stock
markets. Allvine and O'Neill (1980) also conducted a study on stock market returns and
the presidential election cycle.

9
A previous study conducted in Kenya, by Gitobu (2000), focused on the influence of
macro-economic indicators on stock market returns. Irungu (2012) did a study on the
informational content of general election results announcement at the Nairobi Securities
Exchange and established that general election results carried a lot of information which
affected the performance of shares trading at the NSE. Lusinde (2012) reviewed volatility
in stock returns of NSE listed companies around general elections in Kenya. The findings
revealed that volatility in stock returns of Kenyan listed companies’ increases around
general elections within which period investors are sensitive to the developing political
landscape which then influences their decisions on whether to invest at the NSE or not.
The study was in agreement with some local studies that portray general elections as
having an impact on the stock returns of companies listed at the NSE.
From the above discussion, it can be seen that limited studies if any have been conducted
on the effect of elections on stock returns. This study therefore sought to fill this research
gap by answering one research question: How do elections affect stock returns at NSE?
1.3 Objective
The objective of the study was to establish the effect of elections on stock returns at
Nairobi Securities Exchange.
1.4 Value of the Study
The study contributed to the existing literature in the area of general elections and the
performance of Nairobi Securities Exchange. The findings of the study will be important

10
to future scholars and academicians because it will serve as a source of reference on the
subject besides providing suggestions on areas requiring future study in as far as the
performance of stocks at the NSE is concerned.
The findings of this study will also be important to investors investing at the Nairobi
Securities Exchange because it will provide vital information for consideration during
election periods. It will provide vital information to investors which they can use to judge
whether to buy or sell their shares at the NSE during election period. The findings of this
study will also be important to managers at the Nairobi Securities Exchange in
understanding the effects of General election on the stock returns for the listed shares.
This will help them institute measures required to stabilize the market and avoid
abnormal performances at the market during such periods.
The findings of this study will also be important to government policy makers because it
will inform their policy formulation and implementation regarding the management of
the security exchange market during elections to ensure capital market stability and
reduce capital flights which may lead to huge losses to investors.

11
CHAPTER TWO
LITERATURE REVIEW
2.1 Introduction
This chapter reviewed existing literature in the area of study. It looked at the work by
other scholars on the subjects of stock market performance during elections. In particular,
the chapter covered, review of theories, review of empirical studies and chapter
summary.
2.2 Theoretical Framework
This section reviewed the theories that guided this study. Specifically, it reviewed
theories explaining stock market performance and how it can vary. The section
specifically reviewed four theories including efficient market hypothesis, the random
walk hypothesis, prospect theory and the political policy theory. These theories were
deemed relevant because of their explanations concerning the two variables in this study.
2.2.1 Efficient Market Hypothesis
Fama (1965) was the first scholar to use the term “efficient market”. An efficient market
is defined as a market in which securities’ prices fully reflect all available information.
This implies that when news about the value of a security hits the market, its price should
react and incorporate this news quickly and correctly, and the price should neither
underreact nor overreact to particular news announcements.

12
In addition Fama (1970) categorized market efficiency into three classifications based on
the information set to which each of them responds. The three forms of efficiency are:
The weak form efficiency, semi-strong form and strong form market. According to
Fama’s study, in a weak-form market stock prices reflect all past information. This
implies that prices have no memory and successive price differences are independent.
Therefore, if a market is weakly efficient it is impossible for a trader to make abnormal
returns using the history of share prices. That is to say, technical analysis cannot be used
to beat the market.
The theory of semi-strong form efficiency asserts that all publicly available information
is fully reflected in security prices. It is impossible for technical or fundamental analysts
to beat the market by exploiting public information. This theory also provides the basic
theoretical background in this study. The main purpose of this study is to examine how
the markets react to presidential elections (Fama, 1970). The elections are unique events
in that the date of an election is known for certain in advance and only the outcome is
uncertain. The outcomes that are anticipated from the market often cause prices to move
to the implied direction before the date of elections. If the market is semi-strong efficient,
the adjustment of prices to the outcome of elections should occur in a very short period of
time and there are no trading strategies adopted to earn abnormal returns. On the other
hand, if any systematically abnormal returns can be found around elections and used to
beat the market, then this phenomenon of election patterns can be viewed as challenging
market efficiency. A market where prices reflect all past, public and private information

13
is defined as strong form efficiency. In this market even if certain investors have
monopolistic access to inside information, they cannot make superior returns.
2.2.2 The Random Walk Hypothesis
The importance of the EMH stems primarily from its sharp empirical implications many
of which have been tested over the years. Much of the EMH literature before Lerol
(1973) and Lucas (1978) revolved around the random walk hypothesis (RWH) and the
martingale model, two statistical descriptions of unforecastable price changes that were
initially taken to be implications of the EMH (Fama and Blume, 1966). One of the first
tests of the RWH was developed by Cowles and Jones (1937), who compared the
frequency of sequences and reversals in historical stock returns, where the former are
pairs of consecutive returns with the same sign, and the latter are pairs of consecutive
returns with opposite signs.
French and Roll (1986) document a related phenomenon: stock return variances over
weekends and exchange holidays are considerably lower than return variances over the
same number of days when markets are open. This difference suggests that the very act of
trading creates volatility, which may well be a symptom of Black’s (1988) noise traders.
2.2.3 Prospect Theory
Tversky and Kanheman (1979) showed how people manage risk and uncertainty by way
of developing the Prospect Theory. The theory explains the apparent regularity in human
behaviours when assessing risk under uncertainty and assumes that human beings are not

14
consistently risk-averse; rather they are risk-averse in gains but risk-takers in losses.
According to Tversky and Kanheman (1974), people place much more weight on the
outcomes that are perceived more certain than that are considered more probable, a
feature known as the “certainty effect”.
People’s choices are also affected by ‘framing effect’ which refers to the way a problem
is posed to the decision maker and their ‘mental accounting’ of that problem. The value
maximization function of the Prospect Theory is different from that of the value
maximization function of MPT. Wealth maximization is between gains and losses, rather
than over the final wealth position as in MPT (Markowitz, 1952). As such, people may
make different choices in situations with identical final wealth levels. Critical to the value
maximization is the reference point from which gains and losses are measured. Usually,
the status quo is taken as the reference point and changes are measured against it in
relative terms, rather than in absolute terms.
2.2.4 The Political Policy Theory
The so-called partisan view of macroeconomics, as described by Alesina (1987),
acknowledges that different political parties may have different preferences concerning
their economic policy which may be explained by the fact that different parties aim to
represent a different part of the elective, and therefore may have different objectives to be
reached with their economic policy.

15
As Nofsinger (2007) points out, the political policy theory implies that if one party has
superior economic policies over the other, then a governmental period of this party
should lead to a better performance of the economy. This better performance should not
only be noticeable through the more conventional economic indicators as inflation and
unemployment, but also on the stock market, which then as an indicator of the economy
should show higher returns.
2.3 Event Study Methodology
An event study is concerned with the impact of an event on corporations. An event study
measures the impact of an event study measures the impact of a specific event on the
value of the firm relying on market efficiency (Konchitchki and O'Leary, 2011).
Information about corporate events is key to investor performance and investor
performance signals information about corporate events.
A number of studies have suggested that there exists a high level of efficiency in capital
markets. However, security prices do not always continuously reflect almost all available
information in the market because of information asymmetry (Roztochi and Weistroffer,
2009). If security prices are a function of all available information, and new information
occurs randomly, then one would expect that security prices would fluctuate randomly as
randomly generated news is impounded in security prices. Thus, the “purchase or sale of
any security at the prevailing market price represents a zero net present value transaction.
In a perfectly efficient market, any piece of new relevant information would be
immediately reflected in security prices.

16
One should be able to determine the relevance of a given type of information by
examining the effect of its occurrence on security prices (Pettengill and Clark, 2001).
The impact of any event on security prices is measured as a function of the amount of
time that elapses between event occurrence and stock price change. In a relatively
efficient market, one might expect that the effect of the event on security prices will
occur very quickly after the first investors learn of the event. Event studies are usually
based on daily, hourly or even trade to trade stock price fluctuations. However, many
studies frequently are forced to study only daily security price reactions since more
frequent data is not readily available (Roztochi and Weistroffer, 2009).
2.4 Empirical Review
Several scholars and researchers have reviewed the concept of elections and stock market
returns. Mbugua (2003) evaluated the information content of stock dividend
announcements using the case of companies quoted at the Nairobi Security Exchange.
Mbugua (2003) findings imply that the market, in the aggregate uses the stock dividend
information in setting the equilibrium security prices that much of the NSE’s market
reactions to such information occurs no later than the declaration date, and that such
information tends to produce positive unexpected returns. Kiptoo (2006) studied
information content on dividend announcements by companies quoted in NSE. Kiptoo
established that following dividends announcements, the investors interpreted
information of dividend declaration in different ways depending on their investment
objectives.

17
For long term investors, they regarded dividends as an erosion of their value in the
company. These individuals reacted by taking advantage of the risen prices to sell their
shares and purchase undervalued shares.
Bachtel and Fuss (2006) studied partisan politics and stock market performance where
they looked at the effect of expected government partisanship on stock returns in the
2002 German federal election. From this study, partisan theory and extant evidence from
parties’ ideal policies suggest that firms should perform better under right- than under
left-leaning governments. If investors anticipate these effects of different parties holding
office, changes in expected government partisanship should produce distinct patterns of
stock market performance, with prices reflecting the electoral prospects of the competing
parties in the pre-election time.
Wong and McAleer (2007) did a study on mapping the presidential election cycle in
United States stock markets. Their study shows that in the almost four decades from
January 1965 through to December 2003, US stock prices closely followed the four-year
Presidential Election Cycle where in general, stock prices fell during the first half of a
Presidency, reached a trough in the second year, rose during the second half of a
Presidency, and reached a peak in the third or fourth year. This cyclical trend was found
to hold for the greater part of the last ten administrations, starting from President Lyndon
Johnson to the present administration under President George W. Bush, particularly when
the incumbent was a Republican.

18
Kariuki (2007) did an analysis of the information content of economic value added as a
performance measure of banks in Kenya. The aim of this study was to investigate the
relationship between Economic Value Added, traditional performance measures (ROA
and ROE) and ability of creation of shareholder wealth for banks in Kenya. The results of
regression analysis indicate in all cases a positive correspondence between EVA and
financial performance metrics with very low dependency of EVA on the financial metrics
and show higher quality information content of EVA indicator in the relationship to the
ability of shareholder wealth creation than traditional performance measures.
The data findings analyzed also showed that taking all other independent variables at
zero, a unit increase in liquidity will lead to a 0.423 increase in company performance; a
unit increase in leverage will lead to a 0.215 increase in company performance; a unit
increase in earnings per share will lead to a 0.305 increase in company performance. This
infers that liquidity contribute more to company performance followed by earnings per
share. At 5% level of significance and 95% level of confidence, liquidity had a 0.001
level of significance; leverage showed a 0.003 level of significant, earnings per share
showed a 0.002 level of significant hence the most significant factor is liquidity.
Kairu (2007) studied the effects of secondary equity offering on stock returns of firms
quoted on the Nairobi Security Exchange. The objectives of the study were to determine
the effect of announcement of secondary equity offerings on stock prices of firms listed
on the NSE as well as to investigate the impact of the announcement on trading volume
before and after the secondary issue. The study adopted an event study methodology as

19
its research design. This design was used to identify companies that had issued secondary
shares to the market. This led to the involvement of ten companies that had been listed in
the NSE and had issued secondary shares. Secondary data was used for this study and it
was collected from the Nairobi Security Exchange in Nairobi. The result of the study
showed that the direction of share price and abnormal returns after the announcement was
inclusive. The market reacted differently for different types of stocks. The abnormal
returns were however so small and this meant that the details of a secondary issue or
rights issue do not shock the market in a significant way. However the amount of shares
traded was more at the post announcement period than in the pre announcement period
for most companies involved in the study. This provided an explanation that the
announcement had an effect in increasing the volume of trade.
Gichema (2007) studied the effect of bonus share issues on stock prices of companies
quoted at the Nairobi Security Exchange. The study focused on the effect of bonus share
issues on stock prices of companies quoted at the Nairobi Security Exchange. The
objectives of this study were to determine whether there were abnormal returns
surrounding the bonus issues announcement and to establish the direction and magnitude
of the stock price adjustment on announcement of bonus issue. The sample consisted of
all the companies quoted at NSE which declared bonus issues between the periods of
interest, I January 2004 to 31 July 2007, and were drawn from all the segments of the
Nairobi Security Exchange. In order to achieve this objectives secondary data obtained
from the NSE Secretariat informational database and the companies’ financial statements
were used. Further, this study entailed the determination of the precise day of the bonus

20
share issue announcement and this day was made to be day zero; definition of the period
to be studied; in this study the study period was 101 days surrounding the announcement
date. The magnitude of bonus issue announcement was expected to vary across the firms
because the announcements were made by companies in different industries and at
different times. It was hence useful to examine the behavior of each company
independently. Data was presented using tables and graphs. Descriptive statistics i.e.
mean and standard deviation and t-tests were used to analyze data. The findings of this
study were such that bonus issues typically generate positive stock prices reactions in the
short run but produce no lasting gains in the market price for widely held stocks in the
Nairobi Security Exchange.
Oehler, Walker and Wandt (2009) studied effects of election results on stock price
performance using evidence from 1976 to 2008 in the United States. They established
that election results may influence corporate performance by general changes in
government spending and tax changes. In addition, specific companies or sectors might
benefit or suffer from sector-specific governmental decisions. Stock market participants
will incorporate expectations about political change into stock prices prior to an election
and adjust their opinion according to the actual decision making following the election.
They analyzed abnormal stock price returns around the United States presidential
elections from 1976 to 2008 with focus on party-specific favoritism.

21
The results demonstrated statistically significant positive or negative cumulative
abnormal price returns for most industries. Most effects appeared to be related to the
individual presidents and changes in political decision making irrespective of the
underlying political ideology.
Muikiria (2010) looked at the reaction of share prices to issue of IPOs from the NSE: the
study sought to establish if there exists a relationship between stock prices as may be
influenced by the news of initial public offerings in the Nairobi Security Exchange. The
event defined for these studies are issues of IPO's. The population of this study composed
of all companies listed in the Nairobi Security Exchange (NSE). A portfolio of all the
companies in the stock market was taken and an equal weighting assumed in the
calculation of the mean portfolio daily return within the window period. The study time
period was between 2004-2009.The secondary data was being obtained from the NSE
informational database for the period 2004-2009.
Data analysis was carried out using the comparison period return approach (CPRA) by
Wooldridge (1983). The mean portfolio daily return was calculated for the IPO and
comparison periods. For each day, t-statistics and test of significance was done using
SPSS statistics analysis. The study found that issuing of IPO's at NSE has both positive
and negative effects on daily mean returns, negative effects are on the days nearing the
IPO's event days which are as result of buyer and seller expectation in the market, while
positive effects are in the days far from the IPO's event day which are result of buyer
seller initiated trading.

22
Durnev (2011) studied the real effects of political uncertainty specifically looking at
elections and investment sensitivity to stock prices. This study showed that political
uncertainty surrounding elections can affect how corporate investment responds to stock
prices. Durnev (2011) argues that during periods of increased political uncertainty, stock
prices play a limited role in guiding corporate investment decisions. Using national
elections as a sample of politically uncertain events, Durnev found that during election
years; investment is less sensitive to stock prices, the drop in investment-to-price
sensitivity is larger when election outcomes are less certain, and the drop in investment-
to- price sensitivity is associated with lower post-election company performance. Durnev
(2011) therefore concluded that politics has a real impact on corporate performance by
altering how managers respond to stock prices when making investment decisions.
Lusinde (2012) examined volatility in stock returns of listed companies around general
elections in Kenya. The study considered twenty companies out of the forty seven quoted
firms at the NSE between1997 to 2007. Secondary data was collected from NSE database
and analyzed using the GARCH model. The findings revealed that volatility in stock
returns of Kenyan listed companies’ increases around general elections. Within this
period investors are sensitive to the developing political landscape which then influences
their decisions on whether to invest at the NSE or not. The study is in agreement with
some local studies that portray general elections as having an impact on the stock returns
of companies listed at the NSE.
23
Kinyua, Nyanumba, Gathaiya and Kithitu (2013) reviewed the effects of Initial Public
Offer (IPO) on performance of companies Quoted at the Nairobi Security Exchange. The
study focused on the effects of initial public offer on performance of companies quoted at
the Nairobi Security Exchange, by studying three variables i.e. liquidity, leverage and
Profitability (earnings per share). The literature reviews the effects of initial public offer
on performance of companies quoted at the Nairobi Security Exchange between 2006 and
2011. The study adopted a descriptive research design. The target population was
employees of the 56 listed companies at the NSE. Primary data was gathered using semi
structured questionnaires. Secondary data was gathered from past published scholarly
articles explaining theoretical and empirical information on employee issues. Descriptive
analysis was be used including the use of weighted means, standard deviation, relative
frequencies and percentages. According to the regression equation established, taking all
factors into account (liquidity, leverage and earnings per share) constant at zero, company
performance will be 0.423.
2.5 Summary of Literature Review
From the above literature, it was evident that elections have significant effect on stock
market returns. Oehler, Walker and Wandt (2009) studied effects of election results on
stock price performance using evidence from 1976 to 2008 in the United States. Durnev
(2011) studied the real effects of political uncertainty specifically looking at elections and
investment sensitivity to stock prices. Durnev (2011) argues that during periods of
increased political uncertainty, stock prices play a limited role in guiding corporate
investment decisions. Wong and McAleer (2007) did a study on mapping the presidential

24
election cycle in United States stock markets. Bachtel and Fuss (2006) studied partisan
politics and stock market performance where they looked at the effect of expected
government partisanship on stock returns in the 2002 German federal election. From the
literature reviewed above, it was evident that limited research has been done on the effect
of elections on stock returns at Nairobi Securities Exchange. This study therefore sought
to fill this research gap.
25
CHAPTER THREE
RESEARCH METHODOLOGY
3.1 Introduction
This chapter presented various stages and phases that were followed in completing the
study. The following subsections were included; research design, target population, data
collection and data analysis.
3.2 Research Design
The study adopted an event study methodology. An event study is an analysis of whether
there is a statistically significant reaction in financial markets to past occurrences of a
given type of event that is hypothesized to affect public firms' market values (Armitage,
1995). The event study design was chosen because the study was concerned with the
establishment of the information content of election results announcement on share
performance at the NSE.
The event that affects a firm's market value which in turn affects the returns on a security
may be within the firm's control, such as the event of the announcement of a stock split.
Or the event may be outside the firm's control, such as the event of a legislative act being
passed, or a regulatory ruling being announced, that will affect the firm's future
operations in some way (Armitage, 1995).

26
3.3 Population and Sample of the Study
Population in statistics is the specific population about which information is desired.
According to Ngechu (2004), a population is a well defined or set of people, services,
elements, events, group of things or households that are being investigated. The target
population for this study included: companies trading at the Nairobi Security Exchange as
at December 31st, 1997, 2002, 2007 and March 4th 2013. As per the records at the Nairobi
Securities Exchange there were 56 companies listed at the NSE by March 2013.
Therefore the population of this study was 56 Companies. Since consolidated data on the
variables of the study was available at the NSE, this study sampled the NSE twenty share
index which is representative of the securities exchange performance.
3.4 Data Collection
The study used secondary data from the Nairobi Securities Exchange and the financial
statements of the concerned companies. Data obtained from the NSE covered the period
between 29th December 2002 and 4th March, 2013.
3.5 Data Analysis
The collected secondary data was coded and entered into Statistical Package for Social
Sciences (SPSS, Version 21.0) for analysis. The study collected data on NSE 20 share
index for the identified general election dates. These dates included 29th December, 2002,
30th December 2007 and 4th March 2013.

27
MacKinlay (1997)outlined an event study methodology involving the following steps: (i)
identification of the event of interest; (ii) definition of the event window; (iii) selection of
the sample set of firms to be included in the analysis; (iv) prediction of a “normal” return
during the event window in the absence of the event; (v) estimation of the “abnormal”
return within the event window, where the abnormal return is defined as the difference
between the actual and predicted returns, without the event occurring; and (vi) testing
whether the abnormal return is statistically different from zero. The study computed the
changes recorded in share prices as measured by the NSE 20 Share index. To arrive at
conclusive results, the study compared the performance of the NSE 20 share index
before, during and after general elections for the four general elections 2002-2013.
The market model that was applied was;
Y=a+b1x1+error term
Where
Y= actual returns
X1=market return
B1=market risk
The research applied a mean adjusted return model below to measure abnormal returns
on securities in the investigation period.
ARit=Rit-(αi+βRmt)
Estimation
Window
30 days
Event Window
10 days 10 days
Post Event Window
30 Days

28
Where ARit= abnormal return of stock i at date t
Rit= actual return of stock i at time t
Rmt= market return
α and β=firm specific constants or parameters
From the estimation period.
In event studies abnormal returns were aggregated over both observation of events and
investigation windows. Individual securities’ abnormal returns were aggregated ARit for
each period for any given number of N events. Accordingly average abnormal returns
(AARs) and the cumulative abnormal returns (CAARs) for the stocks were calculated by:
it
n
II AR
NAAR ∑
−
=1
1
Cumulative average abnormal returns
( ) IT
n
T
t
ttT AR
NCAAR ∑∑
−
=1
2
12,1
1
Test statistics were used to measure the statistical significance of the AARs and the
CAARS reported on the event day and the interval around the event date of a significant
level of 95%. To test for the strength of the model, an Analysis of Variance (ANOVA)
was conducted. On extracting the ANOVA table, the researcher looked at the significance
value. The study tested at 95% confidence level and 5% significant levels. If the
significance number found is less than the critical value ( ) set 0.05, then the conclusion
would be that the model is significant in explaining the relationship. Else the model
would be regarded as non significant.

29
CHAPTER FOUR
DATA ANALYSIS AND FINDINGS
4.1 Introduction
This chapter consists of data analysis, findings and interpretation on the data gathered to
address the objective of the study. Descriptive statistics and model results were also
presented in the chapter.
4.2 Annual Trends of Returns
This section presents the trend analysis of the dependent and independent variables of the
study. Abnormal returns present the difference between the actual returns and the
expected returns over a certain period of time. The formula for calculating abnormal
returns was arrived at by using the alpha and the beta in the formula below;
Rstock= αi +βRmt
Expected Return= αi+βRstock
Abnormal Return= Actual Return – Expected Return
where;
Rmt= market return
Rstock =Actual Returns
α and β=firm specific constants or parameters
Substraction of the actual returns from the expected returns gave rise to the abnormal
stock returns.
30
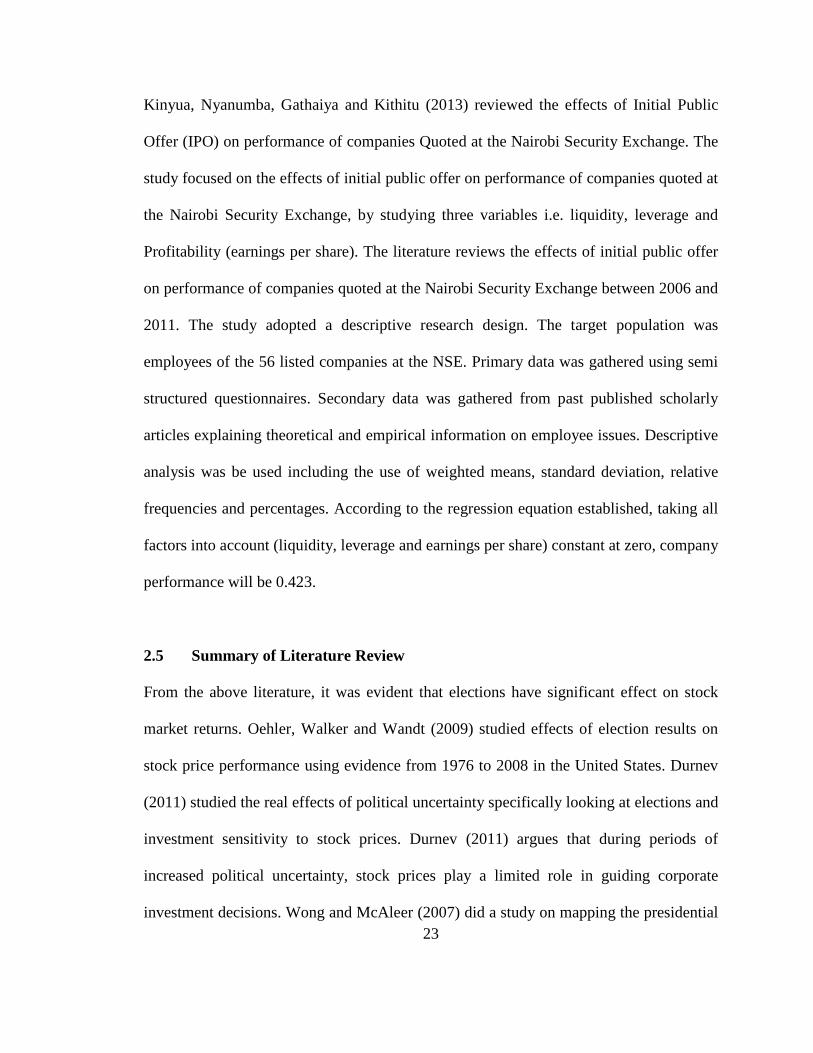
The trend analysis of the abnormal return represented in figure 4.1 shows that there was a
drastic decline from year 2002 to year 2007 followed by an increase in abnormal returns
in year 2013. This changes that caused the drift in abnormal returns as represented by the
graph can be explained by the election period. In 2007 the post election violence caused
the drop in abnormal returns compared to the other election years. This further is because
abnormal returns are sometimes triggered by events. In finance events can typically be
classified as occurrences or information that has not already been priced by the market.
The decline in 2007 may be as a result of a decline in the firms’ market value which
exceeded the expected amount, this therefore is a loss.
Figure 4.1: Trend Analysis of Abnormal Return
Figure 4.2 presents the trend analysis of actual returns between years 2002, 2007 and
2013 which were the election years for Kenya. The graph shows a decrease in actual or
real returns of stock in year 2007 and an increase in election year 2013. The decrease in

31
year 2007 was affected by the then elections which brought about instability in the
country affecting the social and economic pattern of the economy.
Figure 4.2: Trend Analysis in Actual returns
Trend analysis in market return presented in figure 4.3 indicates a decrease in market
return in year 2007 and an increase in 2013. The mean market return of year 2007 is less
than that of the performance of market of the preceding year 2006. This indicates that the
market was more volatile in the election year 2007 compared to the previous years.

32
Figure 4.3: Trend Analysis in Market Returns
4.3 Regression Analysis
This section illustrates the fitness of the model used in the study as well as the calculation
that derived the alpha and beta coefficients for generation of the abnormal returns. The
regression model (market model) used was as follows; Rit= αi+βRmt . Where;
Rit= actual return of stock i at time t
Rmt= market return
α and β=firm specific constants or parameters
Table 4.1 shows fitness of the regression model in determining the abnormal returns. The
variables that were used to determine abnormal returns were actual returns and market
returns. From the results presented below, an R square of 0.04 represents that the
independent variables; actual and market return derived 4% of the abnormal return which
is not satisfactory.

33
Table 4.1: Fitness of Model
Indicator Coefficient
R 0.2
R Square 0.04
Std. Error of the Estimate 0.15697
ANOVA statistics presented on Table 4.2 indicate that the overall model was statistically
significant. This was supported by an F statistic of 4.905 and probability (p) value of
0.029. Probability value (p) is usually given the value of 0.05, therefore any value below
the same is statistically significant while any value above 0.05 is not significant.
Therefore from the results the reported p value 0.029 was less than the conventional
probability of 0.05 significance level thus its significance. The ANOVA results imply
that the independent variable was a good predictor of return and alpha and beta
coefficients.
Table 4.2:Analysis of Variance(ANOVA)
Indicator Sum of Squares Df Mean Square F Sig.
Regression 0.121 1 0.121 4.905 0.029
Residual 2.907 118 0.025
Total 3.028 119
Table 4.3 presents results of the alpha and beta constants that were used to derive the
abnormal return. The model presented below shows how the abnormal return was
calculated. The regression of coefficients results further indicate that the variable market

34
return had a positive and significant relationship with the actual return, which is evident
from the value 0.029. The conventional value of 0.05 is the scale that determines the
significance of an independent variable, thus any value below 0.05 is significant and a
value above the same is not significant. Therefore in the results, 0.029 is lower than the
conventional value 0.05 thus making the market return variable significant in explaining
actual return and determining the beta and alpha coefficients.
Table 4.3: Linear Regression of Coefficients
Indicator B Std. Error Beta T Sig
Constant 0.032 0.016 2.035 0.044
Market Return 0.752 0.34 0.2 2.215 0.029
Y=0.03+0.75X
Y =expected return
X= actual returns
4.4 Analysis of variance Between Groups and t-test Analysis of Abnormal
Returns
The table below provides descriptive statistics for the returns, actual, market, expected
and abnormal returns before and after election period. The results indicate a high score
in the mean of actual return before elections than after the election period. This is
presented by a mean of 0.04 before election and a negative mean of 0.01 after election.
The market return had a mean of 0.01 before election and a mean of -0.05 after the
election. The same case is also presented in the expected returns mean where the returns
before election are higher than after the election period, with means of 0.03 and -0.00

35
respectively. The mean of the abnormal return before election is 0.01 a value higher than
the mean after the election period which is -0.01. These results show that abnormal
returns are higher before elections than after elections.
Table 4.4: Descriptive Statistics for Returns
Variable Period Mean Std.
Deviation
Std. Error
95% Confide
nce Interval
for Mean lower bound
95% Confide
nce Interval
for Mean upper bound
Minimum
Maximum
Returns Before
Election 0.04 0.13 0.02 0.01 0.08 (0.28) 0.59
After
Election (0.01) 0.18 0.02 (0.05) 0.04 (0.90) 0.61
Market Return
Before Election
0.01 0.03 0.00 (0.00) 0.01 (0.03) 0.03
After
Election (0.05) 0.04 0.01 (0.06) (0.03) (0.10) (0.01)
Expected Before
Election 0.03 0.02 0.00 0.03 0.04 0.01 0.05
After
Election (0.00) 0.03 0.00 (0.01) 0.00 (0.05) 0.02
Abnormal Before
Election 0.01 0.13 0.02 (0.03) 0.04 (0.28) 0.58
After
Election (0.00) 0.18 0.02 (0.05) 0.04 (0.92) 0.59
Statistics in table 4.5 indicate that all the returns were statistically significant before and
after the elections. This is represented p values of 0.008 for actual returns, 0.000 for
market return, 0.006 abnormal returns and 0.000 for expected return which were all
statistically significant in relationship between the stocks and election period.

36
Table 4.5: Analysis of Variance (ANOVA) Between Groups
Variable Sum of
Squares df
Mean
Square F Sig.
Returns Between Groups 0.076 1 0.076 30.51 0.008
Within Groups 2.956 118 0.0025
Market Return Between Groups 0.079 1 0.079 68.506 0.000
Within Groups 0.137 118 0.001
Expected Between Groups 0.045 1 0.045 68.506 0.000
Within Groups 0.077 118 0.001
Abnormal Between Groups 0.004 1 0.004 16.0 0.006
Within Groups 2.905 118 0.0025
4.5 Summary of Findings
The results indicate a high score in the mean of actual return before elections than after
the election period. This is presented by a mean of 0.04 before election and a negative
mean of 0.01 after election. The market return had a mean of 0.01 before election and a
mean of -0.05 after the election. The same case is also presented in the expected returns
mean where the returns before election are higher than after the election period, with
means of 0.03 and -0.00 respectively. The mean of the abnormal return before election is
0.01 a value higher than the mean after the election period which is -0.01. These results
show that abnormal returns are higher before elections than after elections.

37
Results further indicate that all the returns were statistically significant before and after
the elections. This is represented p values of 0.008 for actual returns, 0.000 for market
return, 0.006 abnormal returns and 0.000 for expected return which were all statistically
significant in relationship between the stocks and election period.
The results in the findings agree with those of Wong and McAleer (2007) who did a
study on mapping the presidential election cycle in United States stock markets. Their
study shows that in the almost four decades from January 1965 through to December
2003, US stock prices closely followed the four-year Presidential Election Cycle where in
general, stock prices fell during the first half of a Presidency. These findings agree with
those of the study that stock prices tend to decrease in the period after election which
causes a decrease in the stock return compared to periods before election.
Further, these findings did not agree with those of Kairu (2007) who studied the effects of
announcement of secondary equity offerings on stock prices of firms listed on the NSE as
well as to investigate the impact of the announcement on trading volume before and after
the secondary issue the study showed that the amount of abnormal shares traded was
more at the post announcement period than in the pre announcement period for most
companies involved in the study. Kairu’s study provided that the announcement had an
effect in increasing the volume of trade, which is contrary to the findings in this study,
where returns perform better before announcement of election results.

38
Muikiria (2010) looked at the reaction of share prices to issue of IPOs from the NSE: the
study sought to establish if there exists a relationship between stock prices as may be
influenced by the news of initial public offerings in the Nairobi Security Exchange. He
found that issuing of IPO's at NSE has negative effects on the days nearing the IPO's
event days which are as result of buyer and seller expectation in the market, while
positive effects are in the days far from the IPO's event day which are result of buyer
seller initiated trading. The days far from the IPO’s issue event may represent the period
prior election in the current study. These findings can be compared with those of this
study that returns perform well in periods before the election than during and after the
election period.
Durnev (2011) studied the real effects of political uncertainty specifically looking at
elections and investment sensitivity to stock prices. This study found that that politics has
a real impact on corporate performance by altering how managers respond to stock prices
when making investment decisions which agree to the findings of this study. The finding
in the study that stock returns increases in the period before and around election support
those of Lusinde (2012) who examined volatility in stock returns of listed companies
around general elections in Kenya between1997 to 2007. The findings revealed that
volatility in stock returns of Kenyan listed companies’ increase around general elections.
Within this period investors are sensitive to the developing political landscape which then
influences their decisions on whether to invest at the NSE or not. The study is in
agreement with some local studies that portray general elections as having an impact on
the stock returns of companies listed at the NSE.
39
CHAPTER FIVE
SUMMARY, CONCLUSION AND RECOMMENDATIONS
5.1 Introduction
This chapter presents the summary of key data findings, conclusions drawn from the
findings highlighted and recommendations thereof. The conclusions and
recommendations drawn were in quest of addressing research objectives of establishing
the effect of elections on stock returns at Nairobi Securities Exchange.
5.2 Summary
The objective of the study was to establish the effect of elections on stock returns at
Nairobi Securities Exchange. The means performance of the market, actual return and
abnormal return are low after election and indicate good performance before election
period. The increase in market return in year 2013 as indicated in the trend analysis can
also be explained by the increase in stock prices. Increase in market rates of stocks leads
to an increase in prices. The increase and decrease in stock prices can be termed as
volatility. When volatility increases, risk increases and returns decrease. Risk is
represented by the dispersion of returns around the mean. The greater the dispersion of
returns around the mean, the larger the drop in the compound return.
The mean performance of abnormal returns was higher in years 2002 and 2013 while low
performance was recorded in year 2007. Abnormal returns present the difference between

40
the actual returns and the expected returns over a certain period of time. This changes that
caused the drift in abnormal returns as represented by the graph can be explained by the
election period. The performance in year 2007 was affected by the then elections which
brought about instability in the country affecting the social and economic part of the
economy. Results in the actual returns shows a low performance of the actual stocks in
year 2007 and high performance in years 2013. Results further show that the overall
performance of actual returns in the periods before elections performed better than actual
returns on stocks after elections. Further the rise in the market performance after 2013
followed the smooth transition of the political regime to the new government.
Study findings from the market model indicated that the market return is a good predictor
of stock returns. ANOVA results indicated that abnormal returns before elections were
significantly higher than abnormal returns after the elections. ANOVA results also
indicated that actual stock returns were significantly higher before elections than after
election periods. Finally, ANOVA results revealed that the expected returns as well as
the market returns were significantly higher before elections than after the elections.
5.3 Conclusions
From the results, events that tend to affect the financial performance of stock are
primarily political such as the elections. Uncontrollable losses mainly from the external
environment for instance natural calamity and political instability have an effect on the
market value of a firm irrespective of whether it has a weak or a strong shareholders
rights.

41
Study findings led to the conclusion that the market return is a good predictor of stock
returns. It was concluded that abnormal returns before elections were significantly higher
than abnormal returns after the elections. Results led to the conclusion that actual stock
returns were significantly higher before elections than after election periods. Finally,
results led to the conclusion that the expected returns as well as the market returns were
significantly higher before elections than after the elections.
From the study conclusions can be made that during periods of increased political
uncertainty such as election periods, the stock returns declined. Political uncertainty
surrounding elections can affect how corporate investment responds to stock prices.
Kenya is not the only country that experiences this effect, most countries around the
world have sensitive stock returns during and the short period after election years
compared to periods before election. The poor performance after the election could be
attributed to investor anxiety and panic associated with post-election period. It is
therefore with the findings from this study that elections have a real impact on
performance of returns in the Nairobi Security Exchange market.
5.4 Recommendation
The study provides recommendation to the investors who should carefully plan and carry
out investments during and after the periods of the general elections as the returns could
be affected either positively or negatively during that period. Elections can have
important consequences in the stock market; therefore investors can devote a certain
portion of money to invest in stocks before and another in stocks after elections. Many

42
investors simply invest in stocks after elections where they presume that the market will
be performing well as a result of the new regime. However, this is not the best option as
expanding ones mindset may lead to discovery of high returns on stocks before the
election or even after the election.
Further recommendations are to government policy makers, who formulate and
implement laws and policies on management of security exchange. The recommendation
is that they should implement policies that reduce capital flights which may lead to huge
losses especially to investors making them to draw out from investing in securities
exchange which in turn may affect the gross national income of the country.
5.5 Limitations of the Study
A limitation for the purpose of this research regards a challenging factor that was present
to the researcher when sourcing for information. The study focused on market returns
which are not the only factors that affect the performance of a company during and after
the election period. Other factors that ought to have been considered in the study are cash
flows, gearing ratio, asset base, growth opportunities, liquidity which were not
considered when estimating the returns. These factors account for the unexplained
element in the regression model.

43
5.7 Suggestions for Further Studies
The study put more emphasis on the effects of elections on stock returns, thus further
studies should examine what other factors affect NSE stock returns. Factors such as
corporate performance, increased tax rates or dividends of shareholders could be assessed
to analyze their effects on stock returns.
Further research could be done to analyze the performance of stock returns in non
election periods to compare their performance with the periods prior to elections as it is
in this study. Furthermore, researchers should analyze the effect of terrorist events, IPO
events, regulation events, demutualization events among other events.

44
REFERENCES
Alesina, A. & Jeffrey, S. (1987). Political Parties and the Business Cycle in the United States, 1948-1984. Journal of Money, Credit and Banking, Vol. 20 (1), 63–82.
Alesina, S., & Rodrik, D. (1994). Political Cycles and the Macroeconomy.
Massachusetts Institute of Technology Press. Cambridge. Allvine, P. & O’Neil, D. E. (1980) Stock market returns and the presidential election
cycle. Journal of Financial Analysts, Vol.36, 49-56. Amihud, Y., & Mendelson, H. (1986). Asset pricing and the bid-ask spread. Journal of
Financial Economics, Vol. 17, 223-249. Armitage, S. (1995). Event Study Methods and Evidence on Their Performance. Journal
of Economic Surveys, Vol. 8, 25-52 Bachted T., & Fuss, S. (2006). Financing investment. Journal of American Economic
Review, Vol. 91, 1263-1285. Black, F. (1988). An Equilibrium Model of the Crash. National Bureau of Economic
Research. Macroeconomics Annual, 269–275. Bloomberg, S., & Hess, G. (2001). Is the political business cycle for real? Journal of
Public Economics, Vol. 87, 1091-1121. Booth, J.R. & Booth, L.C. (2003). Is the presidential cycle in security returns merely a
reflection of business conditions? Journal Review of Financial Economics, Vol. 12(1), 131-159.
Durnev, A., Morck, R. & Yeung, B. (2004). Value enhancing capital budgeting and firm-
specific stock return variation. Journal of Finance, Vol. 59, 65-105. Durnev, A., Errunza, V. & Molchanov, A. (2011). Property rights protection, corporate
transparency, and growth. Journal of International Business Studies, Vol. 40, 99-107.
Fama, E. F. (1965). The Behavior of Stock Market Prices. Journal of Business, Vol. 38,
34-105. Fiorina, M. P. (1991). Elections and the Economy in the 1980s: Short- and Long- Term
Effects. In Alberto Alesina and Geoffrey Carliner eds. Politics and Economics in the Eighties, 17-40. Chicago, University of Chicago Press,

45
Foerster, S. R. & Schmitz J. J. (1997). The Transmission of US Election Cycles to International Stock Returns, Journal of International Business Studies, Vol. 28, 1-27.
French K.R. & Rou R. (1966). The market pricing of accruals quality, Journal of
Accounting and Economics, Vol. 39, 295–327. Gartner, B.L., & Wellershoff, K. W. (1995). Is there an election Cycle in American stock
returns. Journal of Internal Review of Economics and Finance, Vol. 4, 387-410. Gichema, G. W. (2007). The Effect of Bonus Share Issues on Stock Prices of Companies
Quoted at The Nairobi Security Exchange. Unpublished MBA Project, University of Nairobi.
Gitobu, M. (2000). Determining the Influence of Macro Economic Indicators on Stock
Market Indicators. Unpublished MBA Dissertation, University of Nairobi Hibbs, D. A. (1977). Political Parties and Macroeconomic Policy. Journal of American
Political Science Review, Vol. 7, 1467-1487. Irungu, A. (2012). Informational content of presidential results at the Nairobi Securities
Exchange. Unpublished MSC Project, University of Nairobi. James, L. (2006). Earnings Yields, Market Values, and Stock Returns, Journal of
Finance, Vol.44, 135-148. Kairu, G. S. (2007). The Effects of Secondary Equity Offering on Stock Returns Of Firms
Quoted on The Nairobi Stock Exchange. Unpublished MBA Project, University of Nairobi.
Kariuki, N. J. (2007). Effects of share split in a listed company a study of the Nairobi
stock exchange. Journal of Financing investment Review, Vol. 1, 24-26 Kibuthu W. (2005) Capital Markets in Emerging Economies, A Case Study of the Nairobi
Stock Exchange. Unpublished MA dissertation, Tufts University Kinyua, J., Nyanumba, P. M., Gathaiya, .R.N.& Kithitu, J. W. (2013). Journal of Effects
of Initial Public Offer on Performance of Companies Quoted at the Nairobi Stock Exchange, Vol.3 (1).
Kiptoo, L. (2006). Information content on dividend announcements by companies quoted
in NSE. Unpublished MBA Project, University of Nairobi.

46
Kithinji, A. & Ngugi, W. (2008) Stock market performance before and after general elections. A case study of the Nairobi Stock Exchange. Unpublished paper presented in African International Business and Management Conference
Konchitchki, Y. & O'Leary, D. E. (2011). Event study methodologies in information
systems research. International Journal of Accounting Information System, Vol. 12, 99–115
Leblang, D. & Mukherjee, B. (2005). Government Partisanship, Elections and the Stock
Market: Examining American and British Stock Returns, 1930-2000. Journal of American Political Science, Vol. 49(4), 780–802.
Lee, R. (1998). What is an Exchange? The Automation, Management, and Regulation of
Financial Markets. New York, Oxford University Press Inc. Lerol, S. F. (1973). Contrarian investment, extrapolation, and risk. Journal of Finance,
Vol. 49, 1541-1578. Lucas, R. E. (1978). Asset Prices in an Exchange Economy. Journal of Econometrica,
Vol. 46, 1429–1445 Lusinde, M. M. (2012). Volatility in stock returns of NSE listed companies around
general elections in Kenya. Unpublished MBA project, University of Nairobi MacKinlay, C. (1997). Event studies in economics and finance. Journal of Economic
Literature,Vol. 35 (1), 13–39. Markowitz, H. (1952). Portfolio Selection. Journal of Finance, Vol. 7, 77-91. Mbugua, D. (2003). Financial markets and the allocation of capital. Journal of Financial
Economics, Vol. 58, 187-214. Mishkin, Frederic S. and White Eugene N. (2002). U.S. Stock Market Crashes and their
Aftermath: Implications for Monetary Policy. National Bureau of Economic Research, Working Paper Series 8992, 1-10.
Muikiria, W. J. (2010). Empirical evidence. Journal of reaction of share prices to issue of
IPOs from the NSE, Vol. 4, 30-34. Nairobi Security Exchange (2013). Handbook for the NSE. Retrieved from www.nse.co.ke
on 15th May 2013. Ngechu, M. (2004), Understanding the research process and methods. An introduction to
research methods. Acts Press, Nairobi.

47
Nofsinger, J. R. (2007). Social mood and financial economics. Journal of Behavioral Finance, Vol. 6, 144–160.
Nofsinger, J. R. and Sias, R.W. (2005). Herding and feedback trading by institutional and
individual investors. Journal of Finance, Vol. 54, 2263–2295. Nohlen, D., Krennerich, M & Thibaut, B (1999), Elections in Africa: A data handbook,
ISBN 0-19-829645-2, 486. Nordhaus, W. (1975). The Political Business Cycle. Journal of Economic Review Studies.
Vol.42, 169-190. Oehler, A. Walker, T. & Wendt, S. (2009). Effects of Election Results on Stock Price
Performance: Evidence from 1976 to 2008. Journal of political Economics, Vol.11, (18), 16.
Pettengill, G. N, & Clark, J. M. (2001). Estimating expected returns in an event study
framework: Evidence from the dartboard column. Quartely Journal of Buiness Economy, Vol.40, 3-21.
Rogoff, K. (1990). Equilibrium Political Budget Cycle. Journal of American Economic
Review, Vol. (80), 21-36. Roztochi, N. & Weistroffer, H. (2009). Event studies in information systems research: An
updated review. Americas Conference on Information Systems 2009 Proceedings, Paper 191.
Schneider, G. and Tröger, V. (2006). War and the World Economy, stock market
reactions to international conflicts. Journal of Conflict Resolution, Vol.50 (5), 623-645.
Siegel, J. J. (1998). Stocks for the Long Run. New York, McGraw Hill. Stoll, H. R., & Whaley, R. E. (1983). Transactions costs and the small firm effect,
Journal of Financial Economics, Vol. 12, 57–80. Throup, D. & Charles, H. (1998). Multi-Party Politics in Kenya: The Kenyatta & Moi
States & the Triumph of the System in the 1992 Election, 435. New York, Long House Publishing Services, Cumbria.
Tversky, A. & Kahneman, D. (1981). The framing of decisions and the psychology of
choice. Journal of Science Vol. 211, 453–458. Tversky, A., & Kahneman, D. (1992). Advances in prospect theory: Cumulative
representation of uncertainty. Journal of Risk and Uncertainty, Vol. 5, 297–323.

48
Wong, W.K., & McAleer, M., (2009). Journal of Mapping the Presidential Election Cycle in US stock markets, Mathematics and Computers in Simulation, Vol. 79 (11), 3267-3277.

49
APPENDICES Appendix 1: List of Companies
No Company
1 Eaagads Ltd
2 Kapchorua Tea Co. Ltd
3 Kakuzi
4 Limuru Tea Co. Ltd
5 Rea Vipingo Plantations Ltd
6 Sasini Ltd
7 Williamson Tea Kenya Ltd
8 Express Ltd
9 Kenya Airways Ltd
10 Hutchings Biemer
11 Longhorn Publishers
12 Nation Media Group
13 Standard Group Ltd
14 TPS Eastern Africa (Serena) Ltd

50
15 Scangroup Ltd
16 Uchumi Supermarket Ltd
17 AccessKenya Group Ltd
18 Safaricom Ltd
19 Car and General (K) Ltd
20 CMC Holdings Ltd
21 Sameer Africa Ltd
22 Marshalls (E.A.) Ltd
23 Barclays Bank Ltd
24 CFC Stanbic Holdings Ltd
25 Diamond Trust Bank Kenya Ltd
26 Housing Finance Co Ltd
27 Kenya Commercial Bank Ltd
28 National Bank of Kenya Ltd
29 NIC Bank Ltd
30 Standard Chartered Bank Ltd

51
31 Equity Bank Ltd
32 The Co-operative Bank of Kenya Ltd
33 I and M Bank Kenya Ltd
34 Jubilee Holdings Ltd
35 Pan Africa Insurance Holdings Ltd
36 Kenya Re-Insurance Corporation Ltd
37 Olympia Capital Holdings ltd
38 Centum Investment Co Ltd
39 B.O.C Kenya Ltd
40 British American Tobacco Kenya Ltd
41 Carbacid Investments Ltd
42 East African Breweries Ltd
43 Mumias Sugar Co. Ltd
44 Unga Group Ltd
45 Eveready East Africa Ltd
46 Athi River Mining

52
47 Bamburi Cement Ltd
48 Crown Berger Ltd
49 E.A.Cables Ltd Ord
50 E.A.Portland Cement Ltd
51 KenolKobil Ltd
52 Total Kenya Ltd
53 KenGen Ltd
54 Kenya Power & Lighting Co Ltd
55 National Bank of Kenya Ltd
56 Kenya Oil Company Limited

53
Appendix II: Data Input
COMPANY
PER
IOD
Retu
rns
Mar
ket
Retu
rn a b
Expe
cted
Abno
rmal
Dum
my
Eaagards Kenya Ltd 2013 0.08 -0.02 0.03 0.75 0.02 0.07 1
2013 -0.08 0.02 0.03 0.75 0.05 -0.13 0
2007 -0.08 -0.10 0.03 0.75 -0.05 -0.03 1
2007 -0.09 0.03 0.03 0.75 0.05 -0.13 0
2002 -0.09 -0.01 0.03 0.75 0.02 -0.11 1
2002 -0.02 -0.03 0.03 0.75 0.01 -0.02 0
Kakuzi Limited 2013 0.06 -0.02 0.03 0.75 0.02 0.04 1
2013 0.14 0.02 0.03 0.75 0.05 0.09 0

54
2007 -0.04 -0.10 0.03 0.75 -0.05 0.01 1
2007 0.16 0.03 0.03 0.75 0.05 0.11 0
2002 -0.03 -0.01 0.03 0.75 0.02 -0.05 1
2002 -0.03 -0.03 0.03 0.75 0.01 -0.03 0
Kapchorua Tea
Company Limited 2013 -0.90 -0.02 0.03 0.75 0.02 -0.92 1
2013 0.02 0.02 0.03 0.75 0.05 -0.03 0
2007 0.11 -0.10 0.03 0.75 -0.05 0.16 1
2007 0.00 0.03 0.03 0.75 0.05 -0.05 0
2002 -0.01 -0.01 0.03 0.75 0.02 -0.03 1
2002 0.12 -0.03 0.03 0.75 0.01 0.11 0
REA Vipingo 2013 -0.01 -0.02 0.03 0.75 0.02 -0.03 1

55
Plantations Ltd
2013 0.10 0.02 0.03 0.75 0.05 0.05 0
2007 -0.08 -0.10 0.03 0.75 -0.05 -0.03 1
2007 0.12 0.03 0.03 0.75 0.05 0.07 0
2002 0.61 -0.01 0.03 0.75 0.02 0.59 1
2002 0.00 -0.03 0.03 0.75 0.01 -0.01 0
Limuru Tea Company
Limited 2013 0.00 -0.02 0.03 0.75 0.02 -0.02 1
2013 0.00 0.02 0.03 0.75 0.05 -0.05 0
2007 0.00 -0.10 0.03 0.75 -0.05 0.05 1
2007 0.00 0.03 0.03 0.75 0.05 -0.05 0
2002 0.00 -0.01 0.03 0.75 0.02 -0.02 1

56
2002 0.00 -0.03 0.03 0.75 0.01 -0.01 0
Sasini Tea And Coffee
Limited 2013 0.04 -0.02 0.03 0.75 0.02 0.02 1
2013 -0.02 0.02 0.03 0.75 0.05 -0.06 0
2007 -0.12 -0.10 0.03 0.75 -0.05 -0.07 1
2007 0.12 0.03 0.03 0.75 0.05 0.07 0
2002 -0.02 -0.01 0.03 0.75 0.02 -0.04 1
2002 -0.09 -0.03 0.03 0.75 0.01 -0.10 0
Williamson Tea Kenya
Limited 2013 0.07 -0.02 0.03 0.75 0.02 0.06 1
2013 0.05 0.02 0.03 0.75 0.05 0.00 0
2007 -0.20 -0.10 0.03 0.75 -0.05 -0.15 1

57
2007 -0.06 0.03 0.03 0.75 0.05 -0.11 0
2002 -0.21 -0.01 0.03 0.75 0.02 -0.23 1
2002 0.59 -0.03 0.03 0.75 0.01 0.58 0
Access Kenya Group 2013 0.43 -0.02 0.03 0.75 0.02 0.42 1
2013 0.33 0.02 0.03 0.75 0.05 0.28 0
2007 -0.01 -0.10 0.03 0.75 -0.05 0.04 1
2007 0.30 0.03 0.03 0.75 0.05 0.25 0
2002 0.00 -0.01 0.03 0.75 0.02 -0.02 1
2002 0.00 -0.03 0.03 0.75 0.01 -0.01 0
Car And General
(Kenya) Limited 2013 0.18 -0.02 0.03 0.75 0.02 0.17 1
2013 0.08 0.02 0.03 0.75 0.05 0.04 0

58
2007 -0.17 -0.10 0.03 0.75 -0.05 -0.13 1
2007 0.18 0.03 0.03 0.75 0.05 0.13 0
2002 0.00 -0.01 0.03 0.75 0.02 -0.02 1
2002 -0.03 -0.03 0.03 0.75 0.01 -0.04 0
CMC Holdings Limited 2013 0.00 -0.02 0.03 0.75 0.02 -0.02 1
2013 0.00 0.02 0.03 0.75 0.05 -0.05 0
2007 0.00 -0.10 0.03 0.75 -0.05 0.05 1
2007 0.00 0.03 0.03 0.75 0.05 -0.05 0
2002 0.00 -0.01 0.03 0.75 0.02 -0.02 1
2002 0.00 -0.03 0.03 0.75 0.01 -0.01 0
Express Kenya Limited 2013 0.03 -0.02 0.03 0.75 0.02 0.01 1

59
2013 -0.09 0.02 0.03 0.75 0.05 -0.13 0
2007 -0.04 -0.10 0.03 0.75 -0.05 0.00 1
2007 0.05 0.03 0.03 0.75 0.05 0.00 0
2002 0.00 -0.01 0.03 0.75 0.02 -0.02 1
2002 -0.03 -0.03 0.03 0.75 0.01 -0.04 0
Kenya Airways Limited 2013 -0.03 -0.02 0.03 0.75 0.02 -0.04 1
2013 -0.05 0.02 0.03 0.75 0.05 -0.10 0
2007 -0.23 -0.10 0.03 0.75 -0.05 -0.19 1
2007 0.07 0.03 0.03 0.75 0.05 0.02 0
2002 -0.15 -0.01 0.03 0.75 0.02 -0.17 1
2002 0.02 -0.03 0.03 0.75 0.01 0.01 0

60
Marshalls (East Africa)
Limited 2013 -0.01 -0.02 0.03 0.75 0.02 -0.02 1
2013 -0.10 0.02 0.03 0.75 0.05 -0.15 0
2007 0.07 -0.10 0.03 0.75 -0.05 0.12 1
2007 0.08 0.03 0.03 0.75 0.05 0.03 0
2002 0.10 -0.01 0.03 0.75 0.02 0.08 1
2002 0.02 -0.03 0.03 0.75 0.01 0.01 0
Nation Media Group
Limited 2013 0.19 -0.02 0.03 0.75 0.02 0.18 1
2013 0.19 0.02 0.03 0.75 0.05 0.14 0
2007 -0.06 -0.10 0.03 0.75 -0.05 -0.01 1
2007 0.13 0.03 0.03 0.75 0.05 0.08 0

61
2002 -0.10 -0.01 0.03 0.75 0.02 -0.12 1
2002 0.37 -0.03 0.03 0.75 0.01 0.37 0
Safaricom Limited 2013 0.13 -0.02 0.03 0.75 0.02 0.11 1
2013 0.06 0.02 0.03 0.75 0.05 0.01 0
2007 0.00 -0.10 0.03 0.75 -0.05 0.05 1
2007 0.00 0.03 0.03 0.75 0.05 -0.05 0
2002 0.00 -0.01 0.03 0.75 0.02 -0.02 1
2002 0.00 -0.03 0.03 0.75 0.01 -0.01 0
Scangroup Limited 2013 0.29 -0.02 0.03 0.75 0.02 0.28 1
2013 0.11 0.02 0.03 0.75 0.05 0.07 0
2007 -0.03 -0.10 0.03 0.75 -0.05 0.02 1

62
2007 0.06 0.03 0.03 0.75 0.05 0.01 0
2002 0.03 -0.01 0.03 0.75 0.02 0.01 1
2002 -0.18 -0.03 0.03 0.75 0.01 -0.19 0
Standard Group
Limited 2013 -0.08 -0.02 0.03 0.75 0.02 -0.09 1
2013 0.16 0.02 0.03 0.75 0.05 0.11 0
2007 0.13 -0.10 0.03 0.75 -0.05 0.18 1
2007 0.07 0.03 0.03 0.75 0.05 0.02 0
2002 -0.03 -0.01 0.03 0.75 0.02 -0.05 1
2002 0.08 -0.03 0.03 0.75 0.01 0.08 0
TPS 2013 0.06 -0.02 0.03 0.75 0.02 0.04 1
2013 -0.04 0.02 0.03 0.75 0.05 -0.09 0
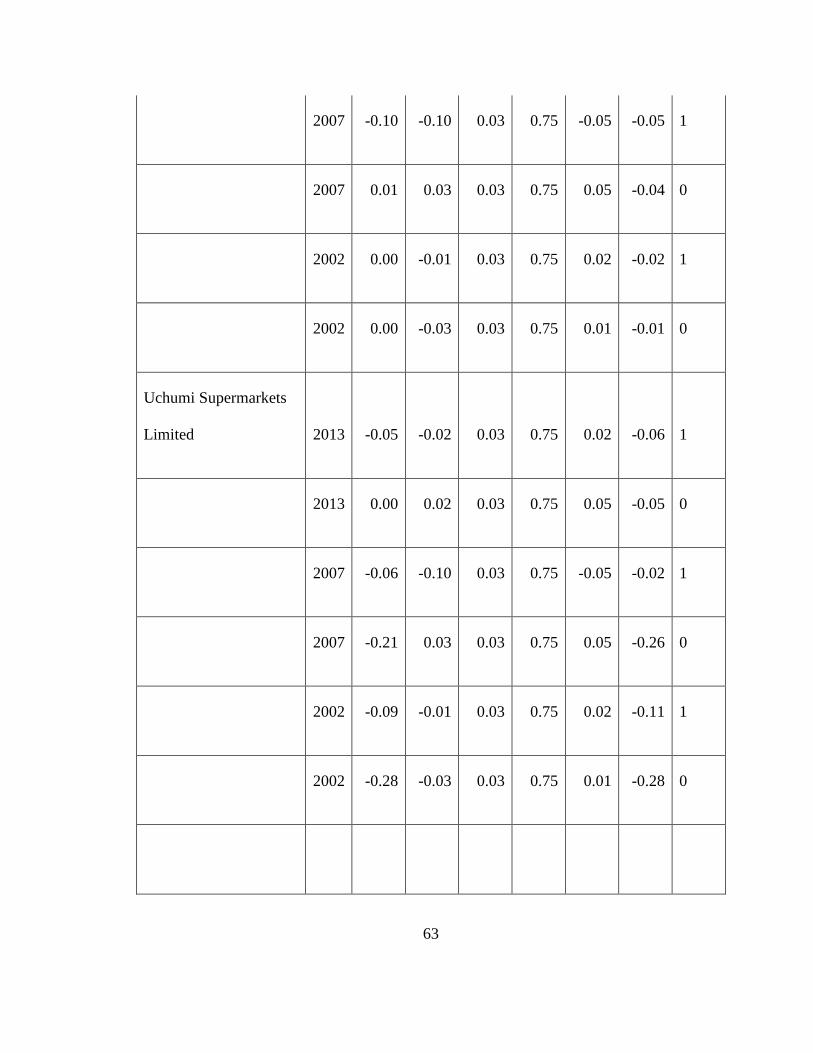
63
2007 -0.10 -0.10 0.03 0.75 -0.05 -0.05 1
2007 0.01 0.03 0.03 0.75 0.05 -0.04 0
2002 0.00 -0.01 0.03 0.75 0.02 -0.02 1
2002 0.00 -0.03 0.03 0.75 0.01 -0.01 0
Uchumi Supermarkets
Limited 2013 -0.05 -0.02 0.03 0.75 0.02 -0.06 1
2013 0.00 0.02 0.03 0.75 0.05 -0.05 0
2007 -0.06 -0.10 0.03 0.75 -0.05 -0.02 1
2007 -0.21 0.03 0.03 0.75 0.05 -0.26 0
2002 -0.09 -0.01 0.03 0.75 0.02 -0.11 1
2002 -0.28 -0.03 0.03 0.75 0.01 -0.28 0

64
Barclays Bank Of
Kenya Limited
2013 0.07 -0.02 0.03 0.75 0.02 0.05 1
2013 0.02 0.02 0.03 0.75 0.05 -0.03 0
2007 -0.11 -0.10 0.03 0.75 -0.05 -0.06 1
2007 0.08 0.03 0.03 0.75 0.05 0.03 0
2002 0.03 -0.01 0.03 0.75 0.02 0.01 1
2002 0.10 -0.03 0.03 0.75 0.01 0.09 0