effect of certain social policy measures on welfare …
TRANSCRIPT

EFFECT OF CERTAIN SOCIAL POLICY MEASURES ON WELFARE OF SOCIALLY VULNERABLE GROUPS*
Gleb Shymanovich, Alexander Chubrik**
Abstract This work assesses the effects of potential social policy reforms, the need for which is due to negative demographic and economic trends, on the welfare of socially vulnerable groups and the population of Belarus as a whole. Based on a sample survey of households in 2007-2012, the study models possible changes in the disposable resources of the population as the result of parametric reforms in the pension system (raising the retirement age and switching to the indexation of pensions for inflation), raising housing and utility services rates, and eliminating privileges. According to the results obtained, the reforms under consideration would in most cases substantially worsen the financial condition of a number of socially vulnerable groups: single-parent families, retirees and one-member households. The exception is the reform of raising the retirement age, where the net direct effect for the population could be neutral, provided that the labor market proved capable of painlessly absorbing the new workforce with-out a burst of unemployment and/ or economic inactivity. In that case a sizeable part of the population, which currently retires on pension while continuing to work, thereby avoiding relative and absolute poverty, would be worse off. Accordingly, any reforms in social policy aimed at rationalizing the structure of public spending would require compensatory measures for social protection of vulnerable population groups. This work models the effect of raising the criterion for granting targeted social benefits to 150% of the minimum subsistence budget. That measure would make it possible to compensate for the losses from the reforms under consideration for most of the socially vulnerable population and substantially lower the poverty level, but would require substantial addi-tional funding. However, considering the reduction in budget expenditures on funding the privileges system and the resources saved by raising housing and utility services rates, an increase in spending on providing targeted social assistance to the extent indicated looks entirely acceptable. An important shortcoming of that reform might only be a distortion of incentives for economic activity. In any case, along with changes in the system of social support and pension reform, it would be necessary to improve the effectiveness of the employment promotion system in order to increase the mobility of labor resources, especially at the pre-retirement age. Keywords: Belarus, sample survey of household budgets, social support system, living standard JEL classification: I38, I32 IPM Research Center, Working paper WP/13/04
50 B Zakharov St, Minsk, Belarus tel/ fax +375 17 210 0105 Web site: http://research.by/ email: [email protected] © 2013 IPM Research Center The views presented in the document are those of the authors and may not be the views of the organization they represent.
* English translation kindly provided by the International Monetary Fund. ** Gleb Shymanovich is an economist with the IPM Research Center, email: [email protected], Alexander Chu-
brik is director of the IPM Research Center, email: [email protected].

Effect of Certain Socioeconomic Policies on the Welfare of Socially Vulnerable Groups
CONTENTS
1. Introduction ............................................................................................................................................................ 3
2. Leterature survey ................................................................................................................................................. 3
2.1. Areas of reform .............................................................................................................................................. 3
2.2. Approaches to assessing the effect of reforms on the social situation of the population 4
3. Data and methodology ........................................................................................................................................ 5
3.1. Data ......................................................................................................................................................................... 5
3.2. Methodology for assessing effects of changes in social policy .................................................. 6
4. Reform scenarios .................................................................................................................................................. 7
4.1. Pension system .............................................................................................................................................. 7
4.1.1. Raising the retirement age ............................................................................................................... 7
4.1.2. Indexation for inflation .................................................................................................................. 10
4.2. Raising rates of recovery of housing and utility costs ............................................................... 11
4.3. Reforms in the social support system ............................................................................................... 11
5. RESULTS OF MODELING ................................................................................................................................. 13
5.1. Pension reform ........................................................................................................................................... 13
5.1.1. Raising the retirement age ............................................................................................................ 13
5.1.2. Indexation of pensions for inflation.......................................................................................... 15
5.2. Raising housing and utility services rates ....................................................................................... 17
5.3. Reforms in the social support system ............................................................................................... 18
6. Conclusions ........................................................................................................................................................... 20
References ...................................................................................................................................................................... 21
Appendix A. ASSESSMENT OF THE PROBABILITY OF UNEMPLOYMENT OF THE POPULATION OF PRE-RETIREMENT AGE ..................................................................................................................................... 23
Appendix B. ASSESSMENT OF FACTORS DETERMINING AMOUNT OF PRE-PENSION-AGE POPULATION’S WAGES ............................................................................................................................................. 26
Appendix C. CHANGE IN DISPOSABLE RESOURCES OF VARIOUS SOCIAL GROUPS OF POPULATION, %........................................................................................................................................................... 27
Appendix D. ABSOLUTE POVERTY LEVEL UNDER VARIOUS SOCIAL POLICY REFORM OPTIONS, % OF POPULATION ..................................................................................................................................................... 28

Gleb Shymanovich, Alexander Chubrik
3
1. INTRODUCTION
In recent years Belarus has encountered a number of negative trends that give unprecedented urgency to the question of reforming the social protection system. First, long-term demographic trends – the reduction in the working-age population along with an increase in the pension-age population – have placed an increased burden on the pension system. Second, the rapid accu-mulation of external debt along with a deterioration in external economic conditions have re-sulted in a change in the structure of expenditures and limited sources of state budget revenues. Third, the absence of significant formal barriers to the movement of the workforce between Belarus and Russia, has made the Belarusian labor market highly sensitive to negative shocks, which have resulted in widening the wage gap between the countries. Finally, as a result of the slowdown in growth/ reduction in productivity (Kruk, Bornukova, 2013), potential GDP growth has slowed considerably (Research Center, 2013b).
Under these conditions, changes in social policy (including pension system reform) aimed at reducing the burden on the state budget, are becoming unavoidable. Obviously, those changes that would result in a deterioration of the situation of socially vulnerable population groups require balanced compensatory measures. The present work makes an assessment of the con-sequences of certain changes in social policy for the population as a whole, the groups that would be affected by such changes, and socially vulnerable groups and population determined on the basis of Laeken indicators.
The work has the following structure: In the second section a brief survey is made of World Bank proposals and government plans for reforming social policy and of the approaches to as-sessing the effect of reforms on the population’s welfare. The third section describes the meth-odology for assessing the effects of such reforms, and the data on which that assessment is based. The fourth section examines the specifics of scenarios for the social policy reforms in question. Assessments of the effects of changes in social policy on various population groups are made on the basis of modeling those scenarios (fifth section). In the Conclusion brief con-clusions are drawn for social policy. The work is followed by appendices containing the main quantitative results of the analysis.
2. LETERATURE REVIEW
2.1. Areas of reform
A number of studies have noted the need for social policy reforms that would respond to the challenges stemming from negative demographic and economic trends. Chubrik and Shy-manovich (2008) have pointed out the instability of Belarus’s pension system and the need for parametric and/ or structural reforms that would ensure its stable functioning. The World Bank (2011) has proposed a number of changes in the social benefit system, measures to reduce cross subsidies, and parametric changes in the pension system:1
- “The key challenge for the pension system in Belarus is to secure its long-term fiscal sus-tainability given the projected demographic changes, while allowing for a fiscally re-sponsible reduction in contribution rates” (World Bank, 2011, p. xix);
- “To improve targeting efficiency and reduce the cost of social assistance spending, rea-lignment of spending from untargeted to targeted programs is needed.” (Ibid., p. xviii);
- “The analysis highlights the need to comprehensively reform energy policy. . . [includ-ing] reform of tariffs to improve the financial viability of energy service provision 1. and reduce the fiscal
1 Some of the proposed measures are already starting to be implemented by the government (in particular, an accelerated increase in utility rates compared with inflation, which is aimed at increasing the coverage of costs by rates). In addition, the government has made attempts to provide incentives for later retirement on pension, but from all indications they will not produce the desired effect. See http://www.kp.ru/daily/25857/2825463/.

Effect of Certain Socioeconomic Policies on the Welfare of Socially Vulnerable Groups
- burden from underpricing (Ibid., p. xvi).
The economic authorities have also noted the need for changes: In an October resolution, the Council of Ministers and National Bank2 adopted a joint action plan “for the structural reform and improved competitiveness of the Republic of Belarus economy,” which, among other things, provides measures for reducing cross subsidies and enhancing the role of targeted social assis-tance:
- “Taking decisions on the gradual reduction of cross and budgetary subsidies (Joint Ac-tion Plan of the Council of Ministers and National Bank,3 p. 11);
- “Improving the state targeted assistance system based on the results of monitoring the effectiveness of its performance under the conditions of eliminating cross subsidies” (Ibid., p. 11).
In addition, members of government authorities have noted that “under the conditions of an expected increase in the number of pension recipients due to the aging of the population, there is a need for measures to hold down the increase in the financial burden on the pension system” (Kuzmych, 2013, p. 22), in particular parametric reforms of the pension system and the devel-opment of voluntary and occupational pension insurance (Kuzmych, 2013).
Further, an assessment will be made of the social consequences of carrying out some of the social policy measures proposed by the World Bank and the government, including raising the retirement age, switching to the indexation of pensions for inflation, reducing cross subsidies, eliminating benefits in kind, and raising the need criterion for monthly benefits in the context of targeted social assistance.
2.2. Approaches to assessing the effect of reforms on the social situation of the population
Assessing the effect of reforms on the social situation of the population is a widespread practice in many international organizations, such as the World Bank, the European Commission, and UNDP. There is a whole area of related research – analysis of poverty and social consequences (Poverty and Social Impact Analysis4 – Assessment). Within that area, the effects on the popu-lation’s welfare of reforms in social policy and taxation, changes in rates and pricing policy, the consequences of joining or withdrawing from regional integration agreements, and reforms in agriculture and other sectors of the economy are studied. Because of the regular performance of such research and its great practical importance to economic policy, the World Bank has de-veloped special methods guides for poverty and social impact analysis (see World Bank, 2003).
There are no strict criteria for choosing a specific methodology for research – it depends on the nature of the reforms being analyzed, the distinctive features of the country and the availability of data. The World Bank singles out five main economic approaches to calculating the social impact of reforms:
1. Analysis of direct impact, i.e., distribution of the direct benefits of reforms (for example, from the change in prices or size of benefits) among households;
2. Behavioral models that entail an econometric assessment of the change in households’ behavior as the result of reforms (change in demand for goods and services, in the labor supply in the labor market, etc.);
3. Partial equilibrium models; 4. General equilibrium models;
2 Resolution No. 895/15 of the Republic of Belarus Council of Ministers and National Bank of 10/10/2013. 3 See http://www.government.by/upload/docs/filebf535b23cb8884fb.PDF. 4 http://web.worldbank.org/WBSITE/EXTERNAL/TOPICS/EXTPSIA/0..content-MDK:20415258~pagePK:210058~piPK:210062~theSitePK:490130.00.html.

Gleb Shymanovich, Alexander Chubrik
5
5. Special instruments combining macroeconomic models (3 and 4) and data on the distri-bution of effects on the micro level (1 and 2).
In practice, many studies include a mixture of several methods. The final stage is frequently an analysis of the distribution of direct benefits, which may be preceded by a study of behavioral responses of households, analysis of the effects of reforms on the macro level using partial equi-librium models or computable general equilibrium (CGE) models. Analysis of the distribution of benefits is based on data from household surveys. It assumes that the effect of reforms equals the change in expenses or income caused by a change in prices or wages and depends on the individual characteristics of households. A quantitative assessment of the effect is made using models based on the envelope theorem5 and models describing sources of households’ income.
The envelope theorem makes it possible in the context of an optimization model, to assess the effect of a change in the parameters of an objective function at the optimum. The mathematical effect is equal to a partial derivative objective function at the optimum for a changing parame-ter. In practice this means that the effect of reforms (resulting in a change in prices and wages) on the financial condition of households equals the weighted sum of changes in prices and wages, where the weights are the amount of the relevant consumption and income (Essama-Nssah, 2005). The main theoretical limitation of such an impact assessment is the condition of a relatively small change in the parameter relative to the optimum. Accordingly, in the case of a substantial change in prices or wages, this approach may cause distortions, and the analysis needs to be supplemented by taking elasticity into account.
Models describing household income make it possible to analyze the change in the population’s welfare as a result of reforms affecting the labor market. They are based on regressions, using which assessment is made of the factors determining:
- choice of employment and self-employment, unemployment or economic inactivity; - level of compensation in the case of employment and self-employment. Said regressions are usually assessed in reduced form, and they are not aimed at creating a full-fledged structural model describing the causal connection (Bourguignon, Ferreira, 2005). “pa-rameters generated by these equations are merely descriptions of conditional distributions based on the chosen functional forms” (Essama-Nssah, 2005).
The main advantage of analysis of the distribution of benefits is the possibility of a detailed analysis of the distribution of the direct effect of reforms for various population groups, which cannot be achieved using macro models. But the shortcoming of this approach is the static na-ture of the model and the impossibility of taking into account all changes in the economy that are due to reforms.
3. DATA AND METHODOLOGY
3.1. Data
The consequences of reforms in the area of social policy for the population’s welfare are as-sessed in the work on the basis of the micro data from a sample survey of households in terms of living standard6 (sample survey of households). The data provided in it about the structure of income and expenses of households and their makeup and the main social characteristics of household members7 can be used to analyze the effects of changes in social policy not only for the welfare of the population as a whole but for the financial condition of individual socially vulnerable population groups. That is the main advantage of analysis on the micro level. The potential of the alternative approach, which entails the construction of macroeconomic models,
5 http://en.wikipedia.org/wiki/Envelope_theorem. 6 http://belstat.gov.by/homep/ru/households/main1.php. 7 http://belstat.gov.by/homep/ru/households/1_microfile.php.

Effect of Certain Socioeconomic Policies on the Welfare of Socially Vulnerable Groups
is considerably limited, since they make it possible to assess effects only on very aggregated population groups.
On average, about 15,000 persons per year participated in the sample survey of households. That is sufficient to make the sample representative on the Oblast level. However, certain social groups, such as the pre-pension-age unemployed population, may be represented by a rela-tively small number in the survey (because of their relatively small share of the population structure), which makes the analysis of their welfare less than entirely reliable (especially in the attempt at disaggregation to the Oblast level). In order to address this problem in this work, data were used from the 2007-2012 period. Such an approach also makes it possible to avoid distortions related to the distinctive features of economic policy and the economic situation in any given year. For example, the period considered includes two episodes of currency crisis that had a substantial negative impact on the population’s welfare, as well as a period of stim-ulative incomes policy on the eve of the 2008 and 2012 parliamentary elections and 2010 pres-idential election. For example, during the 2011 crisis in Belarus the financial condition of pen-sioners deteriorated relative to the population as a whole, and in 2012 it recovered because of a rapid increase in pensions. In that situation the reform of the pension system in the form of switching to the indexation of pensions for inflation could have had adverse results in 2011 and 2012.
3.2. Methodology for assessing effects of changes in social policy
Analysis of the effects on the population’s welfare of reforms in social policy is performed using the method of assessing the distribution of direct benefits. Disposable resources8 of household members are used as the target variable. Reforms in social policy result in a change in the level and structure of households’ income and expenses, which is reflected in the amount of dispos-able resources. For example, administratively raising prices on “socially significant” goods or housing and utilities will mean a reduction in disposable resources. The sizes of the effect are determined by the amount of the change in prices and percentages of expenses for those goods and services in households’ consumption. In general, the effect of social policy reforms is as-sessed using the formula:
ΔW = ∑ 𝑝𝑖𝑛𝑖=1 ∙(qi – ci)∙Δ1n pi + ∑ 𝑟𝑗
𝑘𝑗=1 ∙Δ1nrj, (1)
where W is households’ disposable resources, 𝑝𝑖 is the price of a good or service i, qi is the pro-duction of a good/ service i within a household, ci is the consumption of the good/ service i by the household, rj is the household income from employment, benefits, the assistance of relatives or some other source j.
In the case of a more detailed analysis of the effects on household expenses of a substantial change in prices relative to their initial level, the model may be made more complex with elas-ticities reflecting changes in the supply of and demand for goods and services dependent on price change. See de Janvry, Sadoule (2008).
ΔW = ∑ 𝑝𝑖𝑛𝑖=1 ∙(qi – ci)∙Δ1n pi + ∑ 𝑟𝑗
𝑘𝑗=1 ∙Δ1nrj +
1
2 ∑ ∑ 𝑝𝑖
𝑛𝑗=1
𝑛𝑖=1 ∙(qi𝜀𝑖𝑗
𝑐 - ci𝜀𝑖𝑗𝑐 )∙Δ1n pi (2)
where 𝜀𝑖𝑗𝑝
is elasticity of demand for a good i at price of the good j, and 𝜀𝑖𝑗𝑐 is elasticity of demand
for good i at price of the good j.
8 Assessed as the sum of money expenditures (including increase in savings) and nonmonetary income from ben-efits and household farming (monetary value of income in kind net of expenses for household farming). Disposable resources are the main indicator of the welfare of the population of Belarus in the analysis of microdata and are used in assessing the indicators of poverty and inequality.

Gleb Shymanovich, Alexander Chubrik
7
However, the effects of a change in the structure of supply and demand are usually insignificant compared with the effects of the first order from a change in prices, and they can be disregarded (Chen, Ravallion, 2004).9
A more detailed methodology for modeling the impact of reforms in social policy on the popu-lation’s welfare is presented in a description of individual reform scenarios.
4. REFORM SCENARIOS
4.1. Pension system
4.1.1. Raising the retirement age
This work studies the impact on the population’s income only of parametric reforms in the pen-sion system. At this time structural reforms are relatively unlikely because of the absence of the necessary internal and external prerequisites.10 Furthermore, modeling their effects requires other approaches and is beyond the scope of the objectives of this study. The most urgent par-ametric reforms in the pension system were presented in World Bank research (2011). In par-ticular, it proposed raising the retirement age and switching to the indexation of pensions for inflation, “decoupling” it from average wages.
The World Bank studied the possibility of raising the retirement age of the entire population from 63 to 65 years. Accordingly, in the context of the proposed reform options, retirement age was raised by a total of 3-5 years for men and 8-10 years for women. Such a scenario, with a sharp increase in the retirement age for women, appears extremely complex to implement, and therefore we shall consider a more balanced reform option –raising the retirement age by five years for men and women.
In the short term, such a reform means that the income structure would change substantially for the population ages 55-60 (women) and 60-65 (men). Most of them would lose the possi-bility of receiving a pension11 and must seek employment possibilities. Considering the short-age of labor resources in Belarus (Akulava, Kirchner, Shymanovich, 2013) and the high level of employment among pensioners in the first years after their reaching retirement age (Shy-manovich, 2013a), we make the assumption that employment for the pre-pension-age popula-tion (55-59 years and 60-64 years, respectively, for women and men) would not be a problem. Nonetheless, part of the population under that scenario would cease to be economically active (concentrating, for example, on housekeeping), and part would encounter unemployment. Ac-cordingly, in modeling it is necessary to take into account the possibility of unemployment of part of the population group affected by reform. Obviously, as a result of raising the retirement age, the role of other income sources might also change – the percentage of income from house-hold farming (retirees have more time to devote to it) or of assistance from relatives would decline. However, on average such income constitutes a relatively small part of the disposable
9 In the case of Belarus the claim concerning the insignificance of the effect of elasticities on the end result was confirmed in Shymanovich (2013b). The study showed that the scale of effects from a change in import tariffs on households’ welfare remains practically unchanged regardless of whether the price elasticity of an import is taken into account or ignored. 10 For example, the creation of pension system savings levels is made difficult by the low level of confidence in the national currency and in long-term savings, in general. 11 Part of the Belarus population is entitled to early retirement on pension, including members of the military and law-enforcement agencies, those who are employed in production with adverse working conditions, etc. However, data from the sample survey of households do not include separate information about the recipients of that form of pension; therefore, we are forced to disregard that group in modeling the effect of raising the retirement age.

Effect of Certain Socioeconomic Policies on the Welfare of Socially Vulnerable Groups
income of the pension- and pre-pension-age population and differs insignificantly,12 which makes modeling the changes in it unadvisable.
Thus, modeling retirement age reform in the context of the methodology for analyzing the dis-tribution of direct advantages entails a mixture of approaches based both on the envelope the-orem and on models describing sources of household income. The modeling includes three el-ements: (1) subtracting pension income for the population group affected by the reform; (2) determining who from the given group would continue working; and (3) assuming what income level would be provided by the continuation of employment. In this connection it should be taken into account that some pensioners would continue to work, receiving both wages and pensions. That is a traditional strategy for overcoming difficulties associated with the increased risk of relative poverty after retiring on pension (IPM Research Center, 2013a). For working pensioners the given reform would unquestionably result in a deterioration in financial condi-tion. And the effect for households would be assessed using the formula:
ΔW = ∑ 𝑞𝑖𝑛𝑖=1 ∙(𝑤𝑖
𝑟 - 𝑤𝑖𝑜) – pi, (3)
where 𝑞𝑖 is the probability of employment of a household member i, that comes under the cri-terion of the added working age, pi is the amount of a pension that a household member i re-ceives, 𝑤𝑖
𝑟 is potential wages, and 𝑤𝑖𝑜 is wages in the case of the original employment of a house-
hold member of retirement age (prior to reform).
The greatest difficulty is posed by trying to assess who in the population of the added working age (55-60 for women and 60-65 for men) would be employed (q = 1), and who not (q = 0). Obviously, there are a number of factors that determine the desire and ability of a person to continue employment, and their role differs considerably depending on the person’s age. Ex-amples of such factors can be the level of education, the characteristics of the labor market in the region of residence, the type of community in which a person lives, the makeup of the house-hold, etc. The data from the sample survey of households makes it possible to assess their in-fluence on the willingness and ability of the population in the pre-retirement age, which is clos-est in age to our analyzed population group, to continue employment. Assuming that the role of said factors would not change with a five-year increase in age, we can predict which population group would be most likely to be unemployed at the added working age.
Analysis of the factors in choosing employment or unemployment will be performed using a probit model based on the sample survey of households in 2007-2012. The sample of pre-pen-sion-age population included a total of 6,320 persons, 6.4% of whom 13 were unemployed. Those who, in response to the question about their socioeconomic status, either answered “other” or couldn’t say were included in the unemployed population in 2012. In previous years the structure of questions about an individual’s socioeconomic status was different, and those who considered themselves nonworking (excluding pensioners and students) and those who indicated that they were employed but couldn’t explain exactly how were counted among the unemployed population. The model was assessed separately for women and men, since calcu-lations showed the existence of differences in the roles of various factors determining the prob-ability of unemployment for men and women.
Among the factors that proved important in overcoming unemployment in the population as a whole, educational level played a substantial role (see Appendix A). The population with a lower level of education is more likely not to continue employment, since it has less chance of employment in high-paid work. Employment opportunity was also substantially lower for rural
12 In 2007-2012, the percentage of income in kind from household farming averaged 5.1% of the disposable re-
sources of the pre-pension-age population and 5% of those of the population in the first five years of retirement age. The
percentages for assistance from relatives were 3% and 2.6%, respectively. 13 Here and subsequently weights are taken into account.

Gleb Shymanovich, Alexander Chubrik
9
residents in Gomel and Mogilev Oblasts, where the labor market in rural areas and small towns has certain difficulties related, among other things, to the accident at the Chernobyl Nuclear Power Plant, and relatively low activity was also seen in using individual strategies for over-coming difficulties (see IPM Research Center, 2013a).
For women the probability of being unemployed also rises in the event of a large household size, which demands greater effort and time spent on housekeeping. In this connection the ex-istence of other breadwinners (adult) is important. Children, on the other hand, are more likely to force women to continue employment, since rearing them requires additional income sources for a family. The modeling results are given in detail in Appendix A.
On the basis of the assessments obtained, the probability of unemployment was calculated for our studied population group at the added working age. On average, the probability of unem-ployment, i.e., the probable percentage of unemployed among men ages 60-65 and women ages 55-60, was 6.4% and 6.1%. Further, a subsample of the unemployed population was singled out. For that, all women and men were divided into three groups depending on their probability of ending up unemployed (see Table 1 and Figure A1 in Appendix A). The first group included people with greater than 75% probability of being unemployed. The size of that group was rel-atively small among both sexes, and yet its members were subsequently viewed as unemployed, i.e., as lacking income in the form of wages. The probability of unemployment among members of the second group exceeded 10%, constituting an average of 15% for men and 12% for women. The corresponding subsample of individuals from the second group was randomly formed based on those probabilities.14 Subsequently the selected individuals were regarded as unemployed. An analogous procedure was also followed for those for whom the probability of being unemployed was less than 10% (the average probability was 4.4% and 4.8% for men and women, respectively). That enabled us to create a subgroup of the unemployed population the profile of which corresponds to the expectations obtained on the basis of an analysis of the un-employment of pre-pension-age people.
Table 1. Distribution of Probability of Unemployment by Population Subgroup
Women Men Percentage of
group structure Average probabil-ity of unemploy-
ment
Percentage of group structure
Average probabil-ity of unemploy-
ment With greater probability (>75%) of unemployment
0.8 91.1 1.3 83.8
With relatively small proba-bility of unemployment (10%-75%)
7.1 12.3 8.9 15.1
With low probability of unem-ployment (<10%)
92.1 4.8 89.8 4.4
Note: Determination of group boundaries was based on analysis of the distribution characteristics presented in figure A1. Source: our estimates.
The next stage of modeling was calculation of the potential wages of a given part of the popula-tion at the added working age, 15 which was classified as employed population. They were also calculated based on factors determining the size of wages of the population of actual pre-retire-ment age. Such factors,16 as shown in Chubrik, Shymanovich (2013), are education level, place of residence, sex and the distinctive features of the macroeconomic environment in a given year. The calculation methodology is presented in detail in Appendix B.
14 Using the “complex samples” functions in SPSS. 15 Here and subsequently – 55-59 years for women and 60-64 years for men. 16 Of those that could be singled out from the microdata of the sample survey of households.

Effect of Certain Socioeconomic Policies on the Welfare of Socially Vulnerable Groups
However, using the potential wage level for the entire population of added working age is illog-ical. A substantial part of pensioners continued to work and originally had income in the form of wages. The research of Chubrik, Shymanovich (2013) showed, however, that the level of wages of working pensioners is often below average. That can be attributed, among other fac-tors, to their having additional income, pensions, that may reduce their incentives for intensive work. Correspondingly, if a person continues working at retirement age without receiving a pension, a change in the pension will probably not affect his/ her income. Moreover, one can assume that if a person of retirement age continues to work throughout the entire year (the period of observations in the sample survey of households), the person’s wages would also not be lower than the potential wages: Employment throughout the entire year may indicate the retention of a high motivation to work and, consequently, high wages. For that reason, the as-sumption was made that for those two groups the size of wages would not change after the reforms. That supposition changes in the base scenario. In addition, calculation was performed of the resulting effect in the event that, for pensioners working for the entire year, not their actual wages but their potential wages were used (alternative scenario, see Table 2.
For the remaining population groups (individuals who did not have “pre-reform” income in the form of wages or who received such income less than 11 months per year), potential wages were used (see Table 2), assessed based on regression parameters for income of the pre-pen-sion-age population from Appendix B.
Table 2. Wages Used in Modeling (depending on original income source)
Existence of wages for more than 10 months per year yes no
Existence of pension Yes Actual (base scenario) and potential (alternative scenario)
Potential
No Actual Potential
4.1.2. Indexation for inflation
Another potential reform in the pension system mentioned in the World Bank report is switch-ing to the indexation of pensions for inflation. In the period considered, the indexation of pen-sions was based on the rate of increase in wages, which made it possible to maintain the re-placement coefficient at around 40%. In the second half of 2013, however, that principle began to be abandoned, and indexation was made not automatically but pursuant to a presidential decree. For example, in July 2013 the indexation of pensions occurred a month earlier than the time stated in the law and because of that did not take into account the full increase in wages for the quarter.17 Subsequently the official media reported that the increase in pensions would occur “to the extent that it does not upset the stability of the pension system.18 Thus, there are signals indicating that in Belarus abandoning the indexation of pensions for the increase in wages appears to be a likely scenario, and switching to their indexation for inflation looks like a realistic solution.
Modeling the effect of that parametric reform for households was based on the formula:
ΔW = ∑ 𝑝𝑖𝑛𝑖=1 ∙(
𝑐𝑝𝑖
𝑟𝑛𝑝− 1), (4)
where pi is the pension income of a household member i, cpi is the average consumer price index for the analyzed year, and rnw is the growth rate of average nominal wages in the ana-lyzed year.
17 http://www.aif.by/ru/social/pensii/item/23294-pensii.html. 18 http://www.belta.by/ru/all_news/society/Dalnejshee-povyshenie-pensij-budet-opredeljatsja-vozmozhnostjami-pensionnoj-sistemy---Mintruda_i_647265.html.

Gleb Shymanovich, Alexander Chubrik
11
Calculation of the effect was also made for the entire 2007-2012 period, since it may differ sub-stantially under conditions of crisis and economic growth. Moreover, even before 2013 pen-sions were sometimes not indexed in full because of crises in the economy (for example, in 2011), but after that the replacement coefficient was restored by a more rapid increase in pen-sions in subsequent periods. In order to take those characteristics into account, the effect was also calculated with an adjustment of the rate of increase with respect to actual pensions rather than nominal wages:
ΔW = ∑ 𝑝𝑖𝑛𝑖=1 ∙(
𝑐𝑝𝑖
𝑟𝑛𝑝− 1), (5)
where rnp is the rate of increase in the nominal average pension.
4.2. Raising rates of recovery of housing and utility costs
Plans for raising housing and utility services rates to the pay-back level have long been men-tioned by economic authorities in Belarus. Moreover, that step has been strongly supported by international financial organizations. Yet as of mid-2013, no appreciable measures to increase the public’s coverage of housing and utility expenses had been taken, and the rate of coverage of costs by rates for the population continued to gradually decline.19 Plans for the socioeco-nomic development of Belarus in 2014 that are under discussion include the possibility of rais-ing housing and utility services rates by 65%. That is due not only to the need to reduce budget expenditures for funding housing and utilities, but also to the desire to hold down the growth in imports and in base inflation under the influence of the population’s income growth. Consid-ering a forecast of 10.5% inflation in 2014, housing and utility services rates may increase by 49.3% relative to the general price level.
This work assesses the impact of such a rate increase on the population’s welfare, given other unchanged conditions. The period under consideration, as in the case of pension system re-forms, covers 2007-2012, which makes it possible to trace how the potential effect of raising housing and utility services rates changed over recent years. The effect of raising rates will be assessed using the formula:
ΔW = -U∙Δt , (6)
where U is households’ actual expenses to pay for housing and utilities, and Δt is the change in rates. Since raising rates might result in a reduction in the consumption of some services, the effect was also calculated taking into account price elasticity of demand for housing services. Based on equation (2), the effect can be assessed using the formula:
ΔW = -U∙Δt - 1
2 𝑈∙Δt2∙e = -U∙Δt (1 +
𝑒 ∙Δ𝑡
2), (7)
where e is elasticity of demand for housing services in terms of price.
The given formula was used in the World Bank study (2011) for an analogous analysis of the effect of raising housing and utility services rates. In the base scenario the researchers assumed that elasticity equaled -0.285. That elasticity value will also be used in the present study.
4.3. Reforms in the social support system
The main areas of reforming the social support system are eliminating privileges, which typi-cally are relatively untargeted, and further expanding targeted social assistance.
Rationalization of the privileges system occurred in Belarus in 2007, as a result of which a large number of privileges were withdrawn. A relatively small part of them, such as reduced-price
19 In December 2012 the recovery rate was around 22%, http://www.nest.by/news/2013-01-15/tarify-na-osnov-nye-uslugi-zhkkh-s-1-yanvarya-2013-goda-povysheny.

Effect of Certain Socioeconomic Policies on the Welfare of Socially Vulnerable Groups
travel for pensioners on local transit during the summer or on urban transit for students, were subsequently restored, but the scale of state funding of reduced-price public services was sub-stantially reduced (see World Bank, 2011). The need for optimizing the privileges system is related to the fact that in most cases they cannot be accurately targeted. Access to privileges may even improve with an increase in the population’s prosperity, which was confirmed by relevant studies by the World Bank and the IPM Research Center. In the first volume of the Public Expenditure Review (2011), the World Bank proposed fully eliminating the privileges system. The effect of such a reform is indirectly assessed by the IPM Research Center in its year-book, Bednost i sotsialno-uyazvimyye grupy v Belarusi [Poverty and Socially Vulnerable Groups in Belarus] in calculating the Laeken indicators. In the present work corresponding calculations are made for 2007-2012.
It is proposed to compensate for the elimination of privileges and raising of rates on housing and utilities for socially vulnerable groups by increasing the targeted social assistance system. At present it includes a monthly social benefit that depends on households’ individual income, a simultaneous benefit in the event of unexpected adverse circumstances, assistance in acquir-ing social rehabilitation devices, and allowances for acquiring incontinence pads (for disabled children and adults) and for food for children under two years old.
A key element in the system of targeted social assistance is the monthly social benefit. It is pro-vided for no more than six months a year to households with a per capita income below the minimum subsistence budget. The amount of the benefit is determined by the difference be-tween a household’s total minimum subsistence budget and its actual income, i.e., by the depth of absolute poverty. Such a mechanism for providing the benefit has not proved to be very ef-fective in the case of Belarus, which is due the low depth of absolute poverty (see IPM Research Center, 2013) and the existence of certain costs of applying for the benefit. In 2012 it was granted to 136,400 persons. Given an absolute poverty level20 of 6.6%, that means that only 22% of potential recipients took advantage of the benefit. The average amount of the benefit of Rbl 184,900 per month (22.4% of the subsistence minimum) explains the relative lack of inter-est in it on the part of the disadvantaged population.
The solution to the problem is to raise the need criterion. The World Bank report (World Bank, 2011) proposes a criterion of 1.5 times the minimum subsistence budget for providing housing subsidies to offset the increase in housing and utility services rates for socially vulnerable pop-ulation groups. An alternative might be establishing at that level the criterion for providing the monthly social benefit and a corresponding increase in the maximum possible size of the ben-efit. That measure is supposed to make it possible to reduce the negative effects of raising hous-ing and utility services rates and of eliminating privileges for absolutely poor and relatively poor population groups. The present study evaluates the extent to which those expectations are warranted.
Modeling the social effect of increasing the targeted social assistance benefit, in addition to pro-posals concerning its size/ the criterion for providing it, also requires an assessment of the in-clination of potential recipients to apply for the benefit. Assuming that the key obstacle to re-ceiving a benefit at this time is the shallow depth of poverty, the main task in that case is to calculate the upper limit above which it appears that an application for the benefit will not oc-cur. Since only 22% of the absolutely poor population apply for the benefit, the amount of in-come of precisely 22% of the poor might be considered the cut-off criterion. In 2012 the mon-etary income of that population group was 13.4% below the minimum subsistence budget (Rbl 110,900). Thus, one can presume that using the new criterion for providing targeted assistance,
20 According to the methodology used by the IPM Research Center (see, for example, IPM Research Center, 2013).

Gleb Shymanovich, Alexander Chubrik
13
only those whose income is 136.6%[sic] below the minimum subsistence budget would apply for it. Accordingly, the effect of this reform is assessed using the formula:
ΔW = (1.5M – PR)∙n, if (PR < 1.366M), (8)
where M is the average minimum subsistence budget per capita for the analyzed year, PR is a household’s per capita monetary income, and n is the number of household members.
5. MODELING RESULTS
5.1. Pension reform
5.1.1. Raising the retirement age
The chief financial effects of raising the retirement age are due to the fact that part of the pop-ulation would lose the ability to receive a guaranteed income in the form of a pension but would be more likely to receive an income from employment. Such a change would substantially change the characteristics of the disposable resources of the population group ages 55-59 for women and 60-64 for men. A positive effect would be due to the fact that the level of average wages is significantly higher than the average pension (the coefficient of replacement in Belarus has traditionally been close to 40%). However, first of all, at an age close to the retirement age the level of wages starts to decline, which reduces the potential positive effect from obtaining wages in lieu of a pension. Second, during the first retirement age years a substantial part of the Belarus population continues to work, receiving a pension and wages simultaneously (in 2007-2012, 41% of the population at an age no more than five years above the retirement age re-ceived income from employment for 11-12 months a year). Thereby, the given group eliminates the risk of absolute and relative poverty and also increases savings for use after finally quitting work. As a result of the reform, that possibility of receiving additional income would disappear, which would negatively impact the financial condition of part of the population. Third, the de-gree of differentiation in wages is much greater than with pensions, which would contribute to increasing inequality among the population at the added working age. Fourth, not everyone is able to get a job, especially at an advanced age, since either their skills do not correspond to the demand in the labor market, or they themselves prefer (or are forced) to concentrate on house-keeping.
Taking these factors into account, one might assume that the short-term effect of raising the retirement age would not necessarily be positive for the population group affected by that re-form. Modeling results confirm those expectations. For the population as a whole, the effect on disposable resources21 of changing the structure of income by virtue of raising the retirement age is positive. However, the size of the positive effect is not great (0.4% per year, on average, for 2007-2012 under the base scenario, whereby the potential wage level applies only to those former pensioners who were not employed or were employed less than 11 months a year), and was provided during the earlier, precrisis years. Amid the crises of 2009 and 2011, the average effect on disposable resources proved to be close to neutral.22
The effect of a change in income structure is unevenly distributed, and the greatest gains are realized by the socially vulnerable population groups. On average, in 2007-2012 the positive effect for the absolutely poor under the base scenario was 3% of disposable resources per year
21 The effect is calculated in the form of the average arithmetical percentage of change in households’ disposable resources. That approach makes it possible to make a comparison by years. 22 In nominal terms, the total effect for the whole population in 2009-2012 was negative. However, converting the
effect to proportions of disposable resources changes the sign from negative to positive on account of an uneven distri-
bution of the effect. The greatest negative effect in monetary terms was seen among relatively privileged households,
which made their relative loss (as a percentage of disposable resources) not so great. On the contrary, even a relatively
small absolute increase in disposable resources for the poor population results in a substantial relative increase in their
disposable resources.

Effect of Certain Socioeconomic Policies on the Welfare of Socially Vulnerable Groups
(3.7% for the relatively poor). And for the relatively nonpoor population group, the effect in most of the years considered was negative. In the case of the scenario under which wages also changed from actual to potential for those pensioners who were employed (more than 10 months of the year studied) originally, the effect changed to positive (excluding 2011). Another feature is the fact that the positive effect for the relatively poor population remains high even amid crisis (see Table 3), which indicates the high role of employment as a means of overcoming poverty.
Table 3. Effect of Raising the Retirement age on the Population’s Disposable Resources
2007 2008 2009 2010 2011 2012 average. 2007-2012
Scenario using potential wages only for pensions who were originally not working and those who were employed less than 11 months per year (base) population average 0.8 0.7 0.2 0.5 0.1 -0.1 0.4 absolutely poor 2.6 2.4 2.5 4.7 4.2 2.1 3.0 absolutely nonpoor 0.6 0.5 0.0 0.2 -0.2 -0.2 0.2 relatively poor 3.5 2.7 3.5 4.7 2.9 5.0 3.7 relatively nonpoor 0.4 0.4 -0.2 -0.1 -0.3 -0.7 -0.1 Scenario using potential wages for all pensioners, excluding those who originally worked while declining pensions population average 1.2 1.2 0.4 0.8 0.4 0.1 0.7 absolutely poor 3.1 2.7 2.7 5.1 4.5 2.2 3.3 absolutely nonpoor 0.9 1.1 0.2 0.5 0.1 0.0 0.5 relatively poor 4.2 2.9 3.6 5.2 3.4 5.2 4.1 relatively nonpoor 0.7 1.0 0.0 0.2 0.0 -0.5 0.2
Source: own estimates.
Such a distribution of effect in favor of the poor is attributable to the fact that the population group directly affected by the reform is characterized by a high risk of relative poverty. The average risk of relative poverty among pensioners has traditionally been among the highest because the Belarus pension system provides for a substantial redistribution of income. Conse-quently, the income differentiation among pensioners is considerably lower than among people of pre-retirement age. And the average pension greatly exceeds the absolute poverty line (see IPM Research Center, 2013a). Accordingly, a change in the income structure from pensions to potential wages significantly increases the prosperity of that population group. The problem is that, in practice, in not all cases would men ages 60-65 and women ages 55-60 be able to main-tain employment/ get jobs and receive the potential wages. Moreover, the state of the labor market in the country as a whole and in certain regions may deprive elderly people of the ability to receive the potential wages in full.23 Finally, some people affected by the reform may have difficulties getting a job on account of their health (the average life expectancy for men age 60 is only 15 years).
For population groups the greatest reduction from implementation of the reform occurs in the income of working pensioners (up to 10.5% of disposable resources per capita for the house-hold of a working pensioner; see Appendix C). Since the proportion of them is highest in Minsk and Minsk Oblast, those are the regions that would experience negative consequences from a change in the retirement age. On the other hand, household groups of which a substantial per-centage are households with nonworking pensioners would come out ahead. Among such households the increase in disposable resources is around 4.5%. Such groups include one-per-son households, the population of Gomel Oblast, and rural residents. However, this positive ef-fect is possible only provided that conditions for employment at an advanced age exist. And at present the economic activity of the population is low in rural areas, especially in Gomel Oblast.
23 The problem of local labor markets has been partly taken into account in calculating potential wages. However, the approach we use cannot take into account potential future negative trends in the country’s economy.

Gleb Shymanovich, Alexander Chubrik
15
The increase in incomes of socially vulnerable groups would not make it possible to reduce the scale of absolute poverty (see Appendix D, Table D1). If the reform had been carried out in 2011-2012 absolute poverty would have even increased. The reason is that initially the level of absolute poverty among pensioners would be extremely low, and postponing retirement on pension would deprive part of that population group of an extremely important source of in-come, while retaining (and possibly even increasing) the risk of economic inactivity and unem-ployment for part of the group (6.2% of the group would find themselves unemployed, accord-ing to the methodology). Accordingly, that group would encounter an increased risk of absolute poverty. Moreover, previously employed pensioners’ loss of additional income in the form of a pension could result in a substantial deterioration in the condition of households in the event of their having dependent members). Under the base scenario, in 2007-2012 the level of abso-lute poverty among originally employed pensioners increases, on average, from 1% to 3.3% per year (see Appendix D1, Table D1).24 Thus, in the population group no more than five years older than the working age, a substantial change occurs in the distribution of the population by in-come: Some of the population gains from getting the possibility of continuing to work and solves the problem of relative poverty, while another part, to the contrary, loses guaranteed income from pensions and ends up below the absolute poverty level.
Over the long term, the negative consequences might be eased by the fact that pensioners would be able to receive a larger pension because of their increased length of service (World Bank, 2011). However, all the positive effects from the given reform are possible only on the condition that the population is employed at the added working age. In modeling we made the assump-tion that only 6.2% of that group would be unemployed. Considering that 41% of that group is already employed, that means that an additional 2.4% of the population would be entering the labor market.25 It is unknown to what extent that additional labor supply would be absorbed by companies, even amid the current labor shortage in some sectors, since the specialization, skills and abilities of that population group might not match the demand. Moreover, the mobil-ity of that part of the workforce is fairly limited. And if people at the new pre-retirement age get jobs in accordance with the indicated probability, there could be a problem of their displac-ing young people, with a resulting rise in youth unemployment. Moreover, in the absence of reforms in the labor market, the retention of employment might occur at state-owned enter-prises to the detriment of economic efficiency in the form of excess employment.
Raising the retirement age would substantially reduce the burden on Belarus’s pension system, but this reform’s potential in Belarus is considerably limited by the need to provide for an ade-quate period of life on pension, especially for men. Moreover, the modeling results, for all their conditionality, show that raising the retirement age does not result in improving the financial condition of the population affected by the reform, even if they do successfully find employ-ment. Finally, the lack of preparedness of the labor market for an increase in the retirement age might result in a high risk of poverty among the population of added working age, thereby de-priving it of the possibilities provided by the strategy of maintaining employment while simul-taneously receiving a pension.
5.1.2. Indexation of pensions for inflation
The thrust of the impact of switching to the indexation of pensions for the inflation rate rather than for the rate of increase in wages depends on the macroeconomic situation in the country. In a period of economic growth, accompanied by an increase in real wages, such a reform re-
24 The highest level of economic activity among pensioners was seen in 2011-2012, which caused raising the re-tirement age during those years to have a negative impact on the absolute poverty level. 25 In all, the group of the population employed at ages 55-60 for women and 60-65 for men would constitute 5.9% of the
population.
Effect of Certain Socioeconomic Policies on the Welfare of Socially Vulnerable Groups
sults in improving pensioners’ financial condition relative to the employed population. Con-versely, amid a crisis, when a decline in real wages is possible, indexing pensions for inflation may contribute to strengthening pensioners’ social security and increasing their relative finan-cial well-being.
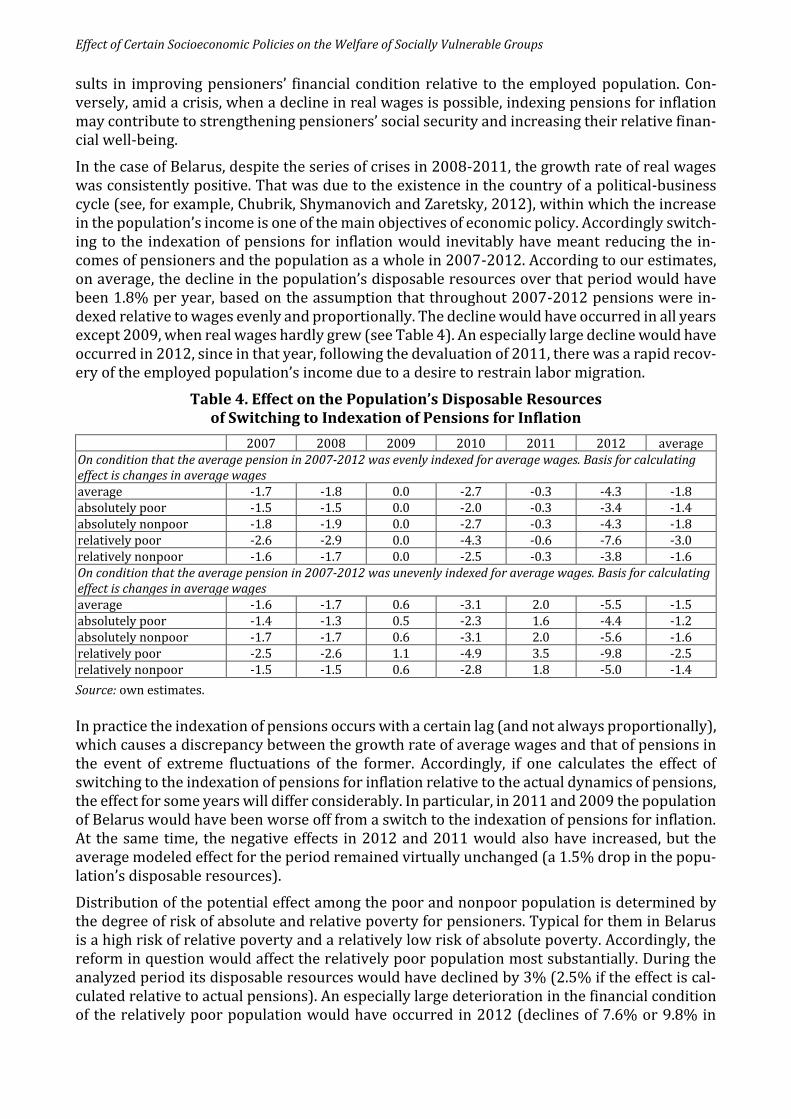
In the case of Belarus, despite the series of crises in 2008-2011, the growth rate of real wages was consistently positive. That was due to the existence in the country of a political-business cycle (see, for example, Chubrik, Shymanovich and Zaretsky, 2012), within which the increase in the population’s income is one of the main objectives of economic policy. Accordingly switch-ing to the indexation of pensions for inflation would inevitably have meant reducing the in-comes of pensioners and the population as a whole in 2007-2012. According to our estimates, on average, the decline in the population’s disposable resources over that period would have been 1.8% per year, based on the assumption that throughout 2007-2012 pensions were in-dexed relative to wages evenly and proportionally. The decline would have occurred in all years except 2009, when real wages hardly grew (see Table 4). An especially large decline would have occurred in 2012, since in that year, following the devaluation of 2011, there was a rapid recov-ery of the employed population’s income due to a desire to restrain labor migration.
Table 4. Effect on the Population’s Disposable Resources of Switching to Indexation of Pensions for Inflation
2007 2008 2009 2010 2011 2012 average On condition that the average pension in 2007-2012 was evenly indexed for average wages. Basis for calculating effect is changes in average wages average -1.7 -1.8 0.0 -2.7 -0.3 -4.3 -1.8 absolutely poor -1.5 -1.5 0.0 -2.0 -0.3 -3.4 -1.4 absolutely nonpoor -1.8 -1.9 0.0 -2.7 -0.3 -4.3 -1.8 relatively poor -2.6 -2.9 0.0 -4.3 -0.6 -7.6 -3.0 relatively nonpoor -1.6 -1.7 0.0 -2.5 -0.3 -3.8 -1.6 On condition that the average pension in 2007-2012 was unevenly indexed for average wages. Basis for calculating effect is changes in average wages average -1.6 -1.7 0.6 -3.1 2.0 -5.5 -1.5 absolutely poor -1.4 -1.3 0.5 -2.3 1.6 -4.4 -1.2 absolutely nonpoor -1.7 -1.7 0.6 -3.1 2.0 -5.6 -1.6 relatively poor -2.5 -2.6 1.1 -4.9 3.5 -9.8 -2.5 relatively nonpoor -1.5 -1.5 0.6 -2.8 1.8 -5.0 -1.4
Source: own estimates.
In practice the indexation of pensions occurs with a certain lag (and not always proportionally), which causes a discrepancy between the growth rate of average wages and that of pensions in the event of extreme fluctuations of the former. Accordingly, if one calculates the effect of switching to the indexation of pensions for inflation relative to the actual dynamics of pensions, the effect for some years will differ considerably. In particular, in 2011 and 2009 the population of Belarus would have been worse off from a switch to the indexation of pensions for inflation. At the same time, the negative effects in 2012 and 2011 would also have increased, but the average modeled effect for the period remained virtually unchanged (a 1.5% drop in the popu-lation’s disposable resources).
Distribution of the potential effect among the poor and nonpoor population is determined by the degree of risk of absolute and relative poverty for pensioners. Typical for them in Belarus is a high risk of relative poverty and a relatively low risk of absolute poverty. Accordingly, the reform in question would affect the relatively poor population most substantially. During the analyzed period its disposable resources would have declined by 3% (2.5% if the effect is cal-culated relative to actual pensions). An especially large deterioration in the financial condition of the relatively poor population would have occurred in 2012 (declines of 7.6% or 9.8% in

Gleb Shymanovich, Alexander Chubrik
17
disposable resources, depending on basis). For the absolutely poor, the effect of the reform would have been lower than the countrywide average.
On the whole, the consequences of the reform in question would affect those population groups in which the percentage of pensioners is relatively high. In particular, based on the gender cri-terion, it would be women; based on place of residence, it would be rural areas; based on region, it would be Gomel, Vitebsk and Mogilev Oblasts; and based on type of household, it would be one-person households and the families of pensioners (see Appendix C). For nonworking pen-sioners the decline in the disposable resources of the households in which they live would av-erage 5%-6%. That effect would be slightly offset (to 3%-3.5%) if the pensioner continued to work. However, a possible simultaneous reform in the retirement age would probably deprive pensioners of that additional source of income.
On the whole, the poverty level as a result of switching to the indexation of pensions would not increase greatly – by an average of 0.5 percentage points for the population as a whole (see Appendix D). However, over the long term, as the effect of the discrepancy between the wage dynamics and pension dynamics accumulated, the social vulnerability of pensioners (and pov-erty level as a whole) could rise substantially. For example, in modeling the switch to the index-ation of pensions relative to their actual dynamics in 2012 (the period with the maximum rate of increase in real pensions), the poverty level increases by 1.8 percentage points.
5.2. Raising housing and utility services rates
Raising housing and utility services rates would inevitably result in a deterioration in the pop-ulation’s financial condition. However, the negative social consequences of that reform might not be so high. The most housing and utility services are consumed by the relatively privileged households, and they accordingly receive the highest subsidies. Belarus’s disadvantaged house-holds often lack access to all utility services, since a sizeable percentage of them live in small towns and rural areas. Because of that, in recent years in Belarus certain measures have been adopted to raise rates for the financially privileged population groups. The main difficulty in doing so is determining the criterion for being highly privileged financially, which considerably limits the effectiveness of the measures that have been taken.26
Nonetheless, the modeling results do not support the hypothesis that raising rates would not substantially affect the socially vulnerable population groups. The main shortcoming in opin-ions cited above concerning the relative lack of targeting of housing and utility rate subsidies is that they are based on the absolute sizes of the subsidies received by households. If subsidies are converted to percentages of disposable resources, their role proves to be much higher for disadvantaged households. Consequently, in 2007-2012 raising the rate levels on the scale planned for 2014 (by 49.3% relative to the overall price level) would have resulted in a decline in the population’s disposable resources by an average of 2.6% per year, including a decline of 3.8% for the absolutely poor population. If the analysis takes into account a possible decline in the consumption of housing and utility services on account of an increase in their price, the negative effect would come to 2.2% and 3.3% of disposable resources for the population as a whole and the absolutely poor population, respectively.
If one compares the effect for the relatively poor and nonpoor population groups, the discrep-ancy becomes even greater (see Table 5). It reaches a maximum value in 2010. A subsequent decline in the discrepancy is partly due to the introduction of higher housing and utility services rates for the owners of homes of greater luxury, as well as owners of empty or leased apart-ments. Also, a general decline in the negative effect closer to 2012 is related to a drop in the
26 A household’s being highly privileged is determined by living space, the existence of conveniences, number of persons living in it, etc.

Effect of Certain Socioeconomic Policies on the Welfare of Socially Vulnerable Groups
coverage of costs by rates and reduction in the percentage of the population’s disposable re-sources spent on housing and utilities.
Table 5. Effect of Raising Housing and Utility Rates on the Population’s Welfare, % of Disposable Resources
2007 2008 2009 2010 2011 2012 average On condition of zero price elasticity of demand for housing and utility services average -3.1 -2.8 -3.0 -2.8 -2.2 -1.7 -2.6 absolutely poor -4.3 -4.0 -3.9 -4.2 -3.4 -2.6 -3.8 absolutely nonpoor -2.9 -2.7 -2.9 -2.7 -2.1 -1.6 -2.5 relatively poor -4.3 -4.1 -4.2 -4.2 -3.4 -2.6 -3.8 relatively nonpoor -2.9 -2.7 -2.8 -2.6 -2.1 -1.5 -2.4 On condition of -0.285 price elasticity of demand for housing and utility services average -2.6 -2.4 -2.6 -2.4 -1.9 -1.4 -2.2 absolutely poor -3.7 -3.4 -3.3 -3.6 -2.9 -2.2 -3.3 absolutely nonpoor -2.5 -2.4 -2.5 -2.3 -1.8 -1.4 -2.1 relatively poor -3.7 -3.5 -3.6 -3.6 -2.9 -2.2 -3.3 relatively nonpoor -2.5 -2.3 -2.4 -2.2 -1.8 -1.3 -2.1
Source: own estimates.
Among the socially vulnerable population groups, the greatest drop in income due to a rate increase would be seen in single-parent families and one-person households (se Appendix C). A substantial deterioration in their financial condition is due to the lack of economy of scale occurring in larger households. The condition of pensioners, especially unemployed ones, would also be significantly worse, since, on the one hand, housing and utility expenses consti-tute a substantial part of their disposable resources, and on the other, one-person households are often found in precisely that group. In terms of place of residence, the main discrepancy in the effect of a rate increase is between rural residents and residents of big cities, which confirms the limited access of the rural population to housing and utility services. On the whole, the re-form in question, without offsetting measures in the form, for example, of an expansion of tar-geted social assistance, would result in raising the absolute poverty level by an average of 1 percentage point (0.6 percentage points in 2012) over the analyzed period.
5.3. Reforms in the social support system
Privileges in Belarus are categorical and therefore are relatively untargeted and are considered a fairly ineffective social policy tool for supporting the welfare of vulnerable population groups.27 Accordingly, the complete elimination of privileges and allocation of the resources thereby freed up to the funding of more highly targeted social policy tools could have a positive effect on the financial condition of socially vulnerable population groups. Without that step, eliminating privileges would significantly worsen the welfare of poor population segments. Whereas in absolute terms privileges are distributed fairly evenly, as a percentage of disposable resources their role turns out to be much greater for poor households. Moreover, in 2011-2012 there was a certain general improvement in the targeting of privileges. Consequently, eliminat-ing privileges would have resulted in a decline in the disposable resources of the absolutely poor population by an average of 2.5% over the period in consideration, but by only 1% for the nonpoor. The most socially vulnerable population would have suffered if that reform had been conducted in 2008-2009 (see Table 6). For that period the privileges eliminated in 2007 had not yet been partially restored, so the extent to which they were targeted was relatively high, and the condition of the budget made it possible to follow a fairly soft fiscal policy, with greater funding of social policy and of privileges, in particular. (see World Bank, 2011).
27 A 1-percentage point reduction in privileges as a percentage of disposable resources produces the least increase in
poverty compared with other forms of social assistance. See IPM Research Center, 2013a.

Gleb Shymanovich, Alexander Chubrik
19
Table 6. Effect of Changes in Social Support System on Population’s Welfare, as % of Disposable Resources
2007 2008 2009 2010 2011 2012 average Elimination of privileges average -1.5 -1.2 -1.1 -1.1 -0.9 -.09 -1.1 absolutely poor -2.5 -3.2 -2.8 -2.5 -1.9 -1.8 -2.5 absolutely nonpoor -1.4 -1.0 -1.0 -1.0 -0.8 -0.9 -1.0 relatively poor -2.3 -2.3 -2.3 -2.1 -1.6 -1.8 -2.1 relatively nonpoor -1.4 -1.0 -1.0 -0.9 -0.8 -0.8 -1.0 Increase in targeted social assistance average 5.7 4.7 4.1 3.0 3.7 2.5 4.0 absolutely poor 34.8 35.6 34.7 27.9 29.7 21.4 31.3 absolutely nonpoor 2.3 2.1 1.7 1.2 1.8 1.2 1.7 relatively poor 31.9 26.6 26.6 19.5 22.4 16.6 24.1 relatively nonpoor 2.1 1.6 1.2 0.7 1.3 0.8 1.3 Net effect of eliminating benefits, raising housing and utility rates and increasing targeted social assistance average 1.1 0.7 0.0 -0.9 0.6 -0.1 0.3 absolutely poor 28.1 28.4 28.1 21.2 24.4 17.0 25.1 absolutely nonpoor -2.0 -1.7 -2.1 -2.4 -1.1 -1.3 -1.8 relatively poor 25.3 20.1 20.2 13.1 17.4 12.3 18.2 relatively nonpoor -2.2 -2.1 -2.5 -2.8 -1.5 -1.6 -2.1
Source: own estimates.
The last of the social policies being considered is raising the need criterion under which a monthly benefit is provided in the context of targeted social assistance, to 150% of the mini-mum subsistence budget. Such an increase would make it possible to offset for the population the negative consequences of raising housing and utility rates and eliminating privileges. On average, that measure would have increased the population’s disposable resources over the 2007-2012 period by 4% per annum, with a net negative effect from higher housing and utility rates and the elimination of privileges of 3.7% per annum. In 2012 itself, against the backdrop of a rapid recovery of the population’s income following the crisis, the effects would have been practically equal, at 2.5% and 2.6%, respectively, of disposable resources (see Table 6). How-ever, the distribution of negative and positive effects from those three reforms by population groups differs considerably, which changes the profiles of socially vulnerable groups.
Raising the criterion for targeted social assistance in 2012 would have resulted in a 2.5% in-crease in average disposable resources, while they would have risen by 21.4% for the abso-lutely poor. The average difference for the period is even greater – 31.3% and 4%, respectively. The reason for such an effect lies in the high degree to which said measure, theoretically, is targeted. Consequently, it makes it possible not simply to offset the loss of income for the poor from the rise in housing and utility rates and elimination of privileges, but also to increase their disposable resources by 17% (in 2012). On the other hand, the nonpoor population would ex-perience a 1.3% reduction in disposable resources. The result of such an increase in the income of the poor is a reduction in the level of absolute poverty from 6.6% to 4.5% in 2012. In other years the effect is even greater (from 7.6% to 4.1%, on average, for 2007-2012).
However, the positive changes resulting from the reforms in the social support system do not affect all socially vulnerable groups. In particular, an overall reduction in disposable resources is seen in pension-age people, regardless of their employment, and in one-person households (see Appendix C). Accordingly, the poverty risk for them is either reduced insignificantly or increases slightly. The greatest gains from raising the need criterion are realized by children and single-parent families (for the 2007-2012 period, on average, absolute poverty in those groups drops from 13.5% and 17.9% to 6.5% and 11.9%, respectively; see Table D2), and by the unemployed working-age population (from 16.3% to 7.9%).

Effect of Certain Socioeconomic Policies on the Welfare of Socially Vulnerable Groups
That positive effect for the economically inactive population cannot always be considered de-sirable, since it might contribute to a further decline in their activity, a faster reduction in the labor supply, and an increase in budget expenditures. Overall, budget expenditures for funding increased support would have been 0.5% of GDP in 2012,28 which is not entirely in keeping with plans for the fiscal tightening required to maintain macroeconomic stability in Belarus. However, taking into account the reduction in budget expenditures for funding the privileges system29 and the savings in resources from raising housing and utility services rates,30 the in-crease in expenditures for providing targeted social assistance in the amount indicated looks perfectly acceptable.
6. CONCLUSIONS
The urgency of reforms in social policy in Belarus is due to a number of reasons. First of all, there is a need for fiscal tightening, including in the form of reducing social expenditures, in order to eliminate imbalances in the external sector. Second, the level of general government revenues amid the slowdown in economic growth remains sufficiently low that a rationaliza-tion of the structure of expenditures is needed. Third, the existing social protection system is incapable of effectively coping with the challenges of the aging of society, which are becoming increasingly acute for Belarus. Fourth, implementation of structural reforms would inevitably result in changing income distribution in the economy and change the profiles of the socially vulnerable groups, which would, in turn, require adaptation of the social protection system. Response to the challenges cited requires both short-term and long-term measures of a struc-tural nature. However, most of the reforms in the social sector that are being discussed are parametric in nature. For example, it is proposed to raise the retirement age, revise the criteria for indexing pensions, raise rates for housing and utility services and public transit, and other such measures.
This work assesses the social consequences of certain parametric reforms: raising the retire-ment age, switching to the indexation of pensions for inflation, raising housing and utility rates, eliminating benefits in kind and raising the need criterion (for allocating the monthly benefit in the context of targeted social assistance) from 100% to 150% of the minimum subsistence budget as a compensatory measure.
In the event of raising the retirement age, the average direct impact on the population group affected by the reform would be neutral, but that is on the condition that that group does not encounter problems with employment. A negative effect would occur for those who under the current retirement age would continue to work after retirement on pension (receiving both wages and pension). That strategy is widespread among the population during the first five years after reaching retirement age.
“Decoupling” pensions from wage changes and subsequently indexing them for inflation would negatively affect pensioners’ incomes in a situation of economic growth. However, in a situation of stagnation, which threatens Belarus, that step would result neither in changing pensioners’ incomes nor in improving the stability of the pension system.
The social costs of reforming housing and utility rates and the privileges system are, in theory, considered relatively small because of the poor targeting both of housing and utility subsidies
28 The average benefit would have been 330,100 per month, and 13.6% of the population would have received it. Total expenditures would have been Rbl 212.4 bil. 29 According to World Bank estimates, expenditures for funding the system of benefits in kind in 2010 amounted to approximately 0.5% of GDP (World Bank, 2011). 30 According to our estimates based on the results of modeling the effect of raising utility rates (not counting the possible reduction in their consumption), additional housing and utility revenues (and consequently, savings in budgetary resources) would have been around 0.7% of GDP in 2012.
Gleb Shymanovich, Alexander Chubrik
21
and of privileges. In practice, however, expenditures on housing and utilities and income in the form of privileges play the greatest role in the welfare of Belarus’s least privileged population. Accordingly, socially vulnerable groups would suffer from raising rates and eliminating privi-leges more than the population on average. Single-parent families, single people and pensioners are especially vulnerable to raising housing and utility rates. They might encounter a substan-tial increase in the risk of absolute poverty.
Thus, any reforms in the area of social policy aimed at rationalizing public expenditures require the prompt adoption of additional compensatory measures for social protection of population groups vulnerable to reforms. In particular, raising the criterion for granting the monthly tar-geted social benefit to 150% of the minimum subsistence budget would make it possible to offset the negative consequences of a rate increase and elimination of privileges for most of the socially vulnerable population (excluding pensioners), and also would significantly reduce pov-erty among children and the unemployed. That option for overcoming the negative conse-quences of rationalizing public expenditures, however, is not optimal, since it might distort in-centives for finding work or better-paid work. Nonetheless, public expenditures for paying even such a benefit prove comparable to the expenditures that the state presently incurs for funding the privileges system.
Both proposed parametric changes in fiscal and social policy and structural reforms require, in addition to compensatory measures, a revision of the employment assistance system. The need to provide for greater mobility of labor resources against the backdrop of an increased labor supply at the age above the working age will require additional active policy measures in the labor market. Attention should be paid to developing a system for personnel retraining and employment incentives, while simultaneously increasing the social protection of the unem-ployed population.
REFERENCES
Akulava, M., Kirchner, R., and Shymanovich, G (2013). “Current Trends and Challenges in Bela-rus’s Labor Market,” IPM Research Center, Policy Paper, PP/02/13.
World Bank (2003). A User’s Guide to Poverty and Social Impact Analysis, Poverty Reduction Group (PRMPR) and Social Development Department (SDV), Washington, DC, USA.
World Bank (2011). Belarus Public Expenditure Review: Fiscal Reforms for a Sustainable Eco-nomic Recovery. Part 1, Report 63566-BY.
World Bank (2012). Belarus Country Economic Memorandum: Economic Transformation for Growth, report 66614-BY.
IPM Research Center (2013a). Bednost i socialno uyazvimyye gruppy v Belarusi [Poverty and So-cially Vulnerable Groups in Belarus], yearbook.
IPM Research Center (2013b). Kratkosrochnyye tendentsii v ekonomike Belarusi: VVP [Short-Term Trends in the Economy of Belarus: GDP], 5/2013.
Kuzmych, G. (2013). “How to Improve the Stability of the Pension System,” Financy i audit [Fi-nances and Audit], 11 (238), 21-35.
Chubrik, A., and Shymanovich, G. (2008). “Effect of Demographic Trends on the Stability of Bel-arus’s Unfunded Pension System,” in Chubrik, A. (Ed.), Pensionnaya sistema Belarusi: otnosheniye naseleniya i scenario izmeneniy [Belarus’s Pension System: Population’s Atti-tude and Scenarios for Change]. Minsk IPM Research Center.
Chubrik, A., and Shymanovich, G. (2013). “Return on Education and Assessment of Human Cap-ital in Belarus,” Working Paper, WP/13/02, IPM Research Center.
Effect of Certain Socioeconomic Policies on the Welfare of Socially Vulnerable Groups
Chubrik, A., Shymanovich, G., and Zaretsky, A. (2012). “Long-Term Prospects for the Belarus Economy After the Balance of Payments Crisis,” IPM Research Center, Working Paper, WP/12/03.
Shymanovich (2013a). “Challenges for Belarus’s Economic Policy Related to the Aging of the Population,” IPM Research Center, Commentary, 01/2013.
Shymanovich (2013b). “Social Consequences of Belarus’s Accession to the WTO,” IPM Research Center, Discussion Material, PDP/13/08.
Chen, S., and Ravallion, M. Welfare Impacts of China’s Accession to the World Trade Organiza-tion,” World Bank Economic Review, 18(1), 29-57.
Bourguignon, F. and Ferreira, F. (2005). “Decomposing Changes in the Distribution of House-hold Incomes: Methodological Aspects. In: Bourguignon, F., Ferreira, F., and Lustig N. (Eds.). The Microeconomics of Income Distribution Dynamics in East Asia and Latin Amer-ica. New York, Oxford University Press.
Essama-Nssah, B. (2005). “The Poverty and Distributional Impact of Macroeconomic Shocks and Policies: A Review of Modeling Approaches,” World Bank Policy Research Working Pa-per, 3682.
Kruk, D., and Bornukova, K. (2013). “Decomposition of Economic Growth in Belarus,” FREE Pol-icy Brief, October 13.
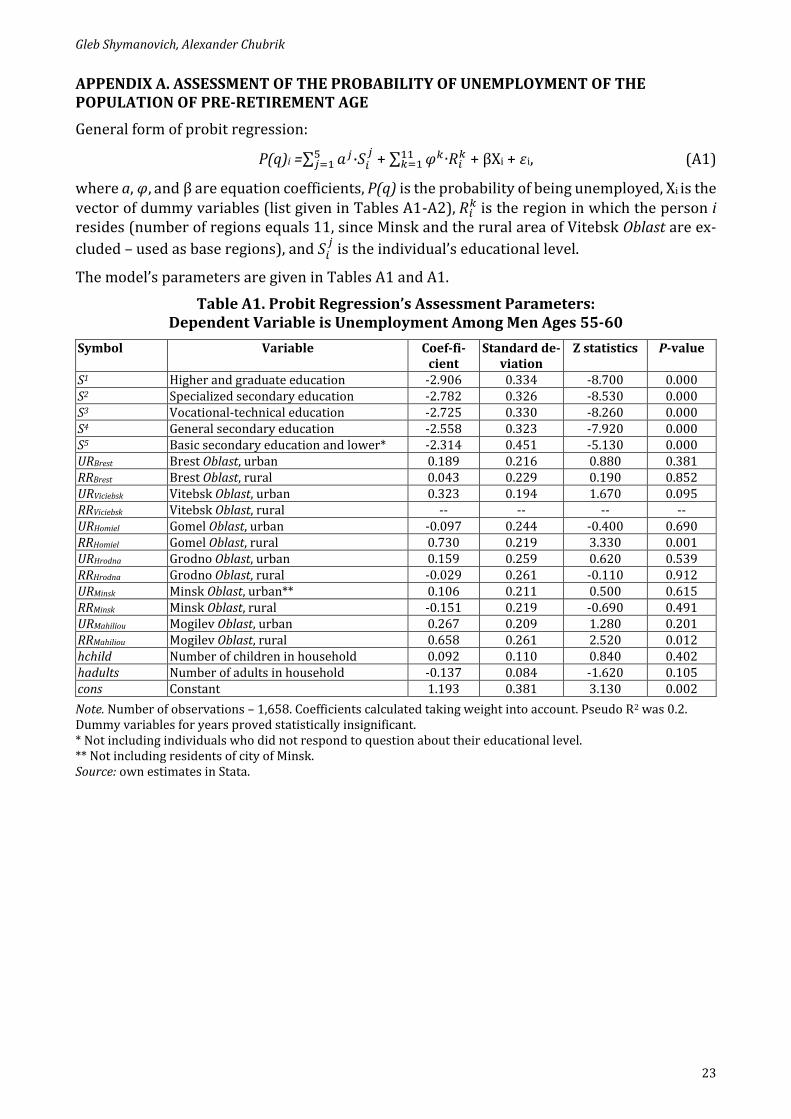
Gleb Shymanovich, Alexander Chubrik
23
APPENDIX A. ASSESSMENT OF THE PROBABILITY OF UNEMPLOYMENT OF THE POPULATION OF PRE-RETIREMENT AGE
General form of probit regression:
P(q)i =∑ 𝑎𝑗5𝑗=1 ∙𝑆𝑖
𝑗 + ∑ 𝜑𝑘11
𝑘=1 ∙𝑅𝑖𝑘 + βXi + 𝜀i, (A1)
where a, 𝜑, and β are equation coefficients, P(q) is the probability of being unemployed, Xi is the vector of dummy variables (list given in Tables A1-A2), 𝑅𝑖
𝑘 is the region in which the person i resides (number of regions equals 11, since Minsk and the rural area of Vitebsk Oblast are ex-
cluded – used as base regions), and 𝑆𝑖𝑗 is the individual’s educational level.
The model’s parameters are given in Tables A1 and A1.
Table A1. Probit Regression’s Assessment Parameters: Dependent Variable is Unemployment Among Men Ages 55-60
Symbol Variable Coef-fi-cient
Standard de-viation
Z statistics P-value
S1 Higher and graduate education -2.906 0.334 -8.700 0.000 S2 Specialized secondary education -2.782 0.326 -8.530 0.000 S3 Vocational-technical education -2.725 0.330 -8.260 0.000 S4 General secondary education -2.558 0.323 -7.920 0.000 S5 Basic secondary education and lower* -2.314 0.451 -5.130 0.000 URBrest Brest Oblast, urban 0.189 0.216 0.880 0.381 RRBrest Brest Oblast, rural 0.043 0.229 0.190 0.852 URViciebsk Vitebsk Oblast, urban 0.323 0.194 1.670 0.095 RRViciebsk Vitebsk Oblast, rural -- -- -- -- URHomiel Gomel Oblast, urban -0.097 0.244 -0.400 0.690 RRHomiel Gomel Oblast, rural 0.730 0.219 3.330 0.001 URHrodna Grodno Oblast, urban 0.159 0.259 0.620 0.539 RRHrodna Grodno Oblast, rural -0.029 0.261 -0.110 0.912 URMinsk Minsk Oblast, urban** 0.106 0.211 0.500 0.615 RRMinsk Minsk Oblast, rural -0.151 0.219 -0.690 0.491 URMahiliou Mogilev Oblast, urban 0.267 0.209 1.280 0.201 RRMahiliou Mogilev Oblast, rural 0.658 0.261 2.520 0.012 hchild Number of children in household 0.092 0.110 0.840 0.402 hadults Number of adults in household -0.137 0.084 -1.620 0.105 cons Constant 1.193 0.381 3.130 0.002
Note. Number of observations – 1,658. Coefficients calculated taking weight into account. Pseudo R2 was 0.2. Dummy variables for years proved statistically insignificant. * Not including individuals who did not respond to question about their educational level. ** Not including residents of city of Minsk. Source: own estimates in Stata.

Effect of Certain Socioeconomic Policies on the Welfare of Socially Vulnerable Groups
Table A2. Probit Regression’s Assessment Parameters: Dependent Variable is Unemployment Among Women Ages 50-55
Symbol Variable Coef-fi-cient
Standard de-viation
Z statistics P-value
S1 Higher and graduate education -3.330 0.407 -8.180 0.000 S2 Specialized secondary education -3.173 0.397 -8.000 0.000 S3 Vocational-technical education -3.209 0.404 -7.950 0.000 S4 General secondary education -2.926 0.399 -7.330 0.000 S5 Basic secondary education and lower* -2.869 0.479 -5.990 0.000 URBrest Brest Oblast, urban -0.251 0.207 -1.210 0.226 RRBrest Brest Oblast, rural 0.189 0.183 1.030 0.301 URViciebsk Vitebsk Oblast, urban 0.186 0.165 1.130 0.261 RRViciebsk Vitebsk Oblast, rural -- -- -- -- URHomiel Gomel Oblast, urban 0.417 0.149 2.790 0.005 RRHomiel Gomel Oblast, rural 0.159 0.237 0.670 0.504 URHrodna Grodno Oblast, urban 0.196 0.175 1.120 0.263 RRHrodna Grodno Oblast, rural 0.199 0.192 1.030 0.301 URMinsk Minsk Oblast, urban** -0.057 0.198 -0.290 0.774 RRMinsk Minsk Oblast, rural 0.222 0.177 1.260 0.209 URMahiliou Mogilev Oblast, urban 0.244 0.170 1.440 0.151 RRMahiliou Mogilev Oblast, rural 0.275 0.214 1.280 0.199 hchild Number of children in household -0.143 0.087 -1.630 0.102 hadults Number of adults in household 0.183 0.047 3.850 0.000 cons Constant 1.011 0.405 2.500 0.013
Note. Number of observations – 2,609. Coefficients calculated taking weight into account. Pseudo R2 was 0.11. Dummy variables for years proved statistically insignificant. * Not including individuals who did not respond to question about their educational level. ** Not including residents of city of Minsk. Source: own estimates in Stata.

Gleb Shymanovich, Alexander Chubrik
25
Figure A1. Distribution of Probability of Unemployment in Population of Added Working Age According to Profile Obtained of Unemployment Among People of Pre-
retirement age
0 .2 .4 .6 .8 1 [Label on vertical axis: “Density” [Numbers on vertical axis, top to bottom: 15, 10, 5, 0] [Label on horizontal axis: “Probability of unemployment among women ages 55-60”]
0 .2 .4 .6 .8 1
[Label on vertical axis: “Density” [Numbers on vertical axis, top to bottom: 15, 10, 5, 0] [Label on horizontal axis: “Probability of unemployment among men ages 60-65”] Source: own estimates in Stata.

Effect of Certain Socioeconomic Policies on the Welfare of Socially Vulnerable Groups
APPENDIX B. ASSESSMENT OF FACTORS DETERMINING AMOUNT OF PRE-PENSION-AGE POPULATION’S WAGES
General form of regression equation:
WI1 = ∑ 𝑎𝑗5𝑗=1 ∙𝑆𝑖
𝑗 + ∑ 𝜑𝑘11
𝑘=1 ∙𝑅𝑖𝑘 + βXi ∑ 𝛾𝑡6
𝑡=1 ∙T𝐷𝑖𝑡 + 𝜀i, (B1)
where a, 𝜑, and β are equation coefficients, WI is the ratio of the wages of individual i to average wages for the pre-pension-age population during the period in question, Xi is the vector of dummy variables (list given in Tables A1-A2), 𝑅𝑖
𝑘 is the region in which a person i resides (num-ber of regions equals 11, since Minsk and the rural area of Vitebsk Oblast are excluded – used
as base regions), and 𝑆𝑖𝑗 is the individual’s educational level, and TD is dummy variables for
each year but 2009 (base year).
The model’s parameters are given in Table B1.
Table B1. Assessment Parameters of Regression Equation: Dependent Variable is Ratio of Wages to Average Wages at Pre-Retirement age
Symbol Variable Coef-fi-cient
Standard de-viation
Z statistics P-value
S1 Higher and graduate education 2.277 0.233 9.790 0.000 S2 Specialized secondary education 1.751 0.232 7.540 0.000 S3 Vocational-technical education 1.589 0.233 6.830 0.000 S4 General secondary education 1.573 0.233 6.760 0.000 S5 Basic secondary education and lower* 1.468 0.241 6.080 0.000 URBrest Brest Oblast, urban -0.205 0.034 -5.970 0.000 RRBrest Brest Oblast, rural -0.420 0.043 -9.820 0.000 URViciebsk Vitebsk Oblast, urban -0.307 0.036 -8.550 0.000 RRViciebsk Vitebsk Oblast, rural -- -- -- -- URHomiel Gomel Oblast, urban -0.258 0.033 -7.720 0.000 RRHomiel Gomel Oblast, rural -0.452 0.051 -8.800 0.000 URHrodna Grodno Oblast, urban -0.139 0.037 -3.760 0.000 RRHrodna Grodno Oblast, rural -0.500 0.048 -10.370 0.000 URMinsk Minsk Oblast, urban** -0.158 0.037 -4.290 0.000 RRMinsk Minsk Oblast, rural -0.273 0.038 -7.100 0.000 URMahiliou Mogilev Oblast, urban -0.243 0.037 -6.580 0.000 RRMahiliou Mogilev Oblast, rural -0.534 0.055 -9.660 0.000 Male Males 0.196 0.019 10.110 0.000 T2012 Dummy variable for 2012 -0.050 0.024 -2.050 0.041 T2008 Dummy variable for 2008 -0.063 0.026 -2.390 0.017 T2007 Dummy variable for 2007 -0.064 0.026 -2.430 0.015 cons Constant -0.302 0.233 -1.300 0.194
Note. Number of observations – 4,530. Income in the form of wages of individuals classified as unemployed and pensioners excluded from analysis. Coefficients calculated taking weight into account. Adjusted R2 was 0.25. Dummy variables for years 2011 and 2010 proved statistically insignificant, and 2009 was taken as base year. * Not including individuals who did not respond to question about their educational level. ** Not including residents of city of Minsk. Source: own estimates.
The assessments of coefficients obtained (and the average values of wages for those of pre-retirement age) were used for calculating the potential wages of the population of added work-ing age.

Gleb Shymanovich, Alexander Chubrik
27
APPENDIX C. CHANGE IN DISPOSABLE RESOURCES OF VARIOUS SOCIAL GROUPS OF POPULATION, %
Raising retirement age
Indexing pensions for inflation
Raising housing, utility rates
Elimina-ting privi-
leges
Target-ed assis-
tance
Com-bined ef-
fect Sc. A1 Sc. A2 Sc. I1 Sc. I2 Sc. E1 Sc. E2 Sc. P Sc. T Sc. C Gender Males 0.47 0.74 -1.51 -1.30 -2.48 -2.13 -1.07 4.14 0.59 Women 0.30 0.65 -2.03 -1.73 -2.69 -2.31 -1.16 3.87 0.01 Age under 17 0.19 0.31 -0.58 -0.51 -2.52 -2.16 -1.74 7.43 3.17 working age 0.43 0.85 -1.30 -1.12 -2.57 -2.20 -0.88 3.43 -0.02 over 65 0.36 0.45 -5.98 -5.10 -2.85 -2.44 -1.41 1.70 -2.56 Socioeconomic status working-age working population
0.06 0.22 -0.62 -0.52 -2.47 -2.11 -0.84 3.06 -0.25
pension-age working population
-10.46 -7.33 -3.42 -2.98 -2.52 -2.16 -0.61 0.39 -2.73
working-age unem-ployed
0.72 0.97 -1.26 -1.15 -2.80 -2.40 -1.03 8.47 4.64
pension-age unem-ployed
4.33 4.56 -5.86 -5.01 -2.92 -2.50 -1.33 1.87 -2.37
Household type One-person household 1.43 2.06 -4.41 -3.68 -3.56 -3.05 -1.15 0.96 -3.75 Single-parent family 0.27 0.27 -0.71 -0.65 -3.20 -2.74 -2.65 8.61 2.76 Family of pensioners 0.87 1.65 -6.59 -5.74 -2.41 -2.07 -1.18 0.38 -3.21 Place of residence Minsk -0.87 -1.10 -1.42 -1.22 -2.64 -2.27 -0.92 0.75 -2.81 Large cities 0.21 0.60 -1.69 -1.46 -2.95 -2.53 -1.18 3.09 -1.04 Small towns 0.55 0.98 -1.70 -1.45 -2.67 -2.29 -1.14 4.23 0.42 Rural areas 1.24 1.74 -2.26 -1.94 -2.13 -1.83 -1.18 6.92 3.61 Region Brest Oblast 0.92 1.26 -1.76 -1.48 -2.62 -2.25 -0.70 5.34 2.03 Vitebsk Oblast 0.73 1.23 -2.00 -1.73 -2.69 -2.31 -0.85 4.10 0.56 Gomel Oblast 1.11 1.77 -2.14 -1.90 -2.68 -2.30 -2.48 5.49 0.33 Grodno Oblast 0.50 0.82 -1.76 -1.49 -2.50 -2.14 -0.71 3.73 0.52 city of Minsk -0.87 -1.10 -1.42 -1.22 -2.64 -2.27 -0.92 0.75 -2.81 Minsk Oblast -0.14 0.28 -1.74 -1.48 -2.45 -2.10 -0.79 3.92 0.68 Mogilev Oblast 0.86 1.23 -1.90 -1.60 -2.59 -2.22 -1.35 5.73 1.80
Note. Sc. A1. Scenario of raising retirement age under which in modeling final income potential wages are used only for originally nonworking pensioners (base). Sc. A2. Scenario of raising retirement age under which in modeling final income potential wages are used for all pensioners, excluding those who originally worked while declining pension. Sc I1. Scenario of indexing pensions based on assumption that average pension in 2007-2012 was evenly indexed relative to average wages. Base for calculating effect is changes in average wages. Sc. I1. Scenario of indexing pensions based on assumption that average pension in 2007-2012 was unevenly in-dexed relative to average wages. Base for calculating effect is changes in average pension. Sc. E1. Scenario of raising housing and utility rates taking into account zero price elasticity of demand for those services. Scenario E2. Scenario of raising housing and utility rates taking into account -0.285 price elasticity of demand for those services. Sc. P. Elimination of all privileges. Sc. T. Raising criterion for providing targeted social assistance to 150% of minimum subsistence budget. Sc. C. Scenario of combined effect of raising housing and utility rates (with zero price elasticity), eliminating priv-ileges and raising criterion for providing targeted social assistance. Source: own estimates.

Effect of Certain Socioeconomic Policies on the Welfare of Socially Vulnerable Groups
APPENDIX D. ABSOLUTE POVERTY LEVEL UNDER VARIOUS SOCIAL POLICY REFORM OPTIONS, % OF POPULATION
Table D1. Absolute Poverty Level After Social Policy Reforms
2007 2008 2009 2010 2011 2012 average Initial 10.4 8.0 7.2 6.5 6.9 6.6 7.6 Raising retirement age Sc. A1 10.0 8.1 7.2 6.6 7.3 7.1 7.7
Sc.A2 9.9 7.9 7.2 6.4 7.0 6.9 7.6 Indexing pensions for inflation
Sc. I1 10.9 8.3 7.2 7.1 7.0 7.7 8.1 Sc. I2 10.9 8.3 7.0 7.2 6.5 8.4 8.1
Raising housing, utility rates
Sc. E1 12.0 9.3 8.1 7.3 7.7 7.2 8.6
Eliminating privileges Sc. E2 11.8 9.1 8.0 7.1 7.5 7.1 8.5 Sc. P 11.2 8.7 7.6 7.0 7.5 7.2 8.2
Raising targeted social assistance
Sc. T 3.8 2.9 2.3 2.0 2.7 3.4 2.9
Eliminating privileges, raising housing and util-ity rates, and increasing targeted assistance
Sc. C 5.4 4.8 3.5 3.0 3.4 4.5 4.1
Source: own estimates.

Gleb Shymanovich, Alexander Chubrik
29
Table D2. Absolute Poverty Level After Social Policy Reforms in 2007-2012, on Average, for Various Population Groups
Initial level
Raising retire-ment age
Indexing pen-sions for infla-
tion
Raising housing, utility rates
Elimina-ting privileges
Target-ed assis-tance
Com-bined effect
Sc. A1 Sc. A2 Sc. I1 Sc. I2 Sc. E1 Sc. E2 Sc. P Sc. T Sc. C Gender Males 8.0 8.0 7.9 8.4 8.4 9.1 8.9 8.6 3.0 4.3 Women 7.3 7.5 7.3 7.8 7.8 8.3 8.1 7.9 2.7 4.0 Age under 17 13.6 13.5 13.4 13.9 13.9 15.0 14.8 14.9 4.1 6.5 working age 6.9 7.1 6.9 7.3 7.3 7.9 7.7 7.4 2.9 4.0 over 65 2.4 2.4 2.4 3.3 3.4 2.8 2.8 2.6 1.1 1.5 Socioeconomic status working-age working pop-ulation
6.4 6.4 6.3 6.5 6.5 7.3 7.1 6.8 2.7 3.8
pension-age working pop-ulation
1.0 3.3 2.5 1.3 1.3 1.2 1.2 1.1 0.7 0.9
working-age unemployed 16.3 16.2 15.8 17.2 17.3 18.0 17.8 17.0 5.9 7.9 pension- age unemployed 2.9 2.9 2.8 3.9 3.9 3.4 3.3 3.1 1.3 1.8 Household type One-person household 4.1 4.5 4.4 4.7 4.6 4.8 4.7 4.3 3.7 4.3 Single-parent family 17.9 18.0 17.9 18.3 18.5 19.9 19.6 20.3 7.6 11.9 Family of pensioners 1.1 1.9 1.4 1.7 1.9 1.3 1.3 1.2 1.0 1.2 Place of residence Minsk 2.6 2.8 2.7 2.8 2.8 3.2 3.0 2.7 1.6 2.4 Large cities 6.6 6.6 6.5 7.0 7.0 7.8 7.6 7.1 2.5 4.0 Small towns 8.1 8.2 8.1 8.5 8.4 9.2 9.1 8.9 2.9 4.2 Rural areas 11.7 11.8 11.6 12.4 12.4 12.7 12.6 12.6 4.1 5.4 Region Brest Oblast 10.3 10.2 10.0 10.8 10.8 11.3 11.2 10.8 3.6 4.8 Vitebsk Oblast 9.1 9.2 8.9 9.6 9.5 10.2 9.9 9.6 4.1 5.5 Gomel Oblast 10.1 10.5 10.1 10.7 10.9 11.6 11.5 11.8 4.0 6.3 Grodno Oblast 5.6 5.6 5.5 5.8 5.8 6.7 6.6 5.9 1.0 1.8 city of Minsk 2.6 2.8 2.7 2.8 2.8 3.2 3.0 2.7 1.6 2.4 Minsk Oblast 7.0 7.1 7.1 7.3 7.3 7.7 7.6 7.4 2.3 3.2 Mogilev Oblast 10.3 10.3 10.2 11.0 10.9 11.5 11.3 11.0 3.6 5.0
Note. Sc. A1. Scenario of raising retirement age under which in modeling final income potential wages are used only for originally nonworking pensioners (base). Sc. A2. Scenario of raising retirement age under which in modeling final income potential wages are used for all pensioners, excluding those who originally worked while declining pension. Sc I1. Scenario of indexing pensions based on assumption that average pension in 2007-2012 was evenly indexed relative to average wages. Base for calculating effect is changes in average wages. Sc. I1. Scenario of indexing pensions based on assumption that average pension in 2007-2012 was unevenly in-dexed relative to average wages. Base for calculating effect is changes in average pension. Sc. E1. Scenario of raising housing and utility rates taking into account zero price elasticity of demand for those services. Scenario E2. Scenario of raising housing and utility rates taking into account -0.285 price elasticity of demand for those services. Sc. P. Elimination of all privileges. Sc. T. Raising criterion for providing targeted social assistance to 150% of minimum subsistence budget. Sc. C. Scenario of combined effect of raising housing and utility rates (with zero price elasticity), eliminating priv-ileges and raising criterion for providing targeted social assistance. Source: own estimates.