eeurope2002/03: statistical glance at e-activities assoc. prof. dr. nerute kligiene, institute of...
TRANSCRIPT

eEurope2002/03: Statistical eEurope2002/03: Statistical Glance at e-ActivitiesGlance at e-Activities
Assoc. Prof. dr. Assoc. Prof. dr. NerutNerutee Kligien Kligienee,,Institute of Mathematics and InformaticsInstitute of Mathematics and Informatics,,Vilnius Gediminas Technical UniversityVilnius Gediminas Technical University
Vilnius, LITHUANIA, 200Vilnius, LITHUANIA, 20044
ISSS / LORIS 2004 ConferenceISSS / LORIS 2004 ConferencePrague & Hradec KralovePrague & Hradec Kralove
PLAN OF THIS LECTURE
Introduction Objectives Methodology used to
derive data summaries
Description of Measuring NAS achievements in the EU15 context
Conclusions

INTRODUCTION
eEurope-plus: EU15+NAS10eEurope-plus: EU15+NAS10 (less advanced) (less advanced)creates a need to evaluate a real situation:creates a need to evaluate a real situation:
SIBIS – IST 5FP project measuring and SIBIS – IST 5FP project measuring and
benchmarking Information Society benchmarking Information Society Results – the arrays of percentages and data Results – the arrays of percentages and data
charts on charts on 8484 indicators, updated – indicators, updated – 133133 indicators indicators Difficult to compare the results in separate areas, Difficult to compare the results in separate areas,
to see a position of any country or their groups;to see a position of any country or their groups;
A general view of situation focused on EU –A general view of situation focused on EU –NAS differences is badly needed.NAS differences is badly needed.

Data Examples
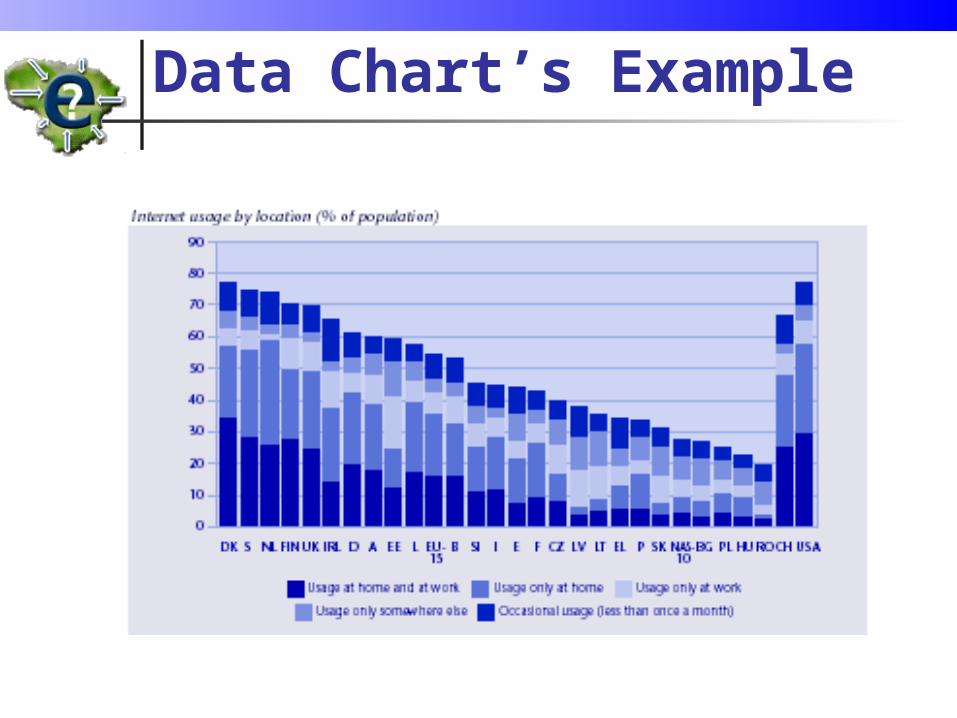
Data Chart’s Example

SIBIS INVESTIGATION AREAS
BASIC ACCESS AND USAGE (10 indicators)
INFORMATION SECURITY (8 indicators) eCOMMERCE (10 indicators) eWORK (14 indicators) eGOVERNMENT (10 indicators) eHEALTH (7 indicators) DIGITAL LITERACY (9 indicators) LEARNING AND TRAINING (4 indicators) DIGITAL DIVIDES (12 indicators)
All together IS data covered by 84 indicators
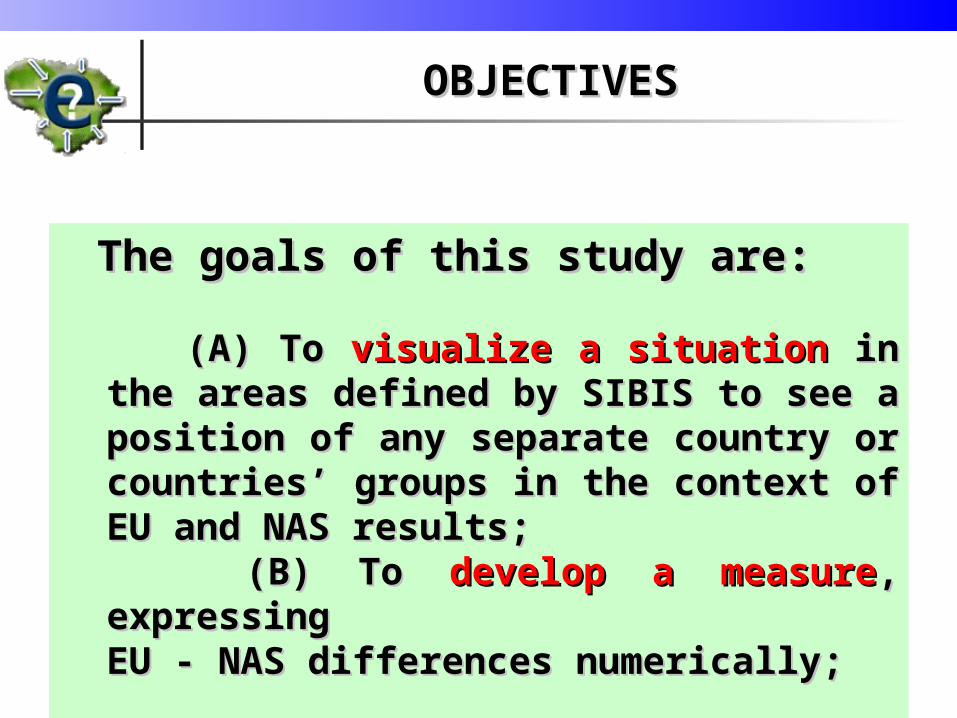
OBJECTIVESOBJECTIVES
The goals of this study are:The goals of this study are:
(A)(A) To To visualize a situationvisualize a situation in the in the areas defined by SIBIS to see a areas defined by SIBIS to see a position of any separate country or position of any separate country or countries’ groups in the context of countries’ groups in the context of EU and NAS results;EU and NAS results; (B)(B) To To develop a measuredevelop a measure, , expressing expressing EU - NASEU - NAS differences numerically; differences numerically;

OBJECTIVES (continued)OBJECTIVES (continued)
(C)(C) To To get at a glance a clear pictureget at a glance a clear picture of of eEurope-pluseEurope-plus in order to identify: in order to identify:
The areas where the NAS are The areas where the NAS are dramatically dramatically behindbehind the EU; the EU;
The topics in the enlarged EU where The topics in the enlarged EU where the IS development is the IS development is not sufficientnot sufficient;;
The areas where the NAS countries The areas where the NAS countries have a have a readiness to reachreadiness to reach the EU the EU level.level.

SOME BASIC FACTS AND NOTATIONSSOME BASIC FACTS AND NOTATIONS
EU15 European Union, 15 countries, plus US, CHEU15 European Union, 15 countries, plus US, CH NAS10 Newly Accessing States, 10 countriesNAS10 Newly Accessing States, 10 countries
SampleSample – the percentages of population having a – the percentages of population having a property investigated in some indicator in every of 27 property investigated in some indicator in every of 27 countries: countries: xx11, …, , …, xxNN. (N=500-1000 sample size per country).. (N=500-1000 sample size per country). Ordered countries sample: Ordered countries sample: xxminmin, …, x, …, xmaxmax
Median Median - a- a value of an ordered countries sample in the value of an ordered countries sample in the middle of it, denote it middle of it, denote it MeMe EU-15, NAS-10 EU-15, NAS-10 the weighted averages of EU and NAS, the weighted averages of EU and NAS, provided by SIBIS, let provided by SIBIS, let D = EU-15 – NAS-10D = EU-15 – NAS-10

SOME BASIC FACTS AND NOTATIONSSOME BASIC FACTS AND NOTATIONS
Q1Q1 – the first quartile – the first quartile – the value in the middle of the – the value in the middle of the first halffirst half Q3Q3 – the third quartile – the third quartile – the value in the middle of the – the value in the middle of the second halfsecond half IQR = Q3 – Q1IQR = Q3 – Q1 – – thethe inter-quartile range representing inter-quartile range representing aa spread of data spread of data under consideration under consideration
The Box Plot – a graphical display that simultaneously The Box Plot – a graphical display that simultaneously display Me, IQR, departure from symmetrydisplay Me, IQR, departure from symmetry Let us consider the statisticsLet us consider the statistics
ΔΔ = D / IQR = D / IQR S = (D – S = (D – λλ) / ) / [[Var (D)Var (D)]]1/21/2
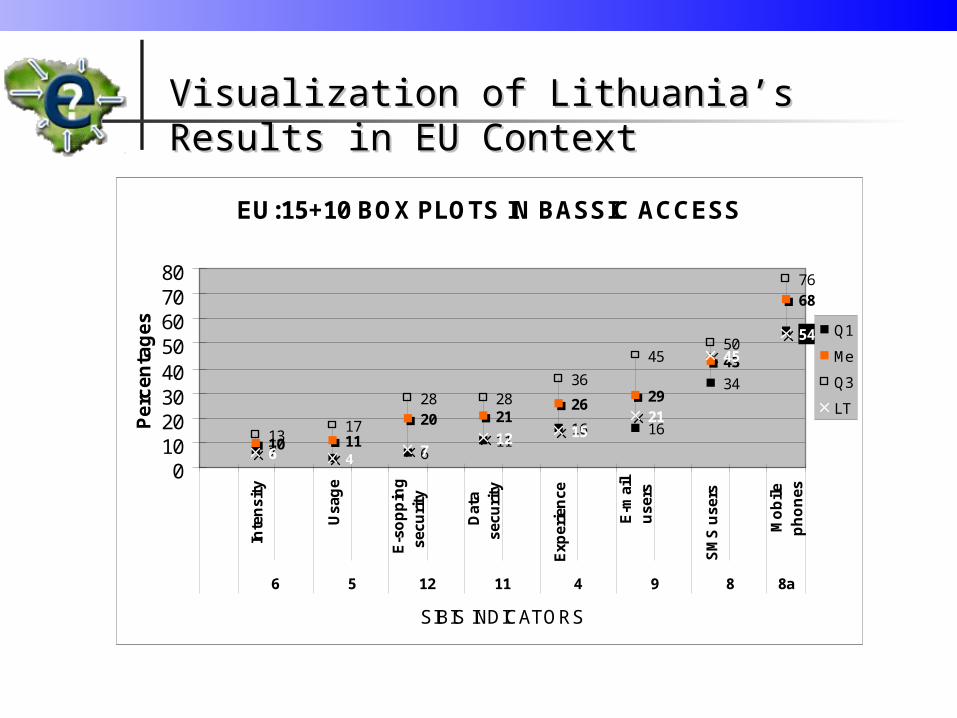
Visualization of Lithuania’s Results in Visualization of Lithuania’s Results in EU ContextEU Context
EU:15+10 BOX PLOTS IN BASSIC ACCESS
7 4 611
16 16
34
55
10 11
20 2126 29
43
68
1317
28 2836
4550
76
6 4 712 15
21
45
54
01020304050607080
Inte
nsi
ty
Usa
ge
E-s
op
pin
gse
curi
ty
Dat
ase
curi
ty
Exp
erie
nce
E-m
ail
use
rs
SM
S u
sers
Mo
bile
ph
on
es
6 5 12 11 4 9 8 8a
SIBIS INDICATORS
Pe
rce
nta
ge
s
Q1
Me
Q3
LT
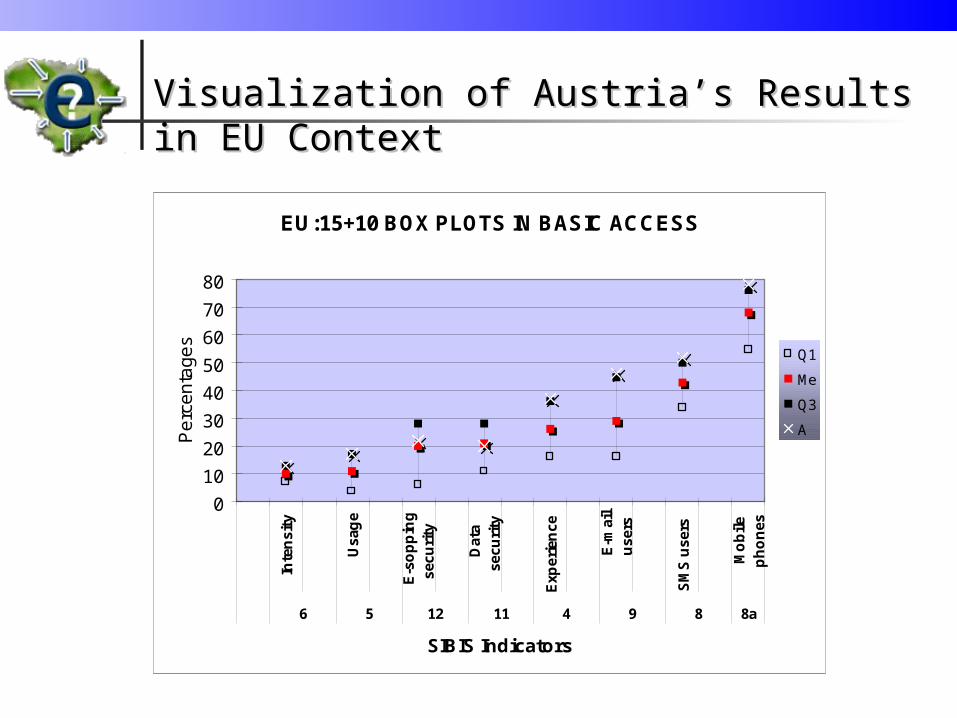
Visualization of Austria’s Results in EU Visualization of Austria’s Results in EU ContextContext
EU:15+10 BOX PLOTS IN BASIC ACCESS
0
10
20
30
40
50
60
70
80In
ten
sity
Usa
ge
E-s
op
pin
gse
curi
ty
Dat
ase
curi
ty
Exp
erie
nce
E-m
ail
use
rs
SM
S u
sers
Mo
bile
ph
on
es
6 5 12 11 4 9 8 8a
SIBIS Indicators
Pe
rce
nta
ge
s
Q1
Me
Q3
A

Comments
Internet usage by intensity and by location are close to 10%, the concerns on information security matters are located around 20%, the middle values of e-mail and experience of Internet users are approaching 30%;
Data spread (IQR) is largest in the e-mail usage and security concerns in online shopping, the smallest - in the Internet usage over 6 hrs/week intensity;
Mobile technologies have a wide spread of data and are visibly different;
Almost all indicators show departures from symmetry in data distributions;
Lithuania’s results in many indicators is near the first quartile Q1 – fairly good results, while Austria – nearly Q3, shows much better results.

COMPARISON OF BALTIC COUNTRIESCOMPARISON OF BALTIC COUNTRIES
B3 RESULTS IN BASIC ACCESS
6 310
44
20 19
4551
6 4 712 15
21
45
54
1812
59
35 38
54
68
0
10
20
30
40
50
60
70
80In
ten
sity
Usa
ge
E-
sho
pp
ing
Dat
ase
curi
ty
Exp
erie
nce
E-m
ail
use
rs
SM
S u
sers
Mo
bile
ph
on
es
6 6 5 5 12 12 11 11 4 4 9 9 8 8 8a 8a
SIBIS indicators
Per
cen
tag
es LV LT EE
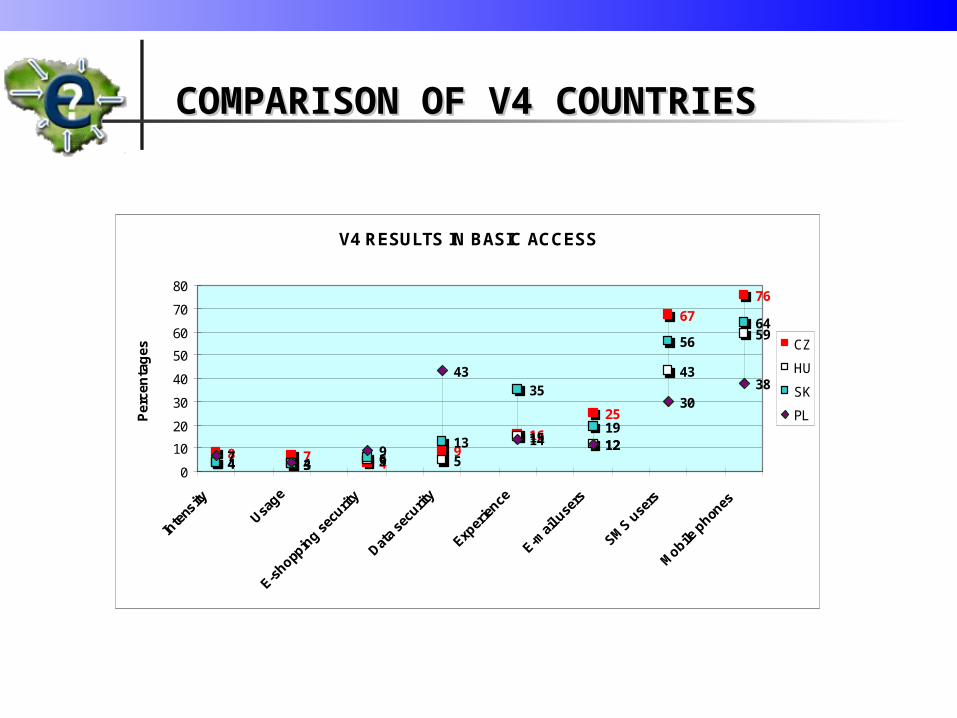
COMPARISON OF V4 COUNTRIESCOMPARISON OF V4 COUNTRIES
V4 RESULTS IN BASIC ACCESS
8 7 49
16
25
67
76
4 3 5 5
15 12
43
59
4 3 613
35
19
5664
7 49
43
14 12
3038
0
10
20
30
40
50
60
70
80
Inte
nsity
Usage
E-shopp
ing s
ecurit
y
Data
secu
rity
Exper
ience
E-mai
l use
rs
SMS u
sers
Mobile
phon
es
Per
cen
tag
es
CZ
HU
SK
PL
Comments
There is no discernible difference between V4 and Baltic countries groups in the considered indicators from the Basic access and usage/Information security areas;
CZ is a leading country among the V4 countries (except concerns on security matters);
LT and LV performed rather similarly in all considered indicators while EE has visibly outstanding results
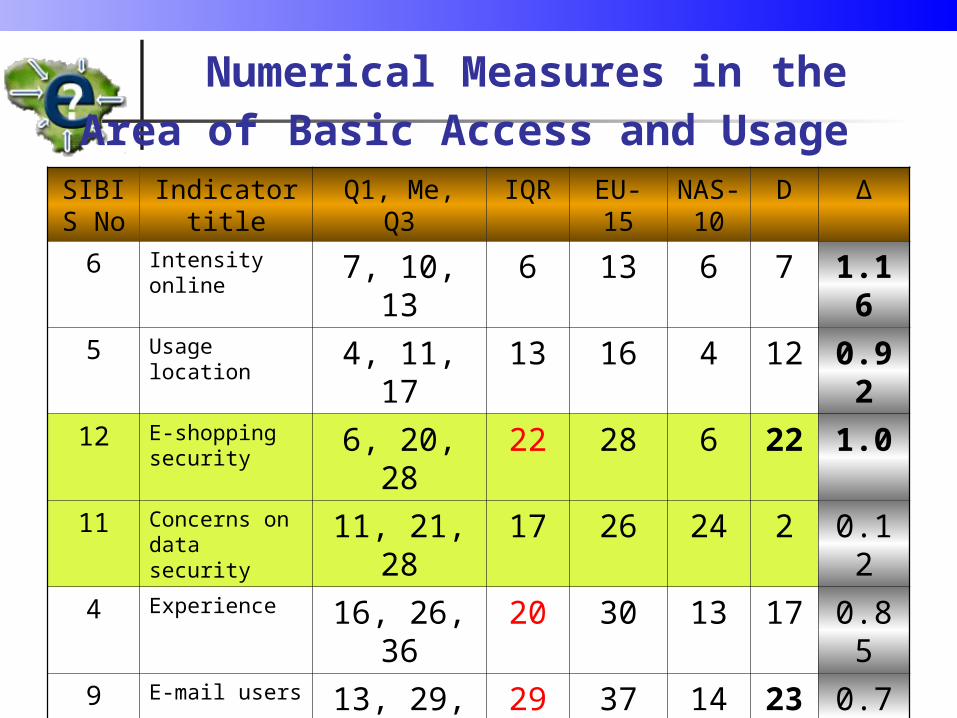
Numerical Measures in the Area of Basic Access and Usage
SIBIS No
Indicator title
Q1, Me, Q3 IQR EU-15
NAS-10
D Δ
6 Intensity online
7, 10, 13 6 13 6 7 1.16
5 Usage location
4, 11, 17 13 16 4 12 0.92
12 E-shopping security
6, 20, 28 22 28 6 22 1.0
11 Concerns on data security
11, 21, 28
17 26 24 2 0.12
4 Experience 16, 26, 36
20 30 13 17 0.85
9 E-mail users 13, 29, 45
29 37 14 23 0.79
8 SMS users 34, 43, 50
16 40 34 6 0.37
8a Mobile phones ownership
55, 68, 76
21 69 44 25 1.19
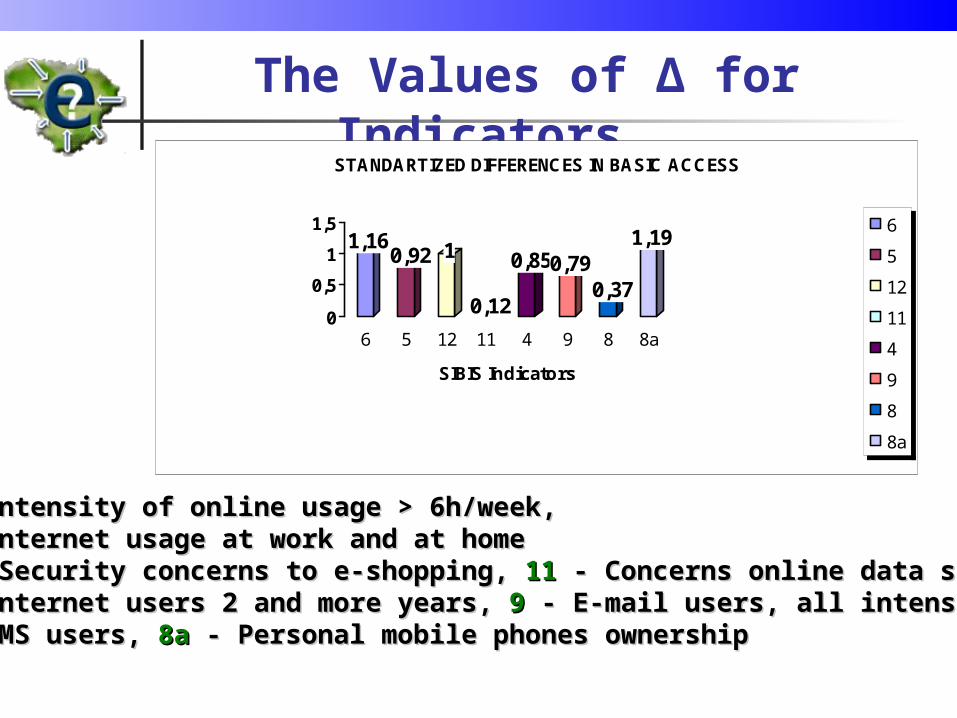
The Values of Δ for Indicators
1,160,92 1
0,12
0,850,790,37
1,19
0
0,5
1
1,5
6 5 12 11 4 9 8 8a
SIBIS Indicators
STANDARTIZED DIFFERENCES IN BASIC ACCESS
6
5
12
11
4
9
8
8a
66 - Intensity of online usage > 6h/week, - Intensity of online usage > 6h/week, 55 - Internet usage at work and at home - Internet usage at work and at home1212 - Security concerns to e-shopping, - Security concerns to e-shopping, 1111 - Concerns online data security - Concerns online data security44 - Internet users 2 and more years, - Internet users 2 and more years, 99 - E-mail users, all intensities - E-mail users, all intensities88 - SMS users, - SMS users, 8a8a - Personal mobile phones ownership - Personal mobile phones ownership

Measuring NAS Achievements in the EU15 Context (1)
Let Δ1, …, Δ k – are the values derived for each indicator (in the considered area)
λ – the threshold value The DECISION RULE on the i-th indicator
contribution in the area: if Δi< λ, the contribution is not significant, if Δi > λ, the contribution is significant;
Let r values among k were significant, introduce
MARK = 1 – r/k

Measuring NAS Achievements in the EU15 Context (2)
Evidently 0 < MARK < 1 Small MARK values mean small NAS
achievements compared to EU15 If the value is approaching 1 – the NAS
and EU15 achievements are comparable If the value is close to 0.5 – a middle NAS
success discovered in that area.
Each SIBIS area such as Basic Access, eWork, Digital Literacy and others
acquire own MARK value.

RESULTS IN SIBIS AREASeEUROPE 2002/03 at a GLANCE
0,5 0,560,71
0,34 0,380,2
0,430,5
00,20,40,60,8
1
SIBIS Areas
MA
RK
val
ues
Bassic Access
eCommerce
eWork
eGovernment
eHealth
Digital Literacy
Learn&Training
Digital Divides
The MARK values, derived for The MARK values, derived for λλ = 0.9, indicate: = 0.9, indicate:•Learning and Training, e-Health, Digital LiteracyLearning and Training, e-Health, Digital Literacy are the areas where NAS are clearly behind the EUare the areas where NAS are clearly behind the EU,,• E-GovernmentE-Government is a topic where the NAS is closest to the is a topic where the NAS is closest to the EU level.EU level.
Conclusions
Box Plot was applied to SIBIS data in order to see a position of any separate country in the context of enlarged EU and to see how the inclusion of 10 new NAS countries do affect the common results
The measure MARK expressing EU-NAS differences numerically have been developed and applied to get a clear picture of eEurope-plus at a glance
Notice, that in principle the results derived here have an “optimistic” trend, because the data of EU – GPS 2002 survey has to be compared with the NAS – GPS 2003.

THE CONTACT INFORMATION
dr. Nerute Kligiene (IMI)dr. Nerute Kligiene (IMI)
Address for contacts Address for contacts [email protected]
N. Kligiene, Institute of Mathematics and Informatics, N. Kligiene, Institute of Mathematics and Informatics, A. Gostauto 12, LT- 01113, Vilnius, Lithuania.A. Gostauto 12, LT- 01113, Vilnius, Lithuania.Phone: (370 5) 2660386, Fax: (370 5) 2619905Phone: (370 5) 2660386, Fax: (370 5) 2619905
THANKS FOR YOUR ATTENTION !