ee379k/ee394v smart grids: building a smart grid...
TRANSCRIPT

EE379K/EE394V Smart Grids:Building A Smart Grid Architecture – Lecture 3/4
Ross Baldick, Department of Electrical and
Computer Engineering
1Copyright © 2017 CMG Consulting LLC. All Rights Reserved.
Andres Carvallo,
CMG Consulting
Westlake Energy
Spring 2017

Lecture 3 Outline
2.6 Dynamic Interaction Model .............................................................8 slides
2.7 Control/Coordination Framework ...................................................13 slides
3.0 Selected Architectural Views for the Smart Grid of 2030 ....................2 slides
3.1 Desired Qualities List.......................................................................3 slides
3.2 Key System Properties Supporting These Qualities.............................4 slides
3.3 Key Future Grid Components and Structures ....................................5 slides
3.3.1 Mappings.....................................................................................8 slides
2Copyright © 2017 CMG Consulting LLC. All Rights Reserved.

2.6 Dynamic Interaction Model (1/8)
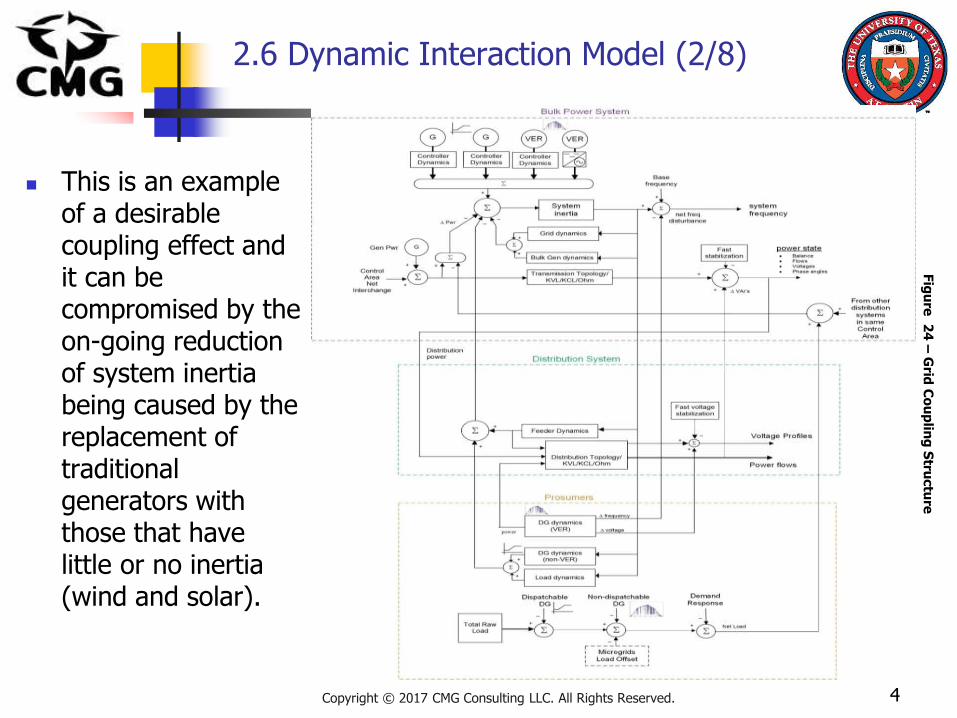
Due to the complexity of grid interactions caused by coupling, it is becoming unsustainable to modify one part of the grid without understanding whole grid effects and implications.
Some recent examples of new understanding about grid interactions include the interaction of Demand Response and Volt/VAR regulation on distribution grids, and the rising concern about the impact of reduction in grid inertia on various aspects of grid stability.
In addition, the bifurcation of generation and the rise of transactive loads are changing the basic assumption about distribution being a passive load on transmission.
The interaction model in the next figure illustrates the dynamic impacts of basic coupling as shown in the electric coupling model.
3Copyright © 2017 CMG Consulting LLC. All Rights Reserved.
2.6 Dynamic Interaction Model (2/8)
This is an example of a desirable coupling effect and it can be compromised by the on-going reduction of system inertia being caused by the replacement of traditional generators with those that have little or no inertia (wind and solar).
4Copyright © 2017 CMG Consulting LLC. All Rights Reserved.
Fig
ure
24
–G
rid C
ou
plin
g S
tructu
re

2.6 Dynamic Interaction Model (2/7)
5Copyright © 2017 CMG Consulting LLC. All Rights Reserved.
Fig
ure
24
–G
rid C
ou
plin
g S
tructu
re
2.6 Dynamic Interaction Model (3/8)
Note that the dynamic model includes a block labeled system inertia.
This is the sum of rotational inertias exerted by the various rotating machine generators connected to the transmission grid.
This inertia acts as a stabilizing influence and is in fact a crucial element of primary generator control in bulk power systems.
The combination of generation with droop control, system inertia, and coupling through transmission not only tends to stabilize against small signal oscillations but also reduces the tendency of generators to “hunt” when finding a new load sharing equilibrium after an incremental load or generation change.
6Copyright © 2017 CMG Consulting LLC. All Rights Reserved.

2.6 Dynamic Interaction Model (4/8)
Inertia
The large rotational mass providing system inertia by turbines slows the decline in frequency should there be a sudden change in the generation or load of the system.
System inertia helps prevent protective load shedding mechanisms from kicking in by providing time for compensating control systems to adjust generation to the changing environment. It ranges from 2s to 10s, with 6s being typical for large generators.
Newer renewable technologies connect their generation source to the electric grid through power inverters which do not provide any inertia to the rest of the system.
Likewise, adding more renewable technologies is enabling the retirement of older generation technologies which results in less system inertia being available. This decline in inertia is also compounded by a decrease in large industrial motors.
7Copyright © 2017 CMG Consulting LLC. All Rights Reserved.
2.6 Dynamic Interaction Model (5/8)
Architectural Insight 10 (1/2)
System inertia and coupling (interaction) of generators with droop control through the transmission system are crucial to proper present-day grid operation. Other methods are possible but the majority of existing generators use this method.
The gradual reduction in system inertia caused by replacing traditional generation with wind and solar will cause gradual degradation system stability.
System inertia is not just a single value for a whole interconnection. For example, in the Western Interconnection, loose coupling means that the effective inertia in one area as seen by the generators there is different from that seen in another area of the same Interconnection.
8Copyright © 2017 CMG Consulting LLC. All Rights Reserved.

2.6 Dynamic Interaction Model (6/8)
9Copyright © 2017 CMG Consulting LLC. All Rights Reserved.
Architectural Insight 10 (2/2)
The Western Interconnection is also the one where most of the system inertia reduction trends due to the shift to wind and solar generation are presently evolving. Measurement of system inertia to track changes must be done in multiple locations in the Western Interconnection in order to understand the implications of changing generation mix.
Other emerging causes of instability include “hiding” of bulk system reserve requirements due to the existence of DER that can change rapidly, and lack of coordination between DER operations and bulk system operations.

2.6 Dynamic Interaction Model (7/8)
10Copyright © 2017 CMG Consulting LLC. All Rights Reserved.
Policy Implications 5 (1/2)
Exploring methods for measuring—and potentially predicting—system inertia associated with existing operations as well as in the context of a changing generation mix may provide key insights for policymakers and regulators concerned with system reliability.
At present, this may require additional R&D efforts. In addition, such methods would be useful in the development of joint planning tools, which likewise do not yet exist for purposes of enhancing industry and policymakers’ understanding of emerging infrastructure interdependencies (such as electricity and natural gas).

2.6 Dynamic Interaction Model (8/8)
11Copyright © 2017 CMG Consulting LLC. All Rights Reserved.
Policy Implications 5 (2/2)
Meanwhile, efforts underway in ERCOT to consider inertia-related grid services merit careful attention.
As discussed more fully in our next section, novel configurations of assets at the distribution level (including storage) may ultimately be leveraged to help provide such services—but once again, regulatory friction associated with determining which entities are eligible to provide such services, and allocation of costs and benefits, may arise under current law.

2.7 Control/Coordination Framework (1/13)
Individual elements of grid control are well-known, but a whole grid control model is not widely available yet.
However, the grid has become too complex to treat in silo sections.
Control is crucial for obvious reasons (it causes the business outcomes to happen) and it is also a source of coupling.
Existing grid controls have been developed in the context of 20th Century design criteria, most of which are being altered for the grid of 2030.
12Copyright © 2017 CMG Consulting LLC. All Rights Reserved.

2.7 Control/Coordination Framework (2/13)
Any whole grid control framework must encompass a range of elements: primary, secondary, and tertiary generator controls, balance and dispatch, load frequency control, flow control, regulation of voltage and reactive power, stabilization (counteracting disturbances), and synchronization (since the grid is AC based).
Control is divided across many entities and the process of aligning control (coordination) must take into account the structure of control in the whole grid.
13Copyright © 2017 CMG Consulting LLC. All Rights Reserved.

2.7 Control/Coordination Framework (3/13)
The system control level illustrates how system control is integrated with wholesale markets (basically the 15 minute and 5 minutes markets are part of the optimizing steps in receding horizon controls).
Receding horizon controls are a class of control systems that plan control over a time window that continually slides forward after each control time step. Model predictive control uses receding time horizons.
Even the day ahead market (where it is used) is part of a control loop, since absent any changes due to participation in the 15 or 5 minute markets, a settlement in the day-ahead market specifies a dispatch schedule that the generator is bound to meet.
14Copyright © 2017 CMG Consulting LLC. All Rights Reserved.
2.7 Control/Coordination Framework (4/13)
The control structure model does not specify control algorithms or laws, but does indicate lines of control, especially those that cross entity boundaries. Localized control is also indicated. At the distribution level, three different modes for Volt/VAR regulation are illustrated:
1. Individual locally controlled voltage regulation and separate VAR support
2. Centrally controlled combined Volt/VAR control
3. Free-standing integrated Volt/VAR control
15Copyright © 2017 CMG Consulting LLC. All Rights Reserved.

2.7 Control/Coordination Framework (5/13)
Specific methods of control are not indicated since at the architecture level, the specifics of how a particular component works internally are not of concern.
Consequently no distinction is made between central and embedded dedicated controllers and agents, as these are implementation tools.
The control structure model includes specific references to microgrids and to buildings as key elements.
In the buildings case, the model includes the remote control of sets of buildings in a manner that may or may not be coordinated with grid operations.
16Copyright © 2017 CMG Consulting LLC. All Rights Reserved.

2.7 Control/Coordination Framework (6/13)
The control framework also indicates three modes of dispatch of Demand Response (DR) and Distributed Energy Resources (DER):
1. Locally, by the distribution provider
2. From the system operator level, bypassing distribution
3. Via third party aggregators that may bid aggregated resources into a wholesale market and perform dispatch directly, or possibly in collaboration with a distribution utility
17Copyright © 2017 CMG Consulting LLC. All Rights Reserved.
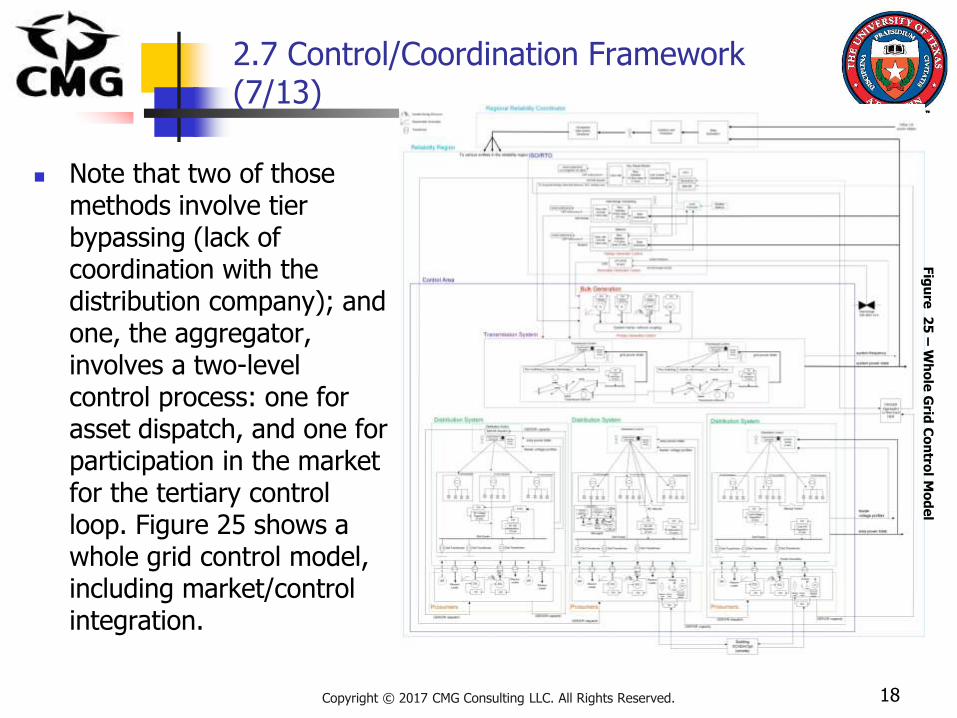
2.7 Control/Coordination Framework (7/13)
Note that two of those methods involve tier bypassing (lack of coordination with the distribution company); and one, the aggregator, involves a two-level control process: one for asset dispatch, and one for participation in the market for the tertiary control loop. Figure 25 shows a whole grid control model, including market/control integration.
18Copyright © 2017 CMG Consulting LLC. All Rights Reserved.
Fig
ure
25
–W
ho
le G
rid C
on
trol M
od
el

2.7 Control/Coordination Framework (7/13)
19Copyright © 2017 CMG Consulting LLC. All Rights Reserved.
Fig
ure
25
–W
ho
le G
rid C
on
trol M
od
el

2.7 Control/Coordination Framework (8/13)
Examination of the control diagram shows that distribution, while electrically connected to the rest of the system, is not control connected.
Considering just the bulk power system, and setting DER aside momentarily, the integration of markets and system control are clear, as shown in Figure 26
20Copyright © 2017 CMG Consulting LLC. All Rights Reserved.
Fig
ure
26
–B
ulk
Syste
m C
on
trol/
Ma
rke
t Inte
gra
tion

2.7 Control/Coordination Framework (8/13)
21Copyright © 2017 CMG Consulting LLC. All Rights Reserved.
Fig
ure
26
–B
ulk
Syste
m C
on
trol/
Ma
rke
t Inte
gra
tion

2.7 Control/Coordination Framework (9/13)
As figure 26 indicates, the wholesale markets are not just included in—but are integral parts of—the closed loop control of the Control Area, through dispatch, balance, and load frequency control. Primary generator control relies upon local closed loops, droop control, system inertia, and transmission grid coupling.
Closed loop control uses measurements of the controlled system, fed back into the controller, to determine incremental control corrections. Such feedback, used improperly, can cause instability (oscillation or runaway).
22Copyright © 2017 CMG Consulting LLC. All Rights Reserved.

2.7 Control/Coordination Framework (10/13)
Architectural Insight 11
The inclusion of real time power markets inside closed loop grid controls means that these markets could contribute to control instability.
The problem will worsen with additional entities in the loop and the presence of faster dynamics and diverse sources of net load volatility.
23Copyright © 2017 CMG Consulting LLC. All Rights Reserved.

2.7 Control/Coordination Framework (11/13)
Skeletonizing the control structure yields the coordination view, shown in Figure 27.
The isolation of distribution operations is clearly apparent. This condition also exists in the Public power/PUD/Muni/Co-op case as well, and is just as problematic. In the vertically integrated case, the functions exist within a single company or set of integrated companies, but distribution may still be isolated.
24Copyright © 2017 CMG Consulting LLC. All Rights Reserved.
Fig
ure
27
–G
rid C
oo
rdin
atio
n S
tructu
re

2.7 Control/Coordination Framework (11/13)
25Copyright © 2017 CMG Consulting LLC. All Rights Reserved.
Fig
ure
27
–G
rid C
oo
rdin
atio
n S
tructu
re

2.7 Control/Coordination Framework (12/13)
Architectural Insight 12
Consider the fact that distribution control and coordination is presently not well coordinated with the rest of the grid in the light of regulatory structure, namely the Federal regulation of the bulk power system, vs. State regulation of distribution grids.
Note that regulatory structure, industry structure and control/coordination structure are aligned—but this alignment is with control structures that are increasingly problematic as the grid changes due to emerging trends.
Bifurcation of generation (across the transmission and distribution levels), responsive loads, dynamics associated with managing net loads vs. gross loads and the increasing impact of distribution on transmission operations suggest that new models for how reliability responsibility is allocated are needed.
Such models are starting to emerge at the State level, and they may imply structural changes to reliability oversight and to markets for distributed energy resources.
In addition the recent 3rd Circuit Court of Appeals ruling regarding jurisdiction over DER, and the subsequent view published by PJM conceding that DER and bulk system generation regulation should be separated add to the architectural argument for changing structure.
26Copyright © 2017 CMG Consulting LLC. All Rights Reserved.

2.7 Control/Coordination Framework (13/13)
Policy Implications 6
The changing nature of system dynamics, implications of DER deployment at increasing scale, new technologies, and models of consumer engagement are putting pressure on regulatory boundaries that have evolved in the past century.
Current academic and industry literature suggests consideration of a new, Distribution System Operator (DSO) model, though this thinking is very new and includes a highly varied set of topics.
The States of New York and California are currently engaged in regulatory proceedings that may define and establish responsibilities for what may ultimately be termed a DSO—though outcomes remain uncertain at this early juncture.
A careful consideration and/or rationalization of these responsibilities might better align with system structure (bulk system vs. distribution vs. unregulated prosumers/third parties).
27Copyright © 2017 CMG Consulting LLC. All Rights Reserved.

3.0 Selected Architectural Viewsfor the Smart Grid of 2030 (1/2)
The slides that follow present potential forward-looking alternatives to selected grid structures and components, driven by emerging trends and systemic issues resulting from the widening gap between existing grid structure and the desired functions and qualities of the new grid.
It does not represent the only possible approaches, but it does address many of the issues reviewed in the process of this project and incorporate thinking from across many segments of the utility industry.
In addition to the need to accommodate large numbers of distributed energy resources behaving independently, injecting energy wherever they happen to be connected to the grid, creating multi-directional flows and causing flows from distribution onto the transmission system—often reversing direction from one time interval to the next—there is also a shift of operational emphasis.
28Copyright © 2017 CMG Consulting LLC. All Rights Reserved.

3.0 Selected Architectural Viewsfor the Smart Grid of 2030 (2/2)
For the grid of 2030, it is expected it will no longer be sufficient solely to deliver energy from central stations to end-use customers, but rather, utilities should provide reliable grid operation while allowing maximum flexibility to customers to choose their sources and uses of energy.
The creation of even a partial architecture such as this one starts with the specification of aspirational requirements in the form of desired system (grid) qualities.
29Copyright © 2017 CMG Consulting LLC. All Rights Reserved.

3.1 Desired Qualities List (1/3)
System Qualities
Are a set of requirements that clearly define the functionality and characteristics of a power grid system.
Proper Qualities
Such as Safety, Scalability, Minimum environmental footprint, Robustness (reliability/resilience), Security, Flexibility (extensibility, optionality, interoperability), Affordability, Financiability (used, useful, rate-based, discrete, bounded, bankable).
30Copyright © 2017 CMG Consulting LLC. All Rights Reserved.

3.1 Desired Qualities List (2/3)
The target customer has to provide an initial list of desired qualities. Some may come from customer/prosumer needs and public policy issues. Here is a sample initial list:
1. Safety
2. Scalability
3. Minimum environmental footprint
4. Robustness (reliability/resilience)
5. Security
6. Flexibility (extensibility, optionality, interoperability)
7. Affordability
8. Financiability (used, useful, rate-based, discrete, bounded, bankable)
31Copyright © 2017 CMG Consulting LLC. All Rights Reserved.

3.1 Desired Qualities List (3/3)
Key Question 3
What makes for a proper set of System Qualities?
A good set of qualities is more than just a list of “key requirements;” the items should be as nearly orthogonal (non-overlapping) as possible, should be as specific and quantifiable as possible, and should be prioritized with relative weighting factors. It is often the case that what at first may seem to be a proper quality is in fact a system property— the grid architect can help sort out the distinction.
32Copyright © 2017 CMG Consulting LLC. All Rights Reserved.

3.2 Key System Properties SupportingThese Qualities (1/4)
For any qualities list, a key set of supporting system properties should be selected by the architecture team. The properties are:
1. Observability (situational awareness)— sufficient sensing and data collection to assemble an adequate view of system behavior for control purposes
2. Controllability and dynamic stability—ability to sufficiently control grid behavior and ability to maintain stability in the presence perturbations
3. Smoothly adjustable N-way power flow— provide for adjustable and flexible power flows at all grid levels
4. Tolerance of generation/load stochasticity—reducing the dependence on being able to dispatch generation sources and accommodating net load variability
33Copyright © 2017 CMG Consulting LLC. All Rights Reserved.

3.2 Key System Properties SupportingThese Qualities (2/4)
5. Convergence of T&D, natural gas, and prosumers— use of common architecture, tools, and operational methods to maximize value stream opportunities and reduce operational difficulties across these domains
6. Scalability—able to meet a range of demand levels, interaction points, geographic or time scales
7. Distributed reliability management—specific reliability management for DR/DER
8. Whole (extended) grid coordination—mechanism for cooperation across system and organizational boundaries that does not bypass tiers, organizations, or systems
34Copyright © 2017 CMG Consulting LLC. All Rights Reserved.

3.2 Key System Properties SupportingThese Qualities (3/4)
9. Attack resistance/fault tolerance/self-healing— systems tolerate asset or function loss, whether through failure or attack, and act to maintain best available service despite degradation
10. Data/device/system interoperation—automated systems exchange data and messages via common and open standards without the need for custom system integration
11. Boundary deference/local optimization—control and coordination respect organization and system boundaries and provide for local optimization criteria and local constraints to be observed
12. Control federation/disaggregation—control systems combine multiple, possibly competing or conflicting objectives into uniform controls; bulk level control commands are broken down into units that can be adjusted based on local conditions, and constraints
35Copyright © 2017 CMG Consulting LLC. All Rights Reserved.
3.2 Key System Properties SupportingThese Qualities (4/4)
These properties are mapped to the system qualities as part of the architecture development process.
This mapping can be combined with the mapping of components and structures to the system properties, making a tri-partite map.
This mapping is crucial to understanding, analyzing, and optimizing the architecture.
36Copyright © 2017 CMG Consulting LLC. All Rights Reserved.

3.3 Key Future Grid Components and Structures (1/5)
Key Question 4
Where do the system properties, components, and structures come from in this process?
The selection of these elements is technical in nature and is driven by the constraints, emerging trends, systemic issues, and use cases identified for the system at hand, as well as technology, regulatory, and economic information.
The architecture team synthesizes the lists with input from various subject matter experts and stakeholders. Thus the selection is driven by requirements, not by desires of the architect.
The architect manages the complexity and provides the framework
and conceptual integrity for the architecture.
37Copyright © 2017 CMG Consulting LLC. All Rights Reserved.

3.3 Key Future Grid Components and Structures (2/5)
38Copyright © 2017 CMG Consulting LLC. All Rights Reserved.
Table 2 – Key Grid Components (1/2)
3.3 Key Future Grid Components and Structures (3/5)
39Copyright © 2017 CMG Consulting LLC. All Rights Reserved.
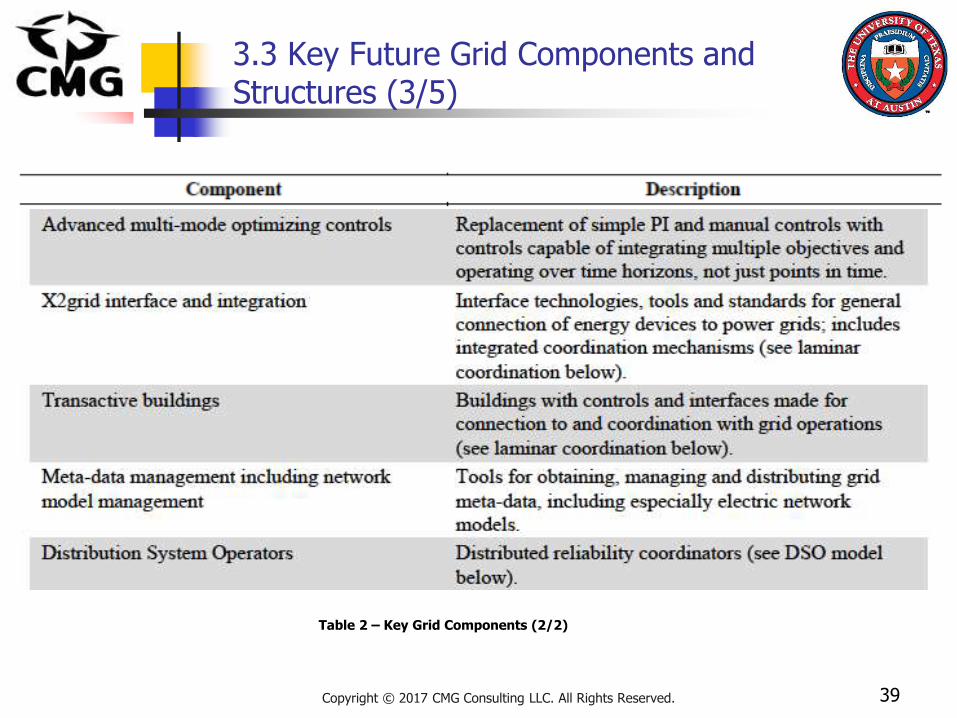
Table 2 – Key Grid Components (2/2)

3.3 Key Future Grid Components and Structures (4/5)
40Copyright © 2017 CMG Consulting LLC. All Rights Reserved.
Table 3 – Key Grid Structures

3.3 Key Future Grid Components and Structures (5/5)
Laminar Coordination Laminar Coordination means that power grid operations will need
automatic coordination in layers (a.k.a. as nested networks).
The US Power Grid is a ultra-large scale control system that is based on layered optimization and has structural properties and operational modes that allow federated control systems with useful scalability and reliability properties.
The control system based on these principles, require Laminar Control (a.k.a. nested control) architectures and Laminar Coordination of assets.
The structures used have properties such as layer-by-layer segmentation of control signal traffic, abstraction of local state into scalar signal flows, self-similarity of data flow patterns at each layer, and support for islanded operation and re-connection.
41Copyright © 2017 CMG Consulting LLC. All Rights Reserved.
3.3.1 Mappings (1/8)
42Copyright © 2017 CMG Consulting LLC. All Rights Reserved.
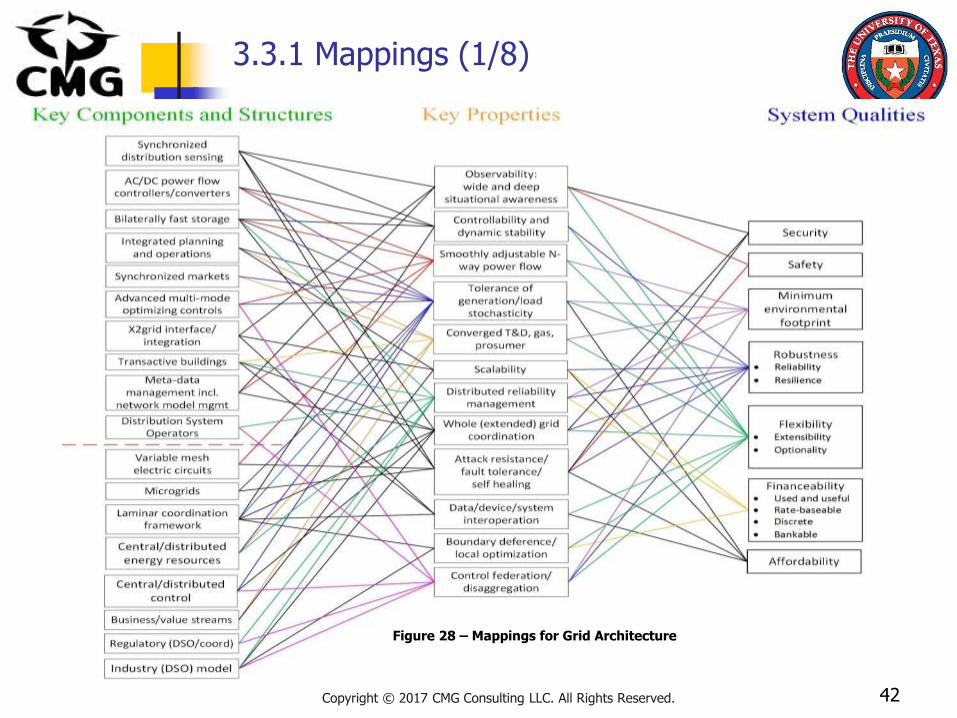
Figure 28 – Mappings for Grid Architecture
3.3.1 Mappings (2/8)
The full mapping (components/structures to system properties; and system properties to desired system characteristics) as shown in Figure 28.
These mappings are crucial architecture artifacts; they define the essential structure of the architecture itself and permit quantitative analysis and comparison.
The mapping diagrams show how architectural elements provide support to architecture properties, and how properties support desired qualities.
43Copyright © 2017 CMG Consulting LLC. All Rights Reserved.

3.3.1 Mappings (3/8)
While the diagrams only show mapping lines, in practice, each line has a detailed explanation/justification (not shown here).
In addition, each line can have a value attached to it; these values can be set to represent the degree of support flowing from left to right and become the bases for analytical evaluation of the architecture as described later.
The mapping diagrams are complex, and for a full architecture are even more complex. They can be decomposed into subsets for consumption by various stakeholders, something that involves a larger effort that this project could support.
44Copyright © 2017 CMG Consulting LLC. All Rights Reserved.

3.3.1 Mappings (4/8)
In a full scale architecture development, much front end effort would be applied to the creation and validation of these mappings with stakeholders during the construction of the architecture.
That full scale process was also beyond the scope of the present project, so the mappings were created by the architecture team and commented on by various stakeholders during the project process to the extent possible given the time constraints.
45Copyright © 2017 CMG Consulting LLC. All Rights Reserved.

3.3.1 Mappings (5/8)
Key Question 5
How does the architecture impact system qualities?
The architecture mappings are the primary means by which the impact of architectural elements, singly, or in groups, or in total impact the qualities. It is vital that the mappings be well thought out and validated by stakeholders early in the architecture process.
46Copyright © 2017 CMG Consulting LLC. All Rights Reserved.

3.3.1 Mappings (6/8)
47Copyright © 2017 CMG Consulting LLC. All Rights Reserved.
Figure 29 – Tracing the Impact of Laminar Coordination on Qualities
3.3.1 Mappings (7/8)
48Copyright © 2017 CMG Consulting LLC. All Rights Reserved.
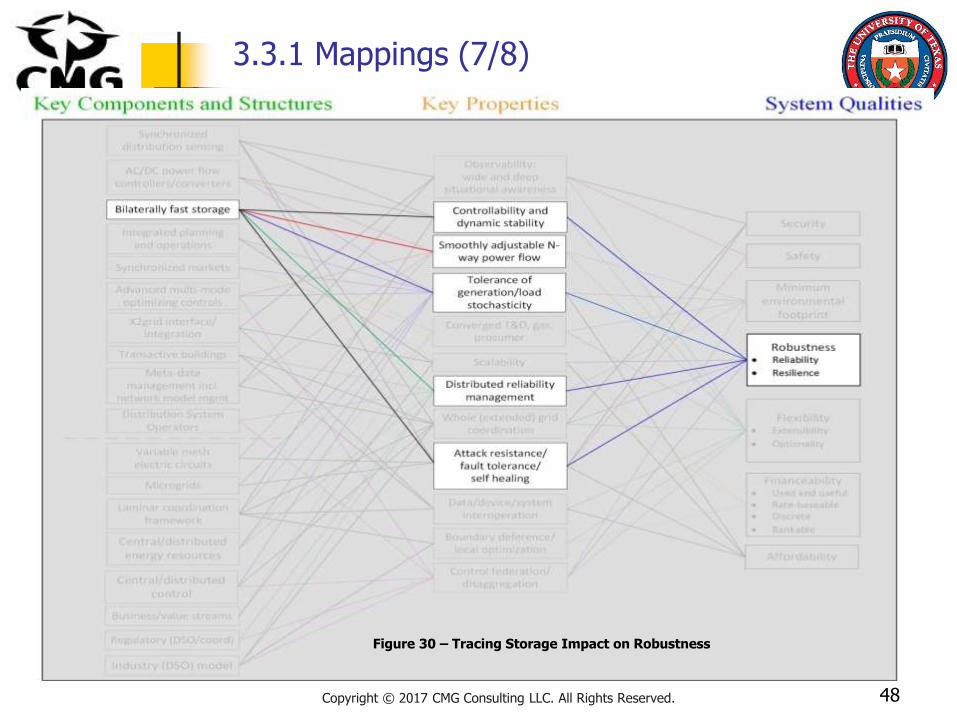
Figure 30 – Tracing Storage Impact on Robustness

3.3.1 Mappings (8/8)
Architectural Insight 13
The ability to quantitatively analyze and optimize architectures is crucial due to the complexity of modern grids. The development and validation of the mappings is a critical early phase step in the architecture development process.
49Copyright © 2017 CMG Consulting LLC. All Rights Reserved.
Lecture 3 Summary
50Copyright © 2017 CMG Consulting LLC. All Rights Reserved.
2.6 Dynamic Interaction Model
2.7 Control/Coordination Framework
3.0 Selected Architectural Views for the Smart Grid of 2030
3.1 Desired Qualities List
3.2 Key System Properties Supporting These Qualities
3.3 Key Future Grid Components and Structures
3.3.1 Mappings

Homework Exercises:Due Feb 2nd, 2017
2
A.What happens to the system frequency when the amount of electricity produced by generators exceeds the power used by customers?
B.What happens to the system frequency when the amount of DER (like solar PV) from customers are larger than the electricity produced by the wholesale market?
C.What is the range of System Inertia for large generators? And what is the typical value?
D.What does ROCOF mean? (hint: frequency, rate, change)
E.Using the formula Hsys= (Pg – Pl)/(2*ROCOF)
Calculate the System Inertia for (i) absolute value of ROCOF of 0.5 Hz/s, 1 Hz/s, and 1.5 Hz/s, (ii) generation of 300 MW, and (iii) load of 295 MW and 305 MW. You will calculate six values of inertia. Note that ROCOF is negative when load exceeds generation, but inertia is always positive.
51Copyright © 2017 CMG Consulting LLC. All Rights Reserved.

Suggested Reading
1. https://pdfs.semanticscholar.org/1cd1/9e3ae4b3ff6919570cf6faa693a13d21652a.pdf
2. https://arxiv.org/pdf/1312.6435.pdf
3. http://www.fglongatt.org/Papers/Papers2012/EFEA_06294049.pdf
52Copyright © 2017 CMG Consulting LLC. All Rights Reserved.