educational marginalization in the uk - unesdoc...
TRANSCRIPT

2010/ED/EFA/MRT/PI/41
Background paper prepared for the Education for All Global Monitoring Report 2010
Reaching the marginalized
Educational marginalization in the UK
Anna Vignoles2009
This paper was commissioned by the Education for All Global Monitoring Report as background information to assist in drafting the 2010 report. It has not been edited by the team. The views and opinions expressed in this paper are those of the author(s) and should not be attributed to the EFA Global Monitoring Report or to UNESCO. The papers can be cited with the following reference: “Paper commissioned for the EFA Global Monitoring Report 2010, Reaching the marginalized” For further information, please contact [email protected]

Educational marginalization in the UK Anna Vignoles
April 2009
1. Introduction The purpose of this report is to describe the extent of educational marginalization in
the UK and to consider the effectiveness of UK policy with regards to reducing this
marginalization1. During recent decades the UK Government has introduced a wide
range of policies aimed at both increasing educational quality and participation
generally, and narrowing socio-economic, gender and ethnic gaps in education
achievement. The government has also increased the share of GDP spent on
education from 5.2% of GDP to 6.2% between 1994 and 2005 and increased per
capita expenditure on primary and secondary education from 3.7% of GDP to 4.6%
over the same period (OECD, 2008). Certainly this government has done much to
live up to their claim that education is a top priority, a claim which has been made in
the Queen’s speech at the opening of every parliament since 19972.
Much of the policy emphasis has been on a specific education gap: namely the gap
in education achievement between students from different socio-economic
backgrounds. The broad thrust of UK education policy on marginalization is outlined
in the next section, along with more detailed discussion of two policy interventions
that were introduced to tackle particular types of marginalization. Specifically, the
report reviews the Excellence in Cities programme, which was introduced to raise
standards and address issues of marginalization in inner city schools. The report also
discusses the Education Maintenance Allowance policy which was introduced to
reduce the socio-economic gap in education participation in the post-compulsory
schooling phase (age 16 plus).
A key feature of the UK education system is the large increase in education
participation during the last 40 years. The proportion of young people remaining on in
full time education beyond the age of 16 has increased substantially and now stands
1 Much of the emphasis will be on school policy development in England. 2 Thanks go to Ruth Lupton for highlighting this point. See her broader discussion in Lupton et al. 2008.
1

at 78%, up from 70% in 1997 and up from around just under half the age group in
19853. Furthermore, the tertiary education participation rate has risen dramatically
since the 1980s, although it has remained stagnant at around 40% for the last few
years. Yet despite the large increase in education participation in the UK, there has
been growing concern about the marginalization of certain groups, particularly those
from poorer backgrounds. Certainly the socio-economic gap in HE participation
remains large in the UK and research suggests suggest that much of the increase in
education participation over time has been amongst more advantaged groups of
students (Blanden, Gregg and Machin, 2005; Blanden and Machin, 2008), an issue
we return to in more detail below.
Another trend in the UK over the last ten years is the shift of public resources
towards earlier educational phases, such as pre-school. The UK government
increased expenditure on early years and childcare fourfold (in nominal terms) over
the period 1997-2007 to £5billion and the number of child care places doubled
(Cabinet Office, 2008). This approach is supported by research that has indicated
that educational marginalization starts early and hence policy responses need to be
aimed at reducing the socio-economic gap in education achievement much earlier in
the system (Chowdry et al. 2008; Feinstein, 2003; Cunha and Heckman, 2008).
Certainly one of the most pressing challenges for the UK, in terms of educational
marginalization, is not widening participation in tertiary participation, for example, but
rather reducing the “long tail of low achieving students” caused by the relatively high
proportion of each cohort who continue to drop out of the education system at age 16
with few or no qualifications. The proportion not achieving a pass at GCSE, the
examination taken at age 16, has reduced from 8% in 1997 to 5% in 2007, whilst the
proportion not achieving 5 pass grades at GCSE reduced from 13.6% in 1997 to
10.1% in 20074.
3 http://www.dcsf.gov.uk/rsgateway/DB/SFR/s000792/index.shtml 4 Derived from information provided to the Houses of Parliament in response to a Parliamentary Question. See Hansard 21 July Column 936W and http://www.publications.parliament.uk/pa/cm200708/cmhansrd/cm080107/text/80107w0045.htm.
2

With the above trends in mind, the report will start with an overview of the extent of
marginalization in the UK, particularly with respect to socio-economic background,
gender, ethnicity and location. The general direction of policy in terms of reducing
marginalization will then be discussed, along with the Excellence in Cities (EiC) and
the Education Maintenance Allowance (EMA) interventions. Lastly, the report will
look to the future and consider the likely impact of the recent proposals in the
Government’s recent White Paper on social mobility and their implications for
educational marginalization (H M Government, 2008).
2. Educational marginalization in the UK
As has been already said, there has been extensive educational reform in the UK in
recent years, with a number of policies aimed at improving the skill levels of students
and reducing the number who leave the education system with few or no
qualifications at the end of the compulsory schooling phase (age 16). Despite this,
the UK has a lower proportion of young people participating in full or part time
education than many other OECD countries (Figure 1). In 2006, 70% of young
people age 15-19 in the UK were in full time or part time education, as compared to
82% for the OECD as a whole, and 85% for the 19 EU countries.
3

Figure 1: OECD participation in education at 15-19 in 2006
n 10.0
20.0 30.0 40.0 50.0
60.0 70.0 80.0
90.0 100.0
Belgium
Greece
Poland
Czech
Rep
ublic
Netherlan
ds
German
y
Finlan
d
Irelan
d
Sweden
Hungary
NorwayKore
a
France
EU19 av
erage
Slovak R
epub
lic
Iceland
Switzerl
and
Denmark
Austra
lia
Austria Ita
ly
OECD avera
geSpa
in
Canada
United Stat
es
New Zealan
d
Luxe
mbourg
Portug
al
United King
dom
Mexico
Turkey
%
Source: OECD, ‘Education at a Glance 2008’, http://www.oecd.org/dataoecd/23/46/41284038.pdf
International comparison data is also potentially informative, although the UK ranking
on international tests varies substantially over time and by test and thus long term
trends can be difficult to determine. Furthermore, measuring educational
marginalization (particularly socio-economic marginalization) is problematic as
measures of socio-economic background vary in meaning across countries and
contexts. That said, such data can be a useful guide as to how the UK compares with
other countries. The most recent international test data, namely data from the OECD
Programme for International Student Assessment (PISA)5, suggests that the UK is
an above average achiever in science and average in mathematics and reading. In
2006, the UK scored 515, i.e. above the OECD mean in science (500). In reading
and mathematics, the UK scored just below the OECD mean but not significantly so.
Of course the overall level of educational participation and achievement does not
necessarily inform us of the extent of educational marginalization and we start by
documenting the extent of this marginalisation. In the UK policy attention has been
focused particularly on socio-economic marginalization. 5 http://www.oecd.org/dataoecd/60/1/39727764.ppt#2417
4

2.1 Socio-economic marginalization
Gaps in educational achievement between socio-economically advantaged and
disadvantaged groups emerge early (Feinstein, 2003; George et al. 2007). A study of
children born in 2000 (The Millennium Cohort Study) has confirmed that poorer
children in the UK have lower vocabulary scores, and score less well on tests of
school readiness, even at the age of 3 (George et al. 2007). Barreau et al. (2008)
found that English children from lower socio-economic backgrounds have both
poorer cognitive and non-cognitive development pre-school and go on to have lower
levels of academic achievement and non-cognitive development at school.
As has been said, even as children enter the education system there is a socio-
economic gap in achievement. At age 5 in 2007, only around one third of pupils in the
most deprived areas reached the expected level of attainment as compared to
around half of pupils in other areas (DCSF, 2008). Of course not all poor children live
in a deprived area nor attend a deprived school. In fact, a relatively small percentage
of pupils (3%) who are poor, as identified by whether they are in receipt of Free
School Meals6, actually live in a deprived area or attend a school with a high
proportion of FSM pupils (DCSF, 2008). So whilst identifying poorer children by which
school they attend is partially successful, individual measurement is important too.
Focusing now on FSM pupils (as distinct from deprived schools), the socio-economic
gap widens through the school system until, in 2007, at age 16 there was a 28-29
percentage point gap in the English and mathematics test scores7 achieved by FSM
students and less deprived pupils.
There is an important although admittedly arbitrary threshold at age 16, namely
achieving five Grades A*-C General Certificates of Secondary Education (GCSE)
including English and Mathematics. There is considerable policy emphasis on this
threshold and data on the proportions of children achieving this threshold are
published at school level. One fifth of deprived (FSM) children achieved this in 2007, 6 In the UK children from poor families in receipt of state income support benefits are entitled to Free School Meals. Thus FSM status is an indicator of deprivation. 7 In England students take General Certificates of Secondary Education (GCSE) at age 16. They take these tests in a range of subjects, the range being determined by the ability and interests of the child.
5
compared to around 50% of less deprived pupils, although the gap between FSM
and non FSM students has reduced somewhat since 2003 (DCSF, 2008). FSM
pupils are not only less likely to achieve in school but they are also more likely to be
“excluded” from school i.e. asked to leave the school either permanently or
temporarily. FSM pupils are seven times more likely to be excluded from primary
school and 3 to 4 times more likely to be excluded from secondary school.
PISA data, described earlier, confirms that in international terms the UK is a slightly
higher than average performer at age 15 but also has higher than average socio-
economic education achievement gaps8.
Socio-economic marginalization continues on into higher education. Figure 3
indicates that there has been a reduction in the (long standing) socio-economic gap
since 2002 (this mirrors the reduction in the FSM/ non FSM gap in test score
achievement at age 16 over the same period mentioned earlier). Specifically, the gap
in higher education participation at age 18-20 between higher socio-economic
classes (groups 1, 2, 3) and lower socio-economic classes (groups 4 to 7) has
narrowed from nearly 27 percentage points in 2002 down to 21 percentage points in
2006. The gap is of course still sizeable.
8 http://www.oecd.org/dataoecd/60/1/39727764.ppt#2390,21,Slide 21
6

Figure 2: Higher Education Participation Rates by Socio-economic Class for Young People age 18-20
Source: (DIUS, 2008)
Notes: The figure shows the Full-time Young Participation by Socio-Economic Class (FYPSEC)
measure. FYPSEC covers English domiciled 18-20 year old first time entrants to full time higher
education at UK HEIs and English FE colleges who remain on their courses for at least 6 months.
In summary, the main cause of the very large socio-economic gap in tertiary
participation in England is pupils’ poor prior achievement (Chowdry et al., 2008). In
other words, because socio-economic gaps emerge early in the UK education
system and widen, poorer students fail to achieve in primary and secondary school
and this explains why they then do not enroll in tertiary education. The left hand
panel of Figure 3 shows the socio-economic gap in higher education participation as
measured by FSM for those entering higher education in 2004/5 and 2005/6. More
advantaged young females who did not receive Free School Meals at the age of 16
had more than twice the probability of enrolling in tertiary education at the age of
18/19, as compared to those in receipt of free school meals. The picture is similar for
males. Yet the right hand panel also shows that the raw socio-economic gap in
tertiary enrollment (in excess of 20 percentage points) is massively reduced once we
allow for the prior achievement of these students. This confirms that much of the
7
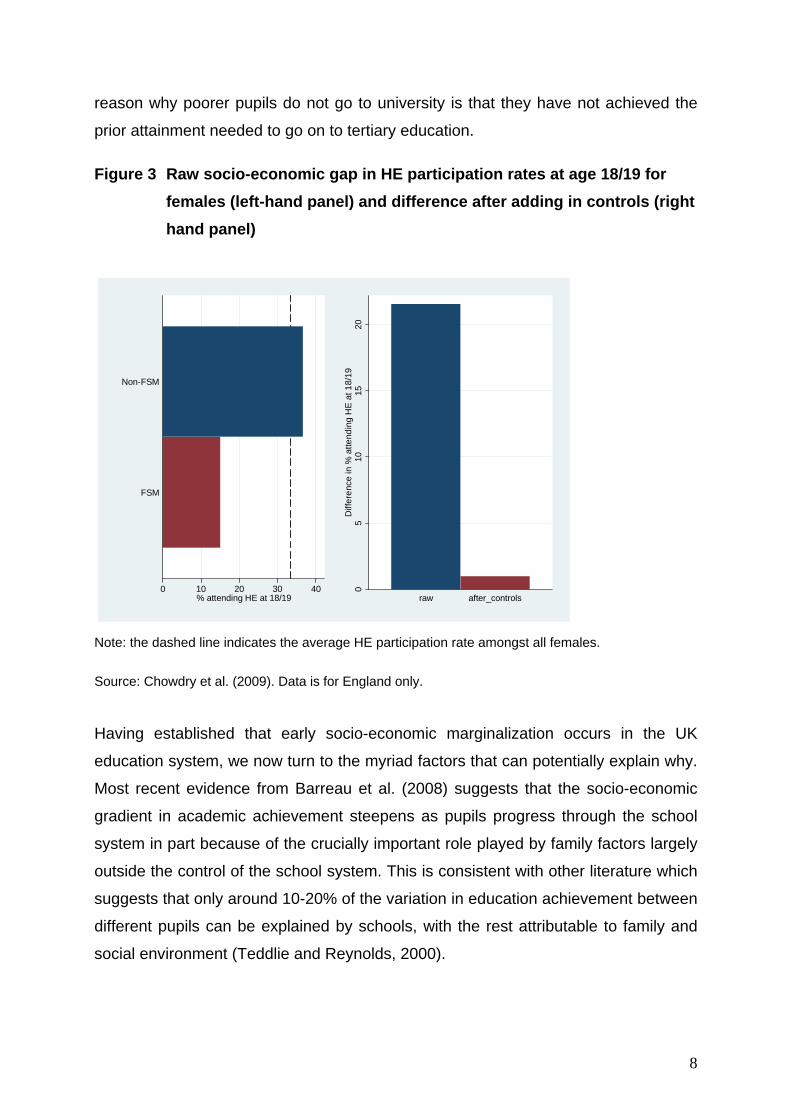
reason why poorer pupils do not go to university is that they have not achieved the
prior attainment needed to go on to tertiary education.
Figure 3 Raw socio-economic gap in HE participation rates at age 18/19 for females (left-hand panel) and difference after adding in controls (right hand panel)
0 10 20 30 40% attending HE at 18/19
FSM
Non-FSM
05
1015
20D
iffer
ence
in %
atte
ndin
g H
E at
18/
19
raw after_controls
Note: the dashed line indicates the average HE participation rate amongst all females.
Source: Chowdry et al. (2009). Data is for England only.
Having established that early socio-economic marginalization occurs in the UK
education system, we now turn to the myriad factors that can potentially explain why.
Most recent evidence from Barreau et al. (2008) suggests that the socio-economic
gradient in academic achievement steepens as pupils progress through the school
system in part because of the crucially important role played by family factors largely
outside the control of the school system. This is consistent with other literature which
suggests that only around 10-20% of the variation in education achievement between
different pupils can be explained by schools, with the rest attributable to family and
social environment (Teddlie and Reynolds, 2000).
8

Barreau et al. found that parental characteristics, e.g. parental education, or other
child factors, such as birth weight are important in determining child achievement.
What they term as “non-traditional” factors i.e. parental and child attitudes and beliefs
appear to be important too. Focusing on non academic outcomes, such as
behavioural and emotional difficulties and risky behaviour, they confirmed that some
of the socio-economic gradient in non-cognitive outcomes is also related to these
“non-traditional” factors. In particular, maternal mental health seemed to play a
significant role. Aspirations, self confidence in one’s own ability, locus of control and
behavioural problems are highly related to both academic achievement and non-
cognitive outcomes.
International 2.2 Ethnic marginalization
Education achievement gaps by ethnicity have also been a source of concern.
Historically, some ethnic minority groups (but by no means all) have had lower levels
of achievement in the UK (Dearing, 1997). Patterns of ethnic marginalization are
changing however and Cassen and Kingdon (2007) report that nearly half of all low
achievers at age 16, defined as achieving few or no passes at GCSE, are White
British students.
Current levels of education achievement by ethnic minority group are shown in Table
1, with Asian and Chinese students doing particularly well at age 16. By contrast
Black students do less well at age 16. However, it is also the case that ethnicity and
socio-economic background are related (DCSF, 2008). Ethnic minority students tend
to come from more deprived backgrounds and it is important to take account of this.
Wilson et al. (2005) found that all ethnic minority groups now make more progress
through the English primary and secondary education system than whites, once you
allow for their (on average poorer) socio-economic background. The interaction
between socio-economic background and ethnicity is also strongest for White British
students. Cassen and Kingdon (2007) found that the socio-economic gap in
education achievement at age 16 was greatest for White British pupils (see too
DCSF, 2008).
9
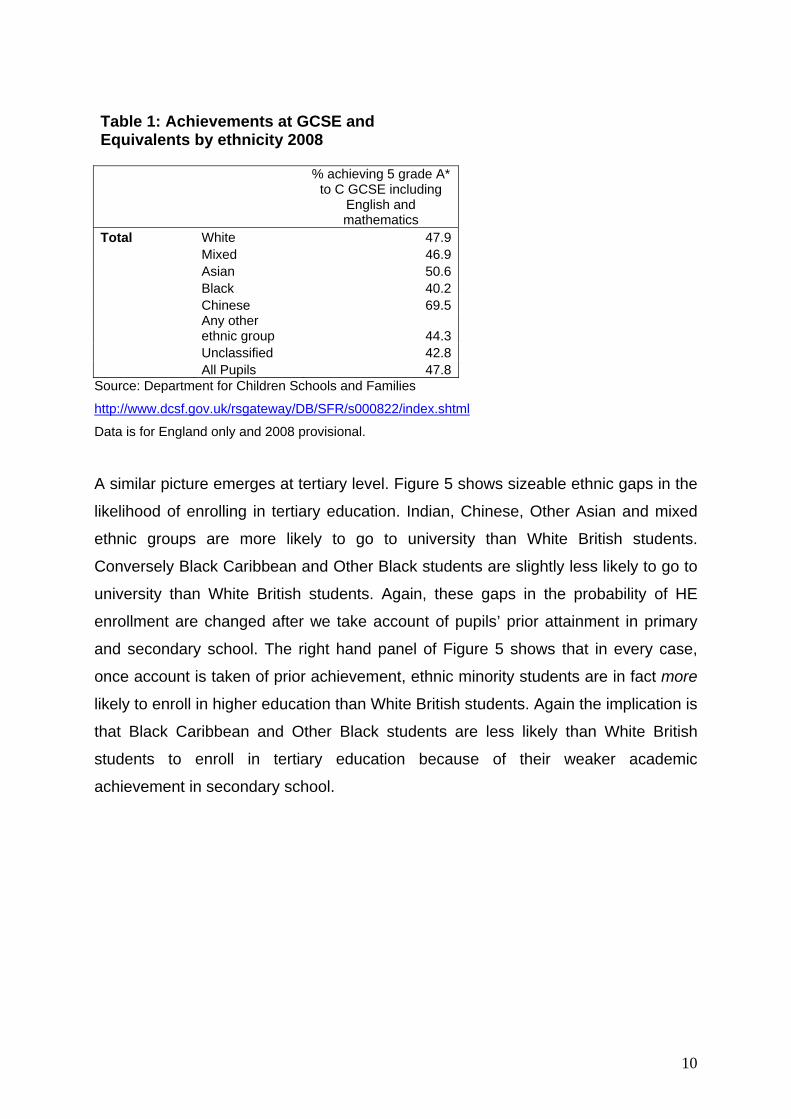
Table 1: Achievements at GCSE and Equivalents by ethnicity 2008
% achieving 5 grade A* to C GCSE including
English and mathematics
Total White 47.9 Mixed 46.9 Asian 50.6 Black 40.2 Chinese 69.5
Any other ethnic group 44.3
Unclassified 42.8 All Pupils 47.8
Source: Department for Children Schools and Families
http://www.dcsf.gov.uk/rsgateway/DB/SFR/s000822/index.shtml
Data is for England only and 2008 provisional.
A similar picture emerges at tertiary level. Figure 5 shows sizeable ethnic gaps in the
likelihood of enrolling in tertiary education. Indian, Chinese, Other Asian and mixed
ethnic groups are more likely to go to university than White British students.
Conversely Black Caribbean and Other Black students are slightly less likely to go to
university than White British students. Again, these gaps in the probability of HE
enrollment are changed after we take account of pupils’ prior attainment in primary
and secondary school. The right hand panel of Figure 5 shows that in every case,
once account is taken of prior achievement, ethnic minority students are in fact more
likely to enroll in higher education than White British students. Again the implication is
that Black Caribbean and Other Black students are less likely than White British
students to enroll in tertiary education because of their weaker academic
achievement in secondary school.
10

Figure 4 Raw ethnic gap in HE participation rates at age 18/19 for males (left-hand panel) and difference after adding in controls (right hand panel)
0 20 40 60 80% attending HE at 18/19
Other (O)
Mixed (M)
Other Asian (OA)
Chinese (C)
Bangladeshi (B)
Pakistani (P)
Indian (I)
Other Black (OB)
Black Caribbean (BC)
Black African (BA)
Other White (OW)
White British (WB)
-20
020
4060
Diff
eren
ce in
% a
ttend
ing
HE
at 1
8/19
OW BA BC OB I P B C OA M O
raw after_controls
Note: the dashed line indicates the average HE participation rate amongst all males.
Source: Chowdry et al. 2008. Data is for England only. 2.3 Other sources of marginalization
Historically marginalization by gender has been a major issue in the UK, as girls
underachieved relative to boys. However since the late 1980s, females have
outperformed males in the UK education system. Women are more likely than males
to have higher levels of achievement at every level, including tertiary. Policy concern
has switched to underachievement of boys, particularly working class boys. In fact
administrative data indicates that between the ages of 14 to 16, the gender gap in the
gain in achievement exceeds the socio-economic gap (DCSF, 2008). So for a given
level of achievement at age 14, girls are 11 percentage points more likely than boys
to reach the key education threshold 5 grades A*-C at GCSE (age 16), whilst more
advantaged non FSM students are 7 percentage points more likely to achieve this
threshold than FSM students. Of course some of the gender gap may simply reflect
the fact that boys develop at different rates, or that the particular assessment
methods used at age 16 (more continual assessment in recent years, for example)
11

favour girls. Nonetheless the extent to which boys’ behaviour and achievement is
problematic in the UK education system is a topical issue.
There are also differences in educational achievement across the different regions of
the UK and indeed even greater disparities within English regions. Disparities in both
education achievement and school quality by neighbourhood have been longstanding
in the UK (Lupton, 2006). Despite a number of policies targeting poor
neighbourhoods with low levels of education achievement (e.g. New Deal for
Communities) or schools in deprived areas (e.g. the Excellence in Cities programme
as reviewed below), geographic disparities in education achievement remain. For
example, in 2008 within London the proportion of young people achieving 5 grades
A*-C at GCSE (including mathematics and English) ranged from just 38.2% in
Islington to 67.2% in Sutton9 (see Table 2 for regional differences). Furthermore,
Cassen and Kingdon (2007) in their study of underachievement noted that in fact
educational disadvantage is particularly concentrated in urban areas. Their evidence
from 2003 indicated that, for example, there were 13 local authorities where low
achievement, defined as no passes at GCSE was 50% or more above the national
average (which was 5.53% at that time). Such concentrations of very disadvantaged
pupils in a limited number of urban schools may lead to greater educational
difficulties than more dispersed rural deprivation. This was part of the motivation
behind the Excellence in Cities programme, described below, which was focused
purely on urban schools.
The socio-economic gap in education achievement also varies by region. Column 2
of Table 2 shows the FSM gap in the proportion of young people achieving 5 grades
A*-C at GCSE (including mathematics and English). Most striking is the fact that the
socio-economic gap in education achievement is around one third lower in London
than in the other regions. Thus London is a relatively average achieving area of
England but also one where the gap in education achievement between FSM and
non FSM students is relatively low. This is partly because non FSM students are
relatively poorer in London than elsewhere.
9 Source: Department for Children, Schools and Families http://www.dcsf.gov.uk/rsgateway/DB/SFR/s000822/index.shtml
12

Equally as has been said already, only a small proportion of FSM (3%) children live
in deprived areas and attend deprived schools. This of course limits the potential
effectiveness of area based initiatives because such interventions are then received
by many non deprived students. That said, a case can still be made for such
interventions as discussed further below under the Excellence in Cities programme
analysis.
Table 2: FSM/non-FSM gap in 20081 % achieving 5 grades A*-C GCSEs includingEnglish and Mathematics by Government Office Region Coverage: England FSM/ Non-FSM gap
Percentage achieving 5 A* to C including E & M Percentage difference
of those achieving 5 A* to C including E & M
NORTH EAST 44.6 30.2 NORTH WEST 46.9 30.6 YORKSHIRE & HUMBER 44.0 29.8 EAST MIDLANDS 46.5 30.0 WEST MIDLANDS 45.7 27.0 EAST OF ENGLAND 50.0 29.7 LONDON 49.9 20.5 SOUTH EAST 51.4 32.7 SOUTH WEST 49.0 30.8 ENGLAND 47.9 27.8 1. Figures for 2005 are based on revised data and figures for 2006, 2007 and 2008 are based on provisional data, to be comparable with the information published in the relevant Statistical First Releases.
Source: Department for Children, Schools and Families http://www.dcsf.gov.uk/rsgateway/DB/SFR/s000822/index.shtml
2.4 Social mobility
Another aspect of educational marginalization is social mobility, i.e. the extent to
which your parents’ characteristics determine your chances of achieving highly in
education and the labour market. Recently the UK Government have published a
White Paper on the issue (Cabinet Office, 2008). The evidence base on social
mobility suggests that immediately after World War II there was a rise in social
13
mobility in the UK, particularly as the number of white collar jobs increased. However
Blanden and Machin (2008) (see also Blanden, Gregg and Machin, 2005) found that
there had been some reduction in social mobility across two cohorts of men born in
1958 and 1970. Specifically they found that family income was a more important
determinant of both educational achievement and subsequent income levels for the
later cohort. This apparent fall in social mobility was a major motivation behind the
increased policy focus on this issue. This evidence is contentious and some
commentators argue that class based measures of social mobility are superior to
those based purely on income (Goldthorpe and Jackson, 2008). That said other
studies certainly confirm that there was no major improvement in social mobility
during this period (Ermisch and Nicoletti, 2005). International evidence indicates that
social mobility for UK males in the 1970s-1990s period was similar to the mobility
experienced by males in other European countries, although social mobility for UK
females was somewhat lower (Breen, 2004).
3. Policy responses
The policy emphasis in the UK in recent decades has been on tackling the two inter-
related problems of a) raising mean educational standards and b) reducing the gaps
in education achievement between different groups of students. Certainly since 1997
the government has professed their commitment to reducing educational
marginalization and since 1997 this goal has been made explicit in most pieces of
education legislation passed into law.
Educational marginalization has been tackled in two main ways. Firstly, there have
been numerous initiatives to raise standards in schools, to ensure that individuals
who do leave the school system at age 16 leave with a minimum level of skill. These
initiatives include greater accountability and market oriented reform of the schooling
system, as well as curriculum reform (Machin and Vignoles, 2005). Whilst some
policies, such as market reforms, are primarily about raising mean standards in
schools, policy-makers have recognized that the lowest levels of achievement are
found in the most deprived areas and certainly amongst deprived students. Thus
policies which raised standards, it was argued, were likely to help low achieving
14

students to a greater extent. Whether this has happened in practice is discussed
further below. The second policy thrust has been to encourage individuals to spend
more time in education, either by persuading them to stay on in school past the age
of 16, by encouraging them to enroll in higher education or by enabling them to return
to education and training later in life.
In 1988 quasi-market features were introduced into the UK education system.
Parents were given the power to choose their child’s school, with the idea that
schools would therefore become more accountable and this would tend to improve
educational standards. Alongside parental choice, the financial system allocated
resources to schools on the basis of student numbers. Thus schools had a clear
incentive to attract more students. In addition, better information on schools and pupil
performance was published (the so called “school league tables”), to help parents
make informed choices. So for the last two decades the English education system in
particular has relied partially on market forces to improve educational standards.
Yet the empirical evidence suggests that competition between schools has had only
a limited impact on mean education achievement (Bradley et al. 2001; Levacic, 2004;
Gibbons et al. 2008 Burgess and Slater, 2006). Nor has it substantially reduced the
extent of marginalization, at least as measured by the socio-economic gap in
education achievement. Some critics had argued that market reforms would in fact
increase educational marginalization, as more advantaged parents secure places for
their children in better quality schools thus widening gaps in achievement further and
increasing social segregation across schools. In fact this has not happened either
(Gorard et al. 2003; Allen and Vignoles, 2008). In general there has been a lack of a
competition effect (for good or bad). This is partly because market forces are
constrained in the UK. Good schools cannot expand indefinitely and policy-makers
try to avoid closing poor quality schools (they prefer to try to improve them by giving
them additional resources). This means that although parents have a free choice of
school, in practice parents still need to live very near to “good” oversubscribed
schools in order to gain access. In other words the introduction of parental choice
has not radically altered the pre-existing system of allocation to schools according to
residential location. It remains as true as ever that richer parents can afford to buy
more expensive houses near better schools and thus access to these good schools
15

is not equal: this is one route by which socio-economic educational marginalization
occurs.
The government has not left everything to the market however. The National
Challenge programme, for example, was launched in 2008. This programme
provided support to schools that did not achieve a minimum standard of at least 30%
of pupils in every school gaining five or more GCSEs at A*‐C, including both English
and mathematics. In 2008 around 400 schools did not meet this standard in England.
However, the number of “National Challenge Schools” has reduced markedly since
2007 when it stood at just over 600. Whilst additional resources were allocated to this
programme (£400m)10, it is difficult to confirm that this was genuinely additional
money as opposed to resources redirected from elsewhere in the education system,
and it is even more difficult to explain how such a dramatic improvement has been
brought about in such a short period of time and with only 27 school closures11. Another government policy, namely Every Child Matters (ECM), can also be seen as
a major attempt to both reduce the educational marginalization of some groups of
children (by forcing schools to focus on the lowest achievers) and to broaden the role
of the school system beyond academic achievement to non-cognitive outcomes,
such as children’s health or well being. It is not clear how ECM is going to lead to
reductions in marginalization in practice and the policy has not been fully evaluated.
What it has done however, at least in theory, is to require schools to focus more on
the “whole child” and increased schools’ concern with child welfare. In part this
reflects a backlash against a particular side effect of the market system, namely that
schools focus excessively on school league table results, potentially at the expense
of other aspects of children’s schooling. It also represents (implicitly) an
acknowledgement that some low achieving children face challenging family
circumstances and that schools need to play a pastoral role to help pupils overcome
this. Policies such as Every Child Matters and indeed Extended Schools (the latter
extends the role of schools to include breakfast clubs and after school clubs and
10 How much has been spent on each school under this programme has been subject to much public debate both in the media and in the House of Commons. Many schools have only received small amounts of funding. 11 http://www.dcsf.gov.uk/nationalchallenge/index.shtml
16

activities) can be seen as part of this attempt to tackle the factors associated with
educational marginalisation and to refocus attention on broader child outcomes.
We also noted earlier that there has been a distinct shift of public resources in the UK
towards the early years. Much of the considerable investments made in pre-school
provision have been designed specifically to reduce the socio-economic gap in
education achievement that emerges so early. One example of an intervention
targeting poorer parents in their children’s early years is Sure Start, a programme
modelled on the US HeadStart pre-school intervention, which provides advice,
health, nutrition, education and parenting support. Sure Start has been found to have
a positive impact on early achievement and to reduce the socio-economic gap12.
Likewise interventions in the primary school phase, such as the Literacy and
Numeracy Hours which prescribe how these subjects should be taught in primary
school, have also improved mean achievement and reduced the socio-economic gap
(Machin and McNally, 2004).
At the other end of the academic spectrum, public resources into higher education
have been reduced (at least on a per pupil basis). Tertiary students now are required
to pay tuition fees, although the fees are deferred and supported by income
contingent loans available for students. The net result of these tertiary financial
reforms has been to shift the burden of costs towards students. Recent evaluation of
these reforms has found firstly, no substantial negative impact on higher education
participation rates from the reform, and secondly no widening of the socio-economic
gap (Dearden et al., 2007). The latter finding is perhaps unsurprising given that
tuition fees are means tested and the poorest students are fully exempt from fees.
With these broad policy trends in mind, we now consider in more detail two specific
policies aimed at reducing educational marginalization.
3.1 Excellence in Cities
12 http://www.ness.bbk.ac.uk/documents/activities/impact/42.pdf
17

The Excellence in Cities (EiC) programme was a policy initiative aimed at improving
pupil achievement in deprived urban schools and was first introduced on a pilot basis
in 1999. Subsequently further schools were incorporated into Excellence in Cities
both during the pilot stage (to 2001) and afterwards when the programme was
implemented nationally. The initial pilots were targeted on inner city schools in the
most deprived circumstances.
The EiC programme was in fact not a single policy intervention. It was implemented
in a relatively diverse manner across different schools, i.e. the intervention was quite
different in different settings. In some schools the focus was on targeting students at
risk of failure, whilst in others it involved a greater focus on more able but deprived
pupils. The policy was also relatively modest in terms of the additional resources
allocated to it: EiC schools were funded at an additional £120 per pupil level initially
so the impact on achievement was likely to be modest. Expenditure then rose from
£24 million in the first year of the pilot (1999) to £386million in 2006 (Kendall et al.
2005).
Although describing the exact activities taking place in each school under the EiC
programme is not possible, most EiC schools included elements of the following
strands:
1. Gifted and talented programmes were targeted at the most able students. The
idea behind this initiative was to identify pupils in these deprived schools who
were capable of performing above their expected level. The programme would
then stretch and encourage them in their learning and provide some level of
individualized support. The extent to which this actually happened varied
hugely in practice and some teachers reported being uncomfortable with this
element of the programme and perceived it as elitist. Since the first EiC pilots,
identification of gifted and talented children has become routine in most
schools (although what happens to that information varies hugely by school).
2. Learning mentors were introduced to assist under achieving children. Learning
mentors provided support either in or outside the classroom and specifically
18

targeted support at children who were having trouble accessing the
curriculum, faced barriers to learning and were not making sufficient progress.
3. Learner Support Units to assist under achieving children were also introduced.
LSUs provided more structured support to pupils who were failing to achieve
academically and had behaviour and other types of difficulties that meant they
would benefit from having some time outside the classroom.
4. EIC Action Zones were set up, i.e. areas that were identified as being
educationally deprived were included into the EiC initiative and local
partnerships set up. The purpose of an area rather than a school based
approach was particularly to encourage different primary and secondary
schools in deprived urban areas to work together to raise standards.
5. In a few schools there were also City Learning Centres (CLCs) which were
technology units that provided information technology for young people
normally across a range of schools and community groups.
A comprehensive evaluation of EiC was carried out by the London School of
Economics (Machin et al. 2007) and the National Foundation for Education
Research13. The evaluation was very large with many interim findings and a number
of different methodological approaches were adopted for the evaluation with some
conflicting results. We focus largely on the quantitative evidence arising from the
evaluation as our interest is primarily in whether the EiC initiative reduced the extent
of educational marginalization in these inner city schools.
13A full list of research outputs from this evaluation is at http://www.nfer.ac.uk/research-areas/research-area-full-list.cfm?research_area=EIC&Ref=Excellence%20in%20cities.
19

We need to start the discussion with a methodological point. As has been discussed
earlier, only a relatively small percentage of poor students (FSM pupils) live in a poor
area and attend a deprived (high FSM school). Thus an area based approach will
inevitably miss many poor students who attend less deprived schools or who live in
less deprived areas. Equally an area based approach will incur considerable
deadweight loss, i.e. it will provide support or resources to pupils who are not
genuinely deprived but who happen to live in a deprived area and attend a deprived
school. Excellence in Cities was implemented however, as a school based
programme, and clearly many systematic problems relating to underachievement of
some pupils can only be dealt with at a school or an even more aggregate area level.
For example, the difficulties schools face in attracting and retaining good teachers is
clearly an area or school based problem rather than one facing an individual pupil. A
central question about EiC was therefore the extent to which it benefited poor (FSM)
pupils or whether the benefits were largely experienced by less deprived pupils in
EiC schools.
The quantitative research found that the impact of EiC varied across the stages of
education. The evaluators found that the greatest impact from EiC was on
mathematics achievement at age 14 in the most disadvantaged schools in the
programme. However, within these more deprived schools the impact of EiC on
mathematics test scores was greatest for medium and higher ability children. Effects
on English and Science were not found at this age and no effect from the programme
was found on GCSE scores at age 16. When the programme was implemented, all
schools in deprived urban Local Education Authorities were included in the EiC
programme. Yet as the programme only impacted on the most disadvantaged
schools, this suggests some deadweight loss. Nonetheless a variety of different
evaluations, using different methods, concluded that by and large EiC had a positive
impact, at least on some pupils in deprived schools, but that since it did not impact on
GCSE results and it tended to be more effective for medium/high ability children, its
impact on educational marginalization was relatively limited.
In terms of the impact of specific strands, again no impact on student achievement
was found for pupils making use of either a Learner Support Unit or a City Learning
Centre. Students using a Learning Mentor at Key Stage 3 (age 14) actually made
20
less progress than those who did not but there was qualitative evidence that Learning
Mentors helped some students overcome barriers to learning. There was no
evidence that EiC Action Zones had any impact either. Pupils designated as Gifted
and Talented did indeed have higher levels of education achievement but the
evaluation evidence does not suggest any causal impact from EiC on their
achievement (Kendall et al. 2005).
Funding for EiC as a specific initiative has ceased from 2006. Funding and indeed
the programme is now no longer distinct in the sense that there is no additional
budget from central government specifically for EiC schools and all schools are
expected to adopt the elements of the EiC programme (e.g. have a gifted and
talented programme). So EiC schools, i.e. those who were part of the original EiC
initiative, are now funded in the normal way, via a mix of funding from local and
central government. This does not mean they have experienced a cut in funding
however, as funding levels in primary and secondary schools have risen since 1997,
as detailed earlier, and deprived schools continue to be funded at a higher rate than
less deprived schools (as has always been the case in the UK). The extent to which
more deprived pupils, and indeed deprived schools, receive higher levels of funding
is in fact hard to determine. Research suggests that even though additional
resources are given to local government in areas with higher numbers of FSM
students, this resource does not necessarily reach the most deprived pupils nor their
schools (Thrupp and Lupton, 2006; West, 2009). Recent analysis by Sibieta et. al.
(2008) suggests that FSM pupils attract around 70% more funding than non FSM
pupils and that this premium has grown over time. Yet they also calculated that only
40-50% of the additional funds given to local authorities for FSM pupils actually goes
to the schools that these FSM pupils attend. This has been a major political issue
and the government has decreed that this proportion needs to rise to a minimum of
80% (DCSF, 2008).
In summary, EiC as an area based initiative was always destined to have a high level
of deadweight loss in that it was targeted at a wide range of students who attended
deprived schools. However, the results suggest that deadweight loss was not
necessarily the major concern. What was striking was the generally weak positive
impact from the EiC programme overall. This may have been partially linked to the
21

low level of funding and the fact that the programme was implemented in very
diverse ways in different schools making it difficult to uncover impact. Perhaps
teachers themselves can explain why the programme was not more effective.
Although the evaluation evidence suggests teachers viewed EiC favourably, it also
found that teacher turnover was not reduced and in fact teacher recruitment became
more difficult over the period (linked to fall in new teacher qualification rates). Since
teachers are arguably a more important determinant of children’s achievement than
schools (Rivkin et al. 2005), this fact may explain why this particular school based
initiative was not more effective.
3.2 Educational Maintenance Allowance
We now discuss a second major initiative implemented on a pilot basis in 1999 and
continuing to this day, namely the Education Maintenance Allowance (EMA). The
objective of the EMA was to raise post-compulsory educational participation and
retention in education of young people (age 16-19) from low income families.
Education Maintenance Allowances are weekly term time only payments made to
students aged 16-19 for staying on in full time education for 2-3 additional years. The
amount paid to the student varies and is means tested in the sense that EMA
eligibility was determined by family income level in the previous year. The EMA
scheme was designed to give young people from disadvantaged backgrounds an
added incentive to stay on in education and to help them meet some of the additional
costs associated with full time education. In 2008, it was reported in the House of
Commons that 556,702 young people aged 16-19 claimed EMA, around 35% of each
cohort14.
One unique feature of the Education Maintenance Allowance scheme is that it was
evaluated prior to national implementation and the evaluation design was very
methodologically robust (IFS, 2007)15. The EMA pilots were implemented in 1999,
14 This proportion is calculated from the Longitudinal Study of Young People in England and the Youth Cohort Study http://www.dcsf.gov.uk/rsgateway/DB/SBU/b000795/YCS_LSYPE_Bulletin_final.pdf 15 The evaluation design was based on a longitudinal cohort study of random samples of young people living in EMA pilot areas and control areas.
22

extended to about a third of the country between 2000-2004 and in 2004, the EMA
was rolled out throughout the UK.
The evaluation of the EMA indicated a positive impact on education participation for
those eligible for EMA, i.e. more deprived students from low income families.
Specifically, the introduction of EMA appears to have lead to an increase in
education participation at age 16 of 4.5 percentage points among those eligible for
the EMA. This improvement in the participation rate of the most deprived students is
in the context of an average education participation rate of 64.7% in the control
sample (Dearden et al. 2005). A follow up study (Dearden et al. 2007), using more
recent but somewhat lower quality data, found a smaller impact from EMA on
participation (2-3 percentage points) and only for Whites. Since EMA raised the
education participation rate of deprived students, it directly narrowed the socio-
economic gap in participation post age 16. The EMA was therefore successful in
terms of its objective of reducing educational marginalisation. However, the evidence
on the impact of EMA on education achievement (i.e. qualifications achieved) and
indeed subsequent labour market progress is less clear. Dearden et al. (2007) found
no significant impact from EMA on female qualification rates and only small effects
for males. In other words, although paying poorer students to remain on in full time
education may have induced them to do so, the impact on their educational
achievement in the long run is not proven. This is an important point given the recent
decision by the UK government to extend compulsory education and training to age
18.
4. Future policy development
This section discusses the likely impact of policies introduced by the recent
Government White Paper on social mobility and the extent to which they are likely to
break the cycle of educational marginalization in the UK.
The White Paper recognized the educational marginalization of some UK students;
specifically, it highlighted the under achievement of students from deprived
23

backgrounds as documented in this paper. The White Paper also acknowledged that
gaps in educational achievement emerge incredibly early and thus suggests a
number of pre-school policies to address early educational marginalization. The
White Paper also confirmed that the socio-economic gap in education achievement
widens, at least in the secondary phase. A number of policies have been put forward
to solve this problem. In particular, building on the Excellence in Cities policy
described above, the Government has already implemented a programme which
targets additional resources at deprived schools (this includes The National
Challenge programme described earlier to achieve minimum standards in all
schools).
Perhaps the most radical proposal in the White Paper to reduce marginalization is
the use of greater personalization for pupils at risk of under achievement. Some
programmes have already been implemented in this regard, namely Every Child a
Reader/Writer, and now Every Child Counts aimed at those in the bottom 5% of
education achievement. These programmes provide additional tutoring (on a one-to-
one basis in theory) for under achieving children. There is as yet no full evaluation of
the impact of the existing programmes. There is also a similar tutoring programme for
children about to enter secondary school who are at risk of falling behind. The White
Paper proposed that £1.6 billion nationally be spent on these types of programmes.
Another key initiative in the White Paper is a package of policies to encourage better
teachers to work in the most deprived schools, again with the aim of reduction socio-
economic marginalization. This package will include additional payments to teachers
for sustained work in deprived schools.
At the school level, the White Paper proposes that the current system of league
tables which measure the contextualized value added of each school be
supplemented with a broader range of measures of school success (a “school report
card”). As discussed above, this is a further attempt to refocus schools on broader
outcomes from education and to mitigate the undue focus on academic achievement
and targets. The White Paper is not clear as to how these broader indicators of
school success will be measured in practice. However, the suggestion is that the
24

focus will switch from an emphasis on mean pupil achievement to a focus on
variances in achievement within schools and statutory targets that are aimed
specifically at marginalized groups. Thus there will be targets specifically for
improving the educational achievement of poorer pupils (i.e. those eligible for Free
School Meals).
Again as mentioned earlier, the most major policy reform with the potential to
increase education achievement is the raising of the age for leaving full-time
education to 18 by 2015. Its impact very much depends on what pupils do when they
remain in education (see comments about the modest impact of EMA on actual
achievement above). Linked to this the White Paper also promised a review of how
16-18 year olds would be funded given that they now have to remain in full time
education longer. In addition better advice and guidance is promised to guide these
students through the system.
6. Conclusions In summary, the major source of educational marginalisation in the UK is socio-
economic. Gender gaps interact with socio-economic gaps so that poor boys are
particularly vulnerable to educational marginalisation. The evidence also suggests
these gaps emerge early and remain entrenched in primary school and widen in the
secondary phase. Some progress has certainly been made in reducing the socio-
economic gap in education achievement during the last decade or so but it remains
large.
So which policies have been most effective in reducing educational marginalisation,
albeit by a modest amount? The UK, unlike most other education systems, has for
some time followed a quasi-market approach to education policy (parental choice
and markets were introduced to the system in 1988). This has not had a huge impact
on overall educational standards but equally nor has it increased or reduced
educational marginalisation to any great extent. Therefore although the fears that
markets in education inevitably lead to greater educational marginalisation have not
25

been realised, the potentially positive effects of markets have not come to pass
either.
Reducing educational marginalisation has been the major policy objective in recent
legislation and initiatives. Policy-makers have recognised however that much of the
socio-economic gap in education achievement is related to factors outside the school
system. Thus policies such as Every Child Matters or Extended Schools attempt to
both involve parents in their children’s schooling and to broaden the role of schools to
undertake activities often done by parents (e.g. homework supervision). The
effectiveness of these policies has not yet been evaluated, although on the basis of
previous broadly targeted interventions we might worry that they will tend to benefit
the less deprived students rather than necessarily reduce marginalisation.
In this paper, we highlighted two specific approaches to reducing marginalisation.
Interventions to raise standards in the most deprived schools, such as the Excellence
in Cities programme, and policies to encourage greater participation of poor children,
such as Education Maintenance Allowances. Both have had some impact but neither
has substantially reduced the socio-economic gap in education achievement (as
opposed to participation). EMA did however, at least raise education participation of
poorer students post age 16. On the basis of just two policies it would be dangerous
to conclude that area based initiatives like EiC are inherently flawed and an individual
approach like EMA is best (see Lupton, Heath and Salter, 2008). Indeed many of the
difficulties that deprived students face in deprived schools are systemic and can only
be addressed at the whole school level or even at a more aggregate level16.
However, there are difficulties inherent in area based approaches, including the
significant deadweight loss as more advantaged pupils in deprived areas tend to
benefit disproportionately from such interventions. One can see the increased
emphasis on personalisation in the recent White Paper, as described in the previous
section, as one reflection of the shift to more individual based approaches.
16 Such as the difficulties of attracting good teachers to schools with disadvantaged intakes, which has been recognised in the recent White Paper as described above. See also Tunstall and Lupton (2003) for an analysis of the effectiveness of area based targeting.
26

So what does work to reduce educational marginalisation? The evidence base is
optimistic about the effectiveness of some key UK policies in the Early Years and
Primary school phase, such as The Literacy and Numeracy Hours and Sure Start.
Such policies improved children’s learning and led to both mean improvements in
standards and some narrowing of the socio-economic gap in achievement. Thus the
recent White Paper’s continued emphasis on early investment is to be welcomed.
Only by putting in place policies to reduce educational marginalisation early on in the
system can we be hopeful that policies that extend education participation later on
(e.g. EMA or raising the education participation age to 18) will genuinely reduce gaps
in educational achievement. Early intervention is a necessary but not sufficient
response to marginalisation however. Further investments in later years, targeted at
marginalised students and building on success in early years are also needed
(Cunha and Heckman, 2008). In particular the evidence base points to the
importance of teachers and interventions to improve the quality of teachers in
deprived areas and schools are also likely to be most effective.
6. References
Allen, R. and Vignoles, A. (2007) ‘What Should an Index of School Segregation
Measure?’, Oxford Review of Education, Vol. 33 No. 4.
Barreau, S., P. Carneiro, H. Chowdry, C. Crawford, L. Dearden, A. Goodman, P.
Gregg, L. Macmillan, L. Sibieta, K. Sylva & L. Washbrook (2008) “The socio-
economic gradient in child outcomes: the role of attitudes, behaviours and beliefs”,
Interim Report for the Joseph Rowntree Foundation, July 2008.
Blanden, J., Gregg, P. and Machin, S. (2005), ‘Educational Inequality and
Intergenerational Mobility’, in Stephen Machin and Anna Vignoles (eds), What’s the
Good of Education?, Princeton University Press.
Blanden and Machin (2008) Up and Down the Generational Income Ladder in
Britain: Past Changes and Future Prospects.
27

Bradley, S., Johnes, G. and Millington, J. (2001) “The effect of competition on the
efficiency of secondary schools in England” European Journal of Operational
Research, 135: 545-568.
Breen (2004) Social Mobility in Europe.
Burgess, S. and Slater, H. (2006) “Using boundary changes to estimate the impact of
school competition on test scores”, CMPO working paper 158.
Cabinet Office (2008) ‘Getting on, getting ahead – A discussion paper: analyzing the
trends and drivers of social mobility’, Cabinet Office The Strategy Unit, November.
Cassen, R. and Kingdon, G. (2007) Tackling Low Achievement, Report for The
Joseph Rowntree Foundation,
http://www.aimhighereastofengland.org.uk/clientUpload/resource/2063-education-
schools-achievement.pdf
Chowdry, H., C. Crawford, L. Dearden, A. Goodman and A. Vignoles (2008),
Widening Participation in Higher Education: analysis using linked administrative data,
Institute for Fiscal Studies Report No. R69, mimeo.
Cunha F. and Heckman, J. (2008) “Formulating, identifying, and estimating the
technology of cognitive and noncognitive skill formation”, Journal of Human
Resources (forthcoming)
Dearden, L., Emmerson, C., Frayne, C. and Meghir, C. (2005), ‘Education and
School Drop-Out Rates’, forthcoming Centre for the Economics of Education
Discussion Paper.
Dearden, L., Fitzsimons, Goodman, A. and Kaplan, G. (2007) ‘Higher education
funding reforms in England: the distributional effects and the shifting balance of
costs’, Economic Journal Features, 118, 526, pp.F110-125 (see also Institute for
Fiscal Studies Working Papers, http://www.ifs.org.uk/publications/4077).
28

Dearing, R (1997) Higher Education in the Learning Society, Report of the National
Committee, National Committee of Inquiry into Higher Education (HMSO: Norwich).
Department for Children, Schools and Families (2008) ‘Deprivation and Education:
The evidence on pupils in England, Foundation Stage to Key Stage 4’,
http://publications.dcsf.gov.uk/eOrderingDownload/DCSF-RTP-09-01.pdf .
Ermisch and Nicoletti (2005) Intergenerational Earnings Mobility: Changes Across
Cohorts in Britain.
Feinstein, L., (2003), "Inequality in the Early Cognitive Development of British
Children in the 1970 Cohort," Economica 70(277): 73-97.
George, A., Hansen, K., and Schoon, I. (2007). Child Development. In K. Hansen &
H. Joshi (Eds.), Millennium Cohort Study. Second Survey. A User's Guide to Initial
Findings. London: Institute of Education, Centre for Longitudinal Studies.
Gibbons, S., S. Machin, and O. Silva, (2008) ‘Choice, Competition and Pupil
Achievement,’ Journal of the European Economic Association, 6 (4): 912-947.
Gibbons, S., and O. Silva, (2005), ‘Competition and School Stratification,’
forthcoming Centre for the Economics of Education Discussion Paper
Goldthorpe, J. and Jackson, J (2008) ‘Education-Based Meritocracy: the Barriers to
its Realisation’ in A. Lareau and D. Conley, eds., Social Class: How Does it Work?
Russell Sage Foundation, New York.
Gorard, S., Taylor, C., and Fitz, J. (2003) Schools, markets and choice policies.
RoutledgeFalmer, London.
H M Government (2008) New Opportunities White Paper - Fair Chances for the
Future, White Paper, Cabinet Office: http://www.hmg.gov.uk/newopportunities.aspx
29

IFS (2007) Education maintenance allowance: Evaluation with administrative data.
Kendall, L., O’Donnell, L., Golden, S., Ridley, K., Machin, S., Rutt, S., McNally, S.,
Schagen, I., Meghir, C., Stoney, S., Morris, M., West, A., and Noden, P. (2005)
Excellence in Cities; The National Evaluation of a Policy to Raise Standards in Urban
Schools 2000-2003, Department for Children Schools and Families, Research Report
RR675B.
RESEARCH
Levacic, R. (2004) “Competition and the performance of English secondary schools:
further evidence”, Education Economics, 12: 179-194.
Lupton, R. (2006) “Schools in Disadvantaged Areas: Low Attainment and a
Contextualised Policy Response”, in H.Lauder, P.Brown, J.Dillabough and A.H.
Halsey (eds.), Education, Globalization and Social Change, Oxford University Press.
Lupton, R., Heath, N. and Salter, E. (2008) ‘Education: New Labour’s Top Priority’ in
J. Hills (ed) Towards a more equal society, Policy Press, UK.
Lupton, R. and Tunstall, R. (2004) ‘Is Targeting Deprived Areas an Effective Means
to Reach Poor People? An assessment of one rationale for area-based funding
programmes’, London School of Economics, Paper No' CASE 070.
Machin, S. and McNally, S. (2004), ‘The Literacy Hour’, Institute for the Study
of Labor (IZA) Discussion Paper 1005, Bonn, Germany.
Machin, S., McNally, S. and Meghir, C. (2007), ‘Resources and Standards in
Urban Schools’, Centre for the Economics of Education Discussion Paper 79,
London School of Economics, http://cee.lse.ac.uk/cee%20dps/ceedp76.pdf.
Machin, S. and Vignoles, A. (2005) What’s the Good of Education?: The Economics
of Education in the UK, Princeton University Press: Princeton and Oxford.
OECD (2008) Education at a Glance, OECD: Paris.
30

31
Sibieta, L., Chowdry, H. and Muriel, A. (2008) Level playing field? The implications of
school funding. CFBT. http://www.ifs.org.uk/docs/level_playing.pdf
Raffo, C., Dyson, A., Gunter, H., Hall, D., Jones, L. and Kalambouka, A. (2007)
Education and Poverty: a critical review of theory, policy and practice. Joseph
Rowntree Foundation.
http://www.jrf.org.uk/bookshop/eBooks/2028‐education‐poverty‐theory.pdf
Rivkin, S.G., Hanushek, E.A., and Kain, J.F. (2005) ‘Teachers, Schools and
Academic Achievement’, Econometrica, Vol. 73, No. 2 (March, 2005), 417–458.
Teddlie, C. and Reynolds, D. (2000) The International Handbook of School
Effectiveness Research, Reynolds, Falmer Press, London and New York.
UNICEF
Thrupp, M. and Lupton, R. (2006) Taking school contexts more seriously: the social
justice challenge. British Journal of Educational Studies, 54:3, 308‐328.
West, Anne (2009) Redistribution and financing schools in England under Labour:
are resources going where needs are greatest? Education management,
administration and leadership, 37 (2). pp. 158-179. ISSN 1741-1432.
Wilson, D., Burgess, S. and Briggs, A. (2005) The Dynamics of School Attainment of
England's Ethnic Minorities. CMPO DP # 05/130.