explaining and overcoming marginalization in education: a...
TRANSCRIPT

2010/ED/EFA/MRT/PI/11
Background paper prepared for the Education for All Global Monitoring Report 2010
Reaching the marginalized
Explaining and overcoming marginalization in education: a focus on ethnic/language minorities in
Peru
Santiago Cueto, Gabriela Guerrero, Juan León, Elisa Seguin & Ismael Muñoz 2009
This paper was commissioned by the Education for All Global Monitoring Report as background information to assist in drafting the 2010 report. It has not been edited by the team. The views and opinions expressed in this paper are those of the author(s) and should not be attributed to the EFA Global Monitoring Report or to UNESCO. The papers can be cited with the following reference: “Paper commissioned for the EFA Global Monitoring Report 2010, Reaching the marginalized” For further information, please contact [email protected]

Explaining and overcoming marginalization in education: a focus on ethnic/language minorities in Peru
Santiago Cueto, Gabriela Guerrero, Juan León, Elisa Seguin & Ismael Muñoz
GRADE
I. Introduction In the past few decades, education in Peru has shown a tendency to increased enrollment, especially in primary schools, and consistent low achievement as measured by national and international standardized tests in reading comprehension and mathematics. However, averages hide wide disparities in diverse educational outcomes, which are often times marked by individual and family characteristics. Among these, coming from an indigenous speaking family1 has been shown to be an important predictor of low educational outcomes as compared to the majority of Spanish-speaking children (Cueto, 2007). It is important to note from the outset however, as shown below, that having an indigenous maternal language is also associated with other individual and family characteristics, such as being poor and living in a rural environment; and that these two are also associated with low educational achievement. The combination of these variables makes for a compounded negative effect on educational outcomes. Peruvian law and international agreements, such as the goals set forth in Education for All, call for a reduction in inequalities and increase of educational quality. The purpose of this paper is to present and discuss empirical information on the educational opportunities and outcomes of indigenous speaking children as compared to their Spanish-speaking counterparts in Peru. This paper is organized as follows: after this brief introduction we present several social and economic indicators for indigenous and Spanish-speakers in Peru. The third section presents descriptive information on diverse educational outcomes for these groups and a multivariate analysis of the determinants of achievement, decomposing the factors that predict the gap between indigenous and Spanish-speakers. The fourth section describes intercultural bilingual policies and its implementation. The final section presents some preliminary conclusions and suggestions for further research and policies. For the analysis we rely on several secondary data sources; however all estimates presented below were calculated by the authors. References to previous studies on relevant topics, performed in Peru and Latin America, are included throughout the paper. II Characteristics of Indigenous and Spanish-speaking populations in Peru In this first section we present some characteristics of the indigenous-speaking population in Peru. As shown in Table 1, the number and percentage of Spanish-speakers has grown between 1993 and 2007 (when the last two National Censuses were conducted). On the other hand, while the number of persons with an indigenous tongue has increased, its percentage among the national population has diminished. There are over 40 indigenous languages spoken in Peru, most in the jungle and with a relatively small number of speakers (Zúñiga, 2008). Quechua is the most frequent indigenous language and is spoken widely in the Andes. Aymara is the
1 The authors realize that maternal language is not a comprehensive indicator of ethnicity; however it is a proxy for being a member of an indigenous group that is usually available in data bases and used in empirical studies in Peru and Latin America. Other studies (e.g. Figueroa and Barron, 2005) have used geographical and historical indicators to identify ethnic groups. Their conclusion is that in Peru “indigenous populations are second rate citizens” (p. 2).

second most frequent indigenous language, spoken mostly in the Southern part of the Peruvian Andes2.
Table 1: Peru’s population by mother tongue (3 years old and older)
Maternal language 1993 2007
Quechua 3,177,937 3,360,331 16.5% 13.0%
Aymara 440,380 443,248 2.3% 1.7%
Other native languages 132,174 242,134 0.7% 0.9%
Total population with indigenous mother tongue
3,750,491 4,045,713 19.4% 15.7%
Spanish 15,405,014 21,713,165 79.8% 84.1%
Foreign Language 35,118 21,434 0.2% 0.1%
Deaf-mute/ no answer 117,980 30,019 0.6% 0.1%
Total 19,308,603 25,810,331 Source: National Census 1993 and National Census 2007.
According to Peruvian Constitution3 (article 48, issued in 1993) Spanish is the official language of the country but indigenous languages are also official in the places where they are “predominant”, although no operational definition for this term is provided4. To characterize the country, perhaps it is important to note a few idiosyncrasies. For example, the language used by the President in addressing the country, by most newspapers and TV stations, official documents, and in political instances such as Congress is Spanish, although of course there are important regional differences (e.g. some regional presidents might give public speeches or part of their speeches in an indigenous language). In this context it has become increasingly unlikely to find a school-age person who speaks no Spanish at all (this would be more likely in older adults or infants in relatively isolated rural areas); education has probably had a large role to play in this, as most lessons at school are carried out in Spanish (see the description of the government’s bilingual education program below). Hence Spanish is clearly the dominant language in a country that still has an important presence of indigenous languages. From now on we will merge all speakers with an indigenous mother tongue (i.e. reported having an indigenous tongue as the first one learned at home, although many could be bilingual, especially those who learned first an indigenous language) into a single “indigenous” group. Although there could be some important differences in the characteristics of children from different indigenous groups, the data bases available are usually not able to capture a representative sample of each group; thus the results given below should be interpreted with this limitation and considering the relative predominance of Quechua speakers among the indigenous group. 2 For a map of Peruvian indigenous languages see http://portal.perueduca.edu.pe/boletin/boletin24/mapa.htm. 3 http://www.tc.gob.pe/legconperu/constitucion.html 4 The Public Law 28106, approved by Congress in 2003, declares of national interest the preservation, promotion and dissemination of indigenous languages.
2

The following analyses were done using the National Household Survey (ENAHO) dataset. Table 2 shows the distributions of indigenous and Spanish-speakers by geographical area (Coast, Andes and Jungle) and area of residence (urban or rural). As shown, the highest proportion of indigenous households is located in rural areas, especially in the Andes, although many live in urban areas (which would be the result of migration for the most part). As in many developing countries, rural areas are less well connected to capital of districts and provinces because of lack or bad conditions of roads. Rural areas tend also to lack or have poorer basic services, such as electricity, running water and sewage (see Table 3), but also public services such as hospitals, secondary schools or universities. Table 2: Distribution of households by region and area of residence (Number and percentage)
Coast Andes Jungle
Urban Rural Urban Rural Urban Rural
Indigenous 426,862 39,719 379,498 935,026 30,202 118,416
6.2% 0.6% 5.5% 13.5% 0.4% 1.7%
Spanish 2,804,032 321,226 527,676 635,710 363,521 325,275
40.6% 4.7% 7.6% 9.2% 5.3% 4.7% Source: Enaho (National Household Survey) 2007.
Table 3: Household Access to basic services
Water Sewage Electricity
Urban Rural Urban Rural Urban Rural
Indigenous 80.5% 29.4% 72.3% 5.5% 93.5% 48.8%
Spanish 85.0% 36.0% 79.6% 9.8% 96.5% 44.4%
Total 84.2% 33.0% 78.3% 7.8% 95.9% 46.4% Source: Enaho 2007.
This information is consistent with literature reviews. Trivelli (2000) has shown that over time the population in rural areas has had higher indices of poverty than their urban counterparts. Given the above, it is not surprising that indigenous speakers are more likely to be poor than their Spanish-speaking counterparts. While the percentages of poor and extremely poor have diminished between 1997 and 2007, the gap favoring Spanish speakers is still wide (see Table 4). Table 4: Households by level of poverty5
1997 2007
Indigenous
Extreme poor 28.8% 22.5% Poor 32.5% 29.6% Not Poor 38.7% 47.9%
Spanish Extreme poor 8.4% 6.2% Poor 27.2% 19.2% Not Poor 64.4% 74.6%
5 Although ENNIV and ENAHO surveys have different sample designs and different methodologies for the collection of information on consumption - and thus results are not strictly comparable-, we decided to present poverty estimates from both sources as an approximation to the relative standings of indigenous people living in poverty over time.
3

Source: Enniv 1997 and Enaho 2007. The above information is consistent with other analysis, for example Trivelli (2005) has found that indigenous-speaking populations are 11% more likely to be poor than their Spanish-speaking counterparts, but this is especially so in rural areas and for older women. Escobal and Ponce (2007) have performed econometric analysis to suggest that there are direct and indirect social exclusion mechanisms operating in Peru for indigenous speaking populations, especially when they live in areas with high concentration of indigenous-speakers, which limit their possibilities to better economic opportunities, including access to public services and the job market. In regards to illiteracy for populations age 15 and older, Table 5 shows that the prevalence is much higher among indigenous-speakers. Most illiterates are women living in rural areas (Webb and Fernandez Baca, 2008), although the gender difference in educational levels in general seems to have disappeared for younger populations, at least in terms of school enrollment. Table 5: Adult illiteracy rates by mother tongue (15 year-old and older)
Literate Illiterate
Indigenous
2,527,309
671,424 79% 21%
Spanish 15,159,800 674,014 96% 4%
Total 17,695,066 1,359,558 93% 7%
Source: National Census 2007. Below we present some specific information on the education of indigenous children as compared to their Spanish-speaking counterparts. III. Education opportunities and outcomes for indigenous and Spanish-speaking populations in Peru In this section we present information on several types of educational indicators to compare the two groups of interest. First we present descriptive statistics for educational inputs, enrollment and outputs (including achievement). The inputs are presented to understand the educational opportunities children from different groups have had: if all children had had similar educational experiences then differences in outcomes would be largely the result of individual and family variables. If on the other hand indigenous children have less educational opportunities then the outcomes would be the result of a combination of individual and family variables with school experiences. Policies favoring equity would require that children from poorer backgrounds (including indigenous children) would get similar or improved conditions as compared to their richer peers, and furthermore programs that attend to their specific characteristics (i.e. equity in opportunities does not necessarily imply that all children should be treated the same). Specifically, indigenous children would require an educational experience that takes into account their cultural and language background, such as bilingual education. It is important to note that more information is available from national surveys on outcomes, some on input and next to nothing on educational processes in the classroom; getting further
4

information on the last two is an important topic for future educational studies in Peru. Below is a sample of the information we were able to gather.
3.1 Input indicators
In this paper we consider several school characteristics as educational inputs. While it would be difficult to establish a direct causal link between any of these and specific educational outcomes, given that all the data we have been able to access is cross-sectional, we have chosen a few inputs that have face validity as desirable characteristics of a school. To compare across schools we present inputs for four types of schools: Schools managed under a private administration (mostly urban, mostly Spanish speakers) are differentiated from those managed under a public administration (depending on the national and/or regional or local governments). Private schools usually charge a fee, while public schools are free (although some expenses may be expected to be paid by parents, such as a fee for the parents’ association). Within the public schools we differentiate: public urban (mostly Spanish speakers) and rural. The definition of urban and rural comes from the Ministry of Education and depends on the number of persons living in the site were the school is located. Rural schools are further divided into indigenous and Spanish; indigenous rural schools are those where more than 50% of the students speak an indigenous language. This classification covers all schools in Peru. Tables 6 and 7 show the results for several inputs in the four types of schools just described for primary and secondary education. The data comes from the School Census, which is a survey completed annually by each school principal. Since the information is not verified independently, some of it could be inaccurate but it is still the best source of information for the conditions under which Peruvian children attend school6. Table 6: School inputs in Primary Education
Private Schools (n=7,558)
Public Urban Schools (n=5,694)
Public Rural Schools
(Spanish)1/
(n=16,499)
Public Rural Schools
(Indigenous)1/
(n=6,255) n (%) n (%) n (%) n (%)
Infrastructure
Library 3,889 (51) 2,742 (48) 4,695 (28) 1,279 (20)
Computer Lab 4,718 (62) 2,343 (41) 595 (4) 201 (3)
Court or field 1,406 (19) 2,221 (39) 1,421 (9) 694 (11)
Basic services
Electricity 6,448 (85) 4,805 (84) 4,880 (30) 2,277 (36)
Running water 6,059 (80) 4,307 (76) 5,184 (31) 1,835 (29)
Sewage 6,721 (89) 4,426 (78) 6,166 (37) 2,231 (36)
Teachers and Staff
Administrative staff available (1 or more)
1,492 (20) 119 (2) 72 (0) 38 (1)
Teacher's attainment Teacher's education (Tertiary -Pedagogical studies)
44,224 (96) 73,459 (99) 41,516 (98) 16,244 (98)
6 The school census is completed by all schools at the preschool, primary and secondary levels. Historically, between 2 and 4% of schools do not complete the Census. For 2006, 2.6% of schools did not complete the Census.
5

Teacher's education (Tertiary – Other studies)
1,729 (4) 524 (1) 442 (1) 195 (1)
Teacher's education (Secondary)
121 (0) 203 (0) 268 (1) 157 (1)
Multigrade schools 1,444 (19) 900 (16) 8,354 (51) 3,514 (56)
Student per teacher ratio 15 24 22 23
Total enrollment 754,370 (19) 1,908,459 (48) 930,057 (23) 374,411 (9) Percentage of students with an indigenous mother tongue 2 6 1 98
Source: School census 2007 1/ No indigenous Public Rural Schools: less than 50% of students have an indigenous language as their mother tongue. Indigenous Public Rural Schools: more than 50% of students speak an indigenous language.
Table 7: School inputs in Secondary Education
Private Schools (n=4,268)
Public Urban Schools (n=3,789)
Public Rural Schools (Spanish)1/
( n=2,394)
Public Rural Schools
(Indigenous)1/ (n=853)
n (%) n (%) n (%) n (%)
Infrastructure
Library 2,555 (60) 2,543 (67) 1,081 (45) 288 (34)
Computer Lab 2,990 (70) 2,196 (58) 442 (18) 155 (18)
Court or field 1,176 (28) 1,918 (51) 509 (21) 183 (21)
Basic services
Electricity 3,767 (88) 3,477 (92) 1,395 (58) 535 (63)
Water 3,571 (84) 3,045 (80) 1,107 (46) 308 (36)
Sewage 3,779 (89) 2,931 (77) 1,157 (48) 321 (38)
Teachers and staff
Administrative staff (1 or more)
1,388 (33) 257 (7) 91 (4) 12 (1)
Teacher's attainment Teacher's education (Tertiary – Pedagogical Studies)
41,834 (87) 83,131 (98) 18,302 (97) 6,461 (97)
Teacher's education (Tertiary – Other Studies)
6,059 (13) 1,843 (2) 497 (3) 205 (3)
Teacher's education (Secondary)
115 (0) 187 (0) 42 (0) 16 (0)
Student/teacher ratio 18 28 19 21
Total enrollment (nº students) 560,192 (22) 1,608,400 (64) 264,910 (10) 95,461 (4) Percentage of students with native mother tongue 3 9 1 97
Source: School Census 2007
6

1/ No indigenous Public Rural Schools: less than 50% of students have an indigenous language as their mother tongue. Indigenous Public Rural Schools: more than 50% of students speak an indigenous language.
What follows are comments for both primary and secondary schools, unless noted. In terms of infrastructure, it is worth noting how libraries and computer laboratories are more likely to be present in private schools, followed by urban public schools and then, much below, rural schools. Within the latter there are only small differences between schools attended mostly by Spanish and indigenous-speakers. It is interesting that private schools are less likely to report having a court or field than urban public schools; this could be due to the fact that many operate in an infrastructure that was not designed as a school but has been adapted (e.g. a large house) and hence have no space for this. In terms of public services, private schools and urban public schools are very similar, with rural schools less likely to have electricity, running water or electricity and little differences between the two types of rural schools. Private schools are much more likely than public schools to have administrative support staff. There are almost no differences in the percentage of teachers with a higher education degree. This is due to a great effort from the government in the 90’s to give incentives to getting such degrees (although there is no empirical evidence on whether or not teacher performance increased as a result of this). In primary, it is important to note that rural schools in general are more likely to be multigrade; this means that in one classroom students from different grades will be placed under the supervision of a teacher. The number of grades in a classroom can go from two to six (i.e. all grades in primary school). Students of multigrade schools have consistently shown poorer results in standardized tests, but this could be a combination of poor educational services and the characteristics of students that attend these schools. There are no multigrade schools in secondary. Regarding differences between primary and secondary, it is interesting how there are many more primary than secondary schools; many primary schools are located in rural areas and are smaller in terms of student enrollment than secondary schools, which tend to be urban and larger. This means that for many rural students (including those with an indigenous mother tongue, as shown in previous tables), attending secondary schools means they have to go to an urban school, be it that they move to an urban area altogether or have to commute (usually walk) every day for several hours. In general, the differences are clear in inputs between public urban and rural schools, favoring the former. This is most likely due to the relative isolation of rural schools (e.g. roads are in poor conditions or inexistent) and they enroll less students than urban schools. Hence it is cheaper to implement better conditions in public urban schools. This has been identified as an important problem for several years now, and in 2003 a program from the government with World Bank support, called PEAR (Educational Program for Rural Areas), was approved. The program was for rural education in general, but had a specific component for indigenous children. The program had a budget of $USD 94.20 million, $USD 41.7 financed by the government of Peru and $USD 52.50 by the World Bank However, the program was discontinued in December 2008 due to poor financial and technical management, and it has not been followed by a similar program7. Rural education is still an important policy issue in Peru, as it closely linked to several forms of inequality.
3.2 Enrollment
7 For the World Bank report on PEAR see World Bank (2008). Implementation Completion and Results Report (IBRD-71760) on a Loan in the Amount of (US$52.5 million) to the Republic of Peru for a Rural Education Project in Support of the First Phase of the Rural Education Program. Report No: ICR0000862.
7
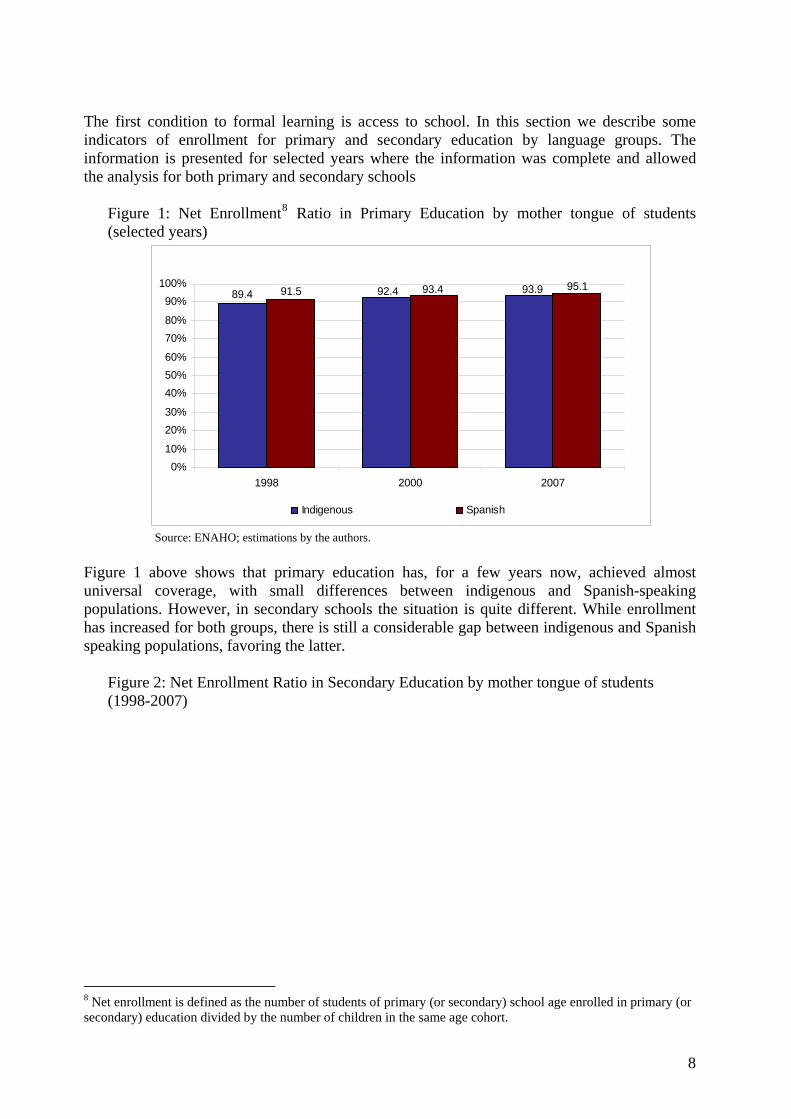
The first condition to formal learning is access to school. In this section we describe some indicators of enrollment for primary and secondary education by language groups. The information is presented for selected years where the information was complete and allowed the analysis for both primary and secondary schools
Figure 1: Net Enrollment8 Ratio in Primary Education by mother tongue of students (selected years)
93.992.489.495.193.491.5
0%10%
20%30%
40%50%60%
70%80%
90%100%
1998 2000 2007
Indigenous Spanish
Source: ENAHO; estimations by the authors.
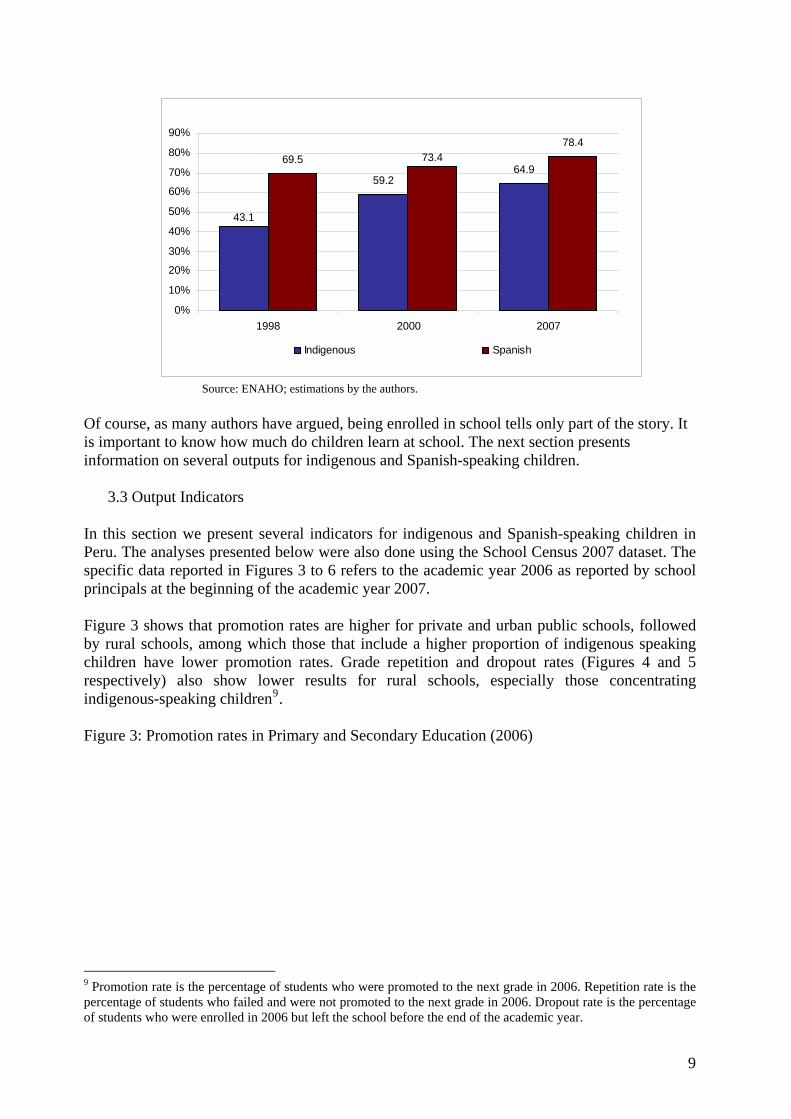
Figure 1 above shows that primary education has, for a few years now, achieved almost universal coverage, with small differences between indigenous and Spanish-speaking populations. However, in secondary schools the situation is quite different. While enrollment has increased for both groups, there is still a considerable gap between indigenous and Spanish speaking populations, favoring the latter.
Figure 2: Net Enrollment Ratio in Secondary Education by mother tongue of students (1998-2007)
8 Net enrollment is defined as the number of students of primary (or secondary) school age enrolled in primary (or secondary) education divided by the number of children in the same age cohort.
8
59.264.9
69.578.4
43.1
73.4
0%
10%
20%
30%
40%
50%
60%
70%
80%
90%
1998 2000 2007
Indigenous Spanish
Source: ENAHO; estimations by the authors.
Of course, as many authors have argued, being enrolled in school tells only part of the story. It is important to know how much do children learn at school. The next section presents information on several outputs for indigenous and Spanish-speaking children.
3.3 Output Indicators
In this section we present several indicators for indigenous and Spanish-speaking children in Peru. The analyses presented below were also done using the School Census 2007 dataset. The specific data reported in Figures 3 to 6 refers to the academic year 2006 as reported by school principals at the beginning of the academic year 2007. Figure 3 shows that promotion rates are higher for private and urban public schools, followed by rural schools, among which those that include a higher proportion of indigenous speaking children have lower promotion rates. Grade repetition and dropout rates (Figures 4 and 5 respectively) also show lower results for rural schools, especially those concentrating indigenous-speaking children9.
Figure 3: Promotion rates in Primary and Secondary Education (2006)
9 Promotion rate is the percentage of students who were promoted to the next grade in 2006. Repetition rate is the percentage of students who failed and were not promoted to the next grade in 2006. Dropout rate is the percentage of students who were enrolled in 2006 but left the school before the end of the academic year.
9

95.492.9
89.3
84.681.8 82.3
78.1 78.2
87.685.9
0.0
10.0
20.0
30.0
40.0
50.0
60.0
70.0
80.0
90.0
100.0
Primary Secondary
Private schools Public Urban Schools Public Rural Schools (Spanish) Public Rural Schools (Indigenous) Total
Source: School census 2007 Figure 4: Repetition rates in Primary and Secondary Education (2006)
2.4
4.2
6.0
10.0
7.9
9.3
13.4
9.3
7.1
8.6
0.0
2.0
4.0
6.0
8.0
10.0
12.0
14.0
16.0
Primary Secondary
Private schools Public Urban Schools Public Rural Schools (Spanish) Public Rural Schools (Indigenous) Total
Source: School census 2007 Figure 5: Dropout rates in Primary and Secondary Education (2006)
10
2.2
2.9
4.6
5.3
7.9
9.3
8.5
12.4
5.3 5.5
0.0
2.0
4.0
6.0
8.0
10.0
12.0
14.0
Primary Secondary
Private schools Public Urban Schools Public Rural Schools (Spanish) Public Rural Schools (Indigenous) Total
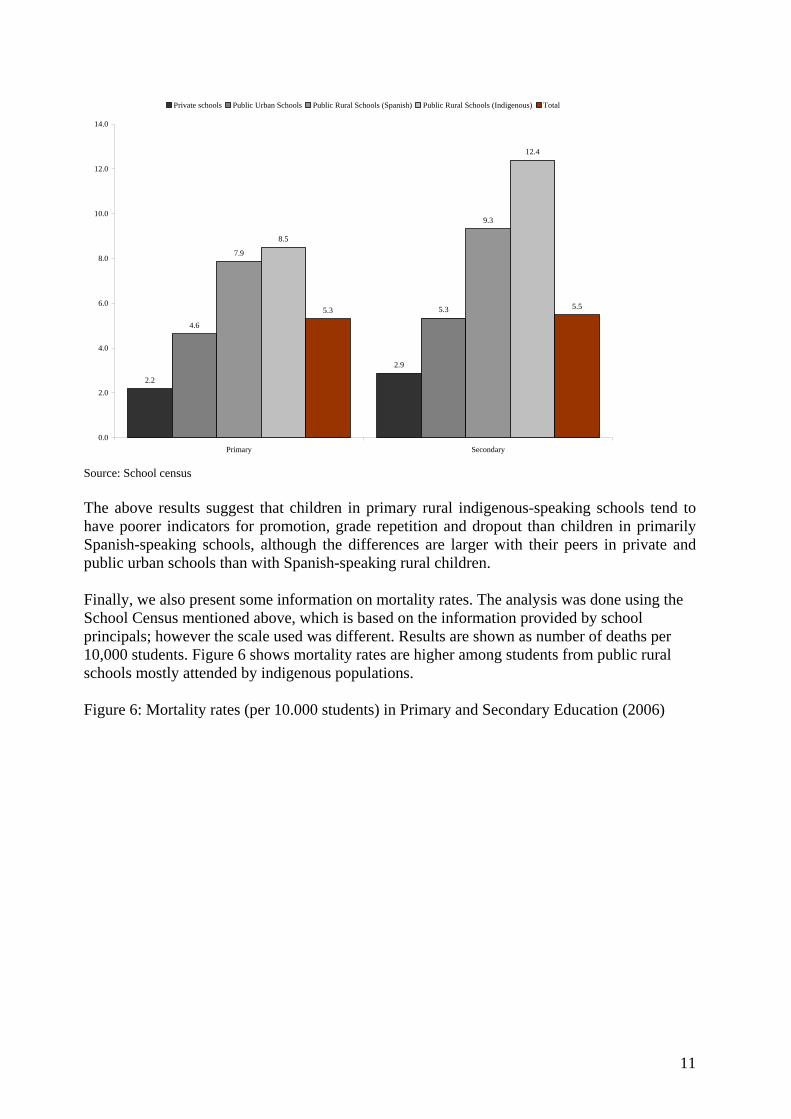
Source: School census The above results suggest that children in primary rural indigenous-speaking schools tend to have poorer indicators for promotion, grade repetition and dropout than children in primarily Spanish-speaking schools, although the differences are larger with their peers in private and public urban schools than with Spanish-speaking rural children. Finally, we also present some information on mortality rates. The analysis was done using the School Census mentioned above, which is based on the information provided by school principals; however the scale used was different. Results are shown as number of deaths per 10,000 students. Figure 6 shows mortality rates are higher among students from public rural schools mostly attended by indigenous populations. Figure 6: Mortality rates (per 10.000 students) in Primary and Secondary Education (2006)
11
1.6
2.8
4.6
3.3
4.0
3.5
5.3
8.1
4.0
3.4
0.0
1.0
2.0
3.0
4.0
5.0
6.0
7.0
8.0
9.0
Primary Secondary
Private schools Public Urban Schools Public Rural Schools (Spanish) Public Rural Schools (Indigenous) Total
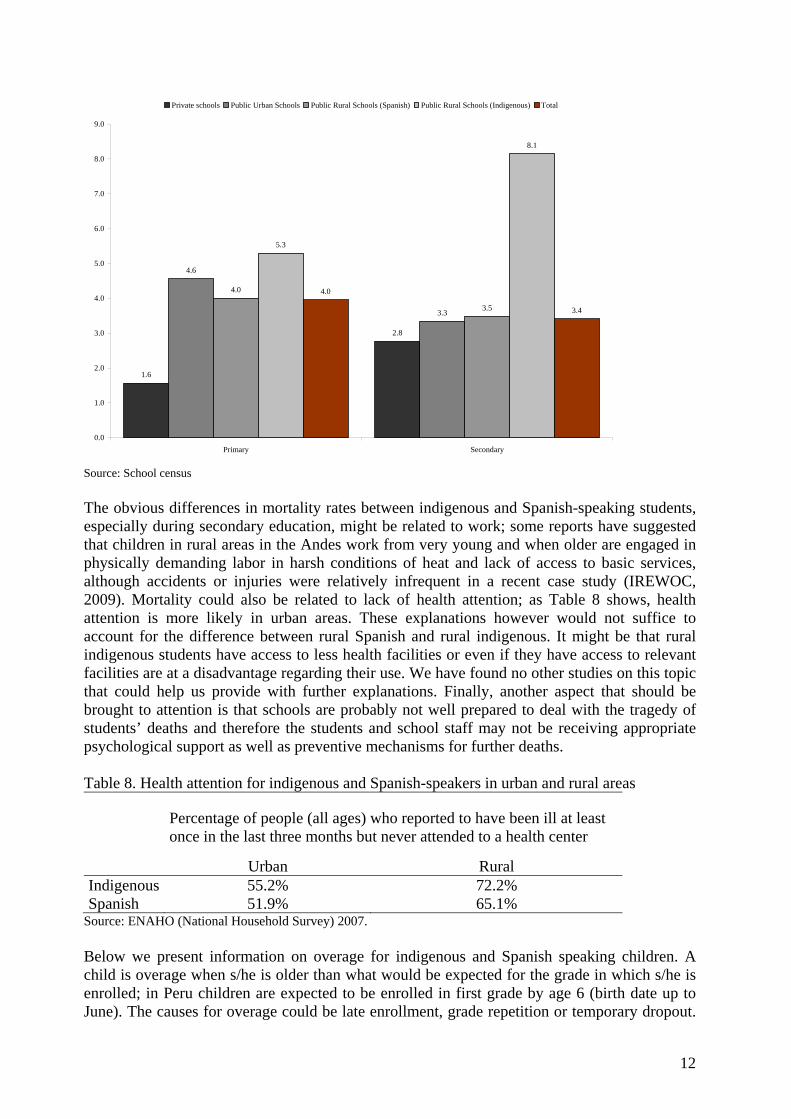
Source: School census The obvious differences in mortality rates between indigenous and Spanish-speaking students, especially during secondary education, might be related to work; some reports have suggested that children in rural areas in the Andes work from very young and when older are engaged in physically demanding labor in harsh conditions of heat and lack of access to basic services, although accidents or injuries were relatively infrequent in a recent case study (IREWOC, 2009). Mortality could also be related to lack of health attention; as Table 8 shows, health attention is more likely in urban areas. These explanations however would not suffice to account for the difference between rural Spanish and rural indigenous. It might be that rural indigenous students have access to less health facilities or even if they have access to relevant facilities are at a disadvantage regarding their use. We have found no other studies on this topic that could help us provide with further explanations. Finally, another aspect that should be brought to attention is that schools are probably not well prepared to deal with the tragedy of students’ deaths and therefore the students and school staff may not be receiving appropriate psychological support as well as preventive mechanisms for further deaths. Table 8. Health attention for indigenous and Spanish-speakers in urban and rural areas
Percentage of people (all ages) who reported to have been ill at least once in the last three months but never attended to a health center
Urban Rural Indigenous 55.2% 72.2% Spanish 51.9% 65.1%
Source: ENAHO (National Household Survey) 2007. Below we present information on overage for indigenous and Spanish speaking children. A child is overage when s/he is older than what would be expected for the grade in which s/he is enrolled; in Peru children are expected to be enrolled in first grade by age 6 (birth date up to June). The causes for overage could be late enrollment, grade repetition or temporary dropout.
12

For this analysis we present information from a longitudinal study in Peru (Young Lives10) which follows the lives of 3,000 children to understand the causes and consequences of poverty. While the study follows two cohorts (the younger born in 2001 and the older in 1994), in this section we will concentrate on children from the latter. Figure 7. Overage among indigenous and Spanish-speaking children (in percentages)11
Indigenous
Spanish
0.0
10.0
20.0
30.0
40.0
50.0
60.0
70.0
Perc
enta
ge
31.7
21.1
Indigenous 29.3 61.0
Spanish 13.8 34.9
2002 2006
Note: The numbers above the lines are the differences between 2002 and 2006 for each language group. Figure 7 shows a gap of 15.5% between indigenous and Spanish-speaking children in round 1, when they were about 8 years olds, and it increases to 26.1% by the time they are 12. It is important to note that in the Peruvian education system there are no free public programs to help children who lag behind in achievement (indigenous or other), although some school or teacher specific initiatives may occur. Below are the results in years of average for the two groups, with 0 being no overage. The results suggest again a difference favoring Spanish-speaking children that increases over time, with an even steeper slope than in Figure 7. Figure 8. Overage among indigenous and Spanish-speaking children (in years)
10 For more information on this study see www.younglives.org.uk. 11 The numbers of children in this analysis are 43 for indigenous and 631 for Spanish-speakers. Even though the sample size for indigenous is small, it was collected from 20 sites around the country. We calculated this indicator for a cohort of children in 6th grade nationally and found 66% of Spanish-speakers and 43% of indigenous-speakers to be overage (Enaho national survey, 2007).
13
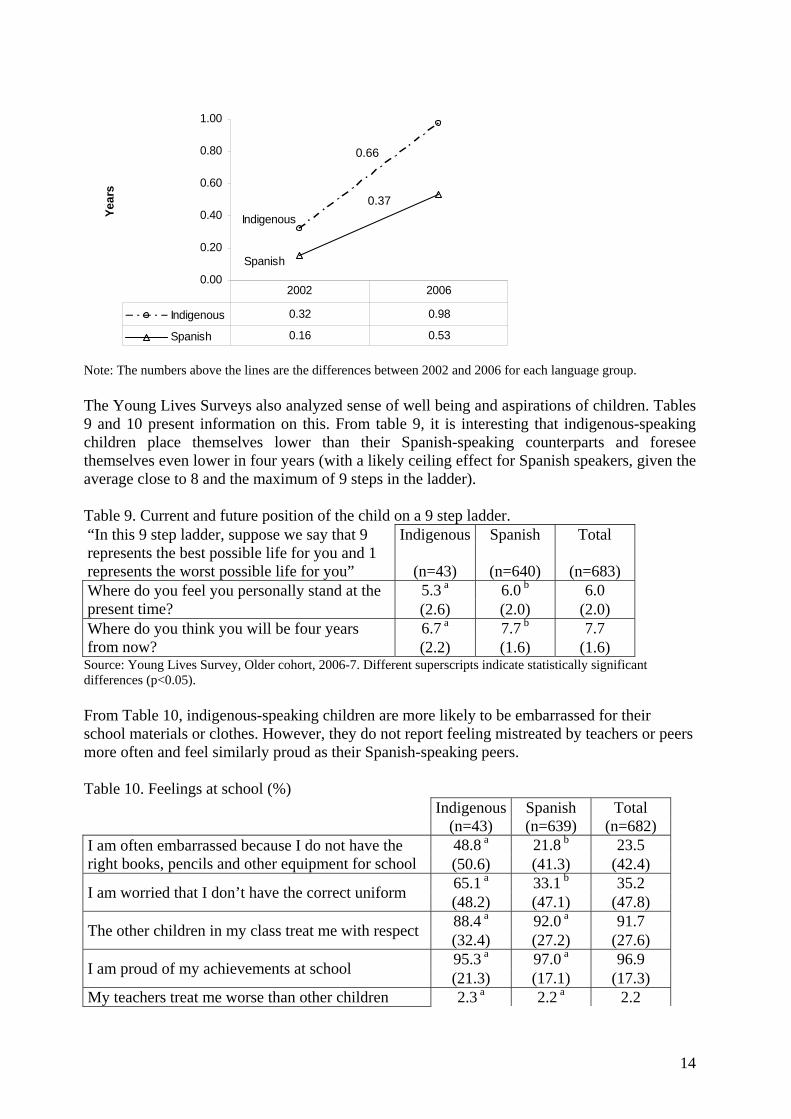
Note: The numbers above the lines are the differences between 2002 and 2006 for each language group. The Young Lives Surveys also analyzed sense of well being and aspirations of children. Tables 9 and 10 present information on this. From table 9, it is interesting that indigenous-speaking children place themselves lower than their Spanish-speaking counterparts and foresee themselves even lower in four years (with a likely ceiling effect for Spanish speakers, given the average close to 8 and the maximum of 9 steps in the ladder). Table 9. Current and future position of the child on a 9 step ladder. “In this 9 step ladder, suppose we say that 9 represents the best possible life for you and 1 represents the worst possible life for you”
Indigenous Spanish Total
(n=43) (n=640) (n=683) Where do you feel you personally stand at the present time?
5.3 a 6.0 b 6.0 (2.6) (2.0) (2.0)
Where do you think you will be four years from now?
6.7 a 7.7 b 7.7 (2.2) (1.6) (1.6)
Source: Young Lives Survey, Older cohort, 2006-7. Different superscripts indicate statistically significant differences (p<0.05). From Table 10, indigenous-speaking children are more likely to be embarrassed for their school materials or clothes. However, they do not report feeling mistreated by teachers or peers more often and feel similarly proud as their Spanish-speaking peers. Table 10. Feelings at school (%)
Indigenous Spanish Total (n=43) (n=639) (n=682)
I am often embarrassed because I do not have the right books, pencils and other equipment for school
48.8 a 21.8 b 23.5 (50.6) (41.3) (42.4)
I am worried that I don’t have the correct uniform 65.1 a 33.1 b 35.2 (48.2) (47.1) (47.8)
The other children in my class treat me with respect 88.4 a 92.0 a 91.7 (32.4) (27.2) (27.6)
I am proud of my achievements at school 95.3 a 97.0 a 96.9 (21.3) (17.1) (17.3)
My teachers treat me worse than other children 2.3 a 2.2 a 2.2
Indigenous
Spanish0.00
0.20
0.40
0.60
0.80
1.00Ye
ars
0.66
0.37
Indigenous 0.32 0.98
Spanish 0.16 0.53
2002 2006
14
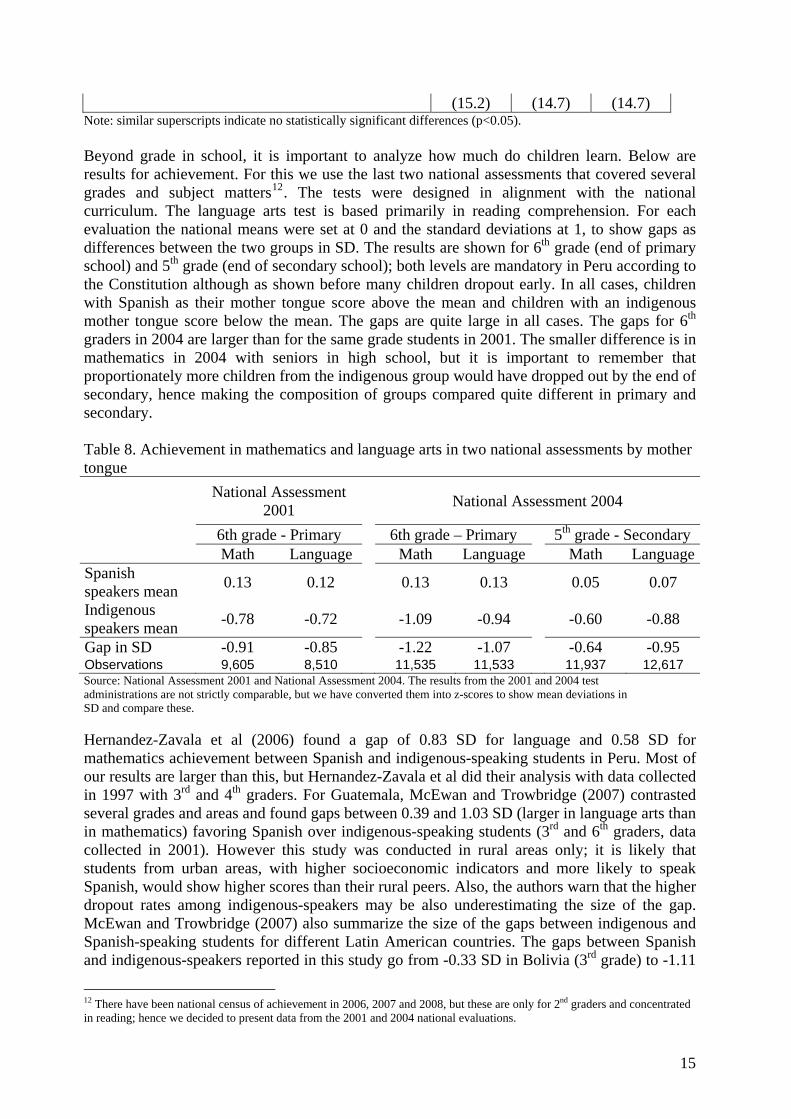
(15.2) (14.7) (14.7) Note: similar superscripts indicate no statistically significant differences (p<0.05). Beyond grade in school, it is important to analyze how much do children learn. Below are results for achievement. For this we use the last two national assessments that covered several grades and subject matters12. The tests were designed in alignment with the national curriculum. The language arts test is based primarily in reading comprehension. For each evaluation the national means were set at 0 and the standard deviations at 1, to show gaps as differences between the two groups in SD. The results are shown for 6th grade (end of primary school) and 5th grade (end of secondary school); both levels are mandatory in Peru according to the Constitution although as shown before many children dropout early. In all cases, children with Spanish as their mother tongue score above the mean and children with an indigenous mother tongue score below the mean. The gaps are quite large in all cases. The gaps for 6th graders in 2004 are larger than for the same grade students in 2001. The smaller difference is in mathematics in 2004 with seniors in high school, but it is important to remember that proportionately more children from the indigenous group would have dropped out by the end of secondary, hence making the composition of groups compared quite different in primary and secondary. Table 8. Achievement in mathematics and language arts in two national assessments by mother tongue
National Assessment 2001 National Assessment 2004
6th grade - Primary 6th grade – Primary 5th grade - Secondary Math Language Math Language Math Language
Spanish speakers mean 0.13 0.12 0.13 0.13 0.05 0.07
Indigenous speakers mean -0.78 -0.72 -1.09 -0.94 -0.60 -0.88
Gap in SD -0.91 -0.85 -1.22 -1.07 -0.64 -0.95 Observations 9,605 8,510 11,535 11,533 11,937 12,617 Source: National Assessment 2001 and National Assessment 2004. The results from the 2001 and 2004 test administrations are not strictly comparable, but we have converted them into z-scores to show mean deviations in SD and compare these. Hernandez-Zavala et al (2006) found a gap of 0.83 SD for language and 0.58 SD for mathematics achievement between Spanish and indigenous-speaking students in Peru. Most of our results are larger than this, but Hernandez-Zavala et al did their analysis with data collected in 1997 with 3rd and 4th graders. For Guatemala, McEwan and Trowbridge (2007) contrasted several grades and areas and found gaps between 0.39 and 1.03 SD (larger in language arts than in mathematics) favoring Spanish over indigenous-speaking students (3rd and 6th graders, data collected in 2001). However this study was conducted in rural areas only; it is likely that students from urban areas, with higher socioeconomic indicators and more likely to speak Spanish, would show higher scores than their rural peers. Also, the authors warn that the higher dropout rates among indigenous-speakers may be also underestimating the size of the gap. McEwan and Trowbridge (2007) also summarize the size of the gaps between indigenous and Spanish-speaking students for different Latin American countries. The gaps between Spanish and indigenous-speakers reported in this study go from -0.33 SD in Bolivia (3rd grade) to -1.11
12 There have been national census of achievement in 2006, 2007 and 2008, but these are only for 2nd graders and concentrated in reading; hence we decided to present data from the 2001 and 2004 national evaluations.
15

SD in Guatemala (3rd and 4th graders). For mathematics, the gaps go from -0.2 in Ecuador (5th graders) to -0.9 in Guatemala (3rd and 4th graders), all favoring Spanish-speakers. Thus the gaps reported here would be among the largest reported for Latin America.
3.4 Determinants of achievement and the gap between indigenous and Spanish-speakers A next step in the analysis is to show the weight of speaking an indigenous language versus Spanish in explaining achievement, as compared to other individual, family and school characteristics. Our approach will allow us to decompose the achievement gap into 3 portions: a portion explained by individual and family characteristics, a portion explained by school factors and a portion not explained by any of these. We will use the dataset from the National Assessment 2004 (EN 2004), a national survey administered by the Ministry of Education. The tests were administered to second and sixth graders in primary and third and fifth graders in secondary. Information on family and school variables was collected as well. Our analysis will be limited to the results of 6th graders, since this is the end of primary school and should show an accumulation of learning, indigenous children should be fluent in Spanish (all tests are administered in Spanish at this grade), and the dropout rates are relatively small (at least as compared to secondary school). The mathematics and language tests were designed to be aligned with the national curriculum; the test of language arts is primarily on reading comprehension. The definition of the variables used in the model and descriptive statistics for these are presented in the Appendix. To decompose the indigenous gap, the method employed by McEwan, P.J. and Trowbridge, M. (2007) was used, as specified below: Yij = β0 + β1Indigenous + Cijβ2 + Sijβ3 + εij ( 1 ) Where: Yij = Math/Language achievement for the student i at school j Indigenous = The student has an indigenous mother tongue Cij = Student and Family characteristics Sij = School variables εij = Random error β’s = Coefficients estimated Then, the student achievement for indigenous and Spanish students is given by:
3210
∧−∧−∧∧−
+++= ββββIII
SCY (Indigenous – 2)
320
∧−∧−∧−
++= βββSSS
SCY (Spanish – 3) Where the variables related with the student (C) and the school (S) are evaluated in the mean for each group. Thus, the mean difference between indigenous and Spanish could be summarized as:
321 )()()(∧−−∧−−∧−−
−+−+=− βββSISISI
SSCCYY (2) – (3) = (4)
16

Thus, β2 and β3 are the portions of the gap explained by student and school characteristics respectively, while β1 is the unexplained gap that is not related with any of the groups of variables included in the model. There are limitations in the number and measurement of variables related with schools and educational processes in the classroom; for this reason, a final fixed effects model was estimated where the observable and non-observable variables at the school level are controlled. The fixed effects model estimated was:
∑∑∑∑= =
∧
= =
∧∧−−∧−−
−−+−+=−J
j
I
ijijS
J
j
I
ijijI
SISI jj
IndigenousN
IndigenousN
CCYY1 11 1
21 ))1(11()()( μμββ
As mentioned above, the fixed effects model controls for all the observable and non-observable variables that vary across schools, therefore making these variables constant at the school level. As in equation 4, the coefficient β1 is the unexplained gap that is not accounted for by any of the variables included in the model.
Tables 9 and 10 present several multivariate models for mathematics and language arts13. The first model presents the gap between indigenous and Spanish-speakers without adjusting for any variables. Model 2 controls for some individual and family variables, while model 3 controls for some school variables. Finally, model 4 presents the fixed effects model. Table 11 presents the decomposition of the variance in the three groups of variables of interest for the four models.
13 According to the Collin Test, Vector of Inflation Factor (VIF) values vary around 2 for all independent variables, suggesting acceptable levels of multicolinearity.
17

18
Table 9. Multivariate analysis of mathematics achievement
Model 1 Model 2 Model 3
Model 4 (school fixed effects)
Β se ( β ) β se ( β ) β se ( β ) β se ( β ) Indigenous mother tongue -69.58 (4.80) *** -32.22 (4.44) *** -25.91 (4.48) *** -3.62 (3.56) Individual variables Female -9.76 (1.80) *** -9.83 (1.74) *** -10.48 (1.46) ***Age (years) -6.20 (0.89) *** -6.17 (0.83) *** -6.31 (0.78) ***Number of siblings -1.26 (0.43) ** -0.55 (0.42) -0.13 (0.37) Nuclear family -3.96 (1.91) * -4.63 (1.86) * -1.12 (1.52) Child works outside home -10.78 (2.56) *** -7.27 (2.46) ** -2.85 (2.00) Child works at home -10.29 (5.91) + -6.17 (6.11) 1.69 (4.77) Educational Materials at home -1.05 (0.95) -0.68 (0.90) -0.01 (0.85) More than 50 books at home 17.89 (2.58) *** 12.57 (2.43) *** 10.35 (2.27) ***Mother's education (Secondary or higher) 10.34 (2.27) *** 6.87 (2.24) ** 6.21 (1.95) ** Father's education (Secondary or higher) 10.17 (2.11) *** 7.57 (2.00) *** 5.21 (1.81) ** Socioeconomic index 1.17 (0.10) *** 0.58 (0.11) *** -0.09 (0.08) School variables Public -26.38 (3.54) *** Full grade 6.27 (5.29) Urban 1.77 (5.33) Infrastructure index 0.10 (0.02) *** EIB school -8.02 (4.86) + Teacher's education 2 (Higher technical education) -3.24 (3.72) Teacher's education 3 (Higher university education) 3.96 (3.67) Teacher's education 4 (Post-graduate) 10.47 (5.98) + Teacher's experience (in years) 0.41 (0.21) + Constant 302.96 (2.48) *** 263.62 (15.11) *** 300.93 (15.42) *** 368.21 (11.73) ***R-square 0.11 0.33 0.37 0.54 Students 9333 9333 9333 9333 Schools 540 540 540 540 ***p<.001, **p<.01, *p<.05,+p<.10 Robust standard errors adjusted by clustering of the students are in parenthesis

19
Table 10. Multivariate analysis of language arts achievement
Model 1 Model 2 Model 3
Model 4 (school fixed effects)
β se ( β ) β se ( β ) β se ( β ) β se ( β ) Indigenous mother tongue -73.30 (4.62) *** -35.31 (4.04) *** -27.41 (4.18) *** -5.23 (4.45) Individual variables Female 4.03 (2.05) + 4.21 (1.97) * 3.06 (2.03) Age (years) -5.57 (0.93) *** -5.22 (0.90) *** -4.89 (0.93) ***Number of siblings -1.68 (0.48) *** -1.04 (0.47) * -0.30 (0.43) Nuclear family -4.71 (2.00) * -4.52 (1.94) * -1.64 (1.81) Child works outside home -15.80 (2.64) *** -11.43 (2.64) *** -4.93 (2.46) * Child works at home -17.80 (7.03) * -13.41 (7.08) + -4.63 (5.71) Educational materials at home -2.17 (1.08) + -2.25 (1.06) * -1.53 (1.03) More than 50 books at home 12.43 (2.58) *** 9.68 (2.44) *** 8.47 (2.44) ** Mother's education (Secondary or higher) 7.23 (2.58) ** 5.05 (2.64) + 5.32 (2.44) * Father's education (Secondary or higher) 10.81 (2.31) *** 8.13 (2.19) *** 7.07 (2.16) ** Socioeconomic index 1.27 (0.10) *** 0.68 (0.11) *** 0.00 (0.10) School variables Public -18.69 (3.21) *** Full grade 10.61 (5.67) + Urban 8.89 (5.58) Infrastructure index 0.08 (0.02) *** EIB school -9.96 (4.51) * Teacher's education 2 (Higher technical education) -2.93 (3.35) Teacher's education 3 (Higher university education) 5.14 (3.36) Teacher's education 4 (Post-graduate) 9.99 (6.14) Teacher's experience (in years) 0.24 (0.22) Constant 302.14 (2.39) *** 248.39 (15.71) *** 275.58 (16.08) *** 306.02 (15.32) ***R-square 0.11 0.32 0.35 0.48 Students 8878 8878 8878 8878 Schools 537 537 537 537 ***p<.001, **p<.01, *p<.05,+p<.10 Robust standard errors adjusted by clustering of the students are in parenthesis

20
Table 11. Mother tongue gap decomposition
Mathematics Language Model 1 Model 2 Model 3 Model 4 Model 1 Model 2 Model 3 Model 4
Gap decomposition Unexplained -69.58 -32.22 -25.91 -3.62 -73.30 -35.31 -27.41 -5.23 Individual factors - -37.36 -23.93 -10.66 - -38.00 -24.75 -10.86 School factors - - -19.74 - - - -21.14 - Fixed effect - - - -55.30 - - - -57.21 Gap decomposition (%) Unexplained 100 46 37 5 100 48 37 7 Individual factors - 54 34 15 - 52 34 15 School factors - - 28 - - - 29 - Fixed effect - - - 79 - - - 78 Total Gap -69.58 -69.58 -69.58 -69.58 -73.30 -73.30 -73.30 -73.30

The results are quite similar for mathematics and language achievement. Having an indigenous mother tongue is statistically significant in explaining achievement, but its coefficient diminishes when other individual and family variables are included and becomes non-significant when fixed effects for school are included. This is most likely because, as shown in other parts of this paper, indigenous speakers also tend to be poorer, live in rural areas, and attend public schools where they gather with peers who are from similar backgrounds (especially in rural indigenous schools). The low achievement of indigenous-speakers would be a result of an interaction of several of these. The variance decomposition shows a higher weight of individual and family variables over school variables in explaining achievement in model 3. However, in the final fixed effects model the higher weight is for school variables. This does not mean that it is only the school’s inputs and the educational processes generated there that explain achievement, but it could also be that there are some effects of the composition of the student body that influence achievement. There are some studies in Peru showing the importance of peer effects in explaining achievement; for example Aguero & Cueto (2003) found that peers with similar achievement have an effect on each other. Hence they suggest increasing variability in the composition of student classrooms as a way of increasing overall performance. It would also be a way to fight stereotyping of some schools (e.g. indigenous and rural) as being of poor achievement, hence suggesting some teachers to have low expectations. It is interesting to compare these results to other similar analysis carried out with Peruvian students. For instance Hernandez-Zavala et al (2006) used the data from the UNESCO evaluation (1997) for 3rd and 4th graders in Peru. They found that “in Peru, having more books at home, having a father with post-secondary education, and attending a private paying school increases test scores, while poor classroom conditions decrease test scores”(p. 22). These results are quite similar to the ones presented above. McEwan and Trowbridge (2007) used a fixed effects model to decompose the gaps in achievement in Guatemala and found a high weight of both socioeconomic individual factors and school quality, but the latter explained between 50% and 69% of the gap. However, as the authors warn, school fixed effects may capture instructional inputs and educational quality as well as the school’s social context. In a study for Chile and Bolivia, McEwan (2004) found that the school fixed effect explained between 51% and 71% of the gap between indigenous and Spanish-speakers. In our analysis the weight of school fixed effects is even larger (79% and 78% for mathematics and language arts respectively), suggesting a very important clustering effect of students at school. In the next section we turn to specific educational policies targeting indigenous children in Peru. IV. Intercultural Bilingual Education Policies (EIB14) in Peru The first national policy for bilingual education was issued in 1972. This was the first of its kind for Latin America (Zúñiga, 2008). It was issued by a military revolutionary government that aimed at reducing poverty and increasing social inclusion15. The Peruvian program targeted mostly speakers of indigenous languages and had the goal of helping indigenous populations in the transition to speaking Spanish, which was considered the main language, but
14 In Spanish EIB stands for Educación Intercultural Bilingüe. 15 Bilingual education policies in Peru started with the government, while in neighbors Bolivia and Ecuador came through indigenous movements. Bolivia and Ecuador have had a more vigorous indigenous movement than Peru. In fact, Peru is the only of the three countries where EIB programs are not managed by representatives of the indigenous populations (Zavala, 2007).
21

preserving indigenous languages and cultures. There was an attempt to make indigenous language part of social communications, for instance by including commentaries in national TV in Quechua; this was discontinued later. In the 80’s and 90’s the Ministry of Education issued national policies to include an intercultural component and not only a bilingual educational policy (Zúñiga, 2008). Hence EIB was born and was conceived as a cross-sectional topic of the curriculum, targeting all children and not only speakers of indigenous languages; however, in practice, teaching and learning of indigenous languages occurs almost exclusively in EIB schools, although schools with predominantly Spanish-speakers are encouraged to promote intercultural socialization and practices. Currently EIB is an official program executed by the Ministry of Education and also by several NGO and international organizations. The Ministry of Education over the past few years has printed around three and a half million textbooks in mathematics and language arts in five varieties of Quechua, in Aymara and nine Amazon languages (Zúñiga, 2008), although the quality of these texts has not been assessed empirically. One issue to consider is that many indigenous languages have a strong oral tradition (there was no alphabet in any language before the Spaniards came to Peru); hence it is difficult to establish a single way of writing that is understandable for all users. The EIB model is designed to teach indigenous speakers to read and write first in their maternal language and then move on to Spanish, while strengthening their mastery of language skills in their maternal tongue. However in practice many authors have suggested that in many schools learning in indigenous language does not occur, thus making it a very adverse environment for children who reach school with no knowledge of Spanish and face a teacher who often times has no knowledge of the local language (Zúñiga, 2008; Zavala, 2007). While there are a few universities and teacher education institutes with a special program on EIB, these seem to be not enough to attend the indigenous population. Regarding laws referred to EIB, in 1993 the new Constitution stated in article 17: “…The State guarantees the eradication of illiteracy. Also it promotes bilingual and intercultural education, depending on the characteristics of each zone. It preserves the diverse cultural and linguistic manifestations in the country. It promotes national integration.”16 This article seems to be based on a conception of bilingual education targeting indigenous children only, given that it says that this should be implemented “depending on the characteristics of each zone”, which would suggest to implement it only in rural areas where indigenous population is concentrated. The justification for bilingual intercultural education seems to be based more on national objectives, such as the preservation of cultural and linguistic diversity, than in adapting education models and practices to the culture of children in specific contexts. This type of justification would seem more appropriate for a museum or national historic site than for educational practices based on personal and social interactions. There are other formal documents stating the importance of EIB. For instance in 2002 the National Agreement, a special group formed by representatives of some of the main social and political groups, included in its 12th State Policy the importance of providing EIB to indigenous populations, which should increase over time. This has not happened but the Agreement is still in place. In 2003 a new General Law of Education was issued, again stating the importance of providing EIB nationally (this time not only for indigenous populations). However, again this is not carried out and there are no ways of bringing the State to comply with EIB policies as stated in the Constitution, the Agreement, and the Law.
16 Translated by the authors.
22

Zúñiga (2008) identifies several limitations of the EIB model as currently implemented in Peru: “In general, EIB is only implemented in primary education, not at preschool or secondary; EIB is implemented for the most part in rural areas; EIB is usually thought of as education for indigenous people… In many places EIB is used as a policy of Spanish assimilation; there is great lack of capacity to implement efficient programs to teach Spanish and indigenous languages as secondary languages… Within civil society, with few exceptions, there is no commitment yet with the construction of EIB proposals...” (p. 12). EIB policy would call for all children with an indigenous mother tongue to attend an EIB school. However, as shown below, many indigenous-speaking children attend a regular Spanish-speaking school and some Spanish-speakers attend an EIB school (in fact, given figures in the table below, about 40% of the children who attend an EIB school say their mother tongue is Spanish). Table 12: EIB schools and indigenous student population (primary only)
Mother tongue
Total Indigenous Spanish Enrolment (students) EIB 175,282 119,167 294,449 Non-EIB 332,220 3,340,628 3,672,848 Total 507,502 3,459,795 3,967,297 Enrolment (%) EIB 35 3 7 Non-EIB 65 97 93 Total 100 100 100
Source: School Census 2007 According to the last school census, there are 3,804 EIB schools. This is based on reports by the school principal on whether or not the school is EIB, not necessarily that the program is implemented as programmed. The majority are public, multigrade in the rural area (see Table 13). A few EIB schools are run by NGO or private organizations in agreement with the government.
Table 13. Distribution of EIB schools by area and type of school (Number and percentage)
Multigrade Full grade
school Total
Rural 3,079 (96%) 271 (45%) 3,350 (88%) Urban 125 (4%) 329 (55%) 454 (12%) Public 3,138 (98%) 500 (83%) 3,638 (96%) Private 66 (2%) 100 (17%) 166 (4%) Total 3,204 (100%) 600 (100%) 3,804 (100%)
Source: School Census 2007 There are few studies about the impact of bilingual intercultural policies with rigorous designs, and we know of no studies with random assignment to treatment and control conditions in Peruvian schools. However any comparison would need to take into account if indeed EIB policies are implemented at school, which of the several EIB models is actually implemented,
23
and if the program is accepted by parents, teachers and students, among other issues. The few studies available suggest that in many occasions EIB is not actually implemented. For instance Cueto and Secada (2003) in a study for 4th and 5th graders found that in many EIB schools in Puno, south of Peru, less than half of the teachers at EIB schools could not read or write in the indigenous languages (in fact some teachers assigned to EBI schools declared that they did not even speak the local language), language of instruction in the classroom was almost exclusively Spanish and bilingual materials and texts from the Ministry of Education were not used and piled up in a corner of many classrooms (only materials in Spanish were used). In many of the EIB schools the majority of parents did not want their children to learn to read and write in Quechua or Aymara. This is probably based on their personal experience, where many times they might not have seen that speaking an indigenous language has helped them as much as speaking Spanish. Recently there has been some indication that this may be changing; for instance the regional government of Puno has finished translated and displaying publicly the names of the streets in the two indigenous languages spoken there, plus Spanish. This is a small start to indicate that inclusion of indigenous languages in mainstream life may be starting, at least in some regions. Another example is that a telephone company with services around the country is offering to respond callers in several of the native languages. Recently an indigenous social movement in the Amazon has protested for several environmental and social issues, but included in their request the need for more and better EIB. Also, Zavala (2007) and Zúñiga (2008) have described some case studies of bilingual intercultural programs in different regions of Peru that seem to be promising, and also pointed out some challenges these would face. However, we think it is fair to say that most authors currently would say that there is a long way to go before intercultural bilingual policies become an important component of the social agenda nationally. In spite of the above, discrimination based on ethnicity seems to be still strong in Peru. A recent example may illustrate this: recently the personal notes of a Quechua Congresswoman were photographed from the distance by the press, showing them as evidence that she was not qualified to be in Congress due to poor writing in Spanish17. This has led to a public discussion on civil rights, education and discrimination. While most analysts have stated that poor writing in Spanish does not disqualify a person to be in Congress, or is evidence of her intellectual abilities, it is likely that many citizens in Peru still believe that indigenous people, who tend to have lower education levels and speak and write Spanish in non-standard ways, should not take office in public offices such as Congress18. Finally, there is also a social policy worth mentioning in this section even though is not explicitly an educational policy aimed at indigenous groups. A relatively new Conditional Cash Transfer Program (called JUNTOS) is being implemented in Peru as in other countries of the Region. This program is aimed at increasing primary enrollment in rural populations among other objectives, and in that sense favors indigenous students since most of them attend public rural schools. However the program has not taken prevision in improving the quality of rural schools or reinforcing EIB programs wherever needed. The PEAR rural program mentioned 17 See Correo newspaper for the note: http://www.correoperu.com.pe/correo/nota.php?txtEdi_id=4&txtSecci_parent=0&txtSecci_id=80&txtNota_id=43706. 18 See http://www.correoperu.com.pe/correo/columnistas.php?txtEdi_id=4&txtSecci_id=84&txtSecci_parent=&txtNota_id=43799 for the editorial piece of Correo director, stating that citizens with “low education levels” should not be in Congress; Congresswoman Supa did not go to formal school and has said that she self taught to read and write in Spanish.
24
above was also discontinued before schedule and not replaced by a similar program. Overall, it is clear that EIB policies have not been among the educational priorities of Peruvian governments for the past few decades. It would seem that it is not lack of resources or technical knowledge that would explain the little that Peru has to show for EIB policies; as the World Bank has said recently: “Thus, it is clear that if things don’t move forward is because of lack of political will or capacity to implement policies, not because there are no technical options for policies” (Banco Mundial, 2006, p. 135). V. Discussion and policy recommendations The problems that indigenous populations face in Peru are not unique. Hall and Patrinos (2006) have analyzed social indicators for the five countries in Latin America with the largest indigenous populations: Bolivia, Ecuador, Guatemala, Mexico, and Peru at the end of the UN’s Indigenous Peoples’ decade (1994-2004). They found that in spite of increased attention from diverse institutions and political and social representation, indigenous peoples’ still show a wide disparity with their Spanish speaking counterparts in several indicators of poverty, including access to diverse services and outcomes of education. The panoramic view presented above suggests that children who are indigenous speakers in Peru face a variety of challenges: they are usually members of families with less educated parents, more likely to be poor and live in rural areas, especially in the Andes and jungle, where they are likely to lack public services such as running water, electricity and sewage at home. Given these conditions and the fact that Spanish language and culture are clearly dominant in the country, it is not a surprise that many indigenous people have migrated to urban areas and also that the proportion of indigenous speakers in the country has diminished in the past two decades, although there are still around 4 million people in Peru who declare one of the over 40 indigenous languages to be their mother tongue. In terms of education for the children with an indigenous tongue, the good news is that almost all of them are enrolled in primary education but this is about the only positive information. The data presented above shows that they are more likely to repeat and drop out than their Spanish speaking peers. Also, they attend schools that are more likely to have poorer infrastructure than their peers in urban public schools or in private schools. Most rural schools are attended by poorer children. This is quite an important fact for a country that should be trying to raise not only its average educational quality but also reduce educational inequalities associated with the students’ individual and family background. Currently the Peruvian education system would not be reducing inequalities but promoting them, by giving a poorer service to poorer students in rural areas (including indigenous-speaking children) and not providing with education safety nets for those that start lagging behind their peers. Among rural schools, what makes things worse for indigenous speaking children is the fact that intercultural bilingual education programs are available for less than half of them. Furthermore, there is some evidence that EIB policies are not actually implemented in many of these schools. This could happen for many reasons. Interestingly, one of them is that indigenous parents sometimes oppose that their children learn to read and write in their mother tongue. This is probably explained by their personal experiences, where they feel they have benefited more from their Spanish-speaking skills. Thus we think it would be a mistake to continue current policies of EIB isolation, where it is conceived as a policy for indigenous children in rural areas and not a program implemented wherever children with an indigenous mother tongue go to
25
school (starting at preschool but including high school). Also, teaching of indigenous languages could be offered at least as an elective class in schools that are not EIB (including urban schools). Finally, indigenous language and culture need to be felt by the population as part of the mainstream. This would require political will and the combined efforts from different social actors. Currently what many indigenous children with no preschool experience as they enter first grade in a rural school is a teacher that only speaks Spanish. In this context they have to learn Spanish quickly or fail. Perhaps more important, they learn early that the dominant language is the one used by the teacher and in which textbooks are written. This is a way of educational violence that goes against their educational rights to get a high quality education. In this context it is not surprising that the achievement of indigenous-speakers unadjusted scores are 1.22 standard deviations below their Spanish-speaking peers in mathematics and 1.07 standard deviations below in language (6th grade students, 2004 national evaluation). These are among the largest gaps we have found reported in the literature for Latin America. The multivariate analysis suggests that a large portion of the gaps between indigenous and Spanish-speaking children is explained by other individual and family variables, such as overage, higher number of siblings, child labor, availability of books at home, and parental education. But when the school characteristics are controlled for in a fixed effects model they explain 79% of the gap between indigenous and Spanish-speaking children in mathematics and 78% in language. This is quite a large effect compared to other similar studies in the region. It suggests two things: schools might not be providing the best quality education and/or students from relatively similar backgrounds gather at schools, creating a clustering social effect. We have provided evidence for both of these explanations in other parts of this paper, but the data analyzed does not suggest specific policy interventions. However, the analysis quite clearly suggests that it might be relevant to implement policies at the school level, concentrating on rural schools and planning interventions that tackle both the institution as a whole and the individual students. For many cases it would seem that bilingual intercultural policies would be needed, for others it may be targeting individual children who need more individualized attention to catch up with their peers, and in others more resources for better infrastructure at school, but these certainly do not exclude other policies depending on the specific local needs, such policies for fighting extreme poverty. In 2006 the Peruvian government started a program to measure achievement for all second graders nationally (plus a sample of some other grades in primary school). With this information and other from the National Census, School Census and a variety of national surveys there is enough information to identify predominantly indigenous areas, schools and even students with the poorest performance. Knowing and not responding, with the almost certainty that many of these children will fail in school, is poor social and educational policy, and also shows little respect for the rights of these children to receive an appropriate high quality education that allows them to achieve their potential.
26
References Agüero, J., Cueto, S. (2003). Dime con quién andas y te diré cómo rindes: Peer Effects como determinantes del rendimiento escolar. Research report prepared for CIES. Available at http://cies.org.pe/investigaciones/educacion/bajo-rendimiento. Banco Mundial (2006). Progreso y paralysis en la Educación Bilingüe Intercultural: un problema especial con los estándares. In Banco Mundial, Por una Educación de Calidad para el Perú. Estándares, Rendición de Cuentas y Fortalecimiento de Capacidades (pp. 125-135). Lima: Banco Mundial. Cueto, S. (2007). Las evaluaciones nacionales e internacionales de rendimiento escolar en el Perú: balance y perspectivas. En Grupo de Análisis para el Desarrollo (Editor). Investigación, Políticas y Desarrollo en el Perú. (pp. 405-455). Lima: GRADE. Cueto, S. y Secada, W. (2003). Eficacia escolar en escuelas bilingües en Puno, Perú. Revista Electrónica Iberoamericana sobre Calidad, Eficacia y Cambio en Educación, 1(1). Available at http://www.ice.deusto.es/rinace/reice/vol1n1/CuetoySecada.pdf. Escobal, J. and Ponce, C. (2007) Economic opportunities for indigenous peoples in rural and urban Peru. Background paper for Patrinos, H. and Skoufias, E. Economic opportunities for indigenous peoples in Latin America. Washington, DC: The World Bank. Figueroa, A. & Barrón, M. (2005). Inequality, ethnicity and social disorder in Peru. CRISE Working Paper 8. University of Oxford. Hall, G. & Patrinos, H. A. (2006). Indigenous Peoples, Poverty and Human Development in Latin America. London: Palgrave Macmillan. Hernandez-Zavala, M., Patrinos, H.A. Sakellariou, C. and Shapiro, J. (2006) Quality of schooling and quality of schools for indigenous students in Guatemala, Mexico and Peru. Policy Research Working Paper 3982. Washington D.C.: The World Bank. IREWOC (2009). Rural child labour in Andean countries: problems and solutions. Amsterdam: International Research on Working Children. McEwan, P. J. (2004) La brecha de puntaje obtenidos en las pruebas por los niños indígenas en Sudamérica, in: D.R. Winkler and S. Cueto (eds), Etnicidad, Raza, Género y Educación en América Latina (Santiago: PREAL), pp. 133–177. McEwan, P.J. and Trowbridge, M. (2007). The achievement of indigenous students in Guatemalan primary schools. International Journal of Educational Development, 27(1), pp. 61–76. Trivelli, C. (2000). “Pobreza rural: Investigaciones, mediciones y políticas públicas” in Isabel Hurtado, Carolina Trivelli y Antonio Brack (editors). Perú el problema agrario en Debate (pp.199-255). Lima: SEPIA and IRD. Trivelli, C. (2005) Una mirada cuantitativa a la situación de pobreza de los hogares indígenas en el Perú. Economía, 55-56, pp. 83-158.
27
Webb, R. and Fernández Baca, G. (2008). Anuario Estadístico: Perú en Números 2008. Lima: Instituto Cuánto. Zavala, V. (2007). Avances y desafíos de la educación intercultural bilingüe en Bolivia, Ecuador y Perú. Lima: IBIS and CARE. Zúñiga, M. (2008). La Educación Intercultural Bilingüe. El Caso Peruano. Lima: FLAPE and Foro Educativo.
28

29
APPENDIX Table A1: Definition of variables included in multivariate analysis
Variable Definition
Math Achievement Mathematics test score Language Achievement Test score in language arts
Indigenous 1= Child has an indigenous mother tongue; 0= Otherwise
Female 1= Female ; 0= Male Age (years) Child's age Number of siblings Number of siblings
Nuclear family 1= Child lives with both parents 0= Otherwise
Child works outside home 1= Child work outside home 0= Otherwise
Child works at home 1= Child work inside home 0= Otherwise
Educational materials at home Sum of selected educational materials (dictionary, math books, language books, calculator) at home
More than 50 books at home 1= Number of books present at home is higher than 50 0= Otherwise
Socioeconomic index Index constructed based upon material of the house, access to basic services and assets at home
Mother's education (Secondary or higher) 1= Mother completed at least secondary school 0= Otherwise
Father's education (Secondary or higher) 1= Father completed at least secondary school 0= Otherwise
Public 1= Public school 0= Private school
Full grade 1= Full grade school 0= Multigrade school
Urban 1= Urban 0= Rural
Infrastructure index Index constructed based upon the number of school facilities and condition of infrastructure
EIB school
1= Intercultural Bilingual Education Program is implemented at school 0= Otherwise
Teacher's education 1
Level of education completed by the teacher: 1=Completed secondary education or incomplete higher education 0= Otherwise
Teacher's education 2
Level of education completed by the teacher: 1= Completed higher technical education 0= Otherwise
Teacher's education 3
Level of education completed by the teacher: 1= Completed higher university education 0= Otherwise
Teacher's education 4
Level of education completed by the teacher: 1= Post-graduate education 0= Otherwise
Teacher's experience Main teacher's years of experience

Table A2: Descriptive statistics of variables included in multivariate analysis
Mathematics variables Language variables All Indigenous Spanish All Indigenous Spanish Achievement 295.00 233.38 302.96 293.48 228.84 302.14 Indigenous 0.11 1.00 0.00 0.12 1.00 0.00 Female 0.50 0.49 0.50 0.50 0.48 0.50 Age (years) 11.74 12.61 11.63 11.75 12.60 11.64 Number of siblings 3.26 4.55 3.09 3.30 4.52 3.13 Nuclear family 0.76 0.80 0.75 0.76 0.81 0.76 Child works outside home 0.36 0.70 0.31 0.37 0.69 0.32 Child works at home 0.04 0.05 0.03 0.04 0.06 0.03 Educational Materials at home 3.17 2.70 3.23 3.17 2.70 3.23 More than 50 books at home 0.15 0.05 0.17 0.15 0.05 0.16 Mother's education (Secondary or higher) 0.38 0.12 0.42 0.37 0.13 0.41 Father's education (Secondary or higher) 0.49 0.22 0.53 0.48 0.22 0.52 Socioeconomic index 99.16 86.00 100.86 98.72 85.98 100.43 Public 0.86 0.98 0.84 0.87 0.98 0.85 Full grade 0.77 0.40 0.82 0.77 0.42 0.81 Urban 0.74 0.35 0.79 0.73 0.36 0.79 Infrastructure index 295.28 221.33 304.83 292.74 222.07 302.21 EIB school 0.12 0.36 0.08 0.11 0.35 0.08 Teacher's education 1 2.40 2.19 2.43 2.42 2.17 2.45 Teacher's education 2 0.53 0.64 0.52 0.54 0.62 0.53 Teacher's education 3 0.48 0.28 0.50 0.48 0.28 0.50 Teacher's education 4 0.08 0.06 0.08 0.09 0.06 0.09 Teacher's experience (in years) 14.74 13.00 14.97 14.65 13.36 14.83 Observations 9,333 802 8,531 8,878 781 8,097
30

31
Acknowledgements This paper was commissioned by the Education for All Global Monitoring Report as background information to assist in drafting the 2010 report. We also thank the additional support provided by the Young Lives Project. Young Lives is an innovative longitudinal research project investigating the changing nature of childhood poverty. Young Lives is tracking 12,000 children in Ethiopia, India (Andhra Pradesh), Peru and Vietnam over 15 years through a quantitative survey and participatory qualitative research, linked to policy analysis. Young Lives is core-funded by the UK Department for International Development (DFID) for the benefit of developing countries (more information at www.younglives.org.uk).