education, health and sanitation → education is key for development → improving...
TRANSCRIPT
PART 2
Education health and sanitation
The two greatest potential resources in most poor food-insecure countries are the people and the productivityof the land and water To defeat chronic hunger andpoverty investments must be made in both people andproductivity Investing in people must come in the formof education clean water and sanitation health and so-cial services and in some cases direct food and nutritionsupport In rural areas such expenditures are essentialif the corresponding investments in agriculture and itsproductive subsectors are to pay off
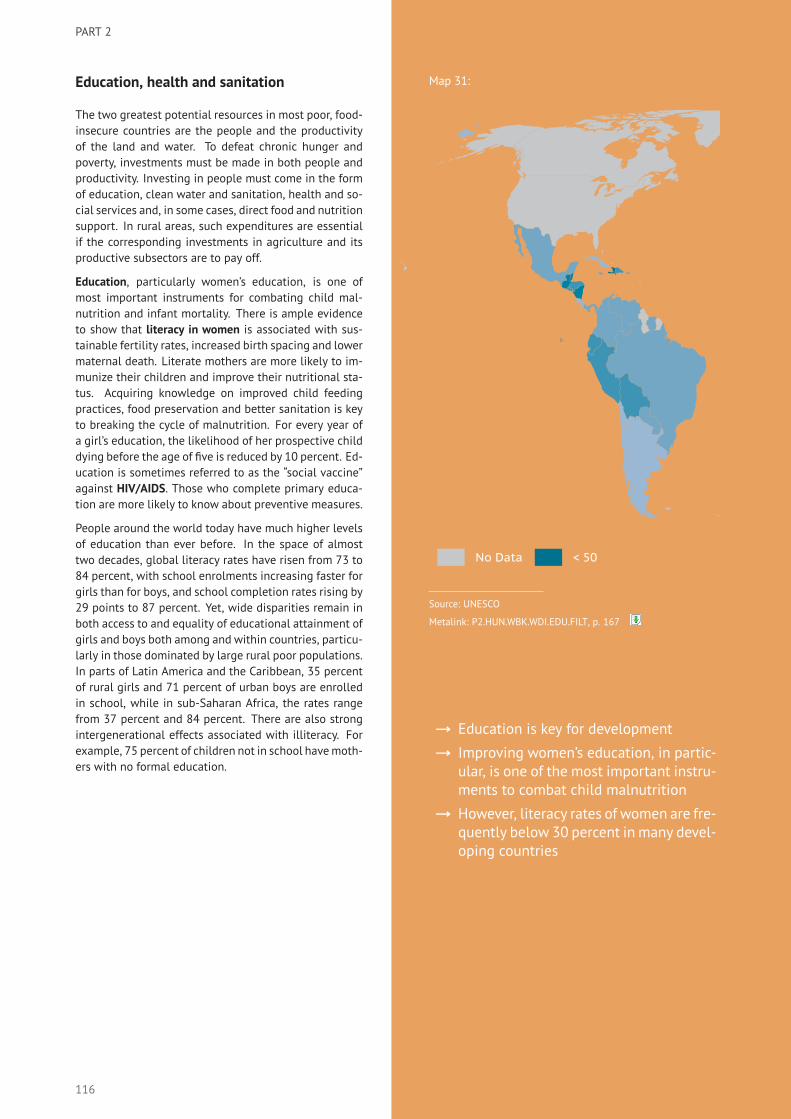
Education particularly womenrsquos education is one ofmost important instruments for combating child mal-nutrition and infant mortality There is ample evidenceto show that literacy in women is associated with sus-tainable fertility rates increased birth spacing and lowermaternal death Literate mothers are more likely to im-munize their children and improve their nutritional sta-tus Acquiring knowledge on improved child feedingpractices food preservation and better sanitation is keyto breaking the cycle of malnutrition For every year ofa girlrsquos education the likelihood of her prospective childdying before the age of five is reduced by 10 percent Ed-ucation is sometimes referred to as the ldquosocial vaccinerdquoagainst HIVAIDS Those who complete primary educa-tion are more likely to know about preventive measures
People around the world today have much higher levelsof education than ever before In the space of almosttwo decades global literacy rates have risen from 73 to84 percent with school enrolments increasing faster forgirls than for boys and school completion rates rising by29 points to 87 percent Yet wide disparities remain inboth access to and equality of educational attainment ofgirls and boys both among and within countries particu-larly in those dominated by large rural poor populationsIn parts of Latin America and the Caribbean 35 percentof rural girls and 71 percent of urban boys are enrolledin school while in sub-Saharan Africa the rates rangefrom 37 percent and 84 percent There are also strongintergenerational effects associated with illiteracy Forexample 75 percent of children not in school havemoth-ers with no formal education
Map 31
No Data lt 50 50 minus 80 80 minus 90 90 minus 95 gt 95
Literacy rate female ( 2009)
Source UNESCO
Metalink P2HUNWBKWDIEDUFILT p 167
rarr Education is key for development
rarr Improving womenrsquos education in partic-ular is one of the most important instru-ments to combat child malnutrition
rarr However literacy rates of women are fre-quently below 30 percent in many devel-oping countries
116
EDUCATION HEALTH AND SANITATION
No Data lt 50 50 minus 80 80 minus 90 90 minus 95 gt 95
Literacy rate female ( 2009)
Chart 61 Unequal opportunity afforded to girls in basic education where it matters most
Ratio of girls to boys in primary and secondary education (2009)
0
20
40
60
80
100
DevelopedEastAsia
LAmer ampCarib
SouthAsia
Sub-SAfrica
Source UNESCO
Metalink P2HUNWBKWDIEDUGEN p 167
117
PART 2
Investment in health is also important for human wel-fare and sustained economic and social developmentTimely access to health services ndash that is to a mix ofpromotion prevention treatment and rehabilitation ndash iscritical This cannot be achieved for the majority of thepopulation without a well-functioning health financingsystem
The most recent estimates of money needed to ensureaccess to essential healthcare suggests that on aver-age low-income countries must spend around US$ 60per capita which is almost double the amount they arecurrently spending Public financing is usually a mixof government money loans grants and aid from in-ternational organizations and non-governmental orga-nizations Apart from insufficient overall funds the percapita distribution of public expenditure on healthcareacross countries is vastly uneven It is unrealistic toexpect most low-income countries to achieve universalcoverage Access is often dictated by the ability to payand fees are a major hindrance for poor people solicitingtreatment
There are other factors beside income that determine ac-cess to health care For instance migrants ethnic mi-norities and indigenous people use services less thanother population groups even though their needs maybe higher Also when people do require healthcare theyoften incur high sometimes catastrophic costs in payingfor access According to the World Health Organization(WHO) about 150 million people globally suffer finan-cial catastrophe annually while 100 million are pushedbelow the poverty line each year
Often lost income causes strenuous financial penaltieson the ill and those who care for them The Interna-tional Labour Organization (ILO) finds that only one infive people in the world has broad-based social securityprotection that also includes cover for lost wages in theevent of illness and more than half the worldrsquos popula-tion lacks any type of formal social protection
Map 32
No Data lt 50 50 minus 150 150 minus 300 300 minus 1000 gt 1000
Annual health expenditure per capita (US$ 2009)
Source WHO
Metalink P2HUNWBKWDIHAEHEPCP p 168
rarr USD 860 spent annually on health perperson at the global level
rarr This number masks huge differences be-tween regions
rarr An average of just USD 32 is spent on aper capita basis in low-income countries
118
EDUCATION HEALTH AND SANITATION
No Data lt 50 50 minus 150 150 minus 300 300 minus 1000 gt 1000
Annual health expenditure per capita (US$ 2009)
Chart 62 Budgetary constraints preclude adequate public health spending in many de-veloping regions
Annual health expenditure (2009)
ofGDP
0
2
4
6
8
10
DevelopedEastAsia
LAmer ampCarib
SouthAsia
Sub-SAfrica
Source WHO
Metalink P2HUNWBKWDIHAEHETOT p 168
119
PART 2
Improving access to safe water and sanitation cangreatly reduce the burden on health systems and pro-mote wider development According to the United Na-tions Childrenrsquos Fund (UNICEF) 25 billion people in de-veloping countries ndash around 50 percent of their popula-tion ndash lack improved sanitation facilities and over 884million still use unsafe drinking water sources
Inadequate access to safe water and sanitation servicescoupled with poor hygiene practices kills and sickensthousands of children every day and leads to impov-erishment and diminished opportunities for thousandsmore Estimates point to some 2 million people dyingevery year as a result of diarrhoea and diseases causedby ingesting contaminated water
Poor water and sanitation have many other seriousrepercussions as well Children especially girls are de-nied their right to education because schools lack pri-vate and decent sanitation facilities Women and girlsare forced to spend large parts of their day searching forand fetching water denying them participation in edu-cation and income-generating employment
Inadequate water and sanitation means that poor farm-ers and wage earners are less productive due to ill-ness health systems are overwhelmed and nationaleconomies underperform
Further reading
bull UNESCO education (wwwunescoorgneweneducation)
bull UNICEF Water Sanitation and Hygiene (wwwuniceforgwash)
bull WHO The world health report - Health systems financ-ing the path to universal coverage (wwwwhointwhr2010enindexhtml
bull UNDP Human Development Report 2010 (hdrundporgenreportsglobalhdr2010)
bull OrsquoDonovan (2008)
Map 33
No Data lt 30 30 minus 50 50 minus 75 75 minus 90 gt 90
Improved water source minus share of rural population with access ( 2008)
Source WHO
Metalink P2HUNWBKWDIHAEWATIMPRU p 168
rarr 78 percent of the worldrsquos rural popula-tion now have access to clean water
rarr Progress has been slow - just 15 percentmore than two decades ago
rarr Yet in many developing countries morethan half of all households struggle withinadequate access to safe water and san-itation services
120
EDUCATION HEALTH AND SANITATION
No Data lt 30 30 minus 50 50 minus 75 75 minus 90 gt 90
Improved water source minus share of rural population with access ( 2008)
Chart 63 There are still many who do not have access to adequate sanitation
Improved sanitation facilities - share of population with access (2008)
0
20
40
60
80
DevelopedEastAsia
LAmer ampCarib
SouthAsia
Sub-SAfrica
Source WHO
Metalink P2HUNWBKWDIHAESANIMPS p 168
121
PART 2
Food aidEmergency situations have become increasingly fre-quent over the past 25 years and are often coupled withacute and chronic food insecurity in the affected coun-tries International responses to these crises have gen-erally focused on addressing immediate humanitarianneeds as evidenced by the growing share of food aidthat is channelled to emergencies
Several formal agreements govern food-related assis-tance at the international level Among these the FoodAid Convention (FAC) is the only legal instrument to en-sure a minimum amount of food aid The components ofthe FAC have remained largely unchanged since its cre-ation in 1967 and many believe that it no longer appliesto todayrsquos food-related assistance needs Current foodaid patterns do not reflect longer-term requirements In2009 around 80 percent of total assistance was chan-nelled to emergency relief measures while the remain-der was used for promoting agricultural and broader eco-nomic development More troubling is the perceivedhigh negative correlation of international food priceswith the level of food aid
The strong focus on short-term relief measures com-bined with limited support to local agriculture is notonly less effective for overcoming the structural reasonsfor food insecurity it might even lower incentives to in-vest in agriculture and domestic food production Amoresustainable solution is required to tackle the underlyingreasons for food insecurity such as low agricultural pro-ductivity Accordingly those most in need would alsobenefit from the provision of basic inputs such as seedsfertilizers and farming tools
Donors are addressing shortcomings of traditional foodassistance A growing number now rely on procurementmechanisms in the target countries themselves Localpurchases not only minimize market distortions (sup-plies are neither increased nor effective demand low-ered) they are also generally cheaper than in-kind aidand can generate development benefits to local marketsand farmers Some donors also strive for better inte-gration of emergency interventions and longer-term de-velopment operations The European Union for exam-ple envisages a rapid handover to structural food se-curity mechanisms during emergency response Suchmeasures help rebuild the livelihoods of affected pop-ulations and strengthen their resilience to future crises
These examples illustrate a fundamental departure fromthe ad hoc and partial approaches to food security inter-ventions followed in the past They also point to donorsrsquogeneral agreement on the principles that should guidefood aid interventions
Further reading
bull FAO Making the Food Aid Convention meet the re-alities of the 21st century (wwwfaoorgdocrep013al935eal935e00pdf)
bull World Food Programme (wwwwfporg)
Map 34
No Data 0 0001 minus 1 1 minus 50 50 minus 100 gt 100
Food aid received grain equivalent (thousand tonnes 2010)
Source WFP
Metalink P2HUNWFPFAISFDAID p 169
rarr 57 million tonnes of food aid were re-ceived in 2010
rarr Despite no let-up in the number of emer-gencies food aid fell to a historical low
rarr Many donors now rely on locally pur-chased food in order to strengthen do-mestic markets in crisis-hit countries
122
FOOD AID
No Data 0 0001 minus 1 1 minus 50 50 minus 100 gt 100
Food aid received grain equivalent (thousand tonnes 2010)
Chart 64 Food aid flows are in long-term decline and have fallen further at a time whenfood prices have spiked
Food aid received (1988-2010)
Thousandtonnes
6000
8000
10000
12000
14000
16000
1990 1995 2000 2005 2010
Source WFP
Metalink P2HUNWFPFAISFDAID p 169
123
TABLE 13 Population at risk UNHCR population of concernUNHCR population of concern
total totalrefugees
internallydisplacedpersons
others andstatelesspersons
total totalrefugees
internallydisplacedpersons
others andstatelesspersons
thousands thousands thousands thousands thousands thousands thousands thousands
2009 2009 2009 2009 2010 2010 2010 2010
WORLD 29233 10174 15628 3431 29986 10350 14456 5180
DEVELOPING REGIONS 28139 9642 15207 3290 28931 9845 14058 5027
AFRICA 10636 2805 6469 1362 10587 2947 6154 1486
North Africa 143 138 0 5 142 137 0 5
Algeria 10 8 0 2 8 7 0 2
Egypt 9 7 0 2 9 7 0 2
Libya 3 2 0 1 3 2 0 1
Morocco 3 2 0 1 3 2 0 1
Tunisia 3 2 0 1 3 2 0 1
Sub-Saharan Africa 10493 2667 6469 1357 10445 2810 6154 1481
Angola 159 141 0 18 136 135 0 1
Benin 1 0 0 0 1 0 0 0
Botswana 0 0 0 0 0 0 0 0
Burkina Faso 1 1 0 0 2 1 0 1
Burundi 231 94 100 37 254 84 157 12
Cameroon 17 15 0 2 17 15 0 2
Cape Verde 0 0 0 0 0 0 0 0
Central African Republic 357 160 197 1 359 165 193 2
Chad 250 55 171 25 237 54 131 53
Comoros 0 0 0 0 0 0 0 0
Congo 24 21 0 3 24 21 0 3
Cocircte drsquoIvoire 714 23 519 172 585 42 515 29
Congo Dem Rep 2663 456 2053 154 2719 477 1721 520
Djibouti 1 1 0 0 1 1 0 0
Equatorial Guinea 0 0 0 0 0 0 0 0
Eritrea 224 209 0 14 236 222 0 14
Ethiopia 112 63 0 49 118 69 0 49
Gabon 0 0 0 0 0 0 0 0
Gambia 5 2 0 3 3 2 0 1
Ghana 16 15 0 1 22 20 0 2
Guinea 14 11 0 3 15 12 0 3
Guinea-Bissau 1 1 0 0 1 1 0 0
Kenya 417 10 399 8 311 9 300 2
Lesotho 0 0 0 0 0 0 0 0
Liberia 78 72 0 6 73 70 0 3
Madagascar 0 0 0 0 0 0 0 0
Malawi 0 0 0 0 0 0 0 0
Mali 4 3 0 1 4 4 0 0
Mauritania 52 39 0 13 40 38 0 2
Mauritius 0 0 0 0 0 0 0 0
Mozambique 0 0 0 0 0 0 0 0
Namibia 1 1 0 0 1 1 0 0
Niger 1 1 0 0 1 1 0 0
Nigeria 25 16 0 10 28 16 0 12
Rwanda 155 129 0 25 136 115 0 21
Senegal 17 16 0 1 18 16 0 2
Seychelles 0 0 0 0 0 0 0 0
Sierra Leone 19 15 0 3 15 11 0 3
Somalia 2249 678 1550 21 2257 770 1464 23
Sudan 1619 368 1034 217 2185 387 1548 250
South Africa 1 0 0 0 1 0 0 0
Swaziland 0 0 0 0 0 0 0 0
Tanzania Utd Rep 156 1 0 155 164 1 0 162
Togo 20 18 0 1 19 18 0 1
Uganda 863 8 446 409 436 6 126 304
Zambia 0 0 0 0 0 0 0 0
Zimbabwe 24 22 0 1 25 24 0 1
124
TABLE 13 Population at risk UNHCR population of concern (continued)UNHCR population of concern
total totalrefugees
internallydisplacedpersons
others andstatelesspersons
total totalrefugees
internallydisplacedpersons
others andstatelesspersons
thousands thousands thousands thousands thousands thousands thousands thousands
2009 2009 2009 2009 2010 2010 2010 2010
ASIA 13602 6372 5435 1796 14103 6425 4232 3446
Central Asia 17 14 0 3 301 17 60 224
Kazakhstan 4 4 0 1 4 4 0 1
Kyrgyzstan 3 3 0 0 284 3 60 222
Tajikistan 1 1 0 0 1 1 0 0
Turkmenistan 1 1 0 0 1 1 0 0
Uzbekistan 8 7 0 2 10 9 0 2
East Asia 1153 975 67 110 1303 986 202 115
Brunei Darussalam 0 0 0 0 0 0 0 0
Cambodia 17 17 0 0 16 16 0 0
China 199 181 0 18 192 185 0 8
Indonesia 21 18 0 2 17 17 0 0
Korea DPR 1 1 0 0 1 1 0 0
Korea Republic of 1 1 0 0 1 1 0 0
Lao PDR 9 8 0 0 8 8 0 0
Malaysia 62 1 0 61 1 1 0 0
Mongolia 4 1 0 2 4 2 0 2
Myanmar 497 407 67 23 500 416 62 22
Philippines 2 1 0 1 221 1 140 81
Singapore 0 0 0 0 0 0 0 0
Thailand 1 1 0 0 1 0 0 0
Viet Nam 341 339 0 1 340 339 0 1
South Asia 7225 3265 2627 1334 7400 3413 1578 2409
Afghanistan 3279 2887 297 95 4404 3055 352 998
Bangladesh 12 10 0 2 17 10 0 7
Bhutan 90 89 0 1 76 75 0 1
India 24 20 0 5 22 18 0 4
Iran (Islamic Rep) 87 73 0 14 85 69 0 16
Maldives 0 0 0 0 0 0 0 0
Nepal 7 5 0 2 7 6 0 1
Pakistan 3041 35 1895 1111 2199 40 952 1207
Sri Lanka 684 146 435 104 590 141 274 175
West Asia 5206 2117 2741 349 5100 2010 2393 698
Armenia 104 18 0 86 103 18 0 85
Azerbaijan 606 17 586 3 612 17 593 2
Bahrain 0 0 0 0 0 0 0 0
Cyprus 0 0 0 0 0 0 0 0
Georgia 378 15 353 10 378 11 236 131
Iraq 3565 1785 1552 228 3387 1684 1344 360
Jordan 3 2 0 1 3 2 0 1
Kuwait 1 1 0 0 1 1 0 0
Lebanon 18 16 0 2 17 16 0 2
Occupied PalestinianTerritory
98 95 0 3 97 93 0 3
Saudi Arabia 1 1 0 0 1 1 0 0
Syrian Arab Republic 23 18 0 6 28 18 0 10
Turkey 156 146 0 10 155 147 0 8
United Arab Emirates 0 0 0 0 0 0 0 0
Yemen 253 2 250 1 318 2 221 95
LATIN AMERICA amp THECARIBBEAN
3898 463 3304 132 4238 471 3672 95
Argentina 1 1 0 0 1 1 0 0
Bahamas 0 0 0 0 0 0 0 0
Barbados 0 0 0 0 0 0 0 0
Belize 0 0 0 0 0 0 0 0
Bolivia (Plur State) 1 1 0 0 1 1 0 0
Brazil 1 1 0 0 1 1 0 0
Chile 1 1 0 0 1 1 0 0
Colombia 3758 390 3304 64 4128 396 3672 60
Costa Rica 0 0 0 0 0 0 0 0
125
TABLE 13 Population at risk UNHCR population of concern (continued)UNHCR population of concern
total totalrefugees
internallydisplacedpersons
others andstatelesspersons
total totalrefugees
internallydisplacedpersons
others andstatelesspersons
thousands thousands thousands thousands thousands thousands thousands thousands
2009 2009 2009 2009 2010 2010 2010 2010
Cuba 10 8 0 2 12 7 0 4
Dominica 0 0 0 0 0 0 0 0
Dominican Republic 1 0 0 0 1 0 0 0
Ecuador 1 1 0 0 1 1 0 0
El Salvador 15 5 0 10 7 5 0 2
French Guiana 0 0 0 0 0 0 0 0
Grenada 0 0 0 0 0 0 0 0
Guatemala 15 6 0 9 7 6 0 1
Guyana 1 1 0 0 1 1 0 0
Haiti 36 24 0 12 33 26 0 7
Honduras 2 1 0 1 2 1 0 1
Jamaica 1 1 0 1 2 1 0 1
Mexico 27 6 0 20 17 7 0 10
Netherlands Antilles
Nicaragua 2 1 0 0 2 1 0 0
Panama 0 0 0 0 0 0 0 0
Paraguay 0 0 0 0 0 0 0 0
Peru 12 6 0 6 11 6 0 5
St Kitts amp Nevis 0 0 0 0 0 0 0 0
St Lucia 1 0 0 1 1 0 0 1
St Vincent amp Grenadines 2 1 0 1 2 1 0 1
Suriname 0 0 0 0 0 0 0 0
Trinidad amp Tobago 1 0 0 0 0 0 0 0
Uruguay 0 0 0 0 0 0 0 0
Venezuela (Boliv Rep of) 8 6 0 2 7 7 0 1
OCEANIA 2 2 0 0 2 2 0 0
Fiji 2 2 0 0 2 2 0 0
French Polynesia 0 0 0 0
New Caledonia 0 0 0 0 0 0 0 0
Papua New Guinea 0 0 0 0 0 0 0 0
Samoa 0 0 0 0 0 0 0 0
Solomon Islands 0 0 0 0 0 0 0 0
Tonga 0 0 0 0 0 0 0 0
Vanuatu 0 0 0 0 0 0 0 0
DEVELOPED REGIONS 1094 532 421 141 1055 505 397 153
NORTH AMERICA 4 2 0 1 4 3 0 1
Bermuda 0 0 0 0 0 0 0 0
Canada 0 0 0 0 0 0 0 0
United States of America 4 2 0 1 4 3 0 1
ASIA amp OCEANIA 3 1 0 1 2 2 0 1
Australia 0 0 0 0 0 0 0 0
Israel 2 1 0 1 2 1 0 1
Japan 0 0 0 0 0 0 0 0
New Zealand 0 0 0 0 0 0 0 0
EUROPE 1088 528 421 139 1048 500 397 151
Albania 17 16 0 2 16 15 0 1
Belarus 7 6 0 1 6 6 0 1
Bosnia amp Herzegovina 237 70 114 53 232 63 113 55
Croatia 103 76 2 25 89 66 2 21
European Union 39 14 0 24 20 13 0 7
Iceland 0 0 0 0 0 0 0 0
Macedonia FYR 9 8 0 1 11 8 0 3
Montenegro 3 3 0 0 3 3 0 0
Norway 0 0 0 0 0 0 0 0
Republic of Moldova 7 6 0 1 7 6 0 1
Russian Federation 204 109 80 14 199 112 53 34
Serbia 437 196 225 16 439 183 228 27
Switzerland 0 0 0 0 0 0 0 0
Ukraine 26 25 0 2 26 25 0 1
126
TABLE 14 Population at risk persons affected by natural disastersPersons affected by natural disasters
total droughtearthquake
extremetemperature
flood landslide storm volcanoeswildfiresand
epidemics
thousands thousands thousands thousands thousands thousands thousands thousands
2010 2010 2010 2010 2010 2010 2010 2010
WORLD 344655 106870 7485 3986 191861 2464 30954 1034
DEVELOPING REGIONS 342717 106870 6650 3971 191352 2464 30403 1007
AFRICA 43854 38810 0 0 4657 20 317 50
North Africa 81 0 0 0 81 0 0 0
Algeria 0 0 0 0 0 0 0 0
Egypt 4 0 0 0 4 0 0 0
Libya
Morocco 77 0 0 0 77 0 0 0
Tunisia
Sub-Saharan Africa 43773 38810 0 0 4577 20 317 50
Angola 255 0 0 0 255 0 0 0
Benin 832 0 0 0 831 0 0 1
Botswana 0 0 0 0 0 0 0 0
Burkina Faso 139 0 0 0 133 0 0 6
Burundi 184 180 0 0 3 0 2 0
Cameroon 6 0 0 0 3 0 0 3
Cape Verde
Central African Republic 2 0 0 0 2 0 0 0
Chad 2552 2400 0 0 145 0 0 7
Comoros
Congo 1 0 0 0 0 0 0 1
Cocircte drsquoIvoire 6 0 0 0 6 0 0 0
Congo Dem Rep 85 0 0 0 70 1 0 14
Djibouti 120 120 0 0 0 0 0 0
Equatorial Guinea
Eritrea
Ethiopia 9482 9400 0 0 81 0 0 1
Gabon 2 0 0 0 0 0 2 1
Gambia 39 0 0 0 39 0 0 0
Ghana 17 0 0 0 17 0 0 0
Guinea 48 0 0 0 48 0 0 0
Guinea-Bissau 57 0 0 0 57 0 0 0
Kenya 7514 7300 0 0 211 0 0 3
Lesotho 5 0 0 0 5 0 0 0
Liberia 15 0 0 0 15 0 0 0
Madagascar 1027 720 0 0 0 0 307 0
Malawi 79 0 0 0 79 0 0 0
Mali 619 600 0 0 19 0 0 0
Mauritania 309 300 0 0 9 0 0 0
Mauritius
Mozambique 544 460 0 0 81 0 0 4
Namibia 338 0 0 0 338 0 0 0
Niger 8134 7900 0 0 233 0 0 1
Nigeria 1509 0 0 0 1500 0 0 8
Rwanda 10 0 0 0 4 6 0 0
Senegal 103 0 0 0 103 0 0 0
Seychelles
Sierra Leone 0 0 0 0 0 0 0 0
Somalia 2866 2850 0 0 16 0 0 0
Sudan 4438 4300 0 0 138 0 0 0
South Africa 26 0 0 0 20 0 6 0
Swaziland
Tanzania Utd Rep
Togo 112 0 0 0 112 0 0 0
Uganda 613 600 0 0 0 13 0 0
Zambia 3 0 0 0 3 0 0 0
Zimbabwe 1681 1680 0 0 1 0 0 0
127
TABLE 14 Population at risk persons affected by natural disasters (continued)Persons affected by natural disasters
total droughtearthquake
extremetemperature
flood landslide storm volcanoeswildfiresand
epidemics
thousands thousands thousands thousands thousands thousands thousands thousands
2010 2010 2010 2010 2010 2010 2010 2010
ASIA 285231 67783 252 3900 181630 2388 28948 330
Central Asia 64 0 8 0 47 8 0 1
Kazakhstan 38 0 0 0 38 0 0 0
Kyrgyzstan 8 0 0 0 0 8 0 0
Tajikistan 17 0 8 0 9 0 0 0
Turkmenistan
Uzbekistan
East Asia 256254 66483 234 3800 154940 2294 28180 324
Brunei Darussalam
Cambodia 0 0 0 0 0 0 0 0
China 231535 60000 196 3800 140254 2148 25137 0
Indonesia 238 0 17 0 69 0 0 152
Korea DPR 96 0 0 0 56 0 40 0
Korea Republic of 42 0 0 0 0 0 42 0
Lao PDR
Malaysia 0 0 0 0 0 0 0 0
Mongolia
Myanmar 426 0 21 0 0 145 260 0
Philippines 6738 0 0 0 3901 1 2666 171
Singapore
Thailand 15654 6483 0 0 9171 0 0 1
Viet Nam 1524 0 0 0 1490 0 35 0
South Asia 27536 0 7 100 26570 86 768 5
Afghanistan 49 0 1 0 48 0 0 0
Bangladesh 987 0 0 100 575 55 257 0
Bhutan
India 4790 0 0 0 4283 0 507 0
Iran (Islamic Rep) 5 0 5 0 0 0 0 0
Maldives
Nepal 13 0 0 0 8 0 0 5
Pakistan 20399 0 1 0 20363 30 4 0
Sri Lanka 1292 0 0 0 1292 0 0 0
West Asia 1377 1300 4 0 74 0 0 0
Armenia
Azerbaijan 70 0 0 0 70 0 0 0
Bahrain
Cyprus
Georgia
Iraq 2 0 0 0 2 0 0 0
Jordan
Kuwait
Lebanon
Occupied PalestinianTerritory
0 0 0 0 0 0 0 0
Saudi Arabia 0 0 0 0 0 0 0 0
Syrian Arab Republic 1300 1300 0 0 0 0 0 0
Turkey 4 0 4 0 0 0 0 0
United Arab Emirates
Yemen 1 0 0 0 1 0 0 0
LATIN AMERICA amp THECARIBBEAN
13570 277 6397 71 5049 56 1093 628
Argentina 0 0 0 0 0 0 0 0
Bahamas
Barbados 2 0 0 0 0 0 2 0
Belize 0 0 0 0 0 0 0 0
Bolivia (Plur State) 428 62 0 0 358 4 0 3
Brazil 357 62 0 0 295 0 0 0
Chile 2676 0 2672 0 0 0 0 4
Colombia 3005 0 0 0 3005 0 0 0
Costa Rica 3 0 0 0 3 0 0 0
128
TABLE 14 Population at risk persons affected by natural disasters (continued)Persons affected by natural disasters
total droughtearthquake
extremetemperature
flood landslide storm volcanoeswildfiresand
epidemics
thousands thousands thousands thousands thousands thousands thousands thousands
2010 2010 2010 2010 2010 2010 2010 2010
Cuba
Dominica
Dominican Republic 52 0 0 0 39 0 12 0
Ecuador 121 108 0 0 11 0 0 2
El Salvador 12 0 0 0 0 0 12 0
French Guiana
Grenada 0 0 0 0 0 0 0 0
Guatemala 456 0 0 0 3 51 400 2
Guyana 0 0 0 0 0 0 0 0
Haiti 4310 0 3700 0 24 0 78 507
Honduras 102 45 0 0 5 0 25 27
Jamaica 3 0 0 0 0 0 3 0
Mexico 1600 0 25 0 1020 0 555 0
Netherlands Antilles
Nicaragua 76 0 0 0 76 0 0 0
Panama 33 0 0 0 33 0 0 0
Paraguay 16 0 0 0 0 0 0 16
Peru 154 0 0 71 80 1 0 2
St Kitts amp Nevis
St Lucia 3 0 0 0 2 0 1 0
St Vincent amp Grenadines
Suriname
Trinidad amp Tobago 0 0 0 0 0 0 0 0
Uruguay 0 0 0 0 0 0 0 0
Venezuela (Boliv Rep of) 95 0 0 0 95 0 0 0
OCEANIA 62 0 1 0 16 0 45 0
Fiji 39 0 0 0 0 0 39 0
French Polynesia 3 0 0 0 0 0 3 0
New Caledonia
Papua New Guinea 0 0 0 0 0 0 0 0
Samoa
Solomon Islands 18 0 1 0 16 0 1 0
Tonga 0 0 0 0 0 0 0 0
Vanuatu 0 0 0 0 0 0 0 0
DEVELOPED REGIONS 1922 0 835 15 509 0 536 27
NORTH AMERICA 36 0 1 0 7 0 29 0
Bermuda
Canada 0 0 0 0 0 0 0 0
United States of America 36 0 1 0 7 0 29 0
ASIA amp OCEANIA 1046 0 792 15 211 0 7 20
Australia 219 0 0 0 211 0 7 0
Israel 20 0 0 0 0 0 0 20
Japan 507 0 492 15 0 0 0 0
New Zealand 300 0 300 0 0 0 0 0
EUROPE 840 0 42 0 291 0 500 7
Albania 14 0 0 0 14 0 0 0
Belarus
Bosnia amp Herzegovina 35 0 0 0 35 0 0 0
Croatia 1 0 0 0 1 0 0 0
European Union 634 0 15 0 119 0 500 0
Iceland 0 0 0 0 0 0 0 0
Macedonia FYR
Montenegro 6 0 0 0 6 0 0 0
Norway
Republic of Moldova 12 0 0 0 12 0 0 0
Russian Federation 66 0 0 0 58 0 0 7
Serbia 32 0 27 0 5 0 0 0
Switzerland 0 0 0 0 0 0 0 0
Ukraine 40 0 0 0 40 0 0 0
129
TABLE 15 UndernourishmentShare of population undernourished Incidence of undernourishment Depth of hunger
pa millions millions pakcalcapday kcalcapday
pa
1995-97 2006-08 growth1995-97 -2006-08
1995-97 2006-08 growth1995-97 -2006-08
1995-97 2006-08 growth1995-97 -2006-08
WORLD 18 16 minus23 7012 7392 05 214 212 minus03
DEVELOPING REGIONS 18 16 minus23 7011 7392 05 234 234 minus03
AFRICA 29 23 minus24 1622 1603 minus01 253 234 minus05
North Africa 5 31 185 188 01
Algeria 5 15 180 180 00
Egypt 190 200 03
Libya 130 130 05
Morocco 6 16 210 200 minus03
Tunisia 120 120 00
Sub-Saharan Africa 31 23 minus23 1591 1603 01 268 243 minus05
Angola 61 41 minus35 78 72 minus07 390 320 minus17
Benin 18 12 minus36 10 10 00 230 210 minus08
Botswana 23 25 08 04 05 20 230 240 08
Burkina Faso 12 8 minus36 12 12 00 210 200 minus06
Burundi 56 62 09 35 49 31 350 390 14
Cameroon 34 22 minus39 50 42 minus16 260 230 minus08
Cape Verde 14 11 minus22 01 01 00 190 190 00
Central African Republic 47 40 minus15 16 17 06 320 300 minus02
Chad 53 39 minus27 39 41 05 370 320 minus12
Comoros 47 47 00 03 04 26 300 300 07
Congo 41 13 minus99 12 05 minus76 310 230 minus18
Cocircte drsquoIvoire 17 14 minus17 26 29 10 240 230 00
Congo Dem Rep
Djibouti 50 26 minus58 03 02 minus36 350 280 minus20
Equatorial Guinea
Eritrea 64 65 01 21 31 36 340 350 minus02
Ethiopia 62 41 minus37 362 326 minus09 390 320 minus17
Gabon 140 140 minus04
Gambia 23 19 minus17 03 03 00 250 240 05
Ghana 13 5 minus83 23 11 minus65 210 180 minus23
Guinea 19 16 minus15 15 16 06 270 260 minus02
Guinea-Bissau 26 22 minus15 03 03 00 260 250 00
Kenya 32 33 03 90 124 30 250 260 02
Lesotho 16 14 minus12 03 03 00 220 220 00
Liberia 32 32 00 07 11 42 330 330 02
Madagascar 26 25 minus04 35 47 27 250 250 05
Malawi 36 27 minus26 38 39 02 310 280 minus08
Mali 25 12 minus65 25 15 minus45 260 220 minus13
Mauritania 9 8 minus11 02 02 00 210 210 minus03
Mauritius 7 5 minus30 01 01 00 190 180 minus03
Mozambique 47 38 minus19 78 83 06 360 330 minus12
Namibia 30 18 minus45 05 04 minus20 250 220 minus08
Niger 37 16 minus73 35 23 minus37 300 240 minus14
Nigeria 10 6 minus45 109 94 minus13 200 180 minus12
Rwanda 53 32 minus45 30 30 00 360 300 minus06
Senegal 26 19 minus28 23 23 00 240 220 minus03
Seychelles 10 8 minus20 00 00 160 150 minus04
Sierra Leone 39 35 minus10 16 19 16 360 340 minus07
Somalia
Sudan 29 22 minus25 93 88 minus05 260 240 minus12
South Africa 160 150 00
Swaziland 21 19 minus09 02 02 00 220 220 09
Tanzania Utd Rep 42 34 minus19 128 139 08 300 280 05
Togo 36 30 minus16 17 19 10 290 280 minus06
Uganda 23 22 minus04 49 67 29 240 240 00
Zambia 38 44 13 36 54 38 300 320 06
Zimbabwe 44 30 minus34 53 37 minus32 340 300 minus06
130
TABLE 15 Undernourishment (continued)Share of population undernourished Incidence of undernourishment Depth of hunger
pa millions millions pakcalcapday kcalcapday
pa
1995-97 2006-08 growth1995-97 -2006-08
1995-97 2006-08 growth1995-97 -2006-08
1995-97 2006-08 growth1995-97 -2006-08
ASIA 16 15 minus21 4909 5372 08 233 238 minus02
Central Asia 12 13 minus20 46 55 16 171 172 minus01
Kazakhstan 130 120 00
Kyrgyzstan 13 11 minus15 06 06 00 210 210 minus03
Tajikistan 42 26 minus43 24 18 minus26 270 230 minus05
Turkmenistan 9 7 minus23 04 03 minus26 180 180 00
Uzbekistan 5 11 74 12 28 80 160 180 07
East Asia 13 11 minus18 2194 2058 minus06 241 241 minus04
Brunei Darussalam 140 130 minus05
Cambodia 40 25 minus42 47 36 minus24 280 250 minus05
China 12 10 minus16 1417 1296 minus08 250 250 minus05
Indonesia 11 13 15 220 297 28 210 220 00
Korea DPR 30 35 14 66 84 22 250 270 10
Korea Republic of 120 130 00
Lao PDR 29 22 minus25 14 14 00 270 260 minus05
Malaysia 120 130 minus05
Mongolia 33 27 minus18 08 07 minus12 260 260 02
Myanmar
Philippines 20 13 minus38 141 118 minus16 250 240 minus07
Singapore
Thailand 18 16 minus11 111 107 minus03 240 240 minus07
Viet Nam 22 11 minus61 167 96 minus49 270 240 minus12
South Asia 20 20 minus11 2570 3174 19 232 246 00
Afghanistan
Bangladesh 41 26 minus41 542 414 minus24 330 290 minus04
Bhutan
India 17 19 10 1671 2246 27 220 240 00
Iran (Islamic Rep) 170 180 07
Maldives 9 10 10 00 00 180 190 07
Nepal 20 17 minus15 44 47 06 230 220 minus03
Pakistan 20 25 20 268 428 43 260 280 00
Sri Lanka 25 20 minus20 45 39 minus13 260 250 minus02
West Asia 24 24 minus42 99 85 minus14 173 169 minus02
Armenia 36 21 minus48 11 06 minus54 230 200 minus14
Azerbaijan 27 22 220 140 minus28
Bahrain
Cyprus 120 120 00
Georgia 19 6 minus99 10 03 minus104 200 160 minus39
Iraq
Jordan 5 02 170 150 00
Kuwait 5 5 00 01 01 00 180 190 minus12
Lebanon 160 170 04
Occupied PalestinianTerritory
10 21 70 03 08 93 160 190
Saudi Arabia 130 130 minus05
Syrian Arab Republic 160 170 04
Turkey 160 160 04
United Arab Emirates 130 140 05
Yemen 31 30 minus03 50 67 27 260 260 02
LATIN AMERICA amp THECARIBBEAN
14 11 minus19 480 416 minus13 212 203 minus03
Argentina 120 130 00
Bahamas 8 6 minus26 00 00 160 160 00
Barbados 140 140 05
Belize 8 5 minus42 00 00 180 170 00
Bolivia (Plur State) 24 27 11 19 25 25 230 240 00
Brazil 10 6 minus45 166 117 minus31 240 220 minus05
Chile 150 140 minus08
Colombia 11 9 minus18 40 41 02 210 210 minus03
Costa Rica 150 150 04
131
TABLE 15 Undernourishment (continued)Share of population undernourished Incidence of undernourishment Depth of hunger
pa millions millions pakcalcapday kcalcapday
pa
1995-97 2006-08 growth1995-97 -2006-08
1995-97 2006-08 growth1995-97 -2006-08
1995-97 2006-08 growth1995-97 -2006-08
Cuba 14 15 190 120 minus18
Dominica 150 150 00
Dominican Republic 26 24 minus07 21 23 08 240 230 minus03
Ecuador 16 15 minus06 18 20 10 190 190 minus03
El Salvador 12 9 minus26 07 06 minus14 200 190 minus03
French Guiana
Grenada 18 21 14 00 00 240 250 08
Guatemala 20 22 09 21 29 30 220 230 06
Guyana 11 8 minus29 01 01 00 200 190 minus12
Haiti 60 57 minus05 48 55 12 430 420 minus03
Honduras 16 12 minus26 09 09 00 240 230 minus05
Jamaica 6 5 minus16 02 01 minus61 170 170 minus07
Mexico 190 190 00
Netherlands Antilles 150 150 minus11
Nicaragua 38 19 minus61 18 11 minus44 310 260 minus18
Panama 20 15 minus26 06 05 minus16 230 220 minus03
Paraguay 10 10 00 05 06 17 200 210 minus03
Peru 21 16 minus24 50 45 minus10 230 220 minus08
St Kitts amp Nevis 16 16 00 00 00 220 220 06
St Lucia 7 8 12 00 00 180 190 00
St Vincent amp Grenadines 16 5 minus100 00 00 210 170 minus10
Suriname 13 15 13 01 01 00 200 200 00
Trinidad amp Tobago 14 11 minus22 02 02 00 220 220 03
Uruguay 140 140 minus04
Venezuela (Boliv Rep of) 14 7 minus61 31 19 minus44 190 170 minus04
OCEANIA 8 9 00 01 182 173 minus06
Fiji 5 00 170 160 minus07
French Polynesia 5 00 160 150 minus11
New Caledonia 9 8 minus11 00 00 210 210 03
Papua New Guinea
Samoa 10 00 180 150 minus11
Solomon Islands 13 11 minus15 00 01 190 190 minus06
Tonga
Vanuatu 9 00 200 180 minus07
DEVELOPED REGIONS 5 01 125 116 01
NORTH AMERICA 111 101 minus02
Bermuda 180 200 07
Canada 120 110 minus10
United States of America 110 100 minus06
ASIA amp OCEANIA 128 126 00
Australia 130 120 00
Israel 90 90 00
Japan 130 130 00
New Zealand 120 120 00
EUROPE 5 01 131 121 01
Albania 160 160 minus07
Belarus 120 130 05
Bosnia amp Herzegovina 150 140 minus12
Croatia 180 150 minus18
European Union 5 01 120 115 minus02
Iceland 130 120 minus05
Macedonia FYR 180 150 minus11
Montenegro 170
Norway 120 110 minus05
Republic of Moldova 190 190 07
Russian Federation 160 130 minus09
Serbia 170
Switzerland 120 120 00
Ukraine 150 130 minus05
132
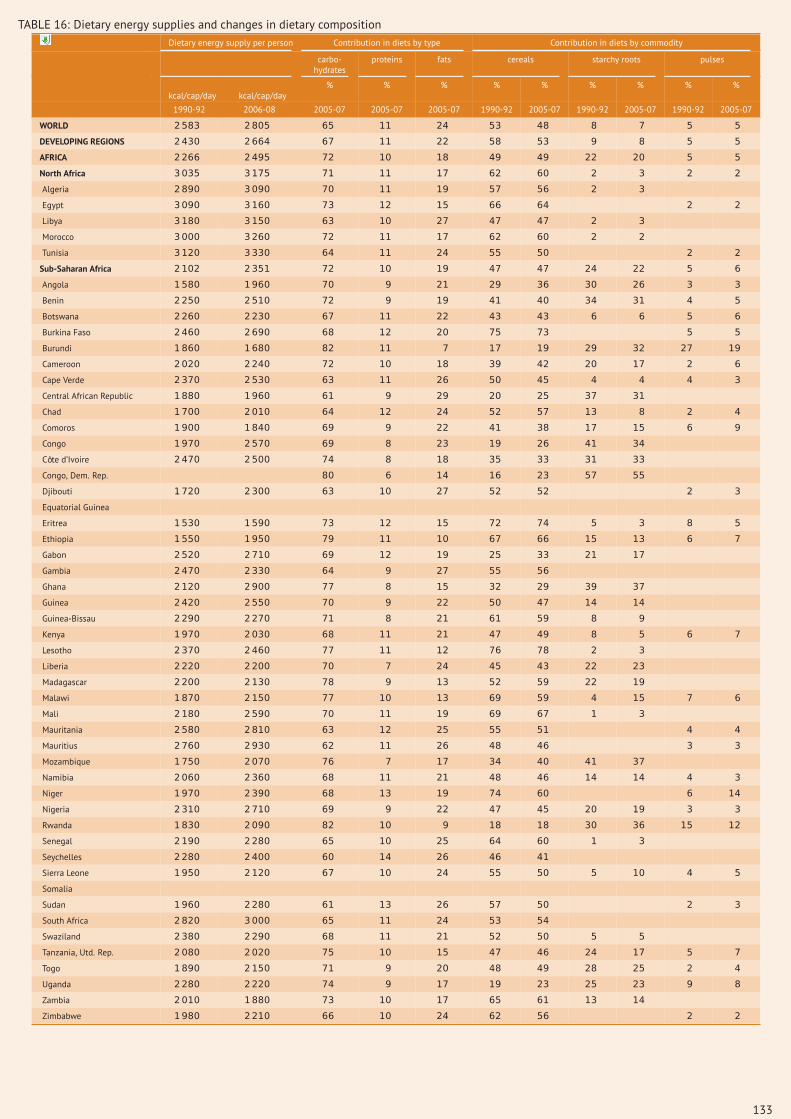
TABLE 16 Dietary energy supplies and changes in dietary compositionDietary energy supply per person Contribution in diets by type Contribution in diets by commodity
carbo-hydrates
proteins fats cereals starchy roots pulses
kcalcapday kcalcapday
1990-92 2006-08 2005-07 2005-07 2005-07 1990-92 2005-07 1990-92 2005-07 1990-92 2005-07
WORLD 2583 2805 65 11 24 53 48 8 7 5 5
DEVELOPING REGIONS 2430 2664 67 11 22 58 53 9 8 5 5
AFRICA 2266 2495 72 10 18 49 49 22 20 5 5
North Africa 3035 3175 71 11 17 62 60 2 3 2 2
Algeria 2890 3090 70 11 19 57 56 2 3
Egypt 3090 3160 73 12 15 66 64 2 2
Libya 3180 3150 63 10 27 47 47 2 3
Morocco 3000 3260 72 11 17 62 60 2 2
Tunisia 3120 3330 64 11 24 55 50 2 2
Sub-Saharan Africa 2102 2351 72 10 19 47 47 24 22 5 6
Angola 1580 1960 70 9 21 29 36 30 26 3 3
Benin 2250 2510 72 9 19 41 40 34 31 4 5
Botswana 2260 2230 67 11 22 43 43 6 6 5 6
Burkina Faso 2460 2690 68 12 20 75 73 5 5
Burundi 1860 1680 82 11 7 17 19 29 32 27 19
Cameroon 2020 2240 72 10 18 39 42 20 17 2 6
Cape Verde 2370 2530 63 11 26 50 45 4 4 4 3
Central African Republic 1880 1960 61 9 29 20 25 37 31
Chad 1700 2010 64 12 24 52 57 13 8 2 4
Comoros 1900 1840 69 9 22 41 38 17 15 6 9
Congo 1970 2570 69 8 23 19 26 41 34
Cocircte drsquoIvoire 2470 2500 74 8 18 35 33 31 33
Congo Dem Rep 80 6 14 16 23 57 55
Djibouti 1720 2300 63 10 27 52 52 2 3
Equatorial Guinea
Eritrea 1530 1590 73 12 15 72 74 5 3 8 5
Ethiopia 1550 1950 79 11 10 67 66 15 13 6 7
Gabon 2520 2710 69 12 19 25 33 21 17
Gambia 2470 2330 64 9 27 55 56
Ghana 2120 2900 77 8 15 32 29 39 37
Guinea 2420 2550 70 9 22 50 47 14 14
Guinea-Bissau 2290 2270 71 8 21 61 59 8 9
Kenya 1970 2030 68 11 21 47 49 8 5 6 7
Lesotho 2370 2460 77 11 12 76 78 2 3
Liberia 2220 2200 70 7 24 45 43 22 23
Madagascar 2200 2130 78 9 13 52 59 22 19
Malawi 1870 2150 77 10 13 69 59 4 15 7 6
Mali 2180 2590 70 11 19 69 67 1 3
Mauritania 2580 2810 63 12 25 55 51 4 4
Mauritius 2760 2930 62 11 26 48 46 3 3
Mozambique 1750 2070 76 7 17 34 40 41 37
Namibia 2060 2360 68 11 21 48 46 14 14 4 3
Niger 1970 2390 68 13 19 74 60 6 14
Nigeria 2310 2710 69 9 22 47 45 20 19 3 3
Rwanda 1830 2090 82 10 9 18 18 30 36 15 12
Senegal 2190 2280 65 10 25 64 60 1 3
Seychelles 2280 2400 60 14 26 46 41
Sierra Leone 1950 2120 67 10 24 55 50 5 10 4 5
Somalia
Sudan 1960 2280 61 13 26 57 50 2 3
South Africa 2820 3000 65 11 24 53 54
Swaziland 2380 2290 68 11 21 52 50 5 5
Tanzania Utd Rep 2080 2020 75 10 15 47 46 24 17 5 7
Togo 1890 2150 71 9 20 48 49 28 25 2 4
Uganda 2280 2220 74 9 17 19 23 25 23 9 8
Zambia 2010 1880 73 10 17 65 61 13 14
Zimbabwe 1980 2210 66 10 24 62 56 2 2
133
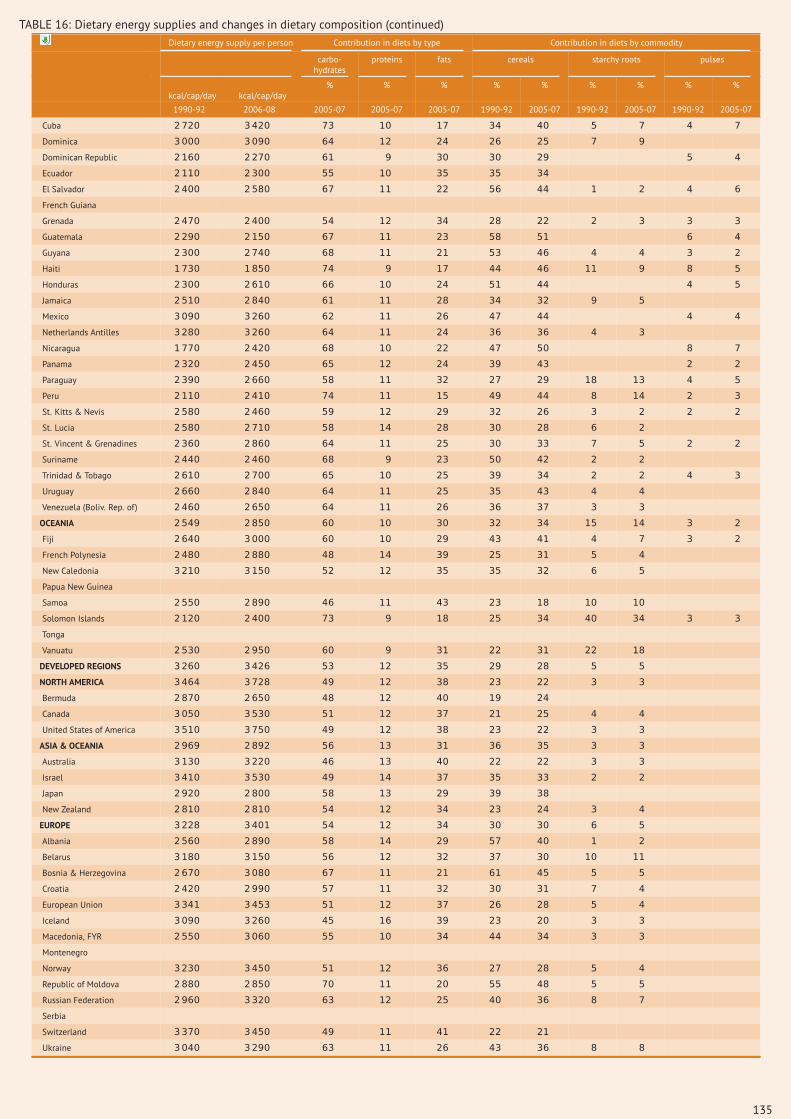
TABLE 16 Dietary energy supplies and changes in dietary composition (continued)Dietary energy supply per person Contribution in diets by type Contribution in diets by commodity
carbo-hydrates
proteins fats cereals starchy roots pulses
kcalcapday kcalcapday
1990-92 2006-08 2005-07 2005-07 2005-07 1990-92 2005-07 1990-92 2005-07 1990-92 2005-07
ASIA 2434 2667 67 11 22 63 56 6 5 5 5
Central Asia 2715 2793 64 12 25 59 54 4 6
Kazakhstan 3280 3510 61 12 27 57 43 4 6
Kyrgyzstan 2400 2660 68 12 20 57 48 5 8
Tajikistan 2020 2190 64 10 26 63 63
Turkmenistan 2550 2740 65 13 23 57 61
Uzbekistan 2650 2560 64 12 25 59 57
East Asia 2508 2872 64 11 24 63 53 7 5 3 6
Brunei Darussalam 2730 2980 64 12 25 48 45
Cambodia 1870 2180 75 10 14 82 72 2 4
China 2580 2990 61 12 27 63 50 7 5
Indonesia 2390 2550 73 9 18 66 63 7 6
Korea DPR 2340 2110 74 11 15 60 62 3 7 6 5
Korea Republic of 2970 3040 63 11 25 54 44
Lao PDR 2010 2240 76 11 13 78 70 6 4
Malaysia 2720 2890 63 11 26 42 47 3 2
Mongolia 2080 2240 56 13 32 42 46 2 4
Myanmar 67 11 22 73 59 2 6
Philippines 2230 2580 73 9 18 53 57 4 3
Singapore
Thailand 2250 2540 71 9 20 57 49
Viet Nam 2090 2780 70 10 19 76 66
South Asia 2279 2374 71 10 19 65 60 2 3 5 5
Afghanistan
Bangladesh 1960 2270 80 9 12 84 78 1 3
Bhutan
India 2290 2360 71 10 19 64 60 5 5
Iran (Islamic Rep) 2970 3050 69 11 20 60 53 3 4
Maldives 2400 2550 60 16 23 46 35
Nepal 2190 2340 74 10 15 74 69 3 5 3 3
Pakistan 2210 2280 63 10 27 55 47 3 3
Sri Lanka 2170 2370 73 9 18 56 56 4 2 3 3
West Asia 2963 3067 64 11 25 51 49 3 3 4 3
Armenia 1920 2260 64 12 24 59 44 8 5
Azerbaijan 2160 3020 73 11 16 66 60 2 6
Bahrain
Cyprus 3120 3190 48 12 41 28 21 3 3
Georgia 1850 2730 67 11 22 57 50 5 3
Iraq
Jordan 2840 3000 63 10 27 50 46 3 2
Kuwait 2350 3030 58 12 30 39 42 2 2
Lebanon 3010 3090 58 11 32 34 34 3 6 4 3
Occupied PalestinianTerritory
2080 66 11 23 0 51
Saudi Arabia 2850 3120 64 11 25 48 48
Syrian Arab Republic 2830 3040 59 10 30 50 45
Turkey 3590 3500 62 11 27 51 48 3 3 4 3
United Arab Emirates 3160 3170 63 13 24 33 43 3 4
Yemen 1980 2050 69 11 20 66 61 3 3
LATIN AMERICA amp THECARIBBEAN
2664 2915 62 11 27 39 37 6 6 5 5
Argentina 3010 3030 55 13 32 32 31 3 3
Bahamas 2610 2710 57 12 30 27 27 2 2
Barbados 3040 3020 59 12 29 30 27 3 3
Belize 2510 2710 67 11 23 37 39 4 4
Bolivia (Plur State) 2030 2100 71 11 18 43 47 9 7
Brazil 2760 3120 59 11 30 33 32 5 5 5 5
Chile 2600 2960 61 12 27 43 40 4 4
Colombia 2410 2690 66 10 24 33 34 8 6
Costa Rica 2820 2820 62 11 27 32 31 3 4
134
TABLE 16 Dietary energy supplies and changes in dietary composition (continued)Dietary energy supply per person Contribution in diets by type Contribution in diets by commodity
carbo-hydrates
proteins fats cereals starchy roots pulses
kcalcapday kcalcapday
1990-92 2006-08 2005-07 2005-07 2005-07 1990-92 2005-07 1990-92 2005-07 1990-92 2005-07
Cuba 2720 3420 73 10 17 34 40 5 7 4 7
Dominica 3000 3090 64 12 24 26 25 7 9
Dominican Republic 2160 2270 61 9 30 30 29 5 4
Ecuador 2110 2300 55 10 35 35 34
El Salvador 2400 2580 67 11 22 56 44 1 2 4 6
French Guiana
Grenada 2470 2400 54 12 34 28 22 2 3 3 3
Guatemala 2290 2150 67 11 23 58 51 6 4
Guyana 2300 2740 68 11 21 53 46 4 4 3 2
Haiti 1730 1850 74 9 17 44 46 11 9 8 5
Honduras 2300 2610 66 10 24 51 44 4 5
Jamaica 2510 2840 61 11 28 34 32 9 5
Mexico 3090 3260 62 11 26 47 44 4 4
Netherlands Antilles 3280 3260 64 11 24 36 36 4 3
Nicaragua 1770 2420 68 10 22 47 50 8 7
Panama 2320 2450 65 12 24 39 43 2 2
Paraguay 2390 2660 58 11 32 27 29 18 13 4 5
Peru 2110 2410 74 11 15 49 44 8 14 2 3
St Kitts amp Nevis 2580 2460 59 12 29 32 26 3 2 2 2
St Lucia 2580 2710 58 14 28 30 28 6 2
St Vincent amp Grenadines 2360 2860 64 11 25 30 33 7 5 2 2
Suriname 2440 2460 68 9 23 50 42 2 2
Trinidad amp Tobago 2610 2700 65 10 25 39 34 2 2 4 3
Uruguay 2660 2840 64 11 25 35 43 4 4
Venezuela (Boliv Rep of) 2460 2650 64 11 26 36 37 3 3
OCEANIA 2549 2850 60 10 30 32 34 15 14 3 2
Fiji 2640 3000 60 10 29 43 41 4 7 3 2
French Polynesia 2480 2880 48 14 39 25 31 5 4
New Caledonia 3210 3150 52 12 35 35 32 6 5
Papua New Guinea
Samoa 2550 2890 46 11 43 23 18 10 10
Solomon Islands 2120 2400 73 9 18 25 34 40 34 3 3
Tonga
Vanuatu 2530 2950 60 9 31 22 31 22 18
DEVELOPED REGIONS 3260 3426 53 12 35 29 28 5 5
NORTH AMERICA 3464 3728 49 12 38 23 22 3 3
Bermuda 2870 2650 48 12 40 19 24
Canada 3050 3530 51 12 37 21 25 4 4
United States of America 3510 3750 49 12 38 23 22 3 3
ASIA amp OCEANIA 2969 2892 56 13 31 36 35 3 3
Australia 3130 3220 46 13 40 22 22 3 3
Israel 3410 3530 49 14 37 35 33 2 2
Japan 2920 2800 58 13 29 39 38
New Zealand 2810 2810 54 12 34 23 24 3 4
EUROPE 3228 3401 54 12 34 30 30 6 5
Albania 2560 2890 58 14 29 57 40 1 2
Belarus 3180 3150 56 12 32 37 30 10 11
Bosnia amp Herzegovina 2670 3080 67 11 21 61 45 5 5
Croatia 2420 2990 57 11 32 30 31 7 4
European Union 3341 3453 51 12 37 26 28 5 4
Iceland 3090 3260 45 16 39 23 20 3 3
Macedonia FYR 2550 3060 55 10 34 44 34 3 3
Montenegro
Norway 3230 3450 51 12 36 27 28 5 4
Republic of Moldova 2880 2850 70 11 20 55 48 5 5
Russian Federation 2960 3320 63 12 25 40 36 8 7
Serbia
Switzerland 3370 3450 49 11 41 22 21
Ukraine 3040 3290 63 11 26 43 36 8 8
135
TABLE 17 Changes in dietary compositionContribution in diets by commodity
meat and fish dairy and eggs fruit and vegetables sugar vegetable oils other
1990-92 2005-07 1990-92 2005-07 1990-92 2005-07 1990-92 2005-07 1990-92 2005-07 1990-92 2005-07
WORLD 8 11 5 5 4 5 8 8 8 9 11 13
DEVELOPING REGIONS 7 10 4 4 4 5 7 7 7 8 10 12
AFRICA 4 4 5 6 6 6 6 6 9 9 11 11
North Africa 3 3 3 3 6 7 10 9 9 7 7 9
Algeria 3 3 6 6 3 5 9 9 14 10 6 8
Egypt 2 3 2 2 7 9 10 8 6 4 5 8
Libya 5 4 5 5 8 7 12 10 14 16 7 8
Morocco 3 3 4 6 10 11 8 8 11 10
Tunisia 3 3 4 5 6 6 9 10 15 14 6 10
Sub-Saharan Africa 4 4 7 7 6 6 5 5 9 9 12 12
Angola 5 5 7 8 14 12 12 10
Benin 2 2 6 8 13 14
Botswana 6 4 9 7 11 13 6 9 14 12
Burkina Faso 3 3 4 5 13 14
Burundi 10 15 17 15
Cameroon 3 3 10 8 3 4 8 8 15 12
Cape Verde 6 9 5 8 2 2 7 9 10 8 12 12
Central African Republic 7 8 4 4 3 4 14 14 15 14
Chad 4 4 5 5 24 22
Comoros 8 7 4 6 8 11 16 14
Congo 4 3 5 4 4 6 12 15 15 12
Cocircte drsquoIvoire 8 7 4 4 10 11 12 12
Congo Dem Rep 7 3 7 7 13 12
Djibouti 5 6 5 5 19 11 10 16 7 7
Equatorial Guinea
Eritrea 1 4 4 6 10 8
Ethiopia 3 2 2 3 7 9
Gabon 8 8 16 12 6 6 5 6 19 18
Gambia 2 2 17 12 13 17 13 13
Ghana 7 11 3 4 7 7 12 12
Guinea 13 10 4 5 11 14 8 10
Guinea-Bissau 4 4 4 3 1 6 13 12 9 7
Kenya 8 7 4 5 10 9 8 8 9 10
Lesotho 4 4 7 6 11 9
Liberia 4 4 2 3 16 19 11 8
Madagascar 6 4 3 3 3 3 3 4 11 8
Malawi 4 5 7 5 9 10
Mali 3 3 5 5 4 5 9 7 9 10
Mauritania 5 5 11 10 10 12 9 12 6 6
Mauritius 4 6 6 6 2 4 14 12 14 15 9 8
Mozambique 1 4 13 9 11 10
Namibia 6 6 4 5 16 10 2 7 6 9
Niger 4 5 3 3 2 3 3 5 8 10
Nigeria 3 3 2 3 13 13 12 14
Rwanda 21 18 2 4 14 12
Senegal 3 3 2 2 7 6 13 15 10 11
Seychelles 10 11 6 4 5 7 14 10 7 8 12 19
Sierra Leone 3 3 20 15 13 17
Somalia
Sudan 4 5 12 17 8 10 7 5 10 10
South Africa 8 9 3 3 12 10 8 12 16 12
Swaziland 5 6 4 5 3 3 15 13 7 6 9 12
Tanzania Utd Rep 3 6 3 5 5 7 13 12
Togo 9 10 13 12
Uganda 20 17 1 4 3 7 23 18
Zambia 3 3 8 6 4 6 7 10
Zimbabwe 3 4 11 12 8 10 14 16
136
TABLE 17 Changes in dietary composition (continued)Contribution in diets by commodity
meat and fish dairy and eggs fruit and vegetables sugar vegetable oils other
1990-92 2005-07 1990-92 2005-07 1990-92 2005-07 1990-92 2005-07 1990-92 2005-07 1990-92 2005-07
ASIA 8 12 3 4 3 4 6 6 7 8 9 12
Central Asia 7 7 9 10 2 4 5 6 9 9 8 9
Kazakhstan 10 9 8 13 1 3 6 9 5 8 9 9
Kyrgyzstan 11 7 12 12 2 4 6 9 4 5 3 7
Tajikistan 3 4 6 5 6 7 11 11 11 10
Turkmenistan 7 10 8 9 2 3 6 4 11 6 9 7
Uzbekistan 6 6 9 9 3 4 4 3 12 11 7 10
East Asia 9 14 1 2 3 5 4 4 6 7 9 13
Brunei Darussalam 9 8 7 9 5 5 12 13 7 8 12 12
Cambodia 5 5 1 4 2 3 8 12
China 9 15 1 2 3 6 3 2 6 7 8 13
Indonesia 2 3 6 6 7 8 12 14
Korea DPR 5 5 8 7 5 6 13 8
Korea Republic of 7 11 7 8 10 11 8 12 14 14
Lao PDR 4 5 2 5 1 2 9 14
Malaysia 12 11 4 3 3 3 13 12 14 12 9 10
Mongolia 30 17 8 11 8 6 1 6 9 10
Myanmar 2 6 2 2 3 6 10 9 8 12
Philippines 10 12 6 6 12 9 6 4 9 9
Singapore
Thailand 8 9 5 4 8 14 5 6 17 18
Viet Nam 6 12 4 5 3 4 2 3 9 10
South Asia 2 4 4 5 2 3 9 8 7 9 9 11
Afghanistan
Bangladesh 3 4 4 7 8 8
Bhutan
India 4 4 2 2 9 8 7 9 9 12
Iran (Islamic Rep) 3 5 3 3 8 12 9 9 9 7 5 7
Maldives 10 17 3 7 4 9 17 13 7 7 13 12
Nepal 3 4 1 2 6 7 10 10
Pakistan 2 3 9 12 12 12 10 11 9 12
Sri Lanka 3 3 3 2 11 11 3 4 17 19
West Asia 5 6 6 6 9 7 9 10 10 12 9 10
Armenia 6 8 7 10 8 13 4 8 2 5 6 7
Azerbaijan 5 4 7 6 5 3 6 6 1 4 8 11
Bahrain
Cyprus 12 13 10 10 8 7 12 13 13 15 14 18
Georgia 7 5 7 10 7 14 2 7 15 11
Iraq
Jordan 5 5 5 5 3 2 15 15 11 15 8 10
Kuwait 11 11 8 5 7 7 12 11 11 12 10 10
Lebanon 5 7 4 5 15 9 11 11 14 14 10 11
Occupied PalestinianTerritory
0 5 0 5 100 8 0 12 0 10 0 9
Saudi Arabia 7 7 5 5 10 10 10 10 13 12 7 8
Syrian Arab Republic 4 4 6 7 4 3 12 13 12 12 12 16
Turkey 6 6 8 8 8 8 11 14 9 10
United Arab Emirates 11 10 9 5 12 9 11 12 9 6 12 11
Yemen 3 4 2 3 10 12 9 10 7 7
LATIN AMERICA amp THECARIBBEAN
7 10 6 6 5 5 16 14 10 11 11 11
Argentina 17 17 8 9 14 16 11 11 15 13
Bahamas 18 17 7 6 9 9 16 15 3 6 18 18
Barbados 16 15 7 7 3 7 16 19 10 9 15 13
Belize 8 8 7 6 8 8 15 15 3 4 18 16
Bolivia (Plur State) 9 10 2 2 7 6 14 13 4 3 12 12
Brazil 8 12 6 7 4 4 17 13 13 13 9 9
Chile 9 14 6 5 3 3 15 14 9 8 11 12
Colombia 7 7 7 8 7 7 19 17 9 11 10 10
Costa Rica 5 5 8 10 6 5 21 19 12 12 13 14
137
TABLE 17 Changes in dietary composition (continued)Contribution in diets by commodity
meat and fish dairy and eggs fruit and vegetables sugar vegetable oils other
1990-92 2005-07 1990-92 2005-07 1990-92 2005-07 1990-92 2005-07 1990-92 2005-07 1990-92 2005-07
Cuba 6 5 6 3 4 6 21 15 9 6 11 11
Dominica 10 11 9 9 11 12 15 14 8 5 14 15
Dominican Republic 6 9 5 4 13 9 15 16 15 16 11 13
Ecuador 6 10 7 7 11 10 9 8 18 17 14 14
El Salvador 2 4 5 7 4 4 15 15 5 6 8 12
French Guiana
Grenada 10 15 10 9 8 7 17 16 9 11 13 14
Guatemala 2 4 3 3 2 3 17 15 6 9 6 11
Guyana 3 6 3 6 1 3 14 13 4 7 15 13
Haiti 3 4 8 6 10 12 5 7 11 11
Honduras 3 6 5 7 5 6 16 17 9 9 7 6
Jamaica 7 8 4 6 5 7 20 16 10 12 11 14
Mexico 6 9 5 5 3 4 16 15 8 8 11 11
Netherlands Antilles 15 13 8 6 10 18 7 6 20 18
Nicaragua 3 4 4 5 14 15 9 9 15 10
Panama 6 8 7 7 5 4 14 12 11 8 16 16
Paraguay 12 9 4 4 4 3 9 9 8 12 14 16
Peru 3 4 3 4 4 6 12 9 5 5 14 11
St Kitts amp Nevis 11 13 8 8 2 3 15 17 13 11 14 18
St Lucia 16 20 8 8 8 7 14 13 3 5 15 17
St Vincent amp Grenadines 11 12 5 5 4 6 18 17 9 8 14 12
Suriname 7 8 7 6 15 18 7 12 12 12
Trinidad amp Tobago 5 7 6 7 3 3 19 21 11 10 11 13
Uruguay 20 10 10 7 2 3 11 13 6 8 12 12
Venezuela (Boliv Rep of) 6 9 6 4 7 4 15 16 15 14 12 13
OCEANIA 11 10 6 7 4 4 7 8 8 8 22 21
Fiji 12 11 7 10 12 10 19 19
French Polynesia 18 19 6 6 2 2 11 7 9 11 24 20
New Caledonia 11 10 7 8 2 3 11 8 12 13 16 21
Papua New Guinea
Samoa 19 17 5 8 9 9 2 7 32 31
Solomon Islands 4 3 4 4 2 4 22 18
Tonga
Vanuatu 10 8 6 5 4 6 6 5 30 27
DEVELOPED REGIONS 11 11 9 9 4 4 13 13 12 14 19 18
NORTH AMERICA 12 12 11 10 3 3 17 17 16 18 16 15
Bermuda 19 17 6 6 11 6 11 14 10 12 24 21
Canada 11 10 8 6 7 6 14 14 14 16 21 19
United States of America 12 12 11 10 3 3 17 17 16 18 15 15
ASIA amp OCEANIA 12 12 8 7 3 4 12 10 11 14 18 17
Australia 15 15 12 10 3 4 15 13 13 16 17 17
Israel 8 12 7 6 9 9 12 7 14 19 13 12
Japan 12 12 7 7 3 3 11 10 10 13 18 17
New Zealand 13 15 9 4 7 8 16 17 7 7 22 21
EUROPE 11 10 9 9 5 5 11 12 10 12 20 19
Albania 4 8 12 18 5 10 6 7 8 6 7 9
Belarus 11 11 11 7 1 3 10 11 4 11 16 16
Bosnia amp Herzegovina 4 4 6 10 5 8 4 6 2 6 13 16
Croatia 6 7 10 11 4 4 17 13 8 13 18 17
European Union 12 11 9 9 5 5 11 11 12 14 22 19
Iceland 17 21 14 16 3 4 18 13 5 6 17 17
Macedonia FYR 9 7 5 6 8 7 12 12 5 14 14 17
Montenegro
Norway 14 14 11 9 3 4 13 12 10 11 17 18
Republic of Moldova 5 4 8 11 2 2 9 12 5 6 11 12
Russian Federation 10 8 8 8 12 13 5 9 17 19
Serbia
Switzerland 16 14 12 11 4 3 13 17 11 13 22 21
Ukraine 7 6 8 9 13 15 7 10 14 16
138
TABLE 18 Health effects of malnutritionShare of children under 5 share of
lowweightnewborns
Share of adults Dietaryironsupply
underweightstunted wasted total with
low BMIwomenwith lowBMI
overweight or obese per person
male female mg day
2009 2009 2009 2009 2009 2009 2009 2009 2005-07
WORLD 18 28 9 13 91 129 145
DEVELOPING REGIONS 20 30 10 14 64 107 144
AFRICA 22 39 10 111 65 135 152
North Africa 7 24 7 10 172 361 163
Algeria 4 16 4 6 107 243 136
Egypt 7 31 8 13 16 225 463 177
Libya 6 21 7 215 413 140
Morocco 10 23 11 53 73 111 231 163
Tunisia 3 9 3 5 139 334 157
Sub-Saharan Africa 25 42 11 126 44 92 150
Angola 28 51 8 38 102 98
Benin 20 45 8 15 92 35 95 154
Botswana 11 29 6 13 30 228 147
Burkina Faso 26 35 11 16 208 17 30 242
Burundi 39 63 8 11 28 37 135
Cameroon 17 36 7 11 67 70 151 158
Cape Verde 6 63 153 121
Central African Republic 22 45 11 13 153 20 53 123
Chad 37 45 16 22 203 24 38 180
Comoros 25 7 13 25 105 35 53 92
Congo 12 31 8 13 132 28 75 120
Cocircte drsquoIvoire 17 40 9 17 82 39 97 111
Congo Dem Rep 28 46 14 185 07 30 84
Djibouti 30 33 26 10 67 138 102
Equatorial Guinea 11 35 3 79 148
Eritrea 35 44 15 14 13 23 132
Ethiopia 35 51 12 20 09 16 154
Gabon 9 26 4 66 84 215 155
Gambia 16 28 7 20 23 144 113
Ghana 14 29 9 13 164 86 44 117 140
Guinea 23 39 11 132 43 51 107
Guinea-Bissau 17 48 9 26 81 91
Kenya 16 35 7 8 123 25 68 134
Lesotho 17 45 6 57 31 266 164
Liberia 20 39 8 14 100 31 77 117
Madagascar 37 53 15 16 192 18 15 113
Malawi 16 53 4 14 92 26 62 162
Mali 28 39 15 135 24 68 187
Mauritania 23 29 13 130 43 233 133
Mauritius 15 10 14 14 129 230 132
Mozambique 21 47 5 15 86 26 78 88
Namibia 18 30 8 16 159 43 168 140
Niger 40 55 12 192 15 37 235
Nigeria 27 41 14 12 122 51 90 196
Rwanda 18 52 5 6 98 49 40 174
Senegal 15 20 9 19 182 32 125 113
Seychelles 6 5 2 151 337 153
Sierra Leone 21 37 11 14 112 36 101 114
Somalia 33 42 13 34 71
Sudan 32 38 21 41 89 157
South Africa 86 232 428 143
Swaziland 6 30 3 9 32 61 371 138
Tanzania Utd Rep 17 44 4 104 40 68 147
Togo 22 28 16 109 30 61 131
Uganda 16 39 6 14 121 43 49 145
Zambia 15 46 6 11 96 12 70 113
Zimbabwe 14 36 7 99 92 28 138 143
139
TABLE 18 Health effects of malnutrition (continued)Share of children under 5 share of
lowweightnewborns
Share of adults Dietaryironsupply
underweightstunted wasted total with
low BMIwomenwith lowBMI
overweight or obese per person
male female mg day
2009 2009 2009 2009 2009 2009 2009 2009 2005-07
ASIA 22 30 11 15 45 75 143
Central Asia 7 21 5 6 68 150 206 113
Kazakhstan 7 18 4 6 74 202 274 133
Kyrgyzstan 3 18 3 5 37 69 117 216 120
Tajikistan 15 33 9 10 80 116 127
Turkmenistan 12 22 6 4 99 139 145 98
Uzbekistan 4 20 5 5 59 145 198 99
East Asia 9 19 5 4 43 67 174
Brunei Darussalam 85 72 174
Cambodia 29 40 9 9 161 16 28 104
China 5 14 3 3 80 46 65 200
Indonesia 20 40 15 25 69 102
Korea DPR 18 45 9 37 39 156
Korea Republic of 1 3 1 47 65 69 77 218
Lao PDR 32 48 7 11 135 145 17 41 121
Malaysia 17 21 15 11 96 104 179 158
Mongolia 5 28 3 5 49 39 119 207 111
Myanmar 30 41 11 20 61 124
Philippines 21 32 7 21 123 142 45 83 99
Singapore 3 4 4 8 92 146 66 62
Thailand 7 16 5 192 49 118 117
Viet Nam 20 1 10 5 265 12 20 130
South Asia 40 46 18 27 329 21 42 106
Afghanistan 33 59 9 15 33
Bangladesh 41 43 18 297 10 13 81
Bhutan 12 38 5 9 47 66
India 44 48 20 28 329 356 13 25 108
Iran (Islamic Rep) 10 20 6 7 57 54 136 295 135
Maldives 18 20 10 65 261 177
Nepal 39 49 13 21 244 14 16 152
Pakistan 31 42 14 32 312 316 35 84 89
Sri Lanka 22 19 12 17 162 26 73 118
West Asia 10 23 6 224 356 144
Armenia 4 18 5 7 52 144 302 118
Azerbaijan 8 27 7 10 48 158 321 120
Bahrain 8 14 7 289 382
Cyprus 43 69 248 219 188
Georgia 2 15 3 5 159 257 105
Iraq 7 28 6 15 223 362
Jordan 2 8 2 13 30 39 273 417 112
Kuwait 2 4 2 7 25 07 372 524 172
Lebanon 4 17 7 264 297 161
Occupied PalestinianTerritory
2 12 2 102
Saudi Arabia 5 9 12 70 49 295 435 159
Syrian Arab Republic 10 28 12 9 238 390 133
Turkey 4 16 1 11 35 16 228 356 158
United Arab Emirates 302 430 196
Yemen 43 58 15 252 105 227 103
LATIN AMERICA amp THECARIBBEAN
4 14 2 8 30 190 279 140
Argentina 2 8 1 7 34 274 310 122
Bahamas 11 267 426 174
Barbados 5 10 4 14 32 33 216 442 192
Belize 5 22 2 14 244 454 167
Bolivia (Plur State) 5 27 1 6 20 100 271 102
Brazil 2 7 2 8 40 35 165 221 137
Chile 1 2 0 08 11 245 336 138
Colombia 3 13 1 6 39 119 237 112
Costa Rica 1 6 1 7 209 283 140
140
TABLE 18 Health effects of malnutrition (continued)Share of children under 5 share of
lowweightnewborns
Share of adults Dietaryironsupply
underweightstunted wasted total with
low BMIwomenwith lowBMI
overweight or obese per person
male female mg day
2009 2009 2009 2009 2009 2009 2009 2009 2005-07
Cuba 5 73 62 133 275 186
Dominica 10 101 391 177
Dominican Republic 3 10 2 11 144 293 100
Ecuador 6 29 2 10 19 157 282 81
El Salvador 7 21 2 29 202 329 157
French Guiana
Grenada 9 149 321 137
Guatemala 13 48 1 20 138 267 131
Guyana 11 18 8 83 271 127
Haiti 19 30 10 155 84 84 99
Honduras 9 30 1 10 40 129 263 140
Jamaica 3 5 5 100 382 150
Mexico 4 15 2 8 14 267 384 178
Netherlands Antilles 128
Nicaragua 6 23 2 37 168 313 136
Panama 6 22 1 10 36 194 321 117
Paraguay 3 18 1 162 223 139
Peru 5 28 1 19 111 217 158
St Kitts amp Nevis 11 320 494 153
St Lucia 12 15 8 11 119 319 158
St Vincent amp Grenadines 8 164 335 130
Suriname 8 11 5 11 165 346 98
Trinidad amp Tobago 4 5 5 19 216 380 134
Uruguay 6 14 3 8 207 260 113
Venezuela (Boliv Rep of) 4 16 5 8 266 348 114
OCEANIA 17 42 4 11 158 265
Fiji 10 61 56 213 422 179
French Polynesia 195
New Caledonia 183
Papua New Guinea 18 44 4 11 118 201
Samoa 2 4 1 453 667 175
Solomon Islands 16 34 7 13 19 253 392 137
Tonga 3 491 703
Vanuatu 12 26 6 10 19 29 229 368 167
DEVELOPED REGIONS 216 230 149
NORTH AMERICA 1 4 1 296 323 142
Bermuda 148
Canada 26 246 239 165
United States of America 1 4 1 24 302 332 139
ASIA amp OCEANIA 3 8 1 94 96 82 191
Australia 7 10 28 252 249 149
Israel 8 232 276 197
Japan 3 8 1 115 108 55 35 199
New Zealand 6 13 16 262 277 152
EUROPE 205 219 144
Albania 6 23 9 217 205 128
Belarus 1 5 2 4 197 264 148
Bosnia amp Herzegovina 2 12 4 5 227 253 202
Croatia 0 1 2 5 02 228 194 116
European Union 215 196 148
Iceland 4 23 30 234 203 208
Macedonia FYR 2 12 3 6 216 189 130
Montenegro 2 8 4 228 207
Norway 5 50 70 216 179 158
Republic of Moldova 3 11 5 6 59 100 288 142
Russian Federation 6 184 298 134
Serbia 2 8 5 6 255 203
Switzerland 35 59 183 116 126
Ukraine 4 23 8 4 54 155 236 127
141
TABLE 19 Trade and food security - caloric self-sufficiencyCaloric self-sufficiency
pa
1970 1980 1990 2000 2009 growth1970-2009
WORLD 1002 1002 1002 1002 1006 00
DEVELOPING REGIONS 997 968 983 964 948 minus04
AFRICA 1021 883 866 821 822 minus06
North Africa 901 638 660 668 761 minus13
Algeria 860
Egypt 930 602 605 668 827 minus03
Libya
Morocco 939 721 813 643 minus10
Tunisia 703 669 612 608 minus04
Sub-Saharan Africa 1044 957 962 920 873 minus06
Angola 1137 697 652 731 779 minus10
Benin 1107 1022 898 992 909 minus05
Botswana
Burkina Faso 1004 967 941 911 922 minus02
Burundi 985 968 981 971 891 minus03
Cameroon 1037 997 977 926 888 minus04
Cape Verde
Central African Republic 964 981 937 951 924 minus01
Chad 968 984 952 970 930 minus01
Comoros 901 825 701 783 692 minus07
Congo 1272 799 880 607 908 minus09
Cocircte drsquoIvoire 1044 1074 1205 1203 1092 01
Congo Dem Rep 1025 962 961 953 879 minus04
Djibouti
Equatorial Guinea 1483 1049 879 835 694 minus19
Eritrea 678
Ethiopia 899 908
Gabon 851 802 763 630 588 minus09
Gambia 1462 1241 703 638 535 minus25
Ghana 1041 990 977 986 939 minus03
Guinea 977 914 863 879 879 minus03
Guinea-Bissau 1055 950 881 871 1048 minus00
Kenya 1004 901 899 742 610 minus13
Lesotho 712 535 536
Liberia 878 823 855 654 707 minus06
Madagascar 1047 975 981 900 918 minus03
Malawi 970 1077 944 994 989 00
Mali 971 970 969 939 940 minus01
Mauritania 682
Mauritius 1057 815
Mozambique 1148 928 811 866 824 minus08
Namibia 691 650 555 564 minus05
Niger 1199 991 941 882 945 minus06
Nigeria 1049 871 982 940 900 minus04
Rwanda 982 977 951 927 890 minus03
Senegal 1095 839 866 817 686 minus12
Seychelles 1055 547
Sierra Leone 946 888 840 751 898 minus01
Somalia 921 765 851 693 524 minus14
Sudan 998 1027 935 923 795 minus06
South Africa 1173 1325 1107 980 940 minus06
Swaziland 2814 1201 minus22
Tanzania Utd Rep 1027 947 1001 902 914 minus03
Togo 1066 966 910 940 840 minus06
Uganda 1010 979 999 965 933 minus02
Zambia 797 711 901 976 1005 06
Zimbabwe 1242 1039 1307 1094 538 minus21
142
TABLE 19 Trade and food security - caloric self-sufficiency (continued)Caloric self-sufficiency
pa
1970 1980 1990 2000 2009 growth1970-2009
ASIA 980 970 987 969 943 03
Central Asia 1138 1002
Kazakhstan 1628 1235
Kyrgyzstan 918 808
Tajikistan 625 574
Turkmenistan 939 895
Uzbekistan 833 841
East Asia 995 982 1017 997 970 minus01
Brunei Darussalam
Cambodia 1075 883 990 939 951 minus03
China 982 953 963 970 895 minus02
Indonesia 1002 964 1036 1039 1247 06
Korea DPR 920 943 906 635 903 minus00
Korea Republic of 755 533
Lao PDR 904 982 987 976 1027 03
Malaysia 925 1336 1540 1340 1455 12
Mongolia 791 845 929 586 627 minus06
Myanmar 1094 1054 1009 1019 1003 minus02
Philippines 1245 1204 1012 922 893 minus08
Singapore
Thailand 1296 1552 1784 1390 1421 02
Viet Nam 797 932 1094 1074 961 05
South Asia 969 955 957 934 906 minus02
Afghanistan 968 984 881 680 812 minus04
Bangladesh 901 894 906 848 800 minus03
Bhutan 834 936 776 707 952 03
India 979 983 1000 986 957 minus01
Iran (Islamic Rep) 958 714 690 606 650 minus10
Maldives
Nepal 1092 991 982 943 920 minus04
Pakistan 991 982 900 926 909 minus02
Sri Lanka 717 792 778 682 721 00
West Asia 868 890 824 876 832
Armenia 539
Azerbaijan 693 734
Bahrain
Cyprus 631
Georgia
Iraq 858
Jordan
Kuwait
Lebanon
Occupied PalestinianTerritory
Saudi Arabia 692
Syrian Arab Republic 724 841 657 679 560 minus07
Turkey 966 1018 921 955 933 minus01
United Arab Emirates
Yemen 709 543
LATIN AMERICA amp THECARIBBEAN
1078 1040 1049 1026 1125 minus06
Argentina 1708 1895 2095 2454 2736 12
Bahamas
Barbados 1754 597 514
Belize 2460 1539
Bolivia (Plur State) 827 870 1024 1201 1421 14
Brazil 1058 1071 1123 1124 1406 07
Chile 843 677 964 680 697 minus05
Colombia 982 925 965 839 783 minus06
Costa Rica 1170 1086 1007 949 910 minus06
143
TABLE 19 Trade and food security - caloric self-sufficiency (continued)Caloric self-sufficiency
pa
1970 1980 1990 2000 2009 growth1970-2009
Cuba 2382 2213 1486 594
Dominica 941 555 527 517 minus15
Dominican Republic 2375 1259 815 508 538 minus37
Ecuador 1080 982 989 1015 1008 minus02
El Salvador 974 880 804 664 701 minus08
French Guiana
Grenada 776 653 501
Guatemala 1000 1099 1054 1267 1199 05
Guyana 2957 2046 1337 2674 1695 minus14
Haiti 958 818 652 528 510 minus16
Honduras 1124 1096 1010 868 880 minus06
Jamaica 1124 559 565
Mexico 997 771 744 669 696 minus09
Netherlands Antilles
Nicaragua 1195 867 913 937 951 minus06
Panama 1103 1105 922 637 544 minus18
Paraguay 1035 1132 1580 1663
Peru 952 636 668 684 661 minus09
St Kitts amp Nevis 1537 1019 524
St Lucia 1012 892 919
St Vincent amp Grenadines 827 517 826
Suriname 834 1163 886 793 792 minus01
Trinidad amp Tobago 1058
Uruguay 1106 1210 1663 1350 2324 19
Venezuela (Boliv Rep of) 724 616 584 619 minus04
OCEANIA 1177 1169 1342 1388 1369 minus04
Fiji 2610 1943 1322
French Polynesia 915 860 600
New Caledonia
Papua New Guinea 1162 1127 1192 1354 1431 05
Samoa 1172 1340 931 836 729 minus12
Solomon Islands 1331 1745 1903 1340 1222 minus02
Tonga 1216 1160 810 793 759 minus12
Vanuatu 1555 1329 1392 1323 1078 minus09
DEVELOPED REGIONS 1064 1190 1181 1122 1140 18
NORTH AMERICA 1260 1612 1353 1321 1290 01
Bermuda
Canada 1585 1717 1538 1607 1832 04
United States of America 1226 1599 1328 1286 1238 00
ASIA amp OCEANIA 2321 1787 2667 2720 2040 minus02
Australia 2416 2907 2931 2075 minus04
Israel
Japan
New Zealand 1833 1787 1443 1646 1859 00
EUROPE 913 873 935 967 1012 03
Albania 875 973 792 601 615 minus09
Belarus 775 1036
Bosnia amp Herzegovina 548 625
Croatia 1016 1086
European Union 851 877 982 987 925 02
Iceland
Macedonia FYR 727 681
Montenegro
Norway 588 621 714 643 501 minus04
Republic of Moldova 1074 1333
Russian Federation 884 1131
Serbia 1262
Switzerland 551 716 662 627
Ukraine 1081 1933
144
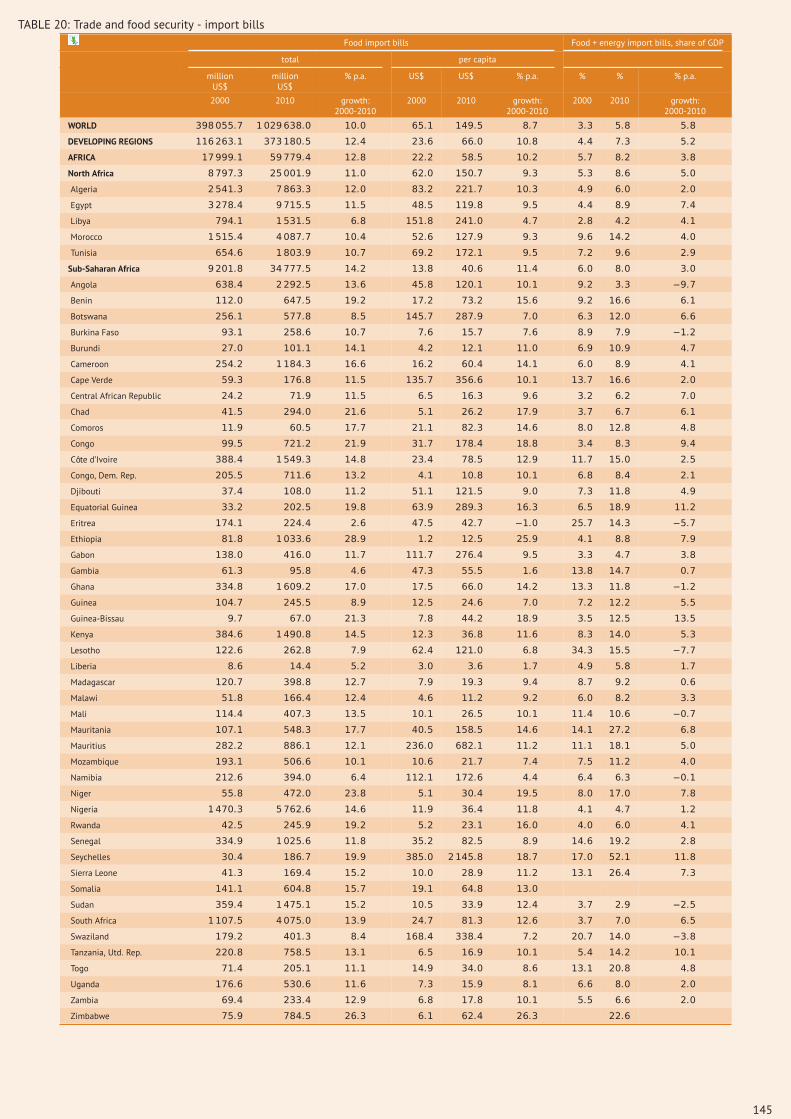
TABLE 20 Trade and food security - import billsFood import bills Food + energy import bills share of GDP
total per capita
millionUS$
millionUS$
pa US$ US$ pa pa
2000 2010 growth2000-2010
2000 2010 growth2000-2010
2000 2010 growth2000-2010
WORLD 3980557 10296380 100 651 1495 87 33 58 58
DEVELOPING REGIONS 1162631 3731805 124 236 660 108 44 73 52
AFRICA 179991 597794 128 222 585 102 57 82 38
North Africa 87973 250019 110 620 1507 93 53 86 50
Algeria 25413 78633 120 832 2217 103 49 60 20
Egypt 32784 97155 115 485 1198 95 44 89 74
Libya 7941 15315 68 1518 2410 47 28 42 41
Morocco 15154 40877 104 526 1279 93 96 142 40
Tunisia 6546 18039 107 692 1721 95 72 96 29
Sub-Saharan Africa 92018 347775 142 138 406 114 60 80 30
Angola 6384 22925 136 458 1201 101 92 33 minus97
Benin 1120 6475 192 172 732 156 92 166 61
Botswana 2561 5778 85 1457 2879 70 63 120 66
Burkina Faso 931 2586 107 76 157 76 89 79 minus12
Burundi 270 1011 141 42 121 110 69 109 47
Cameroon 2542 11843 166 162 604 141 60 89 41
Cape Verde 593 1768 115 1357 3566 101 137 166 20
Central African Republic 242 719 115 65 163 96 32 62 70
Chad 415 2940 216 51 262 179 37 67 61
Comoros 119 605 177 211 823 146 80 128 48
Congo 995 7212 219 317 1784 188 34 83 94
Cocircte drsquoIvoire 3884 15493 148 234 785 129 117 150 25
Congo Dem Rep 2055 7116 132 41 108 101 68 84 21
Djibouti 374 1080 112 511 1215 90 73 118 49
Equatorial Guinea 332 2025 198 639 2893 163 65 189 112
Eritrea 1741 2244 26 475 427 minus10 257 143 minus57
Ethiopia 818 10336 289 12 125 259 41 88 79
Gabon 1380 4160 117 1117 2764 95 33 47 38
Gambia 613 958 46 473 555 16 138 147 07
Ghana 3348 16092 170 175 660 142 133 118 minus12
Guinea 1047 2455 89 125 246 70 72 122 55
Guinea-Bissau 97 670 213 78 442 189 35 125 135
Kenya 3846 14908 145 123 368 116 83 140 53
Lesotho 1226 2628 79 624 1210 68 343 155 minus77
Liberia 86 144 52 30 36 17 49 58 17
Madagascar 1207 3988 127 79 193 94 87 92 06
Malawi 518 1664 124 46 112 92 60 82 33
Mali 1144 4073 135 101 265 101 114 106 minus07
Mauritania 1071 5483 177 405 1585 146 141 272 68
Mauritius 2822 8861 121 2360 6821 112 111 181 50
Mozambique 1931 5066 101 106 217 74 75 112 40
Namibia 2126 3940 64 1121 1726 44 64 63 minus01
Niger 558 4720 238 51 304 195 80 170 78
Nigeria 14703 57626 146 119 364 118 41 47 12
Rwanda 425 2459 192 52 231 160 40 60 41
Senegal 3349 10256 118 352 825 89 146 192 28
Seychelles 304 1867 199 3850 21458 187 170 521 118
Sierra Leone 413 1694 152 100 289 112 131 264 73
Somalia 1411 6048 157 191 648 130
Sudan 3594 14751 152 105 339 124 37 29 minus25
South Africa 11075 40750 139 247 813 126 37 70 65
Swaziland 1792 4013 84 1684 3384 72 207 140 minus38
Tanzania Utd Rep 2208 7585 131 65 169 101 54 142 101
Togo 714 2051 111 149 340 86 131 208 48
Uganda 1766 5306 116 73 159 81 66 80 20
Zambia 694 2334 129 68 178 101 55 66 20
Zimbabwe 759 7845 263 61 624 263 226
145
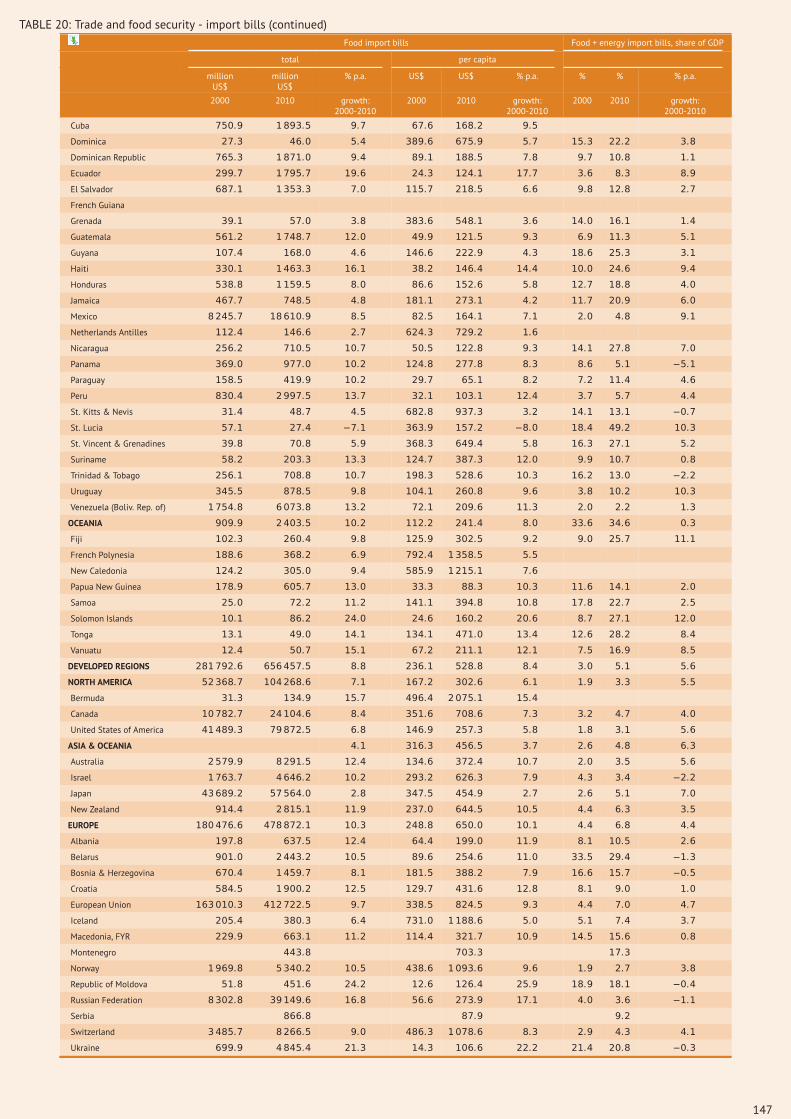
TABLE 20 Trade and food security - import bills (continued)Food import bills Food + energy import bills share of GDP
total per capita
millionUS$
millionUS$
pa US$ US$ pa pa
2000 2010 growth2000-2010
2000 2010 growth2000-2010
2000 2010 growth2000-2010
ASIA 714793 2459868 132 199 611 118 51 82 50
Central Asia 9547 39240 152 172 646 141 54 56 04
Kazakhstan 3726 17041 164 249 1063 156 50 38 minus27
Kyrgyzstan 635 4573 218 128 857 209 140 280 71
Tajikistan 652 4582 215 106 666 202 309 204 minus41
Turkmenistan 1803 4291 91 400 851 78 40
Uzbekistan 2732 8754 124 110 319 112 37 51 32
East Asia 409084 1480333 137 216 725 129 57 88 44
Brunei Darussalam 1727 4502 101 5282 11283 79 29 46 47
Cambodia 938 5678 197 75 402 182 117 167 37
China 207426 837460 150 160 610 143 35 61 57
Indonesia 53 73 33
Korea DPR 2315 2171 minus06 101 89 minus12
Korea Republic of 71923 215999 116 1564 4483 111 85 156 63
Lao PDR 481 1632 130 91 263 113 67 92 32
Malaysia 33406 120525 137 1427 4244 115 78 147 66
Mongolia 778 3684 168 323 1337 153 179 207 15
Myanmar 2184 4950 85 49 103 78 65 40 minus48
Philippines 24056 58852 94 311 631 73 86 90 05
Singapore 32231 80440 96 8224 15816 68 206 448 81
Thailand 24502 82275 129 388 1190 119 81 151 64
Viet Nam 7115 60078 238 90 684 224 91 159 58
South Asia 95776 322413 129 66 189 112 34 83 94
Afghanistan 4174 6659 48 183 212 15 96
Bangladesh 11087 53509 170 86 360 154 37 76 74
Bhutan 220 1100 175 385 1515 147 85 159 65
India 31571 124317 147 30 102 130 26 93 136
Iran (Islamic Rep) 22803 62356 106 349 843 92 28 35 23
Maldives 774 1624 77 2834 5138 61 155 208 30
Nepal 1752 5754 126 72 192 103 72 107 41
Pakistan 15200 48709 124 105 281 103 69 100 38
Sri Lanka 8195 18386 84 437 881 73 83 93 11
West Asia 200387 617881 119 1130 2765 94 44 60 33
Armenia 1753 5934 130 570 1919 129 161 132 minus20
Azerbaijan 1996 9581 170 246 1043 155 49 24 minus68
Bahrain 7491 12547 53 11742 9942 minus16 104 73 minus35
Cyprus 3369 9773 112 3572 8852 95 89 115 26
Georgia 1434 8223 191 302 1889 201 92 157 55
Iraq 33338 83450 96 1397 2635 65 153
Jordan 8045 23347 112 1667 3774 85 118 227 68
Kuwait 9231 34226 140 4756 12505 102 26 32 24
Lebanon 9576 27103 110 2559 6410 96 115 159 33
Occupied PalestinianTerritory
4541 6448 36 1420 1596 12
Saudi Arabia 49863 148133 115 2488 5397 81 27 40 41
Syrian Arab Republic 6831 24656 137 427 1208 110 43 110 99
Turkey 17633 69629 147 277 957 132 35 55 46
United Arab Emirates 31295 98922 122 10318 13168 25 36 50 32
Yemen 7901 29831 142 446 1240 108 110 191 57
LATIN AMERICA amp THECARIBBEAN
258747 650107 97 496 1102 83 27 43 47
Argentina 11905 20384 55 322 504 46 07 14 66
Bahamas 2826 4630 51 9483 13498 36 89 147 51
Barbados 1080 3170 114 4028 11610 112 75 129 55
Belize 591 850 37 2353 2724 15 182 155 minus16
Bolivia (Plur State) 2394 3798 47 288 383 29 39 59 42
Brazil 35101 78639 84 201 403 72 18 24 25
Chile 11818 44242 141 766 2585 129 56 113 73
Colombia 13256 38065 111 333 822 94 16 25 49
Costa Rica 4059 11415 109 1036 2450 90 59 96 51
146
TABLE 20 Trade and food security - import bills (continued)Food import bills Food + energy import bills share of GDP
total per capita
millionUS$
millionUS$
pa US$ US$ pa pa
2000 2010 growth2000-2010
2000 2010 growth2000-2010
2000 2010 growth2000-2010
Cuba 7509 18935 97 676 1682 95
Dominica 273 460 54 3896 6759 57 153 222 38
Dominican Republic 7653 18710 94 891 1885 78 97 108 11
Ecuador 2997 17957 196 243 1241 177 36 83 89
El Salvador 6871 13533 70 1157 2185 66 98 128 27
French Guiana
Grenada 391 570 38 3836 5481 36 140 161 14
Guatemala 5612 17487 120 499 1215 93 69 113 51
Guyana 1074 1680 46 1466 2229 43 186 253 31
Haiti 3301 14633 161 382 1464 144 100 246 94
Honduras 5388 11595 80 866 1526 58 127 188 40
Jamaica 4677 7485 48 1811 2731 42 117 209 60
Mexico 82457 186109 85 825 1641 71 20 48 91
Netherlands Antilles 1124 1466 27 6243 7292 16
Nicaragua 2562 7105 107 505 1228 93 141 278 70
Panama 3690 9770 102 1248 2778 83 86 51 minus51
Paraguay 1585 4199 102 297 651 82 72 114 46
Peru 8304 29975 137 321 1031 124 37 57 44
St Kitts amp Nevis 314 487 45 6828 9373 32 141 131 minus07
St Lucia 571 274 minus71 3639 1572 minus80 184 492 103
St Vincent amp Grenadines 398 708 59 3683 6494 58 163 271 52
Suriname 582 2033 133 1247 3873 120 99 107 08
Trinidad amp Tobago 2561 7088 107 1983 5286 103 162 130 minus22
Uruguay 3455 8785 98 1041 2608 96 38 102 103
Venezuela (Boliv Rep of) 17548 60738 132 721 2096 113 20 22 13
OCEANIA 9099 24035 102 1122 2414 80 336 346 03
Fiji 1023 2604 98 1259 3025 92 90 257 111
French Polynesia 1886 3682 69 7924 13585 55
New Caledonia 1242 3050 94 5859 12151 76
Papua New Guinea 1789 6057 130 333 883 103 116 141 20
Samoa 250 722 112 1411 3948 108 178 227 25
Solomon Islands 101 862 240 246 1602 206 87 271 120
Tonga 131 490 141 1341 4710 134 126 282 84
Vanuatu 124 507 151 672 2111 121 75 169 85
DEVELOPED REGIONS 2817926 6564575 88 2361 5288 84 30 51 56
NORTH AMERICA 523687 1042686 71 1672 3026 61 19 33 55
Bermuda 313 1349 157 4964 20751 154
Canada 107827 241046 84 3516 7086 73 32 47 40
United States of America 414893 798725 68 1469 2573 58 18 31 56
ASIA amp OCEANIA 41 3163 4565 37 26 48 63
Australia 25799 82915 124 1346 3724 107 20 35 56
Israel 17637 46462 102 2932 6263 79 43 34 minus22
Japan 436892 575640 28 3475 4549 27 26 51 70
New Zealand 9144 28151 119 2370 6445 105 44 63 35
EUROPE 1804766 4788721 103 2488 6500 101 44 68 44
Albania 1978 6375 124 644 1990 119 81 105 26
Belarus 9010 24432 105 896 2546 110 335 294 minus13
Bosnia amp Herzegovina 6704 14597 81 1815 3882 79 166 157 minus05
Croatia 5845 19002 125 1297 4316 128 81 90 10
European Union 1630103 4127225 97 3385 8245 93 44 70 47
Iceland 2054 3803 64 7310 11886 50 51 74 37
Macedonia FYR 2299 6631 112 1144 3217 109 145 156 08
Montenegro 4438 7033 173
Norway 19698 53402 105 4386 10936 96 19 27 38
Republic of Moldova 518 4516 242 126 1264 259 189 181 minus04
Russian Federation 83028 391496 168 566 2739 171 40 36 minus11
Serbia 8668 879 92
Switzerland 34857 82665 90 4863 10786 83 29 43 41
Ukraine 6999 48454 213 143 1066 222 214 208 minus03
147
TABLE 21 Dimensions of povertyPoverty gap at Poverty headcount ratio Multi-
dimensional
$125 aday (ppp)
$2 a day(ppp)
nationalpovertyline
ruralpovertyline
$125 aday (ppp)
$2 a day(ppp)
nationalpovertyline
ruralpovertyline
poverty(MPI)
0 to 1
2009 2009 2009 2009 2009 2009 2009 2009 2009
WORLD
DEVELOPING REGIONS
AFRICA
North Africa
Algeria 14 65 32 45 68 236 226 303
Egypt 04 35 36 20 185 220 300 00
Libya
Morocco 05 31 25 140 90 145 00
Tunisia 05 30 25 128 38 00
Sub-Saharan Africa
Angola 299 424 543 702 05
Benin 157 335 120 140 473 753 390 460 04
Botswana 110 223 117 184 312 494 306 448
Burkina Faso 203 393 153 176 565 812 464 524 05
Burundi 364 561 234 242 813 935 669 689 05
Cameroon 12 82 123 175 96 304 399 550 03
Cape Verde 60 152 81 143 210 409 266 443
Central African Republic 313 468 331 350 628 801 620 694 05
Chad 256 439 216 233 619 833 550 586 03
Comoros 208 342 163 178 461 650 448 487 04
Congo 228 388 189 206 541 744 501 577 02
Cocircte drsquoIvoire 75 178 153 203 238 463 427 542 04
Congo Dem Rep 253 424 322 349 592 796 713 757 04
Djibouti 53 146 188 412 01
Equatorial Guinea
Eritrea 690
Ethiopia 96 289 83 85 390 776 389 393 06
Gabon 09 50 100 160 48 196 327 446 02
Gambia 121 249 251 305 343 567 580 678 03
Ghana 105 223 96 135 300 536 285 392 01
Guinea 150 310 176 220 433 696 530 630 05
Guinea-Bissau 165 348 250 278 488 779 647 691
Kenya 61 151 163 175 197 399 459 491 02
Lesotho 208 331 379 265 434 623 566 605 02
Liberia 408 595 244 263 837 948 638 677 05
Madagascar 265 469 268 289 678 896 687 735 04
Malawi 323 518 80 86 739 905 524 559 04
Mali 188 365 167 514 771 474 576 06
Mauritania 57 159 170 241 212 441 463 612 04
Mauritius
Mozambique 252 429 212 222 600 816 547 569 05
Namibia 246 365 130 160 491 622 380 490 02
Niger 119 306 196 212 431 759 595 639 06
Nigeria 296 469 228 266 644 839 547 638 03
Rwanda 409 572 240 260 768 896 585 642 04
Senegal 108 247 164 215 335 604 508 619 04
Seychelles 01 03 02 18
Sierra Leone 203 375 275 346 534 761 664 785 04
Somalia 05
Sudan
South Africa 33 123 70 174 357 230 01
Swaziland 294 458 329 370 629 810 692 750 02
Tanzania Utd Rep 281 475 99 110 679 879 334 374 04
Togo 114 279 229 293 387 693 617 743 03
Uganda 83 213 68 76 287 553 245 272 04
Zambia 328 483 285 388 643 815 593 768 03
Zimbabwe 160 720 440 02
148
TABLE 21 Dimensions of poverty (continued)Poverty gap at Poverty headcount ratio Multi-
dimensional
$125 aday (ppp)
$2 a day(ppp)
nationalpovertyline
ruralpovertyline
$125 aday (ppp)
$2 a day(ppp)
nationalpovertyline
ruralpovertyline
poverty(MPI)
0 to 1
2009 2009 2009 2009 2009 2009 2009 2009 2009
ASIA
Central Asia
Kazakhstan 01 03 31 45 02 15 154 217 00
Kyrgyzstan 01 55 100 120 19 294 431 508 00
Tajikistan 51 168 124 124 215 509 472 492 01
Turkmenistan 70 184 248 497
Uzbekistan 150 332 463 767 00
East Asia
Brunei Darussalam
Cambodia 61 202 72 83 283 565 301 345 03
China 40 122 159 363 28 25
Indonesia 36 155 25 31 187 506 142 174 01
Korea DPR
Korea Republic of
Lao PDR 89 248 339 660 276 317 03
Malaysia 00 02 08 18 00 23 38 82
Mongolia 62 172 101 134 224 491 352 466 01
Myanmar 02
Philippines 55 164 27 152 226 450 265 507 01
Singapore
Thailand 19 83 30 108 265 81 104 00
Viet Nam 23 109 35 46 131 385 145 187 01
South Asia
Afghanistan 79 83 360 375
Bangladesh 131 338 90 98 496 813 400 438 03
Bhutan 70 188 61 81 262 495 232 309 01
India 105 295 416 756 275 283 03
Iran (Islamic Rep) 03 18 14 80
Maldives 01 25 15 122 00
Nepal 197 378 75 85 551 776 309 346 03
Pakistan 43 187 226 603 223 270 03
Sri Lanka 10 74 31 32 70 291 152 157 00
West Asia
Armenia 02 23 49 121 13 124 265 255 00
Azerbaijan 02 15 20 10 78 158 185 00
Bahrain
Cyprus
Georgia 46 118 72 92 147 326 236 297 00
Iraq 06 55 45 90 40 253 229 393 01
Jordan 01 06 26 04 35 133 190 00
Kuwait
Lebanon
Occupied PalestinianTerritory
Saudi Arabia
Syrian Arab Republic 02 33 17 169 00
Turkey 09 26 27 91 181 387 00
United Arab Emirates 00
Yemen 42 148 89 106 175 466 348 401 03
LATIN AMERICA amp THECARIBBEAN
Argentina 04 08 09 24 00
Bahamas
Barbados
Belize 47 97 121 240 335 442 00
Bolivia (Plur State) 58 109 140 247 601 773 01
Brazil 11 32 38 99 214 00
Chile 04 08 08 24 151 129
Colombia 57 119 160 279 455 643 00
Costa Rica 01 11 07 54 217 230
149
TABLE 21 Dimensions of poverty (continued)Poverty gap at Poverty headcount ratio Multi-
dimensional
$125 aday (ppp)
$2 a day(ppp)
nationalpovertyline
ruralpovertyline
$125 aday (ppp)
$2 a day(ppp)
nationalpovertyline
ruralpovertyline
poverty(MPI)
0 to 1
2009 2009 2009 2009 2009 2009 2009 2009 2009
Cuba
Dominica
Dominican Republic 09 39 43 136 505 571 00
Ecuador 16 44 51 134 360 575 00
El Salvador 11 45 51 152 378 465
French Guiana
Grenada
Guatemala 65 129 169 298 510 705 01
Guyana 39 69 77 168 01
Haiti 282 418 549 722 770 880 03
Honduras 119 182 233 354 588 644 02
Jamaica 00 09 02 58 99 251
Mexico 17 32 34 81 474 608 00
Netherlands Antilles
Nicaragua 52 123 158 319 462 679 01
Panama 31 71 95 179 327 598
Paraguay 15 43 51 132 351 498 01
Peru 14 47 59 147 348 603 01
St Kitts amp Nevis
St Lucia 72 155 209 406
St Vincent amp Grenadines
Suriname 59 117 155 272 00
Trinidad amp Tobago 11 39 42 135 00
Uruguay 00 00 00 02 205 222 00
Venezuela (Boliv Rep of) 11 32 35 101 290
OCEANIA
Fiji 101 148 310 433
French Polynesia
New Caledonia
Papua New Guinea 123 255 124 138 358 574 375 413
Samoa
Solomon Islands
Tonga
Vanuatu 01
DEVELOPED REGIONS
NORTH AMERICA
Bermuda
Canada
United States of America
ASIA amp OCEANIA
Australia
Israel
Japan
New Zealand
EUROPE
Albania 02 08 23 26 06 42 124 146 00
Belarus 00 00 00 00 54
Bosnia amp Herzegovina 00 01 46 49 00 02 140 178 00
Croatia 00 00 26 00 00 111 00
European Union
Iceland
Macedonia FYR 00 07 72 77 03 43 190 213 00
Montenegro 00 00 09 14 00 00 49 89 00
Norway
Republic of Moldova 03 26 19 125 290 00
Russian Federation 00 00 27 55 00 01 111 212 00
Serbia 01 02 13 20 01 07 66 98 00
Switzerland
Ukraine 00 01 15 23 01 05 79 113 00
150
TABLE 22 Dimensions of inequalityHuman Development Index Gender
inequalityIndex
Gini-index Income share held by
inequalityadjusted
incomedistribution
highest20
lowest20
index index index index
2010 2010 2008 2009 2009 2009
WORLD
DEVELOPING REGIONS
AFRICA
North Africa
Algeria 07 06 353
Egypt 06 04 07 321 415 90
Libya 07 05
Morocco 06 04 07 409 479 65
Tunisia 07 05 05 408 473 60
Sub-Saharan Africa
Angola 04 02 586 619 20
Benin 04 03 07 386 461 70
Botswana 06 06 610
Burkina Faso 03 02 396 471 70
Burundi 03 02 06 333 428 90
Cameroon 05 03 07 446 462 67
Cape Verde 05 504 559 45
Central African Republic 03 02 08 436 606 34
Chad 03 02 398 466 63
Comoros 04 02 643 680 25
Congo 05 03 07 473 531 50
Cocircte drsquoIvoire 04 03 07 415 476 56
Congo Dem Rep 02 02 08
Djibouti 04 03 399 465 60
Equatorial Guinea 05
Eritrea
Ethiopia 03 02 298 394 93
Gabon 06 05 06 415 482 62
Gambia 04 02 07 473 528 48
Ghana 05 03 07 428 485 52
Guinea 03 02 394 462 63
Guinea-Bissau 03 02 355 432 73
Kenya 05 03 07 477 532 48
Lesotho 04 03 07 525 564 30
Liberia 03 02 08 382 450 64
Madagascar 04 03 472 535 62
Malawi 04 03 07 390 465 70
Mali 03 02 08 390 460 65
Mauritania 04 03 07 390 457 62
Mauritius 07
Mozambique 03 02 07 456 515 52
Namibia 06 03 06 743
Niger 03 02 08 340 428 83
Nigeria 04 02 429 486 51
Rwanda 04 02 06 531 582 42
Senegal 04 03 07 392 459 62
Seychelles 658 696 37
Sierra Leone 03 02 08 425 493 61
Somalia
Sudan 04 07
South Africa 06 04 06 578 722 25
Swaziland 05 03 07 507 559 45
Tanzania Utd Rep 04 03 376 448 68
Togo 04 03 07 344 424 76
Uganda 04 03 07 443 493 61
Zambia 04 03 07 507 552 36
Zimbabwe 01 01 07 501
151
TABLE 22 Dimensions of inequality (continued)Human Development Index Gender
inequalityIndex
Gini-index Income share held by
inequalityadjusted
incomedistribution
highest20
lowest20
index index index index
2010 2010 2008 2009 2009 2009
ASIA
Central Asia
Kazakhstan 07 06 05 309 399 87
Kyrgyzstan 06 05 05 334 428 88
Tajikistan 06 05 05 336 417 78
Turkmenistan 07 05 408
Uzbekistan 06 05 367 442 71
East Asia
Brunei Darussalam 08
Cambodia 05 04 06 444 517 66
China 05 04 415 478 57
Indonesia 06 05 07 368 455 74
Korea DPR
Korea Republic of 09 07 03 316
Lao PDR 05 04 06 367 448 76
Malaysia 07 04 462 448 65
Mongolia 06 05 05 365 405 72
Myanmar 04
Philippines 06 05 06 440 504 56
Singapore 08 02 425
Thailand 06 05 05 536 493 62
Viet Nam 06 05 05 376 454 73
South Asia
Afghanistan 03 08 294 387 90
Bangladesh 05 03 07 310 408 94
Bhutan 467 530 54
India 05 04 07 368 453 81
Iran (Islamic Rep) 07 06 383 452 64
Maldives 06 05 05 374 442 65
Nepal 04 03 07 473 540 59
Pakistan 05 03 07 327 421 90
Sri Lanka 07 05 06 403 478 69
West Asia
Armenia 07 06 05 309 398 88
Azerbaijan 07 06 05 337 421 80
Bahrain 08 05
Cyprus 08 07 03
Georgia 07 06 06 413 471 53
Iraq 07 399 87
Jordan 07 06 06 377 455 73
Kuwait 08 05
Lebanon
Occupied PalestinianTerritory
Saudi Arabia 07 08
Syrian Arab Republic 06 05 06 358 439 77
Turkey 07 05 06 397 489 52
United Arab Emirates 08 04
Yemen 04 03 08 377
LATIN AMERICA amp THECARIBBEAN
Argentina 08 06 05 458 531 36
Bahamas 08 07
Barbados 08 05
Belize 07 05 06 544
Bolivia (Plur State) 06 04 06 573 610 28
Brazil 07 05 06 539 585 32
Chile 08 06 05 521 572 43
Colombia 07 05 06 585 621 25
Costa Rica 07 06 05 503 523 44
152
TABLE 22 Dimensions of inequality (continued)Human Development Index Gender
inequalityIndex
Gini-index Income share held by
inequalityadjusted
incomedistribution
highest20
lowest20
index index index index
2010 2010 2008 2009 2009 2009
Cuba 05
Dominica
Dominican Republic 07 05 06 484 536 44
Ecuador 07 06 06 490 589 36
El Salvador 07 05 06 469 519 47
French Guiana
Grenada
Guatemala 06 04 07 537 580 35
Guyana 06 05 06 432
Haiti 04 02 07 595 630 25
Honduras 06 04 06 577 607 20
Jamaica 07 06 06 455 516 53
Mexico 07 06 06 517 562 38
Netherlands Antilles
Nicaragua 06 04 06 523 569 38
Panama 08 05 06 523 586 27
Paraguay 06 05 06 520 565 38
Peru 07 05 06 480 543 40
St Kitts amp Nevis
St Lucia 426
St Vincent amp Grenadines
Suriname 06 05 528
Trinidad amp Tobago 07 06 05 403
Uruguay 08 06 05 424 515 46
Venezuela (Boliv Rep of) 07 05 06 435 490 49
OCEANIA
Fiji 07
French Polynesia
New Caledonia
Papua New Guinea 04 08 509
Samoa
Solomon Islands 05
Tonga 07
Vanuatu
DEVELOPED REGIONS
NORTH AMERICA
Bermuda
Canada 09 08 03 326 399 72
United States of America 09 08 05 408 458 54
ASIA amp OCEANIA
Australia 09 09 03 352
Israel 09 08 03 392 449 57
Japan 09 03 249
New Zealand 09 03 362
EUROPE
Albania 07 06 05 345 430 81
Belarus 07 07 272 364 92
Bosnia amp Herzegovina 07 06 362 432 67
Croatia 08 07 04 336 420 81
European Union
Iceland 09 08 03
Macedonia FYR 07 06 442 503 54
Montenegro 07 300 388 85
Norway 09 09 02 258 372 96
Republic of Moldova 06 05 05 380 453 68
Russian Federation 07 06 05 423 489 60
Serbia 07 282
Switzerland 09 08 02 337 413 75
Ukraine 07 07 05 275 371 94
153
TABLE 23 GovernanceVoice ampaccount-ability
Politicalstabilityabsence ofviolence ampterrorism
Govern-ment
effectiveness
Regulatoryquality
Rule oflaw
Control ofcorruption
Averagegovernance
-25 to 25(lowest tohighest)
-25 to 25(lowest tohighest)
-25 to 25(lowest tohighest)
-25 to 25(lowest tohighest)
-25 to 25(lowest tohighest)
-25 to 25(lowest tohighest)
-25 to 25(lowest tohighest)
2010 2010 2010 2010 2010 2010 2010
WORLD
DEVELOPING REGIONS
AFRICA
North Africa
Algeria minus10 minus13 minus06 minus11 minus08 minus05 minus09
Egypt minus12 minus09 minus04 minus02 minus01 minus06 minus06
Libya minus19 minus01 minus12 minus12 minus10 minus13 minus11
Morocco minus08 minus05 minus02 minus01 minus02 minus02 minus03
Tunisia minus13 01 02 minus00 01 minus01 minus02
Sub-Saharan Africa
Angola minus11 minus02 minus11 minus10 minus12 minus13 minus10
Benin 03 03 minus05 minus03 minus07 minus08 minus03
Botswana 04 09 05 05 07 10 07
Burkina Faso minus02 minus01 minus06 minus01 minus02 minus04 minus03
Burundi minus09 minus15 minus11 minus11 minus12 minus11 minus12
Cameroon minus11 minus06 minus09 minus07 minus10 minus10 minus09
Cape Verde 09 08 minus01 minus01 04 08 05
Central African Republic minus11 minus21 minus14 minus11 minus13 minus08 minus13
Chad minus14 minus15 minus15 minus11 minus15 minus13 minus14
Comoros minus04 minus04 minus17 minus15 minus11 minus07 minus10
Congo minus10 minus02 minus12 minus13 minus11 minus11 minus10
Cocircte drsquoIvoire minus11 minus16 minus13 minus09 minus12 minus11 minus12
Congo Dem Rep minus14 minus22 minus17 minus16 minus16 minus14 minus17
Djibouti minus11 03 minus10 minus07 minus07 minus03 minus06
Equatorial Guinea minus19 02 minus17 minus14 minus13 minus15 minus12
Eritrea minus22 minus09 minus14 minus22 minus13 minus05 minus14
Ethiopia minus13 minus17 minus03 minus09 minus08 minus07 minus10
Gabon minus09 02 minus09 minus06 minus05 minus08 minus06
Gambia minus11 01 minus07 minus04 minus05 minus06 minus05
Ghana 05 00 minus00 01 minus01 01 01
Guinea minus09 minus18 minus11 minus11 minus15 minus12 minus13
Guinea-Bissau minus09 minus08 minus10 minus11 minus14 minus11 minus10
Kenya minus02 minus12 minus05 minus01 minus10 minus09 minus07
Lesotho minus02 05 minus04 minus06 minus03 02 minus01
Liberia minus02 minus05 minus12 minus11 minus10 minus05 minus07
Madagascar minus08 minus11 minus08 minus06 minus08 minus03 minus07
Malawi minus02 01 minus04 minus06 minus01 minus04 minus03
Mali 02 minus03 minus09 minus05 minus05 minus07 minus04
Mauritania minus09 minus13 minus09 minus08 minus09 minus07 minus09
Mauritius 07 05 08 08 08 07 07
Mozambique minus01 03 minus05 minus04 minus05 minus04 minus03
Namibia 03 08 01 01 02 03 03
Niger minus06 minus11 minus07 minus05 minus06 minus07 minus07
Nigeria minus08 minus20 minus12 minus08 minus12 minus10 minus12
Rwanda minus13 minus01 minus01 minus02 minus03 05 minus02
Senegal minus03 minus04 minus05 minus03 minus04 minus07 minus04
Seychelles 01 08 02 minus06 00 03 01
Sierra Leone minus02 minus02 minus12 minus07 minus09 minus08 minus07
Somalia minus20 minus31 minus22 minus24 minus24 minus17 minus23
Sudan minus17 minus27 minus14 minus14 minus13 minus13 minus16
South Africa 05 minus00 03 04 01 01 02
Swaziland minus13 minus01 minus05 minus06 minus05 minus02 minus05
Tanzania Utd Rep minus01 minus00 minus05 minus04 minus05 minus05 minus03
Togo minus10 minus02 minus14 minus09 minus09 minus10 minus09
Uganda minus05 minus11 minus06 minus01 minus04 minus09 minus06
Zambia minus03 05 minus08 minus05 minus05 minus06 minus04
Zimbabwe minus15 minus12 minus16 minus20 minus18 minus14 minus16
154
TABLE 23 Governance (continued)Voice ampaccount-ability
Politicalstabilityabsence ofviolence ampterrorism
Govern-ment
effectiveness
Regulatoryquality
Rule oflaw
Control ofcorruption
Averagegovernance
-25 to 25(lowest tohighest)
-25 to 25(lowest tohighest)
-25 to 25(lowest tohighest)
-25 to 25(lowest tohighest)
-25 to 25(lowest tohighest)
-25 to 25(lowest tohighest)
-25 to 25(lowest tohighest)
2010 2010 2010 2010 2010 2010 2010
ASIA
Central Asia
Kazakhstan minus11 05 minus03 minus03 minus06 minus10 minus05
Kyrgyzstan minus10 minus10 minus06 minus02 minus13 minus11 minus09
Tajikistan minus14 minus09 minus09 minus11 minus12 minus12 minus11
Turkmenistan minus20 02 minus16 minus21 minus15 minus14 minus14
Uzbekistan minus20 minus08 minus08 minus16 minus14 minus13 minus13
East Asia
Brunei Darussalam minus07 12 09 11 08 09 07
Cambodia minus09 minus06 minus08 minus05 minus11 minus12 minus08
China minus16 minus08 01 minus02 minus03 minus06 minus06
Indonesia minus01 minus09 minus02 minus04 minus06 minus07 minus05
Korea DPR minus22 minus05 minus19 minus24 minus13 minus13 minus16
Korea Republic of 07 01 12 09 10 04 07
Lao PDR minus16 minus02 minus09 minus10 minus09 minus11 minus10
Malaysia minus05 01 11 06 05 01 03
Mongolia 00 05 minus06 minus03 minus04 minus07 minus03
Myanmar minus21 minus13 minus17 minus22 minus15 minus17 minus17
Philippines minus01 minus16 minus01 minus03 minus05 minus08 minus06
Singapore minus03 11 22 18 17 22 15
Thailand minus06 minus12 01 02 minus02 minus03 minus03
Viet Nam minus14 01 minus03 minus06 minus05 minus06 minus05
South Asia
Afghanistan minus15 minus26 minus15 minus16 minus19 minus16 minus18
Bangladesh minus03 minus14 minus08 minus09 minus08 minus10 minus09
Bhutan minus05 07 06 minus11 01 08 01
India 04 minus13 minus00 minus04 minus01 minus05 minus03
Iran (Islamic Rep) minus16 minus16 minus05 minus16 minus09 minus09 minus12
Maldives minus01 minus00 minus02 minus04 minus03 minus06 minus03
Nepal minus05 minus17 minus08 minus07 minus10 minus07 minus09
Pakistan minus08 minus27 minus08 minus06 minus08 minus11 minus11
Sri Lanka minus05 minus08 minus02 minus02 minus01 minus04 minus04
West Asia
Armenia minus09 00 minus02 03 minus05 minus07 minus03
Azerbaijan minus13 minus03 minus08 minus04 minus09 minus12 minus08
Bahrain minus09 minus03 06 08 04 02 01
Cyprus 11 04 15 14 12 11 11
Georgia minus02 minus07 03 06 minus02 minus02 minus01
Iraq minus11 minus23 minus12 minus11 minus16 minus13 minus14
Jordan minus08 minus03 01 02 02 00 minus01
Kuwait minus05 04 01 02 05 03 02
Lebanon minus03 minus15 minus03 00 minus07 minus08 minus06
Occupied PalestinianTerritory
Saudi Arabia minus18 minus02 minus01 01 02 01 minus03
Syrian Arab Republic minus17 minus08 minus06 minus09 minus05 minus11 minus09
Turkey minus02 minus10 04 04 01 00 minus01
United Arab Emirates minus09 08 08 04 04 10 04
Yemen minus13 minus22 minus10 minus06 minus11 minus11 minus12
LATIN AMERICA amp THECARIBBEAN
Argentina 03 minus00 minus02 minus07 minus06 minus04 minus03
Bahamas 10 10 10 05 07 14 09
Barbados 12 11 14 05 10 14 11
Belize 07 minus00 minus04 minus05 minus04 minus01 minus01
Bolivia (Plur State) minus01 minus04 minus05 minus08 minus11 minus05 minus06
Brazil 05 00 01 02 00 01 01
Chile 10 06 12 14 13 15 12
Colombia minus02 minus15 01 03 minus03 minus04 minus03
Costa Rica 10 06 03 05 05 07 06
155
TABLE 23 Governance (continued)Voice ampaccount-ability
Politicalstabilityabsence ofviolence ampterrorism
Govern-ment
effectiveness
Regulatoryquality
Rule oflaw
Control ofcorruption
Averagegovernance
-25 to 25(lowest tohighest)
-25 to 25(lowest tohighest)
-25 to 25(lowest tohighest)
-25 to 25(lowest tohighest)
-25 to 25(lowest tohighest)
-25 to 25(lowest tohighest)
-25 to 25(lowest tohighest)
2010 2010 2010 2010 2010 2010 2010
Cuba minus16 03 minus02 minus16 minus06 05 minus05
Dominica 10 10 07 04 07 07 08
Dominican Republic 01 00 minus06 minus02 minus08 minus08 minus04
Ecuador minus03 minus06 minus07 minus11 minus12 minus09 minus08
El Salvador 00 01 00 04 minus09 minus02 minus01
French Guiana 11 02 12 12 12 11 10
Grenada 08 06 02 04 01 04 04
Guatemala minus04 minus08 minus07 minus02 minus10 minus05 minus06
Guyana 00 minus05 minus01 minus05 minus05 minus06 minus04
Haiti minus07 minus09 minus16 minus11 minus14 minus13 minus12
Honduras minus05 minus05 minus07 minus02 minus09 minus09 minus06
Jamaica 04 minus04 02 03 minus05 minus04 minus01
Mexico 01 minus08 02 03 minus06 minus04 minus02
Netherlands Antilles 04 11 07 09 09 09 08
Nicaragua minus05 minus06 minus10 minus04 minus08 minus08 minus07
Panama 05 00 01 04 minus01 minus04 01
Paraguay minus01 minus09 minus09 minus04 minus09 minus08 minus07
Peru 00 minus09 minus02 05 minus06 minus02 minus02
St Kitts amp Nevis 11 11 07 04 07 10 09
St Lucia 12 08 08 04 08 12 09
St Vincent amp Grenadines 12 09 07 04 09 10 09
Suriname 04 01 minus01 minus07 minus01 minus04 minus01
Trinidad amp Tobago 05 minus00 03 05 minus02 minus04 01
Uruguay 11 09 07 04 07 13 08
Venezuela (Boliv Rep of) minus09 minus14 minus10 minus16 minus16 minus12 minus13
OCEANIA
Fiji minus10 minus01 minus07 minus07 minus09 minus09 minus07
French Polynesia
New Caledonia minus02
Papua New Guinea 01 minus08 minus08 minus05 minus09 minus11 minus07
Samoa
Solomon Islands 01 04 minus09 minus12 minus07 minus05 minus05
Tonga 03 08 minus03 minus05 01 minus03 minus00
Vanuatu 05 14 minus03 minus08 03 04 02
DEVELOPED REGIONS
NORTH AMERICA
Bermuda 10 09 10 14 12 13 11
Canada 14 09 19 17 18 21 16
United States of America 12 03 14 14 16 12 12
ASIA amp OCEANIA
Australia 14 08 18 17 18 21 16
Israel 06 minus15 12 12 09 06 05
Japan 10 09 14 10 13 15 12
New Zealand 15 12 19 18 19 24 18
EUROPE
Albania 01 minus02 minus03 02 minus04 minus04 minus02
Belarus minus16 minus01 minus11 minus12 minus10 minus08 minus10
Bosnia amp Herzegovina minus01 minus07 minus07 minus01 minus04 minus03 minus04
Croatia 04 06 06 06 02 00 04
European Union
Iceland 14 10 16 09 17 19 14
Macedonia FYR 01 minus05 minus02 03 minus03 minus01 minus01
Montenegro 02 05 01 minus01 minus00 minus03 01
Norway 16 13 18 15 19 21 17
Republic of Moldova minus01 minus04 minus06 minus01 minus04 minus07 minus04
Russian Federation minus09 minus09 minus04 minus04 minus08 minus11 minus07
Serbia 03 minus04 minus01 minus00 minus04 minus02 minus01
Switzerland 16 12 19 17 18 21 17
Ukraine minus01 minus01 minus08 minus06 minus08 minus10 minus06
156
TABLE 24 Education health and sanitationLiteracyratefemale
Ratio of girls-to-boys Expendi-ture perstudent
Public expon
education
Health expenditure Prevalenceof HIV
Access to improved
out ofprimaryschool
in primand seceducation
share ofGDP percapita
share ofGDP
currentper capita
share ofGDP
ages15-49
sanitationfacilities
water source
ratio US$ rur urb
2009 2009 2009 2009 2009 2009 2009 2009 2008 2008 2008
WORLD 792 963 44 8600 101 08 61 78 96
DEVELOPING REGIONS
AFRICA
North Africa
Algeria 639 07 993 285 43 2680 58 01 95 79 85
Egypt 578 05 951 38 1130 50 01 94 98 100
Libya 820 00 1050 239 27 4170 39 97
Morocco 439 08 881 872 56 1560 55 01 69 60 98
Tunisia 710 09 1030 507 71 2400 62 01 85 84 99
Sub-Saharan Africa
Angola 576 08 820 1269 26 2040 46 20 57 38 60
Benin 291 01 735 134 35 319 42 12 12 69 84
Botswana 844 12 1000 3014 89 6120 103 248 60 90 99
Burkina Faso 216 08 856 3663 46 381 64 12 11 72 95
Burundi 609 90 927 6009 83 198 131 33 46 71 83
Cameroon 630 02 856 728 37 611 56 53 47 51 92
Cape Verde 802 09 1030 828 59 1460 39 54 82 85
Central African Republic 421 05 687 1448 13 193 43 47 34 51 92
Chad 231 06 636 2488 32 418 70 34 9 44 67
Comoros 687 06 842 272 76 278 34 01 36 97 91
Congo 09 919 29 18 701 30 34 30 34 95
Cocircte drsquoIvoire 453 08 686 1191 46 553 51 34 23 68 93
Congo Dem Rep 549 768 156 95 23 80
Djibouti 09 820 573 84 845 70 25 56 52 98
Equatorial Guinea 898 10 825 40 06 7090 39 50
Eritrea 560 09 773 11356 20 101 21 08 14 57 74
Ethiopia 180 07 879 6642 55 147 43 12 26 98
Gabon 841 10 959 38 2660 35 52 33 41 95
Gambia 358 11 1020 322 20 256 60 20 67 86 96
Ghana 604 11 954 288 54 451 69 18 13 74 90
Guinea 281 07 772 1164 24 188 57 13 19 61 89
Guinea-Bissau 380 07 655 52 184 61 25 21 51 83
Kenya 835 11 954 436 70 332 43 63 31 52 83
Lesotho 953 12 1070 778 124 700 82 236 29 81 97
Liberia 545 04 719 141 28 294 132 15 17 51 79
Madagascar 616 53 969 1581 30 180 41 02 11 29 71
Malawi 670 18 1000 321 42 191 62 110 56 77 95
Mali 182 05 784 1633 44 384 56 10 36 44 81
Mauritania 503 13 1030 736 29 219 25 07 26 47 52
Mauritius 853 13 1010 245 32 3830 57 10 91 99 100
Mozambique 415 05 883 998 50 247 57 115 17 29 77
Namibia 881 16 1040 315 64 2580 60 131 33 88 99
Niger 151 08 753 5143 45 209 61 08 9 39 96
Nigeria 498 09 851 08 693 58 36 32 42 75
Rwanda 668 18 1000 2521 41 482 90 29 54 62 77
Senegal 387 11 955 2169 58 589 57 09 51 52 92
Seychelles 923 15 1030 340 50 3660 40 100
Sierra Leone 301 06 840 251 43 439 131 16 13 26 86
Somalia 09 535 04 07 23 9 67
Sudan 608 09 894 121 946 73 11 34 52 64
South Africa 870 12 994 328 54 4850 85 178 77 78 99
Swaziland 862 11 921 491 78 1560 63 259 55 61 92
Tanzania Utd Rep 669 15 961 409 68 253 51 56 24 45 80
Togo 444 04 753 130 46 289 59 32 12 41 87
Uganda 589 15 987 1339 32 425 82 65 48 64 91
Zambia 613 14 958 10 13 471 48 135 49 46 87
Zimbabwe 894 971 2143 52 143 44 72 99
157
TABLE 24 Education health and sanitation (continued)Literacyratefemale
Ratio of girls-to-boys Expendi-ture perstudent
Public expon
education
Health expenditure Prevalenceof HIV
Access to improved
out ofprimaryschool
in primand seceducation
share ofGDP percapita
share ofGDP
currentper capita
share ofGDP
ages15-49
sanitationfacilities
water source
ratio US$ rur urb
2009 2009 2009 2009 2009 2009 2009 2009 2008 2008 2008
ASIA
Central Asia
Kazakhstan 996 26 986 79 28 3300 45 01 97 90 99
Kyrgyzstan 990 11 1010 173 59 571 68 03 93 85 99
Tajikistan 996 01 906 218 35 380 53 02 94 61 94
Turkmenistan 994 43 771 23 98 97
Uzbekistan 991 08 987 74 622 52 01 100 81 98
East Asia
Brunei Darussalam 937 18 1010 37 7910 30
Cambodia 709 08 897 54 21 421 59 05 29 56 81
China 909 12 1050 1015 19 1770 46 01 55 82 98
Indonesia 891 04 977 397 28 554 24 02 52 71 89
Korea DPR 1000 100 100
Korea Republic of 00 972 528 42 11100 65 01 100 88 100
Lao PDR 632 09 872 100 23 358 41 02 53 51 72
Malaysia 903 10 1030 604 41 3360 48 05 96 99 100
Mongolia 979 15 1030 162 56 742 47 01 50 49 97
Myanmar 895 08 997 54 13 125 20 06 81 69 75
Philippines 958 14 1020 276 28 669 38 01 76 87 93
Singapore 920 116 30 15000 39 01 100 100
Thailand 915 09 1030 554 41 1680 43 13 96 98 99
Viet Nam 905 04 932 982 53 797 72 04 75 92 99
South Asia
Afghanistan 50 07 623 19 509 74 37 39 78
Bangladesh 510 21 1080 256 24 184 34 01 53 78 85
Bhutan 387 13 1000 387 48 980 55 02 65 88 99
India 508 05 922 777 31 448 42 03 31 84 96
Iran (Islamic Rep) 807 07 965 583 47 2690 55 02 98
Maldives 984 06 982 00 112 3310 80 01 98 86 99
Nepal 469 06 825 731 47 253 58 04 31 87 93
Pakistan 401 07 819 27 226 26 01 45 87 95
Sri Lanka 891 12 1040 30 836 40 01 91 88 98
West Asia
Armenia 994 17 1030 533 30 1290 47 01 90 93 98
Azerbaijan 992 10 1020 156 28 2850 58 01 45 71 88
Bahrain 902 03 1010 326 29 11100 45 100
Cyprus 969 05 1000 1352 41 60 100 100 100
Georgia 997 06 965 410 32 2560 101 01 95 96 100
Iraq 699 04 813 51 985 39 73 55 91
Jordan 889 14 1020 277 49 3360 93 98 91 98
Kuwait 918 08 1010 257 38 14200 33 100 99 99
Lebanon 860 09 1040 102 18 6630 81 01 100 100
Occupied PalestinianTerritory
Saudi Arabia 811 08 913 367 56 7140 50 97
Syrian Arab Republic 780 01 973 338 48 720 29 96 84 94
Turkey 853 07 929 547 31 5710 67 01 90 96 100
United Arab Emirates 915 06 998 270 12 15200 28 97 100 100
Yemen 447 06 657 52 640 56 52 57 72
LATIN AMERICA amp THECARIBBEAN
Argentina 977 22 1050 565 49 7300 95 05 90 80 98
Bahamas 14 1010 33 15600 72 31 100 98
Barbados 603 minus67 10400 68 14 100 100 100
Belize 703 44 1010 395 58 2170 49 23 90 100 99
Bolivia (Plur State) 868 12 988 282 63 848 48 02 25 67 96
Brazil 902 07 1030 650 51 7340 91 80 84 99
Chile 987 09 985 428 40 7870 82 04 96 75 99
Colombia 934 10 1050 580 48 3230 64 05 74 73 99
Costa Rica 963 12 1020 290 63 6680 105 03 95 91 100
158
TABLE 24 Education health and sanitation (continued)Literacyratefemale
Ratio of girls-to-boys Expendi-ture perstudent
Public expon
education
Health expenditure Prevalenceof HIV
Access to improved
out ofprimaryschool
in primand seceducation
share ofGDP percapita
share ofGDP
currentper capita
share ofGDP
ages15-49
sanitationfacilities
water source
ratio US$ rur urb
2009 2009 2009 2009 2009 2009 2009 2009 2008 2008 2008
Cuba 998 08 988 1553 136 7070 118 01 91 89 96
Dominica 15 1020 407 47 3610 64
Dominican Republic 883 11 965 147 23 2710 59 09 83 84 87
Ecuador 815 28 1030 92 10 2550 61 04 92 88 97
El Salvador 818 16 983 176 36 2290 63 08 87 76 94
French Guiana
Grenada 960 22 970 227 48 4470 74 97 97
Guatemala 695 04 938 166 32 1860 71 08 81 90 98
Guyana 06 997 447 61 1330 81 12 81 93 98
Haiti 446 10 946 15 396 61 19 17 55 71
Honduras 835 23 1070 36 1170 60 08 71 77 95
Jamaica 911 09 1000 850 58 2310 51 17 83 89 98
Mexico 921 17 1020 637 48 5150 65 03 85 87 96
Netherlands Antilles 964 1020
Nicaragua 779 12 1020 144 31 1050 96 02 52 68 98
Panama 930 08 1010 390 38 5910 83 09 69 83 97
Paraguay 935 10 995 530 40 1590 71 03 70 66 99
Peru 846 12 994 180 27 2010 46 04 68 61 90
St Kitts amp Nevis 15 1040 79 97 6340 60 96 99 99
St Lucia 10 994 368 45 4430 81 98 98
St Vincent amp Grenadines 01 977 455 66 3010 57
Suriname 938 09 1070 90 4290 76 10 84 81 97
Trinidad amp Tobago 983 05 1010 189 42 10700 57 15 92 93 98
Uruguay 986 08 1040 374 29 6980 75 05 100 100 100
Venezuela (Boliv Rep of) 949 11 1020 173 37 6860 60
OCEANIA
Fiji 10 1030 967 62 1300 34 01
French Polynesia 15 1090 98 100 100
New Caledonia 960
Papua New Guinea 565 08 835 65 367 31 09 45 33 87
Samoa 985 17 1050 120 58 2050 70 100
Solomon Islands 690 10 940 22 719 54
Tonga 991 06 999 1449 39 1610 62 96 100 100
Vanuatu 803 05 995 353 48 1060 40 52 79 96
DEVELOPED REGIONS
NORTH AMERICA
Bermuda 979 157 26
Canada 23 987 440 49 43800 109 02 100 99 100
United States of America 14 1000 682 55 74100 162 06 100 94 100
ASIA amp OCEANIA
Australia 14 973 509 45 38700 85 01 100 100 100
Israel 887 15 1010 611 59 19700 76 02 100 100 100
Japan 11 1000 647 35 33200 83 01 100 100 100
New Zealand 31 1030 675 61 26300 97 01 100 100
EUROPE
Albania 947 09 995 444 29 2650 69 98 98 96
Belarus 997 17 1010 150 45 2950 58 03 93 99 100
Bosnia amp Herzegovina 964 13 1020 4950 109 95 98 100
Croatia 981 12 1020 732 46 11200 78 01 99 97 100
European Union 1010 764 49 33700 103 02 98 100 100
Iceland 13 1020 771 74 31300 82 03 100 100 100
Macedonia FYR 956 13 983 238 35 3140 69 89 99 100
Montenegro 6170 93 92 96 100
Norway 13 990 895 68 76600 97 01 100 100 100
Republic of Moldova 980 10 1010 1286 96 1810 119 04 79 85 96
Russian Federation 994 12 980 142 39 4750 54 10 87 89 98
Serbia 09 1010 1105 48 4190 99 01 92 98 99
Switzerland 57 973 956 52 71400 113 04 100 100 100
Ukraine 996 11 988 251 53 1800 70 11 95 97 98
159
TABLE 25 Food aid receivedFood aid received
thousandtonnes
thousandtonnes
thousandtonnes
thousandtonnes
thousandtonnes
1990 1995 2000 2005 2010
WORLD 13172 10201 11345 8288 5682
DEVELOPING REGIONS 10922 9143 9462 8245 5682
AFRICA 5255 3562 4320 4656 3491
North Africa 2268 263 318 56 27
Algeria 10 27 33 42 24
Egypt 1606 207 41 14 3
Libya 0 0 0 0 0
Morocco 271 2 241 0 0
Tunisia 383 27 4 0 0
Sub-Saharan Africa 2986 3299 4002 4601 3464
Angola 124 220 296 57 4
Benin 15 21 12 15 19
Botswana 15 10 0 0 0
Burkina Faso 34 41 33 39 45
Burundi 3 103 11 73 34
Cameroon 3 7 4 14 14
Cape Verde 59 73 53 29 16
Central African Republic 3 1 3 5 10
Chad 26 21 23 74 111
Comoros 4 6 0 0 0
Congo 8 13 18 9 7
Cocircte drsquoIvoire 66 24 17 34 21
Congo Dem Rep 98 109 74 103 193
Djibouti 9 20 12 21 10
Equatorial Guinea 5 4 2 0 0
Eritrea 0 104 257 232 0
Ethiopia 864 636 1527 1122 1415
Gabon 0 0 1 0 0
Gambia 4 4 8 11 23
Ghana 66 97 101 66 7
Guinea 11 8 5 41 4
Guinea-Bissau 5 3 27 11 7
Kenya 90 80 291 155 258
Lesotho 42 34 6 44 7
Liberia 35 161 116 102 30
Madagascar 54 38 44 47 26
Malawi 219 236 36 153 38
Mali 39 20 12 41 25
Mauritania 45 45 17 92 39
Mauritius 11 1 0 0 0
Mozambique 423 386 185 117 80
Namibia 12 3 2 2 1
Niger 40 25 20 139 159
Nigeria 0 0 1 20 0
Rwanda 9 274 232 42 7
Senegal 63 21 54 30 41
Seychelles 1 0 0 0 0
Sierra Leone 11 34 28 39 24
Somalia 98 53 61 40 72
Sudan 230 82 182 931 476
South Africa 7 0 3 0 0
Swaziland 10 7 0 12 17
Tanzania Utd Rep 35 145 63 116 38
Togo 12 6 4 1 2
Uganda 47 77 87 293 80
Zambia 11 26 49 146 7
Zimbabwe 14 13 16 80 92
160
TABLE 25 Food aid received (continued)Food aid received
thousandtonnes
thousandtonnes
thousandtonnes
thousandtonnes
thousandtonnes
1990 1995 2000 2005 2010
ASIA 3357 4641 4314 2958 1775
Central Asia 0 432 195 239 75
Kazakhstan 0 1 0 0 0
Kyrgyzstan 0 150 60 166 50
Tajikistan 0 226 60 73 25
Turkmenistan 0 53 7 0 0
Uzbekistan 0 1 68 0 0
East Asia 530 952 2239 1663 232
Brunei Darussalam 0 0 0 0 0
Cambodia 25 91 62 24 17
China 78 128 90 49 0
Indonesia 56 19 429 197 0
Korea DPR 0 544 1264 1180 80
Korea Republic of 0 0 0 0 0
Lao PDR 0 27 5 19 20
Malaysia 0 0 0 0 0
Mongolia 0 12 46 55 0
Myanmar 0 4 10 16 31
Philippines 160 55 218 121 82
Singapore 0 0 0 0 0
Thailand 148 2 1 1 0
Viet Nam 62 70 82 0 0
South Asia 2288 1445 937 838 1247
Afghanistan 43 133 210 208 140
Bangladesh 1050 586 269 293 194
Bhutan 5 6 4 2 3
India 382 398 321 102 16
Iran (Islamic Rep) 26 13 3 2 5
Maldives 2 3 3 11 12
Nepal 8 38 53 54 53
Pakistan 462 119 20 30 763
Sri Lanka 310 148 55 136 60
West Asia 539 1812 943 218 222
Armenia 0 476 96 22 7
Azerbaijan 0 391 28 12 0
Bahrain 0 0 0 0 0
Cyprus 0 0 0 0 0
Georgia 0 598 71 20 1
Iraq 0 102 18 36 7
Jordan 261 122 401 3 0
Kuwait 0 0 0 0 0
Lebanon 43 11 42 12 0
Occupied PalestinianTerritory
26 48 57 83 90
Saudi Arabia 0 0 0 0 0
Syrian Arab Republic 38 45 35 10 35
Turkey 14 1 0 0 0
United Arab Emirates 0 0 0 0 0
Yemen 157 18 195 21 83
LATIN AMERICA amp THECARIBBEAN
2306 939 828 632 416
Argentina 0 0 0 0 0
Bahamas 0 0 0 0 0
Barbados 0 0 0 0 0
Belize 0 0 0 0 0
Bolivia (Plur State) 262 86 80 65 8
Brazil 29 1 0 0 0
Chile 8 0 0 0 0
Colombia 5 15 12 14 12
Costa Rica 7 3 0 0 0
161
TABLE 25 Food aid received (continued)Food aid received
thousandtonnes
thousandtonnes
thousandtonnes
thousandtonnes
thousandtonnes
1990 1995 2000 2005 2010
Cuba 3 6 24 7 0
Dominica 0 7 0 0 0
Dominican Republic 40 6 2 0 50
Ecuador 77 19 42 43 3
El Salvador 203 25 3 67 3
French Guiana 0 0 0 0 0
Grenada 0 0 0 0 0
Guatemala 185 70 137 69 70
Guyana 46 33 26 0 0
Haiti 108 168 164 137 266
Honduras 146 53 68 98 3
Jamaica 293 56 46 11 0
Mexico 280 46 2 0 0
Netherlands Antilles 0 0 0 0 0
Nicaragua 232 63 62 43 2
Panama 1 2 0 0 0
Paraguay 4 1 0 0 0
Peru 359 254 149 78 0
St Kitts amp Nevis 0 0 0 0 0
St Lucia 0 3 0 0 0
St Vincent amp Grenadines 0 0 0 0 0
Suriname 0 20 0 0 0
Trinidad amp Tobago 0 0 0 0 0
Uruguay 20 0 0 0 0
Venezuela (Boliv Rep of) 0 0 11 0 0
OCEANIA 3 0 0 0 0
Fiji 0 0 0 0 0
French Polynesia 0 0 0 0 0
New Caledonia 0 0 0 0 0
Papua New Guinea 0 0 0 0 0
Samoa 0 0 0 0 0
Solomon Islands 0 0 0 0 0
Tonga 0 0 0 0 0
Vanuatu 0 0 0 0 0
DEVELOPED REGIONS 2250 1058 1883 43 0
NORTH AMERICA 0 0 0 0 0
Bermuda 0 0 0 0 0
Canada 0 0 0 0 0
United States of America 0 0 0 0 0
ASIA amp OCEANIA 1 0 0 0 0
Australia 0 0 0 0 0
Israel 1 0 0 0 0
Japan 0 0 0 0 0
New Zealand 0 0 0 0 0
EUROPE 2249 1058 1883 43 0
Albania 0 10 18 6 0
Belarus 0 98 0 0 0
Bosnia amp Herzegovina 0 23 84 0 0
Croatia 0 14 0 0 0
European Union 2249 40 1 0 0
Iceland 0 0 0 0 0
Macedonia FYR 0 0 63 0 0
Montenegro 0 0 0 0 0
Norway 0 0 0 0 0
Republic of Moldova 0 244 14 10 0
Russian Federation 0 125 1403 26 0
Serbia 0 0 0 0 0
Switzerland 0 0 0 0 0
Ukraine 0 120 0 0 0
162
DEFINITIONS AND SOURCES
Definitions and sources
Countries in protracted crisesP2HUNFAOESARHSNPC
Page table 31 (p 86)
Protracted crises are those environments in which a sig-nificant proportion of the population is acutely vulnera-ble to death disease and disruption of livelihoods overa prolonged period of time The governance of these en-vironments is usually very weak with the state having alimited capacity to respond to and mitigate the threatsto the population or provide adequate levels of protec-tion
Source Trade and Markets Division
Owner FAO
Contribution in diets by typeP2HUNFAOESSDIETCPF
Page table 16 (p 135)
Dietary contribution refers to the amount of carbohy-dratesproteinsfats expressed in kilocalories (kcal) perday available for each individual in the total populationduring the reference period Caloric content is derived byapplying the appropriate food composition factors to thequantities of the commodities Per person supplies arederived from the total amount of food available for hu-man consumption by dividing total calories by total pop-ulation actually partaking of the food supplies during thereference period However per person figures representonly the average supply available for the population asa whole and do not necessarily indicate what is actuallyconsumed by individuals The actual food consumptionmay be lower than the quantity shown as food availabil-ity depending on the magnitude of wastage and lossesof food in the household eg during storage in prepa-ration and cooking as plate-waste or quantities fed todomestic animals and pets thrown or given away
Source Statistics Division
Owner FAO
Dietary Energy Supply per personP2HUNFAOESSDIETDES
Page table 16 (p 135) chart 37 (p 93) map 20 (p 92)
Dietary energy supply per person refers to the amountof food expressed in kilocalories (kcal) per day avail-able for each individual in the total population duringthe reference period Caloric content is derived by ap-plying the appropriate food composition factors to thequantities of the commodities Per person supplies arederived from the total amount of food available for hu-man consumption by dividing total calories by total pop-ulation actually partaking of the food supplies during thereference period However per person figures representonly the average supply available for the population asa whole and do not necessarily indicate what is actuallyconsumed by individuals The actual food consumptionmay be lower than the quantity shown as food availabil-ity depending on the magnitude of wastage and losses
of food in the household eg during storage in prepa-ration and cooking as plate-waste or quantities fed todomestic animals and pets thrown or given awaySource Statistics DivisionOwner FAO
Caloric contribution in diets by commodityP2HUNFAOESSDIETFDS
Page table 40 41 (p 95 95)Contribution of a food Group to total dietary energy sup-plySource Statistics DivisionOwner FAO
Percentage contribution in diets by commodityP2HUNFAOESSDIETFDSx
Page table 16 17 (p 135 138)Percentage contribution of a food group to total dietaryenergy supplySource Statistics DivisionOwner FAO
Depth of hungerP2HUNFAOESSUNMNTDEP
Page table 15 (p 132) chart 36 (p 91)The depth of food deprivation indicates how much food-deprived people fall short of minimum food needs interms of dietary energy It is measured as the differencebetween the minimum dietary energy and the averagedietary energy intake of the undernourished population(food-deprived) The depth of food deprivation is lowwhen it is less than 200 kilocalories per person per dayand high when it is higher than 300 kilocalories per per-son per day The greater the deficit the greater the sus-ceptibility for health risks related to undernutritionSource Statistics DivisionOwner FAO
Incidence of undernourishmentP2HUNFAOESSUNMNTNUM
Page table 15 (p 132) map 19 (p 91)Undernourishment refers to the condition of peoplewhose dietary energy consumption is continuously be-low a minimum dietary energy requirement for main-taining a healthy life and carrying out a light physicalactivity The incidence of undernourishment is the num-ber of people referring to those in this conditionSource Statistics DivisionOwner FAO
Global number of undernourishedP2HUNFAOESSUNMNTPNW
Page chart 33 35 (p 89 90)Undernourishment refers to the condition of peoplewhose dietary energy consumption is continuously be-low a minimum dietary energy requirement for main-taining a healthy life and carrying out a light physical
163
PART 2
activity The global incidence of undernourishment is thetotal number of people in the world referring to those inthis condition
Source Statistics Division
Owner FAO
Percentage of population undernourishedP2HUNFAOESSUNMNTPREV
Page table 15 (p 132) map 18 (p 88)
Undernourishment refers to the condition of peoplewhose dietary energy consumption is continuously be-low a minimum dietary energy requirement for main-taining a healthy life and carrying out a light physicalactivity The percentage of population undernourishedis the total number of people in each country referringto those in this condition divided by the population ofthat country
Source Statistics Division
Owner FAO
Regional percentage of undernourishedP2HUNFAOESSUNMNTPREVR
Page chart 34 (p 90)
Undernourishment refers to the condition of peoplewhose dietary energy consumption is continuously be-low a minimum dietary energy requirement for main-taining a healthy life and carrying out a light physicalactivity The regional percentage of population under-nourished is the total number of people in each regionreferring to those in this condition divided by the popu-lation of that region
Source Statistics Division
Owner FAO
Global affordability of foodP2HUNFAOFPVAFD
Page chart 54 (p 106)
FAO Food Price Index relative to GDP showing howmuchfood prices have risen relative to income from the baseperiod 2002-04 Higer (lower) index scores show greater(less) affordability
Source Statistics Division
Owner FAO
Food price inflationP2HUNFAOFPVFCPI
Page map 25 (p 104)
Annual change in the ILO food price indices The pricedata for the different items included in the computationof the index are normally weighted in order to take intoaccount the relative importance of each item with re-spect to total consumption expenditure In most coun-tries the indices are computed in a derived form suchas weighted arithmetic averages of price relatives fora selected number of representative items between theperiod under consideration and the base period using
one or other forms of Laspeyresrsquo formula The num-ber of items and the weights used to compute the in-dex are given according to expenditure group The termitem is used here to mean the smallest grouping ofgoods and services for which a specific weight is givenThe source(s) and the reference period of the weightsused for the index eg a household expenditure surveynational accounts etc If the reference period for theweights differs from the base period of the index theadjustments made to the weights to take account of theprice changes between the two periods are describedSee httplaborstailoorg for more informationSource LABORSTAOwner ILO
International food prices by food groupP2HUNFAOFPVFPI
Page chart 53 (p 106)The FAO Food Price Index is a measure of themonthly change in international prices of a bas-ket of food commodities It consists of the av-erage of five commodity group price indices (rep-resenting 55 quotations) weighted with the aver-age export shares of each of the groups for 2002-2004 See httpwwwfaoorgworldfoodsituationwfs-homefoodpricesindexen for more information on sub-index constructionSource Statistics DivisionOwner FAO
International food price volatility by food groupP2HUNFAOFPVFPV
Page chart 55 56 (p 107 107)Annualized historical volatility of the FAO Food Price In-dexSource Statistics DivisionOwner FAO
Food price volatility (annualized historical volatility)P2HUNFAOFPVFPVn
Page map 26 (p 108)Annualized historical volatility of the ILO food price in-dicesSource Statistics DivisionOwner FAO
FAO Global Consumption price volatilityP2HUNFAOFPVGCI
Page chart 52 57 (p 105 109)The FAO Global Food Consumption Price Index trackschanges in the cost of the global food basket as por-trayed by the latest FAO world food balance sheet Rep-resentative international prices for each of the commodi-ties or commodity groups appearing in the balance sheetare weighted by their contribution to total calorific in-takeSource Statistics DivisionOwner FAO
164
DEFINITIONS AND SOURCES
Dietary diversity in selected LIFDCs
P2HUNFAOFVDIETDIV
Page chart 39 (p 94)
The Herfindahl index H is calculated as H =sumN=1 S
2
where S is the consumption share of the starchy staple in diets and N is the number of staples consumed For asingle staple consumed the index would equate to oneand declines as the staple base becomes more diversi-fied
Source Statistics Division
Owner FAO
Starchy root consumption and DES
P2HUNFAOFVDIETRTDES
Page chart 38 (p 94)
Caloric equivalent of starchy roots available for con-sumption as a ratio of total dietary energy supply
Source Statistics Division
Owner FAO
Availability of dietary iron
P2HUNFAOMCNIRON
Page table 18 (p 141) chart 44 (p 98)
The dietary availability of iron is calculated by convert-ing the amount of food available for human consumptionas estimated by the FAO Food Balance Sheets in equiv-alent of iron derived from animal and vegetal productsHowever the actual food consumptionmay be lower thanthe quantity shown as food availability depending on themagnitude of wastage and losses of food in the house-hold eg during storage in preparation and cooking asplate-waste or quantities fed to domestic animals andpets thrown or given away
Source Statistics Division
Owner FAO
Food + energy import bills ( GDP)
P2HUNFAOTFSFDFL
Page table 20 (p 147)
The annual value of food imported under SITC sections0 + 22+ 4 plus fuels under SITC section 3 expressed asa ratio of GDP
Source Statistics Division (FAOSTAT) and UNCTADSTAT
Owner FAO UNCTAD
Food import bills
P2HUNFAOTFSFIB
Page table 20 (p 147) chart 49 50 51 (p 103 103103)
The annual value of food imported under SITC sections0 + 22+ 4 expressed in current US$
Source Statistics Division (FAOSTAT) and UNCTADSTAT
Owner FAO UNCTAD
Food + energy import bills per capita
P2HUNFAOTFSFUEL
Page chart 50 51 (p 103 103)
The annual value of food imported under SITC sections0 + 22+ 4 plus fuels under SITC section 3 expressed asa ratio of population
Source Statistics Division (FAOSTAT) and UNCTADSTAT
Owner FAO UNCTAD
Index of variability of food production
P2HUNFAOTFSQPVAR
Page chart 46 (p 102)
Rolling ten-year window of the coefficient of variation ofper capita production index
Source Statistics Division
Owner FAO
Food self-sufficiency (calories)
P2HUNFAOTFSSSCAL
Page table 19 (p 144) chart 45 (p 101) map 24 (p100)
The self-sufficiency ratio (SSR) is defined as SSR = pro-duction x 100(production + imports - exports) The SSRcan be calculated for individual commodities groups ofcommodities of similar nutritional values and after ap-propriate conversion of the commodity equations alsofor the aggregate of all commodities In the context offood security the SSR is often taken to indicate the ex-tent to which a country relies on its own production re-sources ie the higher the ratio the greater the self-sufficiency While the SSR can be the appropriate toolwhen assessing the supply situation for individual com-modities a certain degree of caution should be observedwhen looking at the overall food situation In the casehowever where a large part of a countryrsquos production ofone commodity eg other cereals is exported the SSRmay be very high but the country may still have to relyheavily on imports of food commodities to feed the pop-ulation The self-sufficiency rate (as defined above) can-not be the complement to 100 of the import dependencyrate or vice-versa
Source Statistics Division
Owner FAO
Months of cereal self-provisioning capacity
P2HUNFAOTFSSTU
Page chart 47 48 (p 102 103)
Stocks-to-utilization ratios for cereals (wheat rice andcoarse grains) where stocks refer to the carry-over ofthe preceding national crop season The ratio is thenmultiplied by 12 to calculate the number of months ofself-provisioning capacity in a given year
Source Trade and Markets Division
Owner FAO
165
PART 2
Persons affected by natural disastersP2HUNODFAEMDATRHSPPND
Page table 14 (p 129) chart 29 (p 85) map 16 (p 84)People requiring immediate assistance during a periodof emergency ie requiring basic survival needs suchas food water shelter sanitation and immediate med-ical assistance Appearance of a significant number ofcases of an infectious disease introduced in a region ora population that is usually free from that disease Seewwwemdatnet (Universiteacute catholique de Louvain Brus-sels Belgium)Source International Disaster Database EM-DATOwner OFDA and CRED
Total affected by natural disastersP2HUNODFAEMDATRHSPPNDT
Page chart 30 (p 86)Sum of (i) injured people suffering from physical injuriestrauma or an illness requiring medical treatment as a di-rect result of a disaster (ii) homeless people needing im-mediate assistance for shelter and (iii) affected peoplerequiring immediate assistance during a period of emer-gency it can also include displaced or evacuated peopleSee wwwemdatnet (Universiteacute catholique de LouvainBrussels Belgium)Source International Disaster Database EM-DATOwner OFDA and CRED
Multidimensional Poverty IndexP2HUNUNDPHDRMPI
Page table 21 (p 150)An international measure of poverty for 109 developingcountries the MPI complements income-based povertymeasures by reflecting the multiple deprivations thatpeople face at the same time The MPI identifies de-privations across health education and living standardsand shows the number of people who are multidimen-sionally poor and the deprivations that they face at thehousehold levelSource Alkire S Roche JM Santos ME and Seth S(November 2011) ophiqehoxacukOwner OPHI
Gender Inequality IndexP2HUNUNDPHDRPOVGEI
Page table 22 (p 153) map 29 (p 113)The Gender Inequality Index is a composite measure re-flecting inequality in achievements between women andmen in three dimensions reproductive health empow-erment and the labour market It varies between zero(when women and men fare equally) and one (when menor women fare poorly compared to the other in all di-mensions) The health dimension is measured by twoindicators maternal mortality ratio and the adolescentfertility rate The empowerment dimension is also mea-sured by two indicators the share of parliamentary seatsheld by each sex and by secondary and higher educationattainment levels The labour dimension is measured by
womenrsquos participation in the work force The Gender In-equality Index is designed to reveal the extent to whichnational human development achievements are erodedby gender inequality and to provide empirical founda-tions for policy analysis and advocacy effortsSource Human Development Report 2010Owner UNDP
Human Development IndexP2HUNUNDPHDRPOVHDI
Page table 22 (p 153)The HDI represents a national average of human de-velopment achievements in the three basic dimensionsmaking up the HDI health education and income Likeall averages it conceals disparities in human develop-ment across the population within the same countryTwo countries with different distributions of achieve-ments can have the same average HDI value The IHDItakes into account not only the average achievements ofa country on health education and income but also howthose achievements are distributed among its citizens bydiscounting each dimensionrsquos average value accordingto its level of inequalitySource Human Development Report 2010Owner UNDP
Human Development Index (inequality adjusted)P2HUNUNDPHDRPOVHDIi
Page table 22 (p 153) chart 59 (p 112)The Human Development Index (HDI) is a summary mea-sure of human development It measures the averageachievements in a country in three basic dimensionsof human development a long and healthy life ac-cess to knowledge and a decent standard of living TheInequality-adjusted Human Development Index (IHDI)adjusts the Human Development Index (HDI) for inequal-ity in distribution of each dimension across the popula-tion The IHDI accounts for inequalities in HDI dimen-sions by discounting each dimensionrsquos average valueaccording to its level of inequality The IHDI equals theHDI when there is no inequality across people but is lessthan the HDI as inequality rises In this sense the IHDI isthe actual level of human development (accounting forthis inequality) while the HDI can be viewed as an in-dex of potential human development (or the maximumlevel of HDI) that could be achieved if there was no in-equality The loss in potential human development dueto inequality is given by the difference between the HDIand the IHDI and can be expressed as a percentageSource Human Development Report 2010Owner UNDP
Population of concernP2HUNUNHCRGTRHSTPC
Page table 13 (p 126) map 17 (p 87)Refugees are individuals recognized under the 1951Convention relating to the Status of Refugees and alsopeople in a refugee-like situation such as those who
166
DEFINITIONS AND SOURCES
are outside their country or territory of origin and whoface protection risks similar to those of refugees butfor whom refugee status has for practical or other rea-sons not been ascertained Internally Displaced Persons(IDPs) are people or groups of individuals who have beenforced to leave their homes or places of habitual resi-dence in particular as a result of or in order to avoidthe effects of armed conflict situations of generalized vi-olence violations of human rights or natural- or human-made disasters and who have not crossed an interna-tional border Others include Asylum-seekers (personswho have applied for asylum or refugee status but whohave not yet received a final decision on their applica-tion) Returned IDPs and refugees Stateless Persons (in-dividuals not considered as nationals by any State underrelevant national laws) and other groups of concern towhom UNHCR has extended its protection andor assis-tance services based on humanitarian or other specialgrounds
Source Statistical Online Population Database
Owner UNHCR
Total population of concern
P2HUNUNHCRGTRHSTPCT
Page chart 32 (p 87)
Total population of concern is the sum of various groupsof people including refugees asylum-seekers internallydisplaced persons (IDPs) protectedassisted by UNHCRstateless persons and returnees (returned refugees andIDPs)
Source Statistical Online Population Database
Owner UNHCR
Average governance
P2HUNWBKPOVGOV
Page table 23 (p 156) chart 60 (p 115) map 30 (p114)
The Worldwide Governance Indicators project constructsaggregate indicators of six broad dimensions of gover-nance (i) Voice and Accountability (ii) Political Stabil-ity and Absence of ViolenceTerrorism (iii) GovernmentEffectiveness (iv) Regulatory Quality (v) Rule of Law(vi) Control of Corruption The six aggregate indicatorsare based on 30 underlying data sources reporting theperceptions of governance of a large number of surveyrespondents and expert assessments worldwide De-tails on the underlying data sources the aggregationmethod and the interpretation of the indicators can befound in the WGI methodology paper Daniel KaufmannAart Kraay and Massimo Mastruzzi (2010) The World-wide Governance Indicators A Summary of Methodol-ogy Data and Analytical Issues World Bank Policy Re-search Working Paper No 5430 httppapersssrncomsol3paperscfmabstract_id=1682130
Source World Bank
Owner Worldwide Governance Indicators (WGI) project
Ratio of girls-to-boys out of primary school
P2HUNWBKWDIEDUCOSR
Page table 24 (p 159)
Children out of school are the number of primary-school-age children not enrolled in primary or secondary school
Source World Bank (WDI)
Owner UNESCO
Public spending on education total ( of GDP)
P2HUNWBKWDIEDUEXPP
Page table 24 (p 159)
Public expenditure on education consists of current andcapital public expenditure on education includes gov-ernment spending on educational institutions (both pub-lic and private) education administration as well assubsidies for private entities (studentshouseholds andother privates entities)
Source World Bank (WDI)
Owner UNESCO
Expenditure per student
P2HUNWBKWDIEDUEXPS
Page table 24 (p 159)
Public expenditure per student is the public currentspending on education divided by the total number ofstudents by level as a percentage of GDP per capitaPublic expenditure (current and capital) includes govern-ment spending on educational institutions (both publicand private) education administration as well as subsi-dies for private entities (studentshouseholds and otherprivates entities)
Source World Bank (WDI)
Owner UNESCO
Literacy rate adult female ( of females ages 15 andabove)
P2HUNWBKWDIEDUFILT
Page table 24 (p 159) map 31 (p 116)
Adult literacy rate is the percentage of people ages 15and above who can with understanding read and writea short simple statement on their everyday life
Source World Bank (WDI)
Owner UNESCO
Ratio of girls to boys in primary and secondary education()
P2HUNWBKWDIEDUGEN
Page table 24 (p 159) chart 61 (p 117)
Ratio of girls to boys in primary and secondary educationis the ratio of the female to male gross enrolment ratesin primary and secondary school
Source World Bank (WDI)
Owner UNESCO
167
PART 2
Health expenditure per capita (current US$)P2HUNWBKWDIHAEHEPCP
Page table 24 (p 159) map 32 (p 118)
Total health expenditure is the sum of public and pri-vate health expenditures as a ratio of total populationIt covers the provision of health services (preventive andcurative) family planning activities nutrition activitiesand emergency aid designated for health but does notinclude provision of water and sanitation Data are incurrent US dollars
Source World Bank (WDI)
Owner WHO
Health expenditure total ( of GDP)P2HUNWBKWDIHAEHETOT
Page table 24 (p 159) chart 62 (p 119)
Total health expenditure is the sum of public and privatehealth expenditure It covers the provision of health ser-vices (preventive and curative) family planning activi-ties nutrition activities and emergency aid designatedfor health but does not include provision of water andsanitation
Source World Bank (WDI)
Owner WHO
Prevalence of HIV total ( of population ages 15-49)P2HUNWBKWDIHAEHIVPREV
Page table 24 (p 159)
Prevalence of HIV refers to the percentage of people ages15-49 who are infected with HIV
Source World Bank (WDI)
Owner UNAIDS and WHO
Improved sanitation facilities ( of population with ac-cess)P2HUNWBKWDIHAESANIMPS
Page table 24 (p 159) chart 63 (p 121)
Access to improved sanitation facilities refers to the per-centage of the population with at least adequate accessto excreta disposal facilities that can effectively preventhuman animal and insect contact with excreta Im-proved facilities range from simple but protected pit la-trines to flush toilets with a sewerage connection Tobe effective facilities must be correctly constructed andproperly maintained
Source World Bank (WDI)
Owner WHO and UNCF
Improved water source rural ( of rural population withaccess)P2HUNWBKWDIHAEWATIMPRU
Page table 24 (p 159) map 33 (p 120)
Access to an improved water source refers to the percent-age of the population with reasonable access to an ad-equate amount of water from an improved source suchas a household connection public standpipe borehole
protected well or spring and rainwater collection Unim-proved sources include vendors tanker trucks and un-protected wells and springs Reasonable access is de-fined as the availability of at least 20 litres a person aday from a source within one kilometre of the dwellingSource World Bank (WDI)Owner WHO and UNCF
Improved water source urban ( of urban populationwith access)P2HUNWBKWDIHAEWATIMPWU
Page table 24 (p 159)Access to an improved water source refers to the percent-age of the population with reasonable access to an ad-equate amount of water from an improved source suchas a household connection public standpipe boreholeprotected well or spring and rainwater collection Unim-proved sources include vendors tanker trucks and un-protected wells and springs Reasonable access is de-fined as the availability of at least 20 litres a person aday from a source within one kilometre of the dwellingSource World Bank (WDI)Owner WHO and UNCF
Poverty headcount ratio at $125 a day (PPP) ( of re-gional population)P2HUNWBKWDIPOVAGG
Page chart 58 (p 111)Data are from PovcalNet the on-line tool for povertymeasurement developed by the Development ResearchGroup of the World Bank See httpiresearchworldbankorgPovcalNetpovDuplichtmlSource PovcalNetOwner World Bank
Gini-index of income distributionP2HUNWBKWDIPOVGINI
Page table 22 (p 153) map 28 (p 113)Gini index measures the extent to which the distribu-tion of income among individuals or households withinan economy deviates from a perfectly equal distributionA Lorenz curve plots the cumulative percentages of totalincome received against the cumulative number of recip-ients starting with the poorest individual or householdThe Gini index measures the area between the Lorenzcurve and a hypothetical line of absolute equality ex-pressed as a percentage of the maximum area under theline Thus a Gini index of 0 represents perfect equalitywhile an index of 100 implies perfect inequalitySource World Bank (WDI)Owner World Bank
Poverty headcount ratio at $125 a day (PPP) ( of pop-ulation)P2HUNWBKWDIPOVH125
Page table 21 (p 150)Population below US$125 a day is the percentage of thepopulation living on less than US$125 a day at 2005
168
DEFINITIONS AND SOURCES
international prices As a result of revisions in PPP ex-change rates poverty rates for individual countries can-not be compared with poverty rates reported in earliereditionsSource World Bank (WDI)Owner World Bank
Income share held by highest 20P2HUNWBKWDIPOVH20
Page table 22 (p 153)Percentage share of income or consumption is the sharethat accrues to subgroups of population indicated bydeciles or quintiles Percentage shares by quintile maynot sum to 100 because of roundingSource World Bank (WDI)Owner World Bank
Poverty headcount ratio at $2 a day (PPP) ( of popula-tion)P2HUNWBKWDIPOVH200
Page table 21 (p 150)Population below US$2 a day is the percentage of thepopulation living on less than US$200 a day at 2005international prices As a result of revisions in PPP ex-change rates poverty rates for individual countries can-not be compared with poverty rates reported in earliereditionsSource World Bank (WDI)Owner World Bank
Poverty headcount ratio at national poverty line ( ofpopulation)P2HUNWBKWDIPOVHNPL
Page table 21 (p 150)National poverty rate is the percentage of the popula-tion living below the national poverty line National es-timates are based on population-weighted subgroup es-timates from household surveysSource World Bank (WDI)Owner World Bank
Poverty headcount ratio at rural poverty line ( of ruralpopulation)P2HUNWBKWDIPOVHRPL
Page table 21 (p 150)Rural poverty rate is the percentage of the rural popula-tion living below the national rural poverty lineSource World Bank (WDI)Owner World Bank
Income share held by lowest 20P2HUNWBKWDIPOVL20
Page table 22 (p 153)Percentage share of income or consumption is the sharethat accrues to subgroups of population indicated bydeciles or quintiles Percentage shares by quintile maynot sum to 100 because of roundingSource World Bank (WDI)Owner World Bank
Poverty gap at $125 a day (PPP) ()P2HUNWBKWDIPOVP125
Page table 21 (p 150) map 27 (p 110)Poverty gap is the mean shortfall from the poverty line(counting the nonpoor as having zero shortfall) ex-pressed as a percentage of the poverty line This mea-sure reflects the depth of poverty as well as its incidenceSource World Bank (WDI)Owner World Bank
Poverty gap at $2 a day (PPP) ()P2HUNWBKWDIPOVP200
Page table 21 (p 150)Poverty gap is the mean shortfall from the poverty line(counting the nonpoor as having zero shortfall) ex-pressed as a percentage of the poverty line This mea-sure reflects the depth of poverty as well as its incidenceSource World Bank (WDI)Owner World Bank
Poverty gap at national poverty line ()P2HUNWBKWDIPOVPNPL
Page table 21 (p 150)Poverty gap at national poverty line is the mean short-fall from the poverty line (counting the nonpoor as hav-ing zero shortfall) as a percentage of the poverty lineThis measure reflects the depth of poverty as well as itsincidenceSource World Bank (WDI)Owner World Bank
Poverty gap at rural poverty line ()P2HUNWBKWDIPOVPRPL
Page table 21 (p 150)Poverty gap at rural poverty line is the mean shortfallfrom the poverty line (counting the nonpoor as hav-ing zero shortfall) as a percentage of the national ruralpoverty line This measure reflects the depth of povertyas well as its incidenceSource World Bank (WDI)Owner World Bank
Food aid receivedP2HUNWFPFAISFDAID
Page table 25 (p 162) chart 64 (p 123) map 34 (p122)Quantity of food aid that reaches the recipient coun-try during a given period Quantities exported in GrainEquivalent The latter is a unit of measurement usedas alternative to Actual Ton for cereal-derived productsTo convert a product into grain equivalent a commodityspecific conversion factor is used For example if the fac-tor to convert wheat flour into wheat is 137 a tonne ofwheat flour corresponds to 0730 tons of wheat (1137)Source Food Aid Information SystemOwner WFP
169
PART 2
Percentage of adults with low body mass index (BMI)P2HUNWHOGHOADLTLBMI
Page table 18 (p 141)The indicator of weight adequacy in relation to height ofolder children adolescents and adults It is calculated asweight (kilograms) divided by height (metres) squaredThe acceptable range for adults is 185 to 249 and forchildren it varies with ageSource Global Health ObservatoryOwner WHO
Percentage of female adults with low body mass index(BMI)P2HUNWHOGHOADLTLBMIF
Page table 18 (p 141) map 22 (p 99)The indicator of weight adequacy in relation to height ofolder female children adolescents and adults It is cal-culated as weight (kilograms) divided by height (metres)squared The acceptable range for adults is 185 to 249 and for children it varies with ageSource Global Health ObservatoryOwner WHO
Percentage of adults who are obese by genderP2HUNWHOGHOADLTOBS
Page table 18 (p 141)Percentage of male and female defined population witha body mass index (BMI) of 25 kgm2 or higherSource Global Health ObservatoryOwner WHO
Percentage of adults who are obeseP2HUNWHOGHOADLTOBSx
Page map 23 (p 99)Percentage of adult defined population with a bodymassindex (BMI) of 25 kgm2 or higherSource Global Health ObservatoryOwner WHO
Percentage of children under 5 who are stuntedP2HUNWHOGHOCHLDSTNT
Page table 18 (p 141) chart 43 (p 98)Percentage of stunting (height-for-age less than -2 stan-dard deviations of the WHO Child Growth Standards me-dian) among children aged 0-5 yearsSource Global Health ObservatoryOwner WHO
Percentage of children under 5 who are underweightP2HUNWHOGHOCHLDUW
Page table 18 (p 141) chart 42 (p 97) map 21 (p 96)Percentage of underweight (weight-for-age less than -2standard deviations of the WHO Child Growth Standardsmedian) among children aged 0-5 yearsSource Global Health ObservatoryOwner WHO
Percentage of children under 5 who are wastedP2HUNWHOGHOCHLDWSTD
Page table 18 (p 141) chart 43 (p 98)Percentage of wasting (weight-for-height less than -2standard deviations of the WHO Child Growth Standardsmedian) among children aged 0-5 yearsSource Global Health ObservatoryOwner WHO
Percentage of newborns with low birth weightP2HUNWHOGHONEWLWB
Page table 18 (p 141)Low-birthweight babies are newborns weighing lessthan 2500 grams with the measurement taken withinthe first hours of life before significant postnatal weightloss has occurredSource Global Health ObservatoryOwner WHO
170

EDUCATION HEALTH AND SANITATION
No Data lt 50 50 minus 80 80 minus 90 90 minus 95 gt 95
Literacy rate female ( 2009)
Chart 61 Unequal opportunity afforded to girls in basic education where it matters most
Ratio of girls to boys in primary and secondary education (2009)
0
20
40
60
80
100
DevelopedEastAsia
LAmer ampCarib
SouthAsia
Sub-SAfrica
Source UNESCO
Metalink P2HUNWBKWDIEDUGEN p 167
117
PART 2
Investment in health is also important for human wel-fare and sustained economic and social developmentTimely access to health services ndash that is to a mix ofpromotion prevention treatment and rehabilitation ndash iscritical This cannot be achieved for the majority of thepopulation without a well-functioning health financingsystem
The most recent estimates of money needed to ensureaccess to essential healthcare suggests that on aver-age low-income countries must spend around US$ 60per capita which is almost double the amount they arecurrently spending Public financing is usually a mixof government money loans grants and aid from in-ternational organizations and non-governmental orga-nizations Apart from insufficient overall funds the percapita distribution of public expenditure on healthcareacross countries is vastly uneven It is unrealistic toexpect most low-income countries to achieve universalcoverage Access is often dictated by the ability to payand fees are a major hindrance for poor people solicitingtreatment
There are other factors beside income that determine ac-cess to health care For instance migrants ethnic mi-norities and indigenous people use services less thanother population groups even though their needs maybe higher Also when people do require healthcare theyoften incur high sometimes catastrophic costs in payingfor access According to the World Health Organization(WHO) about 150 million people globally suffer finan-cial catastrophe annually while 100 million are pushedbelow the poverty line each year
Often lost income causes strenuous financial penaltieson the ill and those who care for them The Interna-tional Labour Organization (ILO) finds that only one infive people in the world has broad-based social securityprotection that also includes cover for lost wages in theevent of illness and more than half the worldrsquos popula-tion lacks any type of formal social protection
Map 32
No Data lt 50 50 minus 150 150 minus 300 300 minus 1000 gt 1000
Annual health expenditure per capita (US$ 2009)
Source WHO
Metalink P2HUNWBKWDIHAEHEPCP p 168
rarr USD 860 spent annually on health perperson at the global level
rarr This number masks huge differences be-tween regions
rarr An average of just USD 32 is spent on aper capita basis in low-income countries
118
EDUCATION HEALTH AND SANITATION
No Data lt 50 50 minus 150 150 minus 300 300 minus 1000 gt 1000
Annual health expenditure per capita (US$ 2009)
Chart 62 Budgetary constraints preclude adequate public health spending in many de-veloping regions
Annual health expenditure (2009)
ofGDP
0
2
4
6
8
10
DevelopedEastAsia
LAmer ampCarib
SouthAsia
Sub-SAfrica
Source WHO
Metalink P2HUNWBKWDIHAEHETOT p 168
119
PART 2
Improving access to safe water and sanitation cangreatly reduce the burden on health systems and pro-mote wider development According to the United Na-tions Childrenrsquos Fund (UNICEF) 25 billion people in de-veloping countries ndash around 50 percent of their popula-tion ndash lack improved sanitation facilities and over 884million still use unsafe drinking water sources
Inadequate access to safe water and sanitation servicescoupled with poor hygiene practices kills and sickensthousands of children every day and leads to impov-erishment and diminished opportunities for thousandsmore Estimates point to some 2 million people dyingevery year as a result of diarrhoea and diseases causedby ingesting contaminated water
Poor water and sanitation have many other seriousrepercussions as well Children especially girls are de-nied their right to education because schools lack pri-vate and decent sanitation facilities Women and girlsare forced to spend large parts of their day searching forand fetching water denying them participation in edu-cation and income-generating employment
Inadequate water and sanitation means that poor farm-ers and wage earners are less productive due to ill-ness health systems are overwhelmed and nationaleconomies underperform
Further reading
bull UNESCO education (wwwunescoorgneweneducation)
bull UNICEF Water Sanitation and Hygiene (wwwuniceforgwash)
bull WHO The world health report - Health systems financ-ing the path to universal coverage (wwwwhointwhr2010enindexhtml
bull UNDP Human Development Report 2010 (hdrundporgenreportsglobalhdr2010)
bull OrsquoDonovan (2008)
Map 33
No Data lt 30 30 minus 50 50 minus 75 75 minus 90 gt 90
Improved water source minus share of rural population with access ( 2008)
Source WHO
Metalink P2HUNWBKWDIHAEWATIMPRU p 168
rarr 78 percent of the worldrsquos rural popula-tion now have access to clean water
rarr Progress has been slow - just 15 percentmore than two decades ago
rarr Yet in many developing countries morethan half of all households struggle withinadequate access to safe water and san-itation services
120
EDUCATION HEALTH AND SANITATION
No Data lt 30 30 minus 50 50 minus 75 75 minus 90 gt 90
Improved water source minus share of rural population with access ( 2008)
Chart 63 There are still many who do not have access to adequate sanitation
Improved sanitation facilities - share of population with access (2008)
0
20
40
60
80
DevelopedEastAsia
LAmer ampCarib
SouthAsia
Sub-SAfrica
Source WHO
Metalink P2HUNWBKWDIHAESANIMPS p 168
121
PART 2
Food aidEmergency situations have become increasingly fre-quent over the past 25 years and are often coupled withacute and chronic food insecurity in the affected coun-tries International responses to these crises have gen-erally focused on addressing immediate humanitarianneeds as evidenced by the growing share of food aidthat is channelled to emergencies
Several formal agreements govern food-related assis-tance at the international level Among these the FoodAid Convention (FAC) is the only legal instrument to en-sure a minimum amount of food aid The components ofthe FAC have remained largely unchanged since its cre-ation in 1967 and many believe that it no longer appliesto todayrsquos food-related assistance needs Current foodaid patterns do not reflect longer-term requirements In2009 around 80 percent of total assistance was chan-nelled to emergency relief measures while the remain-der was used for promoting agricultural and broader eco-nomic development More troubling is the perceivedhigh negative correlation of international food priceswith the level of food aid
The strong focus on short-term relief measures com-bined with limited support to local agriculture is notonly less effective for overcoming the structural reasonsfor food insecurity it might even lower incentives to in-vest in agriculture and domestic food production Amoresustainable solution is required to tackle the underlyingreasons for food insecurity such as low agricultural pro-ductivity Accordingly those most in need would alsobenefit from the provision of basic inputs such as seedsfertilizers and farming tools
Donors are addressing shortcomings of traditional foodassistance A growing number now rely on procurementmechanisms in the target countries themselves Localpurchases not only minimize market distortions (sup-plies are neither increased nor effective demand low-ered) they are also generally cheaper than in-kind aidand can generate development benefits to local marketsand farmers Some donors also strive for better inte-gration of emergency interventions and longer-term de-velopment operations The European Union for exam-ple envisages a rapid handover to structural food se-curity mechanisms during emergency response Suchmeasures help rebuild the livelihoods of affected pop-ulations and strengthen their resilience to future crises
These examples illustrate a fundamental departure fromthe ad hoc and partial approaches to food security inter-ventions followed in the past They also point to donorsrsquogeneral agreement on the principles that should guidefood aid interventions
Further reading
bull FAO Making the Food Aid Convention meet the re-alities of the 21st century (wwwfaoorgdocrep013al935eal935e00pdf)
bull World Food Programme (wwwwfporg)
Map 34
No Data 0 0001 minus 1 1 minus 50 50 minus 100 gt 100
Food aid received grain equivalent (thousand tonnes 2010)
Source WFP
Metalink P2HUNWFPFAISFDAID p 169
rarr 57 million tonnes of food aid were re-ceived in 2010
rarr Despite no let-up in the number of emer-gencies food aid fell to a historical low
rarr Many donors now rely on locally pur-chased food in order to strengthen do-mestic markets in crisis-hit countries
122
FOOD AID
No Data 0 0001 minus 1 1 minus 50 50 minus 100 gt 100
Food aid received grain equivalent (thousand tonnes 2010)
Chart 64 Food aid flows are in long-term decline and have fallen further at a time whenfood prices have spiked
Food aid received (1988-2010)
Thousandtonnes
6000
8000
10000
12000
14000
16000
1990 1995 2000 2005 2010
Source WFP
Metalink P2HUNWFPFAISFDAID p 169
123
TABLE 13 Population at risk UNHCR population of concernUNHCR population of concern
total totalrefugees
internallydisplacedpersons
others andstatelesspersons
total totalrefugees
internallydisplacedpersons
others andstatelesspersons
thousands thousands thousands thousands thousands thousands thousands thousands
2009 2009 2009 2009 2010 2010 2010 2010
WORLD 29233 10174 15628 3431 29986 10350 14456 5180
DEVELOPING REGIONS 28139 9642 15207 3290 28931 9845 14058 5027
AFRICA 10636 2805 6469 1362 10587 2947 6154 1486
North Africa 143 138 0 5 142 137 0 5
Algeria 10 8 0 2 8 7 0 2
Egypt 9 7 0 2 9 7 0 2
Libya 3 2 0 1 3 2 0 1
Morocco 3 2 0 1 3 2 0 1
Tunisia 3 2 0 1 3 2 0 1
Sub-Saharan Africa 10493 2667 6469 1357 10445 2810 6154 1481
Angola 159 141 0 18 136 135 0 1
Benin 1 0 0 0 1 0 0 0
Botswana 0 0 0 0 0 0 0 0
Burkina Faso 1 1 0 0 2 1 0 1
Burundi 231 94 100 37 254 84 157 12
Cameroon 17 15 0 2 17 15 0 2
Cape Verde 0 0 0 0 0 0 0 0
Central African Republic 357 160 197 1 359 165 193 2
Chad 250 55 171 25 237 54 131 53
Comoros 0 0 0 0 0 0 0 0
Congo 24 21 0 3 24 21 0 3
Cocircte drsquoIvoire 714 23 519 172 585 42 515 29
Congo Dem Rep 2663 456 2053 154 2719 477 1721 520
Djibouti 1 1 0 0 1 1 0 0
Equatorial Guinea 0 0 0 0 0 0 0 0
Eritrea 224 209 0 14 236 222 0 14
Ethiopia 112 63 0 49 118 69 0 49
Gabon 0 0 0 0 0 0 0 0
Gambia 5 2 0 3 3 2 0 1
Ghana 16 15 0 1 22 20 0 2
Guinea 14 11 0 3 15 12 0 3
Guinea-Bissau 1 1 0 0 1 1 0 0
Kenya 417 10 399 8 311 9 300 2
Lesotho 0 0 0 0 0 0 0 0
Liberia 78 72 0 6 73 70 0 3
Madagascar 0 0 0 0 0 0 0 0
Malawi 0 0 0 0 0 0 0 0
Mali 4 3 0 1 4 4 0 0
Mauritania 52 39 0 13 40 38 0 2
Mauritius 0 0 0 0 0 0 0 0
Mozambique 0 0 0 0 0 0 0 0
Namibia 1 1 0 0 1 1 0 0
Niger 1 1 0 0 1 1 0 0
Nigeria 25 16 0 10 28 16 0 12
Rwanda 155 129 0 25 136 115 0 21
Senegal 17 16 0 1 18 16 0 2
Seychelles 0 0 0 0 0 0 0 0
Sierra Leone 19 15 0 3 15 11 0 3
Somalia 2249 678 1550 21 2257 770 1464 23
Sudan 1619 368 1034 217 2185 387 1548 250
South Africa 1 0 0 0 1 0 0 0
Swaziland 0 0 0 0 0 0 0 0
Tanzania Utd Rep 156 1 0 155 164 1 0 162
Togo 20 18 0 1 19 18 0 1
Uganda 863 8 446 409 436 6 126 304
Zambia 0 0 0 0 0 0 0 0
Zimbabwe 24 22 0 1 25 24 0 1
124
TABLE 13 Population at risk UNHCR population of concern (continued)UNHCR population of concern
total totalrefugees
internallydisplacedpersons
others andstatelesspersons
total totalrefugees
internallydisplacedpersons
others andstatelesspersons
thousands thousands thousands thousands thousands thousands thousands thousands
2009 2009 2009 2009 2010 2010 2010 2010
ASIA 13602 6372 5435 1796 14103 6425 4232 3446
Central Asia 17 14 0 3 301 17 60 224
Kazakhstan 4 4 0 1 4 4 0 1
Kyrgyzstan 3 3 0 0 284 3 60 222
Tajikistan 1 1 0 0 1 1 0 0
Turkmenistan 1 1 0 0 1 1 0 0
Uzbekistan 8 7 0 2 10 9 0 2
East Asia 1153 975 67 110 1303 986 202 115
Brunei Darussalam 0 0 0 0 0 0 0 0
Cambodia 17 17 0 0 16 16 0 0
China 199 181 0 18 192 185 0 8
Indonesia 21 18 0 2 17 17 0 0
Korea DPR 1 1 0 0 1 1 0 0
Korea Republic of 1 1 0 0 1 1 0 0
Lao PDR 9 8 0 0 8 8 0 0
Malaysia 62 1 0 61 1 1 0 0
Mongolia 4 1 0 2 4 2 0 2
Myanmar 497 407 67 23 500 416 62 22
Philippines 2 1 0 1 221 1 140 81
Singapore 0 0 0 0 0 0 0 0
Thailand 1 1 0 0 1 0 0 0
Viet Nam 341 339 0 1 340 339 0 1
South Asia 7225 3265 2627 1334 7400 3413 1578 2409
Afghanistan 3279 2887 297 95 4404 3055 352 998
Bangladesh 12 10 0 2 17 10 0 7
Bhutan 90 89 0 1 76 75 0 1
India 24 20 0 5 22 18 0 4
Iran (Islamic Rep) 87 73 0 14 85 69 0 16
Maldives 0 0 0 0 0 0 0 0
Nepal 7 5 0 2 7 6 0 1
Pakistan 3041 35 1895 1111 2199 40 952 1207
Sri Lanka 684 146 435 104 590 141 274 175
West Asia 5206 2117 2741 349 5100 2010 2393 698
Armenia 104 18 0 86 103 18 0 85
Azerbaijan 606 17 586 3 612 17 593 2
Bahrain 0 0 0 0 0 0 0 0
Cyprus 0 0 0 0 0 0 0 0
Georgia 378 15 353 10 378 11 236 131
Iraq 3565 1785 1552 228 3387 1684 1344 360
Jordan 3 2 0 1 3 2 0 1
Kuwait 1 1 0 0 1 1 0 0
Lebanon 18 16 0 2 17 16 0 2
Occupied PalestinianTerritory
98 95 0 3 97 93 0 3
Saudi Arabia 1 1 0 0 1 1 0 0
Syrian Arab Republic 23 18 0 6 28 18 0 10
Turkey 156 146 0 10 155 147 0 8
United Arab Emirates 0 0 0 0 0 0 0 0
Yemen 253 2 250 1 318 2 221 95
LATIN AMERICA amp THECARIBBEAN
3898 463 3304 132 4238 471 3672 95
Argentina 1 1 0 0 1 1 0 0
Bahamas 0 0 0 0 0 0 0 0
Barbados 0 0 0 0 0 0 0 0
Belize 0 0 0 0 0 0 0 0
Bolivia (Plur State) 1 1 0 0 1 1 0 0
Brazil 1 1 0 0 1 1 0 0
Chile 1 1 0 0 1 1 0 0
Colombia 3758 390 3304 64 4128 396 3672 60
Costa Rica 0 0 0 0 0 0 0 0
125
TABLE 13 Population at risk UNHCR population of concern (continued)UNHCR population of concern
total totalrefugees
internallydisplacedpersons
others andstatelesspersons
total totalrefugees
internallydisplacedpersons
others andstatelesspersons
thousands thousands thousands thousands thousands thousands thousands thousands
2009 2009 2009 2009 2010 2010 2010 2010
Cuba 10 8 0 2 12 7 0 4
Dominica 0 0 0 0 0 0 0 0
Dominican Republic 1 0 0 0 1 0 0 0
Ecuador 1 1 0 0 1 1 0 0
El Salvador 15 5 0 10 7 5 0 2
French Guiana 0 0 0 0 0 0 0 0
Grenada 0 0 0 0 0 0 0 0
Guatemala 15 6 0 9 7 6 0 1
Guyana 1 1 0 0 1 1 0 0
Haiti 36 24 0 12 33 26 0 7
Honduras 2 1 0 1 2 1 0 1
Jamaica 1 1 0 1 2 1 0 1
Mexico 27 6 0 20 17 7 0 10
Netherlands Antilles
Nicaragua 2 1 0 0 2 1 0 0
Panama 0 0 0 0 0 0 0 0
Paraguay 0 0 0 0 0 0 0 0
Peru 12 6 0 6 11 6 0 5
St Kitts amp Nevis 0 0 0 0 0 0 0 0
St Lucia 1 0 0 1 1 0 0 1
St Vincent amp Grenadines 2 1 0 1 2 1 0 1
Suriname 0 0 0 0 0 0 0 0
Trinidad amp Tobago 1 0 0 0 0 0 0 0
Uruguay 0 0 0 0 0 0 0 0
Venezuela (Boliv Rep of) 8 6 0 2 7 7 0 1
OCEANIA 2 2 0 0 2 2 0 0
Fiji 2 2 0 0 2 2 0 0
French Polynesia 0 0 0 0
New Caledonia 0 0 0 0 0 0 0 0
Papua New Guinea 0 0 0 0 0 0 0 0
Samoa 0 0 0 0 0 0 0 0
Solomon Islands 0 0 0 0 0 0 0 0
Tonga 0 0 0 0 0 0 0 0
Vanuatu 0 0 0 0 0 0 0 0
DEVELOPED REGIONS 1094 532 421 141 1055 505 397 153
NORTH AMERICA 4 2 0 1 4 3 0 1
Bermuda 0 0 0 0 0 0 0 0
Canada 0 0 0 0 0 0 0 0
United States of America 4 2 0 1 4 3 0 1
ASIA amp OCEANIA 3 1 0 1 2 2 0 1
Australia 0 0 0 0 0 0 0 0
Israel 2 1 0 1 2 1 0 1
Japan 0 0 0 0 0 0 0 0
New Zealand 0 0 0 0 0 0 0 0
EUROPE 1088 528 421 139 1048 500 397 151
Albania 17 16 0 2 16 15 0 1
Belarus 7 6 0 1 6 6 0 1
Bosnia amp Herzegovina 237 70 114 53 232 63 113 55
Croatia 103 76 2 25 89 66 2 21
European Union 39 14 0 24 20 13 0 7
Iceland 0 0 0 0 0 0 0 0
Macedonia FYR 9 8 0 1 11 8 0 3
Montenegro 3 3 0 0 3 3 0 0
Norway 0 0 0 0 0 0 0 0
Republic of Moldova 7 6 0 1 7 6 0 1
Russian Federation 204 109 80 14 199 112 53 34
Serbia 437 196 225 16 439 183 228 27
Switzerland 0 0 0 0 0 0 0 0
Ukraine 26 25 0 2 26 25 0 1
126
TABLE 14 Population at risk persons affected by natural disastersPersons affected by natural disasters
total droughtearthquake
extremetemperature
flood landslide storm volcanoeswildfiresand
epidemics
thousands thousands thousands thousands thousands thousands thousands thousands
2010 2010 2010 2010 2010 2010 2010 2010
WORLD 344655 106870 7485 3986 191861 2464 30954 1034
DEVELOPING REGIONS 342717 106870 6650 3971 191352 2464 30403 1007
AFRICA 43854 38810 0 0 4657 20 317 50
North Africa 81 0 0 0 81 0 0 0
Algeria 0 0 0 0 0 0 0 0
Egypt 4 0 0 0 4 0 0 0
Libya
Morocco 77 0 0 0 77 0 0 0
Tunisia
Sub-Saharan Africa 43773 38810 0 0 4577 20 317 50
Angola 255 0 0 0 255 0 0 0
Benin 832 0 0 0 831 0 0 1
Botswana 0 0 0 0 0 0 0 0
Burkina Faso 139 0 0 0 133 0 0 6
Burundi 184 180 0 0 3 0 2 0
Cameroon 6 0 0 0 3 0 0 3
Cape Verde
Central African Republic 2 0 0 0 2 0 0 0
Chad 2552 2400 0 0 145 0 0 7
Comoros
Congo 1 0 0 0 0 0 0 1
Cocircte drsquoIvoire 6 0 0 0 6 0 0 0
Congo Dem Rep 85 0 0 0 70 1 0 14
Djibouti 120 120 0 0 0 0 0 0
Equatorial Guinea
Eritrea
Ethiopia 9482 9400 0 0 81 0 0 1
Gabon 2 0 0 0 0 0 2 1
Gambia 39 0 0 0 39 0 0 0
Ghana 17 0 0 0 17 0 0 0
Guinea 48 0 0 0 48 0 0 0
Guinea-Bissau 57 0 0 0 57 0 0 0
Kenya 7514 7300 0 0 211 0 0 3
Lesotho 5 0 0 0 5 0 0 0
Liberia 15 0 0 0 15 0 0 0
Madagascar 1027 720 0 0 0 0 307 0
Malawi 79 0 0 0 79 0 0 0
Mali 619 600 0 0 19 0 0 0
Mauritania 309 300 0 0 9 0 0 0
Mauritius
Mozambique 544 460 0 0 81 0 0 4
Namibia 338 0 0 0 338 0 0 0
Niger 8134 7900 0 0 233 0 0 1
Nigeria 1509 0 0 0 1500 0 0 8
Rwanda 10 0 0 0 4 6 0 0
Senegal 103 0 0 0 103 0 0 0
Seychelles
Sierra Leone 0 0 0 0 0 0 0 0
Somalia 2866 2850 0 0 16 0 0 0
Sudan 4438 4300 0 0 138 0 0 0
South Africa 26 0 0 0 20 0 6 0
Swaziland
Tanzania Utd Rep
Togo 112 0 0 0 112 0 0 0
Uganda 613 600 0 0 0 13 0 0
Zambia 3 0 0 0 3 0 0 0
Zimbabwe 1681 1680 0 0 1 0 0 0
127
TABLE 14 Population at risk persons affected by natural disasters (continued)Persons affected by natural disasters
total droughtearthquake
extremetemperature
flood landslide storm volcanoeswildfiresand
epidemics
thousands thousands thousands thousands thousands thousands thousands thousands
2010 2010 2010 2010 2010 2010 2010 2010
ASIA 285231 67783 252 3900 181630 2388 28948 330
Central Asia 64 0 8 0 47 8 0 1
Kazakhstan 38 0 0 0 38 0 0 0
Kyrgyzstan 8 0 0 0 0 8 0 0
Tajikistan 17 0 8 0 9 0 0 0
Turkmenistan
Uzbekistan
East Asia 256254 66483 234 3800 154940 2294 28180 324
Brunei Darussalam
Cambodia 0 0 0 0 0 0 0 0
China 231535 60000 196 3800 140254 2148 25137 0
Indonesia 238 0 17 0 69 0 0 152
Korea DPR 96 0 0 0 56 0 40 0
Korea Republic of 42 0 0 0 0 0 42 0
Lao PDR
Malaysia 0 0 0 0 0 0 0 0
Mongolia
Myanmar 426 0 21 0 0 145 260 0
Philippines 6738 0 0 0 3901 1 2666 171
Singapore
Thailand 15654 6483 0 0 9171 0 0 1
Viet Nam 1524 0 0 0 1490 0 35 0
South Asia 27536 0 7 100 26570 86 768 5
Afghanistan 49 0 1 0 48 0 0 0
Bangladesh 987 0 0 100 575 55 257 0
Bhutan
India 4790 0 0 0 4283 0 507 0
Iran (Islamic Rep) 5 0 5 0 0 0 0 0
Maldives
Nepal 13 0 0 0 8 0 0 5
Pakistan 20399 0 1 0 20363 30 4 0
Sri Lanka 1292 0 0 0 1292 0 0 0
West Asia 1377 1300 4 0 74 0 0 0
Armenia
Azerbaijan 70 0 0 0 70 0 0 0
Bahrain
Cyprus
Georgia
Iraq 2 0 0 0 2 0 0 0
Jordan
Kuwait
Lebanon
Occupied PalestinianTerritory
0 0 0 0 0 0 0 0
Saudi Arabia 0 0 0 0 0 0 0 0
Syrian Arab Republic 1300 1300 0 0 0 0 0 0
Turkey 4 0 4 0 0 0 0 0
United Arab Emirates
Yemen 1 0 0 0 1 0 0 0
LATIN AMERICA amp THECARIBBEAN
13570 277 6397 71 5049 56 1093 628
Argentina 0 0 0 0 0 0 0 0
Bahamas
Barbados 2 0 0 0 0 0 2 0
Belize 0 0 0 0 0 0 0 0
Bolivia (Plur State) 428 62 0 0 358 4 0 3
Brazil 357 62 0 0 295 0 0 0
Chile 2676 0 2672 0 0 0 0 4
Colombia 3005 0 0 0 3005 0 0 0
Costa Rica 3 0 0 0 3 0 0 0
128
TABLE 14 Population at risk persons affected by natural disasters (continued)Persons affected by natural disasters
total droughtearthquake
extremetemperature
flood landslide storm volcanoeswildfiresand
epidemics
thousands thousands thousands thousands thousands thousands thousands thousands
2010 2010 2010 2010 2010 2010 2010 2010
Cuba
Dominica
Dominican Republic 52 0 0 0 39 0 12 0
Ecuador 121 108 0 0 11 0 0 2
El Salvador 12 0 0 0 0 0 12 0
French Guiana
Grenada 0 0 0 0 0 0 0 0
Guatemala 456 0 0 0 3 51 400 2
Guyana 0 0 0 0 0 0 0 0
Haiti 4310 0 3700 0 24 0 78 507
Honduras 102 45 0 0 5 0 25 27
Jamaica 3 0 0 0 0 0 3 0
Mexico 1600 0 25 0 1020 0 555 0
Netherlands Antilles
Nicaragua 76 0 0 0 76 0 0 0
Panama 33 0 0 0 33 0 0 0
Paraguay 16 0 0 0 0 0 0 16
Peru 154 0 0 71 80 1 0 2
St Kitts amp Nevis
St Lucia 3 0 0 0 2 0 1 0
St Vincent amp Grenadines
Suriname
Trinidad amp Tobago 0 0 0 0 0 0 0 0
Uruguay 0 0 0 0 0 0 0 0
Venezuela (Boliv Rep of) 95 0 0 0 95 0 0 0
OCEANIA 62 0 1 0 16 0 45 0
Fiji 39 0 0 0 0 0 39 0
French Polynesia 3 0 0 0 0 0 3 0
New Caledonia
Papua New Guinea 0 0 0 0 0 0 0 0
Samoa
Solomon Islands 18 0 1 0 16 0 1 0
Tonga 0 0 0 0 0 0 0 0
Vanuatu 0 0 0 0 0 0 0 0
DEVELOPED REGIONS 1922 0 835 15 509 0 536 27
NORTH AMERICA 36 0 1 0 7 0 29 0
Bermuda
Canada 0 0 0 0 0 0 0 0
United States of America 36 0 1 0 7 0 29 0
ASIA amp OCEANIA 1046 0 792 15 211 0 7 20
Australia 219 0 0 0 211 0 7 0
Israel 20 0 0 0 0 0 0 20
Japan 507 0 492 15 0 0 0 0
New Zealand 300 0 300 0 0 0 0 0
EUROPE 840 0 42 0 291 0 500 7
Albania 14 0 0 0 14 0 0 0
Belarus
Bosnia amp Herzegovina 35 0 0 0 35 0 0 0
Croatia 1 0 0 0 1 0 0 0
European Union 634 0 15 0 119 0 500 0
Iceland 0 0 0 0 0 0 0 0
Macedonia FYR
Montenegro 6 0 0 0 6 0 0 0
Norway
Republic of Moldova 12 0 0 0 12 0 0 0
Russian Federation 66 0 0 0 58 0 0 7
Serbia 32 0 27 0 5 0 0 0
Switzerland 0 0 0 0 0 0 0 0
Ukraine 40 0 0 0 40 0 0 0
129
TABLE 15 UndernourishmentShare of population undernourished Incidence of undernourishment Depth of hunger
pa millions millions pakcalcapday kcalcapday
pa
1995-97 2006-08 growth1995-97 -2006-08
1995-97 2006-08 growth1995-97 -2006-08
1995-97 2006-08 growth1995-97 -2006-08
WORLD 18 16 minus23 7012 7392 05 214 212 minus03
DEVELOPING REGIONS 18 16 minus23 7011 7392 05 234 234 minus03
AFRICA 29 23 minus24 1622 1603 minus01 253 234 minus05
North Africa 5 31 185 188 01
Algeria 5 15 180 180 00
Egypt 190 200 03
Libya 130 130 05
Morocco 6 16 210 200 minus03
Tunisia 120 120 00
Sub-Saharan Africa 31 23 minus23 1591 1603 01 268 243 minus05
Angola 61 41 minus35 78 72 minus07 390 320 minus17
Benin 18 12 minus36 10 10 00 230 210 minus08
Botswana 23 25 08 04 05 20 230 240 08
Burkina Faso 12 8 minus36 12 12 00 210 200 minus06
Burundi 56 62 09 35 49 31 350 390 14
Cameroon 34 22 minus39 50 42 minus16 260 230 minus08
Cape Verde 14 11 minus22 01 01 00 190 190 00
Central African Republic 47 40 minus15 16 17 06 320 300 minus02
Chad 53 39 minus27 39 41 05 370 320 minus12
Comoros 47 47 00 03 04 26 300 300 07
Congo 41 13 minus99 12 05 minus76 310 230 minus18
Cocircte drsquoIvoire 17 14 minus17 26 29 10 240 230 00
Congo Dem Rep
Djibouti 50 26 minus58 03 02 minus36 350 280 minus20
Equatorial Guinea
Eritrea 64 65 01 21 31 36 340 350 minus02
Ethiopia 62 41 minus37 362 326 minus09 390 320 minus17
Gabon 140 140 minus04
Gambia 23 19 minus17 03 03 00 250 240 05
Ghana 13 5 minus83 23 11 minus65 210 180 minus23
Guinea 19 16 minus15 15 16 06 270 260 minus02
Guinea-Bissau 26 22 minus15 03 03 00 260 250 00
Kenya 32 33 03 90 124 30 250 260 02
Lesotho 16 14 minus12 03 03 00 220 220 00
Liberia 32 32 00 07 11 42 330 330 02
Madagascar 26 25 minus04 35 47 27 250 250 05
Malawi 36 27 minus26 38 39 02 310 280 minus08
Mali 25 12 minus65 25 15 minus45 260 220 minus13
Mauritania 9 8 minus11 02 02 00 210 210 minus03
Mauritius 7 5 minus30 01 01 00 190 180 minus03
Mozambique 47 38 minus19 78 83 06 360 330 minus12
Namibia 30 18 minus45 05 04 minus20 250 220 minus08
Niger 37 16 minus73 35 23 minus37 300 240 minus14
Nigeria 10 6 minus45 109 94 minus13 200 180 minus12
Rwanda 53 32 minus45 30 30 00 360 300 minus06
Senegal 26 19 minus28 23 23 00 240 220 minus03
Seychelles 10 8 minus20 00 00 160 150 minus04
Sierra Leone 39 35 minus10 16 19 16 360 340 minus07
Somalia
Sudan 29 22 minus25 93 88 minus05 260 240 minus12
South Africa 160 150 00
Swaziland 21 19 minus09 02 02 00 220 220 09
Tanzania Utd Rep 42 34 minus19 128 139 08 300 280 05
Togo 36 30 minus16 17 19 10 290 280 minus06
Uganda 23 22 minus04 49 67 29 240 240 00
Zambia 38 44 13 36 54 38 300 320 06
Zimbabwe 44 30 minus34 53 37 minus32 340 300 minus06
130
TABLE 15 Undernourishment (continued)Share of population undernourished Incidence of undernourishment Depth of hunger
pa millions millions pakcalcapday kcalcapday
pa
1995-97 2006-08 growth1995-97 -2006-08
1995-97 2006-08 growth1995-97 -2006-08
1995-97 2006-08 growth1995-97 -2006-08
ASIA 16 15 minus21 4909 5372 08 233 238 minus02
Central Asia 12 13 minus20 46 55 16 171 172 minus01
Kazakhstan 130 120 00
Kyrgyzstan 13 11 minus15 06 06 00 210 210 minus03
Tajikistan 42 26 minus43 24 18 minus26 270 230 minus05
Turkmenistan 9 7 minus23 04 03 minus26 180 180 00
Uzbekistan 5 11 74 12 28 80 160 180 07
East Asia 13 11 minus18 2194 2058 minus06 241 241 minus04
Brunei Darussalam 140 130 minus05
Cambodia 40 25 minus42 47 36 minus24 280 250 minus05
China 12 10 minus16 1417 1296 minus08 250 250 minus05
Indonesia 11 13 15 220 297 28 210 220 00
Korea DPR 30 35 14 66 84 22 250 270 10
Korea Republic of 120 130 00
Lao PDR 29 22 minus25 14 14 00 270 260 minus05
Malaysia 120 130 minus05
Mongolia 33 27 minus18 08 07 minus12 260 260 02
Myanmar
Philippines 20 13 minus38 141 118 minus16 250 240 minus07
Singapore
Thailand 18 16 minus11 111 107 minus03 240 240 minus07
Viet Nam 22 11 minus61 167 96 minus49 270 240 minus12
South Asia 20 20 minus11 2570 3174 19 232 246 00
Afghanistan
Bangladesh 41 26 minus41 542 414 minus24 330 290 minus04
Bhutan
India 17 19 10 1671 2246 27 220 240 00
Iran (Islamic Rep) 170 180 07
Maldives 9 10 10 00 00 180 190 07
Nepal 20 17 minus15 44 47 06 230 220 minus03
Pakistan 20 25 20 268 428 43 260 280 00
Sri Lanka 25 20 minus20 45 39 minus13 260 250 minus02
West Asia 24 24 minus42 99 85 minus14 173 169 minus02
Armenia 36 21 minus48 11 06 minus54 230 200 minus14
Azerbaijan 27 22 220 140 minus28
Bahrain
Cyprus 120 120 00
Georgia 19 6 minus99 10 03 minus104 200 160 minus39
Iraq
Jordan 5 02 170 150 00
Kuwait 5 5 00 01 01 00 180 190 minus12
Lebanon 160 170 04
Occupied PalestinianTerritory
10 21 70 03 08 93 160 190
Saudi Arabia 130 130 minus05
Syrian Arab Republic 160 170 04
Turkey 160 160 04
United Arab Emirates 130 140 05
Yemen 31 30 minus03 50 67 27 260 260 02
LATIN AMERICA amp THECARIBBEAN
14 11 minus19 480 416 minus13 212 203 minus03
Argentina 120 130 00
Bahamas 8 6 minus26 00 00 160 160 00
Barbados 140 140 05
Belize 8 5 minus42 00 00 180 170 00
Bolivia (Plur State) 24 27 11 19 25 25 230 240 00
Brazil 10 6 minus45 166 117 minus31 240 220 minus05
Chile 150 140 minus08
Colombia 11 9 minus18 40 41 02 210 210 minus03
Costa Rica 150 150 04
131
TABLE 15 Undernourishment (continued)Share of population undernourished Incidence of undernourishment Depth of hunger
pa millions millions pakcalcapday kcalcapday
pa
1995-97 2006-08 growth1995-97 -2006-08
1995-97 2006-08 growth1995-97 -2006-08
1995-97 2006-08 growth1995-97 -2006-08
Cuba 14 15 190 120 minus18
Dominica 150 150 00
Dominican Republic 26 24 minus07 21 23 08 240 230 minus03
Ecuador 16 15 minus06 18 20 10 190 190 minus03
El Salvador 12 9 minus26 07 06 minus14 200 190 minus03
French Guiana
Grenada 18 21 14 00 00 240 250 08
Guatemala 20 22 09 21 29 30 220 230 06
Guyana 11 8 minus29 01 01 00 200 190 minus12
Haiti 60 57 minus05 48 55 12 430 420 minus03
Honduras 16 12 minus26 09 09 00 240 230 minus05
Jamaica 6 5 minus16 02 01 minus61 170 170 minus07
Mexico 190 190 00
Netherlands Antilles 150 150 minus11
Nicaragua 38 19 minus61 18 11 minus44 310 260 minus18
Panama 20 15 minus26 06 05 minus16 230 220 minus03
Paraguay 10 10 00 05 06 17 200 210 minus03
Peru 21 16 minus24 50 45 minus10 230 220 minus08
St Kitts amp Nevis 16 16 00 00 00 220 220 06
St Lucia 7 8 12 00 00 180 190 00
St Vincent amp Grenadines 16 5 minus100 00 00 210 170 minus10
Suriname 13 15 13 01 01 00 200 200 00
Trinidad amp Tobago 14 11 minus22 02 02 00 220 220 03
Uruguay 140 140 minus04
Venezuela (Boliv Rep of) 14 7 minus61 31 19 minus44 190 170 minus04
OCEANIA 8 9 00 01 182 173 minus06
Fiji 5 00 170 160 minus07
French Polynesia 5 00 160 150 minus11
New Caledonia 9 8 minus11 00 00 210 210 03
Papua New Guinea
Samoa 10 00 180 150 minus11
Solomon Islands 13 11 minus15 00 01 190 190 minus06
Tonga
Vanuatu 9 00 200 180 minus07
DEVELOPED REGIONS 5 01 125 116 01
NORTH AMERICA 111 101 minus02
Bermuda 180 200 07
Canada 120 110 minus10
United States of America 110 100 minus06
ASIA amp OCEANIA 128 126 00
Australia 130 120 00
Israel 90 90 00
Japan 130 130 00
New Zealand 120 120 00
EUROPE 5 01 131 121 01
Albania 160 160 minus07
Belarus 120 130 05
Bosnia amp Herzegovina 150 140 minus12
Croatia 180 150 minus18
European Union 5 01 120 115 minus02
Iceland 130 120 minus05
Macedonia FYR 180 150 minus11
Montenegro 170
Norway 120 110 minus05
Republic of Moldova 190 190 07
Russian Federation 160 130 minus09
Serbia 170
Switzerland 120 120 00
Ukraine 150 130 minus05
132
TABLE 16 Dietary energy supplies and changes in dietary compositionDietary energy supply per person Contribution in diets by type Contribution in diets by commodity
carbo-hydrates
proteins fats cereals starchy roots pulses
kcalcapday kcalcapday
1990-92 2006-08 2005-07 2005-07 2005-07 1990-92 2005-07 1990-92 2005-07 1990-92 2005-07
WORLD 2583 2805 65 11 24 53 48 8 7 5 5
DEVELOPING REGIONS 2430 2664 67 11 22 58 53 9 8 5 5
AFRICA 2266 2495 72 10 18 49 49 22 20 5 5
North Africa 3035 3175 71 11 17 62 60 2 3 2 2
Algeria 2890 3090 70 11 19 57 56 2 3
Egypt 3090 3160 73 12 15 66 64 2 2
Libya 3180 3150 63 10 27 47 47 2 3
Morocco 3000 3260 72 11 17 62 60 2 2
Tunisia 3120 3330 64 11 24 55 50 2 2
Sub-Saharan Africa 2102 2351 72 10 19 47 47 24 22 5 6
Angola 1580 1960 70 9 21 29 36 30 26 3 3
Benin 2250 2510 72 9 19 41 40 34 31 4 5
Botswana 2260 2230 67 11 22 43 43 6 6 5 6
Burkina Faso 2460 2690 68 12 20 75 73 5 5
Burundi 1860 1680 82 11 7 17 19 29 32 27 19
Cameroon 2020 2240 72 10 18 39 42 20 17 2 6
Cape Verde 2370 2530 63 11 26 50 45 4 4 4 3
Central African Republic 1880 1960 61 9 29 20 25 37 31
Chad 1700 2010 64 12 24 52 57 13 8 2 4
Comoros 1900 1840 69 9 22 41 38 17 15 6 9
Congo 1970 2570 69 8 23 19 26 41 34
Cocircte drsquoIvoire 2470 2500 74 8 18 35 33 31 33
Congo Dem Rep 80 6 14 16 23 57 55
Djibouti 1720 2300 63 10 27 52 52 2 3
Equatorial Guinea
Eritrea 1530 1590 73 12 15 72 74 5 3 8 5
Ethiopia 1550 1950 79 11 10 67 66 15 13 6 7
Gabon 2520 2710 69 12 19 25 33 21 17
Gambia 2470 2330 64 9 27 55 56
Ghana 2120 2900 77 8 15 32 29 39 37
Guinea 2420 2550 70 9 22 50 47 14 14
Guinea-Bissau 2290 2270 71 8 21 61 59 8 9
Kenya 1970 2030 68 11 21 47 49 8 5 6 7
Lesotho 2370 2460 77 11 12 76 78 2 3
Liberia 2220 2200 70 7 24 45 43 22 23
Madagascar 2200 2130 78 9 13 52 59 22 19
Malawi 1870 2150 77 10 13 69 59 4 15 7 6
Mali 2180 2590 70 11 19 69 67 1 3
Mauritania 2580 2810 63 12 25 55 51 4 4
Mauritius 2760 2930 62 11 26 48 46 3 3
Mozambique 1750 2070 76 7 17 34 40 41 37
Namibia 2060 2360 68 11 21 48 46 14 14 4 3
Niger 1970 2390 68 13 19 74 60 6 14
Nigeria 2310 2710 69 9 22 47 45 20 19 3 3
Rwanda 1830 2090 82 10 9 18 18 30 36 15 12
Senegal 2190 2280 65 10 25 64 60 1 3
Seychelles 2280 2400 60 14 26 46 41
Sierra Leone 1950 2120 67 10 24 55 50 5 10 4 5
Somalia
Sudan 1960 2280 61 13 26 57 50 2 3
South Africa 2820 3000 65 11 24 53 54
Swaziland 2380 2290 68 11 21 52 50 5 5
Tanzania Utd Rep 2080 2020 75 10 15 47 46 24 17 5 7
Togo 1890 2150 71 9 20 48 49 28 25 2 4
Uganda 2280 2220 74 9 17 19 23 25 23 9 8
Zambia 2010 1880 73 10 17 65 61 13 14
Zimbabwe 1980 2210 66 10 24 62 56 2 2
133
TABLE 16 Dietary energy supplies and changes in dietary composition (continued)Dietary energy supply per person Contribution in diets by type Contribution in diets by commodity
carbo-hydrates
proteins fats cereals starchy roots pulses
kcalcapday kcalcapday
1990-92 2006-08 2005-07 2005-07 2005-07 1990-92 2005-07 1990-92 2005-07 1990-92 2005-07
ASIA 2434 2667 67 11 22 63 56 6 5 5 5
Central Asia 2715 2793 64 12 25 59 54 4 6
Kazakhstan 3280 3510 61 12 27 57 43 4 6
Kyrgyzstan 2400 2660 68 12 20 57 48 5 8
Tajikistan 2020 2190 64 10 26 63 63
Turkmenistan 2550 2740 65 13 23 57 61
Uzbekistan 2650 2560 64 12 25 59 57
East Asia 2508 2872 64 11 24 63 53 7 5 3 6
Brunei Darussalam 2730 2980 64 12 25 48 45
Cambodia 1870 2180 75 10 14 82 72 2 4
China 2580 2990 61 12 27 63 50 7 5
Indonesia 2390 2550 73 9 18 66 63 7 6
Korea DPR 2340 2110 74 11 15 60 62 3 7 6 5
Korea Republic of 2970 3040 63 11 25 54 44
Lao PDR 2010 2240 76 11 13 78 70 6 4
Malaysia 2720 2890 63 11 26 42 47 3 2
Mongolia 2080 2240 56 13 32 42 46 2 4
Myanmar 67 11 22 73 59 2 6
Philippines 2230 2580 73 9 18 53 57 4 3
Singapore
Thailand 2250 2540 71 9 20 57 49
Viet Nam 2090 2780 70 10 19 76 66
South Asia 2279 2374 71 10 19 65 60 2 3 5 5
Afghanistan
Bangladesh 1960 2270 80 9 12 84 78 1 3
Bhutan
India 2290 2360 71 10 19 64 60 5 5
Iran (Islamic Rep) 2970 3050 69 11 20 60 53 3 4
Maldives 2400 2550 60 16 23 46 35
Nepal 2190 2340 74 10 15 74 69 3 5 3 3
Pakistan 2210 2280 63 10 27 55 47 3 3
Sri Lanka 2170 2370 73 9 18 56 56 4 2 3 3
West Asia 2963 3067 64 11 25 51 49 3 3 4 3
Armenia 1920 2260 64 12 24 59 44 8 5
Azerbaijan 2160 3020 73 11 16 66 60 2 6
Bahrain
Cyprus 3120 3190 48 12 41 28 21 3 3
Georgia 1850 2730 67 11 22 57 50 5 3
Iraq
Jordan 2840 3000 63 10 27 50 46 3 2
Kuwait 2350 3030 58 12 30 39 42 2 2
Lebanon 3010 3090 58 11 32 34 34 3 6 4 3
Occupied PalestinianTerritory
2080 66 11 23 0 51
Saudi Arabia 2850 3120 64 11 25 48 48
Syrian Arab Republic 2830 3040 59 10 30 50 45
Turkey 3590 3500 62 11 27 51 48 3 3 4 3
United Arab Emirates 3160 3170 63 13 24 33 43 3 4
Yemen 1980 2050 69 11 20 66 61 3 3
LATIN AMERICA amp THECARIBBEAN
2664 2915 62 11 27 39 37 6 6 5 5
Argentina 3010 3030 55 13 32 32 31 3 3
Bahamas 2610 2710 57 12 30 27 27 2 2
Barbados 3040 3020 59 12 29 30 27 3 3
Belize 2510 2710 67 11 23 37 39 4 4
Bolivia (Plur State) 2030 2100 71 11 18 43 47 9 7
Brazil 2760 3120 59 11 30 33 32 5 5 5 5
Chile 2600 2960 61 12 27 43 40 4 4
Colombia 2410 2690 66 10 24 33 34 8 6
Costa Rica 2820 2820 62 11 27 32 31 3 4
134
TABLE 16 Dietary energy supplies and changes in dietary composition (continued)Dietary energy supply per person Contribution in diets by type Contribution in diets by commodity
carbo-hydrates
proteins fats cereals starchy roots pulses
kcalcapday kcalcapday
1990-92 2006-08 2005-07 2005-07 2005-07 1990-92 2005-07 1990-92 2005-07 1990-92 2005-07
Cuba 2720 3420 73 10 17 34 40 5 7 4 7
Dominica 3000 3090 64 12 24 26 25 7 9
Dominican Republic 2160 2270 61 9 30 30 29 5 4
Ecuador 2110 2300 55 10 35 35 34
El Salvador 2400 2580 67 11 22 56 44 1 2 4 6
French Guiana
Grenada 2470 2400 54 12 34 28 22 2 3 3 3
Guatemala 2290 2150 67 11 23 58 51 6 4
Guyana 2300 2740 68 11 21 53 46 4 4 3 2
Haiti 1730 1850 74 9 17 44 46 11 9 8 5
Honduras 2300 2610 66 10 24 51 44 4 5
Jamaica 2510 2840 61 11 28 34 32 9 5
Mexico 3090 3260 62 11 26 47 44 4 4
Netherlands Antilles 3280 3260 64 11 24 36 36 4 3
Nicaragua 1770 2420 68 10 22 47 50 8 7
Panama 2320 2450 65 12 24 39 43 2 2
Paraguay 2390 2660 58 11 32 27 29 18 13 4 5
Peru 2110 2410 74 11 15 49 44 8 14 2 3
St Kitts amp Nevis 2580 2460 59 12 29 32 26 3 2 2 2
St Lucia 2580 2710 58 14 28 30 28 6 2
St Vincent amp Grenadines 2360 2860 64 11 25 30 33 7 5 2 2
Suriname 2440 2460 68 9 23 50 42 2 2
Trinidad amp Tobago 2610 2700 65 10 25 39 34 2 2 4 3
Uruguay 2660 2840 64 11 25 35 43 4 4
Venezuela (Boliv Rep of) 2460 2650 64 11 26 36 37 3 3
OCEANIA 2549 2850 60 10 30 32 34 15 14 3 2
Fiji 2640 3000 60 10 29 43 41 4 7 3 2
French Polynesia 2480 2880 48 14 39 25 31 5 4
New Caledonia 3210 3150 52 12 35 35 32 6 5
Papua New Guinea
Samoa 2550 2890 46 11 43 23 18 10 10
Solomon Islands 2120 2400 73 9 18 25 34 40 34 3 3
Tonga
Vanuatu 2530 2950 60 9 31 22 31 22 18
DEVELOPED REGIONS 3260 3426 53 12 35 29 28 5 5
NORTH AMERICA 3464 3728 49 12 38 23 22 3 3
Bermuda 2870 2650 48 12 40 19 24
Canada 3050 3530 51 12 37 21 25 4 4
United States of America 3510 3750 49 12 38 23 22 3 3
ASIA amp OCEANIA 2969 2892 56 13 31 36 35 3 3
Australia 3130 3220 46 13 40 22 22 3 3
Israel 3410 3530 49 14 37 35 33 2 2
Japan 2920 2800 58 13 29 39 38
New Zealand 2810 2810 54 12 34 23 24 3 4
EUROPE 3228 3401 54 12 34 30 30 6 5
Albania 2560 2890 58 14 29 57 40 1 2
Belarus 3180 3150 56 12 32 37 30 10 11
Bosnia amp Herzegovina 2670 3080 67 11 21 61 45 5 5
Croatia 2420 2990 57 11 32 30 31 7 4
European Union 3341 3453 51 12 37 26 28 5 4
Iceland 3090 3260 45 16 39 23 20 3 3
Macedonia FYR 2550 3060 55 10 34 44 34 3 3
Montenegro
Norway 3230 3450 51 12 36 27 28 5 4
Republic of Moldova 2880 2850 70 11 20 55 48 5 5
Russian Federation 2960 3320 63 12 25 40 36 8 7
Serbia
Switzerland 3370 3450 49 11 41 22 21
Ukraine 3040 3290 63 11 26 43 36 8 8
135
TABLE 17 Changes in dietary compositionContribution in diets by commodity
meat and fish dairy and eggs fruit and vegetables sugar vegetable oils other
1990-92 2005-07 1990-92 2005-07 1990-92 2005-07 1990-92 2005-07 1990-92 2005-07 1990-92 2005-07
WORLD 8 11 5 5 4 5 8 8 8 9 11 13
DEVELOPING REGIONS 7 10 4 4 4 5 7 7 7 8 10 12
AFRICA 4 4 5 6 6 6 6 6 9 9 11 11
North Africa 3 3 3 3 6 7 10 9 9 7 7 9
Algeria 3 3 6 6 3 5 9 9 14 10 6 8
Egypt 2 3 2 2 7 9 10 8 6 4 5 8
Libya 5 4 5 5 8 7 12 10 14 16 7 8
Morocco 3 3 4 6 10 11 8 8 11 10
Tunisia 3 3 4 5 6 6 9 10 15 14 6 10
Sub-Saharan Africa 4 4 7 7 6 6 5 5 9 9 12 12
Angola 5 5 7 8 14 12 12 10
Benin 2 2 6 8 13 14
Botswana 6 4 9 7 11 13 6 9 14 12
Burkina Faso 3 3 4 5 13 14
Burundi 10 15 17 15
Cameroon 3 3 10 8 3 4 8 8 15 12
Cape Verde 6 9 5 8 2 2 7 9 10 8 12 12
Central African Republic 7 8 4 4 3 4 14 14 15 14
Chad 4 4 5 5 24 22
Comoros 8 7 4 6 8 11 16 14
Congo 4 3 5 4 4 6 12 15 15 12
Cocircte drsquoIvoire 8 7 4 4 10 11 12 12
Congo Dem Rep 7 3 7 7 13 12
Djibouti 5 6 5 5 19 11 10 16 7 7
Equatorial Guinea
Eritrea 1 4 4 6 10 8
Ethiopia 3 2 2 3 7 9
Gabon 8 8 16 12 6 6 5 6 19 18
Gambia 2 2 17 12 13 17 13 13
Ghana 7 11 3 4 7 7 12 12
Guinea 13 10 4 5 11 14 8 10
Guinea-Bissau 4 4 4 3 1 6 13 12 9 7
Kenya 8 7 4 5 10 9 8 8 9 10
Lesotho 4 4 7 6 11 9
Liberia 4 4 2 3 16 19 11 8
Madagascar 6 4 3 3 3 3 3 4 11 8
Malawi 4 5 7 5 9 10
Mali 3 3 5 5 4 5 9 7 9 10
Mauritania 5 5 11 10 10 12 9 12 6 6
Mauritius 4 6 6 6 2 4 14 12 14 15 9 8
Mozambique 1 4 13 9 11 10
Namibia 6 6 4 5 16 10 2 7 6 9
Niger 4 5 3 3 2 3 3 5 8 10
Nigeria 3 3 2 3 13 13 12 14
Rwanda 21 18 2 4 14 12
Senegal 3 3 2 2 7 6 13 15 10 11
Seychelles 10 11 6 4 5 7 14 10 7 8 12 19
Sierra Leone 3 3 20 15 13 17
Somalia
Sudan 4 5 12 17 8 10 7 5 10 10
South Africa 8 9 3 3 12 10 8 12 16 12
Swaziland 5 6 4 5 3 3 15 13 7 6 9 12
Tanzania Utd Rep 3 6 3 5 5 7 13 12
Togo 9 10 13 12
Uganda 20 17 1 4 3 7 23 18
Zambia 3 3 8 6 4 6 7 10
Zimbabwe 3 4 11 12 8 10 14 16
136
TABLE 17 Changes in dietary composition (continued)Contribution in diets by commodity
meat and fish dairy and eggs fruit and vegetables sugar vegetable oils other
1990-92 2005-07 1990-92 2005-07 1990-92 2005-07 1990-92 2005-07 1990-92 2005-07 1990-92 2005-07
ASIA 8 12 3 4 3 4 6 6 7 8 9 12
Central Asia 7 7 9 10 2 4 5 6 9 9 8 9
Kazakhstan 10 9 8 13 1 3 6 9 5 8 9 9
Kyrgyzstan 11 7 12 12 2 4 6 9 4 5 3 7
Tajikistan 3 4 6 5 6 7 11 11 11 10
Turkmenistan 7 10 8 9 2 3 6 4 11 6 9 7
Uzbekistan 6 6 9 9 3 4 4 3 12 11 7 10
East Asia 9 14 1 2 3 5 4 4 6 7 9 13
Brunei Darussalam 9 8 7 9 5 5 12 13 7 8 12 12
Cambodia 5 5 1 4 2 3 8 12
China 9 15 1 2 3 6 3 2 6 7 8 13
Indonesia 2 3 6 6 7 8 12 14
Korea DPR 5 5 8 7 5 6 13 8
Korea Republic of 7 11 7 8 10 11 8 12 14 14
Lao PDR 4 5 2 5 1 2 9 14
Malaysia 12 11 4 3 3 3 13 12 14 12 9 10
Mongolia 30 17 8 11 8 6 1 6 9 10
Myanmar 2 6 2 2 3 6 10 9 8 12
Philippines 10 12 6 6 12 9 6 4 9 9
Singapore
Thailand 8 9 5 4 8 14 5 6 17 18
Viet Nam 6 12 4 5 3 4 2 3 9 10
South Asia 2 4 4 5 2 3 9 8 7 9 9 11
Afghanistan
Bangladesh 3 4 4 7 8 8
Bhutan
India 4 4 2 2 9 8 7 9 9 12
Iran (Islamic Rep) 3 5 3 3 8 12 9 9 9 7 5 7
Maldives 10 17 3 7 4 9 17 13 7 7 13 12
Nepal 3 4 1 2 6 7 10 10
Pakistan 2 3 9 12 12 12 10 11 9 12
Sri Lanka 3 3 3 2 11 11 3 4 17 19
West Asia 5 6 6 6 9 7 9 10 10 12 9 10
Armenia 6 8 7 10 8 13 4 8 2 5 6 7
Azerbaijan 5 4 7 6 5 3 6 6 1 4 8 11
Bahrain
Cyprus 12 13 10 10 8 7 12 13 13 15 14 18
Georgia 7 5 7 10 7 14 2 7 15 11
Iraq
Jordan 5 5 5 5 3 2 15 15 11 15 8 10
Kuwait 11 11 8 5 7 7 12 11 11 12 10 10
Lebanon 5 7 4 5 15 9 11 11 14 14 10 11
Occupied PalestinianTerritory
0 5 0 5 100 8 0 12 0 10 0 9
Saudi Arabia 7 7 5 5 10 10 10 10 13 12 7 8
Syrian Arab Republic 4 4 6 7 4 3 12 13 12 12 12 16
Turkey 6 6 8 8 8 8 11 14 9 10
United Arab Emirates 11 10 9 5 12 9 11 12 9 6 12 11
Yemen 3 4 2 3 10 12 9 10 7 7
LATIN AMERICA amp THECARIBBEAN
7 10 6 6 5 5 16 14 10 11 11 11
Argentina 17 17 8 9 14 16 11 11 15 13
Bahamas 18 17 7 6 9 9 16 15 3 6 18 18
Barbados 16 15 7 7 3 7 16 19 10 9 15 13
Belize 8 8 7 6 8 8 15 15 3 4 18 16
Bolivia (Plur State) 9 10 2 2 7 6 14 13 4 3 12 12
Brazil 8 12 6 7 4 4 17 13 13 13 9 9
Chile 9 14 6 5 3 3 15 14 9 8 11 12
Colombia 7 7 7 8 7 7 19 17 9 11 10 10
Costa Rica 5 5 8 10 6 5 21 19 12 12 13 14
137
TABLE 17 Changes in dietary composition (continued)Contribution in diets by commodity
meat and fish dairy and eggs fruit and vegetables sugar vegetable oils other
1990-92 2005-07 1990-92 2005-07 1990-92 2005-07 1990-92 2005-07 1990-92 2005-07 1990-92 2005-07
Cuba 6 5 6 3 4 6 21 15 9 6 11 11
Dominica 10 11 9 9 11 12 15 14 8 5 14 15
Dominican Republic 6 9 5 4 13 9 15 16 15 16 11 13
Ecuador 6 10 7 7 11 10 9 8 18 17 14 14
El Salvador 2 4 5 7 4 4 15 15 5 6 8 12
French Guiana
Grenada 10 15 10 9 8 7 17 16 9 11 13 14
Guatemala 2 4 3 3 2 3 17 15 6 9 6 11
Guyana 3 6 3 6 1 3 14 13 4 7 15 13
Haiti 3 4 8 6 10 12 5 7 11 11
Honduras 3 6 5 7 5 6 16 17 9 9 7 6
Jamaica 7 8 4 6 5 7 20 16 10 12 11 14
Mexico 6 9 5 5 3 4 16 15 8 8 11 11
Netherlands Antilles 15 13 8 6 10 18 7 6 20 18
Nicaragua 3 4 4 5 14 15 9 9 15 10
Panama 6 8 7 7 5 4 14 12 11 8 16 16
Paraguay 12 9 4 4 4 3 9 9 8 12 14 16
Peru 3 4 3 4 4 6 12 9 5 5 14 11
St Kitts amp Nevis 11 13 8 8 2 3 15 17 13 11 14 18
St Lucia 16 20 8 8 8 7 14 13 3 5 15 17
St Vincent amp Grenadines 11 12 5 5 4 6 18 17 9 8 14 12
Suriname 7 8 7 6 15 18 7 12 12 12
Trinidad amp Tobago 5 7 6 7 3 3 19 21 11 10 11 13
Uruguay 20 10 10 7 2 3 11 13 6 8 12 12
Venezuela (Boliv Rep of) 6 9 6 4 7 4 15 16 15 14 12 13
OCEANIA 11 10 6 7 4 4 7 8 8 8 22 21
Fiji 12 11 7 10 12 10 19 19
French Polynesia 18 19 6 6 2 2 11 7 9 11 24 20
New Caledonia 11 10 7 8 2 3 11 8 12 13 16 21
Papua New Guinea
Samoa 19 17 5 8 9 9 2 7 32 31
Solomon Islands 4 3 4 4 2 4 22 18
Tonga
Vanuatu 10 8 6 5 4 6 6 5 30 27
DEVELOPED REGIONS 11 11 9 9 4 4 13 13 12 14 19 18
NORTH AMERICA 12 12 11 10 3 3 17 17 16 18 16 15
Bermuda 19 17 6 6 11 6 11 14 10 12 24 21
Canada 11 10 8 6 7 6 14 14 14 16 21 19
United States of America 12 12 11 10 3 3 17 17 16 18 15 15
ASIA amp OCEANIA 12 12 8 7 3 4 12 10 11 14 18 17
Australia 15 15 12 10 3 4 15 13 13 16 17 17
Israel 8 12 7 6 9 9 12 7 14 19 13 12
Japan 12 12 7 7 3 3 11 10 10 13 18 17
New Zealand 13 15 9 4 7 8 16 17 7 7 22 21
EUROPE 11 10 9 9 5 5 11 12 10 12 20 19
Albania 4 8 12 18 5 10 6 7 8 6 7 9
Belarus 11 11 11 7 1 3 10 11 4 11 16 16
Bosnia amp Herzegovina 4 4 6 10 5 8 4 6 2 6 13 16
Croatia 6 7 10 11 4 4 17 13 8 13 18 17
European Union 12 11 9 9 5 5 11 11 12 14 22 19
Iceland 17 21 14 16 3 4 18 13 5 6 17 17
Macedonia FYR 9 7 5 6 8 7 12 12 5 14 14 17
Montenegro
Norway 14 14 11 9 3 4 13 12 10 11 17 18
Republic of Moldova 5 4 8 11 2 2 9 12 5 6 11 12
Russian Federation 10 8 8 8 12 13 5 9 17 19
Serbia
Switzerland 16 14 12 11 4 3 13 17 11 13 22 21
Ukraine 7 6 8 9 13 15 7 10 14 16
138
TABLE 18 Health effects of malnutritionShare of children under 5 share of
lowweightnewborns
Share of adults Dietaryironsupply
underweightstunted wasted total with
low BMIwomenwith lowBMI
overweight or obese per person
male female mg day
2009 2009 2009 2009 2009 2009 2009 2009 2005-07
WORLD 18 28 9 13 91 129 145
DEVELOPING REGIONS 20 30 10 14 64 107 144
AFRICA 22 39 10 111 65 135 152
North Africa 7 24 7 10 172 361 163
Algeria 4 16 4 6 107 243 136
Egypt 7 31 8 13 16 225 463 177
Libya 6 21 7 215 413 140
Morocco 10 23 11 53 73 111 231 163
Tunisia 3 9 3 5 139 334 157
Sub-Saharan Africa 25 42 11 126 44 92 150
Angola 28 51 8 38 102 98
Benin 20 45 8 15 92 35 95 154
Botswana 11 29 6 13 30 228 147
Burkina Faso 26 35 11 16 208 17 30 242
Burundi 39 63 8 11 28 37 135
Cameroon 17 36 7 11 67 70 151 158
Cape Verde 6 63 153 121
Central African Republic 22 45 11 13 153 20 53 123
Chad 37 45 16 22 203 24 38 180
Comoros 25 7 13 25 105 35 53 92
Congo 12 31 8 13 132 28 75 120
Cocircte drsquoIvoire 17 40 9 17 82 39 97 111
Congo Dem Rep 28 46 14 185 07 30 84
Djibouti 30 33 26 10 67 138 102
Equatorial Guinea 11 35 3 79 148
Eritrea 35 44 15 14 13 23 132
Ethiopia 35 51 12 20 09 16 154
Gabon 9 26 4 66 84 215 155
Gambia 16 28 7 20 23 144 113
Ghana 14 29 9 13 164 86 44 117 140
Guinea 23 39 11 132 43 51 107
Guinea-Bissau 17 48 9 26 81 91
Kenya 16 35 7 8 123 25 68 134
Lesotho 17 45 6 57 31 266 164
Liberia 20 39 8 14 100 31 77 117
Madagascar 37 53 15 16 192 18 15 113
Malawi 16 53 4 14 92 26 62 162
Mali 28 39 15 135 24 68 187
Mauritania 23 29 13 130 43 233 133
Mauritius 15 10 14 14 129 230 132
Mozambique 21 47 5 15 86 26 78 88
Namibia 18 30 8 16 159 43 168 140
Niger 40 55 12 192 15 37 235
Nigeria 27 41 14 12 122 51 90 196
Rwanda 18 52 5 6 98 49 40 174
Senegal 15 20 9 19 182 32 125 113
Seychelles 6 5 2 151 337 153
Sierra Leone 21 37 11 14 112 36 101 114
Somalia 33 42 13 34 71
Sudan 32 38 21 41 89 157
South Africa 86 232 428 143
Swaziland 6 30 3 9 32 61 371 138
Tanzania Utd Rep 17 44 4 104 40 68 147
Togo 22 28 16 109 30 61 131
Uganda 16 39 6 14 121 43 49 145
Zambia 15 46 6 11 96 12 70 113
Zimbabwe 14 36 7 99 92 28 138 143
139
TABLE 18 Health effects of malnutrition (continued)Share of children under 5 share of
lowweightnewborns
Share of adults Dietaryironsupply
underweightstunted wasted total with
low BMIwomenwith lowBMI
overweight or obese per person
male female mg day
2009 2009 2009 2009 2009 2009 2009 2009 2005-07
ASIA 22 30 11 15 45 75 143
Central Asia 7 21 5 6 68 150 206 113
Kazakhstan 7 18 4 6 74 202 274 133
Kyrgyzstan 3 18 3 5 37 69 117 216 120
Tajikistan 15 33 9 10 80 116 127
Turkmenistan 12 22 6 4 99 139 145 98
Uzbekistan 4 20 5 5 59 145 198 99
East Asia 9 19 5 4 43 67 174
Brunei Darussalam 85 72 174
Cambodia 29 40 9 9 161 16 28 104
China 5 14 3 3 80 46 65 200
Indonesia 20 40 15 25 69 102
Korea DPR 18 45 9 37 39 156
Korea Republic of 1 3 1 47 65 69 77 218
Lao PDR 32 48 7 11 135 145 17 41 121
Malaysia 17 21 15 11 96 104 179 158
Mongolia 5 28 3 5 49 39 119 207 111
Myanmar 30 41 11 20 61 124
Philippines 21 32 7 21 123 142 45 83 99
Singapore 3 4 4 8 92 146 66 62
Thailand 7 16 5 192 49 118 117
Viet Nam 20 1 10 5 265 12 20 130
South Asia 40 46 18 27 329 21 42 106
Afghanistan 33 59 9 15 33
Bangladesh 41 43 18 297 10 13 81
Bhutan 12 38 5 9 47 66
India 44 48 20 28 329 356 13 25 108
Iran (Islamic Rep) 10 20 6 7 57 54 136 295 135
Maldives 18 20 10 65 261 177
Nepal 39 49 13 21 244 14 16 152
Pakistan 31 42 14 32 312 316 35 84 89
Sri Lanka 22 19 12 17 162 26 73 118
West Asia 10 23 6 224 356 144
Armenia 4 18 5 7 52 144 302 118
Azerbaijan 8 27 7 10 48 158 321 120
Bahrain 8 14 7 289 382
Cyprus 43 69 248 219 188
Georgia 2 15 3 5 159 257 105
Iraq 7 28 6 15 223 362
Jordan 2 8 2 13 30 39 273 417 112
Kuwait 2 4 2 7 25 07 372 524 172
Lebanon 4 17 7 264 297 161
Occupied PalestinianTerritory
2 12 2 102
Saudi Arabia 5 9 12 70 49 295 435 159
Syrian Arab Republic 10 28 12 9 238 390 133
Turkey 4 16 1 11 35 16 228 356 158
United Arab Emirates 302 430 196
Yemen 43 58 15 252 105 227 103
LATIN AMERICA amp THECARIBBEAN
4 14 2 8 30 190 279 140
Argentina 2 8 1 7 34 274 310 122
Bahamas 11 267 426 174
Barbados 5 10 4 14 32 33 216 442 192
Belize 5 22 2 14 244 454 167
Bolivia (Plur State) 5 27 1 6 20 100 271 102
Brazil 2 7 2 8 40 35 165 221 137
Chile 1 2 0 08 11 245 336 138
Colombia 3 13 1 6 39 119 237 112
Costa Rica 1 6 1 7 209 283 140
140
TABLE 18 Health effects of malnutrition (continued)Share of children under 5 share of
lowweightnewborns
Share of adults Dietaryironsupply
underweightstunted wasted total with
low BMIwomenwith lowBMI
overweight or obese per person
male female mg day
2009 2009 2009 2009 2009 2009 2009 2009 2005-07
Cuba 5 73 62 133 275 186
Dominica 10 101 391 177
Dominican Republic 3 10 2 11 144 293 100
Ecuador 6 29 2 10 19 157 282 81
El Salvador 7 21 2 29 202 329 157
French Guiana
Grenada 9 149 321 137
Guatemala 13 48 1 20 138 267 131
Guyana 11 18 8 83 271 127
Haiti 19 30 10 155 84 84 99
Honduras 9 30 1 10 40 129 263 140
Jamaica 3 5 5 100 382 150
Mexico 4 15 2 8 14 267 384 178
Netherlands Antilles 128
Nicaragua 6 23 2 37 168 313 136
Panama 6 22 1 10 36 194 321 117
Paraguay 3 18 1 162 223 139
Peru 5 28 1 19 111 217 158
St Kitts amp Nevis 11 320 494 153
St Lucia 12 15 8 11 119 319 158
St Vincent amp Grenadines 8 164 335 130
Suriname 8 11 5 11 165 346 98
Trinidad amp Tobago 4 5 5 19 216 380 134
Uruguay 6 14 3 8 207 260 113
Venezuela (Boliv Rep of) 4 16 5 8 266 348 114
OCEANIA 17 42 4 11 158 265
Fiji 10 61 56 213 422 179
French Polynesia 195
New Caledonia 183
Papua New Guinea 18 44 4 11 118 201
Samoa 2 4 1 453 667 175
Solomon Islands 16 34 7 13 19 253 392 137
Tonga 3 491 703
Vanuatu 12 26 6 10 19 29 229 368 167
DEVELOPED REGIONS 216 230 149
NORTH AMERICA 1 4 1 296 323 142
Bermuda 148
Canada 26 246 239 165
United States of America 1 4 1 24 302 332 139
ASIA amp OCEANIA 3 8 1 94 96 82 191
Australia 7 10 28 252 249 149
Israel 8 232 276 197
Japan 3 8 1 115 108 55 35 199
New Zealand 6 13 16 262 277 152
EUROPE 205 219 144
Albania 6 23 9 217 205 128
Belarus 1 5 2 4 197 264 148
Bosnia amp Herzegovina 2 12 4 5 227 253 202
Croatia 0 1 2 5 02 228 194 116
European Union 215 196 148
Iceland 4 23 30 234 203 208
Macedonia FYR 2 12 3 6 216 189 130
Montenegro 2 8 4 228 207
Norway 5 50 70 216 179 158
Republic of Moldova 3 11 5 6 59 100 288 142
Russian Federation 6 184 298 134
Serbia 2 8 5 6 255 203
Switzerland 35 59 183 116 126
Ukraine 4 23 8 4 54 155 236 127
141
TABLE 19 Trade and food security - caloric self-sufficiencyCaloric self-sufficiency
pa
1970 1980 1990 2000 2009 growth1970-2009
WORLD 1002 1002 1002 1002 1006 00
DEVELOPING REGIONS 997 968 983 964 948 minus04
AFRICA 1021 883 866 821 822 minus06
North Africa 901 638 660 668 761 minus13
Algeria 860
Egypt 930 602 605 668 827 minus03
Libya
Morocco 939 721 813 643 minus10
Tunisia 703 669 612 608 minus04
Sub-Saharan Africa 1044 957 962 920 873 minus06
Angola 1137 697 652 731 779 minus10
Benin 1107 1022 898 992 909 minus05
Botswana
Burkina Faso 1004 967 941 911 922 minus02
Burundi 985 968 981 971 891 minus03
Cameroon 1037 997 977 926 888 minus04
Cape Verde
Central African Republic 964 981 937 951 924 minus01
Chad 968 984 952 970 930 minus01
Comoros 901 825 701 783 692 minus07
Congo 1272 799 880 607 908 minus09
Cocircte drsquoIvoire 1044 1074 1205 1203 1092 01
Congo Dem Rep 1025 962 961 953 879 minus04
Djibouti
Equatorial Guinea 1483 1049 879 835 694 minus19
Eritrea 678
Ethiopia 899 908
Gabon 851 802 763 630 588 minus09
Gambia 1462 1241 703 638 535 minus25
Ghana 1041 990 977 986 939 minus03
Guinea 977 914 863 879 879 minus03
Guinea-Bissau 1055 950 881 871 1048 minus00
Kenya 1004 901 899 742 610 minus13
Lesotho 712 535 536
Liberia 878 823 855 654 707 minus06
Madagascar 1047 975 981 900 918 minus03
Malawi 970 1077 944 994 989 00
Mali 971 970 969 939 940 minus01
Mauritania 682
Mauritius 1057 815
Mozambique 1148 928 811 866 824 minus08
Namibia 691 650 555 564 minus05
Niger 1199 991 941 882 945 minus06
Nigeria 1049 871 982 940 900 minus04
Rwanda 982 977 951 927 890 minus03
Senegal 1095 839 866 817 686 minus12
Seychelles 1055 547
Sierra Leone 946 888 840 751 898 minus01
Somalia 921 765 851 693 524 minus14
Sudan 998 1027 935 923 795 minus06
South Africa 1173 1325 1107 980 940 minus06
Swaziland 2814 1201 minus22
Tanzania Utd Rep 1027 947 1001 902 914 minus03
Togo 1066 966 910 940 840 minus06
Uganda 1010 979 999 965 933 minus02
Zambia 797 711 901 976 1005 06
Zimbabwe 1242 1039 1307 1094 538 minus21
142
TABLE 19 Trade and food security - caloric self-sufficiency (continued)Caloric self-sufficiency
pa
1970 1980 1990 2000 2009 growth1970-2009
ASIA 980 970 987 969 943 03
Central Asia 1138 1002
Kazakhstan 1628 1235
Kyrgyzstan 918 808
Tajikistan 625 574
Turkmenistan 939 895
Uzbekistan 833 841
East Asia 995 982 1017 997 970 minus01
Brunei Darussalam
Cambodia 1075 883 990 939 951 minus03
China 982 953 963 970 895 minus02
Indonesia 1002 964 1036 1039 1247 06
Korea DPR 920 943 906 635 903 minus00
Korea Republic of 755 533
Lao PDR 904 982 987 976 1027 03
Malaysia 925 1336 1540 1340 1455 12
Mongolia 791 845 929 586 627 minus06
Myanmar 1094 1054 1009 1019 1003 minus02
Philippines 1245 1204 1012 922 893 minus08
Singapore
Thailand 1296 1552 1784 1390 1421 02
Viet Nam 797 932 1094 1074 961 05
South Asia 969 955 957 934 906 minus02
Afghanistan 968 984 881 680 812 minus04
Bangladesh 901 894 906 848 800 minus03
Bhutan 834 936 776 707 952 03
India 979 983 1000 986 957 minus01
Iran (Islamic Rep) 958 714 690 606 650 minus10
Maldives
Nepal 1092 991 982 943 920 minus04
Pakistan 991 982 900 926 909 minus02
Sri Lanka 717 792 778 682 721 00
West Asia 868 890 824 876 832
Armenia 539
Azerbaijan 693 734
Bahrain
Cyprus 631
Georgia
Iraq 858
Jordan
Kuwait
Lebanon
Occupied PalestinianTerritory
Saudi Arabia 692
Syrian Arab Republic 724 841 657 679 560 minus07
Turkey 966 1018 921 955 933 minus01
United Arab Emirates
Yemen 709 543
LATIN AMERICA amp THECARIBBEAN
1078 1040 1049 1026 1125 minus06
Argentina 1708 1895 2095 2454 2736 12
Bahamas
Barbados 1754 597 514
Belize 2460 1539
Bolivia (Plur State) 827 870 1024 1201 1421 14
Brazil 1058 1071 1123 1124 1406 07
Chile 843 677 964 680 697 minus05
Colombia 982 925 965 839 783 minus06
Costa Rica 1170 1086 1007 949 910 minus06
143
TABLE 19 Trade and food security - caloric self-sufficiency (continued)Caloric self-sufficiency
pa
1970 1980 1990 2000 2009 growth1970-2009
Cuba 2382 2213 1486 594
Dominica 941 555 527 517 minus15
Dominican Republic 2375 1259 815 508 538 minus37
Ecuador 1080 982 989 1015 1008 minus02
El Salvador 974 880 804 664 701 minus08
French Guiana
Grenada 776 653 501
Guatemala 1000 1099 1054 1267 1199 05
Guyana 2957 2046 1337 2674 1695 minus14
Haiti 958 818 652 528 510 minus16
Honduras 1124 1096 1010 868 880 minus06
Jamaica 1124 559 565
Mexico 997 771 744 669 696 minus09
Netherlands Antilles
Nicaragua 1195 867 913 937 951 minus06
Panama 1103 1105 922 637 544 minus18
Paraguay 1035 1132 1580 1663
Peru 952 636 668 684 661 minus09
St Kitts amp Nevis 1537 1019 524
St Lucia 1012 892 919
St Vincent amp Grenadines 827 517 826
Suriname 834 1163 886 793 792 minus01
Trinidad amp Tobago 1058
Uruguay 1106 1210 1663 1350 2324 19
Venezuela (Boliv Rep of) 724 616 584 619 minus04
OCEANIA 1177 1169 1342 1388 1369 minus04
Fiji 2610 1943 1322
French Polynesia 915 860 600
New Caledonia
Papua New Guinea 1162 1127 1192 1354 1431 05
Samoa 1172 1340 931 836 729 minus12
Solomon Islands 1331 1745 1903 1340 1222 minus02
Tonga 1216 1160 810 793 759 minus12
Vanuatu 1555 1329 1392 1323 1078 minus09
DEVELOPED REGIONS 1064 1190 1181 1122 1140 18
NORTH AMERICA 1260 1612 1353 1321 1290 01
Bermuda
Canada 1585 1717 1538 1607 1832 04
United States of America 1226 1599 1328 1286 1238 00
ASIA amp OCEANIA 2321 1787 2667 2720 2040 minus02
Australia 2416 2907 2931 2075 minus04
Israel
Japan
New Zealand 1833 1787 1443 1646 1859 00
EUROPE 913 873 935 967 1012 03
Albania 875 973 792 601 615 minus09
Belarus 775 1036
Bosnia amp Herzegovina 548 625
Croatia 1016 1086
European Union 851 877 982 987 925 02
Iceland
Macedonia FYR 727 681
Montenegro
Norway 588 621 714 643 501 minus04
Republic of Moldova 1074 1333
Russian Federation 884 1131
Serbia 1262
Switzerland 551 716 662 627
Ukraine 1081 1933
144
TABLE 20 Trade and food security - import billsFood import bills Food + energy import bills share of GDP
total per capita
millionUS$
millionUS$
pa US$ US$ pa pa
2000 2010 growth2000-2010
2000 2010 growth2000-2010
2000 2010 growth2000-2010
WORLD 3980557 10296380 100 651 1495 87 33 58 58
DEVELOPING REGIONS 1162631 3731805 124 236 660 108 44 73 52
AFRICA 179991 597794 128 222 585 102 57 82 38
North Africa 87973 250019 110 620 1507 93 53 86 50
Algeria 25413 78633 120 832 2217 103 49 60 20
Egypt 32784 97155 115 485 1198 95 44 89 74
Libya 7941 15315 68 1518 2410 47 28 42 41
Morocco 15154 40877 104 526 1279 93 96 142 40
Tunisia 6546 18039 107 692 1721 95 72 96 29
Sub-Saharan Africa 92018 347775 142 138 406 114 60 80 30
Angola 6384 22925 136 458 1201 101 92 33 minus97
Benin 1120 6475 192 172 732 156 92 166 61
Botswana 2561 5778 85 1457 2879 70 63 120 66
Burkina Faso 931 2586 107 76 157 76 89 79 minus12
Burundi 270 1011 141 42 121 110 69 109 47
Cameroon 2542 11843 166 162 604 141 60 89 41
Cape Verde 593 1768 115 1357 3566 101 137 166 20
Central African Republic 242 719 115 65 163 96 32 62 70
Chad 415 2940 216 51 262 179 37 67 61
Comoros 119 605 177 211 823 146 80 128 48
Congo 995 7212 219 317 1784 188 34 83 94
Cocircte drsquoIvoire 3884 15493 148 234 785 129 117 150 25
Congo Dem Rep 2055 7116 132 41 108 101 68 84 21
Djibouti 374 1080 112 511 1215 90 73 118 49
Equatorial Guinea 332 2025 198 639 2893 163 65 189 112
Eritrea 1741 2244 26 475 427 minus10 257 143 minus57
Ethiopia 818 10336 289 12 125 259 41 88 79
Gabon 1380 4160 117 1117 2764 95 33 47 38
Gambia 613 958 46 473 555 16 138 147 07
Ghana 3348 16092 170 175 660 142 133 118 minus12
Guinea 1047 2455 89 125 246 70 72 122 55
Guinea-Bissau 97 670 213 78 442 189 35 125 135
Kenya 3846 14908 145 123 368 116 83 140 53
Lesotho 1226 2628 79 624 1210 68 343 155 minus77
Liberia 86 144 52 30 36 17 49 58 17
Madagascar 1207 3988 127 79 193 94 87 92 06
Malawi 518 1664 124 46 112 92 60 82 33
Mali 1144 4073 135 101 265 101 114 106 minus07
Mauritania 1071 5483 177 405 1585 146 141 272 68
Mauritius 2822 8861 121 2360 6821 112 111 181 50
Mozambique 1931 5066 101 106 217 74 75 112 40
Namibia 2126 3940 64 1121 1726 44 64 63 minus01
Niger 558 4720 238 51 304 195 80 170 78
Nigeria 14703 57626 146 119 364 118 41 47 12
Rwanda 425 2459 192 52 231 160 40 60 41
Senegal 3349 10256 118 352 825 89 146 192 28
Seychelles 304 1867 199 3850 21458 187 170 521 118
Sierra Leone 413 1694 152 100 289 112 131 264 73
Somalia 1411 6048 157 191 648 130
Sudan 3594 14751 152 105 339 124 37 29 minus25
South Africa 11075 40750 139 247 813 126 37 70 65
Swaziland 1792 4013 84 1684 3384 72 207 140 minus38
Tanzania Utd Rep 2208 7585 131 65 169 101 54 142 101
Togo 714 2051 111 149 340 86 131 208 48
Uganda 1766 5306 116 73 159 81 66 80 20
Zambia 694 2334 129 68 178 101 55 66 20
Zimbabwe 759 7845 263 61 624 263 226
145
TABLE 20 Trade and food security - import bills (continued)Food import bills Food + energy import bills share of GDP
total per capita
millionUS$
millionUS$
pa US$ US$ pa pa
2000 2010 growth2000-2010
2000 2010 growth2000-2010
2000 2010 growth2000-2010
ASIA 714793 2459868 132 199 611 118 51 82 50
Central Asia 9547 39240 152 172 646 141 54 56 04
Kazakhstan 3726 17041 164 249 1063 156 50 38 minus27
Kyrgyzstan 635 4573 218 128 857 209 140 280 71
Tajikistan 652 4582 215 106 666 202 309 204 minus41
Turkmenistan 1803 4291 91 400 851 78 40
Uzbekistan 2732 8754 124 110 319 112 37 51 32
East Asia 409084 1480333 137 216 725 129 57 88 44
Brunei Darussalam 1727 4502 101 5282 11283 79 29 46 47
Cambodia 938 5678 197 75 402 182 117 167 37
China 207426 837460 150 160 610 143 35 61 57
Indonesia 53 73 33
Korea DPR 2315 2171 minus06 101 89 minus12
Korea Republic of 71923 215999 116 1564 4483 111 85 156 63
Lao PDR 481 1632 130 91 263 113 67 92 32
Malaysia 33406 120525 137 1427 4244 115 78 147 66
Mongolia 778 3684 168 323 1337 153 179 207 15
Myanmar 2184 4950 85 49 103 78 65 40 minus48
Philippines 24056 58852 94 311 631 73 86 90 05
Singapore 32231 80440 96 8224 15816 68 206 448 81
Thailand 24502 82275 129 388 1190 119 81 151 64
Viet Nam 7115 60078 238 90 684 224 91 159 58
South Asia 95776 322413 129 66 189 112 34 83 94
Afghanistan 4174 6659 48 183 212 15 96
Bangladesh 11087 53509 170 86 360 154 37 76 74
Bhutan 220 1100 175 385 1515 147 85 159 65
India 31571 124317 147 30 102 130 26 93 136
Iran (Islamic Rep) 22803 62356 106 349 843 92 28 35 23
Maldives 774 1624 77 2834 5138 61 155 208 30
Nepal 1752 5754 126 72 192 103 72 107 41
Pakistan 15200 48709 124 105 281 103 69 100 38
Sri Lanka 8195 18386 84 437 881 73 83 93 11
West Asia 200387 617881 119 1130 2765 94 44 60 33
Armenia 1753 5934 130 570 1919 129 161 132 minus20
Azerbaijan 1996 9581 170 246 1043 155 49 24 minus68
Bahrain 7491 12547 53 11742 9942 minus16 104 73 minus35
Cyprus 3369 9773 112 3572 8852 95 89 115 26
Georgia 1434 8223 191 302 1889 201 92 157 55
Iraq 33338 83450 96 1397 2635 65 153
Jordan 8045 23347 112 1667 3774 85 118 227 68
Kuwait 9231 34226 140 4756 12505 102 26 32 24
Lebanon 9576 27103 110 2559 6410 96 115 159 33
Occupied PalestinianTerritory
4541 6448 36 1420 1596 12
Saudi Arabia 49863 148133 115 2488 5397 81 27 40 41
Syrian Arab Republic 6831 24656 137 427 1208 110 43 110 99
Turkey 17633 69629 147 277 957 132 35 55 46
United Arab Emirates 31295 98922 122 10318 13168 25 36 50 32
Yemen 7901 29831 142 446 1240 108 110 191 57
LATIN AMERICA amp THECARIBBEAN
258747 650107 97 496 1102 83 27 43 47
Argentina 11905 20384 55 322 504 46 07 14 66
Bahamas 2826 4630 51 9483 13498 36 89 147 51
Barbados 1080 3170 114 4028 11610 112 75 129 55
Belize 591 850 37 2353 2724 15 182 155 minus16
Bolivia (Plur State) 2394 3798 47 288 383 29 39 59 42
Brazil 35101 78639 84 201 403 72 18 24 25
Chile 11818 44242 141 766 2585 129 56 113 73
Colombia 13256 38065 111 333 822 94 16 25 49
Costa Rica 4059 11415 109 1036 2450 90 59 96 51
146
TABLE 20 Trade and food security - import bills (continued)Food import bills Food + energy import bills share of GDP
total per capita
millionUS$
millionUS$
pa US$ US$ pa pa
2000 2010 growth2000-2010
2000 2010 growth2000-2010
2000 2010 growth2000-2010
Cuba 7509 18935 97 676 1682 95
Dominica 273 460 54 3896 6759 57 153 222 38
Dominican Republic 7653 18710 94 891 1885 78 97 108 11
Ecuador 2997 17957 196 243 1241 177 36 83 89
El Salvador 6871 13533 70 1157 2185 66 98 128 27
French Guiana
Grenada 391 570 38 3836 5481 36 140 161 14
Guatemala 5612 17487 120 499 1215 93 69 113 51
Guyana 1074 1680 46 1466 2229 43 186 253 31
Haiti 3301 14633 161 382 1464 144 100 246 94
Honduras 5388 11595 80 866 1526 58 127 188 40
Jamaica 4677 7485 48 1811 2731 42 117 209 60
Mexico 82457 186109 85 825 1641 71 20 48 91
Netherlands Antilles 1124 1466 27 6243 7292 16
Nicaragua 2562 7105 107 505 1228 93 141 278 70
Panama 3690 9770 102 1248 2778 83 86 51 minus51
Paraguay 1585 4199 102 297 651 82 72 114 46
Peru 8304 29975 137 321 1031 124 37 57 44
St Kitts amp Nevis 314 487 45 6828 9373 32 141 131 minus07
St Lucia 571 274 minus71 3639 1572 minus80 184 492 103
St Vincent amp Grenadines 398 708 59 3683 6494 58 163 271 52
Suriname 582 2033 133 1247 3873 120 99 107 08
Trinidad amp Tobago 2561 7088 107 1983 5286 103 162 130 minus22
Uruguay 3455 8785 98 1041 2608 96 38 102 103
Venezuela (Boliv Rep of) 17548 60738 132 721 2096 113 20 22 13
OCEANIA 9099 24035 102 1122 2414 80 336 346 03
Fiji 1023 2604 98 1259 3025 92 90 257 111
French Polynesia 1886 3682 69 7924 13585 55
New Caledonia 1242 3050 94 5859 12151 76
Papua New Guinea 1789 6057 130 333 883 103 116 141 20
Samoa 250 722 112 1411 3948 108 178 227 25
Solomon Islands 101 862 240 246 1602 206 87 271 120
Tonga 131 490 141 1341 4710 134 126 282 84
Vanuatu 124 507 151 672 2111 121 75 169 85
DEVELOPED REGIONS 2817926 6564575 88 2361 5288 84 30 51 56
NORTH AMERICA 523687 1042686 71 1672 3026 61 19 33 55
Bermuda 313 1349 157 4964 20751 154
Canada 107827 241046 84 3516 7086 73 32 47 40
United States of America 414893 798725 68 1469 2573 58 18 31 56
ASIA amp OCEANIA 41 3163 4565 37 26 48 63
Australia 25799 82915 124 1346 3724 107 20 35 56
Israel 17637 46462 102 2932 6263 79 43 34 minus22
Japan 436892 575640 28 3475 4549 27 26 51 70
New Zealand 9144 28151 119 2370 6445 105 44 63 35
EUROPE 1804766 4788721 103 2488 6500 101 44 68 44
Albania 1978 6375 124 644 1990 119 81 105 26
Belarus 9010 24432 105 896 2546 110 335 294 minus13
Bosnia amp Herzegovina 6704 14597 81 1815 3882 79 166 157 minus05
Croatia 5845 19002 125 1297 4316 128 81 90 10
European Union 1630103 4127225 97 3385 8245 93 44 70 47
Iceland 2054 3803 64 7310 11886 50 51 74 37
Macedonia FYR 2299 6631 112 1144 3217 109 145 156 08
Montenegro 4438 7033 173
Norway 19698 53402 105 4386 10936 96 19 27 38
Republic of Moldova 518 4516 242 126 1264 259 189 181 minus04
Russian Federation 83028 391496 168 566 2739 171 40 36 minus11
Serbia 8668 879 92
Switzerland 34857 82665 90 4863 10786 83 29 43 41
Ukraine 6999 48454 213 143 1066 222 214 208 minus03
147
TABLE 21 Dimensions of povertyPoverty gap at Poverty headcount ratio Multi-
dimensional
$125 aday (ppp)
$2 a day(ppp)
nationalpovertyline
ruralpovertyline
$125 aday (ppp)
$2 a day(ppp)
nationalpovertyline
ruralpovertyline
poverty(MPI)
0 to 1
2009 2009 2009 2009 2009 2009 2009 2009 2009
WORLD
DEVELOPING REGIONS
AFRICA
North Africa
Algeria 14 65 32 45 68 236 226 303
Egypt 04 35 36 20 185 220 300 00
Libya
Morocco 05 31 25 140 90 145 00
Tunisia 05 30 25 128 38 00
Sub-Saharan Africa
Angola 299 424 543 702 05
Benin 157 335 120 140 473 753 390 460 04
Botswana 110 223 117 184 312 494 306 448
Burkina Faso 203 393 153 176 565 812 464 524 05
Burundi 364 561 234 242 813 935 669 689 05
Cameroon 12 82 123 175 96 304 399 550 03
Cape Verde 60 152 81 143 210 409 266 443
Central African Republic 313 468 331 350 628 801 620 694 05
Chad 256 439 216 233 619 833 550 586 03
Comoros 208 342 163 178 461 650 448 487 04
Congo 228 388 189 206 541 744 501 577 02
Cocircte drsquoIvoire 75 178 153 203 238 463 427 542 04
Congo Dem Rep 253 424 322 349 592 796 713 757 04
Djibouti 53 146 188 412 01
Equatorial Guinea
Eritrea 690
Ethiopia 96 289 83 85 390 776 389 393 06
Gabon 09 50 100 160 48 196 327 446 02
Gambia 121 249 251 305 343 567 580 678 03
Ghana 105 223 96 135 300 536 285 392 01
Guinea 150 310 176 220 433 696 530 630 05
Guinea-Bissau 165 348 250 278 488 779 647 691
Kenya 61 151 163 175 197 399 459 491 02
Lesotho 208 331 379 265 434 623 566 605 02
Liberia 408 595 244 263 837 948 638 677 05
Madagascar 265 469 268 289 678 896 687 735 04
Malawi 323 518 80 86 739 905 524 559 04
Mali 188 365 167 514 771 474 576 06
Mauritania 57 159 170 241 212 441 463 612 04
Mauritius
Mozambique 252 429 212 222 600 816 547 569 05
Namibia 246 365 130 160 491 622 380 490 02
Niger 119 306 196 212 431 759 595 639 06
Nigeria 296 469 228 266 644 839 547 638 03
Rwanda 409 572 240 260 768 896 585 642 04
Senegal 108 247 164 215 335 604 508 619 04
Seychelles 01 03 02 18
Sierra Leone 203 375 275 346 534 761 664 785 04
Somalia 05
Sudan
South Africa 33 123 70 174 357 230 01
Swaziland 294 458 329 370 629 810 692 750 02
Tanzania Utd Rep 281 475 99 110 679 879 334 374 04
Togo 114 279 229 293 387 693 617 743 03
Uganda 83 213 68 76 287 553 245 272 04
Zambia 328 483 285 388 643 815 593 768 03
Zimbabwe 160 720 440 02
148
TABLE 21 Dimensions of poverty (continued)Poverty gap at Poverty headcount ratio Multi-
dimensional
$125 aday (ppp)
$2 a day(ppp)
nationalpovertyline
ruralpovertyline
$125 aday (ppp)
$2 a day(ppp)
nationalpovertyline
ruralpovertyline
poverty(MPI)
0 to 1
2009 2009 2009 2009 2009 2009 2009 2009 2009
ASIA
Central Asia
Kazakhstan 01 03 31 45 02 15 154 217 00
Kyrgyzstan 01 55 100 120 19 294 431 508 00
Tajikistan 51 168 124 124 215 509 472 492 01
Turkmenistan 70 184 248 497
Uzbekistan 150 332 463 767 00
East Asia
Brunei Darussalam
Cambodia 61 202 72 83 283 565 301 345 03
China 40 122 159 363 28 25
Indonesia 36 155 25 31 187 506 142 174 01
Korea DPR
Korea Republic of
Lao PDR 89 248 339 660 276 317 03
Malaysia 00 02 08 18 00 23 38 82
Mongolia 62 172 101 134 224 491 352 466 01
Myanmar 02
Philippines 55 164 27 152 226 450 265 507 01
Singapore
Thailand 19 83 30 108 265 81 104 00
Viet Nam 23 109 35 46 131 385 145 187 01
South Asia
Afghanistan 79 83 360 375
Bangladesh 131 338 90 98 496 813 400 438 03
Bhutan 70 188 61 81 262 495 232 309 01
India 105 295 416 756 275 283 03
Iran (Islamic Rep) 03 18 14 80
Maldives 01 25 15 122 00
Nepal 197 378 75 85 551 776 309 346 03
Pakistan 43 187 226 603 223 270 03
Sri Lanka 10 74 31 32 70 291 152 157 00
West Asia
Armenia 02 23 49 121 13 124 265 255 00
Azerbaijan 02 15 20 10 78 158 185 00
Bahrain
Cyprus
Georgia 46 118 72 92 147 326 236 297 00
Iraq 06 55 45 90 40 253 229 393 01
Jordan 01 06 26 04 35 133 190 00
Kuwait
Lebanon
Occupied PalestinianTerritory
Saudi Arabia
Syrian Arab Republic 02 33 17 169 00
Turkey 09 26 27 91 181 387 00
United Arab Emirates 00
Yemen 42 148 89 106 175 466 348 401 03
LATIN AMERICA amp THECARIBBEAN
Argentina 04 08 09 24 00
Bahamas
Barbados
Belize 47 97 121 240 335 442 00
Bolivia (Plur State) 58 109 140 247 601 773 01
Brazil 11 32 38 99 214 00
Chile 04 08 08 24 151 129
Colombia 57 119 160 279 455 643 00
Costa Rica 01 11 07 54 217 230
149
TABLE 21 Dimensions of poverty (continued)Poverty gap at Poverty headcount ratio Multi-
dimensional
$125 aday (ppp)
$2 a day(ppp)
nationalpovertyline
ruralpovertyline
$125 aday (ppp)
$2 a day(ppp)
nationalpovertyline
ruralpovertyline
poverty(MPI)
0 to 1
2009 2009 2009 2009 2009 2009 2009 2009 2009
Cuba
Dominica
Dominican Republic 09 39 43 136 505 571 00
Ecuador 16 44 51 134 360 575 00
El Salvador 11 45 51 152 378 465
French Guiana
Grenada
Guatemala 65 129 169 298 510 705 01
Guyana 39 69 77 168 01
Haiti 282 418 549 722 770 880 03
Honduras 119 182 233 354 588 644 02
Jamaica 00 09 02 58 99 251
Mexico 17 32 34 81 474 608 00
Netherlands Antilles
Nicaragua 52 123 158 319 462 679 01
Panama 31 71 95 179 327 598
Paraguay 15 43 51 132 351 498 01
Peru 14 47 59 147 348 603 01
St Kitts amp Nevis
St Lucia 72 155 209 406
St Vincent amp Grenadines
Suriname 59 117 155 272 00
Trinidad amp Tobago 11 39 42 135 00
Uruguay 00 00 00 02 205 222 00
Venezuela (Boliv Rep of) 11 32 35 101 290
OCEANIA
Fiji 101 148 310 433
French Polynesia
New Caledonia
Papua New Guinea 123 255 124 138 358 574 375 413
Samoa
Solomon Islands
Tonga
Vanuatu 01
DEVELOPED REGIONS
NORTH AMERICA
Bermuda
Canada
United States of America
ASIA amp OCEANIA
Australia
Israel
Japan
New Zealand
EUROPE
Albania 02 08 23 26 06 42 124 146 00
Belarus 00 00 00 00 54
Bosnia amp Herzegovina 00 01 46 49 00 02 140 178 00
Croatia 00 00 26 00 00 111 00
European Union
Iceland
Macedonia FYR 00 07 72 77 03 43 190 213 00
Montenegro 00 00 09 14 00 00 49 89 00
Norway
Republic of Moldova 03 26 19 125 290 00
Russian Federation 00 00 27 55 00 01 111 212 00
Serbia 01 02 13 20 01 07 66 98 00
Switzerland
Ukraine 00 01 15 23 01 05 79 113 00
150
TABLE 22 Dimensions of inequalityHuman Development Index Gender
inequalityIndex
Gini-index Income share held by
inequalityadjusted
incomedistribution
highest20
lowest20
index index index index
2010 2010 2008 2009 2009 2009
WORLD
DEVELOPING REGIONS
AFRICA
North Africa
Algeria 07 06 353
Egypt 06 04 07 321 415 90
Libya 07 05
Morocco 06 04 07 409 479 65
Tunisia 07 05 05 408 473 60
Sub-Saharan Africa
Angola 04 02 586 619 20
Benin 04 03 07 386 461 70
Botswana 06 06 610
Burkina Faso 03 02 396 471 70
Burundi 03 02 06 333 428 90
Cameroon 05 03 07 446 462 67
Cape Verde 05 504 559 45
Central African Republic 03 02 08 436 606 34
Chad 03 02 398 466 63
Comoros 04 02 643 680 25
Congo 05 03 07 473 531 50
Cocircte drsquoIvoire 04 03 07 415 476 56
Congo Dem Rep 02 02 08
Djibouti 04 03 399 465 60
Equatorial Guinea 05
Eritrea
Ethiopia 03 02 298 394 93
Gabon 06 05 06 415 482 62
Gambia 04 02 07 473 528 48
Ghana 05 03 07 428 485 52
Guinea 03 02 394 462 63
Guinea-Bissau 03 02 355 432 73
Kenya 05 03 07 477 532 48
Lesotho 04 03 07 525 564 30
Liberia 03 02 08 382 450 64
Madagascar 04 03 472 535 62
Malawi 04 03 07 390 465 70
Mali 03 02 08 390 460 65
Mauritania 04 03 07 390 457 62
Mauritius 07
Mozambique 03 02 07 456 515 52
Namibia 06 03 06 743
Niger 03 02 08 340 428 83
Nigeria 04 02 429 486 51
Rwanda 04 02 06 531 582 42
Senegal 04 03 07 392 459 62
Seychelles 658 696 37
Sierra Leone 03 02 08 425 493 61
Somalia
Sudan 04 07
South Africa 06 04 06 578 722 25
Swaziland 05 03 07 507 559 45
Tanzania Utd Rep 04 03 376 448 68
Togo 04 03 07 344 424 76
Uganda 04 03 07 443 493 61
Zambia 04 03 07 507 552 36
Zimbabwe 01 01 07 501
151
TABLE 22 Dimensions of inequality (continued)Human Development Index Gender
inequalityIndex
Gini-index Income share held by
inequalityadjusted
incomedistribution
highest20
lowest20
index index index index
2010 2010 2008 2009 2009 2009
ASIA
Central Asia
Kazakhstan 07 06 05 309 399 87
Kyrgyzstan 06 05 05 334 428 88
Tajikistan 06 05 05 336 417 78
Turkmenistan 07 05 408
Uzbekistan 06 05 367 442 71
East Asia
Brunei Darussalam 08
Cambodia 05 04 06 444 517 66
China 05 04 415 478 57
Indonesia 06 05 07 368 455 74
Korea DPR
Korea Republic of 09 07 03 316
Lao PDR 05 04 06 367 448 76
Malaysia 07 04 462 448 65
Mongolia 06 05 05 365 405 72
Myanmar 04
Philippines 06 05 06 440 504 56
Singapore 08 02 425
Thailand 06 05 05 536 493 62
Viet Nam 06 05 05 376 454 73
South Asia
Afghanistan 03 08 294 387 90
Bangladesh 05 03 07 310 408 94
Bhutan 467 530 54
India 05 04 07 368 453 81
Iran (Islamic Rep) 07 06 383 452 64
Maldives 06 05 05 374 442 65
Nepal 04 03 07 473 540 59
Pakistan 05 03 07 327 421 90
Sri Lanka 07 05 06 403 478 69
West Asia
Armenia 07 06 05 309 398 88
Azerbaijan 07 06 05 337 421 80
Bahrain 08 05
Cyprus 08 07 03
Georgia 07 06 06 413 471 53
Iraq 07 399 87
Jordan 07 06 06 377 455 73
Kuwait 08 05
Lebanon
Occupied PalestinianTerritory
Saudi Arabia 07 08
Syrian Arab Republic 06 05 06 358 439 77
Turkey 07 05 06 397 489 52
United Arab Emirates 08 04
Yemen 04 03 08 377
LATIN AMERICA amp THECARIBBEAN
Argentina 08 06 05 458 531 36
Bahamas 08 07
Barbados 08 05
Belize 07 05 06 544
Bolivia (Plur State) 06 04 06 573 610 28
Brazil 07 05 06 539 585 32
Chile 08 06 05 521 572 43
Colombia 07 05 06 585 621 25
Costa Rica 07 06 05 503 523 44
152
TABLE 22 Dimensions of inequality (continued)Human Development Index Gender
inequalityIndex
Gini-index Income share held by
inequalityadjusted
incomedistribution
highest20
lowest20
index index index index
2010 2010 2008 2009 2009 2009
Cuba 05
Dominica
Dominican Republic 07 05 06 484 536 44
Ecuador 07 06 06 490 589 36
El Salvador 07 05 06 469 519 47
French Guiana
Grenada
Guatemala 06 04 07 537 580 35
Guyana 06 05 06 432
Haiti 04 02 07 595 630 25
Honduras 06 04 06 577 607 20
Jamaica 07 06 06 455 516 53
Mexico 07 06 06 517 562 38
Netherlands Antilles
Nicaragua 06 04 06 523 569 38
Panama 08 05 06 523 586 27
Paraguay 06 05 06 520 565 38
Peru 07 05 06 480 543 40
St Kitts amp Nevis
St Lucia 426
St Vincent amp Grenadines
Suriname 06 05 528
Trinidad amp Tobago 07 06 05 403
Uruguay 08 06 05 424 515 46
Venezuela (Boliv Rep of) 07 05 06 435 490 49
OCEANIA
Fiji 07
French Polynesia
New Caledonia
Papua New Guinea 04 08 509
Samoa
Solomon Islands 05
Tonga 07
Vanuatu
DEVELOPED REGIONS
NORTH AMERICA
Bermuda
Canada 09 08 03 326 399 72
United States of America 09 08 05 408 458 54
ASIA amp OCEANIA
Australia 09 09 03 352
Israel 09 08 03 392 449 57
Japan 09 03 249
New Zealand 09 03 362
EUROPE
Albania 07 06 05 345 430 81
Belarus 07 07 272 364 92
Bosnia amp Herzegovina 07 06 362 432 67
Croatia 08 07 04 336 420 81
European Union
Iceland 09 08 03
Macedonia FYR 07 06 442 503 54
Montenegro 07 300 388 85
Norway 09 09 02 258 372 96
Republic of Moldova 06 05 05 380 453 68
Russian Federation 07 06 05 423 489 60
Serbia 07 282
Switzerland 09 08 02 337 413 75
Ukraine 07 07 05 275 371 94
153
TABLE 23 GovernanceVoice ampaccount-ability
Politicalstabilityabsence ofviolence ampterrorism
Govern-ment
effectiveness
Regulatoryquality
Rule oflaw
Control ofcorruption
Averagegovernance
-25 to 25(lowest tohighest)
-25 to 25(lowest tohighest)
-25 to 25(lowest tohighest)
-25 to 25(lowest tohighest)
-25 to 25(lowest tohighest)
-25 to 25(lowest tohighest)
-25 to 25(lowest tohighest)
2010 2010 2010 2010 2010 2010 2010
WORLD
DEVELOPING REGIONS
AFRICA
North Africa
Algeria minus10 minus13 minus06 minus11 minus08 minus05 minus09
Egypt minus12 minus09 minus04 minus02 minus01 minus06 minus06
Libya minus19 minus01 minus12 minus12 minus10 minus13 minus11
Morocco minus08 minus05 minus02 minus01 minus02 minus02 minus03
Tunisia minus13 01 02 minus00 01 minus01 minus02
Sub-Saharan Africa
Angola minus11 minus02 minus11 minus10 minus12 minus13 minus10
Benin 03 03 minus05 minus03 minus07 minus08 minus03
Botswana 04 09 05 05 07 10 07
Burkina Faso minus02 minus01 minus06 minus01 minus02 minus04 minus03
Burundi minus09 minus15 minus11 minus11 minus12 minus11 minus12
Cameroon minus11 minus06 minus09 minus07 minus10 minus10 minus09
Cape Verde 09 08 minus01 minus01 04 08 05
Central African Republic minus11 minus21 minus14 minus11 minus13 minus08 minus13
Chad minus14 minus15 minus15 minus11 minus15 minus13 minus14
Comoros minus04 minus04 minus17 minus15 minus11 minus07 minus10
Congo minus10 minus02 minus12 minus13 minus11 minus11 minus10
Cocircte drsquoIvoire minus11 minus16 minus13 minus09 minus12 minus11 minus12
Congo Dem Rep minus14 minus22 minus17 minus16 minus16 minus14 minus17
Djibouti minus11 03 minus10 minus07 minus07 minus03 minus06
Equatorial Guinea minus19 02 minus17 minus14 minus13 minus15 minus12
Eritrea minus22 minus09 minus14 minus22 minus13 minus05 minus14
Ethiopia minus13 minus17 minus03 minus09 minus08 minus07 minus10
Gabon minus09 02 minus09 minus06 minus05 minus08 minus06
Gambia minus11 01 minus07 minus04 minus05 minus06 minus05
Ghana 05 00 minus00 01 minus01 01 01
Guinea minus09 minus18 minus11 minus11 minus15 minus12 minus13
Guinea-Bissau minus09 minus08 minus10 minus11 minus14 minus11 minus10
Kenya minus02 minus12 minus05 minus01 minus10 minus09 minus07
Lesotho minus02 05 minus04 minus06 minus03 02 minus01
Liberia minus02 minus05 minus12 minus11 minus10 minus05 minus07
Madagascar minus08 minus11 minus08 minus06 minus08 minus03 minus07
Malawi minus02 01 minus04 minus06 minus01 minus04 minus03
Mali 02 minus03 minus09 minus05 minus05 minus07 minus04
Mauritania minus09 minus13 minus09 minus08 minus09 minus07 minus09
Mauritius 07 05 08 08 08 07 07
Mozambique minus01 03 minus05 minus04 minus05 minus04 minus03
Namibia 03 08 01 01 02 03 03
Niger minus06 minus11 minus07 minus05 minus06 minus07 minus07
Nigeria minus08 minus20 minus12 minus08 minus12 minus10 minus12
Rwanda minus13 minus01 minus01 minus02 minus03 05 minus02
Senegal minus03 minus04 minus05 minus03 minus04 minus07 minus04
Seychelles 01 08 02 minus06 00 03 01
Sierra Leone minus02 minus02 minus12 minus07 minus09 minus08 minus07
Somalia minus20 minus31 minus22 minus24 minus24 minus17 minus23
Sudan minus17 minus27 minus14 minus14 minus13 minus13 minus16
South Africa 05 minus00 03 04 01 01 02
Swaziland minus13 minus01 minus05 minus06 minus05 minus02 minus05
Tanzania Utd Rep minus01 minus00 minus05 minus04 minus05 minus05 minus03
Togo minus10 minus02 minus14 minus09 minus09 minus10 minus09
Uganda minus05 minus11 minus06 minus01 minus04 minus09 minus06
Zambia minus03 05 minus08 minus05 minus05 minus06 minus04
Zimbabwe minus15 minus12 minus16 minus20 minus18 minus14 minus16
154
TABLE 23 Governance (continued)Voice ampaccount-ability
Politicalstabilityabsence ofviolence ampterrorism
Govern-ment
effectiveness
Regulatoryquality
Rule oflaw
Control ofcorruption
Averagegovernance
-25 to 25(lowest tohighest)
-25 to 25(lowest tohighest)
-25 to 25(lowest tohighest)
-25 to 25(lowest tohighest)
-25 to 25(lowest tohighest)
-25 to 25(lowest tohighest)
-25 to 25(lowest tohighest)
2010 2010 2010 2010 2010 2010 2010
ASIA
Central Asia
Kazakhstan minus11 05 minus03 minus03 minus06 minus10 minus05
Kyrgyzstan minus10 minus10 minus06 minus02 minus13 minus11 minus09
Tajikistan minus14 minus09 minus09 minus11 minus12 minus12 minus11
Turkmenistan minus20 02 minus16 minus21 minus15 minus14 minus14
Uzbekistan minus20 minus08 minus08 minus16 minus14 minus13 minus13
East Asia
Brunei Darussalam minus07 12 09 11 08 09 07
Cambodia minus09 minus06 minus08 minus05 minus11 minus12 minus08
China minus16 minus08 01 minus02 minus03 minus06 minus06
Indonesia minus01 minus09 minus02 minus04 minus06 minus07 minus05
Korea DPR minus22 minus05 minus19 minus24 minus13 minus13 minus16
Korea Republic of 07 01 12 09 10 04 07
Lao PDR minus16 minus02 minus09 minus10 minus09 minus11 minus10
Malaysia minus05 01 11 06 05 01 03
Mongolia 00 05 minus06 minus03 minus04 minus07 minus03
Myanmar minus21 minus13 minus17 minus22 minus15 minus17 minus17
Philippines minus01 minus16 minus01 minus03 minus05 minus08 minus06
Singapore minus03 11 22 18 17 22 15
Thailand minus06 minus12 01 02 minus02 minus03 minus03
Viet Nam minus14 01 minus03 minus06 minus05 minus06 minus05
South Asia
Afghanistan minus15 minus26 minus15 minus16 minus19 minus16 minus18
Bangladesh minus03 minus14 minus08 minus09 minus08 minus10 minus09
Bhutan minus05 07 06 minus11 01 08 01
India 04 minus13 minus00 minus04 minus01 minus05 minus03
Iran (Islamic Rep) minus16 minus16 minus05 minus16 minus09 minus09 minus12
Maldives minus01 minus00 minus02 minus04 minus03 minus06 minus03
Nepal minus05 minus17 minus08 minus07 minus10 minus07 minus09
Pakistan minus08 minus27 minus08 minus06 minus08 minus11 minus11
Sri Lanka minus05 minus08 minus02 minus02 minus01 minus04 minus04
West Asia
Armenia minus09 00 minus02 03 minus05 minus07 minus03
Azerbaijan minus13 minus03 minus08 minus04 minus09 minus12 minus08
Bahrain minus09 minus03 06 08 04 02 01
Cyprus 11 04 15 14 12 11 11
Georgia minus02 minus07 03 06 minus02 minus02 minus01
Iraq minus11 minus23 minus12 minus11 minus16 minus13 minus14
Jordan minus08 minus03 01 02 02 00 minus01
Kuwait minus05 04 01 02 05 03 02
Lebanon minus03 minus15 minus03 00 minus07 minus08 minus06
Occupied PalestinianTerritory
Saudi Arabia minus18 minus02 minus01 01 02 01 minus03
Syrian Arab Republic minus17 minus08 minus06 minus09 minus05 minus11 minus09
Turkey minus02 minus10 04 04 01 00 minus01
United Arab Emirates minus09 08 08 04 04 10 04
Yemen minus13 minus22 minus10 minus06 minus11 minus11 minus12
LATIN AMERICA amp THECARIBBEAN
Argentina 03 minus00 minus02 minus07 minus06 minus04 minus03
Bahamas 10 10 10 05 07 14 09
Barbados 12 11 14 05 10 14 11
Belize 07 minus00 minus04 minus05 minus04 minus01 minus01
Bolivia (Plur State) minus01 minus04 minus05 minus08 minus11 minus05 minus06
Brazil 05 00 01 02 00 01 01
Chile 10 06 12 14 13 15 12
Colombia minus02 minus15 01 03 minus03 minus04 minus03
Costa Rica 10 06 03 05 05 07 06
155
TABLE 23 Governance (continued)Voice ampaccount-ability
Politicalstabilityabsence ofviolence ampterrorism
Govern-ment
effectiveness
Regulatoryquality
Rule oflaw
Control ofcorruption
Averagegovernance
-25 to 25(lowest tohighest)
-25 to 25(lowest tohighest)
-25 to 25(lowest tohighest)
-25 to 25(lowest tohighest)
-25 to 25(lowest tohighest)
-25 to 25(lowest tohighest)
-25 to 25(lowest tohighest)
2010 2010 2010 2010 2010 2010 2010
Cuba minus16 03 minus02 minus16 minus06 05 minus05
Dominica 10 10 07 04 07 07 08
Dominican Republic 01 00 minus06 minus02 minus08 minus08 minus04
Ecuador minus03 minus06 minus07 minus11 minus12 minus09 minus08
El Salvador 00 01 00 04 minus09 minus02 minus01
French Guiana 11 02 12 12 12 11 10
Grenada 08 06 02 04 01 04 04
Guatemala minus04 minus08 minus07 minus02 minus10 minus05 minus06
Guyana 00 minus05 minus01 minus05 minus05 minus06 minus04
Haiti minus07 minus09 minus16 minus11 minus14 minus13 minus12
Honduras minus05 minus05 minus07 minus02 minus09 minus09 minus06
Jamaica 04 minus04 02 03 minus05 minus04 minus01
Mexico 01 minus08 02 03 minus06 minus04 minus02
Netherlands Antilles 04 11 07 09 09 09 08
Nicaragua minus05 minus06 minus10 minus04 minus08 minus08 minus07
Panama 05 00 01 04 minus01 minus04 01
Paraguay minus01 minus09 minus09 minus04 minus09 minus08 minus07
Peru 00 minus09 minus02 05 minus06 minus02 minus02
St Kitts amp Nevis 11 11 07 04 07 10 09
St Lucia 12 08 08 04 08 12 09
St Vincent amp Grenadines 12 09 07 04 09 10 09
Suriname 04 01 minus01 minus07 minus01 minus04 minus01
Trinidad amp Tobago 05 minus00 03 05 minus02 minus04 01
Uruguay 11 09 07 04 07 13 08
Venezuela (Boliv Rep of) minus09 minus14 minus10 minus16 minus16 minus12 minus13
OCEANIA
Fiji minus10 minus01 minus07 minus07 minus09 minus09 minus07
French Polynesia
New Caledonia minus02
Papua New Guinea 01 minus08 minus08 minus05 minus09 minus11 minus07
Samoa
Solomon Islands 01 04 minus09 minus12 minus07 minus05 minus05
Tonga 03 08 minus03 minus05 01 minus03 minus00
Vanuatu 05 14 minus03 minus08 03 04 02
DEVELOPED REGIONS
NORTH AMERICA
Bermuda 10 09 10 14 12 13 11
Canada 14 09 19 17 18 21 16
United States of America 12 03 14 14 16 12 12
ASIA amp OCEANIA
Australia 14 08 18 17 18 21 16
Israel 06 minus15 12 12 09 06 05
Japan 10 09 14 10 13 15 12
New Zealand 15 12 19 18 19 24 18
EUROPE
Albania 01 minus02 minus03 02 minus04 minus04 minus02
Belarus minus16 minus01 minus11 minus12 minus10 minus08 minus10
Bosnia amp Herzegovina minus01 minus07 minus07 minus01 minus04 minus03 minus04
Croatia 04 06 06 06 02 00 04
European Union
Iceland 14 10 16 09 17 19 14
Macedonia FYR 01 minus05 minus02 03 minus03 minus01 minus01
Montenegro 02 05 01 minus01 minus00 minus03 01
Norway 16 13 18 15 19 21 17
Republic of Moldova minus01 minus04 minus06 minus01 minus04 minus07 minus04
Russian Federation minus09 minus09 minus04 minus04 minus08 minus11 minus07
Serbia 03 minus04 minus01 minus00 minus04 minus02 minus01
Switzerland 16 12 19 17 18 21 17
Ukraine minus01 minus01 minus08 minus06 minus08 minus10 minus06
156
TABLE 24 Education health and sanitationLiteracyratefemale
Ratio of girls-to-boys Expendi-ture perstudent
Public expon
education
Health expenditure Prevalenceof HIV
Access to improved
out ofprimaryschool
in primand seceducation
share ofGDP percapita
share ofGDP
currentper capita
share ofGDP
ages15-49
sanitationfacilities
water source
ratio US$ rur urb
2009 2009 2009 2009 2009 2009 2009 2009 2008 2008 2008
WORLD 792 963 44 8600 101 08 61 78 96
DEVELOPING REGIONS
AFRICA
North Africa
Algeria 639 07 993 285 43 2680 58 01 95 79 85
Egypt 578 05 951 38 1130 50 01 94 98 100
Libya 820 00 1050 239 27 4170 39 97
Morocco 439 08 881 872 56 1560 55 01 69 60 98
Tunisia 710 09 1030 507 71 2400 62 01 85 84 99
Sub-Saharan Africa
Angola 576 08 820 1269 26 2040 46 20 57 38 60
Benin 291 01 735 134 35 319 42 12 12 69 84
Botswana 844 12 1000 3014 89 6120 103 248 60 90 99
Burkina Faso 216 08 856 3663 46 381 64 12 11 72 95
Burundi 609 90 927 6009 83 198 131 33 46 71 83
Cameroon 630 02 856 728 37 611 56 53 47 51 92
Cape Verde 802 09 1030 828 59 1460 39 54 82 85
Central African Republic 421 05 687 1448 13 193 43 47 34 51 92
Chad 231 06 636 2488 32 418 70 34 9 44 67
Comoros 687 06 842 272 76 278 34 01 36 97 91
Congo 09 919 29 18 701 30 34 30 34 95
Cocircte drsquoIvoire 453 08 686 1191 46 553 51 34 23 68 93
Congo Dem Rep 549 768 156 95 23 80
Djibouti 09 820 573 84 845 70 25 56 52 98
Equatorial Guinea 898 10 825 40 06 7090 39 50
Eritrea 560 09 773 11356 20 101 21 08 14 57 74
Ethiopia 180 07 879 6642 55 147 43 12 26 98
Gabon 841 10 959 38 2660 35 52 33 41 95
Gambia 358 11 1020 322 20 256 60 20 67 86 96
Ghana 604 11 954 288 54 451 69 18 13 74 90
Guinea 281 07 772 1164 24 188 57 13 19 61 89
Guinea-Bissau 380 07 655 52 184 61 25 21 51 83
Kenya 835 11 954 436 70 332 43 63 31 52 83
Lesotho 953 12 1070 778 124 700 82 236 29 81 97
Liberia 545 04 719 141 28 294 132 15 17 51 79
Madagascar 616 53 969 1581 30 180 41 02 11 29 71
Malawi 670 18 1000 321 42 191 62 110 56 77 95
Mali 182 05 784 1633 44 384 56 10 36 44 81
Mauritania 503 13 1030 736 29 219 25 07 26 47 52
Mauritius 853 13 1010 245 32 3830 57 10 91 99 100
Mozambique 415 05 883 998 50 247 57 115 17 29 77
Namibia 881 16 1040 315 64 2580 60 131 33 88 99
Niger 151 08 753 5143 45 209 61 08 9 39 96
Nigeria 498 09 851 08 693 58 36 32 42 75
Rwanda 668 18 1000 2521 41 482 90 29 54 62 77
Senegal 387 11 955 2169 58 589 57 09 51 52 92
Seychelles 923 15 1030 340 50 3660 40 100
Sierra Leone 301 06 840 251 43 439 131 16 13 26 86
Somalia 09 535 04 07 23 9 67
Sudan 608 09 894 121 946 73 11 34 52 64
South Africa 870 12 994 328 54 4850 85 178 77 78 99
Swaziland 862 11 921 491 78 1560 63 259 55 61 92
Tanzania Utd Rep 669 15 961 409 68 253 51 56 24 45 80
Togo 444 04 753 130 46 289 59 32 12 41 87
Uganda 589 15 987 1339 32 425 82 65 48 64 91
Zambia 613 14 958 10 13 471 48 135 49 46 87
Zimbabwe 894 971 2143 52 143 44 72 99
157
TABLE 24 Education health and sanitation (continued)Literacyratefemale
Ratio of girls-to-boys Expendi-ture perstudent
Public expon
education
Health expenditure Prevalenceof HIV
Access to improved
out ofprimaryschool
in primand seceducation
share ofGDP percapita
share ofGDP
currentper capita
share ofGDP
ages15-49
sanitationfacilities
water source
ratio US$ rur urb
2009 2009 2009 2009 2009 2009 2009 2009 2008 2008 2008
ASIA
Central Asia
Kazakhstan 996 26 986 79 28 3300 45 01 97 90 99
Kyrgyzstan 990 11 1010 173 59 571 68 03 93 85 99
Tajikistan 996 01 906 218 35 380 53 02 94 61 94
Turkmenistan 994 43 771 23 98 97
Uzbekistan 991 08 987 74 622 52 01 100 81 98
East Asia
Brunei Darussalam 937 18 1010 37 7910 30
Cambodia 709 08 897 54 21 421 59 05 29 56 81
China 909 12 1050 1015 19 1770 46 01 55 82 98
Indonesia 891 04 977 397 28 554 24 02 52 71 89
Korea DPR 1000 100 100
Korea Republic of 00 972 528 42 11100 65 01 100 88 100
Lao PDR 632 09 872 100 23 358 41 02 53 51 72
Malaysia 903 10 1030 604 41 3360 48 05 96 99 100
Mongolia 979 15 1030 162 56 742 47 01 50 49 97
Myanmar 895 08 997 54 13 125 20 06 81 69 75
Philippines 958 14 1020 276 28 669 38 01 76 87 93
Singapore 920 116 30 15000 39 01 100 100
Thailand 915 09 1030 554 41 1680 43 13 96 98 99
Viet Nam 905 04 932 982 53 797 72 04 75 92 99
South Asia
Afghanistan 50 07 623 19 509 74 37 39 78
Bangladesh 510 21 1080 256 24 184 34 01 53 78 85
Bhutan 387 13 1000 387 48 980 55 02 65 88 99
India 508 05 922 777 31 448 42 03 31 84 96
Iran (Islamic Rep) 807 07 965 583 47 2690 55 02 98
Maldives 984 06 982 00 112 3310 80 01 98 86 99
Nepal 469 06 825 731 47 253 58 04 31 87 93
Pakistan 401 07 819 27 226 26 01 45 87 95
Sri Lanka 891 12 1040 30 836 40 01 91 88 98
West Asia
Armenia 994 17 1030 533 30 1290 47 01 90 93 98
Azerbaijan 992 10 1020 156 28 2850 58 01 45 71 88
Bahrain 902 03 1010 326 29 11100 45 100
Cyprus 969 05 1000 1352 41 60 100 100 100
Georgia 997 06 965 410 32 2560 101 01 95 96 100
Iraq 699 04 813 51 985 39 73 55 91
Jordan 889 14 1020 277 49 3360 93 98 91 98
Kuwait 918 08 1010 257 38 14200 33 100 99 99
Lebanon 860 09 1040 102 18 6630 81 01 100 100
Occupied PalestinianTerritory
Saudi Arabia 811 08 913 367 56 7140 50 97
Syrian Arab Republic 780 01 973 338 48 720 29 96 84 94
Turkey 853 07 929 547 31 5710 67 01 90 96 100
United Arab Emirates 915 06 998 270 12 15200 28 97 100 100
Yemen 447 06 657 52 640 56 52 57 72
LATIN AMERICA amp THECARIBBEAN
Argentina 977 22 1050 565 49 7300 95 05 90 80 98
Bahamas 14 1010 33 15600 72 31 100 98
Barbados 603 minus67 10400 68 14 100 100 100
Belize 703 44 1010 395 58 2170 49 23 90 100 99
Bolivia (Plur State) 868 12 988 282 63 848 48 02 25 67 96
Brazil 902 07 1030 650 51 7340 91 80 84 99
Chile 987 09 985 428 40 7870 82 04 96 75 99
Colombia 934 10 1050 580 48 3230 64 05 74 73 99
Costa Rica 963 12 1020 290 63 6680 105 03 95 91 100
158
TABLE 24 Education health and sanitation (continued)Literacyratefemale
Ratio of girls-to-boys Expendi-ture perstudent
Public expon
education
Health expenditure Prevalenceof HIV
Access to improved
out ofprimaryschool
in primand seceducation
share ofGDP percapita
share ofGDP
currentper capita
share ofGDP
ages15-49
sanitationfacilities
water source
ratio US$ rur urb
2009 2009 2009 2009 2009 2009 2009 2009 2008 2008 2008
Cuba 998 08 988 1553 136 7070 118 01 91 89 96
Dominica 15 1020 407 47 3610 64
Dominican Republic 883 11 965 147 23 2710 59 09 83 84 87
Ecuador 815 28 1030 92 10 2550 61 04 92 88 97
El Salvador 818 16 983 176 36 2290 63 08 87 76 94
French Guiana
Grenada 960 22 970 227 48 4470 74 97 97
Guatemala 695 04 938 166 32 1860 71 08 81 90 98
Guyana 06 997 447 61 1330 81 12 81 93 98
Haiti 446 10 946 15 396 61 19 17 55 71
Honduras 835 23 1070 36 1170 60 08 71 77 95
Jamaica 911 09 1000 850 58 2310 51 17 83 89 98
Mexico 921 17 1020 637 48 5150 65 03 85 87 96
Netherlands Antilles 964 1020
Nicaragua 779 12 1020 144 31 1050 96 02 52 68 98
Panama 930 08 1010 390 38 5910 83 09 69 83 97
Paraguay 935 10 995 530 40 1590 71 03 70 66 99
Peru 846 12 994 180 27 2010 46 04 68 61 90
St Kitts amp Nevis 15 1040 79 97 6340 60 96 99 99
St Lucia 10 994 368 45 4430 81 98 98
St Vincent amp Grenadines 01 977 455 66 3010 57
Suriname 938 09 1070 90 4290 76 10 84 81 97
Trinidad amp Tobago 983 05 1010 189 42 10700 57 15 92 93 98
Uruguay 986 08 1040 374 29 6980 75 05 100 100 100
Venezuela (Boliv Rep of) 949 11 1020 173 37 6860 60
OCEANIA
Fiji 10 1030 967 62 1300 34 01
French Polynesia 15 1090 98 100 100
New Caledonia 960
Papua New Guinea 565 08 835 65 367 31 09 45 33 87
Samoa 985 17 1050 120 58 2050 70 100
Solomon Islands 690 10 940 22 719 54
Tonga 991 06 999 1449 39 1610 62 96 100 100
Vanuatu 803 05 995 353 48 1060 40 52 79 96
DEVELOPED REGIONS
NORTH AMERICA
Bermuda 979 157 26
Canada 23 987 440 49 43800 109 02 100 99 100
United States of America 14 1000 682 55 74100 162 06 100 94 100
ASIA amp OCEANIA
Australia 14 973 509 45 38700 85 01 100 100 100
Israel 887 15 1010 611 59 19700 76 02 100 100 100
Japan 11 1000 647 35 33200 83 01 100 100 100
New Zealand 31 1030 675 61 26300 97 01 100 100
EUROPE
Albania 947 09 995 444 29 2650 69 98 98 96
Belarus 997 17 1010 150 45 2950 58 03 93 99 100
Bosnia amp Herzegovina 964 13 1020 4950 109 95 98 100
Croatia 981 12 1020 732 46 11200 78 01 99 97 100
European Union 1010 764 49 33700 103 02 98 100 100
Iceland 13 1020 771 74 31300 82 03 100 100 100
Macedonia FYR 956 13 983 238 35 3140 69 89 99 100
Montenegro 6170 93 92 96 100
Norway 13 990 895 68 76600 97 01 100 100 100
Republic of Moldova 980 10 1010 1286 96 1810 119 04 79 85 96
Russian Federation 994 12 980 142 39 4750 54 10 87 89 98
Serbia 09 1010 1105 48 4190 99 01 92 98 99
Switzerland 57 973 956 52 71400 113 04 100 100 100
Ukraine 996 11 988 251 53 1800 70 11 95 97 98
159
TABLE 25 Food aid receivedFood aid received
thousandtonnes
thousandtonnes
thousandtonnes
thousandtonnes
thousandtonnes
1990 1995 2000 2005 2010
WORLD 13172 10201 11345 8288 5682
DEVELOPING REGIONS 10922 9143 9462 8245 5682
AFRICA 5255 3562 4320 4656 3491
North Africa 2268 263 318 56 27
Algeria 10 27 33 42 24
Egypt 1606 207 41 14 3
Libya 0 0 0 0 0
Morocco 271 2 241 0 0
Tunisia 383 27 4 0 0
Sub-Saharan Africa 2986 3299 4002 4601 3464
Angola 124 220 296 57 4
Benin 15 21 12 15 19
Botswana 15 10 0 0 0
Burkina Faso 34 41 33 39 45
Burundi 3 103 11 73 34
Cameroon 3 7 4 14 14
Cape Verde 59 73 53 29 16
Central African Republic 3 1 3 5 10
Chad 26 21 23 74 111
Comoros 4 6 0 0 0
Congo 8 13 18 9 7
Cocircte drsquoIvoire 66 24 17 34 21
Congo Dem Rep 98 109 74 103 193
Djibouti 9 20 12 21 10
Equatorial Guinea 5 4 2 0 0
Eritrea 0 104 257 232 0
Ethiopia 864 636 1527 1122 1415
Gabon 0 0 1 0 0
Gambia 4 4 8 11 23
Ghana 66 97 101 66 7
Guinea 11 8 5 41 4
Guinea-Bissau 5 3 27 11 7
Kenya 90 80 291 155 258
Lesotho 42 34 6 44 7
Liberia 35 161 116 102 30
Madagascar 54 38 44 47 26
Malawi 219 236 36 153 38
Mali 39 20 12 41 25
Mauritania 45 45 17 92 39
Mauritius 11 1 0 0 0
Mozambique 423 386 185 117 80
Namibia 12 3 2 2 1
Niger 40 25 20 139 159
Nigeria 0 0 1 20 0
Rwanda 9 274 232 42 7
Senegal 63 21 54 30 41
Seychelles 1 0 0 0 0
Sierra Leone 11 34 28 39 24
Somalia 98 53 61 40 72
Sudan 230 82 182 931 476
South Africa 7 0 3 0 0
Swaziland 10 7 0 12 17
Tanzania Utd Rep 35 145 63 116 38
Togo 12 6 4 1 2
Uganda 47 77 87 293 80
Zambia 11 26 49 146 7
Zimbabwe 14 13 16 80 92
160
TABLE 25 Food aid received (continued)Food aid received
thousandtonnes
thousandtonnes
thousandtonnes
thousandtonnes
thousandtonnes
1990 1995 2000 2005 2010
ASIA 3357 4641 4314 2958 1775
Central Asia 0 432 195 239 75
Kazakhstan 0 1 0 0 0
Kyrgyzstan 0 150 60 166 50
Tajikistan 0 226 60 73 25
Turkmenistan 0 53 7 0 0
Uzbekistan 0 1 68 0 0
East Asia 530 952 2239 1663 232
Brunei Darussalam 0 0 0 0 0
Cambodia 25 91 62 24 17
China 78 128 90 49 0
Indonesia 56 19 429 197 0
Korea DPR 0 544 1264 1180 80
Korea Republic of 0 0 0 0 0
Lao PDR 0 27 5 19 20
Malaysia 0 0 0 0 0
Mongolia 0 12 46 55 0
Myanmar 0 4 10 16 31
Philippines 160 55 218 121 82
Singapore 0 0 0 0 0
Thailand 148 2 1 1 0
Viet Nam 62 70 82 0 0
South Asia 2288 1445 937 838 1247
Afghanistan 43 133 210 208 140
Bangladesh 1050 586 269 293 194
Bhutan 5 6 4 2 3
India 382 398 321 102 16
Iran (Islamic Rep) 26 13 3 2 5
Maldives 2 3 3 11 12
Nepal 8 38 53 54 53
Pakistan 462 119 20 30 763
Sri Lanka 310 148 55 136 60
West Asia 539 1812 943 218 222
Armenia 0 476 96 22 7
Azerbaijan 0 391 28 12 0
Bahrain 0 0 0 0 0
Cyprus 0 0 0 0 0
Georgia 0 598 71 20 1
Iraq 0 102 18 36 7
Jordan 261 122 401 3 0
Kuwait 0 0 0 0 0
Lebanon 43 11 42 12 0
Occupied PalestinianTerritory
26 48 57 83 90
Saudi Arabia 0 0 0 0 0
Syrian Arab Republic 38 45 35 10 35
Turkey 14 1 0 0 0
United Arab Emirates 0 0 0 0 0
Yemen 157 18 195 21 83
LATIN AMERICA amp THECARIBBEAN
2306 939 828 632 416
Argentina 0 0 0 0 0
Bahamas 0 0 0 0 0
Barbados 0 0 0 0 0
Belize 0 0 0 0 0
Bolivia (Plur State) 262 86 80 65 8
Brazil 29 1 0 0 0
Chile 8 0 0 0 0
Colombia 5 15 12 14 12
Costa Rica 7 3 0 0 0
161
TABLE 25 Food aid received (continued)Food aid received
thousandtonnes
thousandtonnes
thousandtonnes
thousandtonnes
thousandtonnes
1990 1995 2000 2005 2010
Cuba 3 6 24 7 0
Dominica 0 7 0 0 0
Dominican Republic 40 6 2 0 50
Ecuador 77 19 42 43 3
El Salvador 203 25 3 67 3
French Guiana 0 0 0 0 0
Grenada 0 0 0 0 0
Guatemala 185 70 137 69 70
Guyana 46 33 26 0 0
Haiti 108 168 164 137 266
Honduras 146 53 68 98 3
Jamaica 293 56 46 11 0
Mexico 280 46 2 0 0
Netherlands Antilles 0 0 0 0 0
Nicaragua 232 63 62 43 2
Panama 1 2 0 0 0
Paraguay 4 1 0 0 0
Peru 359 254 149 78 0
St Kitts amp Nevis 0 0 0 0 0
St Lucia 0 3 0 0 0
St Vincent amp Grenadines 0 0 0 0 0
Suriname 0 20 0 0 0
Trinidad amp Tobago 0 0 0 0 0
Uruguay 20 0 0 0 0
Venezuela (Boliv Rep of) 0 0 11 0 0
OCEANIA 3 0 0 0 0
Fiji 0 0 0 0 0
French Polynesia 0 0 0 0 0
New Caledonia 0 0 0 0 0
Papua New Guinea 0 0 0 0 0
Samoa 0 0 0 0 0
Solomon Islands 0 0 0 0 0
Tonga 0 0 0 0 0
Vanuatu 0 0 0 0 0
DEVELOPED REGIONS 2250 1058 1883 43 0
NORTH AMERICA 0 0 0 0 0
Bermuda 0 0 0 0 0
Canada 0 0 0 0 0
United States of America 0 0 0 0 0
ASIA amp OCEANIA 1 0 0 0 0
Australia 0 0 0 0 0
Israel 1 0 0 0 0
Japan 0 0 0 0 0
New Zealand 0 0 0 0 0
EUROPE 2249 1058 1883 43 0
Albania 0 10 18 6 0
Belarus 0 98 0 0 0
Bosnia amp Herzegovina 0 23 84 0 0
Croatia 0 14 0 0 0
European Union 2249 40 1 0 0
Iceland 0 0 0 0 0
Macedonia FYR 0 0 63 0 0
Montenegro 0 0 0 0 0
Norway 0 0 0 0 0
Republic of Moldova 0 244 14 10 0
Russian Federation 0 125 1403 26 0
Serbia 0 0 0 0 0
Switzerland 0 0 0 0 0
Ukraine 0 120 0 0 0
162
DEFINITIONS AND SOURCES
Definitions and sources
Countries in protracted crisesP2HUNFAOESARHSNPC
Page table 31 (p 86)
Protracted crises are those environments in which a sig-nificant proportion of the population is acutely vulnera-ble to death disease and disruption of livelihoods overa prolonged period of time The governance of these en-vironments is usually very weak with the state having alimited capacity to respond to and mitigate the threatsto the population or provide adequate levels of protec-tion
Source Trade and Markets Division
Owner FAO
Contribution in diets by typeP2HUNFAOESSDIETCPF
Page table 16 (p 135)
Dietary contribution refers to the amount of carbohy-dratesproteinsfats expressed in kilocalories (kcal) perday available for each individual in the total populationduring the reference period Caloric content is derived byapplying the appropriate food composition factors to thequantities of the commodities Per person supplies arederived from the total amount of food available for hu-man consumption by dividing total calories by total pop-ulation actually partaking of the food supplies during thereference period However per person figures representonly the average supply available for the population asa whole and do not necessarily indicate what is actuallyconsumed by individuals The actual food consumptionmay be lower than the quantity shown as food availabil-ity depending on the magnitude of wastage and lossesof food in the household eg during storage in prepa-ration and cooking as plate-waste or quantities fed todomestic animals and pets thrown or given away
Source Statistics Division
Owner FAO
Dietary Energy Supply per personP2HUNFAOESSDIETDES
Page table 16 (p 135) chart 37 (p 93) map 20 (p 92)
Dietary energy supply per person refers to the amountof food expressed in kilocalories (kcal) per day avail-able for each individual in the total population duringthe reference period Caloric content is derived by ap-plying the appropriate food composition factors to thequantities of the commodities Per person supplies arederived from the total amount of food available for hu-man consumption by dividing total calories by total pop-ulation actually partaking of the food supplies during thereference period However per person figures representonly the average supply available for the population asa whole and do not necessarily indicate what is actuallyconsumed by individuals The actual food consumptionmay be lower than the quantity shown as food availabil-ity depending on the magnitude of wastage and losses
of food in the household eg during storage in prepa-ration and cooking as plate-waste or quantities fed todomestic animals and pets thrown or given awaySource Statistics DivisionOwner FAO
Caloric contribution in diets by commodityP2HUNFAOESSDIETFDS
Page table 40 41 (p 95 95)Contribution of a food Group to total dietary energy sup-plySource Statistics DivisionOwner FAO
Percentage contribution in diets by commodityP2HUNFAOESSDIETFDSx
Page table 16 17 (p 135 138)Percentage contribution of a food group to total dietaryenergy supplySource Statistics DivisionOwner FAO
Depth of hungerP2HUNFAOESSUNMNTDEP
Page table 15 (p 132) chart 36 (p 91)The depth of food deprivation indicates how much food-deprived people fall short of minimum food needs interms of dietary energy It is measured as the differencebetween the minimum dietary energy and the averagedietary energy intake of the undernourished population(food-deprived) The depth of food deprivation is lowwhen it is less than 200 kilocalories per person per dayand high when it is higher than 300 kilocalories per per-son per day The greater the deficit the greater the sus-ceptibility for health risks related to undernutritionSource Statistics DivisionOwner FAO
Incidence of undernourishmentP2HUNFAOESSUNMNTNUM
Page table 15 (p 132) map 19 (p 91)Undernourishment refers to the condition of peoplewhose dietary energy consumption is continuously be-low a minimum dietary energy requirement for main-taining a healthy life and carrying out a light physicalactivity The incidence of undernourishment is the num-ber of people referring to those in this conditionSource Statistics DivisionOwner FAO
Global number of undernourishedP2HUNFAOESSUNMNTPNW
Page chart 33 35 (p 89 90)Undernourishment refers to the condition of peoplewhose dietary energy consumption is continuously be-low a minimum dietary energy requirement for main-taining a healthy life and carrying out a light physical
163
PART 2
activity The global incidence of undernourishment is thetotal number of people in the world referring to those inthis condition
Source Statistics Division
Owner FAO
Percentage of population undernourishedP2HUNFAOESSUNMNTPREV
Page table 15 (p 132) map 18 (p 88)
Undernourishment refers to the condition of peoplewhose dietary energy consumption is continuously be-low a minimum dietary energy requirement for main-taining a healthy life and carrying out a light physicalactivity The percentage of population undernourishedis the total number of people in each country referringto those in this condition divided by the population ofthat country
Source Statistics Division
Owner FAO
Regional percentage of undernourishedP2HUNFAOESSUNMNTPREVR
Page chart 34 (p 90)
Undernourishment refers to the condition of peoplewhose dietary energy consumption is continuously be-low a minimum dietary energy requirement for main-taining a healthy life and carrying out a light physicalactivity The regional percentage of population under-nourished is the total number of people in each regionreferring to those in this condition divided by the popu-lation of that region
Source Statistics Division
Owner FAO
Global affordability of foodP2HUNFAOFPVAFD
Page chart 54 (p 106)
FAO Food Price Index relative to GDP showing howmuchfood prices have risen relative to income from the baseperiod 2002-04 Higer (lower) index scores show greater(less) affordability
Source Statistics Division
Owner FAO
Food price inflationP2HUNFAOFPVFCPI
Page map 25 (p 104)
Annual change in the ILO food price indices The pricedata for the different items included in the computationof the index are normally weighted in order to take intoaccount the relative importance of each item with re-spect to total consumption expenditure In most coun-tries the indices are computed in a derived form suchas weighted arithmetic averages of price relatives fora selected number of representative items between theperiod under consideration and the base period using
one or other forms of Laspeyresrsquo formula The num-ber of items and the weights used to compute the in-dex are given according to expenditure group The termitem is used here to mean the smallest grouping ofgoods and services for which a specific weight is givenThe source(s) and the reference period of the weightsused for the index eg a household expenditure surveynational accounts etc If the reference period for theweights differs from the base period of the index theadjustments made to the weights to take account of theprice changes between the two periods are describedSee httplaborstailoorg for more informationSource LABORSTAOwner ILO
International food prices by food groupP2HUNFAOFPVFPI
Page chart 53 (p 106)The FAO Food Price Index is a measure of themonthly change in international prices of a bas-ket of food commodities It consists of the av-erage of five commodity group price indices (rep-resenting 55 quotations) weighted with the aver-age export shares of each of the groups for 2002-2004 See httpwwwfaoorgworldfoodsituationwfs-homefoodpricesindexen for more information on sub-index constructionSource Statistics DivisionOwner FAO
International food price volatility by food groupP2HUNFAOFPVFPV
Page chart 55 56 (p 107 107)Annualized historical volatility of the FAO Food Price In-dexSource Statistics DivisionOwner FAO
Food price volatility (annualized historical volatility)P2HUNFAOFPVFPVn
Page map 26 (p 108)Annualized historical volatility of the ILO food price in-dicesSource Statistics DivisionOwner FAO
FAO Global Consumption price volatilityP2HUNFAOFPVGCI
Page chart 52 57 (p 105 109)The FAO Global Food Consumption Price Index trackschanges in the cost of the global food basket as por-trayed by the latest FAO world food balance sheet Rep-resentative international prices for each of the commodi-ties or commodity groups appearing in the balance sheetare weighted by their contribution to total calorific in-takeSource Statistics DivisionOwner FAO
164
DEFINITIONS AND SOURCES
Dietary diversity in selected LIFDCs
P2HUNFAOFVDIETDIV
Page chart 39 (p 94)
The Herfindahl index H is calculated as H =sumN=1 S
2
where S is the consumption share of the starchy staple in diets and N is the number of staples consumed For asingle staple consumed the index would equate to oneand declines as the staple base becomes more diversi-fied
Source Statistics Division
Owner FAO
Starchy root consumption and DES
P2HUNFAOFVDIETRTDES
Page chart 38 (p 94)
Caloric equivalent of starchy roots available for con-sumption as a ratio of total dietary energy supply
Source Statistics Division
Owner FAO
Availability of dietary iron
P2HUNFAOMCNIRON
Page table 18 (p 141) chart 44 (p 98)
The dietary availability of iron is calculated by convert-ing the amount of food available for human consumptionas estimated by the FAO Food Balance Sheets in equiv-alent of iron derived from animal and vegetal productsHowever the actual food consumptionmay be lower thanthe quantity shown as food availability depending on themagnitude of wastage and losses of food in the house-hold eg during storage in preparation and cooking asplate-waste or quantities fed to domestic animals andpets thrown or given away
Source Statistics Division
Owner FAO
Food + energy import bills ( GDP)
P2HUNFAOTFSFDFL
Page table 20 (p 147)
The annual value of food imported under SITC sections0 + 22+ 4 plus fuels under SITC section 3 expressed asa ratio of GDP
Source Statistics Division (FAOSTAT) and UNCTADSTAT
Owner FAO UNCTAD
Food import bills
P2HUNFAOTFSFIB
Page table 20 (p 147) chart 49 50 51 (p 103 103103)
The annual value of food imported under SITC sections0 + 22+ 4 expressed in current US$
Source Statistics Division (FAOSTAT) and UNCTADSTAT
Owner FAO UNCTAD
Food + energy import bills per capita
P2HUNFAOTFSFUEL
Page chart 50 51 (p 103 103)
The annual value of food imported under SITC sections0 + 22+ 4 plus fuels under SITC section 3 expressed asa ratio of population
Source Statistics Division (FAOSTAT) and UNCTADSTAT
Owner FAO UNCTAD
Index of variability of food production
P2HUNFAOTFSQPVAR
Page chart 46 (p 102)
Rolling ten-year window of the coefficient of variation ofper capita production index
Source Statistics Division
Owner FAO
Food self-sufficiency (calories)
P2HUNFAOTFSSSCAL
Page table 19 (p 144) chart 45 (p 101) map 24 (p100)
The self-sufficiency ratio (SSR) is defined as SSR = pro-duction x 100(production + imports - exports) The SSRcan be calculated for individual commodities groups ofcommodities of similar nutritional values and after ap-propriate conversion of the commodity equations alsofor the aggregate of all commodities In the context offood security the SSR is often taken to indicate the ex-tent to which a country relies on its own production re-sources ie the higher the ratio the greater the self-sufficiency While the SSR can be the appropriate toolwhen assessing the supply situation for individual com-modities a certain degree of caution should be observedwhen looking at the overall food situation In the casehowever where a large part of a countryrsquos production ofone commodity eg other cereals is exported the SSRmay be very high but the country may still have to relyheavily on imports of food commodities to feed the pop-ulation The self-sufficiency rate (as defined above) can-not be the complement to 100 of the import dependencyrate or vice-versa
Source Statistics Division
Owner FAO
Months of cereal self-provisioning capacity
P2HUNFAOTFSSTU
Page chart 47 48 (p 102 103)
Stocks-to-utilization ratios for cereals (wheat rice andcoarse grains) where stocks refer to the carry-over ofthe preceding national crop season The ratio is thenmultiplied by 12 to calculate the number of months ofself-provisioning capacity in a given year
Source Trade and Markets Division
Owner FAO
165
PART 2
Persons affected by natural disastersP2HUNODFAEMDATRHSPPND
Page table 14 (p 129) chart 29 (p 85) map 16 (p 84)People requiring immediate assistance during a periodof emergency ie requiring basic survival needs suchas food water shelter sanitation and immediate med-ical assistance Appearance of a significant number ofcases of an infectious disease introduced in a region ora population that is usually free from that disease Seewwwemdatnet (Universiteacute catholique de Louvain Brus-sels Belgium)Source International Disaster Database EM-DATOwner OFDA and CRED
Total affected by natural disastersP2HUNODFAEMDATRHSPPNDT
Page chart 30 (p 86)Sum of (i) injured people suffering from physical injuriestrauma or an illness requiring medical treatment as a di-rect result of a disaster (ii) homeless people needing im-mediate assistance for shelter and (iii) affected peoplerequiring immediate assistance during a period of emer-gency it can also include displaced or evacuated peopleSee wwwemdatnet (Universiteacute catholique de LouvainBrussels Belgium)Source International Disaster Database EM-DATOwner OFDA and CRED
Multidimensional Poverty IndexP2HUNUNDPHDRMPI
Page table 21 (p 150)An international measure of poverty for 109 developingcountries the MPI complements income-based povertymeasures by reflecting the multiple deprivations thatpeople face at the same time The MPI identifies de-privations across health education and living standardsand shows the number of people who are multidimen-sionally poor and the deprivations that they face at thehousehold levelSource Alkire S Roche JM Santos ME and Seth S(November 2011) ophiqehoxacukOwner OPHI
Gender Inequality IndexP2HUNUNDPHDRPOVGEI
Page table 22 (p 153) map 29 (p 113)The Gender Inequality Index is a composite measure re-flecting inequality in achievements between women andmen in three dimensions reproductive health empow-erment and the labour market It varies between zero(when women and men fare equally) and one (when menor women fare poorly compared to the other in all di-mensions) The health dimension is measured by twoindicators maternal mortality ratio and the adolescentfertility rate The empowerment dimension is also mea-sured by two indicators the share of parliamentary seatsheld by each sex and by secondary and higher educationattainment levels The labour dimension is measured by
womenrsquos participation in the work force The Gender In-equality Index is designed to reveal the extent to whichnational human development achievements are erodedby gender inequality and to provide empirical founda-tions for policy analysis and advocacy effortsSource Human Development Report 2010Owner UNDP
Human Development IndexP2HUNUNDPHDRPOVHDI
Page table 22 (p 153)The HDI represents a national average of human de-velopment achievements in the three basic dimensionsmaking up the HDI health education and income Likeall averages it conceals disparities in human develop-ment across the population within the same countryTwo countries with different distributions of achieve-ments can have the same average HDI value The IHDItakes into account not only the average achievements ofa country on health education and income but also howthose achievements are distributed among its citizens bydiscounting each dimensionrsquos average value accordingto its level of inequalitySource Human Development Report 2010Owner UNDP
Human Development Index (inequality adjusted)P2HUNUNDPHDRPOVHDIi
Page table 22 (p 153) chart 59 (p 112)The Human Development Index (HDI) is a summary mea-sure of human development It measures the averageachievements in a country in three basic dimensionsof human development a long and healthy life ac-cess to knowledge and a decent standard of living TheInequality-adjusted Human Development Index (IHDI)adjusts the Human Development Index (HDI) for inequal-ity in distribution of each dimension across the popula-tion The IHDI accounts for inequalities in HDI dimen-sions by discounting each dimensionrsquos average valueaccording to its level of inequality The IHDI equals theHDI when there is no inequality across people but is lessthan the HDI as inequality rises In this sense the IHDI isthe actual level of human development (accounting forthis inequality) while the HDI can be viewed as an in-dex of potential human development (or the maximumlevel of HDI) that could be achieved if there was no in-equality The loss in potential human development dueto inequality is given by the difference between the HDIand the IHDI and can be expressed as a percentageSource Human Development Report 2010Owner UNDP
Population of concernP2HUNUNHCRGTRHSTPC
Page table 13 (p 126) map 17 (p 87)Refugees are individuals recognized under the 1951Convention relating to the Status of Refugees and alsopeople in a refugee-like situation such as those who
166
DEFINITIONS AND SOURCES
are outside their country or territory of origin and whoface protection risks similar to those of refugees butfor whom refugee status has for practical or other rea-sons not been ascertained Internally Displaced Persons(IDPs) are people or groups of individuals who have beenforced to leave their homes or places of habitual resi-dence in particular as a result of or in order to avoidthe effects of armed conflict situations of generalized vi-olence violations of human rights or natural- or human-made disasters and who have not crossed an interna-tional border Others include Asylum-seekers (personswho have applied for asylum or refugee status but whohave not yet received a final decision on their applica-tion) Returned IDPs and refugees Stateless Persons (in-dividuals not considered as nationals by any State underrelevant national laws) and other groups of concern towhom UNHCR has extended its protection andor assis-tance services based on humanitarian or other specialgrounds
Source Statistical Online Population Database
Owner UNHCR
Total population of concern
P2HUNUNHCRGTRHSTPCT
Page chart 32 (p 87)
Total population of concern is the sum of various groupsof people including refugees asylum-seekers internallydisplaced persons (IDPs) protectedassisted by UNHCRstateless persons and returnees (returned refugees andIDPs)
Source Statistical Online Population Database
Owner UNHCR
Average governance
P2HUNWBKPOVGOV
Page table 23 (p 156) chart 60 (p 115) map 30 (p114)
The Worldwide Governance Indicators project constructsaggregate indicators of six broad dimensions of gover-nance (i) Voice and Accountability (ii) Political Stabil-ity and Absence of ViolenceTerrorism (iii) GovernmentEffectiveness (iv) Regulatory Quality (v) Rule of Law(vi) Control of Corruption The six aggregate indicatorsare based on 30 underlying data sources reporting theperceptions of governance of a large number of surveyrespondents and expert assessments worldwide De-tails on the underlying data sources the aggregationmethod and the interpretation of the indicators can befound in the WGI methodology paper Daniel KaufmannAart Kraay and Massimo Mastruzzi (2010) The World-wide Governance Indicators A Summary of Methodol-ogy Data and Analytical Issues World Bank Policy Re-search Working Paper No 5430 httppapersssrncomsol3paperscfmabstract_id=1682130
Source World Bank
Owner Worldwide Governance Indicators (WGI) project
Ratio of girls-to-boys out of primary school
P2HUNWBKWDIEDUCOSR
Page table 24 (p 159)
Children out of school are the number of primary-school-age children not enrolled in primary or secondary school
Source World Bank (WDI)
Owner UNESCO
Public spending on education total ( of GDP)
P2HUNWBKWDIEDUEXPP
Page table 24 (p 159)
Public expenditure on education consists of current andcapital public expenditure on education includes gov-ernment spending on educational institutions (both pub-lic and private) education administration as well assubsidies for private entities (studentshouseholds andother privates entities)
Source World Bank (WDI)
Owner UNESCO
Expenditure per student
P2HUNWBKWDIEDUEXPS
Page table 24 (p 159)
Public expenditure per student is the public currentspending on education divided by the total number ofstudents by level as a percentage of GDP per capitaPublic expenditure (current and capital) includes govern-ment spending on educational institutions (both publicand private) education administration as well as subsi-dies for private entities (studentshouseholds and otherprivates entities)
Source World Bank (WDI)
Owner UNESCO
Literacy rate adult female ( of females ages 15 andabove)
P2HUNWBKWDIEDUFILT
Page table 24 (p 159) map 31 (p 116)
Adult literacy rate is the percentage of people ages 15and above who can with understanding read and writea short simple statement on their everyday life
Source World Bank (WDI)
Owner UNESCO
Ratio of girls to boys in primary and secondary education()
P2HUNWBKWDIEDUGEN
Page table 24 (p 159) chart 61 (p 117)
Ratio of girls to boys in primary and secondary educationis the ratio of the female to male gross enrolment ratesin primary and secondary school
Source World Bank (WDI)
Owner UNESCO
167
PART 2
Health expenditure per capita (current US$)P2HUNWBKWDIHAEHEPCP
Page table 24 (p 159) map 32 (p 118)
Total health expenditure is the sum of public and pri-vate health expenditures as a ratio of total populationIt covers the provision of health services (preventive andcurative) family planning activities nutrition activitiesand emergency aid designated for health but does notinclude provision of water and sanitation Data are incurrent US dollars
Source World Bank (WDI)
Owner WHO
Health expenditure total ( of GDP)P2HUNWBKWDIHAEHETOT
Page table 24 (p 159) chart 62 (p 119)
Total health expenditure is the sum of public and privatehealth expenditure It covers the provision of health ser-vices (preventive and curative) family planning activi-ties nutrition activities and emergency aid designatedfor health but does not include provision of water andsanitation
Source World Bank (WDI)
Owner WHO
Prevalence of HIV total ( of population ages 15-49)P2HUNWBKWDIHAEHIVPREV
Page table 24 (p 159)
Prevalence of HIV refers to the percentage of people ages15-49 who are infected with HIV
Source World Bank (WDI)
Owner UNAIDS and WHO
Improved sanitation facilities ( of population with ac-cess)P2HUNWBKWDIHAESANIMPS
Page table 24 (p 159) chart 63 (p 121)
Access to improved sanitation facilities refers to the per-centage of the population with at least adequate accessto excreta disposal facilities that can effectively preventhuman animal and insect contact with excreta Im-proved facilities range from simple but protected pit la-trines to flush toilets with a sewerage connection Tobe effective facilities must be correctly constructed andproperly maintained
Source World Bank (WDI)
Owner WHO and UNCF
Improved water source rural ( of rural population withaccess)P2HUNWBKWDIHAEWATIMPRU
Page table 24 (p 159) map 33 (p 120)
Access to an improved water source refers to the percent-age of the population with reasonable access to an ad-equate amount of water from an improved source suchas a household connection public standpipe borehole
protected well or spring and rainwater collection Unim-proved sources include vendors tanker trucks and un-protected wells and springs Reasonable access is de-fined as the availability of at least 20 litres a person aday from a source within one kilometre of the dwellingSource World Bank (WDI)Owner WHO and UNCF
Improved water source urban ( of urban populationwith access)P2HUNWBKWDIHAEWATIMPWU
Page table 24 (p 159)Access to an improved water source refers to the percent-age of the population with reasonable access to an ad-equate amount of water from an improved source suchas a household connection public standpipe boreholeprotected well or spring and rainwater collection Unim-proved sources include vendors tanker trucks and un-protected wells and springs Reasonable access is de-fined as the availability of at least 20 litres a person aday from a source within one kilometre of the dwellingSource World Bank (WDI)Owner WHO and UNCF
Poverty headcount ratio at $125 a day (PPP) ( of re-gional population)P2HUNWBKWDIPOVAGG
Page chart 58 (p 111)Data are from PovcalNet the on-line tool for povertymeasurement developed by the Development ResearchGroup of the World Bank See httpiresearchworldbankorgPovcalNetpovDuplichtmlSource PovcalNetOwner World Bank
Gini-index of income distributionP2HUNWBKWDIPOVGINI
Page table 22 (p 153) map 28 (p 113)Gini index measures the extent to which the distribu-tion of income among individuals or households withinan economy deviates from a perfectly equal distributionA Lorenz curve plots the cumulative percentages of totalincome received against the cumulative number of recip-ients starting with the poorest individual or householdThe Gini index measures the area between the Lorenzcurve and a hypothetical line of absolute equality ex-pressed as a percentage of the maximum area under theline Thus a Gini index of 0 represents perfect equalitywhile an index of 100 implies perfect inequalitySource World Bank (WDI)Owner World Bank
Poverty headcount ratio at $125 a day (PPP) ( of pop-ulation)P2HUNWBKWDIPOVH125
Page table 21 (p 150)Population below US$125 a day is the percentage of thepopulation living on less than US$125 a day at 2005
168
DEFINITIONS AND SOURCES
international prices As a result of revisions in PPP ex-change rates poverty rates for individual countries can-not be compared with poverty rates reported in earliereditionsSource World Bank (WDI)Owner World Bank
Income share held by highest 20P2HUNWBKWDIPOVH20
Page table 22 (p 153)Percentage share of income or consumption is the sharethat accrues to subgroups of population indicated bydeciles or quintiles Percentage shares by quintile maynot sum to 100 because of roundingSource World Bank (WDI)Owner World Bank
Poverty headcount ratio at $2 a day (PPP) ( of popula-tion)P2HUNWBKWDIPOVH200
Page table 21 (p 150)Population below US$2 a day is the percentage of thepopulation living on less than US$200 a day at 2005international prices As a result of revisions in PPP ex-change rates poverty rates for individual countries can-not be compared with poverty rates reported in earliereditionsSource World Bank (WDI)Owner World Bank
Poverty headcount ratio at national poverty line ( ofpopulation)P2HUNWBKWDIPOVHNPL
Page table 21 (p 150)National poverty rate is the percentage of the popula-tion living below the national poverty line National es-timates are based on population-weighted subgroup es-timates from household surveysSource World Bank (WDI)Owner World Bank
Poverty headcount ratio at rural poverty line ( of ruralpopulation)P2HUNWBKWDIPOVHRPL
Page table 21 (p 150)Rural poverty rate is the percentage of the rural popula-tion living below the national rural poverty lineSource World Bank (WDI)Owner World Bank
Income share held by lowest 20P2HUNWBKWDIPOVL20
Page table 22 (p 153)Percentage share of income or consumption is the sharethat accrues to subgroups of population indicated bydeciles or quintiles Percentage shares by quintile maynot sum to 100 because of roundingSource World Bank (WDI)Owner World Bank
Poverty gap at $125 a day (PPP) ()P2HUNWBKWDIPOVP125
Page table 21 (p 150) map 27 (p 110)Poverty gap is the mean shortfall from the poverty line(counting the nonpoor as having zero shortfall) ex-pressed as a percentage of the poverty line This mea-sure reflects the depth of poverty as well as its incidenceSource World Bank (WDI)Owner World Bank
Poverty gap at $2 a day (PPP) ()P2HUNWBKWDIPOVP200
Page table 21 (p 150)Poverty gap is the mean shortfall from the poverty line(counting the nonpoor as having zero shortfall) ex-pressed as a percentage of the poverty line This mea-sure reflects the depth of poverty as well as its incidenceSource World Bank (WDI)Owner World Bank
Poverty gap at national poverty line ()P2HUNWBKWDIPOVPNPL
Page table 21 (p 150)Poverty gap at national poverty line is the mean short-fall from the poverty line (counting the nonpoor as hav-ing zero shortfall) as a percentage of the poverty lineThis measure reflects the depth of poverty as well as itsincidenceSource World Bank (WDI)Owner World Bank
Poverty gap at rural poverty line ()P2HUNWBKWDIPOVPRPL
Page table 21 (p 150)Poverty gap at rural poverty line is the mean shortfallfrom the poverty line (counting the nonpoor as hav-ing zero shortfall) as a percentage of the national ruralpoverty line This measure reflects the depth of povertyas well as its incidenceSource World Bank (WDI)Owner World Bank
Food aid receivedP2HUNWFPFAISFDAID
Page table 25 (p 162) chart 64 (p 123) map 34 (p122)Quantity of food aid that reaches the recipient coun-try during a given period Quantities exported in GrainEquivalent The latter is a unit of measurement usedas alternative to Actual Ton for cereal-derived productsTo convert a product into grain equivalent a commodityspecific conversion factor is used For example if the fac-tor to convert wheat flour into wheat is 137 a tonne ofwheat flour corresponds to 0730 tons of wheat (1137)Source Food Aid Information SystemOwner WFP
169
PART 2
Percentage of adults with low body mass index (BMI)P2HUNWHOGHOADLTLBMI
Page table 18 (p 141)The indicator of weight adequacy in relation to height ofolder children adolescents and adults It is calculated asweight (kilograms) divided by height (metres) squaredThe acceptable range for adults is 185 to 249 and forchildren it varies with ageSource Global Health ObservatoryOwner WHO
Percentage of female adults with low body mass index(BMI)P2HUNWHOGHOADLTLBMIF
Page table 18 (p 141) map 22 (p 99)The indicator of weight adequacy in relation to height ofolder female children adolescents and adults It is cal-culated as weight (kilograms) divided by height (metres)squared The acceptable range for adults is 185 to 249 and for children it varies with ageSource Global Health ObservatoryOwner WHO
Percentage of adults who are obese by genderP2HUNWHOGHOADLTOBS
Page table 18 (p 141)Percentage of male and female defined population witha body mass index (BMI) of 25 kgm2 or higherSource Global Health ObservatoryOwner WHO
Percentage of adults who are obeseP2HUNWHOGHOADLTOBSx
Page map 23 (p 99)Percentage of adult defined population with a bodymassindex (BMI) of 25 kgm2 or higherSource Global Health ObservatoryOwner WHO
Percentage of children under 5 who are stuntedP2HUNWHOGHOCHLDSTNT
Page table 18 (p 141) chart 43 (p 98)Percentage of stunting (height-for-age less than -2 stan-dard deviations of the WHO Child Growth Standards me-dian) among children aged 0-5 yearsSource Global Health ObservatoryOwner WHO
Percentage of children under 5 who are underweightP2HUNWHOGHOCHLDUW
Page table 18 (p 141) chart 42 (p 97) map 21 (p 96)Percentage of underweight (weight-for-age less than -2standard deviations of the WHO Child Growth Standardsmedian) among children aged 0-5 yearsSource Global Health ObservatoryOwner WHO
Percentage of children under 5 who are wastedP2HUNWHOGHOCHLDWSTD
Page table 18 (p 141) chart 43 (p 98)Percentage of wasting (weight-for-height less than -2standard deviations of the WHO Child Growth Standardsmedian) among children aged 0-5 yearsSource Global Health ObservatoryOwner WHO
Percentage of newborns with low birth weightP2HUNWHOGHONEWLWB
Page table 18 (p 141)Low-birthweight babies are newborns weighing lessthan 2500 grams with the measurement taken withinthe first hours of life before significant postnatal weightloss has occurredSource Global Health ObservatoryOwner WHO
170

PART 2
Investment in health is also important for human wel-fare and sustained economic and social developmentTimely access to health services ndash that is to a mix ofpromotion prevention treatment and rehabilitation ndash iscritical This cannot be achieved for the majority of thepopulation without a well-functioning health financingsystem
The most recent estimates of money needed to ensureaccess to essential healthcare suggests that on aver-age low-income countries must spend around US$ 60per capita which is almost double the amount they arecurrently spending Public financing is usually a mixof government money loans grants and aid from in-ternational organizations and non-governmental orga-nizations Apart from insufficient overall funds the percapita distribution of public expenditure on healthcareacross countries is vastly uneven It is unrealistic toexpect most low-income countries to achieve universalcoverage Access is often dictated by the ability to payand fees are a major hindrance for poor people solicitingtreatment
There are other factors beside income that determine ac-cess to health care For instance migrants ethnic mi-norities and indigenous people use services less thanother population groups even though their needs maybe higher Also when people do require healthcare theyoften incur high sometimes catastrophic costs in payingfor access According to the World Health Organization(WHO) about 150 million people globally suffer finan-cial catastrophe annually while 100 million are pushedbelow the poverty line each year
Often lost income causes strenuous financial penaltieson the ill and those who care for them The Interna-tional Labour Organization (ILO) finds that only one infive people in the world has broad-based social securityprotection that also includes cover for lost wages in theevent of illness and more than half the worldrsquos popula-tion lacks any type of formal social protection
Map 32
No Data lt 50 50 minus 150 150 minus 300 300 minus 1000 gt 1000
Annual health expenditure per capita (US$ 2009)
Source WHO
Metalink P2HUNWBKWDIHAEHEPCP p 168
rarr USD 860 spent annually on health perperson at the global level
rarr This number masks huge differences be-tween regions
rarr An average of just USD 32 is spent on aper capita basis in low-income countries
118
EDUCATION HEALTH AND SANITATION
No Data lt 50 50 minus 150 150 minus 300 300 minus 1000 gt 1000
Annual health expenditure per capita (US$ 2009)
Chart 62 Budgetary constraints preclude adequate public health spending in many de-veloping regions
Annual health expenditure (2009)
ofGDP
0
2
4
6
8
10
DevelopedEastAsia
LAmer ampCarib
SouthAsia
Sub-SAfrica
Source WHO
Metalink P2HUNWBKWDIHAEHETOT p 168
119
PART 2
Improving access to safe water and sanitation cangreatly reduce the burden on health systems and pro-mote wider development According to the United Na-tions Childrenrsquos Fund (UNICEF) 25 billion people in de-veloping countries ndash around 50 percent of their popula-tion ndash lack improved sanitation facilities and over 884million still use unsafe drinking water sources
Inadequate access to safe water and sanitation servicescoupled with poor hygiene practices kills and sickensthousands of children every day and leads to impov-erishment and diminished opportunities for thousandsmore Estimates point to some 2 million people dyingevery year as a result of diarrhoea and diseases causedby ingesting contaminated water
Poor water and sanitation have many other seriousrepercussions as well Children especially girls are de-nied their right to education because schools lack pri-vate and decent sanitation facilities Women and girlsare forced to spend large parts of their day searching forand fetching water denying them participation in edu-cation and income-generating employment
Inadequate water and sanitation means that poor farm-ers and wage earners are less productive due to ill-ness health systems are overwhelmed and nationaleconomies underperform
Further reading
bull UNESCO education (wwwunescoorgneweneducation)
bull UNICEF Water Sanitation and Hygiene (wwwuniceforgwash)
bull WHO The world health report - Health systems financ-ing the path to universal coverage (wwwwhointwhr2010enindexhtml
bull UNDP Human Development Report 2010 (hdrundporgenreportsglobalhdr2010)
bull OrsquoDonovan (2008)
Map 33
No Data lt 30 30 minus 50 50 minus 75 75 minus 90 gt 90
Improved water source minus share of rural population with access ( 2008)
Source WHO
Metalink P2HUNWBKWDIHAEWATIMPRU p 168
rarr 78 percent of the worldrsquos rural popula-tion now have access to clean water
rarr Progress has been slow - just 15 percentmore than two decades ago
rarr Yet in many developing countries morethan half of all households struggle withinadequate access to safe water and san-itation services
120
EDUCATION HEALTH AND SANITATION
No Data lt 30 30 minus 50 50 minus 75 75 minus 90 gt 90
Improved water source minus share of rural population with access ( 2008)
Chart 63 There are still many who do not have access to adequate sanitation
Improved sanitation facilities - share of population with access (2008)
0
20
40
60
80
DevelopedEastAsia
LAmer ampCarib
SouthAsia
Sub-SAfrica
Source WHO
Metalink P2HUNWBKWDIHAESANIMPS p 168
121
PART 2
Food aidEmergency situations have become increasingly fre-quent over the past 25 years and are often coupled withacute and chronic food insecurity in the affected coun-tries International responses to these crises have gen-erally focused on addressing immediate humanitarianneeds as evidenced by the growing share of food aidthat is channelled to emergencies
Several formal agreements govern food-related assis-tance at the international level Among these the FoodAid Convention (FAC) is the only legal instrument to en-sure a minimum amount of food aid The components ofthe FAC have remained largely unchanged since its cre-ation in 1967 and many believe that it no longer appliesto todayrsquos food-related assistance needs Current foodaid patterns do not reflect longer-term requirements In2009 around 80 percent of total assistance was chan-nelled to emergency relief measures while the remain-der was used for promoting agricultural and broader eco-nomic development More troubling is the perceivedhigh negative correlation of international food priceswith the level of food aid
The strong focus on short-term relief measures com-bined with limited support to local agriculture is notonly less effective for overcoming the structural reasonsfor food insecurity it might even lower incentives to in-vest in agriculture and domestic food production Amoresustainable solution is required to tackle the underlyingreasons for food insecurity such as low agricultural pro-ductivity Accordingly those most in need would alsobenefit from the provision of basic inputs such as seedsfertilizers and farming tools
Donors are addressing shortcomings of traditional foodassistance A growing number now rely on procurementmechanisms in the target countries themselves Localpurchases not only minimize market distortions (sup-plies are neither increased nor effective demand low-ered) they are also generally cheaper than in-kind aidand can generate development benefits to local marketsand farmers Some donors also strive for better inte-gration of emergency interventions and longer-term de-velopment operations The European Union for exam-ple envisages a rapid handover to structural food se-curity mechanisms during emergency response Suchmeasures help rebuild the livelihoods of affected pop-ulations and strengthen their resilience to future crises
These examples illustrate a fundamental departure fromthe ad hoc and partial approaches to food security inter-ventions followed in the past They also point to donorsrsquogeneral agreement on the principles that should guidefood aid interventions
Further reading
bull FAO Making the Food Aid Convention meet the re-alities of the 21st century (wwwfaoorgdocrep013al935eal935e00pdf)
bull World Food Programme (wwwwfporg)
Map 34
No Data 0 0001 minus 1 1 minus 50 50 minus 100 gt 100
Food aid received grain equivalent (thousand tonnes 2010)
Source WFP
Metalink P2HUNWFPFAISFDAID p 169
rarr 57 million tonnes of food aid were re-ceived in 2010
rarr Despite no let-up in the number of emer-gencies food aid fell to a historical low
rarr Many donors now rely on locally pur-chased food in order to strengthen do-mestic markets in crisis-hit countries
122
FOOD AID
No Data 0 0001 minus 1 1 minus 50 50 minus 100 gt 100
Food aid received grain equivalent (thousand tonnes 2010)
Chart 64 Food aid flows are in long-term decline and have fallen further at a time whenfood prices have spiked
Food aid received (1988-2010)
Thousandtonnes
6000
8000
10000
12000
14000
16000
1990 1995 2000 2005 2010
Source WFP
Metalink P2HUNWFPFAISFDAID p 169
123
TABLE 13 Population at risk UNHCR population of concernUNHCR population of concern
total totalrefugees
internallydisplacedpersons
others andstatelesspersons
total totalrefugees
internallydisplacedpersons
others andstatelesspersons
thousands thousands thousands thousands thousands thousands thousands thousands
2009 2009 2009 2009 2010 2010 2010 2010
WORLD 29233 10174 15628 3431 29986 10350 14456 5180
DEVELOPING REGIONS 28139 9642 15207 3290 28931 9845 14058 5027
AFRICA 10636 2805 6469 1362 10587 2947 6154 1486
North Africa 143 138 0 5 142 137 0 5
Algeria 10 8 0 2 8 7 0 2
Egypt 9 7 0 2 9 7 0 2
Libya 3 2 0 1 3 2 0 1
Morocco 3 2 0 1 3 2 0 1
Tunisia 3 2 0 1 3 2 0 1
Sub-Saharan Africa 10493 2667 6469 1357 10445 2810 6154 1481
Angola 159 141 0 18 136 135 0 1
Benin 1 0 0 0 1 0 0 0
Botswana 0 0 0 0 0 0 0 0
Burkina Faso 1 1 0 0 2 1 0 1
Burundi 231 94 100 37 254 84 157 12
Cameroon 17 15 0 2 17 15 0 2
Cape Verde 0 0 0 0 0 0 0 0
Central African Republic 357 160 197 1 359 165 193 2
Chad 250 55 171 25 237 54 131 53
Comoros 0 0 0 0 0 0 0 0
Congo 24 21 0 3 24 21 0 3
Cocircte drsquoIvoire 714 23 519 172 585 42 515 29
Congo Dem Rep 2663 456 2053 154 2719 477 1721 520
Djibouti 1 1 0 0 1 1 0 0
Equatorial Guinea 0 0 0 0 0 0 0 0
Eritrea 224 209 0 14 236 222 0 14
Ethiopia 112 63 0 49 118 69 0 49
Gabon 0 0 0 0 0 0 0 0
Gambia 5 2 0 3 3 2 0 1
Ghana 16 15 0 1 22 20 0 2
Guinea 14 11 0 3 15 12 0 3
Guinea-Bissau 1 1 0 0 1 1 0 0
Kenya 417 10 399 8 311 9 300 2
Lesotho 0 0 0 0 0 0 0 0
Liberia 78 72 0 6 73 70 0 3
Madagascar 0 0 0 0 0 0 0 0
Malawi 0 0 0 0 0 0 0 0
Mali 4 3 0 1 4 4 0 0
Mauritania 52 39 0 13 40 38 0 2
Mauritius 0 0 0 0 0 0 0 0
Mozambique 0 0 0 0 0 0 0 0
Namibia 1 1 0 0 1 1 0 0
Niger 1 1 0 0 1 1 0 0
Nigeria 25 16 0 10 28 16 0 12
Rwanda 155 129 0 25 136 115 0 21
Senegal 17 16 0 1 18 16 0 2
Seychelles 0 0 0 0 0 0 0 0
Sierra Leone 19 15 0 3 15 11 0 3
Somalia 2249 678 1550 21 2257 770 1464 23
Sudan 1619 368 1034 217 2185 387 1548 250
South Africa 1 0 0 0 1 0 0 0
Swaziland 0 0 0 0 0 0 0 0
Tanzania Utd Rep 156 1 0 155 164 1 0 162
Togo 20 18 0 1 19 18 0 1
Uganda 863 8 446 409 436 6 126 304
Zambia 0 0 0 0 0 0 0 0
Zimbabwe 24 22 0 1 25 24 0 1
124
TABLE 13 Population at risk UNHCR population of concern (continued)UNHCR population of concern
total totalrefugees
internallydisplacedpersons
others andstatelesspersons
total totalrefugees
internallydisplacedpersons
others andstatelesspersons
thousands thousands thousands thousands thousands thousands thousands thousands
2009 2009 2009 2009 2010 2010 2010 2010
ASIA 13602 6372 5435 1796 14103 6425 4232 3446
Central Asia 17 14 0 3 301 17 60 224
Kazakhstan 4 4 0 1 4 4 0 1
Kyrgyzstan 3 3 0 0 284 3 60 222
Tajikistan 1 1 0 0 1 1 0 0
Turkmenistan 1 1 0 0 1 1 0 0
Uzbekistan 8 7 0 2 10 9 0 2
East Asia 1153 975 67 110 1303 986 202 115
Brunei Darussalam 0 0 0 0 0 0 0 0
Cambodia 17 17 0 0 16 16 0 0
China 199 181 0 18 192 185 0 8
Indonesia 21 18 0 2 17 17 0 0
Korea DPR 1 1 0 0 1 1 0 0
Korea Republic of 1 1 0 0 1 1 0 0
Lao PDR 9 8 0 0 8 8 0 0
Malaysia 62 1 0 61 1 1 0 0
Mongolia 4 1 0 2 4 2 0 2
Myanmar 497 407 67 23 500 416 62 22
Philippines 2 1 0 1 221 1 140 81
Singapore 0 0 0 0 0 0 0 0
Thailand 1 1 0 0 1 0 0 0
Viet Nam 341 339 0 1 340 339 0 1
South Asia 7225 3265 2627 1334 7400 3413 1578 2409
Afghanistan 3279 2887 297 95 4404 3055 352 998
Bangladesh 12 10 0 2 17 10 0 7
Bhutan 90 89 0 1 76 75 0 1
India 24 20 0 5 22 18 0 4
Iran (Islamic Rep) 87 73 0 14 85 69 0 16
Maldives 0 0 0 0 0 0 0 0
Nepal 7 5 0 2 7 6 0 1
Pakistan 3041 35 1895 1111 2199 40 952 1207
Sri Lanka 684 146 435 104 590 141 274 175
West Asia 5206 2117 2741 349 5100 2010 2393 698
Armenia 104 18 0 86 103 18 0 85
Azerbaijan 606 17 586 3 612 17 593 2
Bahrain 0 0 0 0 0 0 0 0
Cyprus 0 0 0 0 0 0 0 0
Georgia 378 15 353 10 378 11 236 131
Iraq 3565 1785 1552 228 3387 1684 1344 360
Jordan 3 2 0 1 3 2 0 1
Kuwait 1 1 0 0 1 1 0 0
Lebanon 18 16 0 2 17 16 0 2
Occupied PalestinianTerritory
98 95 0 3 97 93 0 3
Saudi Arabia 1 1 0 0 1 1 0 0
Syrian Arab Republic 23 18 0 6 28 18 0 10
Turkey 156 146 0 10 155 147 0 8
United Arab Emirates 0 0 0 0 0 0 0 0
Yemen 253 2 250 1 318 2 221 95
LATIN AMERICA amp THECARIBBEAN
3898 463 3304 132 4238 471 3672 95
Argentina 1 1 0 0 1 1 0 0
Bahamas 0 0 0 0 0 0 0 0
Barbados 0 0 0 0 0 0 0 0
Belize 0 0 0 0 0 0 0 0
Bolivia (Plur State) 1 1 0 0 1 1 0 0
Brazil 1 1 0 0 1 1 0 0
Chile 1 1 0 0 1 1 0 0
Colombia 3758 390 3304 64 4128 396 3672 60
Costa Rica 0 0 0 0 0 0 0 0
125
TABLE 13 Population at risk UNHCR population of concern (continued)UNHCR population of concern
total totalrefugees
internallydisplacedpersons
others andstatelesspersons
total totalrefugees
internallydisplacedpersons
others andstatelesspersons
thousands thousands thousands thousands thousands thousands thousands thousands
2009 2009 2009 2009 2010 2010 2010 2010
Cuba 10 8 0 2 12 7 0 4
Dominica 0 0 0 0 0 0 0 0
Dominican Republic 1 0 0 0 1 0 0 0
Ecuador 1 1 0 0 1 1 0 0
El Salvador 15 5 0 10 7 5 0 2
French Guiana 0 0 0 0 0 0 0 0
Grenada 0 0 0 0 0 0 0 0
Guatemala 15 6 0 9 7 6 0 1
Guyana 1 1 0 0 1 1 0 0
Haiti 36 24 0 12 33 26 0 7
Honduras 2 1 0 1 2 1 0 1
Jamaica 1 1 0 1 2 1 0 1
Mexico 27 6 0 20 17 7 0 10
Netherlands Antilles
Nicaragua 2 1 0 0 2 1 0 0
Panama 0 0 0 0 0 0 0 0
Paraguay 0 0 0 0 0 0 0 0
Peru 12 6 0 6 11 6 0 5
St Kitts amp Nevis 0 0 0 0 0 0 0 0
St Lucia 1 0 0 1 1 0 0 1
St Vincent amp Grenadines 2 1 0 1 2 1 0 1
Suriname 0 0 0 0 0 0 0 0
Trinidad amp Tobago 1 0 0 0 0 0 0 0
Uruguay 0 0 0 0 0 0 0 0
Venezuela (Boliv Rep of) 8 6 0 2 7 7 0 1
OCEANIA 2 2 0 0 2 2 0 0
Fiji 2 2 0 0 2 2 0 0
French Polynesia 0 0 0 0
New Caledonia 0 0 0 0 0 0 0 0
Papua New Guinea 0 0 0 0 0 0 0 0
Samoa 0 0 0 0 0 0 0 0
Solomon Islands 0 0 0 0 0 0 0 0
Tonga 0 0 0 0 0 0 0 0
Vanuatu 0 0 0 0 0 0 0 0
DEVELOPED REGIONS 1094 532 421 141 1055 505 397 153
NORTH AMERICA 4 2 0 1 4 3 0 1
Bermuda 0 0 0 0 0 0 0 0
Canada 0 0 0 0 0 0 0 0
United States of America 4 2 0 1 4 3 0 1
ASIA amp OCEANIA 3 1 0 1 2 2 0 1
Australia 0 0 0 0 0 0 0 0
Israel 2 1 0 1 2 1 0 1
Japan 0 0 0 0 0 0 0 0
New Zealand 0 0 0 0 0 0 0 0
EUROPE 1088 528 421 139 1048 500 397 151
Albania 17 16 0 2 16 15 0 1
Belarus 7 6 0 1 6 6 0 1
Bosnia amp Herzegovina 237 70 114 53 232 63 113 55
Croatia 103 76 2 25 89 66 2 21
European Union 39 14 0 24 20 13 0 7
Iceland 0 0 0 0 0 0 0 0
Macedonia FYR 9 8 0 1 11 8 0 3
Montenegro 3 3 0 0 3 3 0 0
Norway 0 0 0 0 0 0 0 0
Republic of Moldova 7 6 0 1 7 6 0 1
Russian Federation 204 109 80 14 199 112 53 34
Serbia 437 196 225 16 439 183 228 27
Switzerland 0 0 0 0 0 0 0 0
Ukraine 26 25 0 2 26 25 0 1
126
TABLE 14 Population at risk persons affected by natural disastersPersons affected by natural disasters
total droughtearthquake
extremetemperature
flood landslide storm volcanoeswildfiresand
epidemics
thousands thousands thousands thousands thousands thousands thousands thousands
2010 2010 2010 2010 2010 2010 2010 2010
WORLD 344655 106870 7485 3986 191861 2464 30954 1034
DEVELOPING REGIONS 342717 106870 6650 3971 191352 2464 30403 1007
AFRICA 43854 38810 0 0 4657 20 317 50
North Africa 81 0 0 0 81 0 0 0
Algeria 0 0 0 0 0 0 0 0
Egypt 4 0 0 0 4 0 0 0
Libya
Morocco 77 0 0 0 77 0 0 0
Tunisia
Sub-Saharan Africa 43773 38810 0 0 4577 20 317 50
Angola 255 0 0 0 255 0 0 0
Benin 832 0 0 0 831 0 0 1
Botswana 0 0 0 0 0 0 0 0
Burkina Faso 139 0 0 0 133 0 0 6
Burundi 184 180 0 0 3 0 2 0
Cameroon 6 0 0 0 3 0 0 3
Cape Verde
Central African Republic 2 0 0 0 2 0 0 0
Chad 2552 2400 0 0 145 0 0 7
Comoros
Congo 1 0 0 0 0 0 0 1
Cocircte drsquoIvoire 6 0 0 0 6 0 0 0
Congo Dem Rep 85 0 0 0 70 1 0 14
Djibouti 120 120 0 0 0 0 0 0
Equatorial Guinea
Eritrea
Ethiopia 9482 9400 0 0 81 0 0 1
Gabon 2 0 0 0 0 0 2 1
Gambia 39 0 0 0 39 0 0 0
Ghana 17 0 0 0 17 0 0 0
Guinea 48 0 0 0 48 0 0 0
Guinea-Bissau 57 0 0 0 57 0 0 0
Kenya 7514 7300 0 0 211 0 0 3
Lesotho 5 0 0 0 5 0 0 0
Liberia 15 0 0 0 15 0 0 0
Madagascar 1027 720 0 0 0 0 307 0
Malawi 79 0 0 0 79 0 0 0
Mali 619 600 0 0 19 0 0 0
Mauritania 309 300 0 0 9 0 0 0
Mauritius
Mozambique 544 460 0 0 81 0 0 4
Namibia 338 0 0 0 338 0 0 0
Niger 8134 7900 0 0 233 0 0 1
Nigeria 1509 0 0 0 1500 0 0 8
Rwanda 10 0 0 0 4 6 0 0
Senegal 103 0 0 0 103 0 0 0
Seychelles
Sierra Leone 0 0 0 0 0 0 0 0
Somalia 2866 2850 0 0 16 0 0 0
Sudan 4438 4300 0 0 138 0 0 0
South Africa 26 0 0 0 20 0 6 0
Swaziland
Tanzania Utd Rep
Togo 112 0 0 0 112 0 0 0
Uganda 613 600 0 0 0 13 0 0
Zambia 3 0 0 0 3 0 0 0
Zimbabwe 1681 1680 0 0 1 0 0 0
127
TABLE 14 Population at risk persons affected by natural disasters (continued)Persons affected by natural disasters
total droughtearthquake
extremetemperature
flood landslide storm volcanoeswildfiresand
epidemics
thousands thousands thousands thousands thousands thousands thousands thousands
2010 2010 2010 2010 2010 2010 2010 2010
ASIA 285231 67783 252 3900 181630 2388 28948 330
Central Asia 64 0 8 0 47 8 0 1
Kazakhstan 38 0 0 0 38 0 0 0
Kyrgyzstan 8 0 0 0 0 8 0 0
Tajikistan 17 0 8 0 9 0 0 0
Turkmenistan
Uzbekistan
East Asia 256254 66483 234 3800 154940 2294 28180 324
Brunei Darussalam
Cambodia 0 0 0 0 0 0 0 0
China 231535 60000 196 3800 140254 2148 25137 0
Indonesia 238 0 17 0 69 0 0 152
Korea DPR 96 0 0 0 56 0 40 0
Korea Republic of 42 0 0 0 0 0 42 0
Lao PDR
Malaysia 0 0 0 0 0 0 0 0
Mongolia
Myanmar 426 0 21 0 0 145 260 0
Philippines 6738 0 0 0 3901 1 2666 171
Singapore
Thailand 15654 6483 0 0 9171 0 0 1
Viet Nam 1524 0 0 0 1490 0 35 0
South Asia 27536 0 7 100 26570 86 768 5
Afghanistan 49 0 1 0 48 0 0 0
Bangladesh 987 0 0 100 575 55 257 0
Bhutan
India 4790 0 0 0 4283 0 507 0
Iran (Islamic Rep) 5 0 5 0 0 0 0 0
Maldives
Nepal 13 0 0 0 8 0 0 5
Pakistan 20399 0 1 0 20363 30 4 0
Sri Lanka 1292 0 0 0 1292 0 0 0
West Asia 1377 1300 4 0 74 0 0 0
Armenia
Azerbaijan 70 0 0 0 70 0 0 0
Bahrain
Cyprus
Georgia
Iraq 2 0 0 0 2 0 0 0
Jordan
Kuwait
Lebanon
Occupied PalestinianTerritory
0 0 0 0 0 0 0 0
Saudi Arabia 0 0 0 0 0 0 0 0
Syrian Arab Republic 1300 1300 0 0 0 0 0 0
Turkey 4 0 4 0 0 0 0 0
United Arab Emirates
Yemen 1 0 0 0 1 0 0 0
LATIN AMERICA amp THECARIBBEAN
13570 277 6397 71 5049 56 1093 628
Argentina 0 0 0 0 0 0 0 0
Bahamas
Barbados 2 0 0 0 0 0 2 0
Belize 0 0 0 0 0 0 0 0
Bolivia (Plur State) 428 62 0 0 358 4 0 3
Brazil 357 62 0 0 295 0 0 0
Chile 2676 0 2672 0 0 0 0 4
Colombia 3005 0 0 0 3005 0 0 0
Costa Rica 3 0 0 0 3 0 0 0
128
TABLE 14 Population at risk persons affected by natural disasters (continued)Persons affected by natural disasters
total droughtearthquake
extremetemperature
flood landslide storm volcanoeswildfiresand
epidemics
thousands thousands thousands thousands thousands thousands thousands thousands
2010 2010 2010 2010 2010 2010 2010 2010
Cuba
Dominica
Dominican Republic 52 0 0 0 39 0 12 0
Ecuador 121 108 0 0 11 0 0 2
El Salvador 12 0 0 0 0 0 12 0
French Guiana
Grenada 0 0 0 0 0 0 0 0
Guatemala 456 0 0 0 3 51 400 2
Guyana 0 0 0 0 0 0 0 0
Haiti 4310 0 3700 0 24 0 78 507
Honduras 102 45 0 0 5 0 25 27
Jamaica 3 0 0 0 0 0 3 0
Mexico 1600 0 25 0 1020 0 555 0
Netherlands Antilles
Nicaragua 76 0 0 0 76 0 0 0
Panama 33 0 0 0 33 0 0 0
Paraguay 16 0 0 0 0 0 0 16
Peru 154 0 0 71 80 1 0 2
St Kitts amp Nevis
St Lucia 3 0 0 0 2 0 1 0
St Vincent amp Grenadines
Suriname
Trinidad amp Tobago 0 0 0 0 0 0 0 0
Uruguay 0 0 0 0 0 0 0 0
Venezuela (Boliv Rep of) 95 0 0 0 95 0 0 0
OCEANIA 62 0 1 0 16 0 45 0
Fiji 39 0 0 0 0 0 39 0
French Polynesia 3 0 0 0 0 0 3 0
New Caledonia
Papua New Guinea 0 0 0 0 0 0 0 0
Samoa
Solomon Islands 18 0 1 0 16 0 1 0
Tonga 0 0 0 0 0 0 0 0
Vanuatu 0 0 0 0 0 0 0 0
DEVELOPED REGIONS 1922 0 835 15 509 0 536 27
NORTH AMERICA 36 0 1 0 7 0 29 0
Bermuda
Canada 0 0 0 0 0 0 0 0
United States of America 36 0 1 0 7 0 29 0
ASIA amp OCEANIA 1046 0 792 15 211 0 7 20
Australia 219 0 0 0 211 0 7 0
Israel 20 0 0 0 0 0 0 20
Japan 507 0 492 15 0 0 0 0
New Zealand 300 0 300 0 0 0 0 0
EUROPE 840 0 42 0 291 0 500 7
Albania 14 0 0 0 14 0 0 0
Belarus
Bosnia amp Herzegovina 35 0 0 0 35 0 0 0
Croatia 1 0 0 0 1 0 0 0
European Union 634 0 15 0 119 0 500 0
Iceland 0 0 0 0 0 0 0 0
Macedonia FYR
Montenegro 6 0 0 0 6 0 0 0
Norway
Republic of Moldova 12 0 0 0 12 0 0 0
Russian Federation 66 0 0 0 58 0 0 7
Serbia 32 0 27 0 5 0 0 0
Switzerland 0 0 0 0 0 0 0 0
Ukraine 40 0 0 0 40 0 0 0
129
TABLE 15 UndernourishmentShare of population undernourished Incidence of undernourishment Depth of hunger
pa millions millions pakcalcapday kcalcapday
pa
1995-97 2006-08 growth1995-97 -2006-08
1995-97 2006-08 growth1995-97 -2006-08
1995-97 2006-08 growth1995-97 -2006-08
WORLD 18 16 minus23 7012 7392 05 214 212 minus03
DEVELOPING REGIONS 18 16 minus23 7011 7392 05 234 234 minus03
AFRICA 29 23 minus24 1622 1603 minus01 253 234 minus05
North Africa 5 31 185 188 01
Algeria 5 15 180 180 00
Egypt 190 200 03
Libya 130 130 05
Morocco 6 16 210 200 minus03
Tunisia 120 120 00
Sub-Saharan Africa 31 23 minus23 1591 1603 01 268 243 minus05
Angola 61 41 minus35 78 72 minus07 390 320 minus17
Benin 18 12 minus36 10 10 00 230 210 minus08
Botswana 23 25 08 04 05 20 230 240 08
Burkina Faso 12 8 minus36 12 12 00 210 200 minus06
Burundi 56 62 09 35 49 31 350 390 14
Cameroon 34 22 minus39 50 42 minus16 260 230 minus08
Cape Verde 14 11 minus22 01 01 00 190 190 00
Central African Republic 47 40 minus15 16 17 06 320 300 minus02
Chad 53 39 minus27 39 41 05 370 320 minus12
Comoros 47 47 00 03 04 26 300 300 07
Congo 41 13 minus99 12 05 minus76 310 230 minus18
Cocircte drsquoIvoire 17 14 minus17 26 29 10 240 230 00
Congo Dem Rep
Djibouti 50 26 minus58 03 02 minus36 350 280 minus20
Equatorial Guinea
Eritrea 64 65 01 21 31 36 340 350 minus02
Ethiopia 62 41 minus37 362 326 minus09 390 320 minus17
Gabon 140 140 minus04
Gambia 23 19 minus17 03 03 00 250 240 05
Ghana 13 5 minus83 23 11 minus65 210 180 minus23
Guinea 19 16 minus15 15 16 06 270 260 minus02
Guinea-Bissau 26 22 minus15 03 03 00 260 250 00
Kenya 32 33 03 90 124 30 250 260 02
Lesotho 16 14 minus12 03 03 00 220 220 00
Liberia 32 32 00 07 11 42 330 330 02
Madagascar 26 25 minus04 35 47 27 250 250 05
Malawi 36 27 minus26 38 39 02 310 280 minus08
Mali 25 12 minus65 25 15 minus45 260 220 minus13
Mauritania 9 8 minus11 02 02 00 210 210 minus03
Mauritius 7 5 minus30 01 01 00 190 180 minus03
Mozambique 47 38 minus19 78 83 06 360 330 minus12
Namibia 30 18 minus45 05 04 minus20 250 220 minus08
Niger 37 16 minus73 35 23 minus37 300 240 minus14
Nigeria 10 6 minus45 109 94 minus13 200 180 minus12
Rwanda 53 32 minus45 30 30 00 360 300 minus06
Senegal 26 19 minus28 23 23 00 240 220 minus03
Seychelles 10 8 minus20 00 00 160 150 minus04
Sierra Leone 39 35 minus10 16 19 16 360 340 minus07
Somalia
Sudan 29 22 minus25 93 88 minus05 260 240 minus12
South Africa 160 150 00
Swaziland 21 19 minus09 02 02 00 220 220 09
Tanzania Utd Rep 42 34 minus19 128 139 08 300 280 05
Togo 36 30 minus16 17 19 10 290 280 minus06
Uganda 23 22 minus04 49 67 29 240 240 00
Zambia 38 44 13 36 54 38 300 320 06
Zimbabwe 44 30 minus34 53 37 minus32 340 300 minus06
130
TABLE 15 Undernourishment (continued)Share of population undernourished Incidence of undernourishment Depth of hunger
pa millions millions pakcalcapday kcalcapday
pa
1995-97 2006-08 growth1995-97 -2006-08
1995-97 2006-08 growth1995-97 -2006-08
1995-97 2006-08 growth1995-97 -2006-08
ASIA 16 15 minus21 4909 5372 08 233 238 minus02
Central Asia 12 13 minus20 46 55 16 171 172 minus01
Kazakhstan 130 120 00
Kyrgyzstan 13 11 minus15 06 06 00 210 210 minus03
Tajikistan 42 26 minus43 24 18 minus26 270 230 minus05
Turkmenistan 9 7 minus23 04 03 minus26 180 180 00
Uzbekistan 5 11 74 12 28 80 160 180 07
East Asia 13 11 minus18 2194 2058 minus06 241 241 minus04
Brunei Darussalam 140 130 minus05
Cambodia 40 25 minus42 47 36 minus24 280 250 minus05
China 12 10 minus16 1417 1296 minus08 250 250 minus05
Indonesia 11 13 15 220 297 28 210 220 00
Korea DPR 30 35 14 66 84 22 250 270 10
Korea Republic of 120 130 00
Lao PDR 29 22 minus25 14 14 00 270 260 minus05
Malaysia 120 130 minus05
Mongolia 33 27 minus18 08 07 minus12 260 260 02
Myanmar
Philippines 20 13 minus38 141 118 minus16 250 240 minus07
Singapore
Thailand 18 16 minus11 111 107 minus03 240 240 minus07
Viet Nam 22 11 minus61 167 96 minus49 270 240 minus12
South Asia 20 20 minus11 2570 3174 19 232 246 00
Afghanistan
Bangladesh 41 26 minus41 542 414 minus24 330 290 minus04
Bhutan
India 17 19 10 1671 2246 27 220 240 00
Iran (Islamic Rep) 170 180 07
Maldives 9 10 10 00 00 180 190 07
Nepal 20 17 minus15 44 47 06 230 220 minus03
Pakistan 20 25 20 268 428 43 260 280 00
Sri Lanka 25 20 minus20 45 39 minus13 260 250 minus02
West Asia 24 24 minus42 99 85 minus14 173 169 minus02
Armenia 36 21 minus48 11 06 minus54 230 200 minus14
Azerbaijan 27 22 220 140 minus28
Bahrain
Cyprus 120 120 00
Georgia 19 6 minus99 10 03 minus104 200 160 minus39
Iraq
Jordan 5 02 170 150 00
Kuwait 5 5 00 01 01 00 180 190 minus12
Lebanon 160 170 04
Occupied PalestinianTerritory
10 21 70 03 08 93 160 190
Saudi Arabia 130 130 minus05
Syrian Arab Republic 160 170 04
Turkey 160 160 04
United Arab Emirates 130 140 05
Yemen 31 30 minus03 50 67 27 260 260 02
LATIN AMERICA amp THECARIBBEAN
14 11 minus19 480 416 minus13 212 203 minus03
Argentina 120 130 00
Bahamas 8 6 minus26 00 00 160 160 00
Barbados 140 140 05
Belize 8 5 minus42 00 00 180 170 00
Bolivia (Plur State) 24 27 11 19 25 25 230 240 00
Brazil 10 6 minus45 166 117 minus31 240 220 minus05
Chile 150 140 minus08
Colombia 11 9 minus18 40 41 02 210 210 minus03
Costa Rica 150 150 04
131
TABLE 15 Undernourishment (continued)Share of population undernourished Incidence of undernourishment Depth of hunger
pa millions millions pakcalcapday kcalcapday
pa
1995-97 2006-08 growth1995-97 -2006-08
1995-97 2006-08 growth1995-97 -2006-08
1995-97 2006-08 growth1995-97 -2006-08
Cuba 14 15 190 120 minus18
Dominica 150 150 00
Dominican Republic 26 24 minus07 21 23 08 240 230 minus03
Ecuador 16 15 minus06 18 20 10 190 190 minus03
El Salvador 12 9 minus26 07 06 minus14 200 190 minus03
French Guiana
Grenada 18 21 14 00 00 240 250 08
Guatemala 20 22 09 21 29 30 220 230 06
Guyana 11 8 minus29 01 01 00 200 190 minus12
Haiti 60 57 minus05 48 55 12 430 420 minus03
Honduras 16 12 minus26 09 09 00 240 230 minus05
Jamaica 6 5 minus16 02 01 minus61 170 170 minus07
Mexico 190 190 00
Netherlands Antilles 150 150 minus11
Nicaragua 38 19 minus61 18 11 minus44 310 260 minus18
Panama 20 15 minus26 06 05 minus16 230 220 minus03
Paraguay 10 10 00 05 06 17 200 210 minus03
Peru 21 16 minus24 50 45 minus10 230 220 minus08
St Kitts amp Nevis 16 16 00 00 00 220 220 06
St Lucia 7 8 12 00 00 180 190 00
St Vincent amp Grenadines 16 5 minus100 00 00 210 170 minus10
Suriname 13 15 13 01 01 00 200 200 00
Trinidad amp Tobago 14 11 minus22 02 02 00 220 220 03
Uruguay 140 140 minus04
Venezuela (Boliv Rep of) 14 7 minus61 31 19 minus44 190 170 minus04
OCEANIA 8 9 00 01 182 173 minus06
Fiji 5 00 170 160 minus07
French Polynesia 5 00 160 150 minus11
New Caledonia 9 8 minus11 00 00 210 210 03
Papua New Guinea
Samoa 10 00 180 150 minus11
Solomon Islands 13 11 minus15 00 01 190 190 minus06
Tonga
Vanuatu 9 00 200 180 minus07
DEVELOPED REGIONS 5 01 125 116 01
NORTH AMERICA 111 101 minus02
Bermuda 180 200 07
Canada 120 110 minus10
United States of America 110 100 minus06
ASIA amp OCEANIA 128 126 00
Australia 130 120 00
Israel 90 90 00
Japan 130 130 00
New Zealand 120 120 00
EUROPE 5 01 131 121 01
Albania 160 160 minus07
Belarus 120 130 05
Bosnia amp Herzegovina 150 140 minus12
Croatia 180 150 minus18
European Union 5 01 120 115 minus02
Iceland 130 120 minus05
Macedonia FYR 180 150 minus11
Montenegro 170
Norway 120 110 minus05
Republic of Moldova 190 190 07
Russian Federation 160 130 minus09
Serbia 170
Switzerland 120 120 00
Ukraine 150 130 minus05
132
TABLE 16 Dietary energy supplies and changes in dietary compositionDietary energy supply per person Contribution in diets by type Contribution in diets by commodity
carbo-hydrates
proteins fats cereals starchy roots pulses
kcalcapday kcalcapday
1990-92 2006-08 2005-07 2005-07 2005-07 1990-92 2005-07 1990-92 2005-07 1990-92 2005-07
WORLD 2583 2805 65 11 24 53 48 8 7 5 5
DEVELOPING REGIONS 2430 2664 67 11 22 58 53 9 8 5 5
AFRICA 2266 2495 72 10 18 49 49 22 20 5 5
North Africa 3035 3175 71 11 17 62 60 2 3 2 2
Algeria 2890 3090 70 11 19 57 56 2 3
Egypt 3090 3160 73 12 15 66 64 2 2
Libya 3180 3150 63 10 27 47 47 2 3
Morocco 3000 3260 72 11 17 62 60 2 2
Tunisia 3120 3330 64 11 24 55 50 2 2
Sub-Saharan Africa 2102 2351 72 10 19 47 47 24 22 5 6
Angola 1580 1960 70 9 21 29 36 30 26 3 3
Benin 2250 2510 72 9 19 41 40 34 31 4 5
Botswana 2260 2230 67 11 22 43 43 6 6 5 6
Burkina Faso 2460 2690 68 12 20 75 73 5 5
Burundi 1860 1680 82 11 7 17 19 29 32 27 19
Cameroon 2020 2240 72 10 18 39 42 20 17 2 6
Cape Verde 2370 2530 63 11 26 50 45 4 4 4 3
Central African Republic 1880 1960 61 9 29 20 25 37 31
Chad 1700 2010 64 12 24 52 57 13 8 2 4
Comoros 1900 1840 69 9 22 41 38 17 15 6 9
Congo 1970 2570 69 8 23 19 26 41 34
Cocircte drsquoIvoire 2470 2500 74 8 18 35 33 31 33
Congo Dem Rep 80 6 14 16 23 57 55
Djibouti 1720 2300 63 10 27 52 52 2 3
Equatorial Guinea
Eritrea 1530 1590 73 12 15 72 74 5 3 8 5
Ethiopia 1550 1950 79 11 10 67 66 15 13 6 7
Gabon 2520 2710 69 12 19 25 33 21 17
Gambia 2470 2330 64 9 27 55 56
Ghana 2120 2900 77 8 15 32 29 39 37
Guinea 2420 2550 70 9 22 50 47 14 14
Guinea-Bissau 2290 2270 71 8 21 61 59 8 9
Kenya 1970 2030 68 11 21 47 49 8 5 6 7
Lesotho 2370 2460 77 11 12 76 78 2 3
Liberia 2220 2200 70 7 24 45 43 22 23
Madagascar 2200 2130 78 9 13 52 59 22 19
Malawi 1870 2150 77 10 13 69 59 4 15 7 6
Mali 2180 2590 70 11 19 69 67 1 3
Mauritania 2580 2810 63 12 25 55 51 4 4
Mauritius 2760 2930 62 11 26 48 46 3 3
Mozambique 1750 2070 76 7 17 34 40 41 37
Namibia 2060 2360 68 11 21 48 46 14 14 4 3
Niger 1970 2390 68 13 19 74 60 6 14
Nigeria 2310 2710 69 9 22 47 45 20 19 3 3
Rwanda 1830 2090 82 10 9 18 18 30 36 15 12
Senegal 2190 2280 65 10 25 64 60 1 3
Seychelles 2280 2400 60 14 26 46 41
Sierra Leone 1950 2120 67 10 24 55 50 5 10 4 5
Somalia
Sudan 1960 2280 61 13 26 57 50 2 3
South Africa 2820 3000 65 11 24 53 54
Swaziland 2380 2290 68 11 21 52 50 5 5
Tanzania Utd Rep 2080 2020 75 10 15 47 46 24 17 5 7
Togo 1890 2150 71 9 20 48 49 28 25 2 4
Uganda 2280 2220 74 9 17 19 23 25 23 9 8
Zambia 2010 1880 73 10 17 65 61 13 14
Zimbabwe 1980 2210 66 10 24 62 56 2 2
133
TABLE 16 Dietary energy supplies and changes in dietary composition (continued)Dietary energy supply per person Contribution in diets by type Contribution in diets by commodity
carbo-hydrates
proteins fats cereals starchy roots pulses
kcalcapday kcalcapday
1990-92 2006-08 2005-07 2005-07 2005-07 1990-92 2005-07 1990-92 2005-07 1990-92 2005-07
ASIA 2434 2667 67 11 22 63 56 6 5 5 5
Central Asia 2715 2793 64 12 25 59 54 4 6
Kazakhstan 3280 3510 61 12 27 57 43 4 6
Kyrgyzstan 2400 2660 68 12 20 57 48 5 8
Tajikistan 2020 2190 64 10 26 63 63
Turkmenistan 2550 2740 65 13 23 57 61
Uzbekistan 2650 2560 64 12 25 59 57
East Asia 2508 2872 64 11 24 63 53 7 5 3 6
Brunei Darussalam 2730 2980 64 12 25 48 45
Cambodia 1870 2180 75 10 14 82 72 2 4
China 2580 2990 61 12 27 63 50 7 5
Indonesia 2390 2550 73 9 18 66 63 7 6
Korea DPR 2340 2110 74 11 15 60 62 3 7 6 5
Korea Republic of 2970 3040 63 11 25 54 44
Lao PDR 2010 2240 76 11 13 78 70 6 4
Malaysia 2720 2890 63 11 26 42 47 3 2
Mongolia 2080 2240 56 13 32 42 46 2 4
Myanmar 67 11 22 73 59 2 6
Philippines 2230 2580 73 9 18 53 57 4 3
Singapore
Thailand 2250 2540 71 9 20 57 49
Viet Nam 2090 2780 70 10 19 76 66
South Asia 2279 2374 71 10 19 65 60 2 3 5 5
Afghanistan
Bangladesh 1960 2270 80 9 12 84 78 1 3
Bhutan
India 2290 2360 71 10 19 64 60 5 5
Iran (Islamic Rep) 2970 3050 69 11 20 60 53 3 4
Maldives 2400 2550 60 16 23 46 35
Nepal 2190 2340 74 10 15 74 69 3 5 3 3
Pakistan 2210 2280 63 10 27 55 47 3 3
Sri Lanka 2170 2370 73 9 18 56 56 4 2 3 3
West Asia 2963 3067 64 11 25 51 49 3 3 4 3
Armenia 1920 2260 64 12 24 59 44 8 5
Azerbaijan 2160 3020 73 11 16 66 60 2 6
Bahrain
Cyprus 3120 3190 48 12 41 28 21 3 3
Georgia 1850 2730 67 11 22 57 50 5 3
Iraq
Jordan 2840 3000 63 10 27 50 46 3 2
Kuwait 2350 3030 58 12 30 39 42 2 2
Lebanon 3010 3090 58 11 32 34 34 3 6 4 3
Occupied PalestinianTerritory
2080 66 11 23 0 51
Saudi Arabia 2850 3120 64 11 25 48 48
Syrian Arab Republic 2830 3040 59 10 30 50 45
Turkey 3590 3500 62 11 27 51 48 3 3 4 3
United Arab Emirates 3160 3170 63 13 24 33 43 3 4
Yemen 1980 2050 69 11 20 66 61 3 3
LATIN AMERICA amp THECARIBBEAN
2664 2915 62 11 27 39 37 6 6 5 5
Argentina 3010 3030 55 13 32 32 31 3 3
Bahamas 2610 2710 57 12 30 27 27 2 2
Barbados 3040 3020 59 12 29 30 27 3 3
Belize 2510 2710 67 11 23 37 39 4 4
Bolivia (Plur State) 2030 2100 71 11 18 43 47 9 7
Brazil 2760 3120 59 11 30 33 32 5 5 5 5
Chile 2600 2960 61 12 27 43 40 4 4
Colombia 2410 2690 66 10 24 33 34 8 6
Costa Rica 2820 2820 62 11 27 32 31 3 4
134
TABLE 16 Dietary energy supplies and changes in dietary composition (continued)Dietary energy supply per person Contribution in diets by type Contribution in diets by commodity
carbo-hydrates
proteins fats cereals starchy roots pulses
kcalcapday kcalcapday
1990-92 2006-08 2005-07 2005-07 2005-07 1990-92 2005-07 1990-92 2005-07 1990-92 2005-07
Cuba 2720 3420 73 10 17 34 40 5 7 4 7
Dominica 3000 3090 64 12 24 26 25 7 9
Dominican Republic 2160 2270 61 9 30 30 29 5 4
Ecuador 2110 2300 55 10 35 35 34
El Salvador 2400 2580 67 11 22 56 44 1 2 4 6
French Guiana
Grenada 2470 2400 54 12 34 28 22 2 3 3 3
Guatemala 2290 2150 67 11 23 58 51 6 4
Guyana 2300 2740 68 11 21 53 46 4 4 3 2
Haiti 1730 1850 74 9 17 44 46 11 9 8 5
Honduras 2300 2610 66 10 24 51 44 4 5
Jamaica 2510 2840 61 11 28 34 32 9 5
Mexico 3090 3260 62 11 26 47 44 4 4
Netherlands Antilles 3280 3260 64 11 24 36 36 4 3
Nicaragua 1770 2420 68 10 22 47 50 8 7
Panama 2320 2450 65 12 24 39 43 2 2
Paraguay 2390 2660 58 11 32 27 29 18 13 4 5
Peru 2110 2410 74 11 15 49 44 8 14 2 3
St Kitts amp Nevis 2580 2460 59 12 29 32 26 3 2 2 2
St Lucia 2580 2710 58 14 28 30 28 6 2
St Vincent amp Grenadines 2360 2860 64 11 25 30 33 7 5 2 2
Suriname 2440 2460 68 9 23 50 42 2 2
Trinidad amp Tobago 2610 2700 65 10 25 39 34 2 2 4 3
Uruguay 2660 2840 64 11 25 35 43 4 4
Venezuela (Boliv Rep of) 2460 2650 64 11 26 36 37 3 3
OCEANIA 2549 2850 60 10 30 32 34 15 14 3 2
Fiji 2640 3000 60 10 29 43 41 4 7 3 2
French Polynesia 2480 2880 48 14 39 25 31 5 4
New Caledonia 3210 3150 52 12 35 35 32 6 5
Papua New Guinea
Samoa 2550 2890 46 11 43 23 18 10 10
Solomon Islands 2120 2400 73 9 18 25 34 40 34 3 3
Tonga
Vanuatu 2530 2950 60 9 31 22 31 22 18
DEVELOPED REGIONS 3260 3426 53 12 35 29 28 5 5
NORTH AMERICA 3464 3728 49 12 38 23 22 3 3
Bermuda 2870 2650 48 12 40 19 24
Canada 3050 3530 51 12 37 21 25 4 4
United States of America 3510 3750 49 12 38 23 22 3 3
ASIA amp OCEANIA 2969 2892 56 13 31 36 35 3 3
Australia 3130 3220 46 13 40 22 22 3 3
Israel 3410 3530 49 14 37 35 33 2 2
Japan 2920 2800 58 13 29 39 38
New Zealand 2810 2810 54 12 34 23 24 3 4
EUROPE 3228 3401 54 12 34 30 30 6 5
Albania 2560 2890 58 14 29 57 40 1 2
Belarus 3180 3150 56 12 32 37 30 10 11
Bosnia amp Herzegovina 2670 3080 67 11 21 61 45 5 5
Croatia 2420 2990 57 11 32 30 31 7 4
European Union 3341 3453 51 12 37 26 28 5 4
Iceland 3090 3260 45 16 39 23 20 3 3
Macedonia FYR 2550 3060 55 10 34 44 34 3 3
Montenegro
Norway 3230 3450 51 12 36 27 28 5 4
Republic of Moldova 2880 2850 70 11 20 55 48 5 5
Russian Federation 2960 3320 63 12 25 40 36 8 7
Serbia
Switzerland 3370 3450 49 11 41 22 21
Ukraine 3040 3290 63 11 26 43 36 8 8
135
TABLE 17 Changes in dietary compositionContribution in diets by commodity
meat and fish dairy and eggs fruit and vegetables sugar vegetable oils other
1990-92 2005-07 1990-92 2005-07 1990-92 2005-07 1990-92 2005-07 1990-92 2005-07 1990-92 2005-07
WORLD 8 11 5 5 4 5 8 8 8 9 11 13
DEVELOPING REGIONS 7 10 4 4 4 5 7 7 7 8 10 12
AFRICA 4 4 5 6 6 6 6 6 9 9 11 11
North Africa 3 3 3 3 6 7 10 9 9 7 7 9
Algeria 3 3 6 6 3 5 9 9 14 10 6 8
Egypt 2 3 2 2 7 9 10 8 6 4 5 8
Libya 5 4 5 5 8 7 12 10 14 16 7 8
Morocco 3 3 4 6 10 11 8 8 11 10
Tunisia 3 3 4 5 6 6 9 10 15 14 6 10
Sub-Saharan Africa 4 4 7 7 6 6 5 5 9 9 12 12
Angola 5 5 7 8 14 12 12 10
Benin 2 2 6 8 13 14
Botswana 6 4 9 7 11 13 6 9 14 12
Burkina Faso 3 3 4 5 13 14
Burundi 10 15 17 15
Cameroon 3 3 10 8 3 4 8 8 15 12
Cape Verde 6 9 5 8 2 2 7 9 10 8 12 12
Central African Republic 7 8 4 4 3 4 14 14 15 14
Chad 4 4 5 5 24 22
Comoros 8 7 4 6 8 11 16 14
Congo 4 3 5 4 4 6 12 15 15 12
Cocircte drsquoIvoire 8 7 4 4 10 11 12 12
Congo Dem Rep 7 3 7 7 13 12
Djibouti 5 6 5 5 19 11 10 16 7 7
Equatorial Guinea
Eritrea 1 4 4 6 10 8
Ethiopia 3 2 2 3 7 9
Gabon 8 8 16 12 6 6 5 6 19 18
Gambia 2 2 17 12 13 17 13 13
Ghana 7 11 3 4 7 7 12 12
Guinea 13 10 4 5 11 14 8 10
Guinea-Bissau 4 4 4 3 1 6 13 12 9 7
Kenya 8 7 4 5 10 9 8 8 9 10
Lesotho 4 4 7 6 11 9
Liberia 4 4 2 3 16 19 11 8
Madagascar 6 4 3 3 3 3 3 4 11 8
Malawi 4 5 7 5 9 10
Mali 3 3 5 5 4 5 9 7 9 10
Mauritania 5 5 11 10 10 12 9 12 6 6
Mauritius 4 6 6 6 2 4 14 12 14 15 9 8
Mozambique 1 4 13 9 11 10
Namibia 6 6 4 5 16 10 2 7 6 9
Niger 4 5 3 3 2 3 3 5 8 10
Nigeria 3 3 2 3 13 13 12 14
Rwanda 21 18 2 4 14 12
Senegal 3 3 2 2 7 6 13 15 10 11
Seychelles 10 11 6 4 5 7 14 10 7 8 12 19
Sierra Leone 3 3 20 15 13 17
Somalia
Sudan 4 5 12 17 8 10 7 5 10 10
South Africa 8 9 3 3 12 10 8 12 16 12
Swaziland 5 6 4 5 3 3 15 13 7 6 9 12
Tanzania Utd Rep 3 6 3 5 5 7 13 12
Togo 9 10 13 12
Uganda 20 17 1 4 3 7 23 18
Zambia 3 3 8 6 4 6 7 10
Zimbabwe 3 4 11 12 8 10 14 16
136
TABLE 17 Changes in dietary composition (continued)Contribution in diets by commodity
meat and fish dairy and eggs fruit and vegetables sugar vegetable oils other
1990-92 2005-07 1990-92 2005-07 1990-92 2005-07 1990-92 2005-07 1990-92 2005-07 1990-92 2005-07
ASIA 8 12 3 4 3 4 6 6 7 8 9 12
Central Asia 7 7 9 10 2 4 5 6 9 9 8 9
Kazakhstan 10 9 8 13 1 3 6 9 5 8 9 9
Kyrgyzstan 11 7 12 12 2 4 6 9 4 5 3 7
Tajikistan 3 4 6 5 6 7 11 11 11 10
Turkmenistan 7 10 8 9 2 3 6 4 11 6 9 7
Uzbekistan 6 6 9 9 3 4 4 3 12 11 7 10
East Asia 9 14 1 2 3 5 4 4 6 7 9 13
Brunei Darussalam 9 8 7 9 5 5 12 13 7 8 12 12
Cambodia 5 5 1 4 2 3 8 12
China 9 15 1 2 3 6 3 2 6 7 8 13
Indonesia 2 3 6 6 7 8 12 14
Korea DPR 5 5 8 7 5 6 13 8
Korea Republic of 7 11 7 8 10 11 8 12 14 14
Lao PDR 4 5 2 5 1 2 9 14
Malaysia 12 11 4 3 3 3 13 12 14 12 9 10
Mongolia 30 17 8 11 8 6 1 6 9 10
Myanmar 2 6 2 2 3 6 10 9 8 12
Philippines 10 12 6 6 12 9 6 4 9 9
Singapore
Thailand 8 9 5 4 8 14 5 6 17 18
Viet Nam 6 12 4 5 3 4 2 3 9 10
South Asia 2 4 4 5 2 3 9 8 7 9 9 11
Afghanistan
Bangladesh 3 4 4 7 8 8
Bhutan
India 4 4 2 2 9 8 7 9 9 12
Iran (Islamic Rep) 3 5 3 3 8 12 9 9 9 7 5 7
Maldives 10 17 3 7 4 9 17 13 7 7 13 12
Nepal 3 4 1 2 6 7 10 10
Pakistan 2 3 9 12 12 12 10 11 9 12
Sri Lanka 3 3 3 2 11 11 3 4 17 19
West Asia 5 6 6 6 9 7 9 10 10 12 9 10
Armenia 6 8 7 10 8 13 4 8 2 5 6 7
Azerbaijan 5 4 7 6 5 3 6 6 1 4 8 11
Bahrain
Cyprus 12 13 10 10 8 7 12 13 13 15 14 18
Georgia 7 5 7 10 7 14 2 7 15 11
Iraq
Jordan 5 5 5 5 3 2 15 15 11 15 8 10
Kuwait 11 11 8 5 7 7 12 11 11 12 10 10
Lebanon 5 7 4 5 15 9 11 11 14 14 10 11
Occupied PalestinianTerritory
0 5 0 5 100 8 0 12 0 10 0 9
Saudi Arabia 7 7 5 5 10 10 10 10 13 12 7 8
Syrian Arab Republic 4 4 6 7 4 3 12 13 12 12 12 16
Turkey 6 6 8 8 8 8 11 14 9 10
United Arab Emirates 11 10 9 5 12 9 11 12 9 6 12 11
Yemen 3 4 2 3 10 12 9 10 7 7
LATIN AMERICA amp THECARIBBEAN
7 10 6 6 5 5 16 14 10 11 11 11
Argentina 17 17 8 9 14 16 11 11 15 13
Bahamas 18 17 7 6 9 9 16 15 3 6 18 18
Barbados 16 15 7 7 3 7 16 19 10 9 15 13
Belize 8 8 7 6 8 8 15 15 3 4 18 16
Bolivia (Plur State) 9 10 2 2 7 6 14 13 4 3 12 12
Brazil 8 12 6 7 4 4 17 13 13 13 9 9
Chile 9 14 6 5 3 3 15 14 9 8 11 12
Colombia 7 7 7 8 7 7 19 17 9 11 10 10
Costa Rica 5 5 8 10 6 5 21 19 12 12 13 14
137
TABLE 17 Changes in dietary composition (continued)Contribution in diets by commodity
meat and fish dairy and eggs fruit and vegetables sugar vegetable oils other
1990-92 2005-07 1990-92 2005-07 1990-92 2005-07 1990-92 2005-07 1990-92 2005-07 1990-92 2005-07
Cuba 6 5 6 3 4 6 21 15 9 6 11 11
Dominica 10 11 9 9 11 12 15 14 8 5 14 15
Dominican Republic 6 9 5 4 13 9 15 16 15 16 11 13
Ecuador 6 10 7 7 11 10 9 8 18 17 14 14
El Salvador 2 4 5 7 4 4 15 15 5 6 8 12
French Guiana
Grenada 10 15 10 9 8 7 17 16 9 11 13 14
Guatemala 2 4 3 3 2 3 17 15 6 9 6 11
Guyana 3 6 3 6 1 3 14 13 4 7 15 13
Haiti 3 4 8 6 10 12 5 7 11 11
Honduras 3 6 5 7 5 6 16 17 9 9 7 6
Jamaica 7 8 4 6 5 7 20 16 10 12 11 14
Mexico 6 9 5 5 3 4 16 15 8 8 11 11
Netherlands Antilles 15 13 8 6 10 18 7 6 20 18
Nicaragua 3 4 4 5 14 15 9 9 15 10
Panama 6 8 7 7 5 4 14 12 11 8 16 16
Paraguay 12 9 4 4 4 3 9 9 8 12 14 16
Peru 3 4 3 4 4 6 12 9 5 5 14 11
St Kitts amp Nevis 11 13 8 8 2 3 15 17 13 11 14 18
St Lucia 16 20 8 8 8 7 14 13 3 5 15 17
St Vincent amp Grenadines 11 12 5 5 4 6 18 17 9 8 14 12
Suriname 7 8 7 6 15 18 7 12 12 12
Trinidad amp Tobago 5 7 6 7 3 3 19 21 11 10 11 13
Uruguay 20 10 10 7 2 3 11 13 6 8 12 12
Venezuela (Boliv Rep of) 6 9 6 4 7 4 15 16 15 14 12 13
OCEANIA 11 10 6 7 4 4 7 8 8 8 22 21
Fiji 12 11 7 10 12 10 19 19
French Polynesia 18 19 6 6 2 2 11 7 9 11 24 20
New Caledonia 11 10 7 8 2 3 11 8 12 13 16 21
Papua New Guinea
Samoa 19 17 5 8 9 9 2 7 32 31
Solomon Islands 4 3 4 4 2 4 22 18
Tonga
Vanuatu 10 8 6 5 4 6 6 5 30 27
DEVELOPED REGIONS 11 11 9 9 4 4 13 13 12 14 19 18
NORTH AMERICA 12 12 11 10 3 3 17 17 16 18 16 15
Bermuda 19 17 6 6 11 6 11 14 10 12 24 21
Canada 11 10 8 6 7 6 14 14 14 16 21 19
United States of America 12 12 11 10 3 3 17 17 16 18 15 15
ASIA amp OCEANIA 12 12 8 7 3 4 12 10 11 14 18 17
Australia 15 15 12 10 3 4 15 13 13 16 17 17
Israel 8 12 7 6 9 9 12 7 14 19 13 12
Japan 12 12 7 7 3 3 11 10 10 13 18 17
New Zealand 13 15 9 4 7 8 16 17 7 7 22 21
EUROPE 11 10 9 9 5 5 11 12 10 12 20 19
Albania 4 8 12 18 5 10 6 7 8 6 7 9
Belarus 11 11 11 7 1 3 10 11 4 11 16 16
Bosnia amp Herzegovina 4 4 6 10 5 8 4 6 2 6 13 16
Croatia 6 7 10 11 4 4 17 13 8 13 18 17
European Union 12 11 9 9 5 5 11 11 12 14 22 19
Iceland 17 21 14 16 3 4 18 13 5 6 17 17
Macedonia FYR 9 7 5 6 8 7 12 12 5 14 14 17
Montenegro
Norway 14 14 11 9 3 4 13 12 10 11 17 18
Republic of Moldova 5 4 8 11 2 2 9 12 5 6 11 12
Russian Federation 10 8 8 8 12 13 5 9 17 19
Serbia
Switzerland 16 14 12 11 4 3 13 17 11 13 22 21
Ukraine 7 6 8 9 13 15 7 10 14 16
138
TABLE 18 Health effects of malnutritionShare of children under 5 share of
lowweightnewborns
Share of adults Dietaryironsupply
underweightstunted wasted total with
low BMIwomenwith lowBMI
overweight or obese per person
male female mg day
2009 2009 2009 2009 2009 2009 2009 2009 2005-07
WORLD 18 28 9 13 91 129 145
DEVELOPING REGIONS 20 30 10 14 64 107 144
AFRICA 22 39 10 111 65 135 152
North Africa 7 24 7 10 172 361 163
Algeria 4 16 4 6 107 243 136
Egypt 7 31 8 13 16 225 463 177
Libya 6 21 7 215 413 140
Morocco 10 23 11 53 73 111 231 163
Tunisia 3 9 3 5 139 334 157
Sub-Saharan Africa 25 42 11 126 44 92 150
Angola 28 51 8 38 102 98
Benin 20 45 8 15 92 35 95 154
Botswana 11 29 6 13 30 228 147
Burkina Faso 26 35 11 16 208 17 30 242
Burundi 39 63 8 11 28 37 135
Cameroon 17 36 7 11 67 70 151 158
Cape Verde 6 63 153 121
Central African Republic 22 45 11 13 153 20 53 123
Chad 37 45 16 22 203 24 38 180
Comoros 25 7 13 25 105 35 53 92
Congo 12 31 8 13 132 28 75 120
Cocircte drsquoIvoire 17 40 9 17 82 39 97 111
Congo Dem Rep 28 46 14 185 07 30 84
Djibouti 30 33 26 10 67 138 102
Equatorial Guinea 11 35 3 79 148
Eritrea 35 44 15 14 13 23 132
Ethiopia 35 51 12 20 09 16 154
Gabon 9 26 4 66 84 215 155
Gambia 16 28 7 20 23 144 113
Ghana 14 29 9 13 164 86 44 117 140
Guinea 23 39 11 132 43 51 107
Guinea-Bissau 17 48 9 26 81 91
Kenya 16 35 7 8 123 25 68 134
Lesotho 17 45 6 57 31 266 164
Liberia 20 39 8 14 100 31 77 117
Madagascar 37 53 15 16 192 18 15 113
Malawi 16 53 4 14 92 26 62 162
Mali 28 39 15 135 24 68 187
Mauritania 23 29 13 130 43 233 133
Mauritius 15 10 14 14 129 230 132
Mozambique 21 47 5 15 86 26 78 88
Namibia 18 30 8 16 159 43 168 140
Niger 40 55 12 192 15 37 235
Nigeria 27 41 14 12 122 51 90 196
Rwanda 18 52 5 6 98 49 40 174
Senegal 15 20 9 19 182 32 125 113
Seychelles 6 5 2 151 337 153
Sierra Leone 21 37 11 14 112 36 101 114
Somalia 33 42 13 34 71
Sudan 32 38 21 41 89 157
South Africa 86 232 428 143
Swaziland 6 30 3 9 32 61 371 138
Tanzania Utd Rep 17 44 4 104 40 68 147
Togo 22 28 16 109 30 61 131
Uganda 16 39 6 14 121 43 49 145
Zambia 15 46 6 11 96 12 70 113
Zimbabwe 14 36 7 99 92 28 138 143
139
TABLE 18 Health effects of malnutrition (continued)Share of children under 5 share of
lowweightnewborns
Share of adults Dietaryironsupply
underweightstunted wasted total with
low BMIwomenwith lowBMI
overweight or obese per person
male female mg day
2009 2009 2009 2009 2009 2009 2009 2009 2005-07
ASIA 22 30 11 15 45 75 143
Central Asia 7 21 5 6 68 150 206 113
Kazakhstan 7 18 4 6 74 202 274 133
Kyrgyzstan 3 18 3 5 37 69 117 216 120
Tajikistan 15 33 9 10 80 116 127
Turkmenistan 12 22 6 4 99 139 145 98
Uzbekistan 4 20 5 5 59 145 198 99
East Asia 9 19 5 4 43 67 174
Brunei Darussalam 85 72 174
Cambodia 29 40 9 9 161 16 28 104
China 5 14 3 3 80 46 65 200
Indonesia 20 40 15 25 69 102
Korea DPR 18 45 9 37 39 156
Korea Republic of 1 3 1 47 65 69 77 218
Lao PDR 32 48 7 11 135 145 17 41 121
Malaysia 17 21 15 11 96 104 179 158
Mongolia 5 28 3 5 49 39 119 207 111
Myanmar 30 41 11 20 61 124
Philippines 21 32 7 21 123 142 45 83 99
Singapore 3 4 4 8 92 146 66 62
Thailand 7 16 5 192 49 118 117
Viet Nam 20 1 10 5 265 12 20 130
South Asia 40 46 18 27 329 21 42 106
Afghanistan 33 59 9 15 33
Bangladesh 41 43 18 297 10 13 81
Bhutan 12 38 5 9 47 66
India 44 48 20 28 329 356 13 25 108
Iran (Islamic Rep) 10 20 6 7 57 54 136 295 135
Maldives 18 20 10 65 261 177
Nepal 39 49 13 21 244 14 16 152
Pakistan 31 42 14 32 312 316 35 84 89
Sri Lanka 22 19 12 17 162 26 73 118
West Asia 10 23 6 224 356 144
Armenia 4 18 5 7 52 144 302 118
Azerbaijan 8 27 7 10 48 158 321 120
Bahrain 8 14 7 289 382
Cyprus 43 69 248 219 188
Georgia 2 15 3 5 159 257 105
Iraq 7 28 6 15 223 362
Jordan 2 8 2 13 30 39 273 417 112
Kuwait 2 4 2 7 25 07 372 524 172
Lebanon 4 17 7 264 297 161
Occupied PalestinianTerritory
2 12 2 102
Saudi Arabia 5 9 12 70 49 295 435 159
Syrian Arab Republic 10 28 12 9 238 390 133
Turkey 4 16 1 11 35 16 228 356 158
United Arab Emirates 302 430 196
Yemen 43 58 15 252 105 227 103
LATIN AMERICA amp THECARIBBEAN
4 14 2 8 30 190 279 140
Argentina 2 8 1 7 34 274 310 122
Bahamas 11 267 426 174
Barbados 5 10 4 14 32 33 216 442 192
Belize 5 22 2 14 244 454 167
Bolivia (Plur State) 5 27 1 6 20 100 271 102
Brazil 2 7 2 8 40 35 165 221 137
Chile 1 2 0 08 11 245 336 138
Colombia 3 13 1 6 39 119 237 112
Costa Rica 1 6 1 7 209 283 140
140
TABLE 18 Health effects of malnutrition (continued)Share of children under 5 share of
lowweightnewborns
Share of adults Dietaryironsupply
underweightstunted wasted total with
low BMIwomenwith lowBMI
overweight or obese per person
male female mg day
2009 2009 2009 2009 2009 2009 2009 2009 2005-07
Cuba 5 73 62 133 275 186
Dominica 10 101 391 177
Dominican Republic 3 10 2 11 144 293 100
Ecuador 6 29 2 10 19 157 282 81
El Salvador 7 21 2 29 202 329 157
French Guiana
Grenada 9 149 321 137
Guatemala 13 48 1 20 138 267 131
Guyana 11 18 8 83 271 127
Haiti 19 30 10 155 84 84 99
Honduras 9 30 1 10 40 129 263 140
Jamaica 3 5 5 100 382 150
Mexico 4 15 2 8 14 267 384 178
Netherlands Antilles 128
Nicaragua 6 23 2 37 168 313 136
Panama 6 22 1 10 36 194 321 117
Paraguay 3 18 1 162 223 139
Peru 5 28 1 19 111 217 158
St Kitts amp Nevis 11 320 494 153
St Lucia 12 15 8 11 119 319 158
St Vincent amp Grenadines 8 164 335 130
Suriname 8 11 5 11 165 346 98
Trinidad amp Tobago 4 5 5 19 216 380 134
Uruguay 6 14 3 8 207 260 113
Venezuela (Boliv Rep of) 4 16 5 8 266 348 114
OCEANIA 17 42 4 11 158 265
Fiji 10 61 56 213 422 179
French Polynesia 195
New Caledonia 183
Papua New Guinea 18 44 4 11 118 201
Samoa 2 4 1 453 667 175
Solomon Islands 16 34 7 13 19 253 392 137
Tonga 3 491 703
Vanuatu 12 26 6 10 19 29 229 368 167
DEVELOPED REGIONS 216 230 149
NORTH AMERICA 1 4 1 296 323 142
Bermuda 148
Canada 26 246 239 165
United States of America 1 4 1 24 302 332 139
ASIA amp OCEANIA 3 8 1 94 96 82 191
Australia 7 10 28 252 249 149
Israel 8 232 276 197
Japan 3 8 1 115 108 55 35 199
New Zealand 6 13 16 262 277 152
EUROPE 205 219 144
Albania 6 23 9 217 205 128
Belarus 1 5 2 4 197 264 148
Bosnia amp Herzegovina 2 12 4 5 227 253 202
Croatia 0 1 2 5 02 228 194 116
European Union 215 196 148
Iceland 4 23 30 234 203 208
Macedonia FYR 2 12 3 6 216 189 130
Montenegro 2 8 4 228 207
Norway 5 50 70 216 179 158
Republic of Moldova 3 11 5 6 59 100 288 142
Russian Federation 6 184 298 134
Serbia 2 8 5 6 255 203
Switzerland 35 59 183 116 126
Ukraine 4 23 8 4 54 155 236 127
141
TABLE 19 Trade and food security - caloric self-sufficiencyCaloric self-sufficiency
pa
1970 1980 1990 2000 2009 growth1970-2009
WORLD 1002 1002 1002 1002 1006 00
DEVELOPING REGIONS 997 968 983 964 948 minus04
AFRICA 1021 883 866 821 822 minus06
North Africa 901 638 660 668 761 minus13
Algeria 860
Egypt 930 602 605 668 827 minus03
Libya
Morocco 939 721 813 643 minus10
Tunisia 703 669 612 608 minus04
Sub-Saharan Africa 1044 957 962 920 873 minus06
Angola 1137 697 652 731 779 minus10
Benin 1107 1022 898 992 909 minus05
Botswana
Burkina Faso 1004 967 941 911 922 minus02
Burundi 985 968 981 971 891 minus03
Cameroon 1037 997 977 926 888 minus04
Cape Verde
Central African Republic 964 981 937 951 924 minus01
Chad 968 984 952 970 930 minus01
Comoros 901 825 701 783 692 minus07
Congo 1272 799 880 607 908 minus09
Cocircte drsquoIvoire 1044 1074 1205 1203 1092 01
Congo Dem Rep 1025 962 961 953 879 minus04
Djibouti
Equatorial Guinea 1483 1049 879 835 694 minus19
Eritrea 678
Ethiopia 899 908
Gabon 851 802 763 630 588 minus09
Gambia 1462 1241 703 638 535 minus25
Ghana 1041 990 977 986 939 minus03
Guinea 977 914 863 879 879 minus03
Guinea-Bissau 1055 950 881 871 1048 minus00
Kenya 1004 901 899 742 610 minus13
Lesotho 712 535 536
Liberia 878 823 855 654 707 minus06
Madagascar 1047 975 981 900 918 minus03
Malawi 970 1077 944 994 989 00
Mali 971 970 969 939 940 minus01
Mauritania 682
Mauritius 1057 815
Mozambique 1148 928 811 866 824 minus08
Namibia 691 650 555 564 minus05
Niger 1199 991 941 882 945 minus06
Nigeria 1049 871 982 940 900 minus04
Rwanda 982 977 951 927 890 minus03
Senegal 1095 839 866 817 686 minus12
Seychelles 1055 547
Sierra Leone 946 888 840 751 898 minus01
Somalia 921 765 851 693 524 minus14
Sudan 998 1027 935 923 795 minus06
South Africa 1173 1325 1107 980 940 minus06
Swaziland 2814 1201 minus22
Tanzania Utd Rep 1027 947 1001 902 914 minus03
Togo 1066 966 910 940 840 minus06
Uganda 1010 979 999 965 933 minus02
Zambia 797 711 901 976 1005 06
Zimbabwe 1242 1039 1307 1094 538 minus21
142
TABLE 19 Trade and food security - caloric self-sufficiency (continued)Caloric self-sufficiency
pa
1970 1980 1990 2000 2009 growth1970-2009
ASIA 980 970 987 969 943 03
Central Asia 1138 1002
Kazakhstan 1628 1235
Kyrgyzstan 918 808
Tajikistan 625 574
Turkmenistan 939 895
Uzbekistan 833 841
East Asia 995 982 1017 997 970 minus01
Brunei Darussalam
Cambodia 1075 883 990 939 951 minus03
China 982 953 963 970 895 minus02
Indonesia 1002 964 1036 1039 1247 06
Korea DPR 920 943 906 635 903 minus00
Korea Republic of 755 533
Lao PDR 904 982 987 976 1027 03
Malaysia 925 1336 1540 1340 1455 12
Mongolia 791 845 929 586 627 minus06
Myanmar 1094 1054 1009 1019 1003 minus02
Philippines 1245 1204 1012 922 893 minus08
Singapore
Thailand 1296 1552 1784 1390 1421 02
Viet Nam 797 932 1094 1074 961 05
South Asia 969 955 957 934 906 minus02
Afghanistan 968 984 881 680 812 minus04
Bangladesh 901 894 906 848 800 minus03
Bhutan 834 936 776 707 952 03
India 979 983 1000 986 957 minus01
Iran (Islamic Rep) 958 714 690 606 650 minus10
Maldives
Nepal 1092 991 982 943 920 minus04
Pakistan 991 982 900 926 909 minus02
Sri Lanka 717 792 778 682 721 00
West Asia 868 890 824 876 832
Armenia 539
Azerbaijan 693 734
Bahrain
Cyprus 631
Georgia
Iraq 858
Jordan
Kuwait
Lebanon
Occupied PalestinianTerritory
Saudi Arabia 692
Syrian Arab Republic 724 841 657 679 560 minus07
Turkey 966 1018 921 955 933 minus01
United Arab Emirates
Yemen 709 543
LATIN AMERICA amp THECARIBBEAN
1078 1040 1049 1026 1125 minus06
Argentina 1708 1895 2095 2454 2736 12
Bahamas
Barbados 1754 597 514
Belize 2460 1539
Bolivia (Plur State) 827 870 1024 1201 1421 14
Brazil 1058 1071 1123 1124 1406 07
Chile 843 677 964 680 697 minus05
Colombia 982 925 965 839 783 minus06
Costa Rica 1170 1086 1007 949 910 minus06
143
TABLE 19 Trade and food security - caloric self-sufficiency (continued)Caloric self-sufficiency
pa
1970 1980 1990 2000 2009 growth1970-2009
Cuba 2382 2213 1486 594
Dominica 941 555 527 517 minus15
Dominican Republic 2375 1259 815 508 538 minus37
Ecuador 1080 982 989 1015 1008 minus02
El Salvador 974 880 804 664 701 minus08
French Guiana
Grenada 776 653 501
Guatemala 1000 1099 1054 1267 1199 05
Guyana 2957 2046 1337 2674 1695 minus14
Haiti 958 818 652 528 510 minus16
Honduras 1124 1096 1010 868 880 minus06
Jamaica 1124 559 565
Mexico 997 771 744 669 696 minus09
Netherlands Antilles
Nicaragua 1195 867 913 937 951 minus06
Panama 1103 1105 922 637 544 minus18
Paraguay 1035 1132 1580 1663
Peru 952 636 668 684 661 minus09
St Kitts amp Nevis 1537 1019 524
St Lucia 1012 892 919
St Vincent amp Grenadines 827 517 826
Suriname 834 1163 886 793 792 minus01
Trinidad amp Tobago 1058
Uruguay 1106 1210 1663 1350 2324 19
Venezuela (Boliv Rep of) 724 616 584 619 minus04
OCEANIA 1177 1169 1342 1388 1369 minus04
Fiji 2610 1943 1322
French Polynesia 915 860 600
New Caledonia
Papua New Guinea 1162 1127 1192 1354 1431 05
Samoa 1172 1340 931 836 729 minus12
Solomon Islands 1331 1745 1903 1340 1222 minus02
Tonga 1216 1160 810 793 759 minus12
Vanuatu 1555 1329 1392 1323 1078 minus09
DEVELOPED REGIONS 1064 1190 1181 1122 1140 18
NORTH AMERICA 1260 1612 1353 1321 1290 01
Bermuda
Canada 1585 1717 1538 1607 1832 04
United States of America 1226 1599 1328 1286 1238 00
ASIA amp OCEANIA 2321 1787 2667 2720 2040 minus02
Australia 2416 2907 2931 2075 minus04
Israel
Japan
New Zealand 1833 1787 1443 1646 1859 00
EUROPE 913 873 935 967 1012 03
Albania 875 973 792 601 615 minus09
Belarus 775 1036
Bosnia amp Herzegovina 548 625
Croatia 1016 1086
European Union 851 877 982 987 925 02
Iceland
Macedonia FYR 727 681
Montenegro
Norway 588 621 714 643 501 minus04
Republic of Moldova 1074 1333
Russian Federation 884 1131
Serbia 1262
Switzerland 551 716 662 627
Ukraine 1081 1933
144
TABLE 20 Trade and food security - import billsFood import bills Food + energy import bills share of GDP
total per capita
millionUS$
millionUS$
pa US$ US$ pa pa
2000 2010 growth2000-2010
2000 2010 growth2000-2010
2000 2010 growth2000-2010
WORLD 3980557 10296380 100 651 1495 87 33 58 58
DEVELOPING REGIONS 1162631 3731805 124 236 660 108 44 73 52
AFRICA 179991 597794 128 222 585 102 57 82 38
North Africa 87973 250019 110 620 1507 93 53 86 50
Algeria 25413 78633 120 832 2217 103 49 60 20
Egypt 32784 97155 115 485 1198 95 44 89 74
Libya 7941 15315 68 1518 2410 47 28 42 41
Morocco 15154 40877 104 526 1279 93 96 142 40
Tunisia 6546 18039 107 692 1721 95 72 96 29
Sub-Saharan Africa 92018 347775 142 138 406 114 60 80 30
Angola 6384 22925 136 458 1201 101 92 33 minus97
Benin 1120 6475 192 172 732 156 92 166 61
Botswana 2561 5778 85 1457 2879 70 63 120 66
Burkina Faso 931 2586 107 76 157 76 89 79 minus12
Burundi 270 1011 141 42 121 110 69 109 47
Cameroon 2542 11843 166 162 604 141 60 89 41
Cape Verde 593 1768 115 1357 3566 101 137 166 20
Central African Republic 242 719 115 65 163 96 32 62 70
Chad 415 2940 216 51 262 179 37 67 61
Comoros 119 605 177 211 823 146 80 128 48
Congo 995 7212 219 317 1784 188 34 83 94
Cocircte drsquoIvoire 3884 15493 148 234 785 129 117 150 25
Congo Dem Rep 2055 7116 132 41 108 101 68 84 21
Djibouti 374 1080 112 511 1215 90 73 118 49
Equatorial Guinea 332 2025 198 639 2893 163 65 189 112
Eritrea 1741 2244 26 475 427 minus10 257 143 minus57
Ethiopia 818 10336 289 12 125 259 41 88 79
Gabon 1380 4160 117 1117 2764 95 33 47 38
Gambia 613 958 46 473 555 16 138 147 07
Ghana 3348 16092 170 175 660 142 133 118 minus12
Guinea 1047 2455 89 125 246 70 72 122 55
Guinea-Bissau 97 670 213 78 442 189 35 125 135
Kenya 3846 14908 145 123 368 116 83 140 53
Lesotho 1226 2628 79 624 1210 68 343 155 minus77
Liberia 86 144 52 30 36 17 49 58 17
Madagascar 1207 3988 127 79 193 94 87 92 06
Malawi 518 1664 124 46 112 92 60 82 33
Mali 1144 4073 135 101 265 101 114 106 minus07
Mauritania 1071 5483 177 405 1585 146 141 272 68
Mauritius 2822 8861 121 2360 6821 112 111 181 50
Mozambique 1931 5066 101 106 217 74 75 112 40
Namibia 2126 3940 64 1121 1726 44 64 63 minus01
Niger 558 4720 238 51 304 195 80 170 78
Nigeria 14703 57626 146 119 364 118 41 47 12
Rwanda 425 2459 192 52 231 160 40 60 41
Senegal 3349 10256 118 352 825 89 146 192 28
Seychelles 304 1867 199 3850 21458 187 170 521 118
Sierra Leone 413 1694 152 100 289 112 131 264 73
Somalia 1411 6048 157 191 648 130
Sudan 3594 14751 152 105 339 124 37 29 minus25
South Africa 11075 40750 139 247 813 126 37 70 65
Swaziland 1792 4013 84 1684 3384 72 207 140 minus38
Tanzania Utd Rep 2208 7585 131 65 169 101 54 142 101
Togo 714 2051 111 149 340 86 131 208 48
Uganda 1766 5306 116 73 159 81 66 80 20
Zambia 694 2334 129 68 178 101 55 66 20
Zimbabwe 759 7845 263 61 624 263 226
145
TABLE 20 Trade and food security - import bills (continued)Food import bills Food + energy import bills share of GDP
total per capita
millionUS$
millionUS$
pa US$ US$ pa pa
2000 2010 growth2000-2010
2000 2010 growth2000-2010
2000 2010 growth2000-2010
ASIA 714793 2459868 132 199 611 118 51 82 50
Central Asia 9547 39240 152 172 646 141 54 56 04
Kazakhstan 3726 17041 164 249 1063 156 50 38 minus27
Kyrgyzstan 635 4573 218 128 857 209 140 280 71
Tajikistan 652 4582 215 106 666 202 309 204 minus41
Turkmenistan 1803 4291 91 400 851 78 40
Uzbekistan 2732 8754 124 110 319 112 37 51 32
East Asia 409084 1480333 137 216 725 129 57 88 44
Brunei Darussalam 1727 4502 101 5282 11283 79 29 46 47
Cambodia 938 5678 197 75 402 182 117 167 37
China 207426 837460 150 160 610 143 35 61 57
Indonesia 53 73 33
Korea DPR 2315 2171 minus06 101 89 minus12
Korea Republic of 71923 215999 116 1564 4483 111 85 156 63
Lao PDR 481 1632 130 91 263 113 67 92 32
Malaysia 33406 120525 137 1427 4244 115 78 147 66
Mongolia 778 3684 168 323 1337 153 179 207 15
Myanmar 2184 4950 85 49 103 78 65 40 minus48
Philippines 24056 58852 94 311 631 73 86 90 05
Singapore 32231 80440 96 8224 15816 68 206 448 81
Thailand 24502 82275 129 388 1190 119 81 151 64
Viet Nam 7115 60078 238 90 684 224 91 159 58
South Asia 95776 322413 129 66 189 112 34 83 94
Afghanistan 4174 6659 48 183 212 15 96
Bangladesh 11087 53509 170 86 360 154 37 76 74
Bhutan 220 1100 175 385 1515 147 85 159 65
India 31571 124317 147 30 102 130 26 93 136
Iran (Islamic Rep) 22803 62356 106 349 843 92 28 35 23
Maldives 774 1624 77 2834 5138 61 155 208 30
Nepal 1752 5754 126 72 192 103 72 107 41
Pakistan 15200 48709 124 105 281 103 69 100 38
Sri Lanka 8195 18386 84 437 881 73 83 93 11
West Asia 200387 617881 119 1130 2765 94 44 60 33
Armenia 1753 5934 130 570 1919 129 161 132 minus20
Azerbaijan 1996 9581 170 246 1043 155 49 24 minus68
Bahrain 7491 12547 53 11742 9942 minus16 104 73 minus35
Cyprus 3369 9773 112 3572 8852 95 89 115 26
Georgia 1434 8223 191 302 1889 201 92 157 55
Iraq 33338 83450 96 1397 2635 65 153
Jordan 8045 23347 112 1667 3774 85 118 227 68
Kuwait 9231 34226 140 4756 12505 102 26 32 24
Lebanon 9576 27103 110 2559 6410 96 115 159 33
Occupied PalestinianTerritory
4541 6448 36 1420 1596 12
Saudi Arabia 49863 148133 115 2488 5397 81 27 40 41
Syrian Arab Republic 6831 24656 137 427 1208 110 43 110 99
Turkey 17633 69629 147 277 957 132 35 55 46
United Arab Emirates 31295 98922 122 10318 13168 25 36 50 32
Yemen 7901 29831 142 446 1240 108 110 191 57
LATIN AMERICA amp THECARIBBEAN
258747 650107 97 496 1102 83 27 43 47
Argentina 11905 20384 55 322 504 46 07 14 66
Bahamas 2826 4630 51 9483 13498 36 89 147 51
Barbados 1080 3170 114 4028 11610 112 75 129 55
Belize 591 850 37 2353 2724 15 182 155 minus16
Bolivia (Plur State) 2394 3798 47 288 383 29 39 59 42
Brazil 35101 78639 84 201 403 72 18 24 25
Chile 11818 44242 141 766 2585 129 56 113 73
Colombia 13256 38065 111 333 822 94 16 25 49
Costa Rica 4059 11415 109 1036 2450 90 59 96 51
146
TABLE 20 Trade and food security - import bills (continued)Food import bills Food + energy import bills share of GDP
total per capita
millionUS$
millionUS$
pa US$ US$ pa pa
2000 2010 growth2000-2010
2000 2010 growth2000-2010
2000 2010 growth2000-2010
Cuba 7509 18935 97 676 1682 95
Dominica 273 460 54 3896 6759 57 153 222 38
Dominican Republic 7653 18710 94 891 1885 78 97 108 11
Ecuador 2997 17957 196 243 1241 177 36 83 89
El Salvador 6871 13533 70 1157 2185 66 98 128 27
French Guiana
Grenada 391 570 38 3836 5481 36 140 161 14
Guatemala 5612 17487 120 499 1215 93 69 113 51
Guyana 1074 1680 46 1466 2229 43 186 253 31
Haiti 3301 14633 161 382 1464 144 100 246 94
Honduras 5388 11595 80 866 1526 58 127 188 40
Jamaica 4677 7485 48 1811 2731 42 117 209 60
Mexico 82457 186109 85 825 1641 71 20 48 91
Netherlands Antilles 1124 1466 27 6243 7292 16
Nicaragua 2562 7105 107 505 1228 93 141 278 70
Panama 3690 9770 102 1248 2778 83 86 51 minus51
Paraguay 1585 4199 102 297 651 82 72 114 46
Peru 8304 29975 137 321 1031 124 37 57 44
St Kitts amp Nevis 314 487 45 6828 9373 32 141 131 minus07
St Lucia 571 274 minus71 3639 1572 minus80 184 492 103
St Vincent amp Grenadines 398 708 59 3683 6494 58 163 271 52
Suriname 582 2033 133 1247 3873 120 99 107 08
Trinidad amp Tobago 2561 7088 107 1983 5286 103 162 130 minus22
Uruguay 3455 8785 98 1041 2608 96 38 102 103
Venezuela (Boliv Rep of) 17548 60738 132 721 2096 113 20 22 13
OCEANIA 9099 24035 102 1122 2414 80 336 346 03
Fiji 1023 2604 98 1259 3025 92 90 257 111
French Polynesia 1886 3682 69 7924 13585 55
New Caledonia 1242 3050 94 5859 12151 76
Papua New Guinea 1789 6057 130 333 883 103 116 141 20
Samoa 250 722 112 1411 3948 108 178 227 25
Solomon Islands 101 862 240 246 1602 206 87 271 120
Tonga 131 490 141 1341 4710 134 126 282 84
Vanuatu 124 507 151 672 2111 121 75 169 85
DEVELOPED REGIONS 2817926 6564575 88 2361 5288 84 30 51 56
NORTH AMERICA 523687 1042686 71 1672 3026 61 19 33 55
Bermuda 313 1349 157 4964 20751 154
Canada 107827 241046 84 3516 7086 73 32 47 40
United States of America 414893 798725 68 1469 2573 58 18 31 56
ASIA amp OCEANIA 41 3163 4565 37 26 48 63
Australia 25799 82915 124 1346 3724 107 20 35 56
Israel 17637 46462 102 2932 6263 79 43 34 minus22
Japan 436892 575640 28 3475 4549 27 26 51 70
New Zealand 9144 28151 119 2370 6445 105 44 63 35
EUROPE 1804766 4788721 103 2488 6500 101 44 68 44
Albania 1978 6375 124 644 1990 119 81 105 26
Belarus 9010 24432 105 896 2546 110 335 294 minus13
Bosnia amp Herzegovina 6704 14597 81 1815 3882 79 166 157 minus05
Croatia 5845 19002 125 1297 4316 128 81 90 10
European Union 1630103 4127225 97 3385 8245 93 44 70 47
Iceland 2054 3803 64 7310 11886 50 51 74 37
Macedonia FYR 2299 6631 112 1144 3217 109 145 156 08
Montenegro 4438 7033 173
Norway 19698 53402 105 4386 10936 96 19 27 38
Republic of Moldova 518 4516 242 126 1264 259 189 181 minus04
Russian Federation 83028 391496 168 566 2739 171 40 36 minus11
Serbia 8668 879 92
Switzerland 34857 82665 90 4863 10786 83 29 43 41
Ukraine 6999 48454 213 143 1066 222 214 208 minus03
147
TABLE 21 Dimensions of povertyPoverty gap at Poverty headcount ratio Multi-
dimensional
$125 aday (ppp)
$2 a day(ppp)
nationalpovertyline
ruralpovertyline
$125 aday (ppp)
$2 a day(ppp)
nationalpovertyline
ruralpovertyline
poverty(MPI)
0 to 1
2009 2009 2009 2009 2009 2009 2009 2009 2009
WORLD
DEVELOPING REGIONS
AFRICA
North Africa
Algeria 14 65 32 45 68 236 226 303
Egypt 04 35 36 20 185 220 300 00
Libya
Morocco 05 31 25 140 90 145 00
Tunisia 05 30 25 128 38 00
Sub-Saharan Africa
Angola 299 424 543 702 05
Benin 157 335 120 140 473 753 390 460 04
Botswana 110 223 117 184 312 494 306 448
Burkina Faso 203 393 153 176 565 812 464 524 05
Burundi 364 561 234 242 813 935 669 689 05
Cameroon 12 82 123 175 96 304 399 550 03
Cape Verde 60 152 81 143 210 409 266 443
Central African Republic 313 468 331 350 628 801 620 694 05
Chad 256 439 216 233 619 833 550 586 03
Comoros 208 342 163 178 461 650 448 487 04
Congo 228 388 189 206 541 744 501 577 02
Cocircte drsquoIvoire 75 178 153 203 238 463 427 542 04
Congo Dem Rep 253 424 322 349 592 796 713 757 04
Djibouti 53 146 188 412 01
Equatorial Guinea
Eritrea 690
Ethiopia 96 289 83 85 390 776 389 393 06
Gabon 09 50 100 160 48 196 327 446 02
Gambia 121 249 251 305 343 567 580 678 03
Ghana 105 223 96 135 300 536 285 392 01
Guinea 150 310 176 220 433 696 530 630 05
Guinea-Bissau 165 348 250 278 488 779 647 691
Kenya 61 151 163 175 197 399 459 491 02
Lesotho 208 331 379 265 434 623 566 605 02
Liberia 408 595 244 263 837 948 638 677 05
Madagascar 265 469 268 289 678 896 687 735 04
Malawi 323 518 80 86 739 905 524 559 04
Mali 188 365 167 514 771 474 576 06
Mauritania 57 159 170 241 212 441 463 612 04
Mauritius
Mozambique 252 429 212 222 600 816 547 569 05
Namibia 246 365 130 160 491 622 380 490 02
Niger 119 306 196 212 431 759 595 639 06
Nigeria 296 469 228 266 644 839 547 638 03
Rwanda 409 572 240 260 768 896 585 642 04
Senegal 108 247 164 215 335 604 508 619 04
Seychelles 01 03 02 18
Sierra Leone 203 375 275 346 534 761 664 785 04
Somalia 05
Sudan
South Africa 33 123 70 174 357 230 01
Swaziland 294 458 329 370 629 810 692 750 02
Tanzania Utd Rep 281 475 99 110 679 879 334 374 04
Togo 114 279 229 293 387 693 617 743 03
Uganda 83 213 68 76 287 553 245 272 04
Zambia 328 483 285 388 643 815 593 768 03
Zimbabwe 160 720 440 02
148
TABLE 21 Dimensions of poverty (continued)Poverty gap at Poverty headcount ratio Multi-
dimensional
$125 aday (ppp)
$2 a day(ppp)
nationalpovertyline
ruralpovertyline
$125 aday (ppp)
$2 a day(ppp)
nationalpovertyline
ruralpovertyline
poverty(MPI)
0 to 1
2009 2009 2009 2009 2009 2009 2009 2009 2009
ASIA
Central Asia
Kazakhstan 01 03 31 45 02 15 154 217 00
Kyrgyzstan 01 55 100 120 19 294 431 508 00
Tajikistan 51 168 124 124 215 509 472 492 01
Turkmenistan 70 184 248 497
Uzbekistan 150 332 463 767 00
East Asia
Brunei Darussalam
Cambodia 61 202 72 83 283 565 301 345 03
China 40 122 159 363 28 25
Indonesia 36 155 25 31 187 506 142 174 01
Korea DPR
Korea Republic of
Lao PDR 89 248 339 660 276 317 03
Malaysia 00 02 08 18 00 23 38 82
Mongolia 62 172 101 134 224 491 352 466 01
Myanmar 02
Philippines 55 164 27 152 226 450 265 507 01
Singapore
Thailand 19 83 30 108 265 81 104 00
Viet Nam 23 109 35 46 131 385 145 187 01
South Asia
Afghanistan 79 83 360 375
Bangladesh 131 338 90 98 496 813 400 438 03
Bhutan 70 188 61 81 262 495 232 309 01
India 105 295 416 756 275 283 03
Iran (Islamic Rep) 03 18 14 80
Maldives 01 25 15 122 00
Nepal 197 378 75 85 551 776 309 346 03
Pakistan 43 187 226 603 223 270 03
Sri Lanka 10 74 31 32 70 291 152 157 00
West Asia
Armenia 02 23 49 121 13 124 265 255 00
Azerbaijan 02 15 20 10 78 158 185 00
Bahrain
Cyprus
Georgia 46 118 72 92 147 326 236 297 00
Iraq 06 55 45 90 40 253 229 393 01
Jordan 01 06 26 04 35 133 190 00
Kuwait
Lebanon
Occupied PalestinianTerritory
Saudi Arabia
Syrian Arab Republic 02 33 17 169 00
Turkey 09 26 27 91 181 387 00
United Arab Emirates 00
Yemen 42 148 89 106 175 466 348 401 03
LATIN AMERICA amp THECARIBBEAN
Argentina 04 08 09 24 00
Bahamas
Barbados
Belize 47 97 121 240 335 442 00
Bolivia (Plur State) 58 109 140 247 601 773 01
Brazil 11 32 38 99 214 00
Chile 04 08 08 24 151 129
Colombia 57 119 160 279 455 643 00
Costa Rica 01 11 07 54 217 230
149
TABLE 21 Dimensions of poverty (continued)Poverty gap at Poverty headcount ratio Multi-
dimensional
$125 aday (ppp)
$2 a day(ppp)
nationalpovertyline
ruralpovertyline
$125 aday (ppp)
$2 a day(ppp)
nationalpovertyline
ruralpovertyline
poverty(MPI)
0 to 1
2009 2009 2009 2009 2009 2009 2009 2009 2009
Cuba
Dominica
Dominican Republic 09 39 43 136 505 571 00
Ecuador 16 44 51 134 360 575 00
El Salvador 11 45 51 152 378 465
French Guiana
Grenada
Guatemala 65 129 169 298 510 705 01
Guyana 39 69 77 168 01
Haiti 282 418 549 722 770 880 03
Honduras 119 182 233 354 588 644 02
Jamaica 00 09 02 58 99 251
Mexico 17 32 34 81 474 608 00
Netherlands Antilles
Nicaragua 52 123 158 319 462 679 01
Panama 31 71 95 179 327 598
Paraguay 15 43 51 132 351 498 01
Peru 14 47 59 147 348 603 01
St Kitts amp Nevis
St Lucia 72 155 209 406
St Vincent amp Grenadines
Suriname 59 117 155 272 00
Trinidad amp Tobago 11 39 42 135 00
Uruguay 00 00 00 02 205 222 00
Venezuela (Boliv Rep of) 11 32 35 101 290
OCEANIA
Fiji 101 148 310 433
French Polynesia
New Caledonia
Papua New Guinea 123 255 124 138 358 574 375 413
Samoa
Solomon Islands
Tonga
Vanuatu 01
DEVELOPED REGIONS
NORTH AMERICA
Bermuda
Canada
United States of America
ASIA amp OCEANIA
Australia
Israel
Japan
New Zealand
EUROPE
Albania 02 08 23 26 06 42 124 146 00
Belarus 00 00 00 00 54
Bosnia amp Herzegovina 00 01 46 49 00 02 140 178 00
Croatia 00 00 26 00 00 111 00
European Union
Iceland
Macedonia FYR 00 07 72 77 03 43 190 213 00
Montenegro 00 00 09 14 00 00 49 89 00
Norway
Republic of Moldova 03 26 19 125 290 00
Russian Federation 00 00 27 55 00 01 111 212 00
Serbia 01 02 13 20 01 07 66 98 00
Switzerland
Ukraine 00 01 15 23 01 05 79 113 00
150
TABLE 22 Dimensions of inequalityHuman Development Index Gender
inequalityIndex
Gini-index Income share held by
inequalityadjusted
incomedistribution
highest20
lowest20
index index index index
2010 2010 2008 2009 2009 2009
WORLD
DEVELOPING REGIONS
AFRICA
North Africa
Algeria 07 06 353
Egypt 06 04 07 321 415 90
Libya 07 05
Morocco 06 04 07 409 479 65
Tunisia 07 05 05 408 473 60
Sub-Saharan Africa
Angola 04 02 586 619 20
Benin 04 03 07 386 461 70
Botswana 06 06 610
Burkina Faso 03 02 396 471 70
Burundi 03 02 06 333 428 90
Cameroon 05 03 07 446 462 67
Cape Verde 05 504 559 45
Central African Republic 03 02 08 436 606 34
Chad 03 02 398 466 63
Comoros 04 02 643 680 25
Congo 05 03 07 473 531 50
Cocircte drsquoIvoire 04 03 07 415 476 56
Congo Dem Rep 02 02 08
Djibouti 04 03 399 465 60
Equatorial Guinea 05
Eritrea
Ethiopia 03 02 298 394 93
Gabon 06 05 06 415 482 62
Gambia 04 02 07 473 528 48
Ghana 05 03 07 428 485 52
Guinea 03 02 394 462 63
Guinea-Bissau 03 02 355 432 73
Kenya 05 03 07 477 532 48
Lesotho 04 03 07 525 564 30
Liberia 03 02 08 382 450 64
Madagascar 04 03 472 535 62
Malawi 04 03 07 390 465 70
Mali 03 02 08 390 460 65
Mauritania 04 03 07 390 457 62
Mauritius 07
Mozambique 03 02 07 456 515 52
Namibia 06 03 06 743
Niger 03 02 08 340 428 83
Nigeria 04 02 429 486 51
Rwanda 04 02 06 531 582 42
Senegal 04 03 07 392 459 62
Seychelles 658 696 37
Sierra Leone 03 02 08 425 493 61
Somalia
Sudan 04 07
South Africa 06 04 06 578 722 25
Swaziland 05 03 07 507 559 45
Tanzania Utd Rep 04 03 376 448 68
Togo 04 03 07 344 424 76
Uganda 04 03 07 443 493 61
Zambia 04 03 07 507 552 36
Zimbabwe 01 01 07 501
151
TABLE 22 Dimensions of inequality (continued)Human Development Index Gender
inequalityIndex
Gini-index Income share held by
inequalityadjusted
incomedistribution
highest20
lowest20
index index index index
2010 2010 2008 2009 2009 2009
ASIA
Central Asia
Kazakhstan 07 06 05 309 399 87
Kyrgyzstan 06 05 05 334 428 88
Tajikistan 06 05 05 336 417 78
Turkmenistan 07 05 408
Uzbekistan 06 05 367 442 71
East Asia
Brunei Darussalam 08
Cambodia 05 04 06 444 517 66
China 05 04 415 478 57
Indonesia 06 05 07 368 455 74
Korea DPR
Korea Republic of 09 07 03 316
Lao PDR 05 04 06 367 448 76
Malaysia 07 04 462 448 65
Mongolia 06 05 05 365 405 72
Myanmar 04
Philippines 06 05 06 440 504 56
Singapore 08 02 425
Thailand 06 05 05 536 493 62
Viet Nam 06 05 05 376 454 73
South Asia
Afghanistan 03 08 294 387 90
Bangladesh 05 03 07 310 408 94
Bhutan 467 530 54
India 05 04 07 368 453 81
Iran (Islamic Rep) 07 06 383 452 64
Maldives 06 05 05 374 442 65
Nepal 04 03 07 473 540 59
Pakistan 05 03 07 327 421 90
Sri Lanka 07 05 06 403 478 69
West Asia
Armenia 07 06 05 309 398 88
Azerbaijan 07 06 05 337 421 80
Bahrain 08 05
Cyprus 08 07 03
Georgia 07 06 06 413 471 53
Iraq 07 399 87
Jordan 07 06 06 377 455 73
Kuwait 08 05
Lebanon
Occupied PalestinianTerritory
Saudi Arabia 07 08
Syrian Arab Republic 06 05 06 358 439 77
Turkey 07 05 06 397 489 52
United Arab Emirates 08 04
Yemen 04 03 08 377
LATIN AMERICA amp THECARIBBEAN
Argentina 08 06 05 458 531 36
Bahamas 08 07
Barbados 08 05
Belize 07 05 06 544
Bolivia (Plur State) 06 04 06 573 610 28
Brazil 07 05 06 539 585 32
Chile 08 06 05 521 572 43
Colombia 07 05 06 585 621 25
Costa Rica 07 06 05 503 523 44
152
TABLE 22 Dimensions of inequality (continued)Human Development Index Gender
inequalityIndex
Gini-index Income share held by
inequalityadjusted
incomedistribution
highest20
lowest20
index index index index
2010 2010 2008 2009 2009 2009
Cuba 05
Dominica
Dominican Republic 07 05 06 484 536 44
Ecuador 07 06 06 490 589 36
El Salvador 07 05 06 469 519 47
French Guiana
Grenada
Guatemala 06 04 07 537 580 35
Guyana 06 05 06 432
Haiti 04 02 07 595 630 25
Honduras 06 04 06 577 607 20
Jamaica 07 06 06 455 516 53
Mexico 07 06 06 517 562 38
Netherlands Antilles
Nicaragua 06 04 06 523 569 38
Panama 08 05 06 523 586 27
Paraguay 06 05 06 520 565 38
Peru 07 05 06 480 543 40
St Kitts amp Nevis
St Lucia 426
St Vincent amp Grenadines
Suriname 06 05 528
Trinidad amp Tobago 07 06 05 403
Uruguay 08 06 05 424 515 46
Venezuela (Boliv Rep of) 07 05 06 435 490 49
OCEANIA
Fiji 07
French Polynesia
New Caledonia
Papua New Guinea 04 08 509
Samoa
Solomon Islands 05
Tonga 07
Vanuatu
DEVELOPED REGIONS
NORTH AMERICA
Bermuda
Canada 09 08 03 326 399 72
United States of America 09 08 05 408 458 54
ASIA amp OCEANIA
Australia 09 09 03 352
Israel 09 08 03 392 449 57
Japan 09 03 249
New Zealand 09 03 362
EUROPE
Albania 07 06 05 345 430 81
Belarus 07 07 272 364 92
Bosnia amp Herzegovina 07 06 362 432 67
Croatia 08 07 04 336 420 81
European Union
Iceland 09 08 03
Macedonia FYR 07 06 442 503 54
Montenegro 07 300 388 85
Norway 09 09 02 258 372 96
Republic of Moldova 06 05 05 380 453 68
Russian Federation 07 06 05 423 489 60
Serbia 07 282
Switzerland 09 08 02 337 413 75
Ukraine 07 07 05 275 371 94
153
TABLE 23 GovernanceVoice ampaccount-ability
Politicalstabilityabsence ofviolence ampterrorism
Govern-ment
effectiveness
Regulatoryquality
Rule oflaw
Control ofcorruption
Averagegovernance
-25 to 25(lowest tohighest)
-25 to 25(lowest tohighest)
-25 to 25(lowest tohighest)
-25 to 25(lowest tohighest)
-25 to 25(lowest tohighest)
-25 to 25(lowest tohighest)
-25 to 25(lowest tohighest)
2010 2010 2010 2010 2010 2010 2010
WORLD
DEVELOPING REGIONS
AFRICA
North Africa
Algeria minus10 minus13 minus06 minus11 minus08 minus05 minus09
Egypt minus12 minus09 minus04 minus02 minus01 minus06 minus06
Libya minus19 minus01 minus12 minus12 minus10 minus13 minus11
Morocco minus08 minus05 minus02 minus01 minus02 minus02 minus03
Tunisia minus13 01 02 minus00 01 minus01 minus02
Sub-Saharan Africa
Angola minus11 minus02 minus11 minus10 minus12 minus13 minus10
Benin 03 03 minus05 minus03 minus07 minus08 minus03
Botswana 04 09 05 05 07 10 07
Burkina Faso minus02 minus01 minus06 minus01 minus02 minus04 minus03
Burundi minus09 minus15 minus11 minus11 minus12 minus11 minus12
Cameroon minus11 minus06 minus09 minus07 minus10 minus10 minus09
Cape Verde 09 08 minus01 minus01 04 08 05
Central African Republic minus11 minus21 minus14 minus11 minus13 minus08 minus13
Chad minus14 minus15 minus15 minus11 minus15 minus13 minus14
Comoros minus04 minus04 minus17 minus15 minus11 minus07 minus10
Congo minus10 minus02 minus12 minus13 minus11 minus11 minus10
Cocircte drsquoIvoire minus11 minus16 minus13 minus09 minus12 minus11 minus12
Congo Dem Rep minus14 minus22 minus17 minus16 minus16 minus14 minus17
Djibouti minus11 03 minus10 minus07 minus07 minus03 minus06
Equatorial Guinea minus19 02 minus17 minus14 minus13 minus15 minus12
Eritrea minus22 minus09 minus14 minus22 minus13 minus05 minus14
Ethiopia minus13 minus17 minus03 minus09 minus08 minus07 minus10
Gabon minus09 02 minus09 minus06 minus05 minus08 minus06
Gambia minus11 01 minus07 minus04 minus05 minus06 minus05
Ghana 05 00 minus00 01 minus01 01 01
Guinea minus09 minus18 minus11 minus11 minus15 minus12 minus13
Guinea-Bissau minus09 minus08 minus10 minus11 minus14 minus11 minus10
Kenya minus02 minus12 minus05 minus01 minus10 minus09 minus07
Lesotho minus02 05 minus04 minus06 minus03 02 minus01
Liberia minus02 minus05 minus12 minus11 minus10 minus05 minus07
Madagascar minus08 minus11 minus08 minus06 minus08 minus03 minus07
Malawi minus02 01 minus04 minus06 minus01 minus04 minus03
Mali 02 minus03 minus09 minus05 minus05 minus07 minus04
Mauritania minus09 minus13 minus09 minus08 minus09 minus07 minus09
Mauritius 07 05 08 08 08 07 07
Mozambique minus01 03 minus05 minus04 minus05 minus04 minus03
Namibia 03 08 01 01 02 03 03
Niger minus06 minus11 minus07 minus05 minus06 minus07 minus07
Nigeria minus08 minus20 minus12 minus08 minus12 minus10 minus12
Rwanda minus13 minus01 minus01 minus02 minus03 05 minus02
Senegal minus03 minus04 minus05 minus03 minus04 minus07 minus04
Seychelles 01 08 02 minus06 00 03 01
Sierra Leone minus02 minus02 minus12 minus07 minus09 minus08 minus07
Somalia minus20 minus31 minus22 minus24 minus24 minus17 minus23
Sudan minus17 minus27 minus14 minus14 minus13 minus13 minus16
South Africa 05 minus00 03 04 01 01 02
Swaziland minus13 minus01 minus05 minus06 minus05 minus02 minus05
Tanzania Utd Rep minus01 minus00 minus05 minus04 minus05 minus05 minus03
Togo minus10 minus02 minus14 minus09 minus09 minus10 minus09
Uganda minus05 minus11 minus06 minus01 minus04 minus09 minus06
Zambia minus03 05 minus08 minus05 minus05 minus06 minus04
Zimbabwe minus15 minus12 minus16 minus20 minus18 minus14 minus16
154
TABLE 23 Governance (continued)Voice ampaccount-ability
Politicalstabilityabsence ofviolence ampterrorism
Govern-ment
effectiveness
Regulatoryquality
Rule oflaw
Control ofcorruption
Averagegovernance
-25 to 25(lowest tohighest)
-25 to 25(lowest tohighest)
-25 to 25(lowest tohighest)
-25 to 25(lowest tohighest)
-25 to 25(lowest tohighest)
-25 to 25(lowest tohighest)
-25 to 25(lowest tohighest)
2010 2010 2010 2010 2010 2010 2010
ASIA
Central Asia
Kazakhstan minus11 05 minus03 minus03 minus06 minus10 minus05
Kyrgyzstan minus10 minus10 minus06 minus02 minus13 minus11 minus09
Tajikistan minus14 minus09 minus09 minus11 minus12 minus12 minus11
Turkmenistan minus20 02 minus16 minus21 minus15 minus14 minus14
Uzbekistan minus20 minus08 minus08 minus16 minus14 minus13 minus13
East Asia
Brunei Darussalam minus07 12 09 11 08 09 07
Cambodia minus09 minus06 minus08 minus05 minus11 minus12 minus08
China minus16 minus08 01 minus02 minus03 minus06 minus06
Indonesia minus01 minus09 minus02 minus04 minus06 minus07 minus05
Korea DPR minus22 minus05 minus19 minus24 minus13 minus13 minus16
Korea Republic of 07 01 12 09 10 04 07
Lao PDR minus16 minus02 minus09 minus10 minus09 minus11 minus10
Malaysia minus05 01 11 06 05 01 03
Mongolia 00 05 minus06 minus03 minus04 minus07 minus03
Myanmar minus21 minus13 minus17 minus22 minus15 minus17 minus17
Philippines minus01 minus16 minus01 minus03 minus05 minus08 minus06
Singapore minus03 11 22 18 17 22 15
Thailand minus06 minus12 01 02 minus02 minus03 minus03
Viet Nam minus14 01 minus03 minus06 minus05 minus06 minus05
South Asia
Afghanistan minus15 minus26 minus15 minus16 minus19 minus16 minus18
Bangladesh minus03 minus14 minus08 minus09 minus08 minus10 minus09
Bhutan minus05 07 06 minus11 01 08 01
India 04 minus13 minus00 minus04 minus01 minus05 minus03
Iran (Islamic Rep) minus16 minus16 minus05 minus16 minus09 minus09 minus12
Maldives minus01 minus00 minus02 minus04 minus03 minus06 minus03
Nepal minus05 minus17 minus08 minus07 minus10 minus07 minus09
Pakistan minus08 minus27 minus08 minus06 minus08 minus11 minus11
Sri Lanka minus05 minus08 minus02 minus02 minus01 minus04 minus04
West Asia
Armenia minus09 00 minus02 03 minus05 minus07 minus03
Azerbaijan minus13 minus03 minus08 minus04 minus09 minus12 minus08
Bahrain minus09 minus03 06 08 04 02 01
Cyprus 11 04 15 14 12 11 11
Georgia minus02 minus07 03 06 minus02 minus02 minus01
Iraq minus11 minus23 minus12 minus11 minus16 minus13 minus14
Jordan minus08 minus03 01 02 02 00 minus01
Kuwait minus05 04 01 02 05 03 02
Lebanon minus03 minus15 minus03 00 minus07 minus08 minus06
Occupied PalestinianTerritory
Saudi Arabia minus18 minus02 minus01 01 02 01 minus03
Syrian Arab Republic minus17 minus08 minus06 minus09 minus05 minus11 minus09
Turkey minus02 minus10 04 04 01 00 minus01
United Arab Emirates minus09 08 08 04 04 10 04
Yemen minus13 minus22 minus10 minus06 minus11 minus11 minus12
LATIN AMERICA amp THECARIBBEAN
Argentina 03 minus00 minus02 minus07 minus06 minus04 minus03
Bahamas 10 10 10 05 07 14 09
Barbados 12 11 14 05 10 14 11
Belize 07 minus00 minus04 minus05 minus04 minus01 minus01
Bolivia (Plur State) minus01 minus04 minus05 minus08 minus11 minus05 minus06
Brazil 05 00 01 02 00 01 01
Chile 10 06 12 14 13 15 12
Colombia minus02 minus15 01 03 minus03 minus04 minus03
Costa Rica 10 06 03 05 05 07 06
155
TABLE 23 Governance (continued)Voice ampaccount-ability
Politicalstabilityabsence ofviolence ampterrorism
Govern-ment
effectiveness
Regulatoryquality
Rule oflaw
Control ofcorruption
Averagegovernance
-25 to 25(lowest tohighest)
-25 to 25(lowest tohighest)
-25 to 25(lowest tohighest)
-25 to 25(lowest tohighest)
-25 to 25(lowest tohighest)
-25 to 25(lowest tohighest)
-25 to 25(lowest tohighest)
2010 2010 2010 2010 2010 2010 2010
Cuba minus16 03 minus02 minus16 minus06 05 minus05
Dominica 10 10 07 04 07 07 08
Dominican Republic 01 00 minus06 minus02 minus08 minus08 minus04
Ecuador minus03 minus06 minus07 minus11 minus12 minus09 minus08
El Salvador 00 01 00 04 minus09 minus02 minus01
French Guiana 11 02 12 12 12 11 10
Grenada 08 06 02 04 01 04 04
Guatemala minus04 minus08 minus07 minus02 minus10 minus05 minus06
Guyana 00 minus05 minus01 minus05 minus05 minus06 minus04
Haiti minus07 minus09 minus16 minus11 minus14 minus13 minus12
Honduras minus05 minus05 minus07 minus02 minus09 minus09 minus06
Jamaica 04 minus04 02 03 minus05 minus04 minus01
Mexico 01 minus08 02 03 minus06 minus04 minus02
Netherlands Antilles 04 11 07 09 09 09 08
Nicaragua minus05 minus06 minus10 minus04 minus08 minus08 minus07
Panama 05 00 01 04 minus01 minus04 01
Paraguay minus01 minus09 minus09 minus04 minus09 minus08 minus07
Peru 00 minus09 minus02 05 minus06 minus02 minus02
St Kitts amp Nevis 11 11 07 04 07 10 09
St Lucia 12 08 08 04 08 12 09
St Vincent amp Grenadines 12 09 07 04 09 10 09
Suriname 04 01 minus01 minus07 minus01 minus04 minus01
Trinidad amp Tobago 05 minus00 03 05 minus02 minus04 01
Uruguay 11 09 07 04 07 13 08
Venezuela (Boliv Rep of) minus09 minus14 minus10 minus16 minus16 minus12 minus13
OCEANIA
Fiji minus10 minus01 minus07 minus07 minus09 minus09 minus07
French Polynesia
New Caledonia minus02
Papua New Guinea 01 minus08 minus08 minus05 minus09 minus11 minus07
Samoa
Solomon Islands 01 04 minus09 minus12 minus07 minus05 minus05
Tonga 03 08 minus03 minus05 01 minus03 minus00
Vanuatu 05 14 minus03 minus08 03 04 02
DEVELOPED REGIONS
NORTH AMERICA
Bermuda 10 09 10 14 12 13 11
Canada 14 09 19 17 18 21 16
United States of America 12 03 14 14 16 12 12
ASIA amp OCEANIA
Australia 14 08 18 17 18 21 16
Israel 06 minus15 12 12 09 06 05
Japan 10 09 14 10 13 15 12
New Zealand 15 12 19 18 19 24 18
EUROPE
Albania 01 minus02 minus03 02 minus04 minus04 minus02
Belarus minus16 minus01 minus11 minus12 minus10 minus08 minus10
Bosnia amp Herzegovina minus01 minus07 minus07 minus01 minus04 minus03 minus04
Croatia 04 06 06 06 02 00 04
European Union
Iceland 14 10 16 09 17 19 14
Macedonia FYR 01 minus05 minus02 03 minus03 minus01 minus01
Montenegro 02 05 01 minus01 minus00 minus03 01
Norway 16 13 18 15 19 21 17
Republic of Moldova minus01 minus04 minus06 minus01 minus04 minus07 minus04
Russian Federation minus09 minus09 minus04 minus04 minus08 minus11 minus07
Serbia 03 minus04 minus01 minus00 minus04 minus02 minus01
Switzerland 16 12 19 17 18 21 17
Ukraine minus01 minus01 minus08 minus06 minus08 minus10 minus06
156
TABLE 24 Education health and sanitationLiteracyratefemale
Ratio of girls-to-boys Expendi-ture perstudent
Public expon
education
Health expenditure Prevalenceof HIV
Access to improved
out ofprimaryschool
in primand seceducation
share ofGDP percapita
share ofGDP
currentper capita
share ofGDP
ages15-49
sanitationfacilities
water source
ratio US$ rur urb
2009 2009 2009 2009 2009 2009 2009 2009 2008 2008 2008
WORLD 792 963 44 8600 101 08 61 78 96
DEVELOPING REGIONS
AFRICA
North Africa
Algeria 639 07 993 285 43 2680 58 01 95 79 85
Egypt 578 05 951 38 1130 50 01 94 98 100
Libya 820 00 1050 239 27 4170 39 97
Morocco 439 08 881 872 56 1560 55 01 69 60 98
Tunisia 710 09 1030 507 71 2400 62 01 85 84 99
Sub-Saharan Africa
Angola 576 08 820 1269 26 2040 46 20 57 38 60
Benin 291 01 735 134 35 319 42 12 12 69 84
Botswana 844 12 1000 3014 89 6120 103 248 60 90 99
Burkina Faso 216 08 856 3663 46 381 64 12 11 72 95
Burundi 609 90 927 6009 83 198 131 33 46 71 83
Cameroon 630 02 856 728 37 611 56 53 47 51 92
Cape Verde 802 09 1030 828 59 1460 39 54 82 85
Central African Republic 421 05 687 1448 13 193 43 47 34 51 92
Chad 231 06 636 2488 32 418 70 34 9 44 67
Comoros 687 06 842 272 76 278 34 01 36 97 91
Congo 09 919 29 18 701 30 34 30 34 95
Cocircte drsquoIvoire 453 08 686 1191 46 553 51 34 23 68 93
Congo Dem Rep 549 768 156 95 23 80
Djibouti 09 820 573 84 845 70 25 56 52 98
Equatorial Guinea 898 10 825 40 06 7090 39 50
Eritrea 560 09 773 11356 20 101 21 08 14 57 74
Ethiopia 180 07 879 6642 55 147 43 12 26 98
Gabon 841 10 959 38 2660 35 52 33 41 95
Gambia 358 11 1020 322 20 256 60 20 67 86 96
Ghana 604 11 954 288 54 451 69 18 13 74 90
Guinea 281 07 772 1164 24 188 57 13 19 61 89
Guinea-Bissau 380 07 655 52 184 61 25 21 51 83
Kenya 835 11 954 436 70 332 43 63 31 52 83
Lesotho 953 12 1070 778 124 700 82 236 29 81 97
Liberia 545 04 719 141 28 294 132 15 17 51 79
Madagascar 616 53 969 1581 30 180 41 02 11 29 71
Malawi 670 18 1000 321 42 191 62 110 56 77 95
Mali 182 05 784 1633 44 384 56 10 36 44 81
Mauritania 503 13 1030 736 29 219 25 07 26 47 52
Mauritius 853 13 1010 245 32 3830 57 10 91 99 100
Mozambique 415 05 883 998 50 247 57 115 17 29 77
Namibia 881 16 1040 315 64 2580 60 131 33 88 99
Niger 151 08 753 5143 45 209 61 08 9 39 96
Nigeria 498 09 851 08 693 58 36 32 42 75
Rwanda 668 18 1000 2521 41 482 90 29 54 62 77
Senegal 387 11 955 2169 58 589 57 09 51 52 92
Seychelles 923 15 1030 340 50 3660 40 100
Sierra Leone 301 06 840 251 43 439 131 16 13 26 86
Somalia 09 535 04 07 23 9 67
Sudan 608 09 894 121 946 73 11 34 52 64
South Africa 870 12 994 328 54 4850 85 178 77 78 99
Swaziland 862 11 921 491 78 1560 63 259 55 61 92
Tanzania Utd Rep 669 15 961 409 68 253 51 56 24 45 80
Togo 444 04 753 130 46 289 59 32 12 41 87
Uganda 589 15 987 1339 32 425 82 65 48 64 91
Zambia 613 14 958 10 13 471 48 135 49 46 87
Zimbabwe 894 971 2143 52 143 44 72 99
157
TABLE 24 Education health and sanitation (continued)Literacyratefemale
Ratio of girls-to-boys Expendi-ture perstudent
Public expon
education
Health expenditure Prevalenceof HIV
Access to improved
out ofprimaryschool
in primand seceducation
share ofGDP percapita
share ofGDP
currentper capita
share ofGDP
ages15-49
sanitationfacilities
water source
ratio US$ rur urb
2009 2009 2009 2009 2009 2009 2009 2009 2008 2008 2008
ASIA
Central Asia
Kazakhstan 996 26 986 79 28 3300 45 01 97 90 99
Kyrgyzstan 990 11 1010 173 59 571 68 03 93 85 99
Tajikistan 996 01 906 218 35 380 53 02 94 61 94
Turkmenistan 994 43 771 23 98 97
Uzbekistan 991 08 987 74 622 52 01 100 81 98
East Asia
Brunei Darussalam 937 18 1010 37 7910 30
Cambodia 709 08 897 54 21 421 59 05 29 56 81
China 909 12 1050 1015 19 1770 46 01 55 82 98
Indonesia 891 04 977 397 28 554 24 02 52 71 89
Korea DPR 1000 100 100
Korea Republic of 00 972 528 42 11100 65 01 100 88 100
Lao PDR 632 09 872 100 23 358 41 02 53 51 72
Malaysia 903 10 1030 604 41 3360 48 05 96 99 100
Mongolia 979 15 1030 162 56 742 47 01 50 49 97
Myanmar 895 08 997 54 13 125 20 06 81 69 75
Philippines 958 14 1020 276 28 669 38 01 76 87 93
Singapore 920 116 30 15000 39 01 100 100
Thailand 915 09 1030 554 41 1680 43 13 96 98 99
Viet Nam 905 04 932 982 53 797 72 04 75 92 99
South Asia
Afghanistan 50 07 623 19 509 74 37 39 78
Bangladesh 510 21 1080 256 24 184 34 01 53 78 85
Bhutan 387 13 1000 387 48 980 55 02 65 88 99
India 508 05 922 777 31 448 42 03 31 84 96
Iran (Islamic Rep) 807 07 965 583 47 2690 55 02 98
Maldives 984 06 982 00 112 3310 80 01 98 86 99
Nepal 469 06 825 731 47 253 58 04 31 87 93
Pakistan 401 07 819 27 226 26 01 45 87 95
Sri Lanka 891 12 1040 30 836 40 01 91 88 98
West Asia
Armenia 994 17 1030 533 30 1290 47 01 90 93 98
Azerbaijan 992 10 1020 156 28 2850 58 01 45 71 88
Bahrain 902 03 1010 326 29 11100 45 100
Cyprus 969 05 1000 1352 41 60 100 100 100
Georgia 997 06 965 410 32 2560 101 01 95 96 100
Iraq 699 04 813 51 985 39 73 55 91
Jordan 889 14 1020 277 49 3360 93 98 91 98
Kuwait 918 08 1010 257 38 14200 33 100 99 99
Lebanon 860 09 1040 102 18 6630 81 01 100 100
Occupied PalestinianTerritory
Saudi Arabia 811 08 913 367 56 7140 50 97
Syrian Arab Republic 780 01 973 338 48 720 29 96 84 94
Turkey 853 07 929 547 31 5710 67 01 90 96 100
United Arab Emirates 915 06 998 270 12 15200 28 97 100 100
Yemen 447 06 657 52 640 56 52 57 72
LATIN AMERICA amp THECARIBBEAN
Argentina 977 22 1050 565 49 7300 95 05 90 80 98
Bahamas 14 1010 33 15600 72 31 100 98
Barbados 603 minus67 10400 68 14 100 100 100
Belize 703 44 1010 395 58 2170 49 23 90 100 99
Bolivia (Plur State) 868 12 988 282 63 848 48 02 25 67 96
Brazil 902 07 1030 650 51 7340 91 80 84 99
Chile 987 09 985 428 40 7870 82 04 96 75 99
Colombia 934 10 1050 580 48 3230 64 05 74 73 99
Costa Rica 963 12 1020 290 63 6680 105 03 95 91 100
158
TABLE 24 Education health and sanitation (continued)Literacyratefemale
Ratio of girls-to-boys Expendi-ture perstudent
Public expon
education
Health expenditure Prevalenceof HIV
Access to improved
out ofprimaryschool
in primand seceducation
share ofGDP percapita
share ofGDP
currentper capita
share ofGDP
ages15-49
sanitationfacilities
water source
ratio US$ rur urb
2009 2009 2009 2009 2009 2009 2009 2009 2008 2008 2008
Cuba 998 08 988 1553 136 7070 118 01 91 89 96
Dominica 15 1020 407 47 3610 64
Dominican Republic 883 11 965 147 23 2710 59 09 83 84 87
Ecuador 815 28 1030 92 10 2550 61 04 92 88 97
El Salvador 818 16 983 176 36 2290 63 08 87 76 94
French Guiana
Grenada 960 22 970 227 48 4470 74 97 97
Guatemala 695 04 938 166 32 1860 71 08 81 90 98
Guyana 06 997 447 61 1330 81 12 81 93 98
Haiti 446 10 946 15 396 61 19 17 55 71
Honduras 835 23 1070 36 1170 60 08 71 77 95
Jamaica 911 09 1000 850 58 2310 51 17 83 89 98
Mexico 921 17 1020 637 48 5150 65 03 85 87 96
Netherlands Antilles 964 1020
Nicaragua 779 12 1020 144 31 1050 96 02 52 68 98
Panama 930 08 1010 390 38 5910 83 09 69 83 97
Paraguay 935 10 995 530 40 1590 71 03 70 66 99
Peru 846 12 994 180 27 2010 46 04 68 61 90
St Kitts amp Nevis 15 1040 79 97 6340 60 96 99 99
St Lucia 10 994 368 45 4430 81 98 98
St Vincent amp Grenadines 01 977 455 66 3010 57
Suriname 938 09 1070 90 4290 76 10 84 81 97
Trinidad amp Tobago 983 05 1010 189 42 10700 57 15 92 93 98
Uruguay 986 08 1040 374 29 6980 75 05 100 100 100
Venezuela (Boliv Rep of) 949 11 1020 173 37 6860 60
OCEANIA
Fiji 10 1030 967 62 1300 34 01
French Polynesia 15 1090 98 100 100
New Caledonia 960
Papua New Guinea 565 08 835 65 367 31 09 45 33 87
Samoa 985 17 1050 120 58 2050 70 100
Solomon Islands 690 10 940 22 719 54
Tonga 991 06 999 1449 39 1610 62 96 100 100
Vanuatu 803 05 995 353 48 1060 40 52 79 96
DEVELOPED REGIONS
NORTH AMERICA
Bermuda 979 157 26
Canada 23 987 440 49 43800 109 02 100 99 100
United States of America 14 1000 682 55 74100 162 06 100 94 100
ASIA amp OCEANIA
Australia 14 973 509 45 38700 85 01 100 100 100
Israel 887 15 1010 611 59 19700 76 02 100 100 100
Japan 11 1000 647 35 33200 83 01 100 100 100
New Zealand 31 1030 675 61 26300 97 01 100 100
EUROPE
Albania 947 09 995 444 29 2650 69 98 98 96
Belarus 997 17 1010 150 45 2950 58 03 93 99 100
Bosnia amp Herzegovina 964 13 1020 4950 109 95 98 100
Croatia 981 12 1020 732 46 11200 78 01 99 97 100
European Union 1010 764 49 33700 103 02 98 100 100
Iceland 13 1020 771 74 31300 82 03 100 100 100
Macedonia FYR 956 13 983 238 35 3140 69 89 99 100
Montenegro 6170 93 92 96 100
Norway 13 990 895 68 76600 97 01 100 100 100
Republic of Moldova 980 10 1010 1286 96 1810 119 04 79 85 96
Russian Federation 994 12 980 142 39 4750 54 10 87 89 98
Serbia 09 1010 1105 48 4190 99 01 92 98 99
Switzerland 57 973 956 52 71400 113 04 100 100 100
Ukraine 996 11 988 251 53 1800 70 11 95 97 98
159
TABLE 25 Food aid receivedFood aid received
thousandtonnes
thousandtonnes
thousandtonnes
thousandtonnes
thousandtonnes
1990 1995 2000 2005 2010
WORLD 13172 10201 11345 8288 5682
DEVELOPING REGIONS 10922 9143 9462 8245 5682
AFRICA 5255 3562 4320 4656 3491
North Africa 2268 263 318 56 27
Algeria 10 27 33 42 24
Egypt 1606 207 41 14 3
Libya 0 0 0 0 0
Morocco 271 2 241 0 0
Tunisia 383 27 4 0 0
Sub-Saharan Africa 2986 3299 4002 4601 3464
Angola 124 220 296 57 4
Benin 15 21 12 15 19
Botswana 15 10 0 0 0
Burkina Faso 34 41 33 39 45
Burundi 3 103 11 73 34
Cameroon 3 7 4 14 14
Cape Verde 59 73 53 29 16
Central African Republic 3 1 3 5 10
Chad 26 21 23 74 111
Comoros 4 6 0 0 0
Congo 8 13 18 9 7
Cocircte drsquoIvoire 66 24 17 34 21
Congo Dem Rep 98 109 74 103 193
Djibouti 9 20 12 21 10
Equatorial Guinea 5 4 2 0 0
Eritrea 0 104 257 232 0
Ethiopia 864 636 1527 1122 1415
Gabon 0 0 1 0 0
Gambia 4 4 8 11 23
Ghana 66 97 101 66 7
Guinea 11 8 5 41 4
Guinea-Bissau 5 3 27 11 7
Kenya 90 80 291 155 258
Lesotho 42 34 6 44 7
Liberia 35 161 116 102 30
Madagascar 54 38 44 47 26
Malawi 219 236 36 153 38
Mali 39 20 12 41 25
Mauritania 45 45 17 92 39
Mauritius 11 1 0 0 0
Mozambique 423 386 185 117 80
Namibia 12 3 2 2 1
Niger 40 25 20 139 159
Nigeria 0 0 1 20 0
Rwanda 9 274 232 42 7
Senegal 63 21 54 30 41
Seychelles 1 0 0 0 0
Sierra Leone 11 34 28 39 24
Somalia 98 53 61 40 72
Sudan 230 82 182 931 476
South Africa 7 0 3 0 0
Swaziland 10 7 0 12 17
Tanzania Utd Rep 35 145 63 116 38
Togo 12 6 4 1 2
Uganda 47 77 87 293 80
Zambia 11 26 49 146 7
Zimbabwe 14 13 16 80 92
160
TABLE 25 Food aid received (continued)Food aid received
thousandtonnes
thousandtonnes
thousandtonnes
thousandtonnes
thousandtonnes
1990 1995 2000 2005 2010
ASIA 3357 4641 4314 2958 1775
Central Asia 0 432 195 239 75
Kazakhstan 0 1 0 0 0
Kyrgyzstan 0 150 60 166 50
Tajikistan 0 226 60 73 25
Turkmenistan 0 53 7 0 0
Uzbekistan 0 1 68 0 0
East Asia 530 952 2239 1663 232
Brunei Darussalam 0 0 0 0 0
Cambodia 25 91 62 24 17
China 78 128 90 49 0
Indonesia 56 19 429 197 0
Korea DPR 0 544 1264 1180 80
Korea Republic of 0 0 0 0 0
Lao PDR 0 27 5 19 20
Malaysia 0 0 0 0 0
Mongolia 0 12 46 55 0
Myanmar 0 4 10 16 31
Philippines 160 55 218 121 82
Singapore 0 0 0 0 0
Thailand 148 2 1 1 0
Viet Nam 62 70 82 0 0
South Asia 2288 1445 937 838 1247
Afghanistan 43 133 210 208 140
Bangladesh 1050 586 269 293 194
Bhutan 5 6 4 2 3
India 382 398 321 102 16
Iran (Islamic Rep) 26 13 3 2 5
Maldives 2 3 3 11 12
Nepal 8 38 53 54 53
Pakistan 462 119 20 30 763
Sri Lanka 310 148 55 136 60
West Asia 539 1812 943 218 222
Armenia 0 476 96 22 7
Azerbaijan 0 391 28 12 0
Bahrain 0 0 0 0 0
Cyprus 0 0 0 0 0
Georgia 0 598 71 20 1
Iraq 0 102 18 36 7
Jordan 261 122 401 3 0
Kuwait 0 0 0 0 0
Lebanon 43 11 42 12 0
Occupied PalestinianTerritory
26 48 57 83 90
Saudi Arabia 0 0 0 0 0
Syrian Arab Republic 38 45 35 10 35
Turkey 14 1 0 0 0
United Arab Emirates 0 0 0 0 0
Yemen 157 18 195 21 83
LATIN AMERICA amp THECARIBBEAN
2306 939 828 632 416
Argentina 0 0 0 0 0
Bahamas 0 0 0 0 0
Barbados 0 0 0 0 0
Belize 0 0 0 0 0
Bolivia (Plur State) 262 86 80 65 8
Brazil 29 1 0 0 0
Chile 8 0 0 0 0
Colombia 5 15 12 14 12
Costa Rica 7 3 0 0 0
161
TABLE 25 Food aid received (continued)Food aid received
thousandtonnes
thousandtonnes
thousandtonnes
thousandtonnes
thousandtonnes
1990 1995 2000 2005 2010
Cuba 3 6 24 7 0
Dominica 0 7 0 0 0
Dominican Republic 40 6 2 0 50
Ecuador 77 19 42 43 3
El Salvador 203 25 3 67 3
French Guiana 0 0 0 0 0
Grenada 0 0 0 0 0
Guatemala 185 70 137 69 70
Guyana 46 33 26 0 0
Haiti 108 168 164 137 266
Honduras 146 53 68 98 3
Jamaica 293 56 46 11 0
Mexico 280 46 2 0 0
Netherlands Antilles 0 0 0 0 0
Nicaragua 232 63 62 43 2
Panama 1 2 0 0 0
Paraguay 4 1 0 0 0
Peru 359 254 149 78 0
St Kitts amp Nevis 0 0 0 0 0
St Lucia 0 3 0 0 0
St Vincent amp Grenadines 0 0 0 0 0
Suriname 0 20 0 0 0
Trinidad amp Tobago 0 0 0 0 0
Uruguay 20 0 0 0 0
Venezuela (Boliv Rep of) 0 0 11 0 0
OCEANIA 3 0 0 0 0
Fiji 0 0 0 0 0
French Polynesia 0 0 0 0 0
New Caledonia 0 0 0 0 0
Papua New Guinea 0 0 0 0 0
Samoa 0 0 0 0 0
Solomon Islands 0 0 0 0 0
Tonga 0 0 0 0 0
Vanuatu 0 0 0 0 0
DEVELOPED REGIONS 2250 1058 1883 43 0
NORTH AMERICA 0 0 0 0 0
Bermuda 0 0 0 0 0
Canada 0 0 0 0 0
United States of America 0 0 0 0 0
ASIA amp OCEANIA 1 0 0 0 0
Australia 0 0 0 0 0
Israel 1 0 0 0 0
Japan 0 0 0 0 0
New Zealand 0 0 0 0 0
EUROPE 2249 1058 1883 43 0
Albania 0 10 18 6 0
Belarus 0 98 0 0 0
Bosnia amp Herzegovina 0 23 84 0 0
Croatia 0 14 0 0 0
European Union 2249 40 1 0 0
Iceland 0 0 0 0 0
Macedonia FYR 0 0 63 0 0
Montenegro 0 0 0 0 0
Norway 0 0 0 0 0
Republic of Moldova 0 244 14 10 0
Russian Federation 0 125 1403 26 0
Serbia 0 0 0 0 0
Switzerland 0 0 0 0 0
Ukraine 0 120 0 0 0
162
DEFINITIONS AND SOURCES
Definitions and sources
Countries in protracted crisesP2HUNFAOESARHSNPC
Page table 31 (p 86)
Protracted crises are those environments in which a sig-nificant proportion of the population is acutely vulnera-ble to death disease and disruption of livelihoods overa prolonged period of time The governance of these en-vironments is usually very weak with the state having alimited capacity to respond to and mitigate the threatsto the population or provide adequate levels of protec-tion
Source Trade and Markets Division
Owner FAO
Contribution in diets by typeP2HUNFAOESSDIETCPF
Page table 16 (p 135)
Dietary contribution refers to the amount of carbohy-dratesproteinsfats expressed in kilocalories (kcal) perday available for each individual in the total populationduring the reference period Caloric content is derived byapplying the appropriate food composition factors to thequantities of the commodities Per person supplies arederived from the total amount of food available for hu-man consumption by dividing total calories by total pop-ulation actually partaking of the food supplies during thereference period However per person figures representonly the average supply available for the population asa whole and do not necessarily indicate what is actuallyconsumed by individuals The actual food consumptionmay be lower than the quantity shown as food availabil-ity depending on the magnitude of wastage and lossesof food in the household eg during storage in prepa-ration and cooking as plate-waste or quantities fed todomestic animals and pets thrown or given away
Source Statistics Division
Owner FAO
Dietary Energy Supply per personP2HUNFAOESSDIETDES
Page table 16 (p 135) chart 37 (p 93) map 20 (p 92)
Dietary energy supply per person refers to the amountof food expressed in kilocalories (kcal) per day avail-able for each individual in the total population duringthe reference period Caloric content is derived by ap-plying the appropriate food composition factors to thequantities of the commodities Per person supplies arederived from the total amount of food available for hu-man consumption by dividing total calories by total pop-ulation actually partaking of the food supplies during thereference period However per person figures representonly the average supply available for the population asa whole and do not necessarily indicate what is actuallyconsumed by individuals The actual food consumptionmay be lower than the quantity shown as food availabil-ity depending on the magnitude of wastage and losses
of food in the household eg during storage in prepa-ration and cooking as plate-waste or quantities fed todomestic animals and pets thrown or given awaySource Statistics DivisionOwner FAO
Caloric contribution in diets by commodityP2HUNFAOESSDIETFDS
Page table 40 41 (p 95 95)Contribution of a food Group to total dietary energy sup-plySource Statistics DivisionOwner FAO
Percentage contribution in diets by commodityP2HUNFAOESSDIETFDSx
Page table 16 17 (p 135 138)Percentage contribution of a food group to total dietaryenergy supplySource Statistics DivisionOwner FAO
Depth of hungerP2HUNFAOESSUNMNTDEP
Page table 15 (p 132) chart 36 (p 91)The depth of food deprivation indicates how much food-deprived people fall short of minimum food needs interms of dietary energy It is measured as the differencebetween the minimum dietary energy and the averagedietary energy intake of the undernourished population(food-deprived) The depth of food deprivation is lowwhen it is less than 200 kilocalories per person per dayand high when it is higher than 300 kilocalories per per-son per day The greater the deficit the greater the sus-ceptibility for health risks related to undernutritionSource Statistics DivisionOwner FAO
Incidence of undernourishmentP2HUNFAOESSUNMNTNUM
Page table 15 (p 132) map 19 (p 91)Undernourishment refers to the condition of peoplewhose dietary energy consumption is continuously be-low a minimum dietary energy requirement for main-taining a healthy life and carrying out a light physicalactivity The incidence of undernourishment is the num-ber of people referring to those in this conditionSource Statistics DivisionOwner FAO
Global number of undernourishedP2HUNFAOESSUNMNTPNW
Page chart 33 35 (p 89 90)Undernourishment refers to the condition of peoplewhose dietary energy consumption is continuously be-low a minimum dietary energy requirement for main-taining a healthy life and carrying out a light physical
163
PART 2
activity The global incidence of undernourishment is thetotal number of people in the world referring to those inthis condition
Source Statistics Division
Owner FAO
Percentage of population undernourishedP2HUNFAOESSUNMNTPREV
Page table 15 (p 132) map 18 (p 88)
Undernourishment refers to the condition of peoplewhose dietary energy consumption is continuously be-low a minimum dietary energy requirement for main-taining a healthy life and carrying out a light physicalactivity The percentage of population undernourishedis the total number of people in each country referringto those in this condition divided by the population ofthat country
Source Statistics Division
Owner FAO
Regional percentage of undernourishedP2HUNFAOESSUNMNTPREVR
Page chart 34 (p 90)
Undernourishment refers to the condition of peoplewhose dietary energy consumption is continuously be-low a minimum dietary energy requirement for main-taining a healthy life and carrying out a light physicalactivity The regional percentage of population under-nourished is the total number of people in each regionreferring to those in this condition divided by the popu-lation of that region
Source Statistics Division
Owner FAO
Global affordability of foodP2HUNFAOFPVAFD
Page chart 54 (p 106)
FAO Food Price Index relative to GDP showing howmuchfood prices have risen relative to income from the baseperiod 2002-04 Higer (lower) index scores show greater(less) affordability
Source Statistics Division
Owner FAO
Food price inflationP2HUNFAOFPVFCPI
Page map 25 (p 104)
Annual change in the ILO food price indices The pricedata for the different items included in the computationof the index are normally weighted in order to take intoaccount the relative importance of each item with re-spect to total consumption expenditure In most coun-tries the indices are computed in a derived form suchas weighted arithmetic averages of price relatives fora selected number of representative items between theperiod under consideration and the base period using
one or other forms of Laspeyresrsquo formula The num-ber of items and the weights used to compute the in-dex are given according to expenditure group The termitem is used here to mean the smallest grouping ofgoods and services for which a specific weight is givenThe source(s) and the reference period of the weightsused for the index eg a household expenditure surveynational accounts etc If the reference period for theweights differs from the base period of the index theadjustments made to the weights to take account of theprice changes between the two periods are describedSee httplaborstailoorg for more informationSource LABORSTAOwner ILO
International food prices by food groupP2HUNFAOFPVFPI
Page chart 53 (p 106)The FAO Food Price Index is a measure of themonthly change in international prices of a bas-ket of food commodities It consists of the av-erage of five commodity group price indices (rep-resenting 55 quotations) weighted with the aver-age export shares of each of the groups for 2002-2004 See httpwwwfaoorgworldfoodsituationwfs-homefoodpricesindexen for more information on sub-index constructionSource Statistics DivisionOwner FAO
International food price volatility by food groupP2HUNFAOFPVFPV
Page chart 55 56 (p 107 107)Annualized historical volatility of the FAO Food Price In-dexSource Statistics DivisionOwner FAO
Food price volatility (annualized historical volatility)P2HUNFAOFPVFPVn
Page map 26 (p 108)Annualized historical volatility of the ILO food price in-dicesSource Statistics DivisionOwner FAO
FAO Global Consumption price volatilityP2HUNFAOFPVGCI
Page chart 52 57 (p 105 109)The FAO Global Food Consumption Price Index trackschanges in the cost of the global food basket as por-trayed by the latest FAO world food balance sheet Rep-resentative international prices for each of the commodi-ties or commodity groups appearing in the balance sheetare weighted by their contribution to total calorific in-takeSource Statistics DivisionOwner FAO
164
DEFINITIONS AND SOURCES
Dietary diversity in selected LIFDCs
P2HUNFAOFVDIETDIV
Page chart 39 (p 94)
The Herfindahl index H is calculated as H =sumN=1 S
2
where S is the consumption share of the starchy staple in diets and N is the number of staples consumed For asingle staple consumed the index would equate to oneand declines as the staple base becomes more diversi-fied
Source Statistics Division
Owner FAO
Starchy root consumption and DES
P2HUNFAOFVDIETRTDES
Page chart 38 (p 94)
Caloric equivalent of starchy roots available for con-sumption as a ratio of total dietary energy supply
Source Statistics Division
Owner FAO
Availability of dietary iron
P2HUNFAOMCNIRON
Page table 18 (p 141) chart 44 (p 98)
The dietary availability of iron is calculated by convert-ing the amount of food available for human consumptionas estimated by the FAO Food Balance Sheets in equiv-alent of iron derived from animal and vegetal productsHowever the actual food consumptionmay be lower thanthe quantity shown as food availability depending on themagnitude of wastage and losses of food in the house-hold eg during storage in preparation and cooking asplate-waste or quantities fed to domestic animals andpets thrown or given away
Source Statistics Division
Owner FAO
Food + energy import bills ( GDP)
P2HUNFAOTFSFDFL
Page table 20 (p 147)
The annual value of food imported under SITC sections0 + 22+ 4 plus fuels under SITC section 3 expressed asa ratio of GDP
Source Statistics Division (FAOSTAT) and UNCTADSTAT
Owner FAO UNCTAD
Food import bills
P2HUNFAOTFSFIB
Page table 20 (p 147) chart 49 50 51 (p 103 103103)
The annual value of food imported under SITC sections0 + 22+ 4 expressed in current US$
Source Statistics Division (FAOSTAT) and UNCTADSTAT
Owner FAO UNCTAD
Food + energy import bills per capita
P2HUNFAOTFSFUEL
Page chart 50 51 (p 103 103)
The annual value of food imported under SITC sections0 + 22+ 4 plus fuels under SITC section 3 expressed asa ratio of population
Source Statistics Division (FAOSTAT) and UNCTADSTAT
Owner FAO UNCTAD
Index of variability of food production
P2HUNFAOTFSQPVAR
Page chart 46 (p 102)
Rolling ten-year window of the coefficient of variation ofper capita production index
Source Statistics Division
Owner FAO
Food self-sufficiency (calories)
P2HUNFAOTFSSSCAL
Page table 19 (p 144) chart 45 (p 101) map 24 (p100)
The self-sufficiency ratio (SSR) is defined as SSR = pro-duction x 100(production + imports - exports) The SSRcan be calculated for individual commodities groups ofcommodities of similar nutritional values and after ap-propriate conversion of the commodity equations alsofor the aggregate of all commodities In the context offood security the SSR is often taken to indicate the ex-tent to which a country relies on its own production re-sources ie the higher the ratio the greater the self-sufficiency While the SSR can be the appropriate toolwhen assessing the supply situation for individual com-modities a certain degree of caution should be observedwhen looking at the overall food situation In the casehowever where a large part of a countryrsquos production ofone commodity eg other cereals is exported the SSRmay be very high but the country may still have to relyheavily on imports of food commodities to feed the pop-ulation The self-sufficiency rate (as defined above) can-not be the complement to 100 of the import dependencyrate or vice-versa
Source Statistics Division
Owner FAO
Months of cereal self-provisioning capacity
P2HUNFAOTFSSTU
Page chart 47 48 (p 102 103)
Stocks-to-utilization ratios for cereals (wheat rice andcoarse grains) where stocks refer to the carry-over ofthe preceding national crop season The ratio is thenmultiplied by 12 to calculate the number of months ofself-provisioning capacity in a given year
Source Trade and Markets Division
Owner FAO
165
PART 2
Persons affected by natural disastersP2HUNODFAEMDATRHSPPND
Page table 14 (p 129) chart 29 (p 85) map 16 (p 84)People requiring immediate assistance during a periodof emergency ie requiring basic survival needs suchas food water shelter sanitation and immediate med-ical assistance Appearance of a significant number ofcases of an infectious disease introduced in a region ora population that is usually free from that disease Seewwwemdatnet (Universiteacute catholique de Louvain Brus-sels Belgium)Source International Disaster Database EM-DATOwner OFDA and CRED
Total affected by natural disastersP2HUNODFAEMDATRHSPPNDT
Page chart 30 (p 86)Sum of (i) injured people suffering from physical injuriestrauma or an illness requiring medical treatment as a di-rect result of a disaster (ii) homeless people needing im-mediate assistance for shelter and (iii) affected peoplerequiring immediate assistance during a period of emer-gency it can also include displaced or evacuated peopleSee wwwemdatnet (Universiteacute catholique de LouvainBrussels Belgium)Source International Disaster Database EM-DATOwner OFDA and CRED
Multidimensional Poverty IndexP2HUNUNDPHDRMPI
Page table 21 (p 150)An international measure of poverty for 109 developingcountries the MPI complements income-based povertymeasures by reflecting the multiple deprivations thatpeople face at the same time The MPI identifies de-privations across health education and living standardsand shows the number of people who are multidimen-sionally poor and the deprivations that they face at thehousehold levelSource Alkire S Roche JM Santos ME and Seth S(November 2011) ophiqehoxacukOwner OPHI
Gender Inequality IndexP2HUNUNDPHDRPOVGEI
Page table 22 (p 153) map 29 (p 113)The Gender Inequality Index is a composite measure re-flecting inequality in achievements between women andmen in three dimensions reproductive health empow-erment and the labour market It varies between zero(when women and men fare equally) and one (when menor women fare poorly compared to the other in all di-mensions) The health dimension is measured by twoindicators maternal mortality ratio and the adolescentfertility rate The empowerment dimension is also mea-sured by two indicators the share of parliamentary seatsheld by each sex and by secondary and higher educationattainment levels The labour dimension is measured by
womenrsquos participation in the work force The Gender In-equality Index is designed to reveal the extent to whichnational human development achievements are erodedby gender inequality and to provide empirical founda-tions for policy analysis and advocacy effortsSource Human Development Report 2010Owner UNDP
Human Development IndexP2HUNUNDPHDRPOVHDI
Page table 22 (p 153)The HDI represents a national average of human de-velopment achievements in the three basic dimensionsmaking up the HDI health education and income Likeall averages it conceals disparities in human develop-ment across the population within the same countryTwo countries with different distributions of achieve-ments can have the same average HDI value The IHDItakes into account not only the average achievements ofa country on health education and income but also howthose achievements are distributed among its citizens bydiscounting each dimensionrsquos average value accordingto its level of inequalitySource Human Development Report 2010Owner UNDP
Human Development Index (inequality adjusted)P2HUNUNDPHDRPOVHDIi
Page table 22 (p 153) chart 59 (p 112)The Human Development Index (HDI) is a summary mea-sure of human development It measures the averageachievements in a country in three basic dimensionsof human development a long and healthy life ac-cess to knowledge and a decent standard of living TheInequality-adjusted Human Development Index (IHDI)adjusts the Human Development Index (HDI) for inequal-ity in distribution of each dimension across the popula-tion The IHDI accounts for inequalities in HDI dimen-sions by discounting each dimensionrsquos average valueaccording to its level of inequality The IHDI equals theHDI when there is no inequality across people but is lessthan the HDI as inequality rises In this sense the IHDI isthe actual level of human development (accounting forthis inequality) while the HDI can be viewed as an in-dex of potential human development (or the maximumlevel of HDI) that could be achieved if there was no in-equality The loss in potential human development dueto inequality is given by the difference between the HDIand the IHDI and can be expressed as a percentageSource Human Development Report 2010Owner UNDP
Population of concernP2HUNUNHCRGTRHSTPC
Page table 13 (p 126) map 17 (p 87)Refugees are individuals recognized under the 1951Convention relating to the Status of Refugees and alsopeople in a refugee-like situation such as those who
166
DEFINITIONS AND SOURCES
are outside their country or territory of origin and whoface protection risks similar to those of refugees butfor whom refugee status has for practical or other rea-sons not been ascertained Internally Displaced Persons(IDPs) are people or groups of individuals who have beenforced to leave their homes or places of habitual resi-dence in particular as a result of or in order to avoidthe effects of armed conflict situations of generalized vi-olence violations of human rights or natural- or human-made disasters and who have not crossed an interna-tional border Others include Asylum-seekers (personswho have applied for asylum or refugee status but whohave not yet received a final decision on their applica-tion) Returned IDPs and refugees Stateless Persons (in-dividuals not considered as nationals by any State underrelevant national laws) and other groups of concern towhom UNHCR has extended its protection andor assis-tance services based on humanitarian or other specialgrounds
Source Statistical Online Population Database
Owner UNHCR
Total population of concern
P2HUNUNHCRGTRHSTPCT
Page chart 32 (p 87)
Total population of concern is the sum of various groupsof people including refugees asylum-seekers internallydisplaced persons (IDPs) protectedassisted by UNHCRstateless persons and returnees (returned refugees andIDPs)
Source Statistical Online Population Database
Owner UNHCR
Average governance
P2HUNWBKPOVGOV
Page table 23 (p 156) chart 60 (p 115) map 30 (p114)
The Worldwide Governance Indicators project constructsaggregate indicators of six broad dimensions of gover-nance (i) Voice and Accountability (ii) Political Stabil-ity and Absence of ViolenceTerrorism (iii) GovernmentEffectiveness (iv) Regulatory Quality (v) Rule of Law(vi) Control of Corruption The six aggregate indicatorsare based on 30 underlying data sources reporting theperceptions of governance of a large number of surveyrespondents and expert assessments worldwide De-tails on the underlying data sources the aggregationmethod and the interpretation of the indicators can befound in the WGI methodology paper Daniel KaufmannAart Kraay and Massimo Mastruzzi (2010) The World-wide Governance Indicators A Summary of Methodol-ogy Data and Analytical Issues World Bank Policy Re-search Working Paper No 5430 httppapersssrncomsol3paperscfmabstract_id=1682130
Source World Bank
Owner Worldwide Governance Indicators (WGI) project
Ratio of girls-to-boys out of primary school
P2HUNWBKWDIEDUCOSR
Page table 24 (p 159)
Children out of school are the number of primary-school-age children not enrolled in primary or secondary school
Source World Bank (WDI)
Owner UNESCO
Public spending on education total ( of GDP)
P2HUNWBKWDIEDUEXPP
Page table 24 (p 159)
Public expenditure on education consists of current andcapital public expenditure on education includes gov-ernment spending on educational institutions (both pub-lic and private) education administration as well assubsidies for private entities (studentshouseholds andother privates entities)
Source World Bank (WDI)
Owner UNESCO
Expenditure per student
P2HUNWBKWDIEDUEXPS
Page table 24 (p 159)
Public expenditure per student is the public currentspending on education divided by the total number ofstudents by level as a percentage of GDP per capitaPublic expenditure (current and capital) includes govern-ment spending on educational institutions (both publicand private) education administration as well as subsi-dies for private entities (studentshouseholds and otherprivates entities)
Source World Bank (WDI)
Owner UNESCO
Literacy rate adult female ( of females ages 15 andabove)
P2HUNWBKWDIEDUFILT
Page table 24 (p 159) map 31 (p 116)
Adult literacy rate is the percentage of people ages 15and above who can with understanding read and writea short simple statement on their everyday life
Source World Bank (WDI)
Owner UNESCO
Ratio of girls to boys in primary and secondary education()
P2HUNWBKWDIEDUGEN
Page table 24 (p 159) chart 61 (p 117)
Ratio of girls to boys in primary and secondary educationis the ratio of the female to male gross enrolment ratesin primary and secondary school
Source World Bank (WDI)
Owner UNESCO
167
PART 2
Health expenditure per capita (current US$)P2HUNWBKWDIHAEHEPCP
Page table 24 (p 159) map 32 (p 118)
Total health expenditure is the sum of public and pri-vate health expenditures as a ratio of total populationIt covers the provision of health services (preventive andcurative) family planning activities nutrition activitiesand emergency aid designated for health but does notinclude provision of water and sanitation Data are incurrent US dollars
Source World Bank (WDI)
Owner WHO
Health expenditure total ( of GDP)P2HUNWBKWDIHAEHETOT
Page table 24 (p 159) chart 62 (p 119)
Total health expenditure is the sum of public and privatehealth expenditure It covers the provision of health ser-vices (preventive and curative) family planning activi-ties nutrition activities and emergency aid designatedfor health but does not include provision of water andsanitation
Source World Bank (WDI)
Owner WHO
Prevalence of HIV total ( of population ages 15-49)P2HUNWBKWDIHAEHIVPREV
Page table 24 (p 159)
Prevalence of HIV refers to the percentage of people ages15-49 who are infected with HIV
Source World Bank (WDI)
Owner UNAIDS and WHO
Improved sanitation facilities ( of population with ac-cess)P2HUNWBKWDIHAESANIMPS
Page table 24 (p 159) chart 63 (p 121)
Access to improved sanitation facilities refers to the per-centage of the population with at least adequate accessto excreta disposal facilities that can effectively preventhuman animal and insect contact with excreta Im-proved facilities range from simple but protected pit la-trines to flush toilets with a sewerage connection Tobe effective facilities must be correctly constructed andproperly maintained
Source World Bank (WDI)
Owner WHO and UNCF
Improved water source rural ( of rural population withaccess)P2HUNWBKWDIHAEWATIMPRU
Page table 24 (p 159) map 33 (p 120)
Access to an improved water source refers to the percent-age of the population with reasonable access to an ad-equate amount of water from an improved source suchas a household connection public standpipe borehole
protected well or spring and rainwater collection Unim-proved sources include vendors tanker trucks and un-protected wells and springs Reasonable access is de-fined as the availability of at least 20 litres a person aday from a source within one kilometre of the dwellingSource World Bank (WDI)Owner WHO and UNCF
Improved water source urban ( of urban populationwith access)P2HUNWBKWDIHAEWATIMPWU
Page table 24 (p 159)Access to an improved water source refers to the percent-age of the population with reasonable access to an ad-equate amount of water from an improved source suchas a household connection public standpipe boreholeprotected well or spring and rainwater collection Unim-proved sources include vendors tanker trucks and un-protected wells and springs Reasonable access is de-fined as the availability of at least 20 litres a person aday from a source within one kilometre of the dwellingSource World Bank (WDI)Owner WHO and UNCF
Poverty headcount ratio at $125 a day (PPP) ( of re-gional population)P2HUNWBKWDIPOVAGG
Page chart 58 (p 111)Data are from PovcalNet the on-line tool for povertymeasurement developed by the Development ResearchGroup of the World Bank See httpiresearchworldbankorgPovcalNetpovDuplichtmlSource PovcalNetOwner World Bank
Gini-index of income distributionP2HUNWBKWDIPOVGINI
Page table 22 (p 153) map 28 (p 113)Gini index measures the extent to which the distribu-tion of income among individuals or households withinan economy deviates from a perfectly equal distributionA Lorenz curve plots the cumulative percentages of totalincome received against the cumulative number of recip-ients starting with the poorest individual or householdThe Gini index measures the area between the Lorenzcurve and a hypothetical line of absolute equality ex-pressed as a percentage of the maximum area under theline Thus a Gini index of 0 represents perfect equalitywhile an index of 100 implies perfect inequalitySource World Bank (WDI)Owner World Bank
Poverty headcount ratio at $125 a day (PPP) ( of pop-ulation)P2HUNWBKWDIPOVH125
Page table 21 (p 150)Population below US$125 a day is the percentage of thepopulation living on less than US$125 a day at 2005
168
DEFINITIONS AND SOURCES
international prices As a result of revisions in PPP ex-change rates poverty rates for individual countries can-not be compared with poverty rates reported in earliereditionsSource World Bank (WDI)Owner World Bank
Income share held by highest 20P2HUNWBKWDIPOVH20
Page table 22 (p 153)Percentage share of income or consumption is the sharethat accrues to subgroups of population indicated bydeciles or quintiles Percentage shares by quintile maynot sum to 100 because of roundingSource World Bank (WDI)Owner World Bank
Poverty headcount ratio at $2 a day (PPP) ( of popula-tion)P2HUNWBKWDIPOVH200
Page table 21 (p 150)Population below US$2 a day is the percentage of thepopulation living on less than US$200 a day at 2005international prices As a result of revisions in PPP ex-change rates poverty rates for individual countries can-not be compared with poverty rates reported in earliereditionsSource World Bank (WDI)Owner World Bank
Poverty headcount ratio at national poverty line ( ofpopulation)P2HUNWBKWDIPOVHNPL
Page table 21 (p 150)National poverty rate is the percentage of the popula-tion living below the national poverty line National es-timates are based on population-weighted subgroup es-timates from household surveysSource World Bank (WDI)Owner World Bank
Poverty headcount ratio at rural poverty line ( of ruralpopulation)P2HUNWBKWDIPOVHRPL
Page table 21 (p 150)Rural poverty rate is the percentage of the rural popula-tion living below the national rural poverty lineSource World Bank (WDI)Owner World Bank
Income share held by lowest 20P2HUNWBKWDIPOVL20
Page table 22 (p 153)Percentage share of income or consumption is the sharethat accrues to subgroups of population indicated bydeciles or quintiles Percentage shares by quintile maynot sum to 100 because of roundingSource World Bank (WDI)Owner World Bank
Poverty gap at $125 a day (PPP) ()P2HUNWBKWDIPOVP125
Page table 21 (p 150) map 27 (p 110)Poverty gap is the mean shortfall from the poverty line(counting the nonpoor as having zero shortfall) ex-pressed as a percentage of the poverty line This mea-sure reflects the depth of poverty as well as its incidenceSource World Bank (WDI)Owner World Bank
Poverty gap at $2 a day (PPP) ()P2HUNWBKWDIPOVP200
Page table 21 (p 150)Poverty gap is the mean shortfall from the poverty line(counting the nonpoor as having zero shortfall) ex-pressed as a percentage of the poverty line This mea-sure reflects the depth of poverty as well as its incidenceSource World Bank (WDI)Owner World Bank
Poverty gap at national poverty line ()P2HUNWBKWDIPOVPNPL
Page table 21 (p 150)Poverty gap at national poverty line is the mean short-fall from the poverty line (counting the nonpoor as hav-ing zero shortfall) as a percentage of the poverty lineThis measure reflects the depth of poverty as well as itsincidenceSource World Bank (WDI)Owner World Bank
Poverty gap at rural poverty line ()P2HUNWBKWDIPOVPRPL
Page table 21 (p 150)Poverty gap at rural poverty line is the mean shortfallfrom the poverty line (counting the nonpoor as hav-ing zero shortfall) as a percentage of the national ruralpoverty line This measure reflects the depth of povertyas well as its incidenceSource World Bank (WDI)Owner World Bank
Food aid receivedP2HUNWFPFAISFDAID
Page table 25 (p 162) chart 64 (p 123) map 34 (p122)Quantity of food aid that reaches the recipient coun-try during a given period Quantities exported in GrainEquivalent The latter is a unit of measurement usedas alternative to Actual Ton for cereal-derived productsTo convert a product into grain equivalent a commodityspecific conversion factor is used For example if the fac-tor to convert wheat flour into wheat is 137 a tonne ofwheat flour corresponds to 0730 tons of wheat (1137)Source Food Aid Information SystemOwner WFP
169
PART 2
Percentage of adults with low body mass index (BMI)P2HUNWHOGHOADLTLBMI
Page table 18 (p 141)The indicator of weight adequacy in relation to height ofolder children adolescents and adults It is calculated asweight (kilograms) divided by height (metres) squaredThe acceptable range for adults is 185 to 249 and forchildren it varies with ageSource Global Health ObservatoryOwner WHO
Percentage of female adults with low body mass index(BMI)P2HUNWHOGHOADLTLBMIF
Page table 18 (p 141) map 22 (p 99)The indicator of weight adequacy in relation to height ofolder female children adolescents and adults It is cal-culated as weight (kilograms) divided by height (metres)squared The acceptable range for adults is 185 to 249 and for children it varies with ageSource Global Health ObservatoryOwner WHO
Percentage of adults who are obese by genderP2HUNWHOGHOADLTOBS
Page table 18 (p 141)Percentage of male and female defined population witha body mass index (BMI) of 25 kgm2 or higherSource Global Health ObservatoryOwner WHO
Percentage of adults who are obeseP2HUNWHOGHOADLTOBSx
Page map 23 (p 99)Percentage of adult defined population with a bodymassindex (BMI) of 25 kgm2 or higherSource Global Health ObservatoryOwner WHO
Percentage of children under 5 who are stuntedP2HUNWHOGHOCHLDSTNT
Page table 18 (p 141) chart 43 (p 98)Percentage of stunting (height-for-age less than -2 stan-dard deviations of the WHO Child Growth Standards me-dian) among children aged 0-5 yearsSource Global Health ObservatoryOwner WHO
Percentage of children under 5 who are underweightP2HUNWHOGHOCHLDUW
Page table 18 (p 141) chart 42 (p 97) map 21 (p 96)Percentage of underweight (weight-for-age less than -2standard deviations of the WHO Child Growth Standardsmedian) among children aged 0-5 yearsSource Global Health ObservatoryOwner WHO
Percentage of children under 5 who are wastedP2HUNWHOGHOCHLDWSTD
Page table 18 (p 141) chart 43 (p 98)Percentage of wasting (weight-for-height less than -2standard deviations of the WHO Child Growth Standardsmedian) among children aged 0-5 yearsSource Global Health ObservatoryOwner WHO
Percentage of newborns with low birth weightP2HUNWHOGHONEWLWB
Page table 18 (p 141)Low-birthweight babies are newborns weighing lessthan 2500 grams with the measurement taken withinthe first hours of life before significant postnatal weightloss has occurredSource Global Health ObservatoryOwner WHO
170

EDUCATION HEALTH AND SANITATION
No Data lt 50 50 minus 150 150 minus 300 300 minus 1000 gt 1000
Annual health expenditure per capita (US$ 2009)
Chart 62 Budgetary constraints preclude adequate public health spending in many de-veloping regions
Annual health expenditure (2009)
ofGDP
0
2
4
6
8
10
DevelopedEastAsia
LAmer ampCarib
SouthAsia
Sub-SAfrica
Source WHO
Metalink P2HUNWBKWDIHAEHETOT p 168
119
PART 2
Improving access to safe water and sanitation cangreatly reduce the burden on health systems and pro-mote wider development According to the United Na-tions Childrenrsquos Fund (UNICEF) 25 billion people in de-veloping countries ndash around 50 percent of their popula-tion ndash lack improved sanitation facilities and over 884million still use unsafe drinking water sources
Inadequate access to safe water and sanitation servicescoupled with poor hygiene practices kills and sickensthousands of children every day and leads to impov-erishment and diminished opportunities for thousandsmore Estimates point to some 2 million people dyingevery year as a result of diarrhoea and diseases causedby ingesting contaminated water
Poor water and sanitation have many other seriousrepercussions as well Children especially girls are de-nied their right to education because schools lack pri-vate and decent sanitation facilities Women and girlsare forced to spend large parts of their day searching forand fetching water denying them participation in edu-cation and income-generating employment
Inadequate water and sanitation means that poor farm-ers and wage earners are less productive due to ill-ness health systems are overwhelmed and nationaleconomies underperform
Further reading
bull UNESCO education (wwwunescoorgneweneducation)
bull UNICEF Water Sanitation and Hygiene (wwwuniceforgwash)
bull WHO The world health report - Health systems financ-ing the path to universal coverage (wwwwhointwhr2010enindexhtml
bull UNDP Human Development Report 2010 (hdrundporgenreportsglobalhdr2010)
bull OrsquoDonovan (2008)
Map 33
No Data lt 30 30 minus 50 50 minus 75 75 minus 90 gt 90
Improved water source minus share of rural population with access ( 2008)
Source WHO
Metalink P2HUNWBKWDIHAEWATIMPRU p 168
rarr 78 percent of the worldrsquos rural popula-tion now have access to clean water
rarr Progress has been slow - just 15 percentmore than two decades ago
rarr Yet in many developing countries morethan half of all households struggle withinadequate access to safe water and san-itation services
120
EDUCATION HEALTH AND SANITATION
No Data lt 30 30 minus 50 50 minus 75 75 minus 90 gt 90
Improved water source minus share of rural population with access ( 2008)
Chart 63 There are still many who do not have access to adequate sanitation
Improved sanitation facilities - share of population with access (2008)
0
20
40
60
80
DevelopedEastAsia
LAmer ampCarib
SouthAsia
Sub-SAfrica
Source WHO
Metalink P2HUNWBKWDIHAESANIMPS p 168
121
PART 2
Food aidEmergency situations have become increasingly fre-quent over the past 25 years and are often coupled withacute and chronic food insecurity in the affected coun-tries International responses to these crises have gen-erally focused on addressing immediate humanitarianneeds as evidenced by the growing share of food aidthat is channelled to emergencies
Several formal agreements govern food-related assis-tance at the international level Among these the FoodAid Convention (FAC) is the only legal instrument to en-sure a minimum amount of food aid The components ofthe FAC have remained largely unchanged since its cre-ation in 1967 and many believe that it no longer appliesto todayrsquos food-related assistance needs Current foodaid patterns do not reflect longer-term requirements In2009 around 80 percent of total assistance was chan-nelled to emergency relief measures while the remain-der was used for promoting agricultural and broader eco-nomic development More troubling is the perceivedhigh negative correlation of international food priceswith the level of food aid
The strong focus on short-term relief measures com-bined with limited support to local agriculture is notonly less effective for overcoming the structural reasonsfor food insecurity it might even lower incentives to in-vest in agriculture and domestic food production Amoresustainable solution is required to tackle the underlyingreasons for food insecurity such as low agricultural pro-ductivity Accordingly those most in need would alsobenefit from the provision of basic inputs such as seedsfertilizers and farming tools
Donors are addressing shortcomings of traditional foodassistance A growing number now rely on procurementmechanisms in the target countries themselves Localpurchases not only minimize market distortions (sup-plies are neither increased nor effective demand low-ered) they are also generally cheaper than in-kind aidand can generate development benefits to local marketsand farmers Some donors also strive for better inte-gration of emergency interventions and longer-term de-velopment operations The European Union for exam-ple envisages a rapid handover to structural food se-curity mechanisms during emergency response Suchmeasures help rebuild the livelihoods of affected pop-ulations and strengthen their resilience to future crises
These examples illustrate a fundamental departure fromthe ad hoc and partial approaches to food security inter-ventions followed in the past They also point to donorsrsquogeneral agreement on the principles that should guidefood aid interventions
Further reading
bull FAO Making the Food Aid Convention meet the re-alities of the 21st century (wwwfaoorgdocrep013al935eal935e00pdf)
bull World Food Programme (wwwwfporg)
Map 34
No Data 0 0001 minus 1 1 minus 50 50 minus 100 gt 100
Food aid received grain equivalent (thousand tonnes 2010)
Source WFP
Metalink P2HUNWFPFAISFDAID p 169
rarr 57 million tonnes of food aid were re-ceived in 2010
rarr Despite no let-up in the number of emer-gencies food aid fell to a historical low
rarr Many donors now rely on locally pur-chased food in order to strengthen do-mestic markets in crisis-hit countries
122
FOOD AID
No Data 0 0001 minus 1 1 minus 50 50 minus 100 gt 100
Food aid received grain equivalent (thousand tonnes 2010)
Chart 64 Food aid flows are in long-term decline and have fallen further at a time whenfood prices have spiked
Food aid received (1988-2010)
Thousandtonnes
6000
8000
10000
12000
14000
16000
1990 1995 2000 2005 2010
Source WFP
Metalink P2HUNWFPFAISFDAID p 169
123
TABLE 13 Population at risk UNHCR population of concernUNHCR population of concern
total totalrefugees
internallydisplacedpersons
others andstatelesspersons
total totalrefugees
internallydisplacedpersons
others andstatelesspersons
thousands thousands thousands thousands thousands thousands thousands thousands
2009 2009 2009 2009 2010 2010 2010 2010
WORLD 29233 10174 15628 3431 29986 10350 14456 5180
DEVELOPING REGIONS 28139 9642 15207 3290 28931 9845 14058 5027
AFRICA 10636 2805 6469 1362 10587 2947 6154 1486
North Africa 143 138 0 5 142 137 0 5
Algeria 10 8 0 2 8 7 0 2
Egypt 9 7 0 2 9 7 0 2
Libya 3 2 0 1 3 2 0 1
Morocco 3 2 0 1 3 2 0 1
Tunisia 3 2 0 1 3 2 0 1
Sub-Saharan Africa 10493 2667 6469 1357 10445 2810 6154 1481
Angola 159 141 0 18 136 135 0 1
Benin 1 0 0 0 1 0 0 0
Botswana 0 0 0 0 0 0 0 0
Burkina Faso 1 1 0 0 2 1 0 1
Burundi 231 94 100 37 254 84 157 12
Cameroon 17 15 0 2 17 15 0 2
Cape Verde 0 0 0 0 0 0 0 0
Central African Republic 357 160 197 1 359 165 193 2
Chad 250 55 171 25 237 54 131 53
Comoros 0 0 0 0 0 0 0 0
Congo 24 21 0 3 24 21 0 3
Cocircte drsquoIvoire 714 23 519 172 585 42 515 29
Congo Dem Rep 2663 456 2053 154 2719 477 1721 520
Djibouti 1 1 0 0 1 1 0 0
Equatorial Guinea 0 0 0 0 0 0 0 0
Eritrea 224 209 0 14 236 222 0 14
Ethiopia 112 63 0 49 118 69 0 49
Gabon 0 0 0 0 0 0 0 0
Gambia 5 2 0 3 3 2 0 1
Ghana 16 15 0 1 22 20 0 2
Guinea 14 11 0 3 15 12 0 3
Guinea-Bissau 1 1 0 0 1 1 0 0
Kenya 417 10 399 8 311 9 300 2
Lesotho 0 0 0 0 0 0 0 0
Liberia 78 72 0 6 73 70 0 3
Madagascar 0 0 0 0 0 0 0 0
Malawi 0 0 0 0 0 0 0 0
Mali 4 3 0 1 4 4 0 0
Mauritania 52 39 0 13 40 38 0 2
Mauritius 0 0 0 0 0 0 0 0
Mozambique 0 0 0 0 0 0 0 0
Namibia 1 1 0 0 1 1 0 0
Niger 1 1 0 0 1 1 0 0
Nigeria 25 16 0 10 28 16 0 12
Rwanda 155 129 0 25 136 115 0 21
Senegal 17 16 0 1 18 16 0 2
Seychelles 0 0 0 0 0 0 0 0
Sierra Leone 19 15 0 3 15 11 0 3
Somalia 2249 678 1550 21 2257 770 1464 23
Sudan 1619 368 1034 217 2185 387 1548 250
South Africa 1 0 0 0 1 0 0 0
Swaziland 0 0 0 0 0 0 0 0
Tanzania Utd Rep 156 1 0 155 164 1 0 162
Togo 20 18 0 1 19 18 0 1
Uganda 863 8 446 409 436 6 126 304
Zambia 0 0 0 0 0 0 0 0
Zimbabwe 24 22 0 1 25 24 0 1
124
TABLE 13 Population at risk UNHCR population of concern (continued)UNHCR population of concern
total totalrefugees
internallydisplacedpersons
others andstatelesspersons
total totalrefugees
internallydisplacedpersons
others andstatelesspersons
thousands thousands thousands thousands thousands thousands thousands thousands
2009 2009 2009 2009 2010 2010 2010 2010
ASIA 13602 6372 5435 1796 14103 6425 4232 3446
Central Asia 17 14 0 3 301 17 60 224
Kazakhstan 4 4 0 1 4 4 0 1
Kyrgyzstan 3 3 0 0 284 3 60 222
Tajikistan 1 1 0 0 1 1 0 0
Turkmenistan 1 1 0 0 1 1 0 0
Uzbekistan 8 7 0 2 10 9 0 2
East Asia 1153 975 67 110 1303 986 202 115
Brunei Darussalam 0 0 0 0 0 0 0 0
Cambodia 17 17 0 0 16 16 0 0
China 199 181 0 18 192 185 0 8
Indonesia 21 18 0 2 17 17 0 0
Korea DPR 1 1 0 0 1 1 0 0
Korea Republic of 1 1 0 0 1 1 0 0
Lao PDR 9 8 0 0 8 8 0 0
Malaysia 62 1 0 61 1 1 0 0
Mongolia 4 1 0 2 4 2 0 2
Myanmar 497 407 67 23 500 416 62 22
Philippines 2 1 0 1 221 1 140 81
Singapore 0 0 0 0 0 0 0 0
Thailand 1 1 0 0 1 0 0 0
Viet Nam 341 339 0 1 340 339 0 1
South Asia 7225 3265 2627 1334 7400 3413 1578 2409
Afghanistan 3279 2887 297 95 4404 3055 352 998
Bangladesh 12 10 0 2 17 10 0 7
Bhutan 90 89 0 1 76 75 0 1
India 24 20 0 5 22 18 0 4
Iran (Islamic Rep) 87 73 0 14 85 69 0 16
Maldives 0 0 0 0 0 0 0 0
Nepal 7 5 0 2 7 6 0 1
Pakistan 3041 35 1895 1111 2199 40 952 1207
Sri Lanka 684 146 435 104 590 141 274 175
West Asia 5206 2117 2741 349 5100 2010 2393 698
Armenia 104 18 0 86 103 18 0 85
Azerbaijan 606 17 586 3 612 17 593 2
Bahrain 0 0 0 0 0 0 0 0
Cyprus 0 0 0 0 0 0 0 0
Georgia 378 15 353 10 378 11 236 131
Iraq 3565 1785 1552 228 3387 1684 1344 360
Jordan 3 2 0 1 3 2 0 1
Kuwait 1 1 0 0 1 1 0 0
Lebanon 18 16 0 2 17 16 0 2
Occupied PalestinianTerritory
98 95 0 3 97 93 0 3
Saudi Arabia 1 1 0 0 1 1 0 0
Syrian Arab Republic 23 18 0 6 28 18 0 10
Turkey 156 146 0 10 155 147 0 8
United Arab Emirates 0 0 0 0 0 0 0 0
Yemen 253 2 250 1 318 2 221 95
LATIN AMERICA amp THECARIBBEAN
3898 463 3304 132 4238 471 3672 95
Argentina 1 1 0 0 1 1 0 0
Bahamas 0 0 0 0 0 0 0 0
Barbados 0 0 0 0 0 0 0 0
Belize 0 0 0 0 0 0 0 0
Bolivia (Plur State) 1 1 0 0 1 1 0 0
Brazil 1 1 0 0 1 1 0 0
Chile 1 1 0 0 1 1 0 0
Colombia 3758 390 3304 64 4128 396 3672 60
Costa Rica 0 0 0 0 0 0 0 0
125
TABLE 13 Population at risk UNHCR population of concern (continued)UNHCR population of concern
total totalrefugees
internallydisplacedpersons
others andstatelesspersons
total totalrefugees
internallydisplacedpersons
others andstatelesspersons
thousands thousands thousands thousands thousands thousands thousands thousands
2009 2009 2009 2009 2010 2010 2010 2010
Cuba 10 8 0 2 12 7 0 4
Dominica 0 0 0 0 0 0 0 0
Dominican Republic 1 0 0 0 1 0 0 0
Ecuador 1 1 0 0 1 1 0 0
El Salvador 15 5 0 10 7 5 0 2
French Guiana 0 0 0 0 0 0 0 0
Grenada 0 0 0 0 0 0 0 0
Guatemala 15 6 0 9 7 6 0 1
Guyana 1 1 0 0 1 1 0 0
Haiti 36 24 0 12 33 26 0 7
Honduras 2 1 0 1 2 1 0 1
Jamaica 1 1 0 1 2 1 0 1
Mexico 27 6 0 20 17 7 0 10
Netherlands Antilles
Nicaragua 2 1 0 0 2 1 0 0
Panama 0 0 0 0 0 0 0 0
Paraguay 0 0 0 0 0 0 0 0
Peru 12 6 0 6 11 6 0 5
St Kitts amp Nevis 0 0 0 0 0 0 0 0
St Lucia 1 0 0 1 1 0 0 1
St Vincent amp Grenadines 2 1 0 1 2 1 0 1
Suriname 0 0 0 0 0 0 0 0
Trinidad amp Tobago 1 0 0 0 0 0 0 0
Uruguay 0 0 0 0 0 0 0 0
Venezuela (Boliv Rep of) 8 6 0 2 7 7 0 1
OCEANIA 2 2 0 0 2 2 0 0
Fiji 2 2 0 0 2 2 0 0
French Polynesia 0 0 0 0
New Caledonia 0 0 0 0 0 0 0 0
Papua New Guinea 0 0 0 0 0 0 0 0
Samoa 0 0 0 0 0 0 0 0
Solomon Islands 0 0 0 0 0 0 0 0
Tonga 0 0 0 0 0 0 0 0
Vanuatu 0 0 0 0 0 0 0 0
DEVELOPED REGIONS 1094 532 421 141 1055 505 397 153
NORTH AMERICA 4 2 0 1 4 3 0 1
Bermuda 0 0 0 0 0 0 0 0
Canada 0 0 0 0 0 0 0 0
United States of America 4 2 0 1 4 3 0 1
ASIA amp OCEANIA 3 1 0 1 2 2 0 1
Australia 0 0 0 0 0 0 0 0
Israel 2 1 0 1 2 1 0 1
Japan 0 0 0 0 0 0 0 0
New Zealand 0 0 0 0 0 0 0 0
EUROPE 1088 528 421 139 1048 500 397 151
Albania 17 16 0 2 16 15 0 1
Belarus 7 6 0 1 6 6 0 1
Bosnia amp Herzegovina 237 70 114 53 232 63 113 55
Croatia 103 76 2 25 89 66 2 21
European Union 39 14 0 24 20 13 0 7
Iceland 0 0 0 0 0 0 0 0
Macedonia FYR 9 8 0 1 11 8 0 3
Montenegro 3 3 0 0 3 3 0 0
Norway 0 0 0 0 0 0 0 0
Republic of Moldova 7 6 0 1 7 6 0 1
Russian Federation 204 109 80 14 199 112 53 34
Serbia 437 196 225 16 439 183 228 27
Switzerland 0 0 0 0 0 0 0 0
Ukraine 26 25 0 2 26 25 0 1
126
TABLE 14 Population at risk persons affected by natural disastersPersons affected by natural disasters
total droughtearthquake
extremetemperature
flood landslide storm volcanoeswildfiresand
epidemics
thousands thousands thousands thousands thousands thousands thousands thousands
2010 2010 2010 2010 2010 2010 2010 2010
WORLD 344655 106870 7485 3986 191861 2464 30954 1034
DEVELOPING REGIONS 342717 106870 6650 3971 191352 2464 30403 1007
AFRICA 43854 38810 0 0 4657 20 317 50
North Africa 81 0 0 0 81 0 0 0
Algeria 0 0 0 0 0 0 0 0
Egypt 4 0 0 0 4 0 0 0
Libya
Morocco 77 0 0 0 77 0 0 0
Tunisia
Sub-Saharan Africa 43773 38810 0 0 4577 20 317 50
Angola 255 0 0 0 255 0 0 0
Benin 832 0 0 0 831 0 0 1
Botswana 0 0 0 0 0 0 0 0
Burkina Faso 139 0 0 0 133 0 0 6
Burundi 184 180 0 0 3 0 2 0
Cameroon 6 0 0 0 3 0 0 3
Cape Verde
Central African Republic 2 0 0 0 2 0 0 0
Chad 2552 2400 0 0 145 0 0 7
Comoros
Congo 1 0 0 0 0 0 0 1
Cocircte drsquoIvoire 6 0 0 0 6 0 0 0
Congo Dem Rep 85 0 0 0 70 1 0 14
Djibouti 120 120 0 0 0 0 0 0
Equatorial Guinea
Eritrea
Ethiopia 9482 9400 0 0 81 0 0 1
Gabon 2 0 0 0 0 0 2 1
Gambia 39 0 0 0 39 0 0 0
Ghana 17 0 0 0 17 0 0 0
Guinea 48 0 0 0 48 0 0 0
Guinea-Bissau 57 0 0 0 57 0 0 0
Kenya 7514 7300 0 0 211 0 0 3
Lesotho 5 0 0 0 5 0 0 0
Liberia 15 0 0 0 15 0 0 0
Madagascar 1027 720 0 0 0 0 307 0
Malawi 79 0 0 0 79 0 0 0
Mali 619 600 0 0 19 0 0 0
Mauritania 309 300 0 0 9 0 0 0
Mauritius
Mozambique 544 460 0 0 81 0 0 4
Namibia 338 0 0 0 338 0 0 0
Niger 8134 7900 0 0 233 0 0 1
Nigeria 1509 0 0 0 1500 0 0 8
Rwanda 10 0 0 0 4 6 0 0
Senegal 103 0 0 0 103 0 0 0
Seychelles
Sierra Leone 0 0 0 0 0 0 0 0
Somalia 2866 2850 0 0 16 0 0 0
Sudan 4438 4300 0 0 138 0 0 0
South Africa 26 0 0 0 20 0 6 0
Swaziland
Tanzania Utd Rep
Togo 112 0 0 0 112 0 0 0
Uganda 613 600 0 0 0 13 0 0
Zambia 3 0 0 0 3 0 0 0
Zimbabwe 1681 1680 0 0 1 0 0 0
127
TABLE 14 Population at risk persons affected by natural disasters (continued)Persons affected by natural disasters
total droughtearthquake
extremetemperature
flood landslide storm volcanoeswildfiresand
epidemics
thousands thousands thousands thousands thousands thousands thousands thousands
2010 2010 2010 2010 2010 2010 2010 2010
ASIA 285231 67783 252 3900 181630 2388 28948 330
Central Asia 64 0 8 0 47 8 0 1
Kazakhstan 38 0 0 0 38 0 0 0
Kyrgyzstan 8 0 0 0 0 8 0 0
Tajikistan 17 0 8 0 9 0 0 0
Turkmenistan
Uzbekistan
East Asia 256254 66483 234 3800 154940 2294 28180 324
Brunei Darussalam
Cambodia 0 0 0 0 0 0 0 0
China 231535 60000 196 3800 140254 2148 25137 0
Indonesia 238 0 17 0 69 0 0 152
Korea DPR 96 0 0 0 56 0 40 0
Korea Republic of 42 0 0 0 0 0 42 0
Lao PDR
Malaysia 0 0 0 0 0 0 0 0
Mongolia
Myanmar 426 0 21 0 0 145 260 0
Philippines 6738 0 0 0 3901 1 2666 171
Singapore
Thailand 15654 6483 0 0 9171 0 0 1
Viet Nam 1524 0 0 0 1490 0 35 0
South Asia 27536 0 7 100 26570 86 768 5
Afghanistan 49 0 1 0 48 0 0 0
Bangladesh 987 0 0 100 575 55 257 0
Bhutan
India 4790 0 0 0 4283 0 507 0
Iran (Islamic Rep) 5 0 5 0 0 0 0 0
Maldives
Nepal 13 0 0 0 8 0 0 5
Pakistan 20399 0 1 0 20363 30 4 0
Sri Lanka 1292 0 0 0 1292 0 0 0
West Asia 1377 1300 4 0 74 0 0 0
Armenia
Azerbaijan 70 0 0 0 70 0 0 0
Bahrain
Cyprus
Georgia
Iraq 2 0 0 0 2 0 0 0
Jordan
Kuwait
Lebanon
Occupied PalestinianTerritory
0 0 0 0 0 0 0 0
Saudi Arabia 0 0 0 0 0 0 0 0
Syrian Arab Republic 1300 1300 0 0 0 0 0 0
Turkey 4 0 4 0 0 0 0 0
United Arab Emirates
Yemen 1 0 0 0 1 0 0 0
LATIN AMERICA amp THECARIBBEAN
13570 277 6397 71 5049 56 1093 628
Argentina 0 0 0 0 0 0 0 0
Bahamas
Barbados 2 0 0 0 0 0 2 0
Belize 0 0 0 0 0 0 0 0
Bolivia (Plur State) 428 62 0 0 358 4 0 3
Brazil 357 62 0 0 295 0 0 0
Chile 2676 0 2672 0 0 0 0 4
Colombia 3005 0 0 0 3005 0 0 0
Costa Rica 3 0 0 0 3 0 0 0
128
TABLE 14 Population at risk persons affected by natural disasters (continued)Persons affected by natural disasters
total droughtearthquake
extremetemperature
flood landslide storm volcanoeswildfiresand
epidemics
thousands thousands thousands thousands thousands thousands thousands thousands
2010 2010 2010 2010 2010 2010 2010 2010
Cuba
Dominica
Dominican Republic 52 0 0 0 39 0 12 0
Ecuador 121 108 0 0 11 0 0 2
El Salvador 12 0 0 0 0 0 12 0
French Guiana
Grenada 0 0 0 0 0 0 0 0
Guatemala 456 0 0 0 3 51 400 2
Guyana 0 0 0 0 0 0 0 0
Haiti 4310 0 3700 0 24 0 78 507
Honduras 102 45 0 0 5 0 25 27
Jamaica 3 0 0 0 0 0 3 0
Mexico 1600 0 25 0 1020 0 555 0
Netherlands Antilles
Nicaragua 76 0 0 0 76 0 0 0
Panama 33 0 0 0 33 0 0 0
Paraguay 16 0 0 0 0 0 0 16
Peru 154 0 0 71 80 1 0 2
St Kitts amp Nevis
St Lucia 3 0 0 0 2 0 1 0
St Vincent amp Grenadines
Suriname
Trinidad amp Tobago 0 0 0 0 0 0 0 0
Uruguay 0 0 0 0 0 0 0 0
Venezuela (Boliv Rep of) 95 0 0 0 95 0 0 0
OCEANIA 62 0 1 0 16 0 45 0
Fiji 39 0 0 0 0 0 39 0
French Polynesia 3 0 0 0 0 0 3 0
New Caledonia
Papua New Guinea 0 0 0 0 0 0 0 0
Samoa
Solomon Islands 18 0 1 0 16 0 1 0
Tonga 0 0 0 0 0 0 0 0
Vanuatu 0 0 0 0 0 0 0 0
DEVELOPED REGIONS 1922 0 835 15 509 0 536 27
NORTH AMERICA 36 0 1 0 7 0 29 0
Bermuda
Canada 0 0 0 0 0 0 0 0
United States of America 36 0 1 0 7 0 29 0
ASIA amp OCEANIA 1046 0 792 15 211 0 7 20
Australia 219 0 0 0 211 0 7 0
Israel 20 0 0 0 0 0 0 20
Japan 507 0 492 15 0 0 0 0
New Zealand 300 0 300 0 0 0 0 0
EUROPE 840 0 42 0 291 0 500 7
Albania 14 0 0 0 14 0 0 0
Belarus
Bosnia amp Herzegovina 35 0 0 0 35 0 0 0
Croatia 1 0 0 0 1 0 0 0
European Union 634 0 15 0 119 0 500 0
Iceland 0 0 0 0 0 0 0 0
Macedonia FYR
Montenegro 6 0 0 0 6 0 0 0
Norway
Republic of Moldova 12 0 0 0 12 0 0 0
Russian Federation 66 0 0 0 58 0 0 7
Serbia 32 0 27 0 5 0 0 0
Switzerland 0 0 0 0 0 0 0 0
Ukraine 40 0 0 0 40 0 0 0
129
TABLE 15 UndernourishmentShare of population undernourished Incidence of undernourishment Depth of hunger
pa millions millions pakcalcapday kcalcapday
pa
1995-97 2006-08 growth1995-97 -2006-08
1995-97 2006-08 growth1995-97 -2006-08
1995-97 2006-08 growth1995-97 -2006-08
WORLD 18 16 minus23 7012 7392 05 214 212 minus03
DEVELOPING REGIONS 18 16 minus23 7011 7392 05 234 234 minus03
AFRICA 29 23 minus24 1622 1603 minus01 253 234 minus05
North Africa 5 31 185 188 01
Algeria 5 15 180 180 00
Egypt 190 200 03
Libya 130 130 05
Morocco 6 16 210 200 minus03
Tunisia 120 120 00
Sub-Saharan Africa 31 23 minus23 1591 1603 01 268 243 minus05
Angola 61 41 minus35 78 72 minus07 390 320 minus17
Benin 18 12 minus36 10 10 00 230 210 minus08
Botswana 23 25 08 04 05 20 230 240 08
Burkina Faso 12 8 minus36 12 12 00 210 200 minus06
Burundi 56 62 09 35 49 31 350 390 14
Cameroon 34 22 minus39 50 42 minus16 260 230 minus08
Cape Verde 14 11 minus22 01 01 00 190 190 00
Central African Republic 47 40 minus15 16 17 06 320 300 minus02
Chad 53 39 minus27 39 41 05 370 320 minus12
Comoros 47 47 00 03 04 26 300 300 07
Congo 41 13 minus99 12 05 minus76 310 230 minus18
Cocircte drsquoIvoire 17 14 minus17 26 29 10 240 230 00
Congo Dem Rep
Djibouti 50 26 minus58 03 02 minus36 350 280 minus20
Equatorial Guinea
Eritrea 64 65 01 21 31 36 340 350 minus02
Ethiopia 62 41 minus37 362 326 minus09 390 320 minus17
Gabon 140 140 minus04
Gambia 23 19 minus17 03 03 00 250 240 05
Ghana 13 5 minus83 23 11 minus65 210 180 minus23
Guinea 19 16 minus15 15 16 06 270 260 minus02
Guinea-Bissau 26 22 minus15 03 03 00 260 250 00
Kenya 32 33 03 90 124 30 250 260 02
Lesotho 16 14 minus12 03 03 00 220 220 00
Liberia 32 32 00 07 11 42 330 330 02
Madagascar 26 25 minus04 35 47 27 250 250 05
Malawi 36 27 minus26 38 39 02 310 280 minus08
Mali 25 12 minus65 25 15 minus45 260 220 minus13
Mauritania 9 8 minus11 02 02 00 210 210 minus03
Mauritius 7 5 minus30 01 01 00 190 180 minus03
Mozambique 47 38 minus19 78 83 06 360 330 minus12
Namibia 30 18 minus45 05 04 minus20 250 220 minus08
Niger 37 16 minus73 35 23 minus37 300 240 minus14
Nigeria 10 6 minus45 109 94 minus13 200 180 minus12
Rwanda 53 32 minus45 30 30 00 360 300 minus06
Senegal 26 19 minus28 23 23 00 240 220 minus03
Seychelles 10 8 minus20 00 00 160 150 minus04
Sierra Leone 39 35 minus10 16 19 16 360 340 minus07
Somalia
Sudan 29 22 minus25 93 88 minus05 260 240 minus12
South Africa 160 150 00
Swaziland 21 19 minus09 02 02 00 220 220 09
Tanzania Utd Rep 42 34 minus19 128 139 08 300 280 05
Togo 36 30 minus16 17 19 10 290 280 minus06
Uganda 23 22 minus04 49 67 29 240 240 00
Zambia 38 44 13 36 54 38 300 320 06
Zimbabwe 44 30 minus34 53 37 minus32 340 300 minus06
130
TABLE 15 Undernourishment (continued)Share of population undernourished Incidence of undernourishment Depth of hunger
pa millions millions pakcalcapday kcalcapday
pa
1995-97 2006-08 growth1995-97 -2006-08
1995-97 2006-08 growth1995-97 -2006-08
1995-97 2006-08 growth1995-97 -2006-08
ASIA 16 15 minus21 4909 5372 08 233 238 minus02
Central Asia 12 13 minus20 46 55 16 171 172 minus01
Kazakhstan 130 120 00
Kyrgyzstan 13 11 minus15 06 06 00 210 210 minus03
Tajikistan 42 26 minus43 24 18 minus26 270 230 minus05
Turkmenistan 9 7 minus23 04 03 minus26 180 180 00
Uzbekistan 5 11 74 12 28 80 160 180 07
East Asia 13 11 minus18 2194 2058 minus06 241 241 minus04
Brunei Darussalam 140 130 minus05
Cambodia 40 25 minus42 47 36 minus24 280 250 minus05
China 12 10 minus16 1417 1296 minus08 250 250 minus05
Indonesia 11 13 15 220 297 28 210 220 00
Korea DPR 30 35 14 66 84 22 250 270 10
Korea Republic of 120 130 00
Lao PDR 29 22 minus25 14 14 00 270 260 minus05
Malaysia 120 130 minus05
Mongolia 33 27 minus18 08 07 minus12 260 260 02
Myanmar
Philippines 20 13 minus38 141 118 minus16 250 240 minus07
Singapore
Thailand 18 16 minus11 111 107 minus03 240 240 minus07
Viet Nam 22 11 minus61 167 96 minus49 270 240 minus12
South Asia 20 20 minus11 2570 3174 19 232 246 00
Afghanistan
Bangladesh 41 26 minus41 542 414 minus24 330 290 minus04
Bhutan
India 17 19 10 1671 2246 27 220 240 00
Iran (Islamic Rep) 170 180 07
Maldives 9 10 10 00 00 180 190 07
Nepal 20 17 minus15 44 47 06 230 220 minus03
Pakistan 20 25 20 268 428 43 260 280 00
Sri Lanka 25 20 minus20 45 39 minus13 260 250 minus02
West Asia 24 24 minus42 99 85 minus14 173 169 minus02
Armenia 36 21 minus48 11 06 minus54 230 200 minus14
Azerbaijan 27 22 220 140 minus28
Bahrain
Cyprus 120 120 00
Georgia 19 6 minus99 10 03 minus104 200 160 minus39
Iraq
Jordan 5 02 170 150 00
Kuwait 5 5 00 01 01 00 180 190 minus12
Lebanon 160 170 04
Occupied PalestinianTerritory
10 21 70 03 08 93 160 190
Saudi Arabia 130 130 minus05
Syrian Arab Republic 160 170 04
Turkey 160 160 04
United Arab Emirates 130 140 05
Yemen 31 30 minus03 50 67 27 260 260 02
LATIN AMERICA amp THECARIBBEAN
14 11 minus19 480 416 minus13 212 203 minus03
Argentina 120 130 00
Bahamas 8 6 minus26 00 00 160 160 00
Barbados 140 140 05
Belize 8 5 minus42 00 00 180 170 00
Bolivia (Plur State) 24 27 11 19 25 25 230 240 00
Brazil 10 6 minus45 166 117 minus31 240 220 minus05
Chile 150 140 minus08
Colombia 11 9 minus18 40 41 02 210 210 minus03
Costa Rica 150 150 04
131
TABLE 15 Undernourishment (continued)Share of population undernourished Incidence of undernourishment Depth of hunger
pa millions millions pakcalcapday kcalcapday
pa
1995-97 2006-08 growth1995-97 -2006-08
1995-97 2006-08 growth1995-97 -2006-08
1995-97 2006-08 growth1995-97 -2006-08
Cuba 14 15 190 120 minus18
Dominica 150 150 00
Dominican Republic 26 24 minus07 21 23 08 240 230 minus03
Ecuador 16 15 minus06 18 20 10 190 190 minus03
El Salvador 12 9 minus26 07 06 minus14 200 190 minus03
French Guiana
Grenada 18 21 14 00 00 240 250 08
Guatemala 20 22 09 21 29 30 220 230 06
Guyana 11 8 minus29 01 01 00 200 190 minus12
Haiti 60 57 minus05 48 55 12 430 420 minus03
Honduras 16 12 minus26 09 09 00 240 230 minus05
Jamaica 6 5 minus16 02 01 minus61 170 170 minus07
Mexico 190 190 00
Netherlands Antilles 150 150 minus11
Nicaragua 38 19 minus61 18 11 minus44 310 260 minus18
Panama 20 15 minus26 06 05 minus16 230 220 minus03
Paraguay 10 10 00 05 06 17 200 210 minus03
Peru 21 16 minus24 50 45 minus10 230 220 minus08
St Kitts amp Nevis 16 16 00 00 00 220 220 06
St Lucia 7 8 12 00 00 180 190 00
St Vincent amp Grenadines 16 5 minus100 00 00 210 170 minus10
Suriname 13 15 13 01 01 00 200 200 00
Trinidad amp Tobago 14 11 minus22 02 02 00 220 220 03
Uruguay 140 140 minus04
Venezuela (Boliv Rep of) 14 7 minus61 31 19 minus44 190 170 minus04
OCEANIA 8 9 00 01 182 173 minus06
Fiji 5 00 170 160 minus07
French Polynesia 5 00 160 150 minus11
New Caledonia 9 8 minus11 00 00 210 210 03
Papua New Guinea
Samoa 10 00 180 150 minus11
Solomon Islands 13 11 minus15 00 01 190 190 minus06
Tonga
Vanuatu 9 00 200 180 minus07
DEVELOPED REGIONS 5 01 125 116 01
NORTH AMERICA 111 101 minus02
Bermuda 180 200 07
Canada 120 110 minus10
United States of America 110 100 minus06
ASIA amp OCEANIA 128 126 00
Australia 130 120 00
Israel 90 90 00
Japan 130 130 00
New Zealand 120 120 00
EUROPE 5 01 131 121 01
Albania 160 160 minus07
Belarus 120 130 05
Bosnia amp Herzegovina 150 140 minus12
Croatia 180 150 minus18
European Union 5 01 120 115 minus02
Iceland 130 120 minus05
Macedonia FYR 180 150 minus11
Montenegro 170
Norway 120 110 minus05
Republic of Moldova 190 190 07
Russian Federation 160 130 minus09
Serbia 170
Switzerland 120 120 00
Ukraine 150 130 minus05
132
TABLE 16 Dietary energy supplies and changes in dietary compositionDietary energy supply per person Contribution in diets by type Contribution in diets by commodity
carbo-hydrates
proteins fats cereals starchy roots pulses
kcalcapday kcalcapday
1990-92 2006-08 2005-07 2005-07 2005-07 1990-92 2005-07 1990-92 2005-07 1990-92 2005-07
WORLD 2583 2805 65 11 24 53 48 8 7 5 5
DEVELOPING REGIONS 2430 2664 67 11 22 58 53 9 8 5 5
AFRICA 2266 2495 72 10 18 49 49 22 20 5 5
North Africa 3035 3175 71 11 17 62 60 2 3 2 2
Algeria 2890 3090 70 11 19 57 56 2 3
Egypt 3090 3160 73 12 15 66 64 2 2
Libya 3180 3150 63 10 27 47 47 2 3
Morocco 3000 3260 72 11 17 62 60 2 2
Tunisia 3120 3330 64 11 24 55 50 2 2
Sub-Saharan Africa 2102 2351 72 10 19 47 47 24 22 5 6
Angola 1580 1960 70 9 21 29 36 30 26 3 3
Benin 2250 2510 72 9 19 41 40 34 31 4 5
Botswana 2260 2230 67 11 22 43 43 6 6 5 6
Burkina Faso 2460 2690 68 12 20 75 73 5 5
Burundi 1860 1680 82 11 7 17 19 29 32 27 19
Cameroon 2020 2240 72 10 18 39 42 20 17 2 6
Cape Verde 2370 2530 63 11 26 50 45 4 4 4 3
Central African Republic 1880 1960 61 9 29 20 25 37 31
Chad 1700 2010 64 12 24 52 57 13 8 2 4
Comoros 1900 1840 69 9 22 41 38 17 15 6 9
Congo 1970 2570 69 8 23 19 26 41 34
Cocircte drsquoIvoire 2470 2500 74 8 18 35 33 31 33
Congo Dem Rep 80 6 14 16 23 57 55
Djibouti 1720 2300 63 10 27 52 52 2 3
Equatorial Guinea
Eritrea 1530 1590 73 12 15 72 74 5 3 8 5
Ethiopia 1550 1950 79 11 10 67 66 15 13 6 7
Gabon 2520 2710 69 12 19 25 33 21 17
Gambia 2470 2330 64 9 27 55 56
Ghana 2120 2900 77 8 15 32 29 39 37
Guinea 2420 2550 70 9 22 50 47 14 14
Guinea-Bissau 2290 2270 71 8 21 61 59 8 9
Kenya 1970 2030 68 11 21 47 49 8 5 6 7
Lesotho 2370 2460 77 11 12 76 78 2 3
Liberia 2220 2200 70 7 24 45 43 22 23
Madagascar 2200 2130 78 9 13 52 59 22 19
Malawi 1870 2150 77 10 13 69 59 4 15 7 6
Mali 2180 2590 70 11 19 69 67 1 3
Mauritania 2580 2810 63 12 25 55 51 4 4
Mauritius 2760 2930 62 11 26 48 46 3 3
Mozambique 1750 2070 76 7 17 34 40 41 37
Namibia 2060 2360 68 11 21 48 46 14 14 4 3
Niger 1970 2390 68 13 19 74 60 6 14
Nigeria 2310 2710 69 9 22 47 45 20 19 3 3
Rwanda 1830 2090 82 10 9 18 18 30 36 15 12
Senegal 2190 2280 65 10 25 64 60 1 3
Seychelles 2280 2400 60 14 26 46 41
Sierra Leone 1950 2120 67 10 24 55 50 5 10 4 5
Somalia
Sudan 1960 2280 61 13 26 57 50 2 3
South Africa 2820 3000 65 11 24 53 54
Swaziland 2380 2290 68 11 21 52 50 5 5
Tanzania Utd Rep 2080 2020 75 10 15 47 46 24 17 5 7
Togo 1890 2150 71 9 20 48 49 28 25 2 4
Uganda 2280 2220 74 9 17 19 23 25 23 9 8
Zambia 2010 1880 73 10 17 65 61 13 14
Zimbabwe 1980 2210 66 10 24 62 56 2 2
133
TABLE 16 Dietary energy supplies and changes in dietary composition (continued)Dietary energy supply per person Contribution in diets by type Contribution in diets by commodity
carbo-hydrates
proteins fats cereals starchy roots pulses
kcalcapday kcalcapday
1990-92 2006-08 2005-07 2005-07 2005-07 1990-92 2005-07 1990-92 2005-07 1990-92 2005-07
ASIA 2434 2667 67 11 22 63 56 6 5 5 5
Central Asia 2715 2793 64 12 25 59 54 4 6
Kazakhstan 3280 3510 61 12 27 57 43 4 6
Kyrgyzstan 2400 2660 68 12 20 57 48 5 8
Tajikistan 2020 2190 64 10 26 63 63
Turkmenistan 2550 2740 65 13 23 57 61
Uzbekistan 2650 2560 64 12 25 59 57
East Asia 2508 2872 64 11 24 63 53 7 5 3 6
Brunei Darussalam 2730 2980 64 12 25 48 45
Cambodia 1870 2180 75 10 14 82 72 2 4
China 2580 2990 61 12 27 63 50 7 5
Indonesia 2390 2550 73 9 18 66 63 7 6
Korea DPR 2340 2110 74 11 15 60 62 3 7 6 5
Korea Republic of 2970 3040 63 11 25 54 44
Lao PDR 2010 2240 76 11 13 78 70 6 4
Malaysia 2720 2890 63 11 26 42 47 3 2
Mongolia 2080 2240 56 13 32 42 46 2 4
Myanmar 67 11 22 73 59 2 6
Philippines 2230 2580 73 9 18 53 57 4 3
Singapore
Thailand 2250 2540 71 9 20 57 49
Viet Nam 2090 2780 70 10 19 76 66
South Asia 2279 2374 71 10 19 65 60 2 3 5 5
Afghanistan
Bangladesh 1960 2270 80 9 12 84 78 1 3
Bhutan
India 2290 2360 71 10 19 64 60 5 5
Iran (Islamic Rep) 2970 3050 69 11 20 60 53 3 4
Maldives 2400 2550 60 16 23 46 35
Nepal 2190 2340 74 10 15 74 69 3 5 3 3
Pakistan 2210 2280 63 10 27 55 47 3 3
Sri Lanka 2170 2370 73 9 18 56 56 4 2 3 3
West Asia 2963 3067 64 11 25 51 49 3 3 4 3
Armenia 1920 2260 64 12 24 59 44 8 5
Azerbaijan 2160 3020 73 11 16 66 60 2 6
Bahrain
Cyprus 3120 3190 48 12 41 28 21 3 3
Georgia 1850 2730 67 11 22 57 50 5 3
Iraq
Jordan 2840 3000 63 10 27 50 46 3 2
Kuwait 2350 3030 58 12 30 39 42 2 2
Lebanon 3010 3090 58 11 32 34 34 3 6 4 3
Occupied PalestinianTerritory
2080 66 11 23 0 51
Saudi Arabia 2850 3120 64 11 25 48 48
Syrian Arab Republic 2830 3040 59 10 30 50 45
Turkey 3590 3500 62 11 27 51 48 3 3 4 3
United Arab Emirates 3160 3170 63 13 24 33 43 3 4
Yemen 1980 2050 69 11 20 66 61 3 3
LATIN AMERICA amp THECARIBBEAN
2664 2915 62 11 27 39 37 6 6 5 5
Argentina 3010 3030 55 13 32 32 31 3 3
Bahamas 2610 2710 57 12 30 27 27 2 2
Barbados 3040 3020 59 12 29 30 27 3 3
Belize 2510 2710 67 11 23 37 39 4 4
Bolivia (Plur State) 2030 2100 71 11 18 43 47 9 7
Brazil 2760 3120 59 11 30 33 32 5 5 5 5
Chile 2600 2960 61 12 27 43 40 4 4
Colombia 2410 2690 66 10 24 33 34 8 6
Costa Rica 2820 2820 62 11 27 32 31 3 4
134
TABLE 16 Dietary energy supplies and changes in dietary composition (continued)Dietary energy supply per person Contribution in diets by type Contribution in diets by commodity
carbo-hydrates
proteins fats cereals starchy roots pulses
kcalcapday kcalcapday
1990-92 2006-08 2005-07 2005-07 2005-07 1990-92 2005-07 1990-92 2005-07 1990-92 2005-07
Cuba 2720 3420 73 10 17 34 40 5 7 4 7
Dominica 3000 3090 64 12 24 26 25 7 9
Dominican Republic 2160 2270 61 9 30 30 29 5 4
Ecuador 2110 2300 55 10 35 35 34
El Salvador 2400 2580 67 11 22 56 44 1 2 4 6
French Guiana
Grenada 2470 2400 54 12 34 28 22 2 3 3 3
Guatemala 2290 2150 67 11 23 58 51 6 4
Guyana 2300 2740 68 11 21 53 46 4 4 3 2
Haiti 1730 1850 74 9 17 44 46 11 9 8 5
Honduras 2300 2610 66 10 24 51 44 4 5
Jamaica 2510 2840 61 11 28 34 32 9 5
Mexico 3090 3260 62 11 26 47 44 4 4
Netherlands Antilles 3280 3260 64 11 24 36 36 4 3
Nicaragua 1770 2420 68 10 22 47 50 8 7
Panama 2320 2450 65 12 24 39 43 2 2
Paraguay 2390 2660 58 11 32 27 29 18 13 4 5
Peru 2110 2410 74 11 15 49 44 8 14 2 3
St Kitts amp Nevis 2580 2460 59 12 29 32 26 3 2 2 2
St Lucia 2580 2710 58 14 28 30 28 6 2
St Vincent amp Grenadines 2360 2860 64 11 25 30 33 7 5 2 2
Suriname 2440 2460 68 9 23 50 42 2 2
Trinidad amp Tobago 2610 2700 65 10 25 39 34 2 2 4 3
Uruguay 2660 2840 64 11 25 35 43 4 4
Venezuela (Boliv Rep of) 2460 2650 64 11 26 36 37 3 3
OCEANIA 2549 2850 60 10 30 32 34 15 14 3 2
Fiji 2640 3000 60 10 29 43 41 4 7 3 2
French Polynesia 2480 2880 48 14 39 25 31 5 4
New Caledonia 3210 3150 52 12 35 35 32 6 5
Papua New Guinea
Samoa 2550 2890 46 11 43 23 18 10 10
Solomon Islands 2120 2400 73 9 18 25 34 40 34 3 3
Tonga
Vanuatu 2530 2950 60 9 31 22 31 22 18
DEVELOPED REGIONS 3260 3426 53 12 35 29 28 5 5
NORTH AMERICA 3464 3728 49 12 38 23 22 3 3
Bermuda 2870 2650 48 12 40 19 24
Canada 3050 3530 51 12 37 21 25 4 4
United States of America 3510 3750 49 12 38 23 22 3 3
ASIA amp OCEANIA 2969 2892 56 13 31 36 35 3 3
Australia 3130 3220 46 13 40 22 22 3 3
Israel 3410 3530 49 14 37 35 33 2 2
Japan 2920 2800 58 13 29 39 38
New Zealand 2810 2810 54 12 34 23 24 3 4
EUROPE 3228 3401 54 12 34 30 30 6 5
Albania 2560 2890 58 14 29 57 40 1 2
Belarus 3180 3150 56 12 32 37 30 10 11
Bosnia amp Herzegovina 2670 3080 67 11 21 61 45 5 5
Croatia 2420 2990 57 11 32 30 31 7 4
European Union 3341 3453 51 12 37 26 28 5 4
Iceland 3090 3260 45 16 39 23 20 3 3
Macedonia FYR 2550 3060 55 10 34 44 34 3 3
Montenegro
Norway 3230 3450 51 12 36 27 28 5 4
Republic of Moldova 2880 2850 70 11 20 55 48 5 5
Russian Federation 2960 3320 63 12 25 40 36 8 7
Serbia
Switzerland 3370 3450 49 11 41 22 21
Ukraine 3040 3290 63 11 26 43 36 8 8
135
TABLE 17 Changes in dietary compositionContribution in diets by commodity
meat and fish dairy and eggs fruit and vegetables sugar vegetable oils other
1990-92 2005-07 1990-92 2005-07 1990-92 2005-07 1990-92 2005-07 1990-92 2005-07 1990-92 2005-07
WORLD 8 11 5 5 4 5 8 8 8 9 11 13
DEVELOPING REGIONS 7 10 4 4 4 5 7 7 7 8 10 12
AFRICA 4 4 5 6 6 6 6 6 9 9 11 11
North Africa 3 3 3 3 6 7 10 9 9 7 7 9
Algeria 3 3 6 6 3 5 9 9 14 10 6 8
Egypt 2 3 2 2 7 9 10 8 6 4 5 8
Libya 5 4 5 5 8 7 12 10 14 16 7 8
Morocco 3 3 4 6 10 11 8 8 11 10
Tunisia 3 3 4 5 6 6 9 10 15 14 6 10
Sub-Saharan Africa 4 4 7 7 6 6 5 5 9 9 12 12
Angola 5 5 7 8 14 12 12 10
Benin 2 2 6 8 13 14
Botswana 6 4 9 7 11 13 6 9 14 12
Burkina Faso 3 3 4 5 13 14
Burundi 10 15 17 15
Cameroon 3 3 10 8 3 4 8 8 15 12
Cape Verde 6 9 5 8 2 2 7 9 10 8 12 12
Central African Republic 7 8 4 4 3 4 14 14 15 14
Chad 4 4 5 5 24 22
Comoros 8 7 4 6 8 11 16 14
Congo 4 3 5 4 4 6 12 15 15 12
Cocircte drsquoIvoire 8 7 4 4 10 11 12 12
Congo Dem Rep 7 3 7 7 13 12
Djibouti 5 6 5 5 19 11 10 16 7 7
Equatorial Guinea
Eritrea 1 4 4 6 10 8
Ethiopia 3 2 2 3 7 9
Gabon 8 8 16 12 6 6 5 6 19 18
Gambia 2 2 17 12 13 17 13 13
Ghana 7 11 3 4 7 7 12 12
Guinea 13 10 4 5 11 14 8 10
Guinea-Bissau 4 4 4 3 1 6 13 12 9 7
Kenya 8 7 4 5 10 9 8 8 9 10
Lesotho 4 4 7 6 11 9
Liberia 4 4 2 3 16 19 11 8
Madagascar 6 4 3 3 3 3 3 4 11 8
Malawi 4 5 7 5 9 10
Mali 3 3 5 5 4 5 9 7 9 10
Mauritania 5 5 11 10 10 12 9 12 6 6
Mauritius 4 6 6 6 2 4 14 12 14 15 9 8
Mozambique 1 4 13 9 11 10
Namibia 6 6 4 5 16 10 2 7 6 9
Niger 4 5 3 3 2 3 3 5 8 10
Nigeria 3 3 2 3 13 13 12 14
Rwanda 21 18 2 4 14 12
Senegal 3 3 2 2 7 6 13 15 10 11
Seychelles 10 11 6 4 5 7 14 10 7 8 12 19
Sierra Leone 3 3 20 15 13 17
Somalia
Sudan 4 5 12 17 8 10 7 5 10 10
South Africa 8 9 3 3 12 10 8 12 16 12
Swaziland 5 6 4 5 3 3 15 13 7 6 9 12
Tanzania Utd Rep 3 6 3 5 5 7 13 12
Togo 9 10 13 12
Uganda 20 17 1 4 3 7 23 18
Zambia 3 3 8 6 4 6 7 10
Zimbabwe 3 4 11 12 8 10 14 16
136
TABLE 17 Changes in dietary composition (continued)Contribution in diets by commodity
meat and fish dairy and eggs fruit and vegetables sugar vegetable oils other
1990-92 2005-07 1990-92 2005-07 1990-92 2005-07 1990-92 2005-07 1990-92 2005-07 1990-92 2005-07
ASIA 8 12 3 4 3 4 6 6 7 8 9 12
Central Asia 7 7 9 10 2 4 5 6 9 9 8 9
Kazakhstan 10 9 8 13 1 3 6 9 5 8 9 9
Kyrgyzstan 11 7 12 12 2 4 6 9 4 5 3 7
Tajikistan 3 4 6 5 6 7 11 11 11 10
Turkmenistan 7 10 8 9 2 3 6 4 11 6 9 7
Uzbekistan 6 6 9 9 3 4 4 3 12 11 7 10
East Asia 9 14 1 2 3 5 4 4 6 7 9 13
Brunei Darussalam 9 8 7 9 5 5 12 13 7 8 12 12
Cambodia 5 5 1 4 2 3 8 12
China 9 15 1 2 3 6 3 2 6 7 8 13
Indonesia 2 3 6 6 7 8 12 14
Korea DPR 5 5 8 7 5 6 13 8
Korea Republic of 7 11 7 8 10 11 8 12 14 14
Lao PDR 4 5 2 5 1 2 9 14
Malaysia 12 11 4 3 3 3 13 12 14 12 9 10
Mongolia 30 17 8 11 8 6 1 6 9 10
Myanmar 2 6 2 2 3 6 10 9 8 12
Philippines 10 12 6 6 12 9 6 4 9 9
Singapore
Thailand 8 9 5 4 8 14 5 6 17 18
Viet Nam 6 12 4 5 3 4 2 3 9 10
South Asia 2 4 4 5 2 3 9 8 7 9 9 11
Afghanistan
Bangladesh 3 4 4 7 8 8
Bhutan
India 4 4 2 2 9 8 7 9 9 12
Iran (Islamic Rep) 3 5 3 3 8 12 9 9 9 7 5 7
Maldives 10 17 3 7 4 9 17 13 7 7 13 12
Nepal 3 4 1 2 6 7 10 10
Pakistan 2 3 9 12 12 12 10 11 9 12
Sri Lanka 3 3 3 2 11 11 3 4 17 19
West Asia 5 6 6 6 9 7 9 10 10 12 9 10
Armenia 6 8 7 10 8 13 4 8 2 5 6 7
Azerbaijan 5 4 7 6 5 3 6 6 1 4 8 11
Bahrain
Cyprus 12 13 10 10 8 7 12 13 13 15 14 18
Georgia 7 5 7 10 7 14 2 7 15 11
Iraq
Jordan 5 5 5 5 3 2 15 15 11 15 8 10
Kuwait 11 11 8 5 7 7 12 11 11 12 10 10
Lebanon 5 7 4 5 15 9 11 11 14 14 10 11
Occupied PalestinianTerritory
0 5 0 5 100 8 0 12 0 10 0 9
Saudi Arabia 7 7 5 5 10 10 10 10 13 12 7 8
Syrian Arab Republic 4 4 6 7 4 3 12 13 12 12 12 16
Turkey 6 6 8 8 8 8 11 14 9 10
United Arab Emirates 11 10 9 5 12 9 11 12 9 6 12 11
Yemen 3 4 2 3 10 12 9 10 7 7
LATIN AMERICA amp THECARIBBEAN
7 10 6 6 5 5 16 14 10 11 11 11
Argentina 17 17 8 9 14 16 11 11 15 13
Bahamas 18 17 7 6 9 9 16 15 3 6 18 18
Barbados 16 15 7 7 3 7 16 19 10 9 15 13
Belize 8 8 7 6 8 8 15 15 3 4 18 16
Bolivia (Plur State) 9 10 2 2 7 6 14 13 4 3 12 12
Brazil 8 12 6 7 4 4 17 13 13 13 9 9
Chile 9 14 6 5 3 3 15 14 9 8 11 12
Colombia 7 7 7 8 7 7 19 17 9 11 10 10
Costa Rica 5 5 8 10 6 5 21 19 12 12 13 14
137
TABLE 17 Changes in dietary composition (continued)Contribution in diets by commodity
meat and fish dairy and eggs fruit and vegetables sugar vegetable oils other
1990-92 2005-07 1990-92 2005-07 1990-92 2005-07 1990-92 2005-07 1990-92 2005-07 1990-92 2005-07
Cuba 6 5 6 3 4 6 21 15 9 6 11 11
Dominica 10 11 9 9 11 12 15 14 8 5 14 15
Dominican Republic 6 9 5 4 13 9 15 16 15 16 11 13
Ecuador 6 10 7 7 11 10 9 8 18 17 14 14
El Salvador 2 4 5 7 4 4 15 15 5 6 8 12
French Guiana
Grenada 10 15 10 9 8 7 17 16 9 11 13 14
Guatemala 2 4 3 3 2 3 17 15 6 9 6 11
Guyana 3 6 3 6 1 3 14 13 4 7 15 13
Haiti 3 4 8 6 10 12 5 7 11 11
Honduras 3 6 5 7 5 6 16 17 9 9 7 6
Jamaica 7 8 4 6 5 7 20 16 10 12 11 14
Mexico 6 9 5 5 3 4 16 15 8 8 11 11
Netherlands Antilles 15 13 8 6 10 18 7 6 20 18
Nicaragua 3 4 4 5 14 15 9 9 15 10
Panama 6 8 7 7 5 4 14 12 11 8 16 16
Paraguay 12 9 4 4 4 3 9 9 8 12 14 16
Peru 3 4 3 4 4 6 12 9 5 5 14 11
St Kitts amp Nevis 11 13 8 8 2 3 15 17 13 11 14 18
St Lucia 16 20 8 8 8 7 14 13 3 5 15 17
St Vincent amp Grenadines 11 12 5 5 4 6 18 17 9 8 14 12
Suriname 7 8 7 6 15 18 7 12 12 12
Trinidad amp Tobago 5 7 6 7 3 3 19 21 11 10 11 13
Uruguay 20 10 10 7 2 3 11 13 6 8 12 12
Venezuela (Boliv Rep of) 6 9 6 4 7 4 15 16 15 14 12 13
OCEANIA 11 10 6 7 4 4 7 8 8 8 22 21
Fiji 12 11 7 10 12 10 19 19
French Polynesia 18 19 6 6 2 2 11 7 9 11 24 20
New Caledonia 11 10 7 8 2 3 11 8 12 13 16 21
Papua New Guinea
Samoa 19 17 5 8 9 9 2 7 32 31
Solomon Islands 4 3 4 4 2 4 22 18
Tonga
Vanuatu 10 8 6 5 4 6 6 5 30 27
DEVELOPED REGIONS 11 11 9 9 4 4 13 13 12 14 19 18
NORTH AMERICA 12 12 11 10 3 3 17 17 16 18 16 15
Bermuda 19 17 6 6 11 6 11 14 10 12 24 21
Canada 11 10 8 6 7 6 14 14 14 16 21 19
United States of America 12 12 11 10 3 3 17 17 16 18 15 15
ASIA amp OCEANIA 12 12 8 7 3 4 12 10 11 14 18 17
Australia 15 15 12 10 3 4 15 13 13 16 17 17
Israel 8 12 7 6 9 9 12 7 14 19 13 12
Japan 12 12 7 7 3 3 11 10 10 13 18 17
New Zealand 13 15 9 4 7 8 16 17 7 7 22 21
EUROPE 11 10 9 9 5 5 11 12 10 12 20 19
Albania 4 8 12 18 5 10 6 7 8 6 7 9
Belarus 11 11 11 7 1 3 10 11 4 11 16 16
Bosnia amp Herzegovina 4 4 6 10 5 8 4 6 2 6 13 16
Croatia 6 7 10 11 4 4 17 13 8 13 18 17
European Union 12 11 9 9 5 5 11 11 12 14 22 19
Iceland 17 21 14 16 3 4 18 13 5 6 17 17
Macedonia FYR 9 7 5 6 8 7 12 12 5 14 14 17
Montenegro
Norway 14 14 11 9 3 4 13 12 10 11 17 18
Republic of Moldova 5 4 8 11 2 2 9 12 5 6 11 12
Russian Federation 10 8 8 8 12 13 5 9 17 19
Serbia
Switzerland 16 14 12 11 4 3 13 17 11 13 22 21
Ukraine 7 6 8 9 13 15 7 10 14 16
138
TABLE 18 Health effects of malnutritionShare of children under 5 share of
lowweightnewborns
Share of adults Dietaryironsupply
underweightstunted wasted total with
low BMIwomenwith lowBMI
overweight or obese per person
male female mg day
2009 2009 2009 2009 2009 2009 2009 2009 2005-07
WORLD 18 28 9 13 91 129 145
DEVELOPING REGIONS 20 30 10 14 64 107 144
AFRICA 22 39 10 111 65 135 152
North Africa 7 24 7 10 172 361 163
Algeria 4 16 4 6 107 243 136
Egypt 7 31 8 13 16 225 463 177
Libya 6 21 7 215 413 140
Morocco 10 23 11 53 73 111 231 163
Tunisia 3 9 3 5 139 334 157
Sub-Saharan Africa 25 42 11 126 44 92 150
Angola 28 51 8 38 102 98
Benin 20 45 8 15 92 35 95 154
Botswana 11 29 6 13 30 228 147
Burkina Faso 26 35 11 16 208 17 30 242
Burundi 39 63 8 11 28 37 135
Cameroon 17 36 7 11 67 70 151 158
Cape Verde 6 63 153 121
Central African Republic 22 45 11 13 153 20 53 123
Chad 37 45 16 22 203 24 38 180
Comoros 25 7 13 25 105 35 53 92
Congo 12 31 8 13 132 28 75 120
Cocircte drsquoIvoire 17 40 9 17 82 39 97 111
Congo Dem Rep 28 46 14 185 07 30 84
Djibouti 30 33 26 10 67 138 102
Equatorial Guinea 11 35 3 79 148
Eritrea 35 44 15 14 13 23 132
Ethiopia 35 51 12 20 09 16 154
Gabon 9 26 4 66 84 215 155
Gambia 16 28 7 20 23 144 113
Ghana 14 29 9 13 164 86 44 117 140
Guinea 23 39 11 132 43 51 107
Guinea-Bissau 17 48 9 26 81 91
Kenya 16 35 7 8 123 25 68 134
Lesotho 17 45 6 57 31 266 164
Liberia 20 39 8 14 100 31 77 117
Madagascar 37 53 15 16 192 18 15 113
Malawi 16 53 4 14 92 26 62 162
Mali 28 39 15 135 24 68 187
Mauritania 23 29 13 130 43 233 133
Mauritius 15 10 14 14 129 230 132
Mozambique 21 47 5 15 86 26 78 88
Namibia 18 30 8 16 159 43 168 140
Niger 40 55 12 192 15 37 235
Nigeria 27 41 14 12 122 51 90 196
Rwanda 18 52 5 6 98 49 40 174
Senegal 15 20 9 19 182 32 125 113
Seychelles 6 5 2 151 337 153
Sierra Leone 21 37 11 14 112 36 101 114
Somalia 33 42 13 34 71
Sudan 32 38 21 41 89 157
South Africa 86 232 428 143
Swaziland 6 30 3 9 32 61 371 138
Tanzania Utd Rep 17 44 4 104 40 68 147
Togo 22 28 16 109 30 61 131
Uganda 16 39 6 14 121 43 49 145
Zambia 15 46 6 11 96 12 70 113
Zimbabwe 14 36 7 99 92 28 138 143
139
TABLE 18 Health effects of malnutrition (continued)Share of children under 5 share of
lowweightnewborns
Share of adults Dietaryironsupply
underweightstunted wasted total with
low BMIwomenwith lowBMI
overweight or obese per person
male female mg day
2009 2009 2009 2009 2009 2009 2009 2009 2005-07
ASIA 22 30 11 15 45 75 143
Central Asia 7 21 5 6 68 150 206 113
Kazakhstan 7 18 4 6 74 202 274 133
Kyrgyzstan 3 18 3 5 37 69 117 216 120
Tajikistan 15 33 9 10 80 116 127
Turkmenistan 12 22 6 4 99 139 145 98
Uzbekistan 4 20 5 5 59 145 198 99
East Asia 9 19 5 4 43 67 174
Brunei Darussalam 85 72 174
Cambodia 29 40 9 9 161 16 28 104
China 5 14 3 3 80 46 65 200
Indonesia 20 40 15 25 69 102
Korea DPR 18 45 9 37 39 156
Korea Republic of 1 3 1 47 65 69 77 218
Lao PDR 32 48 7 11 135 145 17 41 121
Malaysia 17 21 15 11 96 104 179 158
Mongolia 5 28 3 5 49 39 119 207 111
Myanmar 30 41 11 20 61 124
Philippines 21 32 7 21 123 142 45 83 99
Singapore 3 4 4 8 92 146 66 62
Thailand 7 16 5 192 49 118 117
Viet Nam 20 1 10 5 265 12 20 130
South Asia 40 46 18 27 329 21 42 106
Afghanistan 33 59 9 15 33
Bangladesh 41 43 18 297 10 13 81
Bhutan 12 38 5 9 47 66
India 44 48 20 28 329 356 13 25 108
Iran (Islamic Rep) 10 20 6 7 57 54 136 295 135
Maldives 18 20 10 65 261 177
Nepal 39 49 13 21 244 14 16 152
Pakistan 31 42 14 32 312 316 35 84 89
Sri Lanka 22 19 12 17 162 26 73 118
West Asia 10 23 6 224 356 144
Armenia 4 18 5 7 52 144 302 118
Azerbaijan 8 27 7 10 48 158 321 120
Bahrain 8 14 7 289 382
Cyprus 43 69 248 219 188
Georgia 2 15 3 5 159 257 105
Iraq 7 28 6 15 223 362
Jordan 2 8 2 13 30 39 273 417 112
Kuwait 2 4 2 7 25 07 372 524 172
Lebanon 4 17 7 264 297 161
Occupied PalestinianTerritory
2 12 2 102
Saudi Arabia 5 9 12 70 49 295 435 159
Syrian Arab Republic 10 28 12 9 238 390 133
Turkey 4 16 1 11 35 16 228 356 158
United Arab Emirates 302 430 196
Yemen 43 58 15 252 105 227 103
LATIN AMERICA amp THECARIBBEAN
4 14 2 8 30 190 279 140
Argentina 2 8 1 7 34 274 310 122
Bahamas 11 267 426 174
Barbados 5 10 4 14 32 33 216 442 192
Belize 5 22 2 14 244 454 167
Bolivia (Plur State) 5 27 1 6 20 100 271 102
Brazil 2 7 2 8 40 35 165 221 137
Chile 1 2 0 08 11 245 336 138
Colombia 3 13 1 6 39 119 237 112
Costa Rica 1 6 1 7 209 283 140
140
TABLE 18 Health effects of malnutrition (continued)Share of children under 5 share of
lowweightnewborns
Share of adults Dietaryironsupply
underweightstunted wasted total with
low BMIwomenwith lowBMI
overweight or obese per person
male female mg day
2009 2009 2009 2009 2009 2009 2009 2009 2005-07
Cuba 5 73 62 133 275 186
Dominica 10 101 391 177
Dominican Republic 3 10 2 11 144 293 100
Ecuador 6 29 2 10 19 157 282 81
El Salvador 7 21 2 29 202 329 157
French Guiana
Grenada 9 149 321 137
Guatemala 13 48 1 20 138 267 131
Guyana 11 18 8 83 271 127
Haiti 19 30 10 155 84 84 99
Honduras 9 30 1 10 40 129 263 140
Jamaica 3 5 5 100 382 150
Mexico 4 15 2 8 14 267 384 178
Netherlands Antilles 128
Nicaragua 6 23 2 37 168 313 136
Panama 6 22 1 10 36 194 321 117
Paraguay 3 18 1 162 223 139
Peru 5 28 1 19 111 217 158
St Kitts amp Nevis 11 320 494 153
St Lucia 12 15 8 11 119 319 158
St Vincent amp Grenadines 8 164 335 130
Suriname 8 11 5 11 165 346 98
Trinidad amp Tobago 4 5 5 19 216 380 134
Uruguay 6 14 3 8 207 260 113
Venezuela (Boliv Rep of) 4 16 5 8 266 348 114
OCEANIA 17 42 4 11 158 265
Fiji 10 61 56 213 422 179
French Polynesia 195
New Caledonia 183
Papua New Guinea 18 44 4 11 118 201
Samoa 2 4 1 453 667 175
Solomon Islands 16 34 7 13 19 253 392 137
Tonga 3 491 703
Vanuatu 12 26 6 10 19 29 229 368 167
DEVELOPED REGIONS 216 230 149
NORTH AMERICA 1 4 1 296 323 142
Bermuda 148
Canada 26 246 239 165
United States of America 1 4 1 24 302 332 139
ASIA amp OCEANIA 3 8 1 94 96 82 191
Australia 7 10 28 252 249 149
Israel 8 232 276 197
Japan 3 8 1 115 108 55 35 199
New Zealand 6 13 16 262 277 152
EUROPE 205 219 144
Albania 6 23 9 217 205 128
Belarus 1 5 2 4 197 264 148
Bosnia amp Herzegovina 2 12 4 5 227 253 202
Croatia 0 1 2 5 02 228 194 116
European Union 215 196 148
Iceland 4 23 30 234 203 208
Macedonia FYR 2 12 3 6 216 189 130
Montenegro 2 8 4 228 207
Norway 5 50 70 216 179 158
Republic of Moldova 3 11 5 6 59 100 288 142
Russian Federation 6 184 298 134
Serbia 2 8 5 6 255 203
Switzerland 35 59 183 116 126
Ukraine 4 23 8 4 54 155 236 127
141
TABLE 19 Trade and food security - caloric self-sufficiencyCaloric self-sufficiency
pa
1970 1980 1990 2000 2009 growth1970-2009
WORLD 1002 1002 1002 1002 1006 00
DEVELOPING REGIONS 997 968 983 964 948 minus04
AFRICA 1021 883 866 821 822 minus06
North Africa 901 638 660 668 761 minus13
Algeria 860
Egypt 930 602 605 668 827 minus03
Libya
Morocco 939 721 813 643 minus10
Tunisia 703 669 612 608 minus04
Sub-Saharan Africa 1044 957 962 920 873 minus06
Angola 1137 697 652 731 779 minus10
Benin 1107 1022 898 992 909 minus05
Botswana
Burkina Faso 1004 967 941 911 922 minus02
Burundi 985 968 981 971 891 minus03
Cameroon 1037 997 977 926 888 minus04
Cape Verde
Central African Republic 964 981 937 951 924 minus01
Chad 968 984 952 970 930 minus01
Comoros 901 825 701 783 692 minus07
Congo 1272 799 880 607 908 minus09
Cocircte drsquoIvoire 1044 1074 1205 1203 1092 01
Congo Dem Rep 1025 962 961 953 879 minus04
Djibouti
Equatorial Guinea 1483 1049 879 835 694 minus19
Eritrea 678
Ethiopia 899 908
Gabon 851 802 763 630 588 minus09
Gambia 1462 1241 703 638 535 minus25
Ghana 1041 990 977 986 939 minus03
Guinea 977 914 863 879 879 minus03
Guinea-Bissau 1055 950 881 871 1048 minus00
Kenya 1004 901 899 742 610 minus13
Lesotho 712 535 536
Liberia 878 823 855 654 707 minus06
Madagascar 1047 975 981 900 918 minus03
Malawi 970 1077 944 994 989 00
Mali 971 970 969 939 940 minus01
Mauritania 682
Mauritius 1057 815
Mozambique 1148 928 811 866 824 minus08
Namibia 691 650 555 564 minus05
Niger 1199 991 941 882 945 minus06
Nigeria 1049 871 982 940 900 minus04
Rwanda 982 977 951 927 890 minus03
Senegal 1095 839 866 817 686 minus12
Seychelles 1055 547
Sierra Leone 946 888 840 751 898 minus01
Somalia 921 765 851 693 524 minus14
Sudan 998 1027 935 923 795 minus06
South Africa 1173 1325 1107 980 940 minus06
Swaziland 2814 1201 minus22
Tanzania Utd Rep 1027 947 1001 902 914 minus03
Togo 1066 966 910 940 840 minus06
Uganda 1010 979 999 965 933 minus02
Zambia 797 711 901 976 1005 06
Zimbabwe 1242 1039 1307 1094 538 minus21
142
TABLE 19 Trade and food security - caloric self-sufficiency (continued)Caloric self-sufficiency
pa
1970 1980 1990 2000 2009 growth1970-2009
ASIA 980 970 987 969 943 03
Central Asia 1138 1002
Kazakhstan 1628 1235
Kyrgyzstan 918 808
Tajikistan 625 574
Turkmenistan 939 895
Uzbekistan 833 841
East Asia 995 982 1017 997 970 minus01
Brunei Darussalam
Cambodia 1075 883 990 939 951 minus03
China 982 953 963 970 895 minus02
Indonesia 1002 964 1036 1039 1247 06
Korea DPR 920 943 906 635 903 minus00
Korea Republic of 755 533
Lao PDR 904 982 987 976 1027 03
Malaysia 925 1336 1540 1340 1455 12
Mongolia 791 845 929 586 627 minus06
Myanmar 1094 1054 1009 1019 1003 minus02
Philippines 1245 1204 1012 922 893 minus08
Singapore
Thailand 1296 1552 1784 1390 1421 02
Viet Nam 797 932 1094 1074 961 05
South Asia 969 955 957 934 906 minus02
Afghanistan 968 984 881 680 812 minus04
Bangladesh 901 894 906 848 800 minus03
Bhutan 834 936 776 707 952 03
India 979 983 1000 986 957 minus01
Iran (Islamic Rep) 958 714 690 606 650 minus10
Maldives
Nepal 1092 991 982 943 920 minus04
Pakistan 991 982 900 926 909 minus02
Sri Lanka 717 792 778 682 721 00
West Asia 868 890 824 876 832
Armenia 539
Azerbaijan 693 734
Bahrain
Cyprus 631
Georgia
Iraq 858
Jordan
Kuwait
Lebanon
Occupied PalestinianTerritory
Saudi Arabia 692
Syrian Arab Republic 724 841 657 679 560 minus07
Turkey 966 1018 921 955 933 minus01
United Arab Emirates
Yemen 709 543
LATIN AMERICA amp THECARIBBEAN
1078 1040 1049 1026 1125 minus06
Argentina 1708 1895 2095 2454 2736 12
Bahamas
Barbados 1754 597 514
Belize 2460 1539
Bolivia (Plur State) 827 870 1024 1201 1421 14
Brazil 1058 1071 1123 1124 1406 07
Chile 843 677 964 680 697 minus05
Colombia 982 925 965 839 783 minus06
Costa Rica 1170 1086 1007 949 910 minus06
143
TABLE 19 Trade and food security - caloric self-sufficiency (continued)Caloric self-sufficiency
pa
1970 1980 1990 2000 2009 growth1970-2009
Cuba 2382 2213 1486 594
Dominica 941 555 527 517 minus15
Dominican Republic 2375 1259 815 508 538 minus37
Ecuador 1080 982 989 1015 1008 minus02
El Salvador 974 880 804 664 701 minus08
French Guiana
Grenada 776 653 501
Guatemala 1000 1099 1054 1267 1199 05
Guyana 2957 2046 1337 2674 1695 minus14
Haiti 958 818 652 528 510 minus16
Honduras 1124 1096 1010 868 880 minus06
Jamaica 1124 559 565
Mexico 997 771 744 669 696 minus09
Netherlands Antilles
Nicaragua 1195 867 913 937 951 minus06
Panama 1103 1105 922 637 544 minus18
Paraguay 1035 1132 1580 1663
Peru 952 636 668 684 661 minus09
St Kitts amp Nevis 1537 1019 524
St Lucia 1012 892 919
St Vincent amp Grenadines 827 517 826
Suriname 834 1163 886 793 792 minus01
Trinidad amp Tobago 1058
Uruguay 1106 1210 1663 1350 2324 19
Venezuela (Boliv Rep of) 724 616 584 619 minus04
OCEANIA 1177 1169 1342 1388 1369 minus04
Fiji 2610 1943 1322
French Polynesia 915 860 600
New Caledonia
Papua New Guinea 1162 1127 1192 1354 1431 05
Samoa 1172 1340 931 836 729 minus12
Solomon Islands 1331 1745 1903 1340 1222 minus02
Tonga 1216 1160 810 793 759 minus12
Vanuatu 1555 1329 1392 1323 1078 minus09
DEVELOPED REGIONS 1064 1190 1181 1122 1140 18
NORTH AMERICA 1260 1612 1353 1321 1290 01
Bermuda
Canada 1585 1717 1538 1607 1832 04
United States of America 1226 1599 1328 1286 1238 00
ASIA amp OCEANIA 2321 1787 2667 2720 2040 minus02
Australia 2416 2907 2931 2075 minus04
Israel
Japan
New Zealand 1833 1787 1443 1646 1859 00
EUROPE 913 873 935 967 1012 03
Albania 875 973 792 601 615 minus09
Belarus 775 1036
Bosnia amp Herzegovina 548 625
Croatia 1016 1086
European Union 851 877 982 987 925 02
Iceland
Macedonia FYR 727 681
Montenegro
Norway 588 621 714 643 501 minus04
Republic of Moldova 1074 1333
Russian Federation 884 1131
Serbia 1262
Switzerland 551 716 662 627
Ukraine 1081 1933
144
TABLE 20 Trade and food security - import billsFood import bills Food + energy import bills share of GDP
total per capita
millionUS$
millionUS$
pa US$ US$ pa pa
2000 2010 growth2000-2010
2000 2010 growth2000-2010
2000 2010 growth2000-2010
WORLD 3980557 10296380 100 651 1495 87 33 58 58
DEVELOPING REGIONS 1162631 3731805 124 236 660 108 44 73 52
AFRICA 179991 597794 128 222 585 102 57 82 38
North Africa 87973 250019 110 620 1507 93 53 86 50
Algeria 25413 78633 120 832 2217 103 49 60 20
Egypt 32784 97155 115 485 1198 95 44 89 74
Libya 7941 15315 68 1518 2410 47 28 42 41
Morocco 15154 40877 104 526 1279 93 96 142 40
Tunisia 6546 18039 107 692 1721 95 72 96 29
Sub-Saharan Africa 92018 347775 142 138 406 114 60 80 30
Angola 6384 22925 136 458 1201 101 92 33 minus97
Benin 1120 6475 192 172 732 156 92 166 61
Botswana 2561 5778 85 1457 2879 70 63 120 66
Burkina Faso 931 2586 107 76 157 76 89 79 minus12
Burundi 270 1011 141 42 121 110 69 109 47
Cameroon 2542 11843 166 162 604 141 60 89 41
Cape Verde 593 1768 115 1357 3566 101 137 166 20
Central African Republic 242 719 115 65 163 96 32 62 70
Chad 415 2940 216 51 262 179 37 67 61
Comoros 119 605 177 211 823 146 80 128 48
Congo 995 7212 219 317 1784 188 34 83 94
Cocircte drsquoIvoire 3884 15493 148 234 785 129 117 150 25
Congo Dem Rep 2055 7116 132 41 108 101 68 84 21
Djibouti 374 1080 112 511 1215 90 73 118 49
Equatorial Guinea 332 2025 198 639 2893 163 65 189 112
Eritrea 1741 2244 26 475 427 minus10 257 143 minus57
Ethiopia 818 10336 289 12 125 259 41 88 79
Gabon 1380 4160 117 1117 2764 95 33 47 38
Gambia 613 958 46 473 555 16 138 147 07
Ghana 3348 16092 170 175 660 142 133 118 minus12
Guinea 1047 2455 89 125 246 70 72 122 55
Guinea-Bissau 97 670 213 78 442 189 35 125 135
Kenya 3846 14908 145 123 368 116 83 140 53
Lesotho 1226 2628 79 624 1210 68 343 155 minus77
Liberia 86 144 52 30 36 17 49 58 17
Madagascar 1207 3988 127 79 193 94 87 92 06
Malawi 518 1664 124 46 112 92 60 82 33
Mali 1144 4073 135 101 265 101 114 106 minus07
Mauritania 1071 5483 177 405 1585 146 141 272 68
Mauritius 2822 8861 121 2360 6821 112 111 181 50
Mozambique 1931 5066 101 106 217 74 75 112 40
Namibia 2126 3940 64 1121 1726 44 64 63 minus01
Niger 558 4720 238 51 304 195 80 170 78
Nigeria 14703 57626 146 119 364 118 41 47 12
Rwanda 425 2459 192 52 231 160 40 60 41
Senegal 3349 10256 118 352 825 89 146 192 28
Seychelles 304 1867 199 3850 21458 187 170 521 118
Sierra Leone 413 1694 152 100 289 112 131 264 73
Somalia 1411 6048 157 191 648 130
Sudan 3594 14751 152 105 339 124 37 29 minus25
South Africa 11075 40750 139 247 813 126 37 70 65
Swaziland 1792 4013 84 1684 3384 72 207 140 minus38
Tanzania Utd Rep 2208 7585 131 65 169 101 54 142 101
Togo 714 2051 111 149 340 86 131 208 48
Uganda 1766 5306 116 73 159 81 66 80 20
Zambia 694 2334 129 68 178 101 55 66 20
Zimbabwe 759 7845 263 61 624 263 226
145
TABLE 20 Trade and food security - import bills (continued)Food import bills Food + energy import bills share of GDP
total per capita
millionUS$
millionUS$
pa US$ US$ pa pa
2000 2010 growth2000-2010
2000 2010 growth2000-2010
2000 2010 growth2000-2010
ASIA 714793 2459868 132 199 611 118 51 82 50
Central Asia 9547 39240 152 172 646 141 54 56 04
Kazakhstan 3726 17041 164 249 1063 156 50 38 minus27
Kyrgyzstan 635 4573 218 128 857 209 140 280 71
Tajikistan 652 4582 215 106 666 202 309 204 minus41
Turkmenistan 1803 4291 91 400 851 78 40
Uzbekistan 2732 8754 124 110 319 112 37 51 32
East Asia 409084 1480333 137 216 725 129 57 88 44
Brunei Darussalam 1727 4502 101 5282 11283 79 29 46 47
Cambodia 938 5678 197 75 402 182 117 167 37
China 207426 837460 150 160 610 143 35 61 57
Indonesia 53 73 33
Korea DPR 2315 2171 minus06 101 89 minus12
Korea Republic of 71923 215999 116 1564 4483 111 85 156 63
Lao PDR 481 1632 130 91 263 113 67 92 32
Malaysia 33406 120525 137 1427 4244 115 78 147 66
Mongolia 778 3684 168 323 1337 153 179 207 15
Myanmar 2184 4950 85 49 103 78 65 40 minus48
Philippines 24056 58852 94 311 631 73 86 90 05
Singapore 32231 80440 96 8224 15816 68 206 448 81
Thailand 24502 82275 129 388 1190 119 81 151 64
Viet Nam 7115 60078 238 90 684 224 91 159 58
South Asia 95776 322413 129 66 189 112 34 83 94
Afghanistan 4174 6659 48 183 212 15 96
Bangladesh 11087 53509 170 86 360 154 37 76 74
Bhutan 220 1100 175 385 1515 147 85 159 65
India 31571 124317 147 30 102 130 26 93 136
Iran (Islamic Rep) 22803 62356 106 349 843 92 28 35 23
Maldives 774 1624 77 2834 5138 61 155 208 30
Nepal 1752 5754 126 72 192 103 72 107 41
Pakistan 15200 48709 124 105 281 103 69 100 38
Sri Lanka 8195 18386 84 437 881 73 83 93 11
West Asia 200387 617881 119 1130 2765 94 44 60 33
Armenia 1753 5934 130 570 1919 129 161 132 minus20
Azerbaijan 1996 9581 170 246 1043 155 49 24 minus68
Bahrain 7491 12547 53 11742 9942 minus16 104 73 minus35
Cyprus 3369 9773 112 3572 8852 95 89 115 26
Georgia 1434 8223 191 302 1889 201 92 157 55
Iraq 33338 83450 96 1397 2635 65 153
Jordan 8045 23347 112 1667 3774 85 118 227 68
Kuwait 9231 34226 140 4756 12505 102 26 32 24
Lebanon 9576 27103 110 2559 6410 96 115 159 33
Occupied PalestinianTerritory
4541 6448 36 1420 1596 12
Saudi Arabia 49863 148133 115 2488 5397 81 27 40 41
Syrian Arab Republic 6831 24656 137 427 1208 110 43 110 99
Turkey 17633 69629 147 277 957 132 35 55 46
United Arab Emirates 31295 98922 122 10318 13168 25 36 50 32
Yemen 7901 29831 142 446 1240 108 110 191 57
LATIN AMERICA amp THECARIBBEAN
258747 650107 97 496 1102 83 27 43 47
Argentina 11905 20384 55 322 504 46 07 14 66
Bahamas 2826 4630 51 9483 13498 36 89 147 51
Barbados 1080 3170 114 4028 11610 112 75 129 55
Belize 591 850 37 2353 2724 15 182 155 minus16
Bolivia (Plur State) 2394 3798 47 288 383 29 39 59 42
Brazil 35101 78639 84 201 403 72 18 24 25
Chile 11818 44242 141 766 2585 129 56 113 73
Colombia 13256 38065 111 333 822 94 16 25 49
Costa Rica 4059 11415 109 1036 2450 90 59 96 51
146
TABLE 20 Trade and food security - import bills (continued)Food import bills Food + energy import bills share of GDP
total per capita
millionUS$
millionUS$
pa US$ US$ pa pa
2000 2010 growth2000-2010
2000 2010 growth2000-2010
2000 2010 growth2000-2010
Cuba 7509 18935 97 676 1682 95
Dominica 273 460 54 3896 6759 57 153 222 38
Dominican Republic 7653 18710 94 891 1885 78 97 108 11
Ecuador 2997 17957 196 243 1241 177 36 83 89
El Salvador 6871 13533 70 1157 2185 66 98 128 27
French Guiana
Grenada 391 570 38 3836 5481 36 140 161 14
Guatemala 5612 17487 120 499 1215 93 69 113 51
Guyana 1074 1680 46 1466 2229 43 186 253 31
Haiti 3301 14633 161 382 1464 144 100 246 94
Honduras 5388 11595 80 866 1526 58 127 188 40
Jamaica 4677 7485 48 1811 2731 42 117 209 60
Mexico 82457 186109 85 825 1641 71 20 48 91
Netherlands Antilles 1124 1466 27 6243 7292 16
Nicaragua 2562 7105 107 505 1228 93 141 278 70
Panama 3690 9770 102 1248 2778 83 86 51 minus51
Paraguay 1585 4199 102 297 651 82 72 114 46
Peru 8304 29975 137 321 1031 124 37 57 44
St Kitts amp Nevis 314 487 45 6828 9373 32 141 131 minus07
St Lucia 571 274 minus71 3639 1572 minus80 184 492 103
St Vincent amp Grenadines 398 708 59 3683 6494 58 163 271 52
Suriname 582 2033 133 1247 3873 120 99 107 08
Trinidad amp Tobago 2561 7088 107 1983 5286 103 162 130 minus22
Uruguay 3455 8785 98 1041 2608 96 38 102 103
Venezuela (Boliv Rep of) 17548 60738 132 721 2096 113 20 22 13
OCEANIA 9099 24035 102 1122 2414 80 336 346 03
Fiji 1023 2604 98 1259 3025 92 90 257 111
French Polynesia 1886 3682 69 7924 13585 55
New Caledonia 1242 3050 94 5859 12151 76
Papua New Guinea 1789 6057 130 333 883 103 116 141 20
Samoa 250 722 112 1411 3948 108 178 227 25
Solomon Islands 101 862 240 246 1602 206 87 271 120
Tonga 131 490 141 1341 4710 134 126 282 84
Vanuatu 124 507 151 672 2111 121 75 169 85
DEVELOPED REGIONS 2817926 6564575 88 2361 5288 84 30 51 56
NORTH AMERICA 523687 1042686 71 1672 3026 61 19 33 55
Bermuda 313 1349 157 4964 20751 154
Canada 107827 241046 84 3516 7086 73 32 47 40
United States of America 414893 798725 68 1469 2573 58 18 31 56
ASIA amp OCEANIA 41 3163 4565 37 26 48 63
Australia 25799 82915 124 1346 3724 107 20 35 56
Israel 17637 46462 102 2932 6263 79 43 34 minus22
Japan 436892 575640 28 3475 4549 27 26 51 70
New Zealand 9144 28151 119 2370 6445 105 44 63 35
EUROPE 1804766 4788721 103 2488 6500 101 44 68 44
Albania 1978 6375 124 644 1990 119 81 105 26
Belarus 9010 24432 105 896 2546 110 335 294 minus13
Bosnia amp Herzegovina 6704 14597 81 1815 3882 79 166 157 minus05
Croatia 5845 19002 125 1297 4316 128 81 90 10
European Union 1630103 4127225 97 3385 8245 93 44 70 47
Iceland 2054 3803 64 7310 11886 50 51 74 37
Macedonia FYR 2299 6631 112 1144 3217 109 145 156 08
Montenegro 4438 7033 173
Norway 19698 53402 105 4386 10936 96 19 27 38
Republic of Moldova 518 4516 242 126 1264 259 189 181 minus04
Russian Federation 83028 391496 168 566 2739 171 40 36 minus11
Serbia 8668 879 92
Switzerland 34857 82665 90 4863 10786 83 29 43 41
Ukraine 6999 48454 213 143 1066 222 214 208 minus03
147
TABLE 21 Dimensions of povertyPoverty gap at Poverty headcount ratio Multi-
dimensional
$125 aday (ppp)
$2 a day(ppp)
nationalpovertyline
ruralpovertyline
$125 aday (ppp)
$2 a day(ppp)
nationalpovertyline
ruralpovertyline
poverty(MPI)
0 to 1
2009 2009 2009 2009 2009 2009 2009 2009 2009
WORLD
DEVELOPING REGIONS
AFRICA
North Africa
Algeria 14 65 32 45 68 236 226 303
Egypt 04 35 36 20 185 220 300 00
Libya
Morocco 05 31 25 140 90 145 00
Tunisia 05 30 25 128 38 00
Sub-Saharan Africa
Angola 299 424 543 702 05
Benin 157 335 120 140 473 753 390 460 04
Botswana 110 223 117 184 312 494 306 448
Burkina Faso 203 393 153 176 565 812 464 524 05
Burundi 364 561 234 242 813 935 669 689 05
Cameroon 12 82 123 175 96 304 399 550 03
Cape Verde 60 152 81 143 210 409 266 443
Central African Republic 313 468 331 350 628 801 620 694 05
Chad 256 439 216 233 619 833 550 586 03
Comoros 208 342 163 178 461 650 448 487 04
Congo 228 388 189 206 541 744 501 577 02
Cocircte drsquoIvoire 75 178 153 203 238 463 427 542 04
Congo Dem Rep 253 424 322 349 592 796 713 757 04
Djibouti 53 146 188 412 01
Equatorial Guinea
Eritrea 690
Ethiopia 96 289 83 85 390 776 389 393 06
Gabon 09 50 100 160 48 196 327 446 02
Gambia 121 249 251 305 343 567 580 678 03
Ghana 105 223 96 135 300 536 285 392 01
Guinea 150 310 176 220 433 696 530 630 05
Guinea-Bissau 165 348 250 278 488 779 647 691
Kenya 61 151 163 175 197 399 459 491 02
Lesotho 208 331 379 265 434 623 566 605 02
Liberia 408 595 244 263 837 948 638 677 05
Madagascar 265 469 268 289 678 896 687 735 04
Malawi 323 518 80 86 739 905 524 559 04
Mali 188 365 167 514 771 474 576 06
Mauritania 57 159 170 241 212 441 463 612 04
Mauritius
Mozambique 252 429 212 222 600 816 547 569 05
Namibia 246 365 130 160 491 622 380 490 02
Niger 119 306 196 212 431 759 595 639 06
Nigeria 296 469 228 266 644 839 547 638 03
Rwanda 409 572 240 260 768 896 585 642 04
Senegal 108 247 164 215 335 604 508 619 04
Seychelles 01 03 02 18
Sierra Leone 203 375 275 346 534 761 664 785 04
Somalia 05
Sudan
South Africa 33 123 70 174 357 230 01
Swaziland 294 458 329 370 629 810 692 750 02
Tanzania Utd Rep 281 475 99 110 679 879 334 374 04
Togo 114 279 229 293 387 693 617 743 03
Uganda 83 213 68 76 287 553 245 272 04
Zambia 328 483 285 388 643 815 593 768 03
Zimbabwe 160 720 440 02
148
TABLE 21 Dimensions of poverty (continued)Poverty gap at Poverty headcount ratio Multi-
dimensional
$125 aday (ppp)
$2 a day(ppp)
nationalpovertyline
ruralpovertyline
$125 aday (ppp)
$2 a day(ppp)
nationalpovertyline
ruralpovertyline
poverty(MPI)
0 to 1
2009 2009 2009 2009 2009 2009 2009 2009 2009
ASIA
Central Asia
Kazakhstan 01 03 31 45 02 15 154 217 00
Kyrgyzstan 01 55 100 120 19 294 431 508 00
Tajikistan 51 168 124 124 215 509 472 492 01
Turkmenistan 70 184 248 497
Uzbekistan 150 332 463 767 00
East Asia
Brunei Darussalam
Cambodia 61 202 72 83 283 565 301 345 03
China 40 122 159 363 28 25
Indonesia 36 155 25 31 187 506 142 174 01
Korea DPR
Korea Republic of
Lao PDR 89 248 339 660 276 317 03
Malaysia 00 02 08 18 00 23 38 82
Mongolia 62 172 101 134 224 491 352 466 01
Myanmar 02
Philippines 55 164 27 152 226 450 265 507 01
Singapore
Thailand 19 83 30 108 265 81 104 00
Viet Nam 23 109 35 46 131 385 145 187 01
South Asia
Afghanistan 79 83 360 375
Bangladesh 131 338 90 98 496 813 400 438 03
Bhutan 70 188 61 81 262 495 232 309 01
India 105 295 416 756 275 283 03
Iran (Islamic Rep) 03 18 14 80
Maldives 01 25 15 122 00
Nepal 197 378 75 85 551 776 309 346 03
Pakistan 43 187 226 603 223 270 03
Sri Lanka 10 74 31 32 70 291 152 157 00
West Asia
Armenia 02 23 49 121 13 124 265 255 00
Azerbaijan 02 15 20 10 78 158 185 00
Bahrain
Cyprus
Georgia 46 118 72 92 147 326 236 297 00
Iraq 06 55 45 90 40 253 229 393 01
Jordan 01 06 26 04 35 133 190 00
Kuwait
Lebanon
Occupied PalestinianTerritory
Saudi Arabia
Syrian Arab Republic 02 33 17 169 00
Turkey 09 26 27 91 181 387 00
United Arab Emirates 00
Yemen 42 148 89 106 175 466 348 401 03
LATIN AMERICA amp THECARIBBEAN
Argentina 04 08 09 24 00
Bahamas
Barbados
Belize 47 97 121 240 335 442 00
Bolivia (Plur State) 58 109 140 247 601 773 01
Brazil 11 32 38 99 214 00
Chile 04 08 08 24 151 129
Colombia 57 119 160 279 455 643 00
Costa Rica 01 11 07 54 217 230
149
TABLE 21 Dimensions of poverty (continued)Poverty gap at Poverty headcount ratio Multi-
dimensional
$125 aday (ppp)
$2 a day(ppp)
nationalpovertyline
ruralpovertyline
$125 aday (ppp)
$2 a day(ppp)
nationalpovertyline
ruralpovertyline
poverty(MPI)
0 to 1
2009 2009 2009 2009 2009 2009 2009 2009 2009
Cuba
Dominica
Dominican Republic 09 39 43 136 505 571 00
Ecuador 16 44 51 134 360 575 00
El Salvador 11 45 51 152 378 465
French Guiana
Grenada
Guatemala 65 129 169 298 510 705 01
Guyana 39 69 77 168 01
Haiti 282 418 549 722 770 880 03
Honduras 119 182 233 354 588 644 02
Jamaica 00 09 02 58 99 251
Mexico 17 32 34 81 474 608 00
Netherlands Antilles
Nicaragua 52 123 158 319 462 679 01
Panama 31 71 95 179 327 598
Paraguay 15 43 51 132 351 498 01
Peru 14 47 59 147 348 603 01
St Kitts amp Nevis
St Lucia 72 155 209 406
St Vincent amp Grenadines
Suriname 59 117 155 272 00
Trinidad amp Tobago 11 39 42 135 00
Uruguay 00 00 00 02 205 222 00
Venezuela (Boliv Rep of) 11 32 35 101 290
OCEANIA
Fiji 101 148 310 433
French Polynesia
New Caledonia
Papua New Guinea 123 255 124 138 358 574 375 413
Samoa
Solomon Islands
Tonga
Vanuatu 01
DEVELOPED REGIONS
NORTH AMERICA
Bermuda
Canada
United States of America
ASIA amp OCEANIA
Australia
Israel
Japan
New Zealand
EUROPE
Albania 02 08 23 26 06 42 124 146 00
Belarus 00 00 00 00 54
Bosnia amp Herzegovina 00 01 46 49 00 02 140 178 00
Croatia 00 00 26 00 00 111 00
European Union
Iceland
Macedonia FYR 00 07 72 77 03 43 190 213 00
Montenegro 00 00 09 14 00 00 49 89 00
Norway
Republic of Moldova 03 26 19 125 290 00
Russian Federation 00 00 27 55 00 01 111 212 00
Serbia 01 02 13 20 01 07 66 98 00
Switzerland
Ukraine 00 01 15 23 01 05 79 113 00
150
TABLE 22 Dimensions of inequalityHuman Development Index Gender
inequalityIndex
Gini-index Income share held by
inequalityadjusted
incomedistribution
highest20
lowest20
index index index index
2010 2010 2008 2009 2009 2009
WORLD
DEVELOPING REGIONS
AFRICA
North Africa
Algeria 07 06 353
Egypt 06 04 07 321 415 90
Libya 07 05
Morocco 06 04 07 409 479 65
Tunisia 07 05 05 408 473 60
Sub-Saharan Africa
Angola 04 02 586 619 20
Benin 04 03 07 386 461 70
Botswana 06 06 610
Burkina Faso 03 02 396 471 70
Burundi 03 02 06 333 428 90
Cameroon 05 03 07 446 462 67
Cape Verde 05 504 559 45
Central African Republic 03 02 08 436 606 34
Chad 03 02 398 466 63
Comoros 04 02 643 680 25
Congo 05 03 07 473 531 50
Cocircte drsquoIvoire 04 03 07 415 476 56
Congo Dem Rep 02 02 08
Djibouti 04 03 399 465 60
Equatorial Guinea 05
Eritrea
Ethiopia 03 02 298 394 93
Gabon 06 05 06 415 482 62
Gambia 04 02 07 473 528 48
Ghana 05 03 07 428 485 52
Guinea 03 02 394 462 63
Guinea-Bissau 03 02 355 432 73
Kenya 05 03 07 477 532 48
Lesotho 04 03 07 525 564 30
Liberia 03 02 08 382 450 64
Madagascar 04 03 472 535 62
Malawi 04 03 07 390 465 70
Mali 03 02 08 390 460 65
Mauritania 04 03 07 390 457 62
Mauritius 07
Mozambique 03 02 07 456 515 52
Namibia 06 03 06 743
Niger 03 02 08 340 428 83
Nigeria 04 02 429 486 51
Rwanda 04 02 06 531 582 42
Senegal 04 03 07 392 459 62
Seychelles 658 696 37
Sierra Leone 03 02 08 425 493 61
Somalia
Sudan 04 07
South Africa 06 04 06 578 722 25
Swaziland 05 03 07 507 559 45
Tanzania Utd Rep 04 03 376 448 68
Togo 04 03 07 344 424 76
Uganda 04 03 07 443 493 61
Zambia 04 03 07 507 552 36
Zimbabwe 01 01 07 501
151
TABLE 22 Dimensions of inequality (continued)Human Development Index Gender
inequalityIndex
Gini-index Income share held by
inequalityadjusted
incomedistribution
highest20
lowest20
index index index index
2010 2010 2008 2009 2009 2009
ASIA
Central Asia
Kazakhstan 07 06 05 309 399 87
Kyrgyzstan 06 05 05 334 428 88
Tajikistan 06 05 05 336 417 78
Turkmenistan 07 05 408
Uzbekistan 06 05 367 442 71
East Asia
Brunei Darussalam 08
Cambodia 05 04 06 444 517 66
China 05 04 415 478 57
Indonesia 06 05 07 368 455 74
Korea DPR
Korea Republic of 09 07 03 316
Lao PDR 05 04 06 367 448 76
Malaysia 07 04 462 448 65
Mongolia 06 05 05 365 405 72
Myanmar 04
Philippines 06 05 06 440 504 56
Singapore 08 02 425
Thailand 06 05 05 536 493 62
Viet Nam 06 05 05 376 454 73
South Asia
Afghanistan 03 08 294 387 90
Bangladesh 05 03 07 310 408 94
Bhutan 467 530 54
India 05 04 07 368 453 81
Iran (Islamic Rep) 07 06 383 452 64
Maldives 06 05 05 374 442 65
Nepal 04 03 07 473 540 59
Pakistan 05 03 07 327 421 90
Sri Lanka 07 05 06 403 478 69
West Asia
Armenia 07 06 05 309 398 88
Azerbaijan 07 06 05 337 421 80
Bahrain 08 05
Cyprus 08 07 03
Georgia 07 06 06 413 471 53
Iraq 07 399 87
Jordan 07 06 06 377 455 73
Kuwait 08 05
Lebanon
Occupied PalestinianTerritory
Saudi Arabia 07 08
Syrian Arab Republic 06 05 06 358 439 77
Turkey 07 05 06 397 489 52
United Arab Emirates 08 04
Yemen 04 03 08 377
LATIN AMERICA amp THECARIBBEAN
Argentina 08 06 05 458 531 36
Bahamas 08 07
Barbados 08 05
Belize 07 05 06 544
Bolivia (Plur State) 06 04 06 573 610 28
Brazil 07 05 06 539 585 32
Chile 08 06 05 521 572 43
Colombia 07 05 06 585 621 25
Costa Rica 07 06 05 503 523 44
152
TABLE 22 Dimensions of inequality (continued)Human Development Index Gender
inequalityIndex
Gini-index Income share held by
inequalityadjusted
incomedistribution
highest20
lowest20
index index index index
2010 2010 2008 2009 2009 2009
Cuba 05
Dominica
Dominican Republic 07 05 06 484 536 44
Ecuador 07 06 06 490 589 36
El Salvador 07 05 06 469 519 47
French Guiana
Grenada
Guatemala 06 04 07 537 580 35
Guyana 06 05 06 432
Haiti 04 02 07 595 630 25
Honduras 06 04 06 577 607 20
Jamaica 07 06 06 455 516 53
Mexico 07 06 06 517 562 38
Netherlands Antilles
Nicaragua 06 04 06 523 569 38
Panama 08 05 06 523 586 27
Paraguay 06 05 06 520 565 38
Peru 07 05 06 480 543 40
St Kitts amp Nevis
St Lucia 426
St Vincent amp Grenadines
Suriname 06 05 528
Trinidad amp Tobago 07 06 05 403
Uruguay 08 06 05 424 515 46
Venezuela (Boliv Rep of) 07 05 06 435 490 49
OCEANIA
Fiji 07
French Polynesia
New Caledonia
Papua New Guinea 04 08 509
Samoa
Solomon Islands 05
Tonga 07
Vanuatu
DEVELOPED REGIONS
NORTH AMERICA
Bermuda
Canada 09 08 03 326 399 72
United States of America 09 08 05 408 458 54
ASIA amp OCEANIA
Australia 09 09 03 352
Israel 09 08 03 392 449 57
Japan 09 03 249
New Zealand 09 03 362
EUROPE
Albania 07 06 05 345 430 81
Belarus 07 07 272 364 92
Bosnia amp Herzegovina 07 06 362 432 67
Croatia 08 07 04 336 420 81
European Union
Iceland 09 08 03
Macedonia FYR 07 06 442 503 54
Montenegro 07 300 388 85
Norway 09 09 02 258 372 96
Republic of Moldova 06 05 05 380 453 68
Russian Federation 07 06 05 423 489 60
Serbia 07 282
Switzerland 09 08 02 337 413 75
Ukraine 07 07 05 275 371 94
153
TABLE 23 GovernanceVoice ampaccount-ability
Politicalstabilityabsence ofviolence ampterrorism
Govern-ment
effectiveness
Regulatoryquality
Rule oflaw
Control ofcorruption
Averagegovernance
-25 to 25(lowest tohighest)
-25 to 25(lowest tohighest)
-25 to 25(lowest tohighest)
-25 to 25(lowest tohighest)
-25 to 25(lowest tohighest)
-25 to 25(lowest tohighest)
-25 to 25(lowest tohighest)
2010 2010 2010 2010 2010 2010 2010
WORLD
DEVELOPING REGIONS
AFRICA
North Africa
Algeria minus10 minus13 minus06 minus11 minus08 minus05 minus09
Egypt minus12 minus09 minus04 minus02 minus01 minus06 minus06
Libya minus19 minus01 minus12 minus12 minus10 minus13 minus11
Morocco minus08 minus05 minus02 minus01 minus02 minus02 minus03
Tunisia minus13 01 02 minus00 01 minus01 minus02
Sub-Saharan Africa
Angola minus11 minus02 minus11 minus10 minus12 minus13 minus10
Benin 03 03 minus05 minus03 minus07 minus08 minus03
Botswana 04 09 05 05 07 10 07
Burkina Faso minus02 minus01 minus06 minus01 minus02 minus04 minus03
Burundi minus09 minus15 minus11 minus11 minus12 minus11 minus12
Cameroon minus11 minus06 minus09 minus07 minus10 minus10 minus09
Cape Verde 09 08 minus01 minus01 04 08 05
Central African Republic minus11 minus21 minus14 minus11 minus13 minus08 minus13
Chad minus14 minus15 minus15 minus11 minus15 minus13 minus14
Comoros minus04 minus04 minus17 minus15 minus11 minus07 minus10
Congo minus10 minus02 minus12 minus13 minus11 minus11 minus10
Cocircte drsquoIvoire minus11 minus16 minus13 minus09 minus12 minus11 minus12
Congo Dem Rep minus14 minus22 minus17 minus16 minus16 minus14 minus17
Djibouti minus11 03 minus10 minus07 minus07 minus03 minus06
Equatorial Guinea minus19 02 minus17 minus14 minus13 minus15 minus12
Eritrea minus22 minus09 minus14 minus22 minus13 minus05 minus14
Ethiopia minus13 minus17 minus03 minus09 minus08 minus07 minus10
Gabon minus09 02 minus09 minus06 minus05 minus08 minus06
Gambia minus11 01 minus07 minus04 minus05 minus06 minus05
Ghana 05 00 minus00 01 minus01 01 01
Guinea minus09 minus18 minus11 minus11 minus15 minus12 minus13
Guinea-Bissau minus09 minus08 minus10 minus11 minus14 minus11 minus10
Kenya minus02 minus12 minus05 minus01 minus10 minus09 minus07
Lesotho minus02 05 minus04 minus06 minus03 02 minus01
Liberia minus02 minus05 minus12 minus11 minus10 minus05 minus07
Madagascar minus08 minus11 minus08 minus06 minus08 minus03 minus07
Malawi minus02 01 minus04 minus06 minus01 minus04 minus03
Mali 02 minus03 minus09 minus05 minus05 minus07 minus04
Mauritania minus09 minus13 minus09 minus08 minus09 minus07 minus09
Mauritius 07 05 08 08 08 07 07
Mozambique minus01 03 minus05 minus04 minus05 minus04 minus03
Namibia 03 08 01 01 02 03 03
Niger minus06 minus11 minus07 minus05 minus06 minus07 minus07
Nigeria minus08 minus20 minus12 minus08 minus12 minus10 minus12
Rwanda minus13 minus01 minus01 minus02 minus03 05 minus02
Senegal minus03 minus04 minus05 minus03 minus04 minus07 minus04
Seychelles 01 08 02 minus06 00 03 01
Sierra Leone minus02 minus02 minus12 minus07 minus09 minus08 minus07
Somalia minus20 minus31 minus22 minus24 minus24 minus17 minus23
Sudan minus17 minus27 minus14 minus14 minus13 minus13 minus16
South Africa 05 minus00 03 04 01 01 02
Swaziland minus13 minus01 minus05 minus06 minus05 minus02 minus05
Tanzania Utd Rep minus01 minus00 minus05 minus04 minus05 minus05 minus03
Togo minus10 minus02 minus14 minus09 minus09 minus10 minus09
Uganda minus05 minus11 minus06 minus01 minus04 minus09 minus06
Zambia minus03 05 minus08 minus05 minus05 minus06 minus04
Zimbabwe minus15 minus12 minus16 minus20 minus18 minus14 minus16
154
TABLE 23 Governance (continued)Voice ampaccount-ability
Politicalstabilityabsence ofviolence ampterrorism
Govern-ment
effectiveness
Regulatoryquality
Rule oflaw
Control ofcorruption
Averagegovernance
-25 to 25(lowest tohighest)
-25 to 25(lowest tohighest)
-25 to 25(lowest tohighest)
-25 to 25(lowest tohighest)
-25 to 25(lowest tohighest)
-25 to 25(lowest tohighest)
-25 to 25(lowest tohighest)
2010 2010 2010 2010 2010 2010 2010
ASIA
Central Asia
Kazakhstan minus11 05 minus03 minus03 minus06 minus10 minus05
Kyrgyzstan minus10 minus10 minus06 minus02 minus13 minus11 minus09
Tajikistan minus14 minus09 minus09 minus11 minus12 minus12 minus11
Turkmenistan minus20 02 minus16 minus21 minus15 minus14 minus14
Uzbekistan minus20 minus08 minus08 minus16 minus14 minus13 minus13
East Asia
Brunei Darussalam minus07 12 09 11 08 09 07
Cambodia minus09 minus06 minus08 minus05 minus11 minus12 minus08
China minus16 minus08 01 minus02 minus03 minus06 minus06
Indonesia minus01 minus09 minus02 minus04 minus06 minus07 minus05
Korea DPR minus22 minus05 minus19 minus24 minus13 minus13 minus16
Korea Republic of 07 01 12 09 10 04 07
Lao PDR minus16 minus02 minus09 minus10 minus09 minus11 minus10
Malaysia minus05 01 11 06 05 01 03
Mongolia 00 05 minus06 minus03 minus04 minus07 minus03
Myanmar minus21 minus13 minus17 minus22 minus15 minus17 minus17
Philippines minus01 minus16 minus01 minus03 minus05 minus08 minus06
Singapore minus03 11 22 18 17 22 15
Thailand minus06 minus12 01 02 minus02 minus03 minus03
Viet Nam minus14 01 minus03 minus06 minus05 minus06 minus05
South Asia
Afghanistan minus15 minus26 minus15 minus16 minus19 minus16 minus18
Bangladesh minus03 minus14 minus08 minus09 minus08 minus10 minus09
Bhutan minus05 07 06 minus11 01 08 01
India 04 minus13 minus00 minus04 minus01 minus05 minus03
Iran (Islamic Rep) minus16 minus16 minus05 minus16 minus09 minus09 minus12
Maldives minus01 minus00 minus02 minus04 minus03 minus06 minus03
Nepal minus05 minus17 minus08 minus07 minus10 minus07 minus09
Pakistan minus08 minus27 minus08 minus06 minus08 minus11 minus11
Sri Lanka minus05 minus08 minus02 minus02 minus01 minus04 minus04
West Asia
Armenia minus09 00 minus02 03 minus05 minus07 minus03
Azerbaijan minus13 minus03 minus08 minus04 minus09 minus12 minus08
Bahrain minus09 minus03 06 08 04 02 01
Cyprus 11 04 15 14 12 11 11
Georgia minus02 minus07 03 06 minus02 minus02 minus01
Iraq minus11 minus23 minus12 minus11 minus16 minus13 minus14
Jordan minus08 minus03 01 02 02 00 minus01
Kuwait minus05 04 01 02 05 03 02
Lebanon minus03 minus15 minus03 00 minus07 minus08 minus06
Occupied PalestinianTerritory
Saudi Arabia minus18 minus02 minus01 01 02 01 minus03
Syrian Arab Republic minus17 minus08 minus06 minus09 minus05 minus11 minus09
Turkey minus02 minus10 04 04 01 00 minus01
United Arab Emirates minus09 08 08 04 04 10 04
Yemen minus13 minus22 minus10 minus06 minus11 minus11 minus12
LATIN AMERICA amp THECARIBBEAN
Argentina 03 minus00 minus02 minus07 minus06 minus04 minus03
Bahamas 10 10 10 05 07 14 09
Barbados 12 11 14 05 10 14 11
Belize 07 minus00 minus04 minus05 minus04 minus01 minus01
Bolivia (Plur State) minus01 minus04 minus05 minus08 minus11 minus05 minus06
Brazil 05 00 01 02 00 01 01
Chile 10 06 12 14 13 15 12
Colombia minus02 minus15 01 03 minus03 minus04 minus03
Costa Rica 10 06 03 05 05 07 06
155
TABLE 23 Governance (continued)Voice ampaccount-ability
Politicalstabilityabsence ofviolence ampterrorism
Govern-ment
effectiveness
Regulatoryquality
Rule oflaw
Control ofcorruption
Averagegovernance
-25 to 25(lowest tohighest)
-25 to 25(lowest tohighest)
-25 to 25(lowest tohighest)
-25 to 25(lowest tohighest)
-25 to 25(lowest tohighest)
-25 to 25(lowest tohighest)
-25 to 25(lowest tohighest)
2010 2010 2010 2010 2010 2010 2010
Cuba minus16 03 minus02 minus16 minus06 05 minus05
Dominica 10 10 07 04 07 07 08
Dominican Republic 01 00 minus06 minus02 minus08 minus08 minus04
Ecuador minus03 minus06 minus07 minus11 minus12 minus09 minus08
El Salvador 00 01 00 04 minus09 minus02 minus01
French Guiana 11 02 12 12 12 11 10
Grenada 08 06 02 04 01 04 04
Guatemala minus04 minus08 minus07 minus02 minus10 minus05 minus06
Guyana 00 minus05 minus01 minus05 minus05 minus06 minus04
Haiti minus07 minus09 minus16 minus11 minus14 minus13 minus12
Honduras minus05 minus05 minus07 minus02 minus09 minus09 minus06
Jamaica 04 minus04 02 03 minus05 minus04 minus01
Mexico 01 minus08 02 03 minus06 minus04 minus02
Netherlands Antilles 04 11 07 09 09 09 08
Nicaragua minus05 minus06 minus10 minus04 minus08 minus08 minus07
Panama 05 00 01 04 minus01 minus04 01
Paraguay minus01 minus09 minus09 minus04 minus09 minus08 minus07
Peru 00 minus09 minus02 05 minus06 minus02 minus02
St Kitts amp Nevis 11 11 07 04 07 10 09
St Lucia 12 08 08 04 08 12 09
St Vincent amp Grenadines 12 09 07 04 09 10 09
Suriname 04 01 minus01 minus07 minus01 minus04 minus01
Trinidad amp Tobago 05 minus00 03 05 minus02 minus04 01
Uruguay 11 09 07 04 07 13 08
Venezuela (Boliv Rep of) minus09 minus14 minus10 minus16 minus16 minus12 minus13
OCEANIA
Fiji minus10 minus01 minus07 minus07 minus09 minus09 minus07
French Polynesia
New Caledonia minus02
Papua New Guinea 01 minus08 minus08 minus05 minus09 minus11 minus07
Samoa
Solomon Islands 01 04 minus09 minus12 minus07 minus05 minus05
Tonga 03 08 minus03 minus05 01 minus03 minus00
Vanuatu 05 14 minus03 minus08 03 04 02
DEVELOPED REGIONS
NORTH AMERICA
Bermuda 10 09 10 14 12 13 11
Canada 14 09 19 17 18 21 16
United States of America 12 03 14 14 16 12 12
ASIA amp OCEANIA
Australia 14 08 18 17 18 21 16
Israel 06 minus15 12 12 09 06 05
Japan 10 09 14 10 13 15 12
New Zealand 15 12 19 18 19 24 18
EUROPE
Albania 01 minus02 minus03 02 minus04 minus04 minus02
Belarus minus16 minus01 minus11 minus12 minus10 minus08 minus10
Bosnia amp Herzegovina minus01 minus07 minus07 minus01 minus04 minus03 minus04
Croatia 04 06 06 06 02 00 04
European Union
Iceland 14 10 16 09 17 19 14
Macedonia FYR 01 minus05 minus02 03 minus03 minus01 minus01
Montenegro 02 05 01 minus01 minus00 minus03 01
Norway 16 13 18 15 19 21 17
Republic of Moldova minus01 minus04 minus06 minus01 minus04 minus07 minus04
Russian Federation minus09 minus09 minus04 minus04 minus08 minus11 minus07
Serbia 03 minus04 minus01 minus00 minus04 minus02 minus01
Switzerland 16 12 19 17 18 21 17
Ukraine minus01 minus01 minus08 minus06 minus08 minus10 minus06
156
TABLE 24 Education health and sanitationLiteracyratefemale
Ratio of girls-to-boys Expendi-ture perstudent
Public expon
education
Health expenditure Prevalenceof HIV
Access to improved
out ofprimaryschool
in primand seceducation
share ofGDP percapita
share ofGDP
currentper capita
share ofGDP
ages15-49
sanitationfacilities
water source
ratio US$ rur urb
2009 2009 2009 2009 2009 2009 2009 2009 2008 2008 2008
WORLD 792 963 44 8600 101 08 61 78 96
DEVELOPING REGIONS
AFRICA
North Africa
Algeria 639 07 993 285 43 2680 58 01 95 79 85
Egypt 578 05 951 38 1130 50 01 94 98 100
Libya 820 00 1050 239 27 4170 39 97
Morocco 439 08 881 872 56 1560 55 01 69 60 98
Tunisia 710 09 1030 507 71 2400 62 01 85 84 99
Sub-Saharan Africa
Angola 576 08 820 1269 26 2040 46 20 57 38 60
Benin 291 01 735 134 35 319 42 12 12 69 84
Botswana 844 12 1000 3014 89 6120 103 248 60 90 99
Burkina Faso 216 08 856 3663 46 381 64 12 11 72 95
Burundi 609 90 927 6009 83 198 131 33 46 71 83
Cameroon 630 02 856 728 37 611 56 53 47 51 92
Cape Verde 802 09 1030 828 59 1460 39 54 82 85
Central African Republic 421 05 687 1448 13 193 43 47 34 51 92
Chad 231 06 636 2488 32 418 70 34 9 44 67
Comoros 687 06 842 272 76 278 34 01 36 97 91
Congo 09 919 29 18 701 30 34 30 34 95
Cocircte drsquoIvoire 453 08 686 1191 46 553 51 34 23 68 93
Congo Dem Rep 549 768 156 95 23 80
Djibouti 09 820 573 84 845 70 25 56 52 98
Equatorial Guinea 898 10 825 40 06 7090 39 50
Eritrea 560 09 773 11356 20 101 21 08 14 57 74
Ethiopia 180 07 879 6642 55 147 43 12 26 98
Gabon 841 10 959 38 2660 35 52 33 41 95
Gambia 358 11 1020 322 20 256 60 20 67 86 96
Ghana 604 11 954 288 54 451 69 18 13 74 90
Guinea 281 07 772 1164 24 188 57 13 19 61 89
Guinea-Bissau 380 07 655 52 184 61 25 21 51 83
Kenya 835 11 954 436 70 332 43 63 31 52 83
Lesotho 953 12 1070 778 124 700 82 236 29 81 97
Liberia 545 04 719 141 28 294 132 15 17 51 79
Madagascar 616 53 969 1581 30 180 41 02 11 29 71
Malawi 670 18 1000 321 42 191 62 110 56 77 95
Mali 182 05 784 1633 44 384 56 10 36 44 81
Mauritania 503 13 1030 736 29 219 25 07 26 47 52
Mauritius 853 13 1010 245 32 3830 57 10 91 99 100
Mozambique 415 05 883 998 50 247 57 115 17 29 77
Namibia 881 16 1040 315 64 2580 60 131 33 88 99
Niger 151 08 753 5143 45 209 61 08 9 39 96
Nigeria 498 09 851 08 693 58 36 32 42 75
Rwanda 668 18 1000 2521 41 482 90 29 54 62 77
Senegal 387 11 955 2169 58 589 57 09 51 52 92
Seychelles 923 15 1030 340 50 3660 40 100
Sierra Leone 301 06 840 251 43 439 131 16 13 26 86
Somalia 09 535 04 07 23 9 67
Sudan 608 09 894 121 946 73 11 34 52 64
South Africa 870 12 994 328 54 4850 85 178 77 78 99
Swaziland 862 11 921 491 78 1560 63 259 55 61 92
Tanzania Utd Rep 669 15 961 409 68 253 51 56 24 45 80
Togo 444 04 753 130 46 289 59 32 12 41 87
Uganda 589 15 987 1339 32 425 82 65 48 64 91
Zambia 613 14 958 10 13 471 48 135 49 46 87
Zimbabwe 894 971 2143 52 143 44 72 99
157
TABLE 24 Education health and sanitation (continued)Literacyratefemale
Ratio of girls-to-boys Expendi-ture perstudent
Public expon
education
Health expenditure Prevalenceof HIV
Access to improved
out ofprimaryschool
in primand seceducation
share ofGDP percapita
share ofGDP
currentper capita
share ofGDP
ages15-49
sanitationfacilities
water source
ratio US$ rur urb
2009 2009 2009 2009 2009 2009 2009 2009 2008 2008 2008
ASIA
Central Asia
Kazakhstan 996 26 986 79 28 3300 45 01 97 90 99
Kyrgyzstan 990 11 1010 173 59 571 68 03 93 85 99
Tajikistan 996 01 906 218 35 380 53 02 94 61 94
Turkmenistan 994 43 771 23 98 97
Uzbekistan 991 08 987 74 622 52 01 100 81 98
East Asia
Brunei Darussalam 937 18 1010 37 7910 30
Cambodia 709 08 897 54 21 421 59 05 29 56 81
China 909 12 1050 1015 19 1770 46 01 55 82 98
Indonesia 891 04 977 397 28 554 24 02 52 71 89
Korea DPR 1000 100 100
Korea Republic of 00 972 528 42 11100 65 01 100 88 100
Lao PDR 632 09 872 100 23 358 41 02 53 51 72
Malaysia 903 10 1030 604 41 3360 48 05 96 99 100
Mongolia 979 15 1030 162 56 742 47 01 50 49 97
Myanmar 895 08 997 54 13 125 20 06 81 69 75
Philippines 958 14 1020 276 28 669 38 01 76 87 93
Singapore 920 116 30 15000 39 01 100 100
Thailand 915 09 1030 554 41 1680 43 13 96 98 99
Viet Nam 905 04 932 982 53 797 72 04 75 92 99
South Asia
Afghanistan 50 07 623 19 509 74 37 39 78
Bangladesh 510 21 1080 256 24 184 34 01 53 78 85
Bhutan 387 13 1000 387 48 980 55 02 65 88 99
India 508 05 922 777 31 448 42 03 31 84 96
Iran (Islamic Rep) 807 07 965 583 47 2690 55 02 98
Maldives 984 06 982 00 112 3310 80 01 98 86 99
Nepal 469 06 825 731 47 253 58 04 31 87 93
Pakistan 401 07 819 27 226 26 01 45 87 95
Sri Lanka 891 12 1040 30 836 40 01 91 88 98
West Asia
Armenia 994 17 1030 533 30 1290 47 01 90 93 98
Azerbaijan 992 10 1020 156 28 2850 58 01 45 71 88
Bahrain 902 03 1010 326 29 11100 45 100
Cyprus 969 05 1000 1352 41 60 100 100 100
Georgia 997 06 965 410 32 2560 101 01 95 96 100
Iraq 699 04 813 51 985 39 73 55 91
Jordan 889 14 1020 277 49 3360 93 98 91 98
Kuwait 918 08 1010 257 38 14200 33 100 99 99
Lebanon 860 09 1040 102 18 6630 81 01 100 100
Occupied PalestinianTerritory
Saudi Arabia 811 08 913 367 56 7140 50 97
Syrian Arab Republic 780 01 973 338 48 720 29 96 84 94
Turkey 853 07 929 547 31 5710 67 01 90 96 100
United Arab Emirates 915 06 998 270 12 15200 28 97 100 100
Yemen 447 06 657 52 640 56 52 57 72
LATIN AMERICA amp THECARIBBEAN
Argentina 977 22 1050 565 49 7300 95 05 90 80 98
Bahamas 14 1010 33 15600 72 31 100 98
Barbados 603 minus67 10400 68 14 100 100 100
Belize 703 44 1010 395 58 2170 49 23 90 100 99
Bolivia (Plur State) 868 12 988 282 63 848 48 02 25 67 96
Brazil 902 07 1030 650 51 7340 91 80 84 99
Chile 987 09 985 428 40 7870 82 04 96 75 99
Colombia 934 10 1050 580 48 3230 64 05 74 73 99
Costa Rica 963 12 1020 290 63 6680 105 03 95 91 100
158
TABLE 24 Education health and sanitation (continued)Literacyratefemale
Ratio of girls-to-boys Expendi-ture perstudent
Public expon
education
Health expenditure Prevalenceof HIV
Access to improved
out ofprimaryschool
in primand seceducation
share ofGDP percapita
share ofGDP
currentper capita
share ofGDP
ages15-49
sanitationfacilities
water source
ratio US$ rur urb
2009 2009 2009 2009 2009 2009 2009 2009 2008 2008 2008
Cuba 998 08 988 1553 136 7070 118 01 91 89 96
Dominica 15 1020 407 47 3610 64
Dominican Republic 883 11 965 147 23 2710 59 09 83 84 87
Ecuador 815 28 1030 92 10 2550 61 04 92 88 97
El Salvador 818 16 983 176 36 2290 63 08 87 76 94
French Guiana
Grenada 960 22 970 227 48 4470 74 97 97
Guatemala 695 04 938 166 32 1860 71 08 81 90 98
Guyana 06 997 447 61 1330 81 12 81 93 98
Haiti 446 10 946 15 396 61 19 17 55 71
Honduras 835 23 1070 36 1170 60 08 71 77 95
Jamaica 911 09 1000 850 58 2310 51 17 83 89 98
Mexico 921 17 1020 637 48 5150 65 03 85 87 96
Netherlands Antilles 964 1020
Nicaragua 779 12 1020 144 31 1050 96 02 52 68 98
Panama 930 08 1010 390 38 5910 83 09 69 83 97
Paraguay 935 10 995 530 40 1590 71 03 70 66 99
Peru 846 12 994 180 27 2010 46 04 68 61 90
St Kitts amp Nevis 15 1040 79 97 6340 60 96 99 99
St Lucia 10 994 368 45 4430 81 98 98
St Vincent amp Grenadines 01 977 455 66 3010 57
Suriname 938 09 1070 90 4290 76 10 84 81 97
Trinidad amp Tobago 983 05 1010 189 42 10700 57 15 92 93 98
Uruguay 986 08 1040 374 29 6980 75 05 100 100 100
Venezuela (Boliv Rep of) 949 11 1020 173 37 6860 60
OCEANIA
Fiji 10 1030 967 62 1300 34 01
French Polynesia 15 1090 98 100 100
New Caledonia 960
Papua New Guinea 565 08 835 65 367 31 09 45 33 87
Samoa 985 17 1050 120 58 2050 70 100
Solomon Islands 690 10 940 22 719 54
Tonga 991 06 999 1449 39 1610 62 96 100 100
Vanuatu 803 05 995 353 48 1060 40 52 79 96
DEVELOPED REGIONS
NORTH AMERICA
Bermuda 979 157 26
Canada 23 987 440 49 43800 109 02 100 99 100
United States of America 14 1000 682 55 74100 162 06 100 94 100
ASIA amp OCEANIA
Australia 14 973 509 45 38700 85 01 100 100 100
Israel 887 15 1010 611 59 19700 76 02 100 100 100
Japan 11 1000 647 35 33200 83 01 100 100 100
New Zealand 31 1030 675 61 26300 97 01 100 100
EUROPE
Albania 947 09 995 444 29 2650 69 98 98 96
Belarus 997 17 1010 150 45 2950 58 03 93 99 100
Bosnia amp Herzegovina 964 13 1020 4950 109 95 98 100
Croatia 981 12 1020 732 46 11200 78 01 99 97 100
European Union 1010 764 49 33700 103 02 98 100 100
Iceland 13 1020 771 74 31300 82 03 100 100 100
Macedonia FYR 956 13 983 238 35 3140 69 89 99 100
Montenegro 6170 93 92 96 100
Norway 13 990 895 68 76600 97 01 100 100 100
Republic of Moldova 980 10 1010 1286 96 1810 119 04 79 85 96
Russian Federation 994 12 980 142 39 4750 54 10 87 89 98
Serbia 09 1010 1105 48 4190 99 01 92 98 99
Switzerland 57 973 956 52 71400 113 04 100 100 100
Ukraine 996 11 988 251 53 1800 70 11 95 97 98
159
TABLE 25 Food aid receivedFood aid received
thousandtonnes
thousandtonnes
thousandtonnes
thousandtonnes
thousandtonnes
1990 1995 2000 2005 2010
WORLD 13172 10201 11345 8288 5682
DEVELOPING REGIONS 10922 9143 9462 8245 5682
AFRICA 5255 3562 4320 4656 3491
North Africa 2268 263 318 56 27
Algeria 10 27 33 42 24
Egypt 1606 207 41 14 3
Libya 0 0 0 0 0
Morocco 271 2 241 0 0
Tunisia 383 27 4 0 0
Sub-Saharan Africa 2986 3299 4002 4601 3464
Angola 124 220 296 57 4
Benin 15 21 12 15 19
Botswana 15 10 0 0 0
Burkina Faso 34 41 33 39 45
Burundi 3 103 11 73 34
Cameroon 3 7 4 14 14
Cape Verde 59 73 53 29 16
Central African Republic 3 1 3 5 10
Chad 26 21 23 74 111
Comoros 4 6 0 0 0
Congo 8 13 18 9 7
Cocircte drsquoIvoire 66 24 17 34 21
Congo Dem Rep 98 109 74 103 193
Djibouti 9 20 12 21 10
Equatorial Guinea 5 4 2 0 0
Eritrea 0 104 257 232 0
Ethiopia 864 636 1527 1122 1415
Gabon 0 0 1 0 0
Gambia 4 4 8 11 23
Ghana 66 97 101 66 7
Guinea 11 8 5 41 4
Guinea-Bissau 5 3 27 11 7
Kenya 90 80 291 155 258
Lesotho 42 34 6 44 7
Liberia 35 161 116 102 30
Madagascar 54 38 44 47 26
Malawi 219 236 36 153 38
Mali 39 20 12 41 25
Mauritania 45 45 17 92 39
Mauritius 11 1 0 0 0
Mozambique 423 386 185 117 80
Namibia 12 3 2 2 1
Niger 40 25 20 139 159
Nigeria 0 0 1 20 0
Rwanda 9 274 232 42 7
Senegal 63 21 54 30 41
Seychelles 1 0 0 0 0
Sierra Leone 11 34 28 39 24
Somalia 98 53 61 40 72
Sudan 230 82 182 931 476
South Africa 7 0 3 0 0
Swaziland 10 7 0 12 17
Tanzania Utd Rep 35 145 63 116 38
Togo 12 6 4 1 2
Uganda 47 77 87 293 80
Zambia 11 26 49 146 7
Zimbabwe 14 13 16 80 92
160
TABLE 25 Food aid received (continued)Food aid received
thousandtonnes
thousandtonnes
thousandtonnes
thousandtonnes
thousandtonnes
1990 1995 2000 2005 2010
ASIA 3357 4641 4314 2958 1775
Central Asia 0 432 195 239 75
Kazakhstan 0 1 0 0 0
Kyrgyzstan 0 150 60 166 50
Tajikistan 0 226 60 73 25
Turkmenistan 0 53 7 0 0
Uzbekistan 0 1 68 0 0
East Asia 530 952 2239 1663 232
Brunei Darussalam 0 0 0 0 0
Cambodia 25 91 62 24 17
China 78 128 90 49 0
Indonesia 56 19 429 197 0
Korea DPR 0 544 1264 1180 80
Korea Republic of 0 0 0 0 0
Lao PDR 0 27 5 19 20
Malaysia 0 0 0 0 0
Mongolia 0 12 46 55 0
Myanmar 0 4 10 16 31
Philippines 160 55 218 121 82
Singapore 0 0 0 0 0
Thailand 148 2 1 1 0
Viet Nam 62 70 82 0 0
South Asia 2288 1445 937 838 1247
Afghanistan 43 133 210 208 140
Bangladesh 1050 586 269 293 194
Bhutan 5 6 4 2 3
India 382 398 321 102 16
Iran (Islamic Rep) 26 13 3 2 5
Maldives 2 3 3 11 12
Nepal 8 38 53 54 53
Pakistan 462 119 20 30 763
Sri Lanka 310 148 55 136 60
West Asia 539 1812 943 218 222
Armenia 0 476 96 22 7
Azerbaijan 0 391 28 12 0
Bahrain 0 0 0 0 0
Cyprus 0 0 0 0 0
Georgia 0 598 71 20 1
Iraq 0 102 18 36 7
Jordan 261 122 401 3 0
Kuwait 0 0 0 0 0
Lebanon 43 11 42 12 0
Occupied PalestinianTerritory
26 48 57 83 90
Saudi Arabia 0 0 0 0 0
Syrian Arab Republic 38 45 35 10 35
Turkey 14 1 0 0 0
United Arab Emirates 0 0 0 0 0
Yemen 157 18 195 21 83
LATIN AMERICA amp THECARIBBEAN
2306 939 828 632 416
Argentina 0 0 0 0 0
Bahamas 0 0 0 0 0
Barbados 0 0 0 0 0
Belize 0 0 0 0 0
Bolivia (Plur State) 262 86 80 65 8
Brazil 29 1 0 0 0
Chile 8 0 0 0 0
Colombia 5 15 12 14 12
Costa Rica 7 3 0 0 0
161
TABLE 25 Food aid received (continued)Food aid received
thousandtonnes
thousandtonnes
thousandtonnes
thousandtonnes
thousandtonnes
1990 1995 2000 2005 2010
Cuba 3 6 24 7 0
Dominica 0 7 0 0 0
Dominican Republic 40 6 2 0 50
Ecuador 77 19 42 43 3
El Salvador 203 25 3 67 3
French Guiana 0 0 0 0 0
Grenada 0 0 0 0 0
Guatemala 185 70 137 69 70
Guyana 46 33 26 0 0
Haiti 108 168 164 137 266
Honduras 146 53 68 98 3
Jamaica 293 56 46 11 0
Mexico 280 46 2 0 0
Netherlands Antilles 0 0 0 0 0
Nicaragua 232 63 62 43 2
Panama 1 2 0 0 0
Paraguay 4 1 0 0 0
Peru 359 254 149 78 0
St Kitts amp Nevis 0 0 0 0 0
St Lucia 0 3 0 0 0
St Vincent amp Grenadines 0 0 0 0 0
Suriname 0 20 0 0 0
Trinidad amp Tobago 0 0 0 0 0
Uruguay 20 0 0 0 0
Venezuela (Boliv Rep of) 0 0 11 0 0
OCEANIA 3 0 0 0 0
Fiji 0 0 0 0 0
French Polynesia 0 0 0 0 0
New Caledonia 0 0 0 0 0
Papua New Guinea 0 0 0 0 0
Samoa 0 0 0 0 0
Solomon Islands 0 0 0 0 0
Tonga 0 0 0 0 0
Vanuatu 0 0 0 0 0
DEVELOPED REGIONS 2250 1058 1883 43 0
NORTH AMERICA 0 0 0 0 0
Bermuda 0 0 0 0 0
Canada 0 0 0 0 0
United States of America 0 0 0 0 0
ASIA amp OCEANIA 1 0 0 0 0
Australia 0 0 0 0 0
Israel 1 0 0 0 0
Japan 0 0 0 0 0
New Zealand 0 0 0 0 0
EUROPE 2249 1058 1883 43 0
Albania 0 10 18 6 0
Belarus 0 98 0 0 0
Bosnia amp Herzegovina 0 23 84 0 0
Croatia 0 14 0 0 0
European Union 2249 40 1 0 0
Iceland 0 0 0 0 0
Macedonia FYR 0 0 63 0 0
Montenegro 0 0 0 0 0
Norway 0 0 0 0 0
Republic of Moldova 0 244 14 10 0
Russian Federation 0 125 1403 26 0
Serbia 0 0 0 0 0
Switzerland 0 0 0 0 0
Ukraine 0 120 0 0 0
162
DEFINITIONS AND SOURCES
Definitions and sources
Countries in protracted crisesP2HUNFAOESARHSNPC
Page table 31 (p 86)
Protracted crises are those environments in which a sig-nificant proportion of the population is acutely vulnera-ble to death disease and disruption of livelihoods overa prolonged period of time The governance of these en-vironments is usually very weak with the state having alimited capacity to respond to and mitigate the threatsto the population or provide adequate levels of protec-tion
Source Trade and Markets Division
Owner FAO
Contribution in diets by typeP2HUNFAOESSDIETCPF
Page table 16 (p 135)
Dietary contribution refers to the amount of carbohy-dratesproteinsfats expressed in kilocalories (kcal) perday available for each individual in the total populationduring the reference period Caloric content is derived byapplying the appropriate food composition factors to thequantities of the commodities Per person supplies arederived from the total amount of food available for hu-man consumption by dividing total calories by total pop-ulation actually partaking of the food supplies during thereference period However per person figures representonly the average supply available for the population asa whole and do not necessarily indicate what is actuallyconsumed by individuals The actual food consumptionmay be lower than the quantity shown as food availabil-ity depending on the magnitude of wastage and lossesof food in the household eg during storage in prepa-ration and cooking as plate-waste or quantities fed todomestic animals and pets thrown or given away
Source Statistics Division
Owner FAO
Dietary Energy Supply per personP2HUNFAOESSDIETDES
Page table 16 (p 135) chart 37 (p 93) map 20 (p 92)
Dietary energy supply per person refers to the amountof food expressed in kilocalories (kcal) per day avail-able for each individual in the total population duringthe reference period Caloric content is derived by ap-plying the appropriate food composition factors to thequantities of the commodities Per person supplies arederived from the total amount of food available for hu-man consumption by dividing total calories by total pop-ulation actually partaking of the food supplies during thereference period However per person figures representonly the average supply available for the population asa whole and do not necessarily indicate what is actuallyconsumed by individuals The actual food consumptionmay be lower than the quantity shown as food availabil-ity depending on the magnitude of wastage and losses
of food in the household eg during storage in prepa-ration and cooking as plate-waste or quantities fed todomestic animals and pets thrown or given awaySource Statistics DivisionOwner FAO
Caloric contribution in diets by commodityP2HUNFAOESSDIETFDS
Page table 40 41 (p 95 95)Contribution of a food Group to total dietary energy sup-plySource Statistics DivisionOwner FAO
Percentage contribution in diets by commodityP2HUNFAOESSDIETFDSx
Page table 16 17 (p 135 138)Percentage contribution of a food group to total dietaryenergy supplySource Statistics DivisionOwner FAO
Depth of hungerP2HUNFAOESSUNMNTDEP
Page table 15 (p 132) chart 36 (p 91)The depth of food deprivation indicates how much food-deprived people fall short of minimum food needs interms of dietary energy It is measured as the differencebetween the minimum dietary energy and the averagedietary energy intake of the undernourished population(food-deprived) The depth of food deprivation is lowwhen it is less than 200 kilocalories per person per dayand high when it is higher than 300 kilocalories per per-son per day The greater the deficit the greater the sus-ceptibility for health risks related to undernutritionSource Statistics DivisionOwner FAO
Incidence of undernourishmentP2HUNFAOESSUNMNTNUM
Page table 15 (p 132) map 19 (p 91)Undernourishment refers to the condition of peoplewhose dietary energy consumption is continuously be-low a minimum dietary energy requirement for main-taining a healthy life and carrying out a light physicalactivity The incidence of undernourishment is the num-ber of people referring to those in this conditionSource Statistics DivisionOwner FAO
Global number of undernourishedP2HUNFAOESSUNMNTPNW
Page chart 33 35 (p 89 90)Undernourishment refers to the condition of peoplewhose dietary energy consumption is continuously be-low a minimum dietary energy requirement for main-taining a healthy life and carrying out a light physical
163
PART 2
activity The global incidence of undernourishment is thetotal number of people in the world referring to those inthis condition
Source Statistics Division
Owner FAO
Percentage of population undernourishedP2HUNFAOESSUNMNTPREV
Page table 15 (p 132) map 18 (p 88)
Undernourishment refers to the condition of peoplewhose dietary energy consumption is continuously be-low a minimum dietary energy requirement for main-taining a healthy life and carrying out a light physicalactivity The percentage of population undernourishedis the total number of people in each country referringto those in this condition divided by the population ofthat country
Source Statistics Division
Owner FAO
Regional percentage of undernourishedP2HUNFAOESSUNMNTPREVR
Page chart 34 (p 90)
Undernourishment refers to the condition of peoplewhose dietary energy consumption is continuously be-low a minimum dietary energy requirement for main-taining a healthy life and carrying out a light physicalactivity The regional percentage of population under-nourished is the total number of people in each regionreferring to those in this condition divided by the popu-lation of that region
Source Statistics Division
Owner FAO
Global affordability of foodP2HUNFAOFPVAFD
Page chart 54 (p 106)
FAO Food Price Index relative to GDP showing howmuchfood prices have risen relative to income from the baseperiod 2002-04 Higer (lower) index scores show greater(less) affordability
Source Statistics Division
Owner FAO
Food price inflationP2HUNFAOFPVFCPI
Page map 25 (p 104)
Annual change in the ILO food price indices The pricedata for the different items included in the computationof the index are normally weighted in order to take intoaccount the relative importance of each item with re-spect to total consumption expenditure In most coun-tries the indices are computed in a derived form suchas weighted arithmetic averages of price relatives fora selected number of representative items between theperiod under consideration and the base period using
one or other forms of Laspeyresrsquo formula The num-ber of items and the weights used to compute the in-dex are given according to expenditure group The termitem is used here to mean the smallest grouping ofgoods and services for which a specific weight is givenThe source(s) and the reference period of the weightsused for the index eg a household expenditure surveynational accounts etc If the reference period for theweights differs from the base period of the index theadjustments made to the weights to take account of theprice changes between the two periods are describedSee httplaborstailoorg for more informationSource LABORSTAOwner ILO
International food prices by food groupP2HUNFAOFPVFPI
Page chart 53 (p 106)The FAO Food Price Index is a measure of themonthly change in international prices of a bas-ket of food commodities It consists of the av-erage of five commodity group price indices (rep-resenting 55 quotations) weighted with the aver-age export shares of each of the groups for 2002-2004 See httpwwwfaoorgworldfoodsituationwfs-homefoodpricesindexen for more information on sub-index constructionSource Statistics DivisionOwner FAO
International food price volatility by food groupP2HUNFAOFPVFPV
Page chart 55 56 (p 107 107)Annualized historical volatility of the FAO Food Price In-dexSource Statistics DivisionOwner FAO
Food price volatility (annualized historical volatility)P2HUNFAOFPVFPVn
Page map 26 (p 108)Annualized historical volatility of the ILO food price in-dicesSource Statistics DivisionOwner FAO
FAO Global Consumption price volatilityP2HUNFAOFPVGCI
Page chart 52 57 (p 105 109)The FAO Global Food Consumption Price Index trackschanges in the cost of the global food basket as por-trayed by the latest FAO world food balance sheet Rep-resentative international prices for each of the commodi-ties or commodity groups appearing in the balance sheetare weighted by their contribution to total calorific in-takeSource Statistics DivisionOwner FAO
164
DEFINITIONS AND SOURCES
Dietary diversity in selected LIFDCs
P2HUNFAOFVDIETDIV
Page chart 39 (p 94)
The Herfindahl index H is calculated as H =sumN=1 S
2
where S is the consumption share of the starchy staple in diets and N is the number of staples consumed For asingle staple consumed the index would equate to oneand declines as the staple base becomes more diversi-fied
Source Statistics Division
Owner FAO
Starchy root consumption and DES
P2HUNFAOFVDIETRTDES
Page chart 38 (p 94)
Caloric equivalent of starchy roots available for con-sumption as a ratio of total dietary energy supply
Source Statistics Division
Owner FAO
Availability of dietary iron
P2HUNFAOMCNIRON
Page table 18 (p 141) chart 44 (p 98)
The dietary availability of iron is calculated by convert-ing the amount of food available for human consumptionas estimated by the FAO Food Balance Sheets in equiv-alent of iron derived from animal and vegetal productsHowever the actual food consumptionmay be lower thanthe quantity shown as food availability depending on themagnitude of wastage and losses of food in the house-hold eg during storage in preparation and cooking asplate-waste or quantities fed to domestic animals andpets thrown or given away
Source Statistics Division
Owner FAO
Food + energy import bills ( GDP)
P2HUNFAOTFSFDFL
Page table 20 (p 147)
The annual value of food imported under SITC sections0 + 22+ 4 plus fuels under SITC section 3 expressed asa ratio of GDP
Source Statistics Division (FAOSTAT) and UNCTADSTAT
Owner FAO UNCTAD
Food import bills
P2HUNFAOTFSFIB
Page table 20 (p 147) chart 49 50 51 (p 103 103103)
The annual value of food imported under SITC sections0 + 22+ 4 expressed in current US$
Source Statistics Division (FAOSTAT) and UNCTADSTAT
Owner FAO UNCTAD
Food + energy import bills per capita
P2HUNFAOTFSFUEL
Page chart 50 51 (p 103 103)
The annual value of food imported under SITC sections0 + 22+ 4 plus fuels under SITC section 3 expressed asa ratio of population
Source Statistics Division (FAOSTAT) and UNCTADSTAT
Owner FAO UNCTAD
Index of variability of food production
P2HUNFAOTFSQPVAR
Page chart 46 (p 102)
Rolling ten-year window of the coefficient of variation ofper capita production index
Source Statistics Division
Owner FAO
Food self-sufficiency (calories)
P2HUNFAOTFSSSCAL
Page table 19 (p 144) chart 45 (p 101) map 24 (p100)
The self-sufficiency ratio (SSR) is defined as SSR = pro-duction x 100(production + imports - exports) The SSRcan be calculated for individual commodities groups ofcommodities of similar nutritional values and after ap-propriate conversion of the commodity equations alsofor the aggregate of all commodities In the context offood security the SSR is often taken to indicate the ex-tent to which a country relies on its own production re-sources ie the higher the ratio the greater the self-sufficiency While the SSR can be the appropriate toolwhen assessing the supply situation for individual com-modities a certain degree of caution should be observedwhen looking at the overall food situation In the casehowever where a large part of a countryrsquos production ofone commodity eg other cereals is exported the SSRmay be very high but the country may still have to relyheavily on imports of food commodities to feed the pop-ulation The self-sufficiency rate (as defined above) can-not be the complement to 100 of the import dependencyrate or vice-versa
Source Statistics Division
Owner FAO
Months of cereal self-provisioning capacity
P2HUNFAOTFSSTU
Page chart 47 48 (p 102 103)
Stocks-to-utilization ratios for cereals (wheat rice andcoarse grains) where stocks refer to the carry-over ofthe preceding national crop season The ratio is thenmultiplied by 12 to calculate the number of months ofself-provisioning capacity in a given year
Source Trade and Markets Division
Owner FAO
165
PART 2
Persons affected by natural disastersP2HUNODFAEMDATRHSPPND
Page table 14 (p 129) chart 29 (p 85) map 16 (p 84)People requiring immediate assistance during a periodof emergency ie requiring basic survival needs suchas food water shelter sanitation and immediate med-ical assistance Appearance of a significant number ofcases of an infectious disease introduced in a region ora population that is usually free from that disease Seewwwemdatnet (Universiteacute catholique de Louvain Brus-sels Belgium)Source International Disaster Database EM-DATOwner OFDA and CRED
Total affected by natural disastersP2HUNODFAEMDATRHSPPNDT
Page chart 30 (p 86)Sum of (i) injured people suffering from physical injuriestrauma or an illness requiring medical treatment as a di-rect result of a disaster (ii) homeless people needing im-mediate assistance for shelter and (iii) affected peoplerequiring immediate assistance during a period of emer-gency it can also include displaced or evacuated peopleSee wwwemdatnet (Universiteacute catholique de LouvainBrussels Belgium)Source International Disaster Database EM-DATOwner OFDA and CRED
Multidimensional Poverty IndexP2HUNUNDPHDRMPI
Page table 21 (p 150)An international measure of poverty for 109 developingcountries the MPI complements income-based povertymeasures by reflecting the multiple deprivations thatpeople face at the same time The MPI identifies de-privations across health education and living standardsand shows the number of people who are multidimen-sionally poor and the deprivations that they face at thehousehold levelSource Alkire S Roche JM Santos ME and Seth S(November 2011) ophiqehoxacukOwner OPHI
Gender Inequality IndexP2HUNUNDPHDRPOVGEI
Page table 22 (p 153) map 29 (p 113)The Gender Inequality Index is a composite measure re-flecting inequality in achievements between women andmen in three dimensions reproductive health empow-erment and the labour market It varies between zero(when women and men fare equally) and one (when menor women fare poorly compared to the other in all di-mensions) The health dimension is measured by twoindicators maternal mortality ratio and the adolescentfertility rate The empowerment dimension is also mea-sured by two indicators the share of parliamentary seatsheld by each sex and by secondary and higher educationattainment levels The labour dimension is measured by
womenrsquos participation in the work force The Gender In-equality Index is designed to reveal the extent to whichnational human development achievements are erodedby gender inequality and to provide empirical founda-tions for policy analysis and advocacy effortsSource Human Development Report 2010Owner UNDP
Human Development IndexP2HUNUNDPHDRPOVHDI
Page table 22 (p 153)The HDI represents a national average of human de-velopment achievements in the three basic dimensionsmaking up the HDI health education and income Likeall averages it conceals disparities in human develop-ment across the population within the same countryTwo countries with different distributions of achieve-ments can have the same average HDI value The IHDItakes into account not only the average achievements ofa country on health education and income but also howthose achievements are distributed among its citizens bydiscounting each dimensionrsquos average value accordingto its level of inequalitySource Human Development Report 2010Owner UNDP
Human Development Index (inequality adjusted)P2HUNUNDPHDRPOVHDIi
Page table 22 (p 153) chart 59 (p 112)The Human Development Index (HDI) is a summary mea-sure of human development It measures the averageachievements in a country in three basic dimensionsof human development a long and healthy life ac-cess to knowledge and a decent standard of living TheInequality-adjusted Human Development Index (IHDI)adjusts the Human Development Index (HDI) for inequal-ity in distribution of each dimension across the popula-tion The IHDI accounts for inequalities in HDI dimen-sions by discounting each dimensionrsquos average valueaccording to its level of inequality The IHDI equals theHDI when there is no inequality across people but is lessthan the HDI as inequality rises In this sense the IHDI isthe actual level of human development (accounting forthis inequality) while the HDI can be viewed as an in-dex of potential human development (or the maximumlevel of HDI) that could be achieved if there was no in-equality The loss in potential human development dueto inequality is given by the difference between the HDIand the IHDI and can be expressed as a percentageSource Human Development Report 2010Owner UNDP
Population of concernP2HUNUNHCRGTRHSTPC
Page table 13 (p 126) map 17 (p 87)Refugees are individuals recognized under the 1951Convention relating to the Status of Refugees and alsopeople in a refugee-like situation such as those who
166
DEFINITIONS AND SOURCES
are outside their country or territory of origin and whoface protection risks similar to those of refugees butfor whom refugee status has for practical or other rea-sons not been ascertained Internally Displaced Persons(IDPs) are people or groups of individuals who have beenforced to leave their homes or places of habitual resi-dence in particular as a result of or in order to avoidthe effects of armed conflict situations of generalized vi-olence violations of human rights or natural- or human-made disasters and who have not crossed an interna-tional border Others include Asylum-seekers (personswho have applied for asylum or refugee status but whohave not yet received a final decision on their applica-tion) Returned IDPs and refugees Stateless Persons (in-dividuals not considered as nationals by any State underrelevant national laws) and other groups of concern towhom UNHCR has extended its protection andor assis-tance services based on humanitarian or other specialgrounds
Source Statistical Online Population Database
Owner UNHCR
Total population of concern
P2HUNUNHCRGTRHSTPCT
Page chart 32 (p 87)
Total population of concern is the sum of various groupsof people including refugees asylum-seekers internallydisplaced persons (IDPs) protectedassisted by UNHCRstateless persons and returnees (returned refugees andIDPs)
Source Statistical Online Population Database
Owner UNHCR
Average governance
P2HUNWBKPOVGOV
Page table 23 (p 156) chart 60 (p 115) map 30 (p114)
The Worldwide Governance Indicators project constructsaggregate indicators of six broad dimensions of gover-nance (i) Voice and Accountability (ii) Political Stabil-ity and Absence of ViolenceTerrorism (iii) GovernmentEffectiveness (iv) Regulatory Quality (v) Rule of Law(vi) Control of Corruption The six aggregate indicatorsare based on 30 underlying data sources reporting theperceptions of governance of a large number of surveyrespondents and expert assessments worldwide De-tails on the underlying data sources the aggregationmethod and the interpretation of the indicators can befound in the WGI methodology paper Daniel KaufmannAart Kraay and Massimo Mastruzzi (2010) The World-wide Governance Indicators A Summary of Methodol-ogy Data and Analytical Issues World Bank Policy Re-search Working Paper No 5430 httppapersssrncomsol3paperscfmabstract_id=1682130
Source World Bank
Owner Worldwide Governance Indicators (WGI) project
Ratio of girls-to-boys out of primary school
P2HUNWBKWDIEDUCOSR
Page table 24 (p 159)
Children out of school are the number of primary-school-age children not enrolled in primary or secondary school
Source World Bank (WDI)
Owner UNESCO
Public spending on education total ( of GDP)
P2HUNWBKWDIEDUEXPP
Page table 24 (p 159)
Public expenditure on education consists of current andcapital public expenditure on education includes gov-ernment spending on educational institutions (both pub-lic and private) education administration as well assubsidies for private entities (studentshouseholds andother privates entities)
Source World Bank (WDI)
Owner UNESCO
Expenditure per student
P2HUNWBKWDIEDUEXPS
Page table 24 (p 159)
Public expenditure per student is the public currentspending on education divided by the total number ofstudents by level as a percentage of GDP per capitaPublic expenditure (current and capital) includes govern-ment spending on educational institutions (both publicand private) education administration as well as subsi-dies for private entities (studentshouseholds and otherprivates entities)
Source World Bank (WDI)
Owner UNESCO
Literacy rate adult female ( of females ages 15 andabove)
P2HUNWBKWDIEDUFILT
Page table 24 (p 159) map 31 (p 116)
Adult literacy rate is the percentage of people ages 15and above who can with understanding read and writea short simple statement on their everyday life
Source World Bank (WDI)
Owner UNESCO
Ratio of girls to boys in primary and secondary education()
P2HUNWBKWDIEDUGEN
Page table 24 (p 159) chart 61 (p 117)
Ratio of girls to boys in primary and secondary educationis the ratio of the female to male gross enrolment ratesin primary and secondary school
Source World Bank (WDI)
Owner UNESCO
167
PART 2
Health expenditure per capita (current US$)P2HUNWBKWDIHAEHEPCP
Page table 24 (p 159) map 32 (p 118)
Total health expenditure is the sum of public and pri-vate health expenditures as a ratio of total populationIt covers the provision of health services (preventive andcurative) family planning activities nutrition activitiesand emergency aid designated for health but does notinclude provision of water and sanitation Data are incurrent US dollars
Source World Bank (WDI)
Owner WHO
Health expenditure total ( of GDP)P2HUNWBKWDIHAEHETOT
Page table 24 (p 159) chart 62 (p 119)
Total health expenditure is the sum of public and privatehealth expenditure It covers the provision of health ser-vices (preventive and curative) family planning activi-ties nutrition activities and emergency aid designatedfor health but does not include provision of water andsanitation
Source World Bank (WDI)
Owner WHO
Prevalence of HIV total ( of population ages 15-49)P2HUNWBKWDIHAEHIVPREV
Page table 24 (p 159)
Prevalence of HIV refers to the percentage of people ages15-49 who are infected with HIV
Source World Bank (WDI)
Owner UNAIDS and WHO
Improved sanitation facilities ( of population with ac-cess)P2HUNWBKWDIHAESANIMPS
Page table 24 (p 159) chart 63 (p 121)
Access to improved sanitation facilities refers to the per-centage of the population with at least adequate accessto excreta disposal facilities that can effectively preventhuman animal and insect contact with excreta Im-proved facilities range from simple but protected pit la-trines to flush toilets with a sewerage connection Tobe effective facilities must be correctly constructed andproperly maintained
Source World Bank (WDI)
Owner WHO and UNCF
Improved water source rural ( of rural population withaccess)P2HUNWBKWDIHAEWATIMPRU
Page table 24 (p 159) map 33 (p 120)
Access to an improved water source refers to the percent-age of the population with reasonable access to an ad-equate amount of water from an improved source suchas a household connection public standpipe borehole
protected well or spring and rainwater collection Unim-proved sources include vendors tanker trucks and un-protected wells and springs Reasonable access is de-fined as the availability of at least 20 litres a person aday from a source within one kilometre of the dwellingSource World Bank (WDI)Owner WHO and UNCF
Improved water source urban ( of urban populationwith access)P2HUNWBKWDIHAEWATIMPWU
Page table 24 (p 159)Access to an improved water source refers to the percent-age of the population with reasonable access to an ad-equate amount of water from an improved source suchas a household connection public standpipe boreholeprotected well or spring and rainwater collection Unim-proved sources include vendors tanker trucks and un-protected wells and springs Reasonable access is de-fined as the availability of at least 20 litres a person aday from a source within one kilometre of the dwellingSource World Bank (WDI)Owner WHO and UNCF
Poverty headcount ratio at $125 a day (PPP) ( of re-gional population)P2HUNWBKWDIPOVAGG
Page chart 58 (p 111)Data are from PovcalNet the on-line tool for povertymeasurement developed by the Development ResearchGroup of the World Bank See httpiresearchworldbankorgPovcalNetpovDuplichtmlSource PovcalNetOwner World Bank
Gini-index of income distributionP2HUNWBKWDIPOVGINI
Page table 22 (p 153) map 28 (p 113)Gini index measures the extent to which the distribu-tion of income among individuals or households withinan economy deviates from a perfectly equal distributionA Lorenz curve plots the cumulative percentages of totalincome received against the cumulative number of recip-ients starting with the poorest individual or householdThe Gini index measures the area between the Lorenzcurve and a hypothetical line of absolute equality ex-pressed as a percentage of the maximum area under theline Thus a Gini index of 0 represents perfect equalitywhile an index of 100 implies perfect inequalitySource World Bank (WDI)Owner World Bank
Poverty headcount ratio at $125 a day (PPP) ( of pop-ulation)P2HUNWBKWDIPOVH125
Page table 21 (p 150)Population below US$125 a day is the percentage of thepopulation living on less than US$125 a day at 2005
168
DEFINITIONS AND SOURCES
international prices As a result of revisions in PPP ex-change rates poverty rates for individual countries can-not be compared with poverty rates reported in earliereditionsSource World Bank (WDI)Owner World Bank
Income share held by highest 20P2HUNWBKWDIPOVH20
Page table 22 (p 153)Percentage share of income or consumption is the sharethat accrues to subgroups of population indicated bydeciles or quintiles Percentage shares by quintile maynot sum to 100 because of roundingSource World Bank (WDI)Owner World Bank
Poverty headcount ratio at $2 a day (PPP) ( of popula-tion)P2HUNWBKWDIPOVH200
Page table 21 (p 150)Population below US$2 a day is the percentage of thepopulation living on less than US$200 a day at 2005international prices As a result of revisions in PPP ex-change rates poverty rates for individual countries can-not be compared with poverty rates reported in earliereditionsSource World Bank (WDI)Owner World Bank
Poverty headcount ratio at national poverty line ( ofpopulation)P2HUNWBKWDIPOVHNPL
Page table 21 (p 150)National poverty rate is the percentage of the popula-tion living below the national poverty line National es-timates are based on population-weighted subgroup es-timates from household surveysSource World Bank (WDI)Owner World Bank
Poverty headcount ratio at rural poverty line ( of ruralpopulation)P2HUNWBKWDIPOVHRPL
Page table 21 (p 150)Rural poverty rate is the percentage of the rural popula-tion living below the national rural poverty lineSource World Bank (WDI)Owner World Bank
Income share held by lowest 20P2HUNWBKWDIPOVL20
Page table 22 (p 153)Percentage share of income or consumption is the sharethat accrues to subgroups of population indicated bydeciles or quintiles Percentage shares by quintile maynot sum to 100 because of roundingSource World Bank (WDI)Owner World Bank
Poverty gap at $125 a day (PPP) ()P2HUNWBKWDIPOVP125
Page table 21 (p 150) map 27 (p 110)Poverty gap is the mean shortfall from the poverty line(counting the nonpoor as having zero shortfall) ex-pressed as a percentage of the poverty line This mea-sure reflects the depth of poverty as well as its incidenceSource World Bank (WDI)Owner World Bank
Poverty gap at $2 a day (PPP) ()P2HUNWBKWDIPOVP200
Page table 21 (p 150)Poverty gap is the mean shortfall from the poverty line(counting the nonpoor as having zero shortfall) ex-pressed as a percentage of the poverty line This mea-sure reflects the depth of poverty as well as its incidenceSource World Bank (WDI)Owner World Bank
Poverty gap at national poverty line ()P2HUNWBKWDIPOVPNPL
Page table 21 (p 150)Poverty gap at national poverty line is the mean short-fall from the poverty line (counting the nonpoor as hav-ing zero shortfall) as a percentage of the poverty lineThis measure reflects the depth of poverty as well as itsincidenceSource World Bank (WDI)Owner World Bank
Poverty gap at rural poverty line ()P2HUNWBKWDIPOVPRPL
Page table 21 (p 150)Poverty gap at rural poverty line is the mean shortfallfrom the poverty line (counting the nonpoor as hav-ing zero shortfall) as a percentage of the national ruralpoverty line This measure reflects the depth of povertyas well as its incidenceSource World Bank (WDI)Owner World Bank
Food aid receivedP2HUNWFPFAISFDAID
Page table 25 (p 162) chart 64 (p 123) map 34 (p122)Quantity of food aid that reaches the recipient coun-try during a given period Quantities exported in GrainEquivalent The latter is a unit of measurement usedas alternative to Actual Ton for cereal-derived productsTo convert a product into grain equivalent a commodityspecific conversion factor is used For example if the fac-tor to convert wheat flour into wheat is 137 a tonne ofwheat flour corresponds to 0730 tons of wheat (1137)Source Food Aid Information SystemOwner WFP
169
PART 2
Percentage of adults with low body mass index (BMI)P2HUNWHOGHOADLTLBMI
Page table 18 (p 141)The indicator of weight adequacy in relation to height ofolder children adolescents and adults It is calculated asweight (kilograms) divided by height (metres) squaredThe acceptable range for adults is 185 to 249 and forchildren it varies with ageSource Global Health ObservatoryOwner WHO
Percentage of female adults with low body mass index(BMI)P2HUNWHOGHOADLTLBMIF
Page table 18 (p 141) map 22 (p 99)The indicator of weight adequacy in relation to height ofolder female children adolescents and adults It is cal-culated as weight (kilograms) divided by height (metres)squared The acceptable range for adults is 185 to 249 and for children it varies with ageSource Global Health ObservatoryOwner WHO
Percentage of adults who are obese by genderP2HUNWHOGHOADLTOBS
Page table 18 (p 141)Percentage of male and female defined population witha body mass index (BMI) of 25 kgm2 or higherSource Global Health ObservatoryOwner WHO
Percentage of adults who are obeseP2HUNWHOGHOADLTOBSx
Page map 23 (p 99)Percentage of adult defined population with a bodymassindex (BMI) of 25 kgm2 or higherSource Global Health ObservatoryOwner WHO
Percentage of children under 5 who are stuntedP2HUNWHOGHOCHLDSTNT
Page table 18 (p 141) chart 43 (p 98)Percentage of stunting (height-for-age less than -2 stan-dard deviations of the WHO Child Growth Standards me-dian) among children aged 0-5 yearsSource Global Health ObservatoryOwner WHO
Percentage of children under 5 who are underweightP2HUNWHOGHOCHLDUW
Page table 18 (p 141) chart 42 (p 97) map 21 (p 96)Percentage of underweight (weight-for-age less than -2standard deviations of the WHO Child Growth Standardsmedian) among children aged 0-5 yearsSource Global Health ObservatoryOwner WHO
Percentage of children under 5 who are wastedP2HUNWHOGHOCHLDWSTD
Page table 18 (p 141) chart 43 (p 98)Percentage of wasting (weight-for-height less than -2standard deviations of the WHO Child Growth Standardsmedian) among children aged 0-5 yearsSource Global Health ObservatoryOwner WHO
Percentage of newborns with low birth weightP2HUNWHOGHONEWLWB
Page table 18 (p 141)Low-birthweight babies are newborns weighing lessthan 2500 grams with the measurement taken withinthe first hours of life before significant postnatal weightloss has occurredSource Global Health ObservatoryOwner WHO
170

PART 2
Improving access to safe water and sanitation cangreatly reduce the burden on health systems and pro-mote wider development According to the United Na-tions Childrenrsquos Fund (UNICEF) 25 billion people in de-veloping countries ndash around 50 percent of their popula-tion ndash lack improved sanitation facilities and over 884million still use unsafe drinking water sources
Inadequate access to safe water and sanitation servicescoupled with poor hygiene practices kills and sickensthousands of children every day and leads to impov-erishment and diminished opportunities for thousandsmore Estimates point to some 2 million people dyingevery year as a result of diarrhoea and diseases causedby ingesting contaminated water
Poor water and sanitation have many other seriousrepercussions as well Children especially girls are de-nied their right to education because schools lack pri-vate and decent sanitation facilities Women and girlsare forced to spend large parts of their day searching forand fetching water denying them participation in edu-cation and income-generating employment
Inadequate water and sanitation means that poor farm-ers and wage earners are less productive due to ill-ness health systems are overwhelmed and nationaleconomies underperform
Further reading
bull UNESCO education (wwwunescoorgneweneducation)
bull UNICEF Water Sanitation and Hygiene (wwwuniceforgwash)
bull WHO The world health report - Health systems financ-ing the path to universal coverage (wwwwhointwhr2010enindexhtml
bull UNDP Human Development Report 2010 (hdrundporgenreportsglobalhdr2010)
bull OrsquoDonovan (2008)
Map 33
No Data lt 30 30 minus 50 50 minus 75 75 minus 90 gt 90
Improved water source minus share of rural population with access ( 2008)
Source WHO
Metalink P2HUNWBKWDIHAEWATIMPRU p 168
rarr 78 percent of the worldrsquos rural popula-tion now have access to clean water
rarr Progress has been slow - just 15 percentmore than two decades ago
rarr Yet in many developing countries morethan half of all households struggle withinadequate access to safe water and san-itation services
120
EDUCATION HEALTH AND SANITATION
No Data lt 30 30 minus 50 50 minus 75 75 minus 90 gt 90
Improved water source minus share of rural population with access ( 2008)
Chart 63 There are still many who do not have access to adequate sanitation
Improved sanitation facilities - share of population with access (2008)
0
20
40
60
80
DevelopedEastAsia
LAmer ampCarib
SouthAsia
Sub-SAfrica
Source WHO
Metalink P2HUNWBKWDIHAESANIMPS p 168
121
PART 2
Food aidEmergency situations have become increasingly fre-quent over the past 25 years and are often coupled withacute and chronic food insecurity in the affected coun-tries International responses to these crises have gen-erally focused on addressing immediate humanitarianneeds as evidenced by the growing share of food aidthat is channelled to emergencies
Several formal agreements govern food-related assis-tance at the international level Among these the FoodAid Convention (FAC) is the only legal instrument to en-sure a minimum amount of food aid The components ofthe FAC have remained largely unchanged since its cre-ation in 1967 and many believe that it no longer appliesto todayrsquos food-related assistance needs Current foodaid patterns do not reflect longer-term requirements In2009 around 80 percent of total assistance was chan-nelled to emergency relief measures while the remain-der was used for promoting agricultural and broader eco-nomic development More troubling is the perceivedhigh negative correlation of international food priceswith the level of food aid
The strong focus on short-term relief measures com-bined with limited support to local agriculture is notonly less effective for overcoming the structural reasonsfor food insecurity it might even lower incentives to in-vest in agriculture and domestic food production Amoresustainable solution is required to tackle the underlyingreasons for food insecurity such as low agricultural pro-ductivity Accordingly those most in need would alsobenefit from the provision of basic inputs such as seedsfertilizers and farming tools
Donors are addressing shortcomings of traditional foodassistance A growing number now rely on procurementmechanisms in the target countries themselves Localpurchases not only minimize market distortions (sup-plies are neither increased nor effective demand low-ered) they are also generally cheaper than in-kind aidand can generate development benefits to local marketsand farmers Some donors also strive for better inte-gration of emergency interventions and longer-term de-velopment operations The European Union for exam-ple envisages a rapid handover to structural food se-curity mechanisms during emergency response Suchmeasures help rebuild the livelihoods of affected pop-ulations and strengthen their resilience to future crises
These examples illustrate a fundamental departure fromthe ad hoc and partial approaches to food security inter-ventions followed in the past They also point to donorsrsquogeneral agreement on the principles that should guidefood aid interventions
Further reading
bull FAO Making the Food Aid Convention meet the re-alities of the 21st century (wwwfaoorgdocrep013al935eal935e00pdf)
bull World Food Programme (wwwwfporg)
Map 34
No Data 0 0001 minus 1 1 minus 50 50 minus 100 gt 100
Food aid received grain equivalent (thousand tonnes 2010)
Source WFP
Metalink P2HUNWFPFAISFDAID p 169
rarr 57 million tonnes of food aid were re-ceived in 2010
rarr Despite no let-up in the number of emer-gencies food aid fell to a historical low
rarr Many donors now rely on locally pur-chased food in order to strengthen do-mestic markets in crisis-hit countries
122
FOOD AID
No Data 0 0001 minus 1 1 minus 50 50 minus 100 gt 100
Food aid received grain equivalent (thousand tonnes 2010)
Chart 64 Food aid flows are in long-term decline and have fallen further at a time whenfood prices have spiked
Food aid received (1988-2010)
Thousandtonnes
6000
8000
10000
12000
14000
16000
1990 1995 2000 2005 2010
Source WFP
Metalink P2HUNWFPFAISFDAID p 169
123
TABLE 13 Population at risk UNHCR population of concernUNHCR population of concern
total totalrefugees
internallydisplacedpersons
others andstatelesspersons
total totalrefugees
internallydisplacedpersons
others andstatelesspersons
thousands thousands thousands thousands thousands thousands thousands thousands
2009 2009 2009 2009 2010 2010 2010 2010
WORLD 29233 10174 15628 3431 29986 10350 14456 5180
DEVELOPING REGIONS 28139 9642 15207 3290 28931 9845 14058 5027
AFRICA 10636 2805 6469 1362 10587 2947 6154 1486
North Africa 143 138 0 5 142 137 0 5
Algeria 10 8 0 2 8 7 0 2
Egypt 9 7 0 2 9 7 0 2
Libya 3 2 0 1 3 2 0 1
Morocco 3 2 0 1 3 2 0 1
Tunisia 3 2 0 1 3 2 0 1
Sub-Saharan Africa 10493 2667 6469 1357 10445 2810 6154 1481
Angola 159 141 0 18 136 135 0 1
Benin 1 0 0 0 1 0 0 0
Botswana 0 0 0 0 0 0 0 0
Burkina Faso 1 1 0 0 2 1 0 1
Burundi 231 94 100 37 254 84 157 12
Cameroon 17 15 0 2 17 15 0 2
Cape Verde 0 0 0 0 0 0 0 0
Central African Republic 357 160 197 1 359 165 193 2
Chad 250 55 171 25 237 54 131 53
Comoros 0 0 0 0 0 0 0 0
Congo 24 21 0 3 24 21 0 3
Cocircte drsquoIvoire 714 23 519 172 585 42 515 29
Congo Dem Rep 2663 456 2053 154 2719 477 1721 520
Djibouti 1 1 0 0 1 1 0 0
Equatorial Guinea 0 0 0 0 0 0 0 0
Eritrea 224 209 0 14 236 222 0 14
Ethiopia 112 63 0 49 118 69 0 49
Gabon 0 0 0 0 0 0 0 0
Gambia 5 2 0 3 3 2 0 1
Ghana 16 15 0 1 22 20 0 2
Guinea 14 11 0 3 15 12 0 3
Guinea-Bissau 1 1 0 0 1 1 0 0
Kenya 417 10 399 8 311 9 300 2
Lesotho 0 0 0 0 0 0 0 0
Liberia 78 72 0 6 73 70 0 3
Madagascar 0 0 0 0 0 0 0 0
Malawi 0 0 0 0 0 0 0 0
Mali 4 3 0 1 4 4 0 0
Mauritania 52 39 0 13 40 38 0 2
Mauritius 0 0 0 0 0 0 0 0
Mozambique 0 0 0 0 0 0 0 0
Namibia 1 1 0 0 1 1 0 0
Niger 1 1 0 0 1 1 0 0
Nigeria 25 16 0 10 28 16 0 12
Rwanda 155 129 0 25 136 115 0 21
Senegal 17 16 0 1 18 16 0 2
Seychelles 0 0 0 0 0 0 0 0
Sierra Leone 19 15 0 3 15 11 0 3
Somalia 2249 678 1550 21 2257 770 1464 23
Sudan 1619 368 1034 217 2185 387 1548 250
South Africa 1 0 0 0 1 0 0 0
Swaziland 0 0 0 0 0 0 0 0
Tanzania Utd Rep 156 1 0 155 164 1 0 162
Togo 20 18 0 1 19 18 0 1
Uganda 863 8 446 409 436 6 126 304
Zambia 0 0 0 0 0 0 0 0
Zimbabwe 24 22 0 1 25 24 0 1
124
TABLE 13 Population at risk UNHCR population of concern (continued)UNHCR population of concern
total totalrefugees
internallydisplacedpersons
others andstatelesspersons
total totalrefugees
internallydisplacedpersons
others andstatelesspersons
thousands thousands thousands thousands thousands thousands thousands thousands
2009 2009 2009 2009 2010 2010 2010 2010
ASIA 13602 6372 5435 1796 14103 6425 4232 3446
Central Asia 17 14 0 3 301 17 60 224
Kazakhstan 4 4 0 1 4 4 0 1
Kyrgyzstan 3 3 0 0 284 3 60 222
Tajikistan 1 1 0 0 1 1 0 0
Turkmenistan 1 1 0 0 1 1 0 0
Uzbekistan 8 7 0 2 10 9 0 2
East Asia 1153 975 67 110 1303 986 202 115
Brunei Darussalam 0 0 0 0 0 0 0 0
Cambodia 17 17 0 0 16 16 0 0
China 199 181 0 18 192 185 0 8
Indonesia 21 18 0 2 17 17 0 0
Korea DPR 1 1 0 0 1 1 0 0
Korea Republic of 1 1 0 0 1 1 0 0
Lao PDR 9 8 0 0 8 8 0 0
Malaysia 62 1 0 61 1 1 0 0
Mongolia 4 1 0 2 4 2 0 2
Myanmar 497 407 67 23 500 416 62 22
Philippines 2 1 0 1 221 1 140 81
Singapore 0 0 0 0 0 0 0 0
Thailand 1 1 0 0 1 0 0 0
Viet Nam 341 339 0 1 340 339 0 1
South Asia 7225 3265 2627 1334 7400 3413 1578 2409
Afghanistan 3279 2887 297 95 4404 3055 352 998
Bangladesh 12 10 0 2 17 10 0 7
Bhutan 90 89 0 1 76 75 0 1
India 24 20 0 5 22 18 0 4
Iran (Islamic Rep) 87 73 0 14 85 69 0 16
Maldives 0 0 0 0 0 0 0 0
Nepal 7 5 0 2 7 6 0 1
Pakistan 3041 35 1895 1111 2199 40 952 1207
Sri Lanka 684 146 435 104 590 141 274 175
West Asia 5206 2117 2741 349 5100 2010 2393 698
Armenia 104 18 0 86 103 18 0 85
Azerbaijan 606 17 586 3 612 17 593 2
Bahrain 0 0 0 0 0 0 0 0
Cyprus 0 0 0 0 0 0 0 0
Georgia 378 15 353 10 378 11 236 131
Iraq 3565 1785 1552 228 3387 1684 1344 360
Jordan 3 2 0 1 3 2 0 1
Kuwait 1 1 0 0 1 1 0 0
Lebanon 18 16 0 2 17 16 0 2
Occupied PalestinianTerritory
98 95 0 3 97 93 0 3
Saudi Arabia 1 1 0 0 1 1 0 0
Syrian Arab Republic 23 18 0 6 28 18 0 10
Turkey 156 146 0 10 155 147 0 8
United Arab Emirates 0 0 0 0 0 0 0 0
Yemen 253 2 250 1 318 2 221 95
LATIN AMERICA amp THECARIBBEAN
3898 463 3304 132 4238 471 3672 95
Argentina 1 1 0 0 1 1 0 0
Bahamas 0 0 0 0 0 0 0 0
Barbados 0 0 0 0 0 0 0 0
Belize 0 0 0 0 0 0 0 0
Bolivia (Plur State) 1 1 0 0 1 1 0 0
Brazil 1 1 0 0 1 1 0 0
Chile 1 1 0 0 1 1 0 0
Colombia 3758 390 3304 64 4128 396 3672 60
Costa Rica 0 0 0 0 0 0 0 0
125
TABLE 13 Population at risk UNHCR population of concern (continued)UNHCR population of concern
total totalrefugees
internallydisplacedpersons
others andstatelesspersons
total totalrefugees
internallydisplacedpersons
others andstatelesspersons
thousands thousands thousands thousands thousands thousands thousands thousands
2009 2009 2009 2009 2010 2010 2010 2010
Cuba 10 8 0 2 12 7 0 4
Dominica 0 0 0 0 0 0 0 0
Dominican Republic 1 0 0 0 1 0 0 0
Ecuador 1 1 0 0 1 1 0 0
El Salvador 15 5 0 10 7 5 0 2
French Guiana 0 0 0 0 0 0 0 0
Grenada 0 0 0 0 0 0 0 0
Guatemala 15 6 0 9 7 6 0 1
Guyana 1 1 0 0 1 1 0 0
Haiti 36 24 0 12 33 26 0 7
Honduras 2 1 0 1 2 1 0 1
Jamaica 1 1 0 1 2 1 0 1
Mexico 27 6 0 20 17 7 0 10
Netherlands Antilles
Nicaragua 2 1 0 0 2 1 0 0
Panama 0 0 0 0 0 0 0 0
Paraguay 0 0 0 0 0 0 0 0
Peru 12 6 0 6 11 6 0 5
St Kitts amp Nevis 0 0 0 0 0 0 0 0
St Lucia 1 0 0 1 1 0 0 1
St Vincent amp Grenadines 2 1 0 1 2 1 0 1
Suriname 0 0 0 0 0 0 0 0
Trinidad amp Tobago 1 0 0 0 0 0 0 0
Uruguay 0 0 0 0 0 0 0 0
Venezuela (Boliv Rep of) 8 6 0 2 7 7 0 1
OCEANIA 2 2 0 0 2 2 0 0
Fiji 2 2 0 0 2 2 0 0
French Polynesia 0 0 0 0
New Caledonia 0 0 0 0 0 0 0 0
Papua New Guinea 0 0 0 0 0 0 0 0
Samoa 0 0 0 0 0 0 0 0
Solomon Islands 0 0 0 0 0 0 0 0
Tonga 0 0 0 0 0 0 0 0
Vanuatu 0 0 0 0 0 0 0 0
DEVELOPED REGIONS 1094 532 421 141 1055 505 397 153
NORTH AMERICA 4 2 0 1 4 3 0 1
Bermuda 0 0 0 0 0 0 0 0
Canada 0 0 0 0 0 0 0 0
United States of America 4 2 0 1 4 3 0 1
ASIA amp OCEANIA 3 1 0 1 2 2 0 1
Australia 0 0 0 0 0 0 0 0
Israel 2 1 0 1 2 1 0 1
Japan 0 0 0 0 0 0 0 0
New Zealand 0 0 0 0 0 0 0 0
EUROPE 1088 528 421 139 1048 500 397 151
Albania 17 16 0 2 16 15 0 1
Belarus 7 6 0 1 6 6 0 1
Bosnia amp Herzegovina 237 70 114 53 232 63 113 55
Croatia 103 76 2 25 89 66 2 21
European Union 39 14 0 24 20 13 0 7
Iceland 0 0 0 0 0 0 0 0
Macedonia FYR 9 8 0 1 11 8 0 3
Montenegro 3 3 0 0 3 3 0 0
Norway 0 0 0 0 0 0 0 0
Republic of Moldova 7 6 0 1 7 6 0 1
Russian Federation 204 109 80 14 199 112 53 34
Serbia 437 196 225 16 439 183 228 27
Switzerland 0 0 0 0 0 0 0 0
Ukraine 26 25 0 2 26 25 0 1
126
TABLE 14 Population at risk persons affected by natural disastersPersons affected by natural disasters
total droughtearthquake
extremetemperature
flood landslide storm volcanoeswildfiresand
epidemics
thousands thousands thousands thousands thousands thousands thousands thousands
2010 2010 2010 2010 2010 2010 2010 2010
WORLD 344655 106870 7485 3986 191861 2464 30954 1034
DEVELOPING REGIONS 342717 106870 6650 3971 191352 2464 30403 1007
AFRICA 43854 38810 0 0 4657 20 317 50
North Africa 81 0 0 0 81 0 0 0
Algeria 0 0 0 0 0 0 0 0
Egypt 4 0 0 0 4 0 0 0
Libya
Morocco 77 0 0 0 77 0 0 0
Tunisia
Sub-Saharan Africa 43773 38810 0 0 4577 20 317 50
Angola 255 0 0 0 255 0 0 0
Benin 832 0 0 0 831 0 0 1
Botswana 0 0 0 0 0 0 0 0
Burkina Faso 139 0 0 0 133 0 0 6
Burundi 184 180 0 0 3 0 2 0
Cameroon 6 0 0 0 3 0 0 3
Cape Verde
Central African Republic 2 0 0 0 2 0 0 0
Chad 2552 2400 0 0 145 0 0 7
Comoros
Congo 1 0 0 0 0 0 0 1
Cocircte drsquoIvoire 6 0 0 0 6 0 0 0
Congo Dem Rep 85 0 0 0 70 1 0 14
Djibouti 120 120 0 0 0 0 0 0
Equatorial Guinea
Eritrea
Ethiopia 9482 9400 0 0 81 0 0 1
Gabon 2 0 0 0 0 0 2 1
Gambia 39 0 0 0 39 0 0 0
Ghana 17 0 0 0 17 0 0 0
Guinea 48 0 0 0 48 0 0 0
Guinea-Bissau 57 0 0 0 57 0 0 0
Kenya 7514 7300 0 0 211 0 0 3
Lesotho 5 0 0 0 5 0 0 0
Liberia 15 0 0 0 15 0 0 0
Madagascar 1027 720 0 0 0 0 307 0
Malawi 79 0 0 0 79 0 0 0
Mali 619 600 0 0 19 0 0 0
Mauritania 309 300 0 0 9 0 0 0
Mauritius
Mozambique 544 460 0 0 81 0 0 4
Namibia 338 0 0 0 338 0 0 0
Niger 8134 7900 0 0 233 0 0 1
Nigeria 1509 0 0 0 1500 0 0 8
Rwanda 10 0 0 0 4 6 0 0
Senegal 103 0 0 0 103 0 0 0
Seychelles
Sierra Leone 0 0 0 0 0 0 0 0
Somalia 2866 2850 0 0 16 0 0 0
Sudan 4438 4300 0 0 138 0 0 0
South Africa 26 0 0 0 20 0 6 0
Swaziland
Tanzania Utd Rep
Togo 112 0 0 0 112 0 0 0
Uganda 613 600 0 0 0 13 0 0
Zambia 3 0 0 0 3 0 0 0
Zimbabwe 1681 1680 0 0 1 0 0 0
127
TABLE 14 Population at risk persons affected by natural disasters (continued)Persons affected by natural disasters
total droughtearthquake
extremetemperature
flood landslide storm volcanoeswildfiresand
epidemics
thousands thousands thousands thousands thousands thousands thousands thousands
2010 2010 2010 2010 2010 2010 2010 2010
ASIA 285231 67783 252 3900 181630 2388 28948 330
Central Asia 64 0 8 0 47 8 0 1
Kazakhstan 38 0 0 0 38 0 0 0
Kyrgyzstan 8 0 0 0 0 8 0 0
Tajikistan 17 0 8 0 9 0 0 0
Turkmenistan
Uzbekistan
East Asia 256254 66483 234 3800 154940 2294 28180 324
Brunei Darussalam
Cambodia 0 0 0 0 0 0 0 0
China 231535 60000 196 3800 140254 2148 25137 0
Indonesia 238 0 17 0 69 0 0 152
Korea DPR 96 0 0 0 56 0 40 0
Korea Republic of 42 0 0 0 0 0 42 0
Lao PDR
Malaysia 0 0 0 0 0 0 0 0
Mongolia
Myanmar 426 0 21 0 0 145 260 0
Philippines 6738 0 0 0 3901 1 2666 171
Singapore
Thailand 15654 6483 0 0 9171 0 0 1
Viet Nam 1524 0 0 0 1490 0 35 0
South Asia 27536 0 7 100 26570 86 768 5
Afghanistan 49 0 1 0 48 0 0 0
Bangladesh 987 0 0 100 575 55 257 0
Bhutan
India 4790 0 0 0 4283 0 507 0
Iran (Islamic Rep) 5 0 5 0 0 0 0 0
Maldives
Nepal 13 0 0 0 8 0 0 5
Pakistan 20399 0 1 0 20363 30 4 0
Sri Lanka 1292 0 0 0 1292 0 0 0
West Asia 1377 1300 4 0 74 0 0 0
Armenia
Azerbaijan 70 0 0 0 70 0 0 0
Bahrain
Cyprus
Georgia
Iraq 2 0 0 0 2 0 0 0
Jordan
Kuwait
Lebanon
Occupied PalestinianTerritory
0 0 0 0 0 0 0 0
Saudi Arabia 0 0 0 0 0 0 0 0
Syrian Arab Republic 1300 1300 0 0 0 0 0 0
Turkey 4 0 4 0 0 0 0 0
United Arab Emirates
Yemen 1 0 0 0 1 0 0 0
LATIN AMERICA amp THECARIBBEAN
13570 277 6397 71 5049 56 1093 628
Argentina 0 0 0 0 0 0 0 0
Bahamas
Barbados 2 0 0 0 0 0 2 0
Belize 0 0 0 0 0 0 0 0
Bolivia (Plur State) 428 62 0 0 358 4 0 3
Brazil 357 62 0 0 295 0 0 0
Chile 2676 0 2672 0 0 0 0 4
Colombia 3005 0 0 0 3005 0 0 0
Costa Rica 3 0 0 0 3 0 0 0
128
TABLE 14 Population at risk persons affected by natural disasters (continued)Persons affected by natural disasters
total droughtearthquake
extremetemperature
flood landslide storm volcanoeswildfiresand
epidemics
thousands thousands thousands thousands thousands thousands thousands thousands
2010 2010 2010 2010 2010 2010 2010 2010
Cuba
Dominica
Dominican Republic 52 0 0 0 39 0 12 0
Ecuador 121 108 0 0 11 0 0 2
El Salvador 12 0 0 0 0 0 12 0
French Guiana
Grenada 0 0 0 0 0 0 0 0
Guatemala 456 0 0 0 3 51 400 2
Guyana 0 0 0 0 0 0 0 0
Haiti 4310 0 3700 0 24 0 78 507
Honduras 102 45 0 0 5 0 25 27
Jamaica 3 0 0 0 0 0 3 0
Mexico 1600 0 25 0 1020 0 555 0
Netherlands Antilles
Nicaragua 76 0 0 0 76 0 0 0
Panama 33 0 0 0 33 0 0 0
Paraguay 16 0 0 0 0 0 0 16
Peru 154 0 0 71 80 1 0 2
St Kitts amp Nevis
St Lucia 3 0 0 0 2 0 1 0
St Vincent amp Grenadines
Suriname
Trinidad amp Tobago 0 0 0 0 0 0 0 0
Uruguay 0 0 0 0 0 0 0 0
Venezuela (Boliv Rep of) 95 0 0 0 95 0 0 0
OCEANIA 62 0 1 0 16 0 45 0
Fiji 39 0 0 0 0 0 39 0
French Polynesia 3 0 0 0 0 0 3 0
New Caledonia
Papua New Guinea 0 0 0 0 0 0 0 0
Samoa
Solomon Islands 18 0 1 0 16 0 1 0
Tonga 0 0 0 0 0 0 0 0
Vanuatu 0 0 0 0 0 0 0 0
DEVELOPED REGIONS 1922 0 835 15 509 0 536 27
NORTH AMERICA 36 0 1 0 7 0 29 0
Bermuda
Canada 0 0 0 0 0 0 0 0
United States of America 36 0 1 0 7 0 29 0
ASIA amp OCEANIA 1046 0 792 15 211 0 7 20
Australia 219 0 0 0 211 0 7 0
Israel 20 0 0 0 0 0 0 20
Japan 507 0 492 15 0 0 0 0
New Zealand 300 0 300 0 0 0 0 0
EUROPE 840 0 42 0 291 0 500 7
Albania 14 0 0 0 14 0 0 0
Belarus
Bosnia amp Herzegovina 35 0 0 0 35 0 0 0
Croatia 1 0 0 0 1 0 0 0
European Union 634 0 15 0 119 0 500 0
Iceland 0 0 0 0 0 0 0 0
Macedonia FYR
Montenegro 6 0 0 0 6 0 0 0
Norway
Republic of Moldova 12 0 0 0 12 0 0 0
Russian Federation 66 0 0 0 58 0 0 7
Serbia 32 0 27 0 5 0 0 0
Switzerland 0 0 0 0 0 0 0 0
Ukraine 40 0 0 0 40 0 0 0
129
TABLE 15 UndernourishmentShare of population undernourished Incidence of undernourishment Depth of hunger
pa millions millions pakcalcapday kcalcapday
pa
1995-97 2006-08 growth1995-97 -2006-08
1995-97 2006-08 growth1995-97 -2006-08
1995-97 2006-08 growth1995-97 -2006-08
WORLD 18 16 minus23 7012 7392 05 214 212 minus03
DEVELOPING REGIONS 18 16 minus23 7011 7392 05 234 234 minus03
AFRICA 29 23 minus24 1622 1603 minus01 253 234 minus05
North Africa 5 31 185 188 01
Algeria 5 15 180 180 00
Egypt 190 200 03
Libya 130 130 05
Morocco 6 16 210 200 minus03
Tunisia 120 120 00
Sub-Saharan Africa 31 23 minus23 1591 1603 01 268 243 minus05
Angola 61 41 minus35 78 72 minus07 390 320 minus17
Benin 18 12 minus36 10 10 00 230 210 minus08
Botswana 23 25 08 04 05 20 230 240 08
Burkina Faso 12 8 minus36 12 12 00 210 200 minus06
Burundi 56 62 09 35 49 31 350 390 14
Cameroon 34 22 minus39 50 42 minus16 260 230 minus08
Cape Verde 14 11 minus22 01 01 00 190 190 00
Central African Republic 47 40 minus15 16 17 06 320 300 minus02
Chad 53 39 minus27 39 41 05 370 320 minus12
Comoros 47 47 00 03 04 26 300 300 07
Congo 41 13 minus99 12 05 minus76 310 230 minus18
Cocircte drsquoIvoire 17 14 minus17 26 29 10 240 230 00
Congo Dem Rep
Djibouti 50 26 minus58 03 02 minus36 350 280 minus20
Equatorial Guinea
Eritrea 64 65 01 21 31 36 340 350 minus02
Ethiopia 62 41 minus37 362 326 minus09 390 320 minus17
Gabon 140 140 minus04
Gambia 23 19 minus17 03 03 00 250 240 05
Ghana 13 5 minus83 23 11 minus65 210 180 minus23
Guinea 19 16 minus15 15 16 06 270 260 minus02
Guinea-Bissau 26 22 minus15 03 03 00 260 250 00
Kenya 32 33 03 90 124 30 250 260 02
Lesotho 16 14 minus12 03 03 00 220 220 00
Liberia 32 32 00 07 11 42 330 330 02
Madagascar 26 25 minus04 35 47 27 250 250 05
Malawi 36 27 minus26 38 39 02 310 280 minus08
Mali 25 12 minus65 25 15 minus45 260 220 minus13
Mauritania 9 8 minus11 02 02 00 210 210 minus03
Mauritius 7 5 minus30 01 01 00 190 180 minus03
Mozambique 47 38 minus19 78 83 06 360 330 minus12
Namibia 30 18 minus45 05 04 minus20 250 220 minus08
Niger 37 16 minus73 35 23 minus37 300 240 minus14
Nigeria 10 6 minus45 109 94 minus13 200 180 minus12
Rwanda 53 32 minus45 30 30 00 360 300 minus06
Senegal 26 19 minus28 23 23 00 240 220 minus03
Seychelles 10 8 minus20 00 00 160 150 minus04
Sierra Leone 39 35 minus10 16 19 16 360 340 minus07
Somalia
Sudan 29 22 minus25 93 88 minus05 260 240 minus12
South Africa 160 150 00
Swaziland 21 19 minus09 02 02 00 220 220 09
Tanzania Utd Rep 42 34 minus19 128 139 08 300 280 05
Togo 36 30 minus16 17 19 10 290 280 minus06
Uganda 23 22 minus04 49 67 29 240 240 00
Zambia 38 44 13 36 54 38 300 320 06
Zimbabwe 44 30 minus34 53 37 minus32 340 300 minus06
130
TABLE 15 Undernourishment (continued)Share of population undernourished Incidence of undernourishment Depth of hunger
pa millions millions pakcalcapday kcalcapday
pa
1995-97 2006-08 growth1995-97 -2006-08
1995-97 2006-08 growth1995-97 -2006-08
1995-97 2006-08 growth1995-97 -2006-08
ASIA 16 15 minus21 4909 5372 08 233 238 minus02
Central Asia 12 13 minus20 46 55 16 171 172 minus01
Kazakhstan 130 120 00
Kyrgyzstan 13 11 minus15 06 06 00 210 210 minus03
Tajikistan 42 26 minus43 24 18 minus26 270 230 minus05
Turkmenistan 9 7 minus23 04 03 minus26 180 180 00
Uzbekistan 5 11 74 12 28 80 160 180 07
East Asia 13 11 minus18 2194 2058 minus06 241 241 minus04
Brunei Darussalam 140 130 minus05
Cambodia 40 25 minus42 47 36 minus24 280 250 minus05
China 12 10 minus16 1417 1296 minus08 250 250 minus05
Indonesia 11 13 15 220 297 28 210 220 00
Korea DPR 30 35 14 66 84 22 250 270 10
Korea Republic of 120 130 00
Lao PDR 29 22 minus25 14 14 00 270 260 minus05
Malaysia 120 130 minus05
Mongolia 33 27 minus18 08 07 minus12 260 260 02
Myanmar
Philippines 20 13 minus38 141 118 minus16 250 240 minus07
Singapore
Thailand 18 16 minus11 111 107 minus03 240 240 minus07
Viet Nam 22 11 minus61 167 96 minus49 270 240 minus12
South Asia 20 20 minus11 2570 3174 19 232 246 00
Afghanistan
Bangladesh 41 26 minus41 542 414 minus24 330 290 minus04
Bhutan
India 17 19 10 1671 2246 27 220 240 00
Iran (Islamic Rep) 170 180 07
Maldives 9 10 10 00 00 180 190 07
Nepal 20 17 minus15 44 47 06 230 220 minus03
Pakistan 20 25 20 268 428 43 260 280 00
Sri Lanka 25 20 minus20 45 39 minus13 260 250 minus02
West Asia 24 24 minus42 99 85 minus14 173 169 minus02
Armenia 36 21 minus48 11 06 minus54 230 200 minus14
Azerbaijan 27 22 220 140 minus28
Bahrain
Cyprus 120 120 00
Georgia 19 6 minus99 10 03 minus104 200 160 minus39
Iraq
Jordan 5 02 170 150 00
Kuwait 5 5 00 01 01 00 180 190 minus12
Lebanon 160 170 04
Occupied PalestinianTerritory
10 21 70 03 08 93 160 190
Saudi Arabia 130 130 minus05
Syrian Arab Republic 160 170 04
Turkey 160 160 04
United Arab Emirates 130 140 05
Yemen 31 30 minus03 50 67 27 260 260 02
LATIN AMERICA amp THECARIBBEAN
14 11 minus19 480 416 minus13 212 203 minus03
Argentina 120 130 00
Bahamas 8 6 minus26 00 00 160 160 00
Barbados 140 140 05
Belize 8 5 minus42 00 00 180 170 00
Bolivia (Plur State) 24 27 11 19 25 25 230 240 00
Brazil 10 6 minus45 166 117 minus31 240 220 minus05
Chile 150 140 minus08
Colombia 11 9 minus18 40 41 02 210 210 minus03
Costa Rica 150 150 04
131
TABLE 15 Undernourishment (continued)Share of population undernourished Incidence of undernourishment Depth of hunger
pa millions millions pakcalcapday kcalcapday
pa
1995-97 2006-08 growth1995-97 -2006-08
1995-97 2006-08 growth1995-97 -2006-08
1995-97 2006-08 growth1995-97 -2006-08
Cuba 14 15 190 120 minus18
Dominica 150 150 00
Dominican Republic 26 24 minus07 21 23 08 240 230 minus03
Ecuador 16 15 minus06 18 20 10 190 190 minus03
El Salvador 12 9 minus26 07 06 minus14 200 190 minus03
French Guiana
Grenada 18 21 14 00 00 240 250 08
Guatemala 20 22 09 21 29 30 220 230 06
Guyana 11 8 minus29 01 01 00 200 190 minus12
Haiti 60 57 minus05 48 55 12 430 420 minus03
Honduras 16 12 minus26 09 09 00 240 230 minus05
Jamaica 6 5 minus16 02 01 minus61 170 170 minus07
Mexico 190 190 00
Netherlands Antilles 150 150 minus11
Nicaragua 38 19 minus61 18 11 minus44 310 260 minus18
Panama 20 15 minus26 06 05 minus16 230 220 minus03
Paraguay 10 10 00 05 06 17 200 210 minus03
Peru 21 16 minus24 50 45 minus10 230 220 minus08
St Kitts amp Nevis 16 16 00 00 00 220 220 06
St Lucia 7 8 12 00 00 180 190 00
St Vincent amp Grenadines 16 5 minus100 00 00 210 170 minus10
Suriname 13 15 13 01 01 00 200 200 00
Trinidad amp Tobago 14 11 minus22 02 02 00 220 220 03
Uruguay 140 140 minus04
Venezuela (Boliv Rep of) 14 7 minus61 31 19 minus44 190 170 minus04
OCEANIA 8 9 00 01 182 173 minus06
Fiji 5 00 170 160 minus07
French Polynesia 5 00 160 150 minus11
New Caledonia 9 8 minus11 00 00 210 210 03
Papua New Guinea
Samoa 10 00 180 150 minus11
Solomon Islands 13 11 minus15 00 01 190 190 minus06
Tonga
Vanuatu 9 00 200 180 minus07
DEVELOPED REGIONS 5 01 125 116 01
NORTH AMERICA 111 101 minus02
Bermuda 180 200 07
Canada 120 110 minus10
United States of America 110 100 minus06
ASIA amp OCEANIA 128 126 00
Australia 130 120 00
Israel 90 90 00
Japan 130 130 00
New Zealand 120 120 00
EUROPE 5 01 131 121 01
Albania 160 160 minus07
Belarus 120 130 05
Bosnia amp Herzegovina 150 140 minus12
Croatia 180 150 minus18
European Union 5 01 120 115 minus02
Iceland 130 120 minus05
Macedonia FYR 180 150 minus11
Montenegro 170
Norway 120 110 minus05
Republic of Moldova 190 190 07
Russian Federation 160 130 minus09
Serbia 170
Switzerland 120 120 00
Ukraine 150 130 minus05
132
TABLE 16 Dietary energy supplies and changes in dietary compositionDietary energy supply per person Contribution in diets by type Contribution in diets by commodity
carbo-hydrates
proteins fats cereals starchy roots pulses
kcalcapday kcalcapday
1990-92 2006-08 2005-07 2005-07 2005-07 1990-92 2005-07 1990-92 2005-07 1990-92 2005-07
WORLD 2583 2805 65 11 24 53 48 8 7 5 5
DEVELOPING REGIONS 2430 2664 67 11 22 58 53 9 8 5 5
AFRICA 2266 2495 72 10 18 49 49 22 20 5 5
North Africa 3035 3175 71 11 17 62 60 2 3 2 2
Algeria 2890 3090 70 11 19 57 56 2 3
Egypt 3090 3160 73 12 15 66 64 2 2
Libya 3180 3150 63 10 27 47 47 2 3
Morocco 3000 3260 72 11 17 62 60 2 2
Tunisia 3120 3330 64 11 24 55 50 2 2
Sub-Saharan Africa 2102 2351 72 10 19 47 47 24 22 5 6
Angola 1580 1960 70 9 21 29 36 30 26 3 3
Benin 2250 2510 72 9 19 41 40 34 31 4 5
Botswana 2260 2230 67 11 22 43 43 6 6 5 6
Burkina Faso 2460 2690 68 12 20 75 73 5 5
Burundi 1860 1680 82 11 7 17 19 29 32 27 19
Cameroon 2020 2240 72 10 18 39 42 20 17 2 6
Cape Verde 2370 2530 63 11 26 50 45 4 4 4 3
Central African Republic 1880 1960 61 9 29 20 25 37 31
Chad 1700 2010 64 12 24 52 57 13 8 2 4
Comoros 1900 1840 69 9 22 41 38 17 15 6 9
Congo 1970 2570 69 8 23 19 26 41 34
Cocircte drsquoIvoire 2470 2500 74 8 18 35 33 31 33
Congo Dem Rep 80 6 14 16 23 57 55
Djibouti 1720 2300 63 10 27 52 52 2 3
Equatorial Guinea
Eritrea 1530 1590 73 12 15 72 74 5 3 8 5
Ethiopia 1550 1950 79 11 10 67 66 15 13 6 7
Gabon 2520 2710 69 12 19 25 33 21 17
Gambia 2470 2330 64 9 27 55 56
Ghana 2120 2900 77 8 15 32 29 39 37
Guinea 2420 2550 70 9 22 50 47 14 14
Guinea-Bissau 2290 2270 71 8 21 61 59 8 9
Kenya 1970 2030 68 11 21 47 49 8 5 6 7
Lesotho 2370 2460 77 11 12 76 78 2 3
Liberia 2220 2200 70 7 24 45 43 22 23
Madagascar 2200 2130 78 9 13 52 59 22 19
Malawi 1870 2150 77 10 13 69 59 4 15 7 6
Mali 2180 2590 70 11 19 69 67 1 3
Mauritania 2580 2810 63 12 25 55 51 4 4
Mauritius 2760 2930 62 11 26 48 46 3 3
Mozambique 1750 2070 76 7 17 34 40 41 37
Namibia 2060 2360 68 11 21 48 46 14 14 4 3
Niger 1970 2390 68 13 19 74 60 6 14
Nigeria 2310 2710 69 9 22 47 45 20 19 3 3
Rwanda 1830 2090 82 10 9 18 18 30 36 15 12
Senegal 2190 2280 65 10 25 64 60 1 3
Seychelles 2280 2400 60 14 26 46 41
Sierra Leone 1950 2120 67 10 24 55 50 5 10 4 5
Somalia
Sudan 1960 2280 61 13 26 57 50 2 3
South Africa 2820 3000 65 11 24 53 54
Swaziland 2380 2290 68 11 21 52 50 5 5
Tanzania Utd Rep 2080 2020 75 10 15 47 46 24 17 5 7
Togo 1890 2150 71 9 20 48 49 28 25 2 4
Uganda 2280 2220 74 9 17 19 23 25 23 9 8
Zambia 2010 1880 73 10 17 65 61 13 14
Zimbabwe 1980 2210 66 10 24 62 56 2 2
133
TABLE 16 Dietary energy supplies and changes in dietary composition (continued)Dietary energy supply per person Contribution in diets by type Contribution in diets by commodity
carbo-hydrates
proteins fats cereals starchy roots pulses
kcalcapday kcalcapday
1990-92 2006-08 2005-07 2005-07 2005-07 1990-92 2005-07 1990-92 2005-07 1990-92 2005-07
ASIA 2434 2667 67 11 22 63 56 6 5 5 5
Central Asia 2715 2793 64 12 25 59 54 4 6
Kazakhstan 3280 3510 61 12 27 57 43 4 6
Kyrgyzstan 2400 2660 68 12 20 57 48 5 8
Tajikistan 2020 2190 64 10 26 63 63
Turkmenistan 2550 2740 65 13 23 57 61
Uzbekistan 2650 2560 64 12 25 59 57
East Asia 2508 2872 64 11 24 63 53 7 5 3 6
Brunei Darussalam 2730 2980 64 12 25 48 45
Cambodia 1870 2180 75 10 14 82 72 2 4
China 2580 2990 61 12 27 63 50 7 5
Indonesia 2390 2550 73 9 18 66 63 7 6
Korea DPR 2340 2110 74 11 15 60 62 3 7 6 5
Korea Republic of 2970 3040 63 11 25 54 44
Lao PDR 2010 2240 76 11 13 78 70 6 4
Malaysia 2720 2890 63 11 26 42 47 3 2
Mongolia 2080 2240 56 13 32 42 46 2 4
Myanmar 67 11 22 73 59 2 6
Philippines 2230 2580 73 9 18 53 57 4 3
Singapore
Thailand 2250 2540 71 9 20 57 49
Viet Nam 2090 2780 70 10 19 76 66
South Asia 2279 2374 71 10 19 65 60 2 3 5 5
Afghanistan
Bangladesh 1960 2270 80 9 12 84 78 1 3
Bhutan
India 2290 2360 71 10 19 64 60 5 5
Iran (Islamic Rep) 2970 3050 69 11 20 60 53 3 4
Maldives 2400 2550 60 16 23 46 35
Nepal 2190 2340 74 10 15 74 69 3 5 3 3
Pakistan 2210 2280 63 10 27 55 47 3 3
Sri Lanka 2170 2370 73 9 18 56 56 4 2 3 3
West Asia 2963 3067 64 11 25 51 49 3 3 4 3
Armenia 1920 2260 64 12 24 59 44 8 5
Azerbaijan 2160 3020 73 11 16 66 60 2 6
Bahrain
Cyprus 3120 3190 48 12 41 28 21 3 3
Georgia 1850 2730 67 11 22 57 50 5 3
Iraq
Jordan 2840 3000 63 10 27 50 46 3 2
Kuwait 2350 3030 58 12 30 39 42 2 2
Lebanon 3010 3090 58 11 32 34 34 3 6 4 3
Occupied PalestinianTerritory
2080 66 11 23 0 51
Saudi Arabia 2850 3120 64 11 25 48 48
Syrian Arab Republic 2830 3040 59 10 30 50 45
Turkey 3590 3500 62 11 27 51 48 3 3 4 3
United Arab Emirates 3160 3170 63 13 24 33 43 3 4
Yemen 1980 2050 69 11 20 66 61 3 3
LATIN AMERICA amp THECARIBBEAN
2664 2915 62 11 27 39 37 6 6 5 5
Argentina 3010 3030 55 13 32 32 31 3 3
Bahamas 2610 2710 57 12 30 27 27 2 2
Barbados 3040 3020 59 12 29 30 27 3 3
Belize 2510 2710 67 11 23 37 39 4 4
Bolivia (Plur State) 2030 2100 71 11 18 43 47 9 7
Brazil 2760 3120 59 11 30 33 32 5 5 5 5
Chile 2600 2960 61 12 27 43 40 4 4
Colombia 2410 2690 66 10 24 33 34 8 6
Costa Rica 2820 2820 62 11 27 32 31 3 4
134
TABLE 16 Dietary energy supplies and changes in dietary composition (continued)Dietary energy supply per person Contribution in diets by type Contribution in diets by commodity
carbo-hydrates
proteins fats cereals starchy roots pulses
kcalcapday kcalcapday
1990-92 2006-08 2005-07 2005-07 2005-07 1990-92 2005-07 1990-92 2005-07 1990-92 2005-07
Cuba 2720 3420 73 10 17 34 40 5 7 4 7
Dominica 3000 3090 64 12 24 26 25 7 9
Dominican Republic 2160 2270 61 9 30 30 29 5 4
Ecuador 2110 2300 55 10 35 35 34
El Salvador 2400 2580 67 11 22 56 44 1 2 4 6
French Guiana
Grenada 2470 2400 54 12 34 28 22 2 3 3 3
Guatemala 2290 2150 67 11 23 58 51 6 4
Guyana 2300 2740 68 11 21 53 46 4 4 3 2
Haiti 1730 1850 74 9 17 44 46 11 9 8 5
Honduras 2300 2610 66 10 24 51 44 4 5
Jamaica 2510 2840 61 11 28 34 32 9 5
Mexico 3090 3260 62 11 26 47 44 4 4
Netherlands Antilles 3280 3260 64 11 24 36 36 4 3
Nicaragua 1770 2420 68 10 22 47 50 8 7
Panama 2320 2450 65 12 24 39 43 2 2
Paraguay 2390 2660 58 11 32 27 29 18 13 4 5
Peru 2110 2410 74 11 15 49 44 8 14 2 3
St Kitts amp Nevis 2580 2460 59 12 29 32 26 3 2 2 2
St Lucia 2580 2710 58 14 28 30 28 6 2
St Vincent amp Grenadines 2360 2860 64 11 25 30 33 7 5 2 2
Suriname 2440 2460 68 9 23 50 42 2 2
Trinidad amp Tobago 2610 2700 65 10 25 39 34 2 2 4 3
Uruguay 2660 2840 64 11 25 35 43 4 4
Venezuela (Boliv Rep of) 2460 2650 64 11 26 36 37 3 3
OCEANIA 2549 2850 60 10 30 32 34 15 14 3 2
Fiji 2640 3000 60 10 29 43 41 4 7 3 2
French Polynesia 2480 2880 48 14 39 25 31 5 4
New Caledonia 3210 3150 52 12 35 35 32 6 5
Papua New Guinea
Samoa 2550 2890 46 11 43 23 18 10 10
Solomon Islands 2120 2400 73 9 18 25 34 40 34 3 3
Tonga
Vanuatu 2530 2950 60 9 31 22 31 22 18
DEVELOPED REGIONS 3260 3426 53 12 35 29 28 5 5
NORTH AMERICA 3464 3728 49 12 38 23 22 3 3
Bermuda 2870 2650 48 12 40 19 24
Canada 3050 3530 51 12 37 21 25 4 4
United States of America 3510 3750 49 12 38 23 22 3 3
ASIA amp OCEANIA 2969 2892 56 13 31 36 35 3 3
Australia 3130 3220 46 13 40 22 22 3 3
Israel 3410 3530 49 14 37 35 33 2 2
Japan 2920 2800 58 13 29 39 38
New Zealand 2810 2810 54 12 34 23 24 3 4
EUROPE 3228 3401 54 12 34 30 30 6 5
Albania 2560 2890 58 14 29 57 40 1 2
Belarus 3180 3150 56 12 32 37 30 10 11
Bosnia amp Herzegovina 2670 3080 67 11 21 61 45 5 5
Croatia 2420 2990 57 11 32 30 31 7 4
European Union 3341 3453 51 12 37 26 28 5 4
Iceland 3090 3260 45 16 39 23 20 3 3
Macedonia FYR 2550 3060 55 10 34 44 34 3 3
Montenegro
Norway 3230 3450 51 12 36 27 28 5 4
Republic of Moldova 2880 2850 70 11 20 55 48 5 5
Russian Federation 2960 3320 63 12 25 40 36 8 7
Serbia
Switzerland 3370 3450 49 11 41 22 21
Ukraine 3040 3290 63 11 26 43 36 8 8
135
TABLE 17 Changes in dietary compositionContribution in diets by commodity
meat and fish dairy and eggs fruit and vegetables sugar vegetable oils other
1990-92 2005-07 1990-92 2005-07 1990-92 2005-07 1990-92 2005-07 1990-92 2005-07 1990-92 2005-07
WORLD 8 11 5 5 4 5 8 8 8 9 11 13
DEVELOPING REGIONS 7 10 4 4 4 5 7 7 7 8 10 12
AFRICA 4 4 5 6 6 6 6 6 9 9 11 11
North Africa 3 3 3 3 6 7 10 9 9 7 7 9
Algeria 3 3 6 6 3 5 9 9 14 10 6 8
Egypt 2 3 2 2 7 9 10 8 6 4 5 8
Libya 5 4 5 5 8 7 12 10 14 16 7 8
Morocco 3 3 4 6 10 11 8 8 11 10
Tunisia 3 3 4 5 6 6 9 10 15 14 6 10
Sub-Saharan Africa 4 4 7 7 6 6 5 5 9 9 12 12
Angola 5 5 7 8 14 12 12 10
Benin 2 2 6 8 13 14
Botswana 6 4 9 7 11 13 6 9 14 12
Burkina Faso 3 3 4 5 13 14
Burundi 10 15 17 15
Cameroon 3 3 10 8 3 4 8 8 15 12
Cape Verde 6 9 5 8 2 2 7 9 10 8 12 12
Central African Republic 7 8 4 4 3 4 14 14 15 14
Chad 4 4 5 5 24 22
Comoros 8 7 4 6 8 11 16 14
Congo 4 3 5 4 4 6 12 15 15 12
Cocircte drsquoIvoire 8 7 4 4 10 11 12 12
Congo Dem Rep 7 3 7 7 13 12
Djibouti 5 6 5 5 19 11 10 16 7 7
Equatorial Guinea
Eritrea 1 4 4 6 10 8
Ethiopia 3 2 2 3 7 9
Gabon 8 8 16 12 6 6 5 6 19 18
Gambia 2 2 17 12 13 17 13 13
Ghana 7 11 3 4 7 7 12 12
Guinea 13 10 4 5 11 14 8 10
Guinea-Bissau 4 4 4 3 1 6 13 12 9 7
Kenya 8 7 4 5 10 9 8 8 9 10
Lesotho 4 4 7 6 11 9
Liberia 4 4 2 3 16 19 11 8
Madagascar 6 4 3 3 3 3 3 4 11 8
Malawi 4 5 7 5 9 10
Mali 3 3 5 5 4 5 9 7 9 10
Mauritania 5 5 11 10 10 12 9 12 6 6
Mauritius 4 6 6 6 2 4 14 12 14 15 9 8
Mozambique 1 4 13 9 11 10
Namibia 6 6 4 5 16 10 2 7 6 9
Niger 4 5 3 3 2 3 3 5 8 10
Nigeria 3 3 2 3 13 13 12 14
Rwanda 21 18 2 4 14 12
Senegal 3 3 2 2 7 6 13 15 10 11
Seychelles 10 11 6 4 5 7 14 10 7 8 12 19
Sierra Leone 3 3 20 15 13 17
Somalia
Sudan 4 5 12 17 8 10 7 5 10 10
South Africa 8 9 3 3 12 10 8 12 16 12
Swaziland 5 6 4 5 3 3 15 13 7 6 9 12
Tanzania Utd Rep 3 6 3 5 5 7 13 12
Togo 9 10 13 12
Uganda 20 17 1 4 3 7 23 18
Zambia 3 3 8 6 4 6 7 10
Zimbabwe 3 4 11 12 8 10 14 16
136
TABLE 17 Changes in dietary composition (continued)Contribution in diets by commodity
meat and fish dairy and eggs fruit and vegetables sugar vegetable oils other
1990-92 2005-07 1990-92 2005-07 1990-92 2005-07 1990-92 2005-07 1990-92 2005-07 1990-92 2005-07
ASIA 8 12 3 4 3 4 6 6 7 8 9 12
Central Asia 7 7 9 10 2 4 5 6 9 9 8 9
Kazakhstan 10 9 8 13 1 3 6 9 5 8 9 9
Kyrgyzstan 11 7 12 12 2 4 6 9 4 5 3 7
Tajikistan 3 4 6 5 6 7 11 11 11 10
Turkmenistan 7 10 8 9 2 3 6 4 11 6 9 7
Uzbekistan 6 6 9 9 3 4 4 3 12 11 7 10
East Asia 9 14 1 2 3 5 4 4 6 7 9 13
Brunei Darussalam 9 8 7 9 5 5 12 13 7 8 12 12
Cambodia 5 5 1 4 2 3 8 12
China 9 15 1 2 3 6 3 2 6 7 8 13
Indonesia 2 3 6 6 7 8 12 14
Korea DPR 5 5 8 7 5 6 13 8
Korea Republic of 7 11 7 8 10 11 8 12 14 14
Lao PDR 4 5 2 5 1 2 9 14
Malaysia 12 11 4 3 3 3 13 12 14 12 9 10
Mongolia 30 17 8 11 8 6 1 6 9 10
Myanmar 2 6 2 2 3 6 10 9 8 12
Philippines 10 12 6 6 12 9 6 4 9 9
Singapore
Thailand 8 9 5 4 8 14 5 6 17 18
Viet Nam 6 12 4 5 3 4 2 3 9 10
South Asia 2 4 4 5 2 3 9 8 7 9 9 11
Afghanistan
Bangladesh 3 4 4 7 8 8
Bhutan
India 4 4 2 2 9 8 7 9 9 12
Iran (Islamic Rep) 3 5 3 3 8 12 9 9 9 7 5 7
Maldives 10 17 3 7 4 9 17 13 7 7 13 12
Nepal 3 4 1 2 6 7 10 10
Pakistan 2 3 9 12 12 12 10 11 9 12
Sri Lanka 3 3 3 2 11 11 3 4 17 19
West Asia 5 6 6 6 9 7 9 10 10 12 9 10
Armenia 6 8 7 10 8 13 4 8 2 5 6 7
Azerbaijan 5 4 7 6 5 3 6 6 1 4 8 11
Bahrain
Cyprus 12 13 10 10 8 7 12 13 13 15 14 18
Georgia 7 5 7 10 7 14 2 7 15 11
Iraq
Jordan 5 5 5 5 3 2 15 15 11 15 8 10
Kuwait 11 11 8 5 7 7 12 11 11 12 10 10
Lebanon 5 7 4 5 15 9 11 11 14 14 10 11
Occupied PalestinianTerritory
0 5 0 5 100 8 0 12 0 10 0 9
Saudi Arabia 7 7 5 5 10 10 10 10 13 12 7 8
Syrian Arab Republic 4 4 6 7 4 3 12 13 12 12 12 16
Turkey 6 6 8 8 8 8 11 14 9 10
United Arab Emirates 11 10 9 5 12 9 11 12 9 6 12 11
Yemen 3 4 2 3 10 12 9 10 7 7
LATIN AMERICA amp THECARIBBEAN
7 10 6 6 5 5 16 14 10 11 11 11
Argentina 17 17 8 9 14 16 11 11 15 13
Bahamas 18 17 7 6 9 9 16 15 3 6 18 18
Barbados 16 15 7 7 3 7 16 19 10 9 15 13
Belize 8 8 7 6 8 8 15 15 3 4 18 16
Bolivia (Plur State) 9 10 2 2 7 6 14 13 4 3 12 12
Brazil 8 12 6 7 4 4 17 13 13 13 9 9
Chile 9 14 6 5 3 3 15 14 9 8 11 12
Colombia 7 7 7 8 7 7 19 17 9 11 10 10
Costa Rica 5 5 8 10 6 5 21 19 12 12 13 14
137
TABLE 17 Changes in dietary composition (continued)Contribution in diets by commodity
meat and fish dairy and eggs fruit and vegetables sugar vegetable oils other
1990-92 2005-07 1990-92 2005-07 1990-92 2005-07 1990-92 2005-07 1990-92 2005-07 1990-92 2005-07
Cuba 6 5 6 3 4 6 21 15 9 6 11 11
Dominica 10 11 9 9 11 12 15 14 8 5 14 15
Dominican Republic 6 9 5 4 13 9 15 16 15 16 11 13
Ecuador 6 10 7 7 11 10 9 8 18 17 14 14
El Salvador 2 4 5 7 4 4 15 15 5 6 8 12
French Guiana
Grenada 10 15 10 9 8 7 17 16 9 11 13 14
Guatemala 2 4 3 3 2 3 17 15 6 9 6 11
Guyana 3 6 3 6 1 3 14 13 4 7 15 13
Haiti 3 4 8 6 10 12 5 7 11 11
Honduras 3 6 5 7 5 6 16 17 9 9 7 6
Jamaica 7 8 4 6 5 7 20 16 10 12 11 14
Mexico 6 9 5 5 3 4 16 15 8 8 11 11
Netherlands Antilles 15 13 8 6 10 18 7 6 20 18
Nicaragua 3 4 4 5 14 15 9 9 15 10
Panama 6 8 7 7 5 4 14 12 11 8 16 16
Paraguay 12 9 4 4 4 3 9 9 8 12 14 16
Peru 3 4 3 4 4 6 12 9 5 5 14 11
St Kitts amp Nevis 11 13 8 8 2 3 15 17 13 11 14 18
St Lucia 16 20 8 8 8 7 14 13 3 5 15 17
St Vincent amp Grenadines 11 12 5 5 4 6 18 17 9 8 14 12
Suriname 7 8 7 6 15 18 7 12 12 12
Trinidad amp Tobago 5 7 6 7 3 3 19 21 11 10 11 13
Uruguay 20 10 10 7 2 3 11 13 6 8 12 12
Venezuela (Boliv Rep of) 6 9 6 4 7 4 15 16 15 14 12 13
OCEANIA 11 10 6 7 4 4 7 8 8 8 22 21
Fiji 12 11 7 10 12 10 19 19
French Polynesia 18 19 6 6 2 2 11 7 9 11 24 20
New Caledonia 11 10 7 8 2 3 11 8 12 13 16 21
Papua New Guinea
Samoa 19 17 5 8 9 9 2 7 32 31
Solomon Islands 4 3 4 4 2 4 22 18
Tonga
Vanuatu 10 8 6 5 4 6 6 5 30 27
DEVELOPED REGIONS 11 11 9 9 4 4 13 13 12 14 19 18
NORTH AMERICA 12 12 11 10 3 3 17 17 16 18 16 15
Bermuda 19 17 6 6 11 6 11 14 10 12 24 21
Canada 11 10 8 6 7 6 14 14 14 16 21 19
United States of America 12 12 11 10 3 3 17 17 16 18 15 15
ASIA amp OCEANIA 12 12 8 7 3 4 12 10 11 14 18 17
Australia 15 15 12 10 3 4 15 13 13 16 17 17
Israel 8 12 7 6 9 9 12 7 14 19 13 12
Japan 12 12 7 7 3 3 11 10 10 13 18 17
New Zealand 13 15 9 4 7 8 16 17 7 7 22 21
EUROPE 11 10 9 9 5 5 11 12 10 12 20 19
Albania 4 8 12 18 5 10 6 7 8 6 7 9
Belarus 11 11 11 7 1 3 10 11 4 11 16 16
Bosnia amp Herzegovina 4 4 6 10 5 8 4 6 2 6 13 16
Croatia 6 7 10 11 4 4 17 13 8 13 18 17
European Union 12 11 9 9 5 5 11 11 12 14 22 19
Iceland 17 21 14 16 3 4 18 13 5 6 17 17
Macedonia FYR 9 7 5 6 8 7 12 12 5 14 14 17
Montenegro
Norway 14 14 11 9 3 4 13 12 10 11 17 18
Republic of Moldova 5 4 8 11 2 2 9 12 5 6 11 12
Russian Federation 10 8 8 8 12 13 5 9 17 19
Serbia
Switzerland 16 14 12 11 4 3 13 17 11 13 22 21
Ukraine 7 6 8 9 13 15 7 10 14 16
138
TABLE 18 Health effects of malnutritionShare of children under 5 share of
lowweightnewborns
Share of adults Dietaryironsupply
underweightstunted wasted total with
low BMIwomenwith lowBMI
overweight or obese per person
male female mg day
2009 2009 2009 2009 2009 2009 2009 2009 2005-07
WORLD 18 28 9 13 91 129 145
DEVELOPING REGIONS 20 30 10 14 64 107 144
AFRICA 22 39 10 111 65 135 152
North Africa 7 24 7 10 172 361 163
Algeria 4 16 4 6 107 243 136
Egypt 7 31 8 13 16 225 463 177
Libya 6 21 7 215 413 140
Morocco 10 23 11 53 73 111 231 163
Tunisia 3 9 3 5 139 334 157
Sub-Saharan Africa 25 42 11 126 44 92 150
Angola 28 51 8 38 102 98
Benin 20 45 8 15 92 35 95 154
Botswana 11 29 6 13 30 228 147
Burkina Faso 26 35 11 16 208 17 30 242
Burundi 39 63 8 11 28 37 135
Cameroon 17 36 7 11 67 70 151 158
Cape Verde 6 63 153 121
Central African Republic 22 45 11 13 153 20 53 123
Chad 37 45 16 22 203 24 38 180
Comoros 25 7 13 25 105 35 53 92
Congo 12 31 8 13 132 28 75 120
Cocircte drsquoIvoire 17 40 9 17 82 39 97 111
Congo Dem Rep 28 46 14 185 07 30 84
Djibouti 30 33 26 10 67 138 102
Equatorial Guinea 11 35 3 79 148
Eritrea 35 44 15 14 13 23 132
Ethiopia 35 51 12 20 09 16 154
Gabon 9 26 4 66 84 215 155
Gambia 16 28 7 20 23 144 113
Ghana 14 29 9 13 164 86 44 117 140
Guinea 23 39 11 132 43 51 107
Guinea-Bissau 17 48 9 26 81 91
Kenya 16 35 7 8 123 25 68 134
Lesotho 17 45 6 57 31 266 164
Liberia 20 39 8 14 100 31 77 117
Madagascar 37 53 15 16 192 18 15 113
Malawi 16 53 4 14 92 26 62 162
Mali 28 39 15 135 24 68 187
Mauritania 23 29 13 130 43 233 133
Mauritius 15 10 14 14 129 230 132
Mozambique 21 47 5 15 86 26 78 88
Namibia 18 30 8 16 159 43 168 140
Niger 40 55 12 192 15 37 235
Nigeria 27 41 14 12 122 51 90 196
Rwanda 18 52 5 6 98 49 40 174
Senegal 15 20 9 19 182 32 125 113
Seychelles 6 5 2 151 337 153
Sierra Leone 21 37 11 14 112 36 101 114
Somalia 33 42 13 34 71
Sudan 32 38 21 41 89 157
South Africa 86 232 428 143
Swaziland 6 30 3 9 32 61 371 138
Tanzania Utd Rep 17 44 4 104 40 68 147
Togo 22 28 16 109 30 61 131
Uganda 16 39 6 14 121 43 49 145
Zambia 15 46 6 11 96 12 70 113
Zimbabwe 14 36 7 99 92 28 138 143
139
TABLE 18 Health effects of malnutrition (continued)Share of children under 5 share of
lowweightnewborns
Share of adults Dietaryironsupply
underweightstunted wasted total with
low BMIwomenwith lowBMI
overweight or obese per person
male female mg day
2009 2009 2009 2009 2009 2009 2009 2009 2005-07
ASIA 22 30 11 15 45 75 143
Central Asia 7 21 5 6 68 150 206 113
Kazakhstan 7 18 4 6 74 202 274 133
Kyrgyzstan 3 18 3 5 37 69 117 216 120
Tajikistan 15 33 9 10 80 116 127
Turkmenistan 12 22 6 4 99 139 145 98
Uzbekistan 4 20 5 5 59 145 198 99
East Asia 9 19 5 4 43 67 174
Brunei Darussalam 85 72 174
Cambodia 29 40 9 9 161 16 28 104
China 5 14 3 3 80 46 65 200
Indonesia 20 40 15 25 69 102
Korea DPR 18 45 9 37 39 156
Korea Republic of 1 3 1 47 65 69 77 218
Lao PDR 32 48 7 11 135 145 17 41 121
Malaysia 17 21 15 11 96 104 179 158
Mongolia 5 28 3 5 49 39 119 207 111
Myanmar 30 41 11 20 61 124
Philippines 21 32 7 21 123 142 45 83 99
Singapore 3 4 4 8 92 146 66 62
Thailand 7 16 5 192 49 118 117
Viet Nam 20 1 10 5 265 12 20 130
South Asia 40 46 18 27 329 21 42 106
Afghanistan 33 59 9 15 33
Bangladesh 41 43 18 297 10 13 81
Bhutan 12 38 5 9 47 66
India 44 48 20 28 329 356 13 25 108
Iran (Islamic Rep) 10 20 6 7 57 54 136 295 135
Maldives 18 20 10 65 261 177
Nepal 39 49 13 21 244 14 16 152
Pakistan 31 42 14 32 312 316 35 84 89
Sri Lanka 22 19 12 17 162 26 73 118
West Asia 10 23 6 224 356 144
Armenia 4 18 5 7 52 144 302 118
Azerbaijan 8 27 7 10 48 158 321 120
Bahrain 8 14 7 289 382
Cyprus 43 69 248 219 188
Georgia 2 15 3 5 159 257 105
Iraq 7 28 6 15 223 362
Jordan 2 8 2 13 30 39 273 417 112
Kuwait 2 4 2 7 25 07 372 524 172
Lebanon 4 17 7 264 297 161
Occupied PalestinianTerritory
2 12 2 102
Saudi Arabia 5 9 12 70 49 295 435 159
Syrian Arab Republic 10 28 12 9 238 390 133
Turkey 4 16 1 11 35 16 228 356 158
United Arab Emirates 302 430 196
Yemen 43 58 15 252 105 227 103
LATIN AMERICA amp THECARIBBEAN
4 14 2 8 30 190 279 140
Argentina 2 8 1 7 34 274 310 122
Bahamas 11 267 426 174
Barbados 5 10 4 14 32 33 216 442 192
Belize 5 22 2 14 244 454 167
Bolivia (Plur State) 5 27 1 6 20 100 271 102
Brazil 2 7 2 8 40 35 165 221 137
Chile 1 2 0 08 11 245 336 138
Colombia 3 13 1 6 39 119 237 112
Costa Rica 1 6 1 7 209 283 140
140
TABLE 18 Health effects of malnutrition (continued)Share of children under 5 share of
lowweightnewborns
Share of adults Dietaryironsupply
underweightstunted wasted total with
low BMIwomenwith lowBMI
overweight or obese per person
male female mg day
2009 2009 2009 2009 2009 2009 2009 2009 2005-07
Cuba 5 73 62 133 275 186
Dominica 10 101 391 177
Dominican Republic 3 10 2 11 144 293 100
Ecuador 6 29 2 10 19 157 282 81
El Salvador 7 21 2 29 202 329 157
French Guiana
Grenada 9 149 321 137
Guatemala 13 48 1 20 138 267 131
Guyana 11 18 8 83 271 127
Haiti 19 30 10 155 84 84 99
Honduras 9 30 1 10 40 129 263 140
Jamaica 3 5 5 100 382 150
Mexico 4 15 2 8 14 267 384 178
Netherlands Antilles 128
Nicaragua 6 23 2 37 168 313 136
Panama 6 22 1 10 36 194 321 117
Paraguay 3 18 1 162 223 139
Peru 5 28 1 19 111 217 158
St Kitts amp Nevis 11 320 494 153
St Lucia 12 15 8 11 119 319 158
St Vincent amp Grenadines 8 164 335 130
Suriname 8 11 5 11 165 346 98
Trinidad amp Tobago 4 5 5 19 216 380 134
Uruguay 6 14 3 8 207 260 113
Venezuela (Boliv Rep of) 4 16 5 8 266 348 114
OCEANIA 17 42 4 11 158 265
Fiji 10 61 56 213 422 179
French Polynesia 195
New Caledonia 183
Papua New Guinea 18 44 4 11 118 201
Samoa 2 4 1 453 667 175
Solomon Islands 16 34 7 13 19 253 392 137
Tonga 3 491 703
Vanuatu 12 26 6 10 19 29 229 368 167
DEVELOPED REGIONS 216 230 149
NORTH AMERICA 1 4 1 296 323 142
Bermuda 148
Canada 26 246 239 165
United States of America 1 4 1 24 302 332 139
ASIA amp OCEANIA 3 8 1 94 96 82 191
Australia 7 10 28 252 249 149
Israel 8 232 276 197
Japan 3 8 1 115 108 55 35 199
New Zealand 6 13 16 262 277 152
EUROPE 205 219 144
Albania 6 23 9 217 205 128
Belarus 1 5 2 4 197 264 148
Bosnia amp Herzegovina 2 12 4 5 227 253 202
Croatia 0 1 2 5 02 228 194 116
European Union 215 196 148
Iceland 4 23 30 234 203 208
Macedonia FYR 2 12 3 6 216 189 130
Montenegro 2 8 4 228 207
Norway 5 50 70 216 179 158
Republic of Moldova 3 11 5 6 59 100 288 142
Russian Federation 6 184 298 134
Serbia 2 8 5 6 255 203
Switzerland 35 59 183 116 126
Ukraine 4 23 8 4 54 155 236 127
141
TABLE 19 Trade and food security - caloric self-sufficiencyCaloric self-sufficiency
pa
1970 1980 1990 2000 2009 growth1970-2009
WORLD 1002 1002 1002 1002 1006 00
DEVELOPING REGIONS 997 968 983 964 948 minus04
AFRICA 1021 883 866 821 822 minus06
North Africa 901 638 660 668 761 minus13
Algeria 860
Egypt 930 602 605 668 827 minus03
Libya
Morocco 939 721 813 643 minus10
Tunisia 703 669 612 608 minus04
Sub-Saharan Africa 1044 957 962 920 873 minus06
Angola 1137 697 652 731 779 minus10
Benin 1107 1022 898 992 909 minus05
Botswana
Burkina Faso 1004 967 941 911 922 minus02
Burundi 985 968 981 971 891 minus03
Cameroon 1037 997 977 926 888 minus04
Cape Verde
Central African Republic 964 981 937 951 924 minus01
Chad 968 984 952 970 930 minus01
Comoros 901 825 701 783 692 minus07
Congo 1272 799 880 607 908 minus09
Cocircte drsquoIvoire 1044 1074 1205 1203 1092 01
Congo Dem Rep 1025 962 961 953 879 minus04
Djibouti
Equatorial Guinea 1483 1049 879 835 694 minus19
Eritrea 678
Ethiopia 899 908
Gabon 851 802 763 630 588 minus09
Gambia 1462 1241 703 638 535 minus25
Ghana 1041 990 977 986 939 minus03
Guinea 977 914 863 879 879 minus03
Guinea-Bissau 1055 950 881 871 1048 minus00
Kenya 1004 901 899 742 610 minus13
Lesotho 712 535 536
Liberia 878 823 855 654 707 minus06
Madagascar 1047 975 981 900 918 minus03
Malawi 970 1077 944 994 989 00
Mali 971 970 969 939 940 minus01
Mauritania 682
Mauritius 1057 815
Mozambique 1148 928 811 866 824 minus08
Namibia 691 650 555 564 minus05
Niger 1199 991 941 882 945 minus06
Nigeria 1049 871 982 940 900 minus04
Rwanda 982 977 951 927 890 minus03
Senegal 1095 839 866 817 686 minus12
Seychelles 1055 547
Sierra Leone 946 888 840 751 898 minus01
Somalia 921 765 851 693 524 minus14
Sudan 998 1027 935 923 795 minus06
South Africa 1173 1325 1107 980 940 minus06
Swaziland 2814 1201 minus22
Tanzania Utd Rep 1027 947 1001 902 914 minus03
Togo 1066 966 910 940 840 minus06
Uganda 1010 979 999 965 933 minus02
Zambia 797 711 901 976 1005 06
Zimbabwe 1242 1039 1307 1094 538 minus21
142
TABLE 19 Trade and food security - caloric self-sufficiency (continued)Caloric self-sufficiency
pa
1970 1980 1990 2000 2009 growth1970-2009
ASIA 980 970 987 969 943 03
Central Asia 1138 1002
Kazakhstan 1628 1235
Kyrgyzstan 918 808
Tajikistan 625 574
Turkmenistan 939 895
Uzbekistan 833 841
East Asia 995 982 1017 997 970 minus01
Brunei Darussalam
Cambodia 1075 883 990 939 951 minus03
China 982 953 963 970 895 minus02
Indonesia 1002 964 1036 1039 1247 06
Korea DPR 920 943 906 635 903 minus00
Korea Republic of 755 533
Lao PDR 904 982 987 976 1027 03
Malaysia 925 1336 1540 1340 1455 12
Mongolia 791 845 929 586 627 minus06
Myanmar 1094 1054 1009 1019 1003 minus02
Philippines 1245 1204 1012 922 893 minus08
Singapore
Thailand 1296 1552 1784 1390 1421 02
Viet Nam 797 932 1094 1074 961 05
South Asia 969 955 957 934 906 minus02
Afghanistan 968 984 881 680 812 minus04
Bangladesh 901 894 906 848 800 minus03
Bhutan 834 936 776 707 952 03
India 979 983 1000 986 957 minus01
Iran (Islamic Rep) 958 714 690 606 650 minus10
Maldives
Nepal 1092 991 982 943 920 minus04
Pakistan 991 982 900 926 909 minus02
Sri Lanka 717 792 778 682 721 00
West Asia 868 890 824 876 832
Armenia 539
Azerbaijan 693 734
Bahrain
Cyprus 631
Georgia
Iraq 858
Jordan
Kuwait
Lebanon
Occupied PalestinianTerritory
Saudi Arabia 692
Syrian Arab Republic 724 841 657 679 560 minus07
Turkey 966 1018 921 955 933 minus01
United Arab Emirates
Yemen 709 543
LATIN AMERICA amp THECARIBBEAN
1078 1040 1049 1026 1125 minus06
Argentina 1708 1895 2095 2454 2736 12
Bahamas
Barbados 1754 597 514
Belize 2460 1539
Bolivia (Plur State) 827 870 1024 1201 1421 14
Brazil 1058 1071 1123 1124 1406 07
Chile 843 677 964 680 697 minus05
Colombia 982 925 965 839 783 minus06
Costa Rica 1170 1086 1007 949 910 minus06
143
TABLE 19 Trade and food security - caloric self-sufficiency (continued)Caloric self-sufficiency
pa
1970 1980 1990 2000 2009 growth1970-2009
Cuba 2382 2213 1486 594
Dominica 941 555 527 517 minus15
Dominican Republic 2375 1259 815 508 538 minus37
Ecuador 1080 982 989 1015 1008 minus02
El Salvador 974 880 804 664 701 minus08
French Guiana
Grenada 776 653 501
Guatemala 1000 1099 1054 1267 1199 05
Guyana 2957 2046 1337 2674 1695 minus14
Haiti 958 818 652 528 510 minus16
Honduras 1124 1096 1010 868 880 minus06
Jamaica 1124 559 565
Mexico 997 771 744 669 696 minus09
Netherlands Antilles
Nicaragua 1195 867 913 937 951 minus06
Panama 1103 1105 922 637 544 minus18
Paraguay 1035 1132 1580 1663
Peru 952 636 668 684 661 minus09
St Kitts amp Nevis 1537 1019 524
St Lucia 1012 892 919
St Vincent amp Grenadines 827 517 826
Suriname 834 1163 886 793 792 minus01
Trinidad amp Tobago 1058
Uruguay 1106 1210 1663 1350 2324 19
Venezuela (Boliv Rep of) 724 616 584 619 minus04
OCEANIA 1177 1169 1342 1388 1369 minus04
Fiji 2610 1943 1322
French Polynesia 915 860 600
New Caledonia
Papua New Guinea 1162 1127 1192 1354 1431 05
Samoa 1172 1340 931 836 729 minus12
Solomon Islands 1331 1745 1903 1340 1222 minus02
Tonga 1216 1160 810 793 759 minus12
Vanuatu 1555 1329 1392 1323 1078 minus09
DEVELOPED REGIONS 1064 1190 1181 1122 1140 18
NORTH AMERICA 1260 1612 1353 1321 1290 01
Bermuda
Canada 1585 1717 1538 1607 1832 04
United States of America 1226 1599 1328 1286 1238 00
ASIA amp OCEANIA 2321 1787 2667 2720 2040 minus02
Australia 2416 2907 2931 2075 minus04
Israel
Japan
New Zealand 1833 1787 1443 1646 1859 00
EUROPE 913 873 935 967 1012 03
Albania 875 973 792 601 615 minus09
Belarus 775 1036
Bosnia amp Herzegovina 548 625
Croatia 1016 1086
European Union 851 877 982 987 925 02
Iceland
Macedonia FYR 727 681
Montenegro
Norway 588 621 714 643 501 minus04
Republic of Moldova 1074 1333
Russian Federation 884 1131
Serbia 1262
Switzerland 551 716 662 627
Ukraine 1081 1933
144
TABLE 20 Trade and food security - import billsFood import bills Food + energy import bills share of GDP
total per capita
millionUS$
millionUS$
pa US$ US$ pa pa
2000 2010 growth2000-2010
2000 2010 growth2000-2010
2000 2010 growth2000-2010
WORLD 3980557 10296380 100 651 1495 87 33 58 58
DEVELOPING REGIONS 1162631 3731805 124 236 660 108 44 73 52
AFRICA 179991 597794 128 222 585 102 57 82 38
North Africa 87973 250019 110 620 1507 93 53 86 50
Algeria 25413 78633 120 832 2217 103 49 60 20
Egypt 32784 97155 115 485 1198 95 44 89 74
Libya 7941 15315 68 1518 2410 47 28 42 41
Morocco 15154 40877 104 526 1279 93 96 142 40
Tunisia 6546 18039 107 692 1721 95 72 96 29
Sub-Saharan Africa 92018 347775 142 138 406 114 60 80 30
Angola 6384 22925 136 458 1201 101 92 33 minus97
Benin 1120 6475 192 172 732 156 92 166 61
Botswana 2561 5778 85 1457 2879 70 63 120 66
Burkina Faso 931 2586 107 76 157 76 89 79 minus12
Burundi 270 1011 141 42 121 110 69 109 47
Cameroon 2542 11843 166 162 604 141 60 89 41
Cape Verde 593 1768 115 1357 3566 101 137 166 20
Central African Republic 242 719 115 65 163 96 32 62 70
Chad 415 2940 216 51 262 179 37 67 61
Comoros 119 605 177 211 823 146 80 128 48
Congo 995 7212 219 317 1784 188 34 83 94
Cocircte drsquoIvoire 3884 15493 148 234 785 129 117 150 25
Congo Dem Rep 2055 7116 132 41 108 101 68 84 21
Djibouti 374 1080 112 511 1215 90 73 118 49
Equatorial Guinea 332 2025 198 639 2893 163 65 189 112
Eritrea 1741 2244 26 475 427 minus10 257 143 minus57
Ethiopia 818 10336 289 12 125 259 41 88 79
Gabon 1380 4160 117 1117 2764 95 33 47 38
Gambia 613 958 46 473 555 16 138 147 07
Ghana 3348 16092 170 175 660 142 133 118 minus12
Guinea 1047 2455 89 125 246 70 72 122 55
Guinea-Bissau 97 670 213 78 442 189 35 125 135
Kenya 3846 14908 145 123 368 116 83 140 53
Lesotho 1226 2628 79 624 1210 68 343 155 minus77
Liberia 86 144 52 30 36 17 49 58 17
Madagascar 1207 3988 127 79 193 94 87 92 06
Malawi 518 1664 124 46 112 92 60 82 33
Mali 1144 4073 135 101 265 101 114 106 minus07
Mauritania 1071 5483 177 405 1585 146 141 272 68
Mauritius 2822 8861 121 2360 6821 112 111 181 50
Mozambique 1931 5066 101 106 217 74 75 112 40
Namibia 2126 3940 64 1121 1726 44 64 63 minus01
Niger 558 4720 238 51 304 195 80 170 78
Nigeria 14703 57626 146 119 364 118 41 47 12
Rwanda 425 2459 192 52 231 160 40 60 41
Senegal 3349 10256 118 352 825 89 146 192 28
Seychelles 304 1867 199 3850 21458 187 170 521 118
Sierra Leone 413 1694 152 100 289 112 131 264 73
Somalia 1411 6048 157 191 648 130
Sudan 3594 14751 152 105 339 124 37 29 minus25
South Africa 11075 40750 139 247 813 126 37 70 65
Swaziland 1792 4013 84 1684 3384 72 207 140 minus38
Tanzania Utd Rep 2208 7585 131 65 169 101 54 142 101
Togo 714 2051 111 149 340 86 131 208 48
Uganda 1766 5306 116 73 159 81 66 80 20
Zambia 694 2334 129 68 178 101 55 66 20
Zimbabwe 759 7845 263 61 624 263 226
145
TABLE 20 Trade and food security - import bills (continued)Food import bills Food + energy import bills share of GDP
total per capita
millionUS$
millionUS$
pa US$ US$ pa pa
2000 2010 growth2000-2010
2000 2010 growth2000-2010
2000 2010 growth2000-2010
ASIA 714793 2459868 132 199 611 118 51 82 50
Central Asia 9547 39240 152 172 646 141 54 56 04
Kazakhstan 3726 17041 164 249 1063 156 50 38 minus27
Kyrgyzstan 635 4573 218 128 857 209 140 280 71
Tajikistan 652 4582 215 106 666 202 309 204 minus41
Turkmenistan 1803 4291 91 400 851 78 40
Uzbekistan 2732 8754 124 110 319 112 37 51 32
East Asia 409084 1480333 137 216 725 129 57 88 44
Brunei Darussalam 1727 4502 101 5282 11283 79 29 46 47
Cambodia 938 5678 197 75 402 182 117 167 37
China 207426 837460 150 160 610 143 35 61 57
Indonesia 53 73 33
Korea DPR 2315 2171 minus06 101 89 minus12
Korea Republic of 71923 215999 116 1564 4483 111 85 156 63
Lao PDR 481 1632 130 91 263 113 67 92 32
Malaysia 33406 120525 137 1427 4244 115 78 147 66
Mongolia 778 3684 168 323 1337 153 179 207 15
Myanmar 2184 4950 85 49 103 78 65 40 minus48
Philippines 24056 58852 94 311 631 73 86 90 05
Singapore 32231 80440 96 8224 15816 68 206 448 81
Thailand 24502 82275 129 388 1190 119 81 151 64
Viet Nam 7115 60078 238 90 684 224 91 159 58
South Asia 95776 322413 129 66 189 112 34 83 94
Afghanistan 4174 6659 48 183 212 15 96
Bangladesh 11087 53509 170 86 360 154 37 76 74
Bhutan 220 1100 175 385 1515 147 85 159 65
India 31571 124317 147 30 102 130 26 93 136
Iran (Islamic Rep) 22803 62356 106 349 843 92 28 35 23
Maldives 774 1624 77 2834 5138 61 155 208 30
Nepal 1752 5754 126 72 192 103 72 107 41
Pakistan 15200 48709 124 105 281 103 69 100 38
Sri Lanka 8195 18386 84 437 881 73 83 93 11
West Asia 200387 617881 119 1130 2765 94 44 60 33
Armenia 1753 5934 130 570 1919 129 161 132 minus20
Azerbaijan 1996 9581 170 246 1043 155 49 24 minus68
Bahrain 7491 12547 53 11742 9942 minus16 104 73 minus35
Cyprus 3369 9773 112 3572 8852 95 89 115 26
Georgia 1434 8223 191 302 1889 201 92 157 55
Iraq 33338 83450 96 1397 2635 65 153
Jordan 8045 23347 112 1667 3774 85 118 227 68
Kuwait 9231 34226 140 4756 12505 102 26 32 24
Lebanon 9576 27103 110 2559 6410 96 115 159 33
Occupied PalestinianTerritory
4541 6448 36 1420 1596 12
Saudi Arabia 49863 148133 115 2488 5397 81 27 40 41
Syrian Arab Republic 6831 24656 137 427 1208 110 43 110 99
Turkey 17633 69629 147 277 957 132 35 55 46
United Arab Emirates 31295 98922 122 10318 13168 25 36 50 32
Yemen 7901 29831 142 446 1240 108 110 191 57
LATIN AMERICA amp THECARIBBEAN
258747 650107 97 496 1102 83 27 43 47
Argentina 11905 20384 55 322 504 46 07 14 66
Bahamas 2826 4630 51 9483 13498 36 89 147 51
Barbados 1080 3170 114 4028 11610 112 75 129 55
Belize 591 850 37 2353 2724 15 182 155 minus16
Bolivia (Plur State) 2394 3798 47 288 383 29 39 59 42
Brazil 35101 78639 84 201 403 72 18 24 25
Chile 11818 44242 141 766 2585 129 56 113 73
Colombia 13256 38065 111 333 822 94 16 25 49
Costa Rica 4059 11415 109 1036 2450 90 59 96 51
146
TABLE 20 Trade and food security - import bills (continued)Food import bills Food + energy import bills share of GDP
total per capita
millionUS$
millionUS$
pa US$ US$ pa pa
2000 2010 growth2000-2010
2000 2010 growth2000-2010
2000 2010 growth2000-2010
Cuba 7509 18935 97 676 1682 95
Dominica 273 460 54 3896 6759 57 153 222 38
Dominican Republic 7653 18710 94 891 1885 78 97 108 11
Ecuador 2997 17957 196 243 1241 177 36 83 89
El Salvador 6871 13533 70 1157 2185 66 98 128 27
French Guiana
Grenada 391 570 38 3836 5481 36 140 161 14
Guatemala 5612 17487 120 499 1215 93 69 113 51
Guyana 1074 1680 46 1466 2229 43 186 253 31
Haiti 3301 14633 161 382 1464 144 100 246 94
Honduras 5388 11595 80 866 1526 58 127 188 40
Jamaica 4677 7485 48 1811 2731 42 117 209 60
Mexico 82457 186109 85 825 1641 71 20 48 91
Netherlands Antilles 1124 1466 27 6243 7292 16
Nicaragua 2562 7105 107 505 1228 93 141 278 70
Panama 3690 9770 102 1248 2778 83 86 51 minus51
Paraguay 1585 4199 102 297 651 82 72 114 46
Peru 8304 29975 137 321 1031 124 37 57 44
St Kitts amp Nevis 314 487 45 6828 9373 32 141 131 minus07
St Lucia 571 274 minus71 3639 1572 minus80 184 492 103
St Vincent amp Grenadines 398 708 59 3683 6494 58 163 271 52
Suriname 582 2033 133 1247 3873 120 99 107 08
Trinidad amp Tobago 2561 7088 107 1983 5286 103 162 130 minus22
Uruguay 3455 8785 98 1041 2608 96 38 102 103
Venezuela (Boliv Rep of) 17548 60738 132 721 2096 113 20 22 13
OCEANIA 9099 24035 102 1122 2414 80 336 346 03
Fiji 1023 2604 98 1259 3025 92 90 257 111
French Polynesia 1886 3682 69 7924 13585 55
New Caledonia 1242 3050 94 5859 12151 76
Papua New Guinea 1789 6057 130 333 883 103 116 141 20
Samoa 250 722 112 1411 3948 108 178 227 25
Solomon Islands 101 862 240 246 1602 206 87 271 120
Tonga 131 490 141 1341 4710 134 126 282 84
Vanuatu 124 507 151 672 2111 121 75 169 85
DEVELOPED REGIONS 2817926 6564575 88 2361 5288 84 30 51 56
NORTH AMERICA 523687 1042686 71 1672 3026 61 19 33 55
Bermuda 313 1349 157 4964 20751 154
Canada 107827 241046 84 3516 7086 73 32 47 40
United States of America 414893 798725 68 1469 2573 58 18 31 56
ASIA amp OCEANIA 41 3163 4565 37 26 48 63
Australia 25799 82915 124 1346 3724 107 20 35 56
Israel 17637 46462 102 2932 6263 79 43 34 minus22
Japan 436892 575640 28 3475 4549 27 26 51 70
New Zealand 9144 28151 119 2370 6445 105 44 63 35
EUROPE 1804766 4788721 103 2488 6500 101 44 68 44
Albania 1978 6375 124 644 1990 119 81 105 26
Belarus 9010 24432 105 896 2546 110 335 294 minus13
Bosnia amp Herzegovina 6704 14597 81 1815 3882 79 166 157 minus05
Croatia 5845 19002 125 1297 4316 128 81 90 10
European Union 1630103 4127225 97 3385 8245 93 44 70 47
Iceland 2054 3803 64 7310 11886 50 51 74 37
Macedonia FYR 2299 6631 112 1144 3217 109 145 156 08
Montenegro 4438 7033 173
Norway 19698 53402 105 4386 10936 96 19 27 38
Republic of Moldova 518 4516 242 126 1264 259 189 181 minus04
Russian Federation 83028 391496 168 566 2739 171 40 36 minus11
Serbia 8668 879 92
Switzerland 34857 82665 90 4863 10786 83 29 43 41
Ukraine 6999 48454 213 143 1066 222 214 208 minus03
147
TABLE 21 Dimensions of povertyPoverty gap at Poverty headcount ratio Multi-
dimensional
$125 aday (ppp)
$2 a day(ppp)
nationalpovertyline
ruralpovertyline
$125 aday (ppp)
$2 a day(ppp)
nationalpovertyline
ruralpovertyline
poverty(MPI)
0 to 1
2009 2009 2009 2009 2009 2009 2009 2009 2009
WORLD
DEVELOPING REGIONS
AFRICA
North Africa
Algeria 14 65 32 45 68 236 226 303
Egypt 04 35 36 20 185 220 300 00
Libya
Morocco 05 31 25 140 90 145 00
Tunisia 05 30 25 128 38 00
Sub-Saharan Africa
Angola 299 424 543 702 05
Benin 157 335 120 140 473 753 390 460 04
Botswana 110 223 117 184 312 494 306 448
Burkina Faso 203 393 153 176 565 812 464 524 05
Burundi 364 561 234 242 813 935 669 689 05
Cameroon 12 82 123 175 96 304 399 550 03
Cape Verde 60 152 81 143 210 409 266 443
Central African Republic 313 468 331 350 628 801 620 694 05
Chad 256 439 216 233 619 833 550 586 03
Comoros 208 342 163 178 461 650 448 487 04
Congo 228 388 189 206 541 744 501 577 02
Cocircte drsquoIvoire 75 178 153 203 238 463 427 542 04
Congo Dem Rep 253 424 322 349 592 796 713 757 04
Djibouti 53 146 188 412 01
Equatorial Guinea
Eritrea 690
Ethiopia 96 289 83 85 390 776 389 393 06
Gabon 09 50 100 160 48 196 327 446 02
Gambia 121 249 251 305 343 567 580 678 03
Ghana 105 223 96 135 300 536 285 392 01
Guinea 150 310 176 220 433 696 530 630 05
Guinea-Bissau 165 348 250 278 488 779 647 691
Kenya 61 151 163 175 197 399 459 491 02
Lesotho 208 331 379 265 434 623 566 605 02
Liberia 408 595 244 263 837 948 638 677 05
Madagascar 265 469 268 289 678 896 687 735 04
Malawi 323 518 80 86 739 905 524 559 04
Mali 188 365 167 514 771 474 576 06
Mauritania 57 159 170 241 212 441 463 612 04
Mauritius
Mozambique 252 429 212 222 600 816 547 569 05
Namibia 246 365 130 160 491 622 380 490 02
Niger 119 306 196 212 431 759 595 639 06
Nigeria 296 469 228 266 644 839 547 638 03
Rwanda 409 572 240 260 768 896 585 642 04
Senegal 108 247 164 215 335 604 508 619 04
Seychelles 01 03 02 18
Sierra Leone 203 375 275 346 534 761 664 785 04
Somalia 05
Sudan
South Africa 33 123 70 174 357 230 01
Swaziland 294 458 329 370 629 810 692 750 02
Tanzania Utd Rep 281 475 99 110 679 879 334 374 04
Togo 114 279 229 293 387 693 617 743 03
Uganda 83 213 68 76 287 553 245 272 04
Zambia 328 483 285 388 643 815 593 768 03
Zimbabwe 160 720 440 02
148
TABLE 21 Dimensions of poverty (continued)Poverty gap at Poverty headcount ratio Multi-
dimensional
$125 aday (ppp)
$2 a day(ppp)
nationalpovertyline
ruralpovertyline
$125 aday (ppp)
$2 a day(ppp)
nationalpovertyline
ruralpovertyline
poverty(MPI)
0 to 1
2009 2009 2009 2009 2009 2009 2009 2009 2009
ASIA
Central Asia
Kazakhstan 01 03 31 45 02 15 154 217 00
Kyrgyzstan 01 55 100 120 19 294 431 508 00
Tajikistan 51 168 124 124 215 509 472 492 01
Turkmenistan 70 184 248 497
Uzbekistan 150 332 463 767 00
East Asia
Brunei Darussalam
Cambodia 61 202 72 83 283 565 301 345 03
China 40 122 159 363 28 25
Indonesia 36 155 25 31 187 506 142 174 01
Korea DPR
Korea Republic of
Lao PDR 89 248 339 660 276 317 03
Malaysia 00 02 08 18 00 23 38 82
Mongolia 62 172 101 134 224 491 352 466 01
Myanmar 02
Philippines 55 164 27 152 226 450 265 507 01
Singapore
Thailand 19 83 30 108 265 81 104 00
Viet Nam 23 109 35 46 131 385 145 187 01
South Asia
Afghanistan 79 83 360 375
Bangladesh 131 338 90 98 496 813 400 438 03
Bhutan 70 188 61 81 262 495 232 309 01
India 105 295 416 756 275 283 03
Iran (Islamic Rep) 03 18 14 80
Maldives 01 25 15 122 00
Nepal 197 378 75 85 551 776 309 346 03
Pakistan 43 187 226 603 223 270 03
Sri Lanka 10 74 31 32 70 291 152 157 00
West Asia
Armenia 02 23 49 121 13 124 265 255 00
Azerbaijan 02 15 20 10 78 158 185 00
Bahrain
Cyprus
Georgia 46 118 72 92 147 326 236 297 00
Iraq 06 55 45 90 40 253 229 393 01
Jordan 01 06 26 04 35 133 190 00
Kuwait
Lebanon
Occupied PalestinianTerritory
Saudi Arabia
Syrian Arab Republic 02 33 17 169 00
Turkey 09 26 27 91 181 387 00
United Arab Emirates 00
Yemen 42 148 89 106 175 466 348 401 03
LATIN AMERICA amp THECARIBBEAN
Argentina 04 08 09 24 00
Bahamas
Barbados
Belize 47 97 121 240 335 442 00
Bolivia (Plur State) 58 109 140 247 601 773 01
Brazil 11 32 38 99 214 00
Chile 04 08 08 24 151 129
Colombia 57 119 160 279 455 643 00
Costa Rica 01 11 07 54 217 230
149
TABLE 21 Dimensions of poverty (continued)Poverty gap at Poverty headcount ratio Multi-
dimensional
$125 aday (ppp)
$2 a day(ppp)
nationalpovertyline
ruralpovertyline
$125 aday (ppp)
$2 a day(ppp)
nationalpovertyline
ruralpovertyline
poverty(MPI)
0 to 1
2009 2009 2009 2009 2009 2009 2009 2009 2009
Cuba
Dominica
Dominican Republic 09 39 43 136 505 571 00
Ecuador 16 44 51 134 360 575 00
El Salvador 11 45 51 152 378 465
French Guiana
Grenada
Guatemala 65 129 169 298 510 705 01
Guyana 39 69 77 168 01
Haiti 282 418 549 722 770 880 03
Honduras 119 182 233 354 588 644 02
Jamaica 00 09 02 58 99 251
Mexico 17 32 34 81 474 608 00
Netherlands Antilles
Nicaragua 52 123 158 319 462 679 01
Panama 31 71 95 179 327 598
Paraguay 15 43 51 132 351 498 01
Peru 14 47 59 147 348 603 01
St Kitts amp Nevis
St Lucia 72 155 209 406
St Vincent amp Grenadines
Suriname 59 117 155 272 00
Trinidad amp Tobago 11 39 42 135 00
Uruguay 00 00 00 02 205 222 00
Venezuela (Boliv Rep of) 11 32 35 101 290
OCEANIA
Fiji 101 148 310 433
French Polynesia
New Caledonia
Papua New Guinea 123 255 124 138 358 574 375 413
Samoa
Solomon Islands
Tonga
Vanuatu 01
DEVELOPED REGIONS
NORTH AMERICA
Bermuda
Canada
United States of America
ASIA amp OCEANIA
Australia
Israel
Japan
New Zealand
EUROPE
Albania 02 08 23 26 06 42 124 146 00
Belarus 00 00 00 00 54
Bosnia amp Herzegovina 00 01 46 49 00 02 140 178 00
Croatia 00 00 26 00 00 111 00
European Union
Iceland
Macedonia FYR 00 07 72 77 03 43 190 213 00
Montenegro 00 00 09 14 00 00 49 89 00
Norway
Republic of Moldova 03 26 19 125 290 00
Russian Federation 00 00 27 55 00 01 111 212 00
Serbia 01 02 13 20 01 07 66 98 00
Switzerland
Ukraine 00 01 15 23 01 05 79 113 00
150
TABLE 22 Dimensions of inequalityHuman Development Index Gender
inequalityIndex
Gini-index Income share held by
inequalityadjusted
incomedistribution
highest20
lowest20
index index index index
2010 2010 2008 2009 2009 2009
WORLD
DEVELOPING REGIONS
AFRICA
North Africa
Algeria 07 06 353
Egypt 06 04 07 321 415 90
Libya 07 05
Morocco 06 04 07 409 479 65
Tunisia 07 05 05 408 473 60
Sub-Saharan Africa
Angola 04 02 586 619 20
Benin 04 03 07 386 461 70
Botswana 06 06 610
Burkina Faso 03 02 396 471 70
Burundi 03 02 06 333 428 90
Cameroon 05 03 07 446 462 67
Cape Verde 05 504 559 45
Central African Republic 03 02 08 436 606 34
Chad 03 02 398 466 63
Comoros 04 02 643 680 25
Congo 05 03 07 473 531 50
Cocircte drsquoIvoire 04 03 07 415 476 56
Congo Dem Rep 02 02 08
Djibouti 04 03 399 465 60
Equatorial Guinea 05
Eritrea
Ethiopia 03 02 298 394 93
Gabon 06 05 06 415 482 62
Gambia 04 02 07 473 528 48
Ghana 05 03 07 428 485 52
Guinea 03 02 394 462 63
Guinea-Bissau 03 02 355 432 73
Kenya 05 03 07 477 532 48
Lesotho 04 03 07 525 564 30
Liberia 03 02 08 382 450 64
Madagascar 04 03 472 535 62
Malawi 04 03 07 390 465 70
Mali 03 02 08 390 460 65
Mauritania 04 03 07 390 457 62
Mauritius 07
Mozambique 03 02 07 456 515 52
Namibia 06 03 06 743
Niger 03 02 08 340 428 83
Nigeria 04 02 429 486 51
Rwanda 04 02 06 531 582 42
Senegal 04 03 07 392 459 62
Seychelles 658 696 37
Sierra Leone 03 02 08 425 493 61
Somalia
Sudan 04 07
South Africa 06 04 06 578 722 25
Swaziland 05 03 07 507 559 45
Tanzania Utd Rep 04 03 376 448 68
Togo 04 03 07 344 424 76
Uganda 04 03 07 443 493 61
Zambia 04 03 07 507 552 36
Zimbabwe 01 01 07 501
151
TABLE 22 Dimensions of inequality (continued)Human Development Index Gender
inequalityIndex
Gini-index Income share held by
inequalityadjusted
incomedistribution
highest20
lowest20
index index index index
2010 2010 2008 2009 2009 2009
ASIA
Central Asia
Kazakhstan 07 06 05 309 399 87
Kyrgyzstan 06 05 05 334 428 88
Tajikistan 06 05 05 336 417 78
Turkmenistan 07 05 408
Uzbekistan 06 05 367 442 71
East Asia
Brunei Darussalam 08
Cambodia 05 04 06 444 517 66
China 05 04 415 478 57
Indonesia 06 05 07 368 455 74
Korea DPR
Korea Republic of 09 07 03 316
Lao PDR 05 04 06 367 448 76
Malaysia 07 04 462 448 65
Mongolia 06 05 05 365 405 72
Myanmar 04
Philippines 06 05 06 440 504 56
Singapore 08 02 425
Thailand 06 05 05 536 493 62
Viet Nam 06 05 05 376 454 73
South Asia
Afghanistan 03 08 294 387 90
Bangladesh 05 03 07 310 408 94
Bhutan 467 530 54
India 05 04 07 368 453 81
Iran (Islamic Rep) 07 06 383 452 64
Maldives 06 05 05 374 442 65
Nepal 04 03 07 473 540 59
Pakistan 05 03 07 327 421 90
Sri Lanka 07 05 06 403 478 69
West Asia
Armenia 07 06 05 309 398 88
Azerbaijan 07 06 05 337 421 80
Bahrain 08 05
Cyprus 08 07 03
Georgia 07 06 06 413 471 53
Iraq 07 399 87
Jordan 07 06 06 377 455 73
Kuwait 08 05
Lebanon
Occupied PalestinianTerritory
Saudi Arabia 07 08
Syrian Arab Republic 06 05 06 358 439 77
Turkey 07 05 06 397 489 52
United Arab Emirates 08 04
Yemen 04 03 08 377
LATIN AMERICA amp THECARIBBEAN
Argentina 08 06 05 458 531 36
Bahamas 08 07
Barbados 08 05
Belize 07 05 06 544
Bolivia (Plur State) 06 04 06 573 610 28
Brazil 07 05 06 539 585 32
Chile 08 06 05 521 572 43
Colombia 07 05 06 585 621 25
Costa Rica 07 06 05 503 523 44
152
TABLE 22 Dimensions of inequality (continued)Human Development Index Gender
inequalityIndex
Gini-index Income share held by
inequalityadjusted
incomedistribution
highest20
lowest20
index index index index
2010 2010 2008 2009 2009 2009
Cuba 05
Dominica
Dominican Republic 07 05 06 484 536 44
Ecuador 07 06 06 490 589 36
El Salvador 07 05 06 469 519 47
French Guiana
Grenada
Guatemala 06 04 07 537 580 35
Guyana 06 05 06 432
Haiti 04 02 07 595 630 25
Honduras 06 04 06 577 607 20
Jamaica 07 06 06 455 516 53
Mexico 07 06 06 517 562 38
Netherlands Antilles
Nicaragua 06 04 06 523 569 38
Panama 08 05 06 523 586 27
Paraguay 06 05 06 520 565 38
Peru 07 05 06 480 543 40
St Kitts amp Nevis
St Lucia 426
St Vincent amp Grenadines
Suriname 06 05 528
Trinidad amp Tobago 07 06 05 403
Uruguay 08 06 05 424 515 46
Venezuela (Boliv Rep of) 07 05 06 435 490 49
OCEANIA
Fiji 07
French Polynesia
New Caledonia
Papua New Guinea 04 08 509
Samoa
Solomon Islands 05
Tonga 07
Vanuatu
DEVELOPED REGIONS
NORTH AMERICA
Bermuda
Canada 09 08 03 326 399 72
United States of America 09 08 05 408 458 54
ASIA amp OCEANIA
Australia 09 09 03 352
Israel 09 08 03 392 449 57
Japan 09 03 249
New Zealand 09 03 362
EUROPE
Albania 07 06 05 345 430 81
Belarus 07 07 272 364 92
Bosnia amp Herzegovina 07 06 362 432 67
Croatia 08 07 04 336 420 81
European Union
Iceland 09 08 03
Macedonia FYR 07 06 442 503 54
Montenegro 07 300 388 85
Norway 09 09 02 258 372 96
Republic of Moldova 06 05 05 380 453 68
Russian Federation 07 06 05 423 489 60
Serbia 07 282
Switzerland 09 08 02 337 413 75
Ukraine 07 07 05 275 371 94
153
TABLE 23 GovernanceVoice ampaccount-ability
Politicalstabilityabsence ofviolence ampterrorism
Govern-ment
effectiveness
Regulatoryquality
Rule oflaw
Control ofcorruption
Averagegovernance
-25 to 25(lowest tohighest)
-25 to 25(lowest tohighest)
-25 to 25(lowest tohighest)
-25 to 25(lowest tohighest)
-25 to 25(lowest tohighest)
-25 to 25(lowest tohighest)
-25 to 25(lowest tohighest)
2010 2010 2010 2010 2010 2010 2010
WORLD
DEVELOPING REGIONS
AFRICA
North Africa
Algeria minus10 minus13 minus06 minus11 minus08 minus05 minus09
Egypt minus12 minus09 minus04 minus02 minus01 minus06 minus06
Libya minus19 minus01 minus12 minus12 minus10 minus13 minus11
Morocco minus08 minus05 minus02 minus01 minus02 minus02 minus03
Tunisia minus13 01 02 minus00 01 minus01 minus02
Sub-Saharan Africa
Angola minus11 minus02 minus11 minus10 minus12 minus13 minus10
Benin 03 03 minus05 minus03 minus07 minus08 minus03
Botswana 04 09 05 05 07 10 07
Burkina Faso minus02 minus01 minus06 minus01 minus02 minus04 minus03
Burundi minus09 minus15 minus11 minus11 minus12 minus11 minus12
Cameroon minus11 minus06 minus09 minus07 minus10 minus10 minus09
Cape Verde 09 08 minus01 minus01 04 08 05
Central African Republic minus11 minus21 minus14 minus11 minus13 minus08 minus13
Chad minus14 minus15 minus15 minus11 minus15 minus13 minus14
Comoros minus04 minus04 minus17 minus15 minus11 minus07 minus10
Congo minus10 minus02 minus12 minus13 minus11 minus11 minus10
Cocircte drsquoIvoire minus11 minus16 minus13 minus09 minus12 minus11 minus12
Congo Dem Rep minus14 minus22 minus17 minus16 minus16 minus14 minus17
Djibouti minus11 03 minus10 minus07 minus07 minus03 minus06
Equatorial Guinea minus19 02 minus17 minus14 minus13 minus15 minus12
Eritrea minus22 minus09 minus14 minus22 minus13 minus05 minus14
Ethiopia minus13 minus17 minus03 minus09 minus08 minus07 minus10
Gabon minus09 02 minus09 minus06 minus05 minus08 minus06
Gambia minus11 01 minus07 minus04 minus05 minus06 minus05
Ghana 05 00 minus00 01 minus01 01 01
Guinea minus09 minus18 minus11 minus11 minus15 minus12 minus13
Guinea-Bissau minus09 minus08 minus10 minus11 minus14 minus11 minus10
Kenya minus02 minus12 minus05 minus01 minus10 minus09 minus07
Lesotho minus02 05 minus04 minus06 minus03 02 minus01
Liberia minus02 minus05 minus12 minus11 minus10 minus05 minus07
Madagascar minus08 minus11 minus08 minus06 minus08 minus03 minus07
Malawi minus02 01 minus04 minus06 minus01 minus04 minus03
Mali 02 minus03 minus09 minus05 minus05 minus07 minus04
Mauritania minus09 minus13 minus09 minus08 minus09 minus07 minus09
Mauritius 07 05 08 08 08 07 07
Mozambique minus01 03 minus05 minus04 minus05 minus04 minus03
Namibia 03 08 01 01 02 03 03
Niger minus06 minus11 minus07 minus05 minus06 minus07 minus07
Nigeria minus08 minus20 minus12 minus08 minus12 minus10 minus12
Rwanda minus13 minus01 minus01 minus02 minus03 05 minus02
Senegal minus03 minus04 minus05 minus03 minus04 minus07 minus04
Seychelles 01 08 02 minus06 00 03 01
Sierra Leone minus02 minus02 minus12 minus07 minus09 minus08 minus07
Somalia minus20 minus31 minus22 minus24 minus24 minus17 minus23
Sudan minus17 minus27 minus14 minus14 minus13 minus13 minus16
South Africa 05 minus00 03 04 01 01 02
Swaziland minus13 minus01 minus05 minus06 minus05 minus02 minus05
Tanzania Utd Rep minus01 minus00 minus05 minus04 minus05 minus05 minus03
Togo minus10 minus02 minus14 minus09 minus09 minus10 minus09
Uganda minus05 minus11 minus06 minus01 minus04 minus09 minus06
Zambia minus03 05 minus08 minus05 minus05 minus06 minus04
Zimbabwe minus15 minus12 minus16 minus20 minus18 minus14 minus16
154
TABLE 23 Governance (continued)Voice ampaccount-ability
Politicalstabilityabsence ofviolence ampterrorism
Govern-ment
effectiveness
Regulatoryquality
Rule oflaw
Control ofcorruption
Averagegovernance
-25 to 25(lowest tohighest)
-25 to 25(lowest tohighest)
-25 to 25(lowest tohighest)
-25 to 25(lowest tohighest)
-25 to 25(lowest tohighest)
-25 to 25(lowest tohighest)
-25 to 25(lowest tohighest)
2010 2010 2010 2010 2010 2010 2010
ASIA
Central Asia
Kazakhstan minus11 05 minus03 minus03 minus06 minus10 minus05
Kyrgyzstan minus10 minus10 minus06 minus02 minus13 minus11 minus09
Tajikistan minus14 minus09 minus09 minus11 minus12 minus12 minus11
Turkmenistan minus20 02 minus16 minus21 minus15 minus14 minus14
Uzbekistan minus20 minus08 minus08 minus16 minus14 minus13 minus13
East Asia
Brunei Darussalam minus07 12 09 11 08 09 07
Cambodia minus09 minus06 minus08 minus05 minus11 minus12 minus08
China minus16 minus08 01 minus02 minus03 minus06 minus06
Indonesia minus01 minus09 minus02 minus04 minus06 minus07 minus05
Korea DPR minus22 minus05 minus19 minus24 minus13 minus13 minus16
Korea Republic of 07 01 12 09 10 04 07
Lao PDR minus16 minus02 minus09 minus10 minus09 minus11 minus10
Malaysia minus05 01 11 06 05 01 03
Mongolia 00 05 minus06 minus03 minus04 minus07 minus03
Myanmar minus21 minus13 minus17 minus22 minus15 minus17 minus17
Philippines minus01 minus16 minus01 minus03 minus05 minus08 minus06
Singapore minus03 11 22 18 17 22 15
Thailand minus06 minus12 01 02 minus02 minus03 minus03
Viet Nam minus14 01 minus03 minus06 minus05 minus06 minus05
South Asia
Afghanistan minus15 minus26 minus15 minus16 minus19 minus16 minus18
Bangladesh minus03 minus14 minus08 minus09 minus08 minus10 minus09
Bhutan minus05 07 06 minus11 01 08 01
India 04 minus13 minus00 minus04 minus01 minus05 minus03
Iran (Islamic Rep) minus16 minus16 minus05 minus16 minus09 minus09 minus12
Maldives minus01 minus00 minus02 minus04 minus03 minus06 minus03
Nepal minus05 minus17 minus08 minus07 minus10 minus07 minus09
Pakistan minus08 minus27 minus08 minus06 minus08 minus11 minus11
Sri Lanka minus05 minus08 minus02 minus02 minus01 minus04 minus04
West Asia
Armenia minus09 00 minus02 03 minus05 minus07 minus03
Azerbaijan minus13 minus03 minus08 minus04 minus09 minus12 minus08
Bahrain minus09 minus03 06 08 04 02 01
Cyprus 11 04 15 14 12 11 11
Georgia minus02 minus07 03 06 minus02 minus02 minus01
Iraq minus11 minus23 minus12 minus11 minus16 minus13 minus14
Jordan minus08 minus03 01 02 02 00 minus01
Kuwait minus05 04 01 02 05 03 02
Lebanon minus03 minus15 minus03 00 minus07 minus08 minus06
Occupied PalestinianTerritory
Saudi Arabia minus18 minus02 minus01 01 02 01 minus03
Syrian Arab Republic minus17 minus08 minus06 minus09 minus05 minus11 minus09
Turkey minus02 minus10 04 04 01 00 minus01
United Arab Emirates minus09 08 08 04 04 10 04
Yemen minus13 minus22 minus10 minus06 minus11 minus11 minus12
LATIN AMERICA amp THECARIBBEAN
Argentina 03 minus00 minus02 minus07 minus06 minus04 minus03
Bahamas 10 10 10 05 07 14 09
Barbados 12 11 14 05 10 14 11
Belize 07 minus00 minus04 minus05 minus04 minus01 minus01
Bolivia (Plur State) minus01 minus04 minus05 minus08 minus11 minus05 minus06
Brazil 05 00 01 02 00 01 01
Chile 10 06 12 14 13 15 12
Colombia minus02 minus15 01 03 minus03 minus04 minus03
Costa Rica 10 06 03 05 05 07 06
155
TABLE 23 Governance (continued)Voice ampaccount-ability
Politicalstabilityabsence ofviolence ampterrorism
Govern-ment
effectiveness
Regulatoryquality
Rule oflaw
Control ofcorruption
Averagegovernance
-25 to 25(lowest tohighest)
-25 to 25(lowest tohighest)
-25 to 25(lowest tohighest)
-25 to 25(lowest tohighest)
-25 to 25(lowest tohighest)
-25 to 25(lowest tohighest)
-25 to 25(lowest tohighest)
2010 2010 2010 2010 2010 2010 2010
Cuba minus16 03 minus02 minus16 minus06 05 minus05
Dominica 10 10 07 04 07 07 08
Dominican Republic 01 00 minus06 minus02 minus08 minus08 minus04
Ecuador minus03 minus06 minus07 minus11 minus12 minus09 minus08
El Salvador 00 01 00 04 minus09 minus02 minus01
French Guiana 11 02 12 12 12 11 10
Grenada 08 06 02 04 01 04 04
Guatemala minus04 minus08 minus07 minus02 minus10 minus05 minus06
Guyana 00 minus05 minus01 minus05 minus05 minus06 minus04
Haiti minus07 minus09 minus16 minus11 minus14 minus13 minus12
Honduras minus05 minus05 minus07 minus02 minus09 minus09 minus06
Jamaica 04 minus04 02 03 minus05 minus04 minus01
Mexico 01 minus08 02 03 minus06 minus04 minus02
Netherlands Antilles 04 11 07 09 09 09 08
Nicaragua minus05 minus06 minus10 minus04 minus08 minus08 minus07
Panama 05 00 01 04 minus01 minus04 01
Paraguay minus01 minus09 minus09 minus04 minus09 minus08 minus07
Peru 00 minus09 minus02 05 minus06 minus02 minus02
St Kitts amp Nevis 11 11 07 04 07 10 09
St Lucia 12 08 08 04 08 12 09
St Vincent amp Grenadines 12 09 07 04 09 10 09
Suriname 04 01 minus01 minus07 minus01 minus04 minus01
Trinidad amp Tobago 05 minus00 03 05 minus02 minus04 01
Uruguay 11 09 07 04 07 13 08
Venezuela (Boliv Rep of) minus09 minus14 minus10 minus16 minus16 minus12 minus13
OCEANIA
Fiji minus10 minus01 minus07 minus07 minus09 minus09 minus07
French Polynesia
New Caledonia minus02
Papua New Guinea 01 minus08 minus08 minus05 minus09 minus11 minus07
Samoa
Solomon Islands 01 04 minus09 minus12 minus07 minus05 minus05
Tonga 03 08 minus03 minus05 01 minus03 minus00
Vanuatu 05 14 minus03 minus08 03 04 02
DEVELOPED REGIONS
NORTH AMERICA
Bermuda 10 09 10 14 12 13 11
Canada 14 09 19 17 18 21 16
United States of America 12 03 14 14 16 12 12
ASIA amp OCEANIA
Australia 14 08 18 17 18 21 16
Israel 06 minus15 12 12 09 06 05
Japan 10 09 14 10 13 15 12
New Zealand 15 12 19 18 19 24 18
EUROPE
Albania 01 minus02 minus03 02 minus04 minus04 minus02
Belarus minus16 minus01 minus11 minus12 minus10 minus08 minus10
Bosnia amp Herzegovina minus01 minus07 minus07 minus01 minus04 minus03 minus04
Croatia 04 06 06 06 02 00 04
European Union
Iceland 14 10 16 09 17 19 14
Macedonia FYR 01 minus05 minus02 03 minus03 minus01 minus01
Montenegro 02 05 01 minus01 minus00 minus03 01
Norway 16 13 18 15 19 21 17
Republic of Moldova minus01 minus04 minus06 minus01 minus04 minus07 minus04
Russian Federation minus09 minus09 minus04 minus04 minus08 minus11 minus07
Serbia 03 minus04 minus01 minus00 minus04 minus02 minus01
Switzerland 16 12 19 17 18 21 17
Ukraine minus01 minus01 minus08 minus06 minus08 minus10 minus06
156
TABLE 24 Education health and sanitationLiteracyratefemale
Ratio of girls-to-boys Expendi-ture perstudent
Public expon
education
Health expenditure Prevalenceof HIV
Access to improved
out ofprimaryschool
in primand seceducation
share ofGDP percapita
share ofGDP
currentper capita
share ofGDP
ages15-49
sanitationfacilities
water source
ratio US$ rur urb
2009 2009 2009 2009 2009 2009 2009 2009 2008 2008 2008
WORLD 792 963 44 8600 101 08 61 78 96
DEVELOPING REGIONS
AFRICA
North Africa
Algeria 639 07 993 285 43 2680 58 01 95 79 85
Egypt 578 05 951 38 1130 50 01 94 98 100
Libya 820 00 1050 239 27 4170 39 97
Morocco 439 08 881 872 56 1560 55 01 69 60 98
Tunisia 710 09 1030 507 71 2400 62 01 85 84 99
Sub-Saharan Africa
Angola 576 08 820 1269 26 2040 46 20 57 38 60
Benin 291 01 735 134 35 319 42 12 12 69 84
Botswana 844 12 1000 3014 89 6120 103 248 60 90 99
Burkina Faso 216 08 856 3663 46 381 64 12 11 72 95
Burundi 609 90 927 6009 83 198 131 33 46 71 83
Cameroon 630 02 856 728 37 611 56 53 47 51 92
Cape Verde 802 09 1030 828 59 1460 39 54 82 85
Central African Republic 421 05 687 1448 13 193 43 47 34 51 92
Chad 231 06 636 2488 32 418 70 34 9 44 67
Comoros 687 06 842 272 76 278 34 01 36 97 91
Congo 09 919 29 18 701 30 34 30 34 95
Cocircte drsquoIvoire 453 08 686 1191 46 553 51 34 23 68 93
Congo Dem Rep 549 768 156 95 23 80
Djibouti 09 820 573 84 845 70 25 56 52 98
Equatorial Guinea 898 10 825 40 06 7090 39 50
Eritrea 560 09 773 11356 20 101 21 08 14 57 74
Ethiopia 180 07 879 6642 55 147 43 12 26 98
Gabon 841 10 959 38 2660 35 52 33 41 95
Gambia 358 11 1020 322 20 256 60 20 67 86 96
Ghana 604 11 954 288 54 451 69 18 13 74 90
Guinea 281 07 772 1164 24 188 57 13 19 61 89
Guinea-Bissau 380 07 655 52 184 61 25 21 51 83
Kenya 835 11 954 436 70 332 43 63 31 52 83
Lesotho 953 12 1070 778 124 700 82 236 29 81 97
Liberia 545 04 719 141 28 294 132 15 17 51 79
Madagascar 616 53 969 1581 30 180 41 02 11 29 71
Malawi 670 18 1000 321 42 191 62 110 56 77 95
Mali 182 05 784 1633 44 384 56 10 36 44 81
Mauritania 503 13 1030 736 29 219 25 07 26 47 52
Mauritius 853 13 1010 245 32 3830 57 10 91 99 100
Mozambique 415 05 883 998 50 247 57 115 17 29 77
Namibia 881 16 1040 315 64 2580 60 131 33 88 99
Niger 151 08 753 5143 45 209 61 08 9 39 96
Nigeria 498 09 851 08 693 58 36 32 42 75
Rwanda 668 18 1000 2521 41 482 90 29 54 62 77
Senegal 387 11 955 2169 58 589 57 09 51 52 92
Seychelles 923 15 1030 340 50 3660 40 100
Sierra Leone 301 06 840 251 43 439 131 16 13 26 86
Somalia 09 535 04 07 23 9 67
Sudan 608 09 894 121 946 73 11 34 52 64
South Africa 870 12 994 328 54 4850 85 178 77 78 99
Swaziland 862 11 921 491 78 1560 63 259 55 61 92
Tanzania Utd Rep 669 15 961 409 68 253 51 56 24 45 80
Togo 444 04 753 130 46 289 59 32 12 41 87
Uganda 589 15 987 1339 32 425 82 65 48 64 91
Zambia 613 14 958 10 13 471 48 135 49 46 87
Zimbabwe 894 971 2143 52 143 44 72 99
157
TABLE 24 Education health and sanitation (continued)Literacyratefemale
Ratio of girls-to-boys Expendi-ture perstudent
Public expon
education
Health expenditure Prevalenceof HIV
Access to improved
out ofprimaryschool
in primand seceducation
share ofGDP percapita
share ofGDP
currentper capita
share ofGDP
ages15-49
sanitationfacilities
water source
ratio US$ rur urb
2009 2009 2009 2009 2009 2009 2009 2009 2008 2008 2008
ASIA
Central Asia
Kazakhstan 996 26 986 79 28 3300 45 01 97 90 99
Kyrgyzstan 990 11 1010 173 59 571 68 03 93 85 99
Tajikistan 996 01 906 218 35 380 53 02 94 61 94
Turkmenistan 994 43 771 23 98 97
Uzbekistan 991 08 987 74 622 52 01 100 81 98
East Asia
Brunei Darussalam 937 18 1010 37 7910 30
Cambodia 709 08 897 54 21 421 59 05 29 56 81
China 909 12 1050 1015 19 1770 46 01 55 82 98
Indonesia 891 04 977 397 28 554 24 02 52 71 89
Korea DPR 1000 100 100
Korea Republic of 00 972 528 42 11100 65 01 100 88 100
Lao PDR 632 09 872 100 23 358 41 02 53 51 72
Malaysia 903 10 1030 604 41 3360 48 05 96 99 100
Mongolia 979 15 1030 162 56 742 47 01 50 49 97
Myanmar 895 08 997 54 13 125 20 06 81 69 75
Philippines 958 14 1020 276 28 669 38 01 76 87 93
Singapore 920 116 30 15000 39 01 100 100
Thailand 915 09 1030 554 41 1680 43 13 96 98 99
Viet Nam 905 04 932 982 53 797 72 04 75 92 99
South Asia
Afghanistan 50 07 623 19 509 74 37 39 78
Bangladesh 510 21 1080 256 24 184 34 01 53 78 85
Bhutan 387 13 1000 387 48 980 55 02 65 88 99
India 508 05 922 777 31 448 42 03 31 84 96
Iran (Islamic Rep) 807 07 965 583 47 2690 55 02 98
Maldives 984 06 982 00 112 3310 80 01 98 86 99
Nepal 469 06 825 731 47 253 58 04 31 87 93
Pakistan 401 07 819 27 226 26 01 45 87 95
Sri Lanka 891 12 1040 30 836 40 01 91 88 98
West Asia
Armenia 994 17 1030 533 30 1290 47 01 90 93 98
Azerbaijan 992 10 1020 156 28 2850 58 01 45 71 88
Bahrain 902 03 1010 326 29 11100 45 100
Cyprus 969 05 1000 1352 41 60 100 100 100
Georgia 997 06 965 410 32 2560 101 01 95 96 100
Iraq 699 04 813 51 985 39 73 55 91
Jordan 889 14 1020 277 49 3360 93 98 91 98
Kuwait 918 08 1010 257 38 14200 33 100 99 99
Lebanon 860 09 1040 102 18 6630 81 01 100 100
Occupied PalestinianTerritory
Saudi Arabia 811 08 913 367 56 7140 50 97
Syrian Arab Republic 780 01 973 338 48 720 29 96 84 94
Turkey 853 07 929 547 31 5710 67 01 90 96 100
United Arab Emirates 915 06 998 270 12 15200 28 97 100 100
Yemen 447 06 657 52 640 56 52 57 72
LATIN AMERICA amp THECARIBBEAN
Argentina 977 22 1050 565 49 7300 95 05 90 80 98
Bahamas 14 1010 33 15600 72 31 100 98
Barbados 603 minus67 10400 68 14 100 100 100
Belize 703 44 1010 395 58 2170 49 23 90 100 99
Bolivia (Plur State) 868 12 988 282 63 848 48 02 25 67 96
Brazil 902 07 1030 650 51 7340 91 80 84 99
Chile 987 09 985 428 40 7870 82 04 96 75 99
Colombia 934 10 1050 580 48 3230 64 05 74 73 99
Costa Rica 963 12 1020 290 63 6680 105 03 95 91 100
158
TABLE 24 Education health and sanitation (continued)Literacyratefemale
Ratio of girls-to-boys Expendi-ture perstudent
Public expon
education
Health expenditure Prevalenceof HIV
Access to improved
out ofprimaryschool
in primand seceducation
share ofGDP percapita
share ofGDP
currentper capita
share ofGDP
ages15-49
sanitationfacilities
water source
ratio US$ rur urb
2009 2009 2009 2009 2009 2009 2009 2009 2008 2008 2008
Cuba 998 08 988 1553 136 7070 118 01 91 89 96
Dominica 15 1020 407 47 3610 64
Dominican Republic 883 11 965 147 23 2710 59 09 83 84 87
Ecuador 815 28 1030 92 10 2550 61 04 92 88 97
El Salvador 818 16 983 176 36 2290 63 08 87 76 94
French Guiana
Grenada 960 22 970 227 48 4470 74 97 97
Guatemala 695 04 938 166 32 1860 71 08 81 90 98
Guyana 06 997 447 61 1330 81 12 81 93 98
Haiti 446 10 946 15 396 61 19 17 55 71
Honduras 835 23 1070 36 1170 60 08 71 77 95
Jamaica 911 09 1000 850 58 2310 51 17 83 89 98
Mexico 921 17 1020 637 48 5150 65 03 85 87 96
Netherlands Antilles 964 1020
Nicaragua 779 12 1020 144 31 1050 96 02 52 68 98
Panama 930 08 1010 390 38 5910 83 09 69 83 97
Paraguay 935 10 995 530 40 1590 71 03 70 66 99
Peru 846 12 994 180 27 2010 46 04 68 61 90
St Kitts amp Nevis 15 1040 79 97 6340 60 96 99 99
St Lucia 10 994 368 45 4430 81 98 98
St Vincent amp Grenadines 01 977 455 66 3010 57
Suriname 938 09 1070 90 4290 76 10 84 81 97
Trinidad amp Tobago 983 05 1010 189 42 10700 57 15 92 93 98
Uruguay 986 08 1040 374 29 6980 75 05 100 100 100
Venezuela (Boliv Rep of) 949 11 1020 173 37 6860 60
OCEANIA
Fiji 10 1030 967 62 1300 34 01
French Polynesia 15 1090 98 100 100
New Caledonia 960
Papua New Guinea 565 08 835 65 367 31 09 45 33 87
Samoa 985 17 1050 120 58 2050 70 100
Solomon Islands 690 10 940 22 719 54
Tonga 991 06 999 1449 39 1610 62 96 100 100
Vanuatu 803 05 995 353 48 1060 40 52 79 96
DEVELOPED REGIONS
NORTH AMERICA
Bermuda 979 157 26
Canada 23 987 440 49 43800 109 02 100 99 100
United States of America 14 1000 682 55 74100 162 06 100 94 100
ASIA amp OCEANIA
Australia 14 973 509 45 38700 85 01 100 100 100
Israel 887 15 1010 611 59 19700 76 02 100 100 100
Japan 11 1000 647 35 33200 83 01 100 100 100
New Zealand 31 1030 675 61 26300 97 01 100 100
EUROPE
Albania 947 09 995 444 29 2650 69 98 98 96
Belarus 997 17 1010 150 45 2950 58 03 93 99 100
Bosnia amp Herzegovina 964 13 1020 4950 109 95 98 100
Croatia 981 12 1020 732 46 11200 78 01 99 97 100
European Union 1010 764 49 33700 103 02 98 100 100
Iceland 13 1020 771 74 31300 82 03 100 100 100
Macedonia FYR 956 13 983 238 35 3140 69 89 99 100
Montenegro 6170 93 92 96 100
Norway 13 990 895 68 76600 97 01 100 100 100
Republic of Moldova 980 10 1010 1286 96 1810 119 04 79 85 96
Russian Federation 994 12 980 142 39 4750 54 10 87 89 98
Serbia 09 1010 1105 48 4190 99 01 92 98 99
Switzerland 57 973 956 52 71400 113 04 100 100 100
Ukraine 996 11 988 251 53 1800 70 11 95 97 98
159
TABLE 25 Food aid receivedFood aid received
thousandtonnes
thousandtonnes
thousandtonnes
thousandtonnes
thousandtonnes
1990 1995 2000 2005 2010
WORLD 13172 10201 11345 8288 5682
DEVELOPING REGIONS 10922 9143 9462 8245 5682
AFRICA 5255 3562 4320 4656 3491
North Africa 2268 263 318 56 27
Algeria 10 27 33 42 24
Egypt 1606 207 41 14 3
Libya 0 0 0 0 0
Morocco 271 2 241 0 0
Tunisia 383 27 4 0 0
Sub-Saharan Africa 2986 3299 4002 4601 3464
Angola 124 220 296 57 4
Benin 15 21 12 15 19
Botswana 15 10 0 0 0
Burkina Faso 34 41 33 39 45
Burundi 3 103 11 73 34
Cameroon 3 7 4 14 14
Cape Verde 59 73 53 29 16
Central African Republic 3 1 3 5 10
Chad 26 21 23 74 111
Comoros 4 6 0 0 0
Congo 8 13 18 9 7
Cocircte drsquoIvoire 66 24 17 34 21
Congo Dem Rep 98 109 74 103 193
Djibouti 9 20 12 21 10
Equatorial Guinea 5 4 2 0 0
Eritrea 0 104 257 232 0
Ethiopia 864 636 1527 1122 1415
Gabon 0 0 1 0 0
Gambia 4 4 8 11 23
Ghana 66 97 101 66 7
Guinea 11 8 5 41 4
Guinea-Bissau 5 3 27 11 7
Kenya 90 80 291 155 258
Lesotho 42 34 6 44 7
Liberia 35 161 116 102 30
Madagascar 54 38 44 47 26
Malawi 219 236 36 153 38
Mali 39 20 12 41 25
Mauritania 45 45 17 92 39
Mauritius 11 1 0 0 0
Mozambique 423 386 185 117 80
Namibia 12 3 2 2 1
Niger 40 25 20 139 159
Nigeria 0 0 1 20 0
Rwanda 9 274 232 42 7
Senegal 63 21 54 30 41
Seychelles 1 0 0 0 0
Sierra Leone 11 34 28 39 24
Somalia 98 53 61 40 72
Sudan 230 82 182 931 476
South Africa 7 0 3 0 0
Swaziland 10 7 0 12 17
Tanzania Utd Rep 35 145 63 116 38
Togo 12 6 4 1 2
Uganda 47 77 87 293 80
Zambia 11 26 49 146 7
Zimbabwe 14 13 16 80 92
160
TABLE 25 Food aid received (continued)Food aid received
thousandtonnes
thousandtonnes
thousandtonnes
thousandtonnes
thousandtonnes
1990 1995 2000 2005 2010
ASIA 3357 4641 4314 2958 1775
Central Asia 0 432 195 239 75
Kazakhstan 0 1 0 0 0
Kyrgyzstan 0 150 60 166 50
Tajikistan 0 226 60 73 25
Turkmenistan 0 53 7 0 0
Uzbekistan 0 1 68 0 0
East Asia 530 952 2239 1663 232
Brunei Darussalam 0 0 0 0 0
Cambodia 25 91 62 24 17
China 78 128 90 49 0
Indonesia 56 19 429 197 0
Korea DPR 0 544 1264 1180 80
Korea Republic of 0 0 0 0 0
Lao PDR 0 27 5 19 20
Malaysia 0 0 0 0 0
Mongolia 0 12 46 55 0
Myanmar 0 4 10 16 31
Philippines 160 55 218 121 82
Singapore 0 0 0 0 0
Thailand 148 2 1 1 0
Viet Nam 62 70 82 0 0
South Asia 2288 1445 937 838 1247
Afghanistan 43 133 210 208 140
Bangladesh 1050 586 269 293 194
Bhutan 5 6 4 2 3
India 382 398 321 102 16
Iran (Islamic Rep) 26 13 3 2 5
Maldives 2 3 3 11 12
Nepal 8 38 53 54 53
Pakistan 462 119 20 30 763
Sri Lanka 310 148 55 136 60
West Asia 539 1812 943 218 222
Armenia 0 476 96 22 7
Azerbaijan 0 391 28 12 0
Bahrain 0 0 0 0 0
Cyprus 0 0 0 0 0
Georgia 0 598 71 20 1
Iraq 0 102 18 36 7
Jordan 261 122 401 3 0
Kuwait 0 0 0 0 0
Lebanon 43 11 42 12 0
Occupied PalestinianTerritory
26 48 57 83 90
Saudi Arabia 0 0 0 0 0
Syrian Arab Republic 38 45 35 10 35
Turkey 14 1 0 0 0
United Arab Emirates 0 0 0 0 0
Yemen 157 18 195 21 83
LATIN AMERICA amp THECARIBBEAN
2306 939 828 632 416
Argentina 0 0 0 0 0
Bahamas 0 0 0 0 0
Barbados 0 0 0 0 0
Belize 0 0 0 0 0
Bolivia (Plur State) 262 86 80 65 8
Brazil 29 1 0 0 0
Chile 8 0 0 0 0
Colombia 5 15 12 14 12
Costa Rica 7 3 0 0 0
161
TABLE 25 Food aid received (continued)Food aid received
thousandtonnes
thousandtonnes
thousandtonnes
thousandtonnes
thousandtonnes
1990 1995 2000 2005 2010
Cuba 3 6 24 7 0
Dominica 0 7 0 0 0
Dominican Republic 40 6 2 0 50
Ecuador 77 19 42 43 3
El Salvador 203 25 3 67 3
French Guiana 0 0 0 0 0
Grenada 0 0 0 0 0
Guatemala 185 70 137 69 70
Guyana 46 33 26 0 0
Haiti 108 168 164 137 266
Honduras 146 53 68 98 3
Jamaica 293 56 46 11 0
Mexico 280 46 2 0 0
Netherlands Antilles 0 0 0 0 0
Nicaragua 232 63 62 43 2
Panama 1 2 0 0 0
Paraguay 4 1 0 0 0
Peru 359 254 149 78 0
St Kitts amp Nevis 0 0 0 0 0
St Lucia 0 3 0 0 0
St Vincent amp Grenadines 0 0 0 0 0
Suriname 0 20 0 0 0
Trinidad amp Tobago 0 0 0 0 0
Uruguay 20 0 0 0 0
Venezuela (Boliv Rep of) 0 0 11 0 0
OCEANIA 3 0 0 0 0
Fiji 0 0 0 0 0
French Polynesia 0 0 0 0 0
New Caledonia 0 0 0 0 0
Papua New Guinea 0 0 0 0 0
Samoa 0 0 0 0 0
Solomon Islands 0 0 0 0 0
Tonga 0 0 0 0 0
Vanuatu 0 0 0 0 0
DEVELOPED REGIONS 2250 1058 1883 43 0
NORTH AMERICA 0 0 0 0 0
Bermuda 0 0 0 0 0
Canada 0 0 0 0 0
United States of America 0 0 0 0 0
ASIA amp OCEANIA 1 0 0 0 0
Australia 0 0 0 0 0
Israel 1 0 0 0 0
Japan 0 0 0 0 0
New Zealand 0 0 0 0 0
EUROPE 2249 1058 1883 43 0
Albania 0 10 18 6 0
Belarus 0 98 0 0 0
Bosnia amp Herzegovina 0 23 84 0 0
Croatia 0 14 0 0 0
European Union 2249 40 1 0 0
Iceland 0 0 0 0 0
Macedonia FYR 0 0 63 0 0
Montenegro 0 0 0 0 0
Norway 0 0 0 0 0
Republic of Moldova 0 244 14 10 0
Russian Federation 0 125 1403 26 0
Serbia 0 0 0 0 0
Switzerland 0 0 0 0 0
Ukraine 0 120 0 0 0
162
DEFINITIONS AND SOURCES
Definitions and sources
Countries in protracted crisesP2HUNFAOESARHSNPC
Page table 31 (p 86)
Protracted crises are those environments in which a sig-nificant proportion of the population is acutely vulnera-ble to death disease and disruption of livelihoods overa prolonged period of time The governance of these en-vironments is usually very weak with the state having alimited capacity to respond to and mitigate the threatsto the population or provide adequate levels of protec-tion
Source Trade and Markets Division
Owner FAO
Contribution in diets by typeP2HUNFAOESSDIETCPF
Page table 16 (p 135)
Dietary contribution refers to the amount of carbohy-dratesproteinsfats expressed in kilocalories (kcal) perday available for each individual in the total populationduring the reference period Caloric content is derived byapplying the appropriate food composition factors to thequantities of the commodities Per person supplies arederived from the total amount of food available for hu-man consumption by dividing total calories by total pop-ulation actually partaking of the food supplies during thereference period However per person figures representonly the average supply available for the population asa whole and do not necessarily indicate what is actuallyconsumed by individuals The actual food consumptionmay be lower than the quantity shown as food availabil-ity depending on the magnitude of wastage and lossesof food in the household eg during storage in prepa-ration and cooking as plate-waste or quantities fed todomestic animals and pets thrown or given away
Source Statistics Division
Owner FAO
Dietary Energy Supply per personP2HUNFAOESSDIETDES
Page table 16 (p 135) chart 37 (p 93) map 20 (p 92)
Dietary energy supply per person refers to the amountof food expressed in kilocalories (kcal) per day avail-able for each individual in the total population duringthe reference period Caloric content is derived by ap-plying the appropriate food composition factors to thequantities of the commodities Per person supplies arederived from the total amount of food available for hu-man consumption by dividing total calories by total pop-ulation actually partaking of the food supplies during thereference period However per person figures representonly the average supply available for the population asa whole and do not necessarily indicate what is actuallyconsumed by individuals The actual food consumptionmay be lower than the quantity shown as food availabil-ity depending on the magnitude of wastage and losses
of food in the household eg during storage in prepa-ration and cooking as plate-waste or quantities fed todomestic animals and pets thrown or given awaySource Statistics DivisionOwner FAO
Caloric contribution in diets by commodityP2HUNFAOESSDIETFDS
Page table 40 41 (p 95 95)Contribution of a food Group to total dietary energy sup-plySource Statistics DivisionOwner FAO
Percentage contribution in diets by commodityP2HUNFAOESSDIETFDSx
Page table 16 17 (p 135 138)Percentage contribution of a food group to total dietaryenergy supplySource Statistics DivisionOwner FAO
Depth of hungerP2HUNFAOESSUNMNTDEP
Page table 15 (p 132) chart 36 (p 91)The depth of food deprivation indicates how much food-deprived people fall short of minimum food needs interms of dietary energy It is measured as the differencebetween the minimum dietary energy and the averagedietary energy intake of the undernourished population(food-deprived) The depth of food deprivation is lowwhen it is less than 200 kilocalories per person per dayand high when it is higher than 300 kilocalories per per-son per day The greater the deficit the greater the sus-ceptibility for health risks related to undernutritionSource Statistics DivisionOwner FAO
Incidence of undernourishmentP2HUNFAOESSUNMNTNUM
Page table 15 (p 132) map 19 (p 91)Undernourishment refers to the condition of peoplewhose dietary energy consumption is continuously be-low a minimum dietary energy requirement for main-taining a healthy life and carrying out a light physicalactivity The incidence of undernourishment is the num-ber of people referring to those in this conditionSource Statistics DivisionOwner FAO
Global number of undernourishedP2HUNFAOESSUNMNTPNW
Page chart 33 35 (p 89 90)Undernourishment refers to the condition of peoplewhose dietary energy consumption is continuously be-low a minimum dietary energy requirement for main-taining a healthy life and carrying out a light physical
163
PART 2
activity The global incidence of undernourishment is thetotal number of people in the world referring to those inthis condition
Source Statistics Division
Owner FAO
Percentage of population undernourishedP2HUNFAOESSUNMNTPREV
Page table 15 (p 132) map 18 (p 88)
Undernourishment refers to the condition of peoplewhose dietary energy consumption is continuously be-low a minimum dietary energy requirement for main-taining a healthy life and carrying out a light physicalactivity The percentage of population undernourishedis the total number of people in each country referringto those in this condition divided by the population ofthat country
Source Statistics Division
Owner FAO
Regional percentage of undernourishedP2HUNFAOESSUNMNTPREVR
Page chart 34 (p 90)
Undernourishment refers to the condition of peoplewhose dietary energy consumption is continuously be-low a minimum dietary energy requirement for main-taining a healthy life and carrying out a light physicalactivity The regional percentage of population under-nourished is the total number of people in each regionreferring to those in this condition divided by the popu-lation of that region
Source Statistics Division
Owner FAO
Global affordability of foodP2HUNFAOFPVAFD
Page chart 54 (p 106)
FAO Food Price Index relative to GDP showing howmuchfood prices have risen relative to income from the baseperiod 2002-04 Higer (lower) index scores show greater(less) affordability
Source Statistics Division
Owner FAO
Food price inflationP2HUNFAOFPVFCPI
Page map 25 (p 104)
Annual change in the ILO food price indices The pricedata for the different items included in the computationof the index are normally weighted in order to take intoaccount the relative importance of each item with re-spect to total consumption expenditure In most coun-tries the indices are computed in a derived form suchas weighted arithmetic averages of price relatives fora selected number of representative items between theperiod under consideration and the base period using
one or other forms of Laspeyresrsquo formula The num-ber of items and the weights used to compute the in-dex are given according to expenditure group The termitem is used here to mean the smallest grouping ofgoods and services for which a specific weight is givenThe source(s) and the reference period of the weightsused for the index eg a household expenditure surveynational accounts etc If the reference period for theweights differs from the base period of the index theadjustments made to the weights to take account of theprice changes between the two periods are describedSee httplaborstailoorg for more informationSource LABORSTAOwner ILO
International food prices by food groupP2HUNFAOFPVFPI
Page chart 53 (p 106)The FAO Food Price Index is a measure of themonthly change in international prices of a bas-ket of food commodities It consists of the av-erage of five commodity group price indices (rep-resenting 55 quotations) weighted with the aver-age export shares of each of the groups for 2002-2004 See httpwwwfaoorgworldfoodsituationwfs-homefoodpricesindexen for more information on sub-index constructionSource Statistics DivisionOwner FAO
International food price volatility by food groupP2HUNFAOFPVFPV
Page chart 55 56 (p 107 107)Annualized historical volatility of the FAO Food Price In-dexSource Statistics DivisionOwner FAO
Food price volatility (annualized historical volatility)P2HUNFAOFPVFPVn
Page map 26 (p 108)Annualized historical volatility of the ILO food price in-dicesSource Statistics DivisionOwner FAO
FAO Global Consumption price volatilityP2HUNFAOFPVGCI
Page chart 52 57 (p 105 109)The FAO Global Food Consumption Price Index trackschanges in the cost of the global food basket as por-trayed by the latest FAO world food balance sheet Rep-resentative international prices for each of the commodi-ties or commodity groups appearing in the balance sheetare weighted by their contribution to total calorific in-takeSource Statistics DivisionOwner FAO
164
DEFINITIONS AND SOURCES
Dietary diversity in selected LIFDCs
P2HUNFAOFVDIETDIV
Page chart 39 (p 94)
The Herfindahl index H is calculated as H =sumN=1 S
2
where S is the consumption share of the starchy staple in diets and N is the number of staples consumed For asingle staple consumed the index would equate to oneand declines as the staple base becomes more diversi-fied
Source Statistics Division
Owner FAO
Starchy root consumption and DES
P2HUNFAOFVDIETRTDES
Page chart 38 (p 94)
Caloric equivalent of starchy roots available for con-sumption as a ratio of total dietary energy supply
Source Statistics Division
Owner FAO
Availability of dietary iron
P2HUNFAOMCNIRON
Page table 18 (p 141) chart 44 (p 98)
The dietary availability of iron is calculated by convert-ing the amount of food available for human consumptionas estimated by the FAO Food Balance Sheets in equiv-alent of iron derived from animal and vegetal productsHowever the actual food consumptionmay be lower thanthe quantity shown as food availability depending on themagnitude of wastage and losses of food in the house-hold eg during storage in preparation and cooking asplate-waste or quantities fed to domestic animals andpets thrown or given away
Source Statistics Division
Owner FAO
Food + energy import bills ( GDP)
P2HUNFAOTFSFDFL
Page table 20 (p 147)
The annual value of food imported under SITC sections0 + 22+ 4 plus fuels under SITC section 3 expressed asa ratio of GDP
Source Statistics Division (FAOSTAT) and UNCTADSTAT
Owner FAO UNCTAD
Food import bills
P2HUNFAOTFSFIB
Page table 20 (p 147) chart 49 50 51 (p 103 103103)
The annual value of food imported under SITC sections0 + 22+ 4 expressed in current US$
Source Statistics Division (FAOSTAT) and UNCTADSTAT
Owner FAO UNCTAD
Food + energy import bills per capita
P2HUNFAOTFSFUEL
Page chart 50 51 (p 103 103)
The annual value of food imported under SITC sections0 + 22+ 4 plus fuels under SITC section 3 expressed asa ratio of population
Source Statistics Division (FAOSTAT) and UNCTADSTAT
Owner FAO UNCTAD
Index of variability of food production
P2HUNFAOTFSQPVAR
Page chart 46 (p 102)
Rolling ten-year window of the coefficient of variation ofper capita production index
Source Statistics Division
Owner FAO
Food self-sufficiency (calories)
P2HUNFAOTFSSSCAL
Page table 19 (p 144) chart 45 (p 101) map 24 (p100)
The self-sufficiency ratio (SSR) is defined as SSR = pro-duction x 100(production + imports - exports) The SSRcan be calculated for individual commodities groups ofcommodities of similar nutritional values and after ap-propriate conversion of the commodity equations alsofor the aggregate of all commodities In the context offood security the SSR is often taken to indicate the ex-tent to which a country relies on its own production re-sources ie the higher the ratio the greater the self-sufficiency While the SSR can be the appropriate toolwhen assessing the supply situation for individual com-modities a certain degree of caution should be observedwhen looking at the overall food situation In the casehowever where a large part of a countryrsquos production ofone commodity eg other cereals is exported the SSRmay be very high but the country may still have to relyheavily on imports of food commodities to feed the pop-ulation The self-sufficiency rate (as defined above) can-not be the complement to 100 of the import dependencyrate or vice-versa
Source Statistics Division
Owner FAO
Months of cereal self-provisioning capacity
P2HUNFAOTFSSTU
Page chart 47 48 (p 102 103)
Stocks-to-utilization ratios for cereals (wheat rice andcoarse grains) where stocks refer to the carry-over ofthe preceding national crop season The ratio is thenmultiplied by 12 to calculate the number of months ofself-provisioning capacity in a given year
Source Trade and Markets Division
Owner FAO
165
PART 2
Persons affected by natural disastersP2HUNODFAEMDATRHSPPND
Page table 14 (p 129) chart 29 (p 85) map 16 (p 84)People requiring immediate assistance during a periodof emergency ie requiring basic survival needs suchas food water shelter sanitation and immediate med-ical assistance Appearance of a significant number ofcases of an infectious disease introduced in a region ora population that is usually free from that disease Seewwwemdatnet (Universiteacute catholique de Louvain Brus-sels Belgium)Source International Disaster Database EM-DATOwner OFDA and CRED
Total affected by natural disastersP2HUNODFAEMDATRHSPPNDT
Page chart 30 (p 86)Sum of (i) injured people suffering from physical injuriestrauma or an illness requiring medical treatment as a di-rect result of a disaster (ii) homeless people needing im-mediate assistance for shelter and (iii) affected peoplerequiring immediate assistance during a period of emer-gency it can also include displaced or evacuated peopleSee wwwemdatnet (Universiteacute catholique de LouvainBrussels Belgium)Source International Disaster Database EM-DATOwner OFDA and CRED
Multidimensional Poverty IndexP2HUNUNDPHDRMPI
Page table 21 (p 150)An international measure of poverty for 109 developingcountries the MPI complements income-based povertymeasures by reflecting the multiple deprivations thatpeople face at the same time The MPI identifies de-privations across health education and living standardsand shows the number of people who are multidimen-sionally poor and the deprivations that they face at thehousehold levelSource Alkire S Roche JM Santos ME and Seth S(November 2011) ophiqehoxacukOwner OPHI
Gender Inequality IndexP2HUNUNDPHDRPOVGEI
Page table 22 (p 153) map 29 (p 113)The Gender Inequality Index is a composite measure re-flecting inequality in achievements between women andmen in three dimensions reproductive health empow-erment and the labour market It varies between zero(when women and men fare equally) and one (when menor women fare poorly compared to the other in all di-mensions) The health dimension is measured by twoindicators maternal mortality ratio and the adolescentfertility rate The empowerment dimension is also mea-sured by two indicators the share of parliamentary seatsheld by each sex and by secondary and higher educationattainment levels The labour dimension is measured by
womenrsquos participation in the work force The Gender In-equality Index is designed to reveal the extent to whichnational human development achievements are erodedby gender inequality and to provide empirical founda-tions for policy analysis and advocacy effortsSource Human Development Report 2010Owner UNDP
Human Development IndexP2HUNUNDPHDRPOVHDI
Page table 22 (p 153)The HDI represents a national average of human de-velopment achievements in the three basic dimensionsmaking up the HDI health education and income Likeall averages it conceals disparities in human develop-ment across the population within the same countryTwo countries with different distributions of achieve-ments can have the same average HDI value The IHDItakes into account not only the average achievements ofa country on health education and income but also howthose achievements are distributed among its citizens bydiscounting each dimensionrsquos average value accordingto its level of inequalitySource Human Development Report 2010Owner UNDP
Human Development Index (inequality adjusted)P2HUNUNDPHDRPOVHDIi
Page table 22 (p 153) chart 59 (p 112)The Human Development Index (HDI) is a summary mea-sure of human development It measures the averageachievements in a country in three basic dimensionsof human development a long and healthy life ac-cess to knowledge and a decent standard of living TheInequality-adjusted Human Development Index (IHDI)adjusts the Human Development Index (HDI) for inequal-ity in distribution of each dimension across the popula-tion The IHDI accounts for inequalities in HDI dimen-sions by discounting each dimensionrsquos average valueaccording to its level of inequality The IHDI equals theHDI when there is no inequality across people but is lessthan the HDI as inequality rises In this sense the IHDI isthe actual level of human development (accounting forthis inequality) while the HDI can be viewed as an in-dex of potential human development (or the maximumlevel of HDI) that could be achieved if there was no in-equality The loss in potential human development dueto inequality is given by the difference between the HDIand the IHDI and can be expressed as a percentageSource Human Development Report 2010Owner UNDP
Population of concernP2HUNUNHCRGTRHSTPC
Page table 13 (p 126) map 17 (p 87)Refugees are individuals recognized under the 1951Convention relating to the Status of Refugees and alsopeople in a refugee-like situation such as those who
166
DEFINITIONS AND SOURCES
are outside their country or territory of origin and whoface protection risks similar to those of refugees butfor whom refugee status has for practical or other rea-sons not been ascertained Internally Displaced Persons(IDPs) are people or groups of individuals who have beenforced to leave their homes or places of habitual resi-dence in particular as a result of or in order to avoidthe effects of armed conflict situations of generalized vi-olence violations of human rights or natural- or human-made disasters and who have not crossed an interna-tional border Others include Asylum-seekers (personswho have applied for asylum or refugee status but whohave not yet received a final decision on their applica-tion) Returned IDPs and refugees Stateless Persons (in-dividuals not considered as nationals by any State underrelevant national laws) and other groups of concern towhom UNHCR has extended its protection andor assis-tance services based on humanitarian or other specialgrounds
Source Statistical Online Population Database
Owner UNHCR
Total population of concern
P2HUNUNHCRGTRHSTPCT
Page chart 32 (p 87)
Total population of concern is the sum of various groupsof people including refugees asylum-seekers internallydisplaced persons (IDPs) protectedassisted by UNHCRstateless persons and returnees (returned refugees andIDPs)
Source Statistical Online Population Database
Owner UNHCR
Average governance
P2HUNWBKPOVGOV
Page table 23 (p 156) chart 60 (p 115) map 30 (p114)
The Worldwide Governance Indicators project constructsaggregate indicators of six broad dimensions of gover-nance (i) Voice and Accountability (ii) Political Stabil-ity and Absence of ViolenceTerrorism (iii) GovernmentEffectiveness (iv) Regulatory Quality (v) Rule of Law(vi) Control of Corruption The six aggregate indicatorsare based on 30 underlying data sources reporting theperceptions of governance of a large number of surveyrespondents and expert assessments worldwide De-tails on the underlying data sources the aggregationmethod and the interpretation of the indicators can befound in the WGI methodology paper Daniel KaufmannAart Kraay and Massimo Mastruzzi (2010) The World-wide Governance Indicators A Summary of Methodol-ogy Data and Analytical Issues World Bank Policy Re-search Working Paper No 5430 httppapersssrncomsol3paperscfmabstract_id=1682130
Source World Bank
Owner Worldwide Governance Indicators (WGI) project
Ratio of girls-to-boys out of primary school
P2HUNWBKWDIEDUCOSR
Page table 24 (p 159)
Children out of school are the number of primary-school-age children not enrolled in primary or secondary school
Source World Bank (WDI)
Owner UNESCO
Public spending on education total ( of GDP)
P2HUNWBKWDIEDUEXPP
Page table 24 (p 159)
Public expenditure on education consists of current andcapital public expenditure on education includes gov-ernment spending on educational institutions (both pub-lic and private) education administration as well assubsidies for private entities (studentshouseholds andother privates entities)
Source World Bank (WDI)
Owner UNESCO
Expenditure per student
P2HUNWBKWDIEDUEXPS
Page table 24 (p 159)
Public expenditure per student is the public currentspending on education divided by the total number ofstudents by level as a percentage of GDP per capitaPublic expenditure (current and capital) includes govern-ment spending on educational institutions (both publicand private) education administration as well as subsi-dies for private entities (studentshouseholds and otherprivates entities)
Source World Bank (WDI)
Owner UNESCO
Literacy rate adult female ( of females ages 15 andabove)
P2HUNWBKWDIEDUFILT
Page table 24 (p 159) map 31 (p 116)
Adult literacy rate is the percentage of people ages 15and above who can with understanding read and writea short simple statement on their everyday life
Source World Bank (WDI)
Owner UNESCO
Ratio of girls to boys in primary and secondary education()
P2HUNWBKWDIEDUGEN
Page table 24 (p 159) chart 61 (p 117)
Ratio of girls to boys in primary and secondary educationis the ratio of the female to male gross enrolment ratesin primary and secondary school
Source World Bank (WDI)
Owner UNESCO
167
PART 2
Health expenditure per capita (current US$)P2HUNWBKWDIHAEHEPCP
Page table 24 (p 159) map 32 (p 118)
Total health expenditure is the sum of public and pri-vate health expenditures as a ratio of total populationIt covers the provision of health services (preventive andcurative) family planning activities nutrition activitiesand emergency aid designated for health but does notinclude provision of water and sanitation Data are incurrent US dollars
Source World Bank (WDI)
Owner WHO
Health expenditure total ( of GDP)P2HUNWBKWDIHAEHETOT
Page table 24 (p 159) chart 62 (p 119)
Total health expenditure is the sum of public and privatehealth expenditure It covers the provision of health ser-vices (preventive and curative) family planning activi-ties nutrition activities and emergency aid designatedfor health but does not include provision of water andsanitation
Source World Bank (WDI)
Owner WHO
Prevalence of HIV total ( of population ages 15-49)P2HUNWBKWDIHAEHIVPREV
Page table 24 (p 159)
Prevalence of HIV refers to the percentage of people ages15-49 who are infected with HIV
Source World Bank (WDI)
Owner UNAIDS and WHO
Improved sanitation facilities ( of population with ac-cess)P2HUNWBKWDIHAESANIMPS
Page table 24 (p 159) chart 63 (p 121)
Access to improved sanitation facilities refers to the per-centage of the population with at least adequate accessto excreta disposal facilities that can effectively preventhuman animal and insect contact with excreta Im-proved facilities range from simple but protected pit la-trines to flush toilets with a sewerage connection Tobe effective facilities must be correctly constructed andproperly maintained
Source World Bank (WDI)
Owner WHO and UNCF
Improved water source rural ( of rural population withaccess)P2HUNWBKWDIHAEWATIMPRU
Page table 24 (p 159) map 33 (p 120)
Access to an improved water source refers to the percent-age of the population with reasonable access to an ad-equate amount of water from an improved source suchas a household connection public standpipe borehole
protected well or spring and rainwater collection Unim-proved sources include vendors tanker trucks and un-protected wells and springs Reasonable access is de-fined as the availability of at least 20 litres a person aday from a source within one kilometre of the dwellingSource World Bank (WDI)Owner WHO and UNCF
Improved water source urban ( of urban populationwith access)P2HUNWBKWDIHAEWATIMPWU
Page table 24 (p 159)Access to an improved water source refers to the percent-age of the population with reasonable access to an ad-equate amount of water from an improved source suchas a household connection public standpipe boreholeprotected well or spring and rainwater collection Unim-proved sources include vendors tanker trucks and un-protected wells and springs Reasonable access is de-fined as the availability of at least 20 litres a person aday from a source within one kilometre of the dwellingSource World Bank (WDI)Owner WHO and UNCF
Poverty headcount ratio at $125 a day (PPP) ( of re-gional population)P2HUNWBKWDIPOVAGG
Page chart 58 (p 111)Data are from PovcalNet the on-line tool for povertymeasurement developed by the Development ResearchGroup of the World Bank See httpiresearchworldbankorgPovcalNetpovDuplichtmlSource PovcalNetOwner World Bank
Gini-index of income distributionP2HUNWBKWDIPOVGINI
Page table 22 (p 153) map 28 (p 113)Gini index measures the extent to which the distribu-tion of income among individuals or households withinan economy deviates from a perfectly equal distributionA Lorenz curve plots the cumulative percentages of totalincome received against the cumulative number of recip-ients starting with the poorest individual or householdThe Gini index measures the area between the Lorenzcurve and a hypothetical line of absolute equality ex-pressed as a percentage of the maximum area under theline Thus a Gini index of 0 represents perfect equalitywhile an index of 100 implies perfect inequalitySource World Bank (WDI)Owner World Bank
Poverty headcount ratio at $125 a day (PPP) ( of pop-ulation)P2HUNWBKWDIPOVH125
Page table 21 (p 150)Population below US$125 a day is the percentage of thepopulation living on less than US$125 a day at 2005
168
DEFINITIONS AND SOURCES
international prices As a result of revisions in PPP ex-change rates poverty rates for individual countries can-not be compared with poverty rates reported in earliereditionsSource World Bank (WDI)Owner World Bank
Income share held by highest 20P2HUNWBKWDIPOVH20
Page table 22 (p 153)Percentage share of income or consumption is the sharethat accrues to subgroups of population indicated bydeciles or quintiles Percentage shares by quintile maynot sum to 100 because of roundingSource World Bank (WDI)Owner World Bank
Poverty headcount ratio at $2 a day (PPP) ( of popula-tion)P2HUNWBKWDIPOVH200
Page table 21 (p 150)Population below US$2 a day is the percentage of thepopulation living on less than US$200 a day at 2005international prices As a result of revisions in PPP ex-change rates poverty rates for individual countries can-not be compared with poverty rates reported in earliereditionsSource World Bank (WDI)Owner World Bank
Poverty headcount ratio at national poverty line ( ofpopulation)P2HUNWBKWDIPOVHNPL
Page table 21 (p 150)National poverty rate is the percentage of the popula-tion living below the national poverty line National es-timates are based on population-weighted subgroup es-timates from household surveysSource World Bank (WDI)Owner World Bank
Poverty headcount ratio at rural poverty line ( of ruralpopulation)P2HUNWBKWDIPOVHRPL
Page table 21 (p 150)Rural poverty rate is the percentage of the rural popula-tion living below the national rural poverty lineSource World Bank (WDI)Owner World Bank
Income share held by lowest 20P2HUNWBKWDIPOVL20
Page table 22 (p 153)Percentage share of income or consumption is the sharethat accrues to subgroups of population indicated bydeciles or quintiles Percentage shares by quintile maynot sum to 100 because of roundingSource World Bank (WDI)Owner World Bank
Poverty gap at $125 a day (PPP) ()P2HUNWBKWDIPOVP125
Page table 21 (p 150) map 27 (p 110)Poverty gap is the mean shortfall from the poverty line(counting the nonpoor as having zero shortfall) ex-pressed as a percentage of the poverty line This mea-sure reflects the depth of poverty as well as its incidenceSource World Bank (WDI)Owner World Bank
Poverty gap at $2 a day (PPP) ()P2HUNWBKWDIPOVP200
Page table 21 (p 150)Poverty gap is the mean shortfall from the poverty line(counting the nonpoor as having zero shortfall) ex-pressed as a percentage of the poverty line This mea-sure reflects the depth of poverty as well as its incidenceSource World Bank (WDI)Owner World Bank
Poverty gap at national poverty line ()P2HUNWBKWDIPOVPNPL
Page table 21 (p 150)Poverty gap at national poverty line is the mean short-fall from the poverty line (counting the nonpoor as hav-ing zero shortfall) as a percentage of the poverty lineThis measure reflects the depth of poverty as well as itsincidenceSource World Bank (WDI)Owner World Bank
Poverty gap at rural poverty line ()P2HUNWBKWDIPOVPRPL
Page table 21 (p 150)Poverty gap at rural poverty line is the mean shortfallfrom the poverty line (counting the nonpoor as hav-ing zero shortfall) as a percentage of the national ruralpoverty line This measure reflects the depth of povertyas well as its incidenceSource World Bank (WDI)Owner World Bank
Food aid receivedP2HUNWFPFAISFDAID
Page table 25 (p 162) chart 64 (p 123) map 34 (p122)Quantity of food aid that reaches the recipient coun-try during a given period Quantities exported in GrainEquivalent The latter is a unit of measurement usedas alternative to Actual Ton for cereal-derived productsTo convert a product into grain equivalent a commodityspecific conversion factor is used For example if the fac-tor to convert wheat flour into wheat is 137 a tonne ofwheat flour corresponds to 0730 tons of wheat (1137)Source Food Aid Information SystemOwner WFP
169
PART 2
Percentage of adults with low body mass index (BMI)P2HUNWHOGHOADLTLBMI
Page table 18 (p 141)The indicator of weight adequacy in relation to height ofolder children adolescents and adults It is calculated asweight (kilograms) divided by height (metres) squaredThe acceptable range for adults is 185 to 249 and forchildren it varies with ageSource Global Health ObservatoryOwner WHO
Percentage of female adults with low body mass index(BMI)P2HUNWHOGHOADLTLBMIF
Page table 18 (p 141) map 22 (p 99)The indicator of weight adequacy in relation to height ofolder female children adolescents and adults It is cal-culated as weight (kilograms) divided by height (metres)squared The acceptable range for adults is 185 to 249 and for children it varies with ageSource Global Health ObservatoryOwner WHO
Percentage of adults who are obese by genderP2HUNWHOGHOADLTOBS
Page table 18 (p 141)Percentage of male and female defined population witha body mass index (BMI) of 25 kgm2 or higherSource Global Health ObservatoryOwner WHO
Percentage of adults who are obeseP2HUNWHOGHOADLTOBSx
Page map 23 (p 99)Percentage of adult defined population with a bodymassindex (BMI) of 25 kgm2 or higherSource Global Health ObservatoryOwner WHO
Percentage of children under 5 who are stuntedP2HUNWHOGHOCHLDSTNT
Page table 18 (p 141) chart 43 (p 98)Percentage of stunting (height-for-age less than -2 stan-dard deviations of the WHO Child Growth Standards me-dian) among children aged 0-5 yearsSource Global Health ObservatoryOwner WHO
Percentage of children under 5 who are underweightP2HUNWHOGHOCHLDUW
Page table 18 (p 141) chart 42 (p 97) map 21 (p 96)Percentage of underweight (weight-for-age less than -2standard deviations of the WHO Child Growth Standardsmedian) among children aged 0-5 yearsSource Global Health ObservatoryOwner WHO
Percentage of children under 5 who are wastedP2HUNWHOGHOCHLDWSTD
Page table 18 (p 141) chart 43 (p 98)Percentage of wasting (weight-for-height less than -2standard deviations of the WHO Child Growth Standardsmedian) among children aged 0-5 yearsSource Global Health ObservatoryOwner WHO
Percentage of newborns with low birth weightP2HUNWHOGHONEWLWB
Page table 18 (p 141)Low-birthweight babies are newborns weighing lessthan 2500 grams with the measurement taken withinthe first hours of life before significant postnatal weightloss has occurredSource Global Health ObservatoryOwner WHO
170
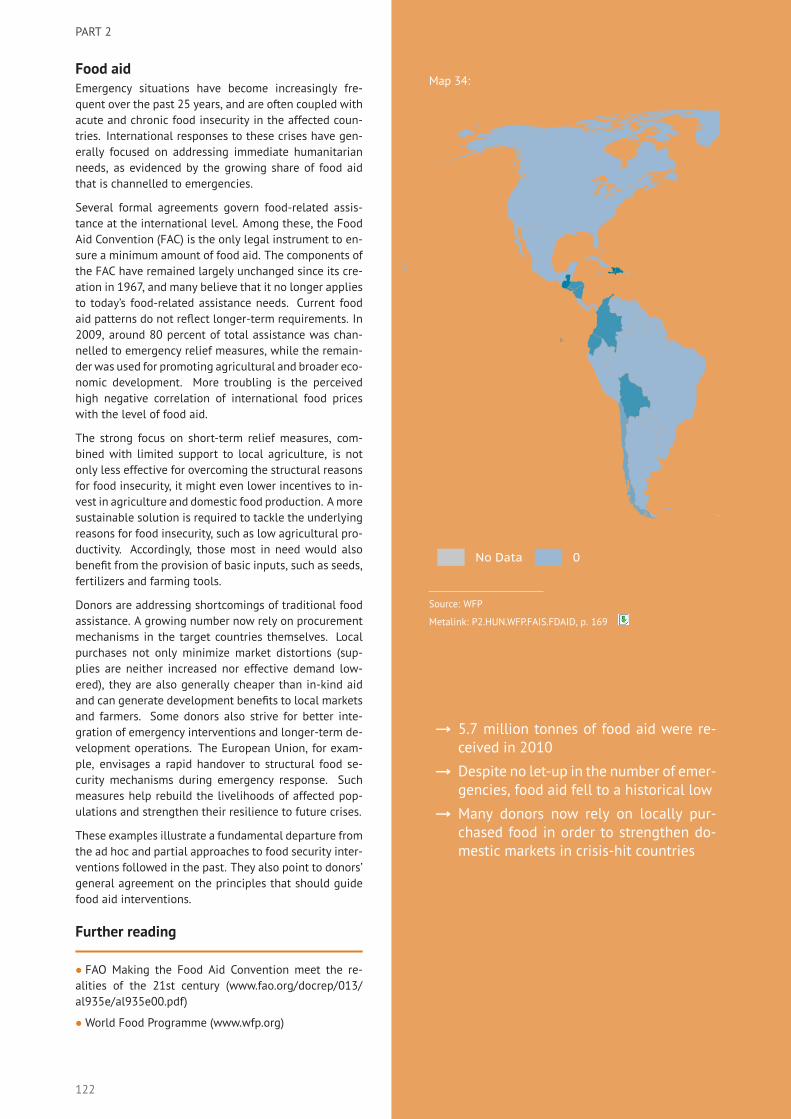
PART 2
Food aidEmergency situations have become increasingly fre-quent over the past 25 years and are often coupled withacute and chronic food insecurity in the affected coun-tries International responses to these crises have gen-erally focused on addressing immediate humanitarianneeds as evidenced by the growing share of food aidthat is channelled to emergencies
Several formal agreements govern food-related assis-tance at the international level Among these the FoodAid Convention (FAC) is the only legal instrument to en-sure a minimum amount of food aid The components ofthe FAC have remained largely unchanged since its cre-ation in 1967 and many believe that it no longer appliesto todayrsquos food-related assistance needs Current foodaid patterns do not reflect longer-term requirements In2009 around 80 percent of total assistance was chan-nelled to emergency relief measures while the remain-der was used for promoting agricultural and broader eco-nomic development More troubling is the perceivedhigh negative correlation of international food priceswith the level of food aid
The strong focus on short-term relief measures com-bined with limited support to local agriculture is notonly less effective for overcoming the structural reasonsfor food insecurity it might even lower incentives to in-vest in agriculture and domestic food production Amoresustainable solution is required to tackle the underlyingreasons for food insecurity such as low agricultural pro-ductivity Accordingly those most in need would alsobenefit from the provision of basic inputs such as seedsfertilizers and farming tools
Donors are addressing shortcomings of traditional foodassistance A growing number now rely on procurementmechanisms in the target countries themselves Localpurchases not only minimize market distortions (sup-plies are neither increased nor effective demand low-ered) they are also generally cheaper than in-kind aidand can generate development benefits to local marketsand farmers Some donors also strive for better inte-gration of emergency interventions and longer-term de-velopment operations The European Union for exam-ple envisages a rapid handover to structural food se-curity mechanisms during emergency response Suchmeasures help rebuild the livelihoods of affected pop-ulations and strengthen their resilience to future crises
These examples illustrate a fundamental departure fromthe ad hoc and partial approaches to food security inter-ventions followed in the past They also point to donorsrsquogeneral agreement on the principles that should guidefood aid interventions
Further reading
bull FAO Making the Food Aid Convention meet the re-alities of the 21st century (wwwfaoorgdocrep013al935eal935e00pdf)
bull World Food Programme (wwwwfporg)
Map 34
No Data 0 0001 minus 1 1 minus 50 50 minus 100 gt 100
Food aid received grain equivalent (thousand tonnes 2010)
Source WFP
Metalink P2HUNWFPFAISFDAID p 169
rarr 57 million tonnes of food aid were re-ceived in 2010
rarr Despite no let-up in the number of emer-gencies food aid fell to a historical low
rarr Many donors now rely on locally pur-chased food in order to strengthen do-mestic markets in crisis-hit countries
122
FOOD AID
No Data 0 0001 minus 1 1 minus 50 50 minus 100 gt 100
Food aid received grain equivalent (thousand tonnes 2010)
Chart 64 Food aid flows are in long-term decline and have fallen further at a time whenfood prices have spiked
Food aid received (1988-2010)
Thousandtonnes
6000
8000
10000
12000
14000
16000
1990 1995 2000 2005 2010
Source WFP
Metalink P2HUNWFPFAISFDAID p 169
123
TABLE 13 Population at risk UNHCR population of concernUNHCR population of concern
total totalrefugees
internallydisplacedpersons
others andstatelesspersons
total totalrefugees
internallydisplacedpersons
others andstatelesspersons
thousands thousands thousands thousands thousands thousands thousands thousands
2009 2009 2009 2009 2010 2010 2010 2010
WORLD 29233 10174 15628 3431 29986 10350 14456 5180
DEVELOPING REGIONS 28139 9642 15207 3290 28931 9845 14058 5027
AFRICA 10636 2805 6469 1362 10587 2947 6154 1486
North Africa 143 138 0 5 142 137 0 5
Algeria 10 8 0 2 8 7 0 2
Egypt 9 7 0 2 9 7 0 2
Libya 3 2 0 1 3 2 0 1
Morocco 3 2 0 1 3 2 0 1
Tunisia 3 2 0 1 3 2 0 1
Sub-Saharan Africa 10493 2667 6469 1357 10445 2810 6154 1481
Angola 159 141 0 18 136 135 0 1
Benin 1 0 0 0 1 0 0 0
Botswana 0 0 0 0 0 0 0 0
Burkina Faso 1 1 0 0 2 1 0 1
Burundi 231 94 100 37 254 84 157 12
Cameroon 17 15 0 2 17 15 0 2
Cape Verde 0 0 0 0 0 0 0 0
Central African Republic 357 160 197 1 359 165 193 2
Chad 250 55 171 25 237 54 131 53
Comoros 0 0 0 0 0 0 0 0
Congo 24 21 0 3 24 21 0 3
Cocircte drsquoIvoire 714 23 519 172 585 42 515 29
Congo Dem Rep 2663 456 2053 154 2719 477 1721 520
Djibouti 1 1 0 0 1 1 0 0
Equatorial Guinea 0 0 0 0 0 0 0 0
Eritrea 224 209 0 14 236 222 0 14
Ethiopia 112 63 0 49 118 69 0 49
Gabon 0 0 0 0 0 0 0 0
Gambia 5 2 0 3 3 2 0 1
Ghana 16 15 0 1 22 20 0 2
Guinea 14 11 0 3 15 12 0 3
Guinea-Bissau 1 1 0 0 1 1 0 0
Kenya 417 10 399 8 311 9 300 2
Lesotho 0 0 0 0 0 0 0 0
Liberia 78 72 0 6 73 70 0 3
Madagascar 0 0 0 0 0 0 0 0
Malawi 0 0 0 0 0 0 0 0
Mali 4 3 0 1 4 4 0 0
Mauritania 52 39 0 13 40 38 0 2
Mauritius 0 0 0 0 0 0 0 0
Mozambique 0 0 0 0 0 0 0 0
Namibia 1 1 0 0 1 1 0 0
Niger 1 1 0 0 1 1 0 0
Nigeria 25 16 0 10 28 16 0 12
Rwanda 155 129 0 25 136 115 0 21
Senegal 17 16 0 1 18 16 0 2
Seychelles 0 0 0 0 0 0 0 0
Sierra Leone 19 15 0 3 15 11 0 3
Somalia 2249 678 1550 21 2257 770 1464 23
Sudan 1619 368 1034 217 2185 387 1548 250
South Africa 1 0 0 0 1 0 0 0
Swaziland 0 0 0 0 0 0 0 0
Tanzania Utd Rep 156 1 0 155 164 1 0 162
Togo 20 18 0 1 19 18 0 1
Uganda 863 8 446 409 436 6 126 304
Zambia 0 0 0 0 0 0 0 0
Zimbabwe 24 22 0 1 25 24 0 1
124
TABLE 13 Population at risk UNHCR population of concern (continued)UNHCR population of concern
total totalrefugees
internallydisplacedpersons
others andstatelesspersons
total totalrefugees
internallydisplacedpersons
others andstatelesspersons
thousands thousands thousands thousands thousands thousands thousands thousands
2009 2009 2009 2009 2010 2010 2010 2010
ASIA 13602 6372 5435 1796 14103 6425 4232 3446
Central Asia 17 14 0 3 301 17 60 224
Kazakhstan 4 4 0 1 4 4 0 1
Kyrgyzstan 3 3 0 0 284 3 60 222
Tajikistan 1 1 0 0 1 1 0 0
Turkmenistan 1 1 0 0 1 1 0 0
Uzbekistan 8 7 0 2 10 9 0 2
East Asia 1153 975 67 110 1303 986 202 115
Brunei Darussalam 0 0 0 0 0 0 0 0
Cambodia 17 17 0 0 16 16 0 0
China 199 181 0 18 192 185 0 8
Indonesia 21 18 0 2 17 17 0 0
Korea DPR 1 1 0 0 1 1 0 0
Korea Republic of 1 1 0 0 1 1 0 0
Lao PDR 9 8 0 0 8 8 0 0
Malaysia 62 1 0 61 1 1 0 0
Mongolia 4 1 0 2 4 2 0 2
Myanmar 497 407 67 23 500 416 62 22
Philippines 2 1 0 1 221 1 140 81
Singapore 0 0 0 0 0 0 0 0
Thailand 1 1 0 0 1 0 0 0
Viet Nam 341 339 0 1 340 339 0 1
South Asia 7225 3265 2627 1334 7400 3413 1578 2409
Afghanistan 3279 2887 297 95 4404 3055 352 998
Bangladesh 12 10 0 2 17 10 0 7
Bhutan 90 89 0 1 76 75 0 1
India 24 20 0 5 22 18 0 4
Iran (Islamic Rep) 87 73 0 14 85 69 0 16
Maldives 0 0 0 0 0 0 0 0
Nepal 7 5 0 2 7 6 0 1
Pakistan 3041 35 1895 1111 2199 40 952 1207
Sri Lanka 684 146 435 104 590 141 274 175
West Asia 5206 2117 2741 349 5100 2010 2393 698
Armenia 104 18 0 86 103 18 0 85
Azerbaijan 606 17 586 3 612 17 593 2
Bahrain 0 0 0 0 0 0 0 0
Cyprus 0 0 0 0 0 0 0 0
Georgia 378 15 353 10 378 11 236 131
Iraq 3565 1785 1552 228 3387 1684 1344 360
Jordan 3 2 0 1 3 2 0 1
Kuwait 1 1 0 0 1 1 0 0
Lebanon 18 16 0 2 17 16 0 2
Occupied PalestinianTerritory
98 95 0 3 97 93 0 3
Saudi Arabia 1 1 0 0 1 1 0 0
Syrian Arab Republic 23 18 0 6 28 18 0 10
Turkey 156 146 0 10 155 147 0 8
United Arab Emirates 0 0 0 0 0 0 0 0
Yemen 253 2 250 1 318 2 221 95
LATIN AMERICA amp THECARIBBEAN
3898 463 3304 132 4238 471 3672 95
Argentina 1 1 0 0 1 1 0 0
Bahamas 0 0 0 0 0 0 0 0
Barbados 0 0 0 0 0 0 0 0
Belize 0 0 0 0 0 0 0 0
Bolivia (Plur State) 1 1 0 0 1 1 0 0
Brazil 1 1 0 0 1 1 0 0
Chile 1 1 0 0 1 1 0 0
Colombia 3758 390 3304 64 4128 396 3672 60
Costa Rica 0 0 0 0 0 0 0 0
125
TABLE 13 Population at risk UNHCR population of concern (continued)UNHCR population of concern
total totalrefugees
internallydisplacedpersons
others andstatelesspersons
total totalrefugees
internallydisplacedpersons
others andstatelesspersons
thousands thousands thousands thousands thousands thousands thousands thousands
2009 2009 2009 2009 2010 2010 2010 2010
Cuba 10 8 0 2 12 7 0 4
Dominica 0 0 0 0 0 0 0 0
Dominican Republic 1 0 0 0 1 0 0 0
Ecuador 1 1 0 0 1 1 0 0
El Salvador 15 5 0 10 7 5 0 2
French Guiana 0 0 0 0 0 0 0 0
Grenada 0 0 0 0 0 0 0 0
Guatemala 15 6 0 9 7 6 0 1
Guyana 1 1 0 0 1 1 0 0
Haiti 36 24 0 12 33 26 0 7
Honduras 2 1 0 1 2 1 0 1
Jamaica 1 1 0 1 2 1 0 1
Mexico 27 6 0 20 17 7 0 10
Netherlands Antilles
Nicaragua 2 1 0 0 2 1 0 0
Panama 0 0 0 0 0 0 0 0
Paraguay 0 0 0 0 0 0 0 0
Peru 12 6 0 6 11 6 0 5
St Kitts amp Nevis 0 0 0 0 0 0 0 0
St Lucia 1 0 0 1 1 0 0 1
St Vincent amp Grenadines 2 1 0 1 2 1 0 1
Suriname 0 0 0 0 0 0 0 0
Trinidad amp Tobago 1 0 0 0 0 0 0 0
Uruguay 0 0 0 0 0 0 0 0
Venezuela (Boliv Rep of) 8 6 0 2 7 7 0 1
OCEANIA 2 2 0 0 2 2 0 0
Fiji 2 2 0 0 2 2 0 0
French Polynesia 0 0 0 0
New Caledonia 0 0 0 0 0 0 0 0
Papua New Guinea 0 0 0 0 0 0 0 0
Samoa 0 0 0 0 0 0 0 0
Solomon Islands 0 0 0 0 0 0 0 0
Tonga 0 0 0 0 0 0 0 0
Vanuatu 0 0 0 0 0 0 0 0
DEVELOPED REGIONS 1094 532 421 141 1055 505 397 153
NORTH AMERICA 4 2 0 1 4 3 0 1
Bermuda 0 0 0 0 0 0 0 0
Canada 0 0 0 0 0 0 0 0
United States of America 4 2 0 1 4 3 0 1
ASIA amp OCEANIA 3 1 0 1 2 2 0 1
Australia 0 0 0 0 0 0 0 0
Israel 2 1 0 1 2 1 0 1
Japan 0 0 0 0 0 0 0 0
New Zealand 0 0 0 0 0 0 0 0
EUROPE 1088 528 421 139 1048 500 397 151
Albania 17 16 0 2 16 15 0 1
Belarus 7 6 0 1 6 6 0 1
Bosnia amp Herzegovina 237 70 114 53 232 63 113 55
Croatia 103 76 2 25 89 66 2 21
European Union 39 14 0 24 20 13 0 7
Iceland 0 0 0 0 0 0 0 0
Macedonia FYR 9 8 0 1 11 8 0 3
Montenegro 3 3 0 0 3 3 0 0
Norway 0 0 0 0 0 0 0 0
Republic of Moldova 7 6 0 1 7 6 0 1
Russian Federation 204 109 80 14 199 112 53 34
Serbia 437 196 225 16 439 183 228 27
Switzerland 0 0 0 0 0 0 0 0
Ukraine 26 25 0 2 26 25 0 1
126
TABLE 14 Population at risk persons affected by natural disastersPersons affected by natural disasters
total droughtearthquake
extremetemperature
flood landslide storm volcanoeswildfiresand
epidemics
thousands thousands thousands thousands thousands thousands thousands thousands
2010 2010 2010 2010 2010 2010 2010 2010
WORLD 344655 106870 7485 3986 191861 2464 30954 1034
DEVELOPING REGIONS 342717 106870 6650 3971 191352 2464 30403 1007
AFRICA 43854 38810 0 0 4657 20 317 50
North Africa 81 0 0 0 81 0 0 0
Algeria 0 0 0 0 0 0 0 0
Egypt 4 0 0 0 4 0 0 0
Libya
Morocco 77 0 0 0 77 0 0 0
Tunisia
Sub-Saharan Africa 43773 38810 0 0 4577 20 317 50
Angola 255 0 0 0 255 0 0 0
Benin 832 0 0 0 831 0 0 1
Botswana 0 0 0 0 0 0 0 0
Burkina Faso 139 0 0 0 133 0 0 6
Burundi 184 180 0 0 3 0 2 0
Cameroon 6 0 0 0 3 0 0 3
Cape Verde
Central African Republic 2 0 0 0 2 0 0 0
Chad 2552 2400 0 0 145 0 0 7
Comoros
Congo 1 0 0 0 0 0 0 1
Cocircte drsquoIvoire 6 0 0 0 6 0 0 0
Congo Dem Rep 85 0 0 0 70 1 0 14
Djibouti 120 120 0 0 0 0 0 0
Equatorial Guinea
Eritrea
Ethiopia 9482 9400 0 0 81 0 0 1
Gabon 2 0 0 0 0 0 2 1
Gambia 39 0 0 0 39 0 0 0
Ghana 17 0 0 0 17 0 0 0
Guinea 48 0 0 0 48 0 0 0
Guinea-Bissau 57 0 0 0 57 0 0 0
Kenya 7514 7300 0 0 211 0 0 3
Lesotho 5 0 0 0 5 0 0 0
Liberia 15 0 0 0 15 0 0 0
Madagascar 1027 720 0 0 0 0 307 0
Malawi 79 0 0 0 79 0 0 0
Mali 619 600 0 0 19 0 0 0
Mauritania 309 300 0 0 9 0 0 0
Mauritius
Mozambique 544 460 0 0 81 0 0 4
Namibia 338 0 0 0 338 0 0 0
Niger 8134 7900 0 0 233 0 0 1
Nigeria 1509 0 0 0 1500 0 0 8
Rwanda 10 0 0 0 4 6 0 0
Senegal 103 0 0 0 103 0 0 0
Seychelles
Sierra Leone 0 0 0 0 0 0 0 0
Somalia 2866 2850 0 0 16 0 0 0
Sudan 4438 4300 0 0 138 0 0 0
South Africa 26 0 0 0 20 0 6 0
Swaziland
Tanzania Utd Rep
Togo 112 0 0 0 112 0 0 0
Uganda 613 600 0 0 0 13 0 0
Zambia 3 0 0 0 3 0 0 0
Zimbabwe 1681 1680 0 0 1 0 0 0
127
TABLE 14 Population at risk persons affected by natural disasters (continued)Persons affected by natural disasters
total droughtearthquake
extremetemperature
flood landslide storm volcanoeswildfiresand
epidemics
thousands thousands thousands thousands thousands thousands thousands thousands
2010 2010 2010 2010 2010 2010 2010 2010
ASIA 285231 67783 252 3900 181630 2388 28948 330
Central Asia 64 0 8 0 47 8 0 1
Kazakhstan 38 0 0 0 38 0 0 0
Kyrgyzstan 8 0 0 0 0 8 0 0
Tajikistan 17 0 8 0 9 0 0 0
Turkmenistan
Uzbekistan
East Asia 256254 66483 234 3800 154940 2294 28180 324
Brunei Darussalam
Cambodia 0 0 0 0 0 0 0 0
China 231535 60000 196 3800 140254 2148 25137 0
Indonesia 238 0 17 0 69 0 0 152
Korea DPR 96 0 0 0 56 0 40 0
Korea Republic of 42 0 0 0 0 0 42 0
Lao PDR
Malaysia 0 0 0 0 0 0 0 0
Mongolia
Myanmar 426 0 21 0 0 145 260 0
Philippines 6738 0 0 0 3901 1 2666 171
Singapore
Thailand 15654 6483 0 0 9171 0 0 1
Viet Nam 1524 0 0 0 1490 0 35 0
South Asia 27536 0 7 100 26570 86 768 5
Afghanistan 49 0 1 0 48 0 0 0
Bangladesh 987 0 0 100 575 55 257 0
Bhutan
India 4790 0 0 0 4283 0 507 0
Iran (Islamic Rep) 5 0 5 0 0 0 0 0
Maldives
Nepal 13 0 0 0 8 0 0 5
Pakistan 20399 0 1 0 20363 30 4 0
Sri Lanka 1292 0 0 0 1292 0 0 0
West Asia 1377 1300 4 0 74 0 0 0
Armenia
Azerbaijan 70 0 0 0 70 0 0 0
Bahrain
Cyprus
Georgia
Iraq 2 0 0 0 2 0 0 0
Jordan
Kuwait
Lebanon
Occupied PalestinianTerritory
0 0 0 0 0 0 0 0
Saudi Arabia 0 0 0 0 0 0 0 0
Syrian Arab Republic 1300 1300 0 0 0 0 0 0
Turkey 4 0 4 0 0 0 0 0
United Arab Emirates
Yemen 1 0 0 0 1 0 0 0
LATIN AMERICA amp THECARIBBEAN
13570 277 6397 71 5049 56 1093 628
Argentina 0 0 0 0 0 0 0 0
Bahamas
Barbados 2 0 0 0 0 0 2 0
Belize 0 0 0 0 0 0 0 0
Bolivia (Plur State) 428 62 0 0 358 4 0 3
Brazil 357 62 0 0 295 0 0 0
Chile 2676 0 2672 0 0 0 0 4
Colombia 3005 0 0 0 3005 0 0 0
Costa Rica 3 0 0 0 3 0 0 0
128
TABLE 14 Population at risk persons affected by natural disasters (continued)Persons affected by natural disasters
total droughtearthquake
extremetemperature
flood landslide storm volcanoeswildfiresand
epidemics
thousands thousands thousands thousands thousands thousands thousands thousands
2010 2010 2010 2010 2010 2010 2010 2010
Cuba
Dominica
Dominican Republic 52 0 0 0 39 0 12 0
Ecuador 121 108 0 0 11 0 0 2
El Salvador 12 0 0 0 0 0 12 0
French Guiana
Grenada 0 0 0 0 0 0 0 0
Guatemala 456 0 0 0 3 51 400 2
Guyana 0 0 0 0 0 0 0 0
Haiti 4310 0 3700 0 24 0 78 507
Honduras 102 45 0 0 5 0 25 27
Jamaica 3 0 0 0 0 0 3 0
Mexico 1600 0 25 0 1020 0 555 0
Netherlands Antilles
Nicaragua 76 0 0 0 76 0 0 0
Panama 33 0 0 0 33 0 0 0
Paraguay 16 0 0 0 0 0 0 16
Peru 154 0 0 71 80 1 0 2
St Kitts amp Nevis
St Lucia 3 0 0 0 2 0 1 0
St Vincent amp Grenadines
Suriname
Trinidad amp Tobago 0 0 0 0 0 0 0 0
Uruguay 0 0 0 0 0 0 0 0
Venezuela (Boliv Rep of) 95 0 0 0 95 0 0 0
OCEANIA 62 0 1 0 16 0 45 0
Fiji 39 0 0 0 0 0 39 0
French Polynesia 3 0 0 0 0 0 3 0
New Caledonia
Papua New Guinea 0 0 0 0 0 0 0 0
Samoa
Solomon Islands 18 0 1 0 16 0 1 0
Tonga 0 0 0 0 0 0 0 0
Vanuatu 0 0 0 0 0 0 0 0
DEVELOPED REGIONS 1922 0 835 15 509 0 536 27
NORTH AMERICA 36 0 1 0 7 0 29 0
Bermuda
Canada 0 0 0 0 0 0 0 0
United States of America 36 0 1 0 7 0 29 0
ASIA amp OCEANIA 1046 0 792 15 211 0 7 20
Australia 219 0 0 0 211 0 7 0
Israel 20 0 0 0 0 0 0 20
Japan 507 0 492 15 0 0 0 0
New Zealand 300 0 300 0 0 0 0 0
EUROPE 840 0 42 0 291 0 500 7
Albania 14 0 0 0 14 0 0 0
Belarus
Bosnia amp Herzegovina 35 0 0 0 35 0 0 0
Croatia 1 0 0 0 1 0 0 0
European Union 634 0 15 0 119 0 500 0
Iceland 0 0 0 0 0 0 0 0
Macedonia FYR
Montenegro 6 0 0 0 6 0 0 0
Norway
Republic of Moldova 12 0 0 0 12 0 0 0
Russian Federation 66 0 0 0 58 0 0 7
Serbia 32 0 27 0 5 0 0 0
Switzerland 0 0 0 0 0 0 0 0
Ukraine 40 0 0 0 40 0 0 0
129
TABLE 15 UndernourishmentShare of population undernourished Incidence of undernourishment Depth of hunger
pa millions millions pakcalcapday kcalcapday
pa
1995-97 2006-08 growth1995-97 -2006-08
1995-97 2006-08 growth1995-97 -2006-08
1995-97 2006-08 growth1995-97 -2006-08
WORLD 18 16 minus23 7012 7392 05 214 212 minus03
DEVELOPING REGIONS 18 16 minus23 7011 7392 05 234 234 minus03
AFRICA 29 23 minus24 1622 1603 minus01 253 234 minus05
North Africa 5 31 185 188 01
Algeria 5 15 180 180 00
Egypt 190 200 03
Libya 130 130 05
Morocco 6 16 210 200 minus03
Tunisia 120 120 00
Sub-Saharan Africa 31 23 minus23 1591 1603 01 268 243 minus05
Angola 61 41 minus35 78 72 minus07 390 320 minus17
Benin 18 12 minus36 10 10 00 230 210 minus08
Botswana 23 25 08 04 05 20 230 240 08
Burkina Faso 12 8 minus36 12 12 00 210 200 minus06
Burundi 56 62 09 35 49 31 350 390 14
Cameroon 34 22 minus39 50 42 minus16 260 230 minus08
Cape Verde 14 11 minus22 01 01 00 190 190 00
Central African Republic 47 40 minus15 16 17 06 320 300 minus02
Chad 53 39 minus27 39 41 05 370 320 minus12
Comoros 47 47 00 03 04 26 300 300 07
Congo 41 13 minus99 12 05 minus76 310 230 minus18
Cocircte drsquoIvoire 17 14 minus17 26 29 10 240 230 00
Congo Dem Rep
Djibouti 50 26 minus58 03 02 minus36 350 280 minus20
Equatorial Guinea
Eritrea 64 65 01 21 31 36 340 350 minus02
Ethiopia 62 41 minus37 362 326 minus09 390 320 minus17
Gabon 140 140 minus04
Gambia 23 19 minus17 03 03 00 250 240 05
Ghana 13 5 minus83 23 11 minus65 210 180 minus23
Guinea 19 16 minus15 15 16 06 270 260 minus02
Guinea-Bissau 26 22 minus15 03 03 00 260 250 00
Kenya 32 33 03 90 124 30 250 260 02
Lesotho 16 14 minus12 03 03 00 220 220 00
Liberia 32 32 00 07 11 42 330 330 02
Madagascar 26 25 minus04 35 47 27 250 250 05
Malawi 36 27 minus26 38 39 02 310 280 minus08
Mali 25 12 minus65 25 15 minus45 260 220 minus13
Mauritania 9 8 minus11 02 02 00 210 210 minus03
Mauritius 7 5 minus30 01 01 00 190 180 minus03
Mozambique 47 38 minus19 78 83 06 360 330 minus12
Namibia 30 18 minus45 05 04 minus20 250 220 minus08
Niger 37 16 minus73 35 23 minus37 300 240 minus14
Nigeria 10 6 minus45 109 94 minus13 200 180 minus12
Rwanda 53 32 minus45 30 30 00 360 300 minus06
Senegal 26 19 minus28 23 23 00 240 220 minus03
Seychelles 10 8 minus20 00 00 160 150 minus04
Sierra Leone 39 35 minus10 16 19 16 360 340 minus07
Somalia
Sudan 29 22 minus25 93 88 minus05 260 240 minus12
South Africa 160 150 00
Swaziland 21 19 minus09 02 02 00 220 220 09
Tanzania Utd Rep 42 34 minus19 128 139 08 300 280 05
Togo 36 30 minus16 17 19 10 290 280 minus06
Uganda 23 22 minus04 49 67 29 240 240 00
Zambia 38 44 13 36 54 38 300 320 06
Zimbabwe 44 30 minus34 53 37 minus32 340 300 minus06
130
TABLE 15 Undernourishment (continued)Share of population undernourished Incidence of undernourishment Depth of hunger
pa millions millions pakcalcapday kcalcapday
pa
1995-97 2006-08 growth1995-97 -2006-08
1995-97 2006-08 growth1995-97 -2006-08
1995-97 2006-08 growth1995-97 -2006-08
ASIA 16 15 minus21 4909 5372 08 233 238 minus02
Central Asia 12 13 minus20 46 55 16 171 172 minus01
Kazakhstan 130 120 00
Kyrgyzstan 13 11 minus15 06 06 00 210 210 minus03
Tajikistan 42 26 minus43 24 18 minus26 270 230 minus05
Turkmenistan 9 7 minus23 04 03 minus26 180 180 00
Uzbekistan 5 11 74 12 28 80 160 180 07
East Asia 13 11 minus18 2194 2058 minus06 241 241 minus04
Brunei Darussalam 140 130 minus05
Cambodia 40 25 minus42 47 36 minus24 280 250 minus05
China 12 10 minus16 1417 1296 minus08 250 250 minus05
Indonesia 11 13 15 220 297 28 210 220 00
Korea DPR 30 35 14 66 84 22 250 270 10
Korea Republic of 120 130 00
Lao PDR 29 22 minus25 14 14 00 270 260 minus05
Malaysia 120 130 minus05
Mongolia 33 27 minus18 08 07 minus12 260 260 02
Myanmar
Philippines 20 13 minus38 141 118 minus16 250 240 minus07
Singapore
Thailand 18 16 minus11 111 107 minus03 240 240 minus07
Viet Nam 22 11 minus61 167 96 minus49 270 240 minus12
South Asia 20 20 minus11 2570 3174 19 232 246 00
Afghanistan
Bangladesh 41 26 minus41 542 414 minus24 330 290 minus04
Bhutan
India 17 19 10 1671 2246 27 220 240 00
Iran (Islamic Rep) 170 180 07
Maldives 9 10 10 00 00 180 190 07
Nepal 20 17 minus15 44 47 06 230 220 minus03
Pakistan 20 25 20 268 428 43 260 280 00
Sri Lanka 25 20 minus20 45 39 minus13 260 250 minus02
West Asia 24 24 minus42 99 85 minus14 173 169 minus02
Armenia 36 21 minus48 11 06 minus54 230 200 minus14
Azerbaijan 27 22 220 140 minus28
Bahrain
Cyprus 120 120 00
Georgia 19 6 minus99 10 03 minus104 200 160 minus39
Iraq
Jordan 5 02 170 150 00
Kuwait 5 5 00 01 01 00 180 190 minus12
Lebanon 160 170 04
Occupied PalestinianTerritory
10 21 70 03 08 93 160 190
Saudi Arabia 130 130 minus05
Syrian Arab Republic 160 170 04
Turkey 160 160 04
United Arab Emirates 130 140 05
Yemen 31 30 minus03 50 67 27 260 260 02
LATIN AMERICA amp THECARIBBEAN
14 11 minus19 480 416 minus13 212 203 minus03
Argentina 120 130 00
Bahamas 8 6 minus26 00 00 160 160 00
Barbados 140 140 05
Belize 8 5 minus42 00 00 180 170 00
Bolivia (Plur State) 24 27 11 19 25 25 230 240 00
Brazil 10 6 minus45 166 117 minus31 240 220 minus05
Chile 150 140 minus08
Colombia 11 9 minus18 40 41 02 210 210 minus03
Costa Rica 150 150 04
131
TABLE 15 Undernourishment (continued)Share of population undernourished Incidence of undernourishment Depth of hunger
pa millions millions pakcalcapday kcalcapday
pa
1995-97 2006-08 growth1995-97 -2006-08
1995-97 2006-08 growth1995-97 -2006-08
1995-97 2006-08 growth1995-97 -2006-08
Cuba 14 15 190 120 minus18
Dominica 150 150 00
Dominican Republic 26 24 minus07 21 23 08 240 230 minus03
Ecuador 16 15 minus06 18 20 10 190 190 minus03
El Salvador 12 9 minus26 07 06 minus14 200 190 minus03
French Guiana
Grenada 18 21 14 00 00 240 250 08
Guatemala 20 22 09 21 29 30 220 230 06
Guyana 11 8 minus29 01 01 00 200 190 minus12
Haiti 60 57 minus05 48 55 12 430 420 minus03
Honduras 16 12 minus26 09 09 00 240 230 minus05
Jamaica 6 5 minus16 02 01 minus61 170 170 minus07
Mexico 190 190 00
Netherlands Antilles 150 150 minus11
Nicaragua 38 19 minus61 18 11 minus44 310 260 minus18
Panama 20 15 minus26 06 05 minus16 230 220 minus03
Paraguay 10 10 00 05 06 17 200 210 minus03
Peru 21 16 minus24 50 45 minus10 230 220 minus08
St Kitts amp Nevis 16 16 00 00 00 220 220 06
St Lucia 7 8 12 00 00 180 190 00
St Vincent amp Grenadines 16 5 minus100 00 00 210 170 minus10
Suriname 13 15 13 01 01 00 200 200 00
Trinidad amp Tobago 14 11 minus22 02 02 00 220 220 03
Uruguay 140 140 minus04
Venezuela (Boliv Rep of) 14 7 minus61 31 19 minus44 190 170 minus04
OCEANIA 8 9 00 01 182 173 minus06
Fiji 5 00 170 160 minus07
French Polynesia 5 00 160 150 minus11
New Caledonia 9 8 minus11 00 00 210 210 03
Papua New Guinea
Samoa 10 00 180 150 minus11
Solomon Islands 13 11 minus15 00 01 190 190 minus06
Tonga
Vanuatu 9 00 200 180 minus07
DEVELOPED REGIONS 5 01 125 116 01
NORTH AMERICA 111 101 minus02
Bermuda 180 200 07
Canada 120 110 minus10
United States of America 110 100 minus06
ASIA amp OCEANIA 128 126 00
Australia 130 120 00
Israel 90 90 00
Japan 130 130 00
New Zealand 120 120 00
EUROPE 5 01 131 121 01
Albania 160 160 minus07
Belarus 120 130 05
Bosnia amp Herzegovina 150 140 minus12
Croatia 180 150 minus18
European Union 5 01 120 115 minus02
Iceland 130 120 minus05
Macedonia FYR 180 150 minus11
Montenegro 170
Norway 120 110 minus05
Republic of Moldova 190 190 07
Russian Federation 160 130 minus09
Serbia 170
Switzerland 120 120 00
Ukraine 150 130 minus05
132
TABLE 16 Dietary energy supplies and changes in dietary compositionDietary energy supply per person Contribution in diets by type Contribution in diets by commodity
carbo-hydrates
proteins fats cereals starchy roots pulses
kcalcapday kcalcapday
1990-92 2006-08 2005-07 2005-07 2005-07 1990-92 2005-07 1990-92 2005-07 1990-92 2005-07
WORLD 2583 2805 65 11 24 53 48 8 7 5 5
DEVELOPING REGIONS 2430 2664 67 11 22 58 53 9 8 5 5
AFRICA 2266 2495 72 10 18 49 49 22 20 5 5
North Africa 3035 3175 71 11 17 62 60 2 3 2 2
Algeria 2890 3090 70 11 19 57 56 2 3
Egypt 3090 3160 73 12 15 66 64 2 2
Libya 3180 3150 63 10 27 47 47 2 3
Morocco 3000 3260 72 11 17 62 60 2 2
Tunisia 3120 3330 64 11 24 55 50 2 2
Sub-Saharan Africa 2102 2351 72 10 19 47 47 24 22 5 6
Angola 1580 1960 70 9 21 29 36 30 26 3 3
Benin 2250 2510 72 9 19 41 40 34 31 4 5
Botswana 2260 2230 67 11 22 43 43 6 6 5 6
Burkina Faso 2460 2690 68 12 20 75 73 5 5
Burundi 1860 1680 82 11 7 17 19 29 32 27 19
Cameroon 2020 2240 72 10 18 39 42 20 17 2 6
Cape Verde 2370 2530 63 11 26 50 45 4 4 4 3
Central African Republic 1880 1960 61 9 29 20 25 37 31
Chad 1700 2010 64 12 24 52 57 13 8 2 4
Comoros 1900 1840 69 9 22 41 38 17 15 6 9
Congo 1970 2570 69 8 23 19 26 41 34
Cocircte drsquoIvoire 2470 2500 74 8 18 35 33 31 33
Congo Dem Rep 80 6 14 16 23 57 55
Djibouti 1720 2300 63 10 27 52 52 2 3
Equatorial Guinea
Eritrea 1530 1590 73 12 15 72 74 5 3 8 5
Ethiopia 1550 1950 79 11 10 67 66 15 13 6 7
Gabon 2520 2710 69 12 19 25 33 21 17
Gambia 2470 2330 64 9 27 55 56
Ghana 2120 2900 77 8 15 32 29 39 37
Guinea 2420 2550 70 9 22 50 47 14 14
Guinea-Bissau 2290 2270 71 8 21 61 59 8 9
Kenya 1970 2030 68 11 21 47 49 8 5 6 7
Lesotho 2370 2460 77 11 12 76 78 2 3
Liberia 2220 2200 70 7 24 45 43 22 23
Madagascar 2200 2130 78 9 13 52 59 22 19
Malawi 1870 2150 77 10 13 69 59 4 15 7 6
Mali 2180 2590 70 11 19 69 67 1 3
Mauritania 2580 2810 63 12 25 55 51 4 4
Mauritius 2760 2930 62 11 26 48 46 3 3
Mozambique 1750 2070 76 7 17 34 40 41 37
Namibia 2060 2360 68 11 21 48 46 14 14 4 3
Niger 1970 2390 68 13 19 74 60 6 14
Nigeria 2310 2710 69 9 22 47 45 20 19 3 3
Rwanda 1830 2090 82 10 9 18 18 30 36 15 12
Senegal 2190 2280 65 10 25 64 60 1 3
Seychelles 2280 2400 60 14 26 46 41
Sierra Leone 1950 2120 67 10 24 55 50 5 10 4 5
Somalia
Sudan 1960 2280 61 13 26 57 50 2 3
South Africa 2820 3000 65 11 24 53 54
Swaziland 2380 2290 68 11 21 52 50 5 5
Tanzania Utd Rep 2080 2020 75 10 15 47 46 24 17 5 7
Togo 1890 2150 71 9 20 48 49 28 25 2 4
Uganda 2280 2220 74 9 17 19 23 25 23 9 8
Zambia 2010 1880 73 10 17 65 61 13 14
Zimbabwe 1980 2210 66 10 24 62 56 2 2
133
TABLE 16 Dietary energy supplies and changes in dietary composition (continued)Dietary energy supply per person Contribution in diets by type Contribution in diets by commodity
carbo-hydrates
proteins fats cereals starchy roots pulses
kcalcapday kcalcapday
1990-92 2006-08 2005-07 2005-07 2005-07 1990-92 2005-07 1990-92 2005-07 1990-92 2005-07
ASIA 2434 2667 67 11 22 63 56 6 5 5 5
Central Asia 2715 2793 64 12 25 59 54 4 6
Kazakhstan 3280 3510 61 12 27 57 43 4 6
Kyrgyzstan 2400 2660 68 12 20 57 48 5 8
Tajikistan 2020 2190 64 10 26 63 63
Turkmenistan 2550 2740 65 13 23 57 61
Uzbekistan 2650 2560 64 12 25 59 57
East Asia 2508 2872 64 11 24 63 53 7 5 3 6
Brunei Darussalam 2730 2980 64 12 25 48 45
Cambodia 1870 2180 75 10 14 82 72 2 4
China 2580 2990 61 12 27 63 50 7 5
Indonesia 2390 2550 73 9 18 66 63 7 6
Korea DPR 2340 2110 74 11 15 60 62 3 7 6 5
Korea Republic of 2970 3040 63 11 25 54 44
Lao PDR 2010 2240 76 11 13 78 70 6 4
Malaysia 2720 2890 63 11 26 42 47 3 2
Mongolia 2080 2240 56 13 32 42 46 2 4
Myanmar 67 11 22 73 59 2 6
Philippines 2230 2580 73 9 18 53 57 4 3
Singapore
Thailand 2250 2540 71 9 20 57 49
Viet Nam 2090 2780 70 10 19 76 66
South Asia 2279 2374 71 10 19 65 60 2 3 5 5
Afghanistan
Bangladesh 1960 2270 80 9 12 84 78 1 3
Bhutan
India 2290 2360 71 10 19 64 60 5 5
Iran (Islamic Rep) 2970 3050 69 11 20 60 53 3 4
Maldives 2400 2550 60 16 23 46 35
Nepal 2190 2340 74 10 15 74 69 3 5 3 3
Pakistan 2210 2280 63 10 27 55 47 3 3
Sri Lanka 2170 2370 73 9 18 56 56 4 2 3 3
West Asia 2963 3067 64 11 25 51 49 3 3 4 3
Armenia 1920 2260 64 12 24 59 44 8 5
Azerbaijan 2160 3020 73 11 16 66 60 2 6
Bahrain
Cyprus 3120 3190 48 12 41 28 21 3 3
Georgia 1850 2730 67 11 22 57 50 5 3
Iraq
Jordan 2840 3000 63 10 27 50 46 3 2
Kuwait 2350 3030 58 12 30 39 42 2 2
Lebanon 3010 3090 58 11 32 34 34 3 6 4 3
Occupied PalestinianTerritory
2080 66 11 23 0 51
Saudi Arabia 2850 3120 64 11 25 48 48
Syrian Arab Republic 2830 3040 59 10 30 50 45
Turkey 3590 3500 62 11 27 51 48 3 3 4 3
United Arab Emirates 3160 3170 63 13 24 33 43 3 4
Yemen 1980 2050 69 11 20 66 61 3 3
LATIN AMERICA amp THECARIBBEAN
2664 2915 62 11 27 39 37 6 6 5 5
Argentina 3010 3030 55 13 32 32 31 3 3
Bahamas 2610 2710 57 12 30 27 27 2 2
Barbados 3040 3020 59 12 29 30 27 3 3
Belize 2510 2710 67 11 23 37 39 4 4
Bolivia (Plur State) 2030 2100 71 11 18 43 47 9 7
Brazil 2760 3120 59 11 30 33 32 5 5 5 5
Chile 2600 2960 61 12 27 43 40 4 4
Colombia 2410 2690 66 10 24 33 34 8 6
Costa Rica 2820 2820 62 11 27 32 31 3 4
134
TABLE 16 Dietary energy supplies and changes in dietary composition (continued)Dietary energy supply per person Contribution in diets by type Contribution in diets by commodity
carbo-hydrates
proteins fats cereals starchy roots pulses
kcalcapday kcalcapday
1990-92 2006-08 2005-07 2005-07 2005-07 1990-92 2005-07 1990-92 2005-07 1990-92 2005-07
Cuba 2720 3420 73 10 17 34 40 5 7 4 7
Dominica 3000 3090 64 12 24 26 25 7 9
Dominican Republic 2160 2270 61 9 30 30 29 5 4
Ecuador 2110 2300 55 10 35 35 34
El Salvador 2400 2580 67 11 22 56 44 1 2 4 6
French Guiana
Grenada 2470 2400 54 12 34 28 22 2 3 3 3
Guatemala 2290 2150 67 11 23 58 51 6 4
Guyana 2300 2740 68 11 21 53 46 4 4 3 2
Haiti 1730 1850 74 9 17 44 46 11 9 8 5
Honduras 2300 2610 66 10 24 51 44 4 5
Jamaica 2510 2840 61 11 28 34 32 9 5
Mexico 3090 3260 62 11 26 47 44 4 4
Netherlands Antilles 3280 3260 64 11 24 36 36 4 3
Nicaragua 1770 2420 68 10 22 47 50 8 7
Panama 2320 2450 65 12 24 39 43 2 2
Paraguay 2390 2660 58 11 32 27 29 18 13 4 5
Peru 2110 2410 74 11 15 49 44 8 14 2 3
St Kitts amp Nevis 2580 2460 59 12 29 32 26 3 2 2 2
St Lucia 2580 2710 58 14 28 30 28 6 2
St Vincent amp Grenadines 2360 2860 64 11 25 30 33 7 5 2 2
Suriname 2440 2460 68 9 23 50 42 2 2
Trinidad amp Tobago 2610 2700 65 10 25 39 34 2 2 4 3
Uruguay 2660 2840 64 11 25 35 43 4 4
Venezuela (Boliv Rep of) 2460 2650 64 11 26 36 37 3 3
OCEANIA 2549 2850 60 10 30 32 34 15 14 3 2
Fiji 2640 3000 60 10 29 43 41 4 7 3 2
French Polynesia 2480 2880 48 14 39 25 31 5 4
New Caledonia 3210 3150 52 12 35 35 32 6 5
Papua New Guinea
Samoa 2550 2890 46 11 43 23 18 10 10
Solomon Islands 2120 2400 73 9 18 25 34 40 34 3 3
Tonga
Vanuatu 2530 2950 60 9 31 22 31 22 18
DEVELOPED REGIONS 3260 3426 53 12 35 29 28 5 5
NORTH AMERICA 3464 3728 49 12 38 23 22 3 3
Bermuda 2870 2650 48 12 40 19 24
Canada 3050 3530 51 12 37 21 25 4 4
United States of America 3510 3750 49 12 38 23 22 3 3
ASIA amp OCEANIA 2969 2892 56 13 31 36 35 3 3
Australia 3130 3220 46 13 40 22 22 3 3
Israel 3410 3530 49 14 37 35 33 2 2
Japan 2920 2800 58 13 29 39 38
New Zealand 2810 2810 54 12 34 23 24 3 4
EUROPE 3228 3401 54 12 34 30 30 6 5
Albania 2560 2890 58 14 29 57 40 1 2
Belarus 3180 3150 56 12 32 37 30 10 11
Bosnia amp Herzegovina 2670 3080 67 11 21 61 45 5 5
Croatia 2420 2990 57 11 32 30 31 7 4
European Union 3341 3453 51 12 37 26 28 5 4
Iceland 3090 3260 45 16 39 23 20 3 3
Macedonia FYR 2550 3060 55 10 34 44 34 3 3
Montenegro
Norway 3230 3450 51 12 36 27 28 5 4
Republic of Moldova 2880 2850 70 11 20 55 48 5 5
Russian Federation 2960 3320 63 12 25 40 36 8 7
Serbia
Switzerland 3370 3450 49 11 41 22 21
Ukraine 3040 3290 63 11 26 43 36 8 8
135
TABLE 17 Changes in dietary compositionContribution in diets by commodity
meat and fish dairy and eggs fruit and vegetables sugar vegetable oils other
1990-92 2005-07 1990-92 2005-07 1990-92 2005-07 1990-92 2005-07 1990-92 2005-07 1990-92 2005-07
WORLD 8 11 5 5 4 5 8 8 8 9 11 13
DEVELOPING REGIONS 7 10 4 4 4 5 7 7 7 8 10 12
AFRICA 4 4 5 6 6 6 6 6 9 9 11 11
North Africa 3 3 3 3 6 7 10 9 9 7 7 9
Algeria 3 3 6 6 3 5 9 9 14 10 6 8
Egypt 2 3 2 2 7 9 10 8 6 4 5 8
Libya 5 4 5 5 8 7 12 10 14 16 7 8
Morocco 3 3 4 6 10 11 8 8 11 10
Tunisia 3 3 4 5 6 6 9 10 15 14 6 10
Sub-Saharan Africa 4 4 7 7 6 6 5 5 9 9 12 12
Angola 5 5 7 8 14 12 12 10
Benin 2 2 6 8 13 14
Botswana 6 4 9 7 11 13 6 9 14 12
Burkina Faso 3 3 4 5 13 14
Burundi 10 15 17 15
Cameroon 3 3 10 8 3 4 8 8 15 12
Cape Verde 6 9 5 8 2 2 7 9 10 8 12 12
Central African Republic 7 8 4 4 3 4 14 14 15 14
Chad 4 4 5 5 24 22
Comoros 8 7 4 6 8 11 16 14
Congo 4 3 5 4 4 6 12 15 15 12
Cocircte drsquoIvoire 8 7 4 4 10 11 12 12
Congo Dem Rep 7 3 7 7 13 12
Djibouti 5 6 5 5 19 11 10 16 7 7
Equatorial Guinea
Eritrea 1 4 4 6 10 8
Ethiopia 3 2 2 3 7 9
Gabon 8 8 16 12 6 6 5 6 19 18
Gambia 2 2 17 12 13 17 13 13
Ghana 7 11 3 4 7 7 12 12
Guinea 13 10 4 5 11 14 8 10
Guinea-Bissau 4 4 4 3 1 6 13 12 9 7
Kenya 8 7 4 5 10 9 8 8 9 10
Lesotho 4 4 7 6 11 9
Liberia 4 4 2 3 16 19 11 8
Madagascar 6 4 3 3 3 3 3 4 11 8
Malawi 4 5 7 5 9 10
Mali 3 3 5 5 4 5 9 7 9 10
Mauritania 5 5 11 10 10 12 9 12 6 6
Mauritius 4 6 6 6 2 4 14 12 14 15 9 8
Mozambique 1 4 13 9 11 10
Namibia 6 6 4 5 16 10 2 7 6 9
Niger 4 5 3 3 2 3 3 5 8 10
Nigeria 3 3 2 3 13 13 12 14
Rwanda 21 18 2 4 14 12
Senegal 3 3 2 2 7 6 13 15 10 11
Seychelles 10 11 6 4 5 7 14 10 7 8 12 19
Sierra Leone 3 3 20 15 13 17
Somalia
Sudan 4 5 12 17 8 10 7 5 10 10
South Africa 8 9 3 3 12 10 8 12 16 12
Swaziland 5 6 4 5 3 3 15 13 7 6 9 12
Tanzania Utd Rep 3 6 3 5 5 7 13 12
Togo 9 10 13 12
Uganda 20 17 1 4 3 7 23 18
Zambia 3 3 8 6 4 6 7 10
Zimbabwe 3 4 11 12 8 10 14 16
136
TABLE 17 Changes in dietary composition (continued)Contribution in diets by commodity
meat and fish dairy and eggs fruit and vegetables sugar vegetable oils other
1990-92 2005-07 1990-92 2005-07 1990-92 2005-07 1990-92 2005-07 1990-92 2005-07 1990-92 2005-07
ASIA 8 12 3 4 3 4 6 6 7 8 9 12
Central Asia 7 7 9 10 2 4 5 6 9 9 8 9
Kazakhstan 10 9 8 13 1 3 6 9 5 8 9 9
Kyrgyzstan 11 7 12 12 2 4 6 9 4 5 3 7
Tajikistan 3 4 6 5 6 7 11 11 11 10
Turkmenistan 7 10 8 9 2 3 6 4 11 6 9 7
Uzbekistan 6 6 9 9 3 4 4 3 12 11 7 10
East Asia 9 14 1 2 3 5 4 4 6 7 9 13
Brunei Darussalam 9 8 7 9 5 5 12 13 7 8 12 12
Cambodia 5 5 1 4 2 3 8 12
China 9 15 1 2 3 6 3 2 6 7 8 13
Indonesia 2 3 6 6 7 8 12 14
Korea DPR 5 5 8 7 5 6 13 8
Korea Republic of 7 11 7 8 10 11 8 12 14 14
Lao PDR 4 5 2 5 1 2 9 14
Malaysia 12 11 4 3 3 3 13 12 14 12 9 10
Mongolia 30 17 8 11 8 6 1 6 9 10
Myanmar 2 6 2 2 3 6 10 9 8 12
Philippines 10 12 6 6 12 9 6 4 9 9
Singapore
Thailand 8 9 5 4 8 14 5 6 17 18
Viet Nam 6 12 4 5 3 4 2 3 9 10
South Asia 2 4 4 5 2 3 9 8 7 9 9 11
Afghanistan
Bangladesh 3 4 4 7 8 8
Bhutan
India 4 4 2 2 9 8 7 9 9 12
Iran (Islamic Rep) 3 5 3 3 8 12 9 9 9 7 5 7
Maldives 10 17 3 7 4 9 17 13 7 7 13 12
Nepal 3 4 1 2 6 7 10 10
Pakistan 2 3 9 12 12 12 10 11 9 12
Sri Lanka 3 3 3 2 11 11 3 4 17 19
West Asia 5 6 6 6 9 7 9 10 10 12 9 10
Armenia 6 8 7 10 8 13 4 8 2 5 6 7
Azerbaijan 5 4 7 6 5 3 6 6 1 4 8 11
Bahrain
Cyprus 12 13 10 10 8 7 12 13 13 15 14 18
Georgia 7 5 7 10 7 14 2 7 15 11
Iraq
Jordan 5 5 5 5 3 2 15 15 11 15 8 10
Kuwait 11 11 8 5 7 7 12 11 11 12 10 10
Lebanon 5 7 4 5 15 9 11 11 14 14 10 11
Occupied PalestinianTerritory
0 5 0 5 100 8 0 12 0 10 0 9
Saudi Arabia 7 7 5 5 10 10 10 10 13 12 7 8
Syrian Arab Republic 4 4 6 7 4 3 12 13 12 12 12 16
Turkey 6 6 8 8 8 8 11 14 9 10
United Arab Emirates 11 10 9 5 12 9 11 12 9 6 12 11
Yemen 3 4 2 3 10 12 9 10 7 7
LATIN AMERICA amp THECARIBBEAN
7 10 6 6 5 5 16 14 10 11 11 11
Argentina 17 17 8 9 14 16 11 11 15 13
Bahamas 18 17 7 6 9 9 16 15 3 6 18 18
Barbados 16 15 7 7 3 7 16 19 10 9 15 13
Belize 8 8 7 6 8 8 15 15 3 4 18 16
Bolivia (Plur State) 9 10 2 2 7 6 14 13 4 3 12 12
Brazil 8 12 6 7 4 4 17 13 13 13 9 9
Chile 9 14 6 5 3 3 15 14 9 8 11 12
Colombia 7 7 7 8 7 7 19 17 9 11 10 10
Costa Rica 5 5 8 10 6 5 21 19 12 12 13 14
137
TABLE 17 Changes in dietary composition (continued)Contribution in diets by commodity
meat and fish dairy and eggs fruit and vegetables sugar vegetable oils other
1990-92 2005-07 1990-92 2005-07 1990-92 2005-07 1990-92 2005-07 1990-92 2005-07 1990-92 2005-07
Cuba 6 5 6 3 4 6 21 15 9 6 11 11
Dominica 10 11 9 9 11 12 15 14 8 5 14 15
Dominican Republic 6 9 5 4 13 9 15 16 15 16 11 13
Ecuador 6 10 7 7 11 10 9 8 18 17 14 14
El Salvador 2 4 5 7 4 4 15 15 5 6 8 12
French Guiana
Grenada 10 15 10 9 8 7 17 16 9 11 13 14
Guatemala 2 4 3 3 2 3 17 15 6 9 6 11
Guyana 3 6 3 6 1 3 14 13 4 7 15 13
Haiti 3 4 8 6 10 12 5 7 11 11
Honduras 3 6 5 7 5 6 16 17 9 9 7 6
Jamaica 7 8 4 6 5 7 20 16 10 12 11 14
Mexico 6 9 5 5 3 4 16 15 8 8 11 11
Netherlands Antilles 15 13 8 6 10 18 7 6 20 18
Nicaragua 3 4 4 5 14 15 9 9 15 10
Panama 6 8 7 7 5 4 14 12 11 8 16 16
Paraguay 12 9 4 4 4 3 9 9 8 12 14 16
Peru 3 4 3 4 4 6 12 9 5 5 14 11
St Kitts amp Nevis 11 13 8 8 2 3 15 17 13 11 14 18
St Lucia 16 20 8 8 8 7 14 13 3 5 15 17
St Vincent amp Grenadines 11 12 5 5 4 6 18 17 9 8 14 12
Suriname 7 8 7 6 15 18 7 12 12 12
Trinidad amp Tobago 5 7 6 7 3 3 19 21 11 10 11 13
Uruguay 20 10 10 7 2 3 11 13 6 8 12 12
Venezuela (Boliv Rep of) 6 9 6 4 7 4 15 16 15 14 12 13
OCEANIA 11 10 6 7 4 4 7 8 8 8 22 21
Fiji 12 11 7 10 12 10 19 19
French Polynesia 18 19 6 6 2 2 11 7 9 11 24 20
New Caledonia 11 10 7 8 2 3 11 8 12 13 16 21
Papua New Guinea
Samoa 19 17 5 8 9 9 2 7 32 31
Solomon Islands 4 3 4 4 2 4 22 18
Tonga
Vanuatu 10 8 6 5 4 6 6 5 30 27
DEVELOPED REGIONS 11 11 9 9 4 4 13 13 12 14 19 18
NORTH AMERICA 12 12 11 10 3 3 17 17 16 18 16 15
Bermuda 19 17 6 6 11 6 11 14 10 12 24 21
Canada 11 10 8 6 7 6 14 14 14 16 21 19
United States of America 12 12 11 10 3 3 17 17 16 18 15 15
ASIA amp OCEANIA 12 12 8 7 3 4 12 10 11 14 18 17
Australia 15 15 12 10 3 4 15 13 13 16 17 17
Israel 8 12 7 6 9 9 12 7 14 19 13 12
Japan 12 12 7 7 3 3 11 10 10 13 18 17
New Zealand 13 15 9 4 7 8 16 17 7 7 22 21
EUROPE 11 10 9 9 5 5 11 12 10 12 20 19
Albania 4 8 12 18 5 10 6 7 8 6 7 9
Belarus 11 11 11 7 1 3 10 11 4 11 16 16
Bosnia amp Herzegovina 4 4 6 10 5 8 4 6 2 6 13 16
Croatia 6 7 10 11 4 4 17 13 8 13 18 17
European Union 12 11 9 9 5 5 11 11 12 14 22 19
Iceland 17 21 14 16 3 4 18 13 5 6 17 17
Macedonia FYR 9 7 5 6 8 7 12 12 5 14 14 17
Montenegro
Norway 14 14 11 9 3 4 13 12 10 11 17 18
Republic of Moldova 5 4 8 11 2 2 9 12 5 6 11 12
Russian Federation 10 8 8 8 12 13 5 9 17 19
Serbia
Switzerland 16 14 12 11 4 3 13 17 11 13 22 21
Ukraine 7 6 8 9 13 15 7 10 14 16
138
TABLE 18 Health effects of malnutritionShare of children under 5 share of
lowweightnewborns
Share of adults Dietaryironsupply
underweightstunted wasted total with
low BMIwomenwith lowBMI
overweight or obese per person
male female mg day
2009 2009 2009 2009 2009 2009 2009 2009 2005-07
WORLD 18 28 9 13 91 129 145
DEVELOPING REGIONS 20 30 10 14 64 107 144
AFRICA 22 39 10 111 65 135 152
North Africa 7 24 7 10 172 361 163
Algeria 4 16 4 6 107 243 136
Egypt 7 31 8 13 16 225 463 177
Libya 6 21 7 215 413 140
Morocco 10 23 11 53 73 111 231 163
Tunisia 3 9 3 5 139 334 157
Sub-Saharan Africa 25 42 11 126 44 92 150
Angola 28 51 8 38 102 98
Benin 20 45 8 15 92 35 95 154
Botswana 11 29 6 13 30 228 147
Burkina Faso 26 35 11 16 208 17 30 242
Burundi 39 63 8 11 28 37 135
Cameroon 17 36 7 11 67 70 151 158
Cape Verde 6 63 153 121
Central African Republic 22 45 11 13 153 20 53 123
Chad 37 45 16 22 203 24 38 180
Comoros 25 7 13 25 105 35 53 92
Congo 12 31 8 13 132 28 75 120
Cocircte drsquoIvoire 17 40 9 17 82 39 97 111
Congo Dem Rep 28 46 14 185 07 30 84
Djibouti 30 33 26 10 67 138 102
Equatorial Guinea 11 35 3 79 148
Eritrea 35 44 15 14 13 23 132
Ethiopia 35 51 12 20 09 16 154
Gabon 9 26 4 66 84 215 155
Gambia 16 28 7 20 23 144 113
Ghana 14 29 9 13 164 86 44 117 140
Guinea 23 39 11 132 43 51 107
Guinea-Bissau 17 48 9 26 81 91
Kenya 16 35 7 8 123 25 68 134
Lesotho 17 45 6 57 31 266 164
Liberia 20 39 8 14 100 31 77 117
Madagascar 37 53 15 16 192 18 15 113
Malawi 16 53 4 14 92 26 62 162
Mali 28 39 15 135 24 68 187
Mauritania 23 29 13 130 43 233 133
Mauritius 15 10 14 14 129 230 132
Mozambique 21 47 5 15 86 26 78 88
Namibia 18 30 8 16 159 43 168 140
Niger 40 55 12 192 15 37 235
Nigeria 27 41 14 12 122 51 90 196
Rwanda 18 52 5 6 98 49 40 174
Senegal 15 20 9 19 182 32 125 113
Seychelles 6 5 2 151 337 153
Sierra Leone 21 37 11 14 112 36 101 114
Somalia 33 42 13 34 71
Sudan 32 38 21 41 89 157
South Africa 86 232 428 143
Swaziland 6 30 3 9 32 61 371 138
Tanzania Utd Rep 17 44 4 104 40 68 147
Togo 22 28 16 109 30 61 131
Uganda 16 39 6 14 121 43 49 145
Zambia 15 46 6 11 96 12 70 113
Zimbabwe 14 36 7 99 92 28 138 143
139
TABLE 18 Health effects of malnutrition (continued)Share of children under 5 share of
lowweightnewborns
Share of adults Dietaryironsupply
underweightstunted wasted total with
low BMIwomenwith lowBMI
overweight or obese per person
male female mg day
2009 2009 2009 2009 2009 2009 2009 2009 2005-07
ASIA 22 30 11 15 45 75 143
Central Asia 7 21 5 6 68 150 206 113
Kazakhstan 7 18 4 6 74 202 274 133
Kyrgyzstan 3 18 3 5 37 69 117 216 120
Tajikistan 15 33 9 10 80 116 127
Turkmenistan 12 22 6 4 99 139 145 98
Uzbekistan 4 20 5 5 59 145 198 99
East Asia 9 19 5 4 43 67 174
Brunei Darussalam 85 72 174
Cambodia 29 40 9 9 161 16 28 104
China 5 14 3 3 80 46 65 200
Indonesia 20 40 15 25 69 102
Korea DPR 18 45 9 37 39 156
Korea Republic of 1 3 1 47 65 69 77 218
Lao PDR 32 48 7 11 135 145 17 41 121
Malaysia 17 21 15 11 96 104 179 158
Mongolia 5 28 3 5 49 39 119 207 111
Myanmar 30 41 11 20 61 124
Philippines 21 32 7 21 123 142 45 83 99
Singapore 3 4 4 8 92 146 66 62
Thailand 7 16 5 192 49 118 117
Viet Nam 20 1 10 5 265 12 20 130
South Asia 40 46 18 27 329 21 42 106
Afghanistan 33 59 9 15 33
Bangladesh 41 43 18 297 10 13 81
Bhutan 12 38 5 9 47 66
India 44 48 20 28 329 356 13 25 108
Iran (Islamic Rep) 10 20 6 7 57 54 136 295 135
Maldives 18 20 10 65 261 177
Nepal 39 49 13 21 244 14 16 152
Pakistan 31 42 14 32 312 316 35 84 89
Sri Lanka 22 19 12 17 162 26 73 118
West Asia 10 23 6 224 356 144
Armenia 4 18 5 7 52 144 302 118
Azerbaijan 8 27 7 10 48 158 321 120
Bahrain 8 14 7 289 382
Cyprus 43 69 248 219 188
Georgia 2 15 3 5 159 257 105
Iraq 7 28 6 15 223 362
Jordan 2 8 2 13 30 39 273 417 112
Kuwait 2 4 2 7 25 07 372 524 172
Lebanon 4 17 7 264 297 161
Occupied PalestinianTerritory
2 12 2 102
Saudi Arabia 5 9 12 70 49 295 435 159
Syrian Arab Republic 10 28 12 9 238 390 133
Turkey 4 16 1 11 35 16 228 356 158
United Arab Emirates 302 430 196
Yemen 43 58 15 252 105 227 103
LATIN AMERICA amp THECARIBBEAN
4 14 2 8 30 190 279 140
Argentina 2 8 1 7 34 274 310 122
Bahamas 11 267 426 174
Barbados 5 10 4 14 32 33 216 442 192
Belize 5 22 2 14 244 454 167
Bolivia (Plur State) 5 27 1 6 20 100 271 102
Brazil 2 7 2 8 40 35 165 221 137
Chile 1 2 0 08 11 245 336 138
Colombia 3 13 1 6 39 119 237 112
Costa Rica 1 6 1 7 209 283 140
140
TABLE 18 Health effects of malnutrition (continued)Share of children under 5 share of
lowweightnewborns
Share of adults Dietaryironsupply
underweightstunted wasted total with
low BMIwomenwith lowBMI
overweight or obese per person
male female mg day
2009 2009 2009 2009 2009 2009 2009 2009 2005-07
Cuba 5 73 62 133 275 186
Dominica 10 101 391 177
Dominican Republic 3 10 2 11 144 293 100
Ecuador 6 29 2 10 19 157 282 81
El Salvador 7 21 2 29 202 329 157
French Guiana
Grenada 9 149 321 137
Guatemala 13 48 1 20 138 267 131
Guyana 11 18 8 83 271 127
Haiti 19 30 10 155 84 84 99
Honduras 9 30 1 10 40 129 263 140
Jamaica 3 5 5 100 382 150
Mexico 4 15 2 8 14 267 384 178
Netherlands Antilles 128
Nicaragua 6 23 2 37 168 313 136
Panama 6 22 1 10 36 194 321 117
Paraguay 3 18 1 162 223 139
Peru 5 28 1 19 111 217 158
St Kitts amp Nevis 11 320 494 153
St Lucia 12 15 8 11 119 319 158
St Vincent amp Grenadines 8 164 335 130
Suriname 8 11 5 11 165 346 98
Trinidad amp Tobago 4 5 5 19 216 380 134
Uruguay 6 14 3 8 207 260 113
Venezuela (Boliv Rep of) 4 16 5 8 266 348 114
OCEANIA 17 42 4 11 158 265
Fiji 10 61 56 213 422 179
French Polynesia 195
New Caledonia 183
Papua New Guinea 18 44 4 11 118 201
Samoa 2 4 1 453 667 175
Solomon Islands 16 34 7 13 19 253 392 137
Tonga 3 491 703
Vanuatu 12 26 6 10 19 29 229 368 167
DEVELOPED REGIONS 216 230 149
NORTH AMERICA 1 4 1 296 323 142
Bermuda 148
Canada 26 246 239 165
United States of America 1 4 1 24 302 332 139
ASIA amp OCEANIA 3 8 1 94 96 82 191
Australia 7 10 28 252 249 149
Israel 8 232 276 197
Japan 3 8 1 115 108 55 35 199
New Zealand 6 13 16 262 277 152
EUROPE 205 219 144
Albania 6 23 9 217 205 128
Belarus 1 5 2 4 197 264 148
Bosnia amp Herzegovina 2 12 4 5 227 253 202
Croatia 0 1 2 5 02 228 194 116
European Union 215 196 148
Iceland 4 23 30 234 203 208
Macedonia FYR 2 12 3 6 216 189 130
Montenegro 2 8 4 228 207
Norway 5 50 70 216 179 158
Republic of Moldova 3 11 5 6 59 100 288 142
Russian Federation 6 184 298 134
Serbia 2 8 5 6 255 203
Switzerland 35 59 183 116 126
Ukraine 4 23 8 4 54 155 236 127
141
TABLE 19 Trade and food security - caloric self-sufficiencyCaloric self-sufficiency
pa
1970 1980 1990 2000 2009 growth1970-2009
WORLD 1002 1002 1002 1002 1006 00
DEVELOPING REGIONS 997 968 983 964 948 minus04
AFRICA 1021 883 866 821 822 minus06
North Africa 901 638 660 668 761 minus13
Algeria 860
Egypt 930 602 605 668 827 minus03
Libya
Morocco 939 721 813 643 minus10
Tunisia 703 669 612 608 minus04
Sub-Saharan Africa 1044 957 962 920 873 minus06
Angola 1137 697 652 731 779 minus10
Benin 1107 1022 898 992 909 minus05
Botswana
Burkina Faso 1004 967 941 911 922 minus02
Burundi 985 968 981 971 891 minus03
Cameroon 1037 997 977 926 888 minus04
Cape Verde
Central African Republic 964 981 937 951 924 minus01
Chad 968 984 952 970 930 minus01
Comoros 901 825 701 783 692 minus07
Congo 1272 799 880 607 908 minus09
Cocircte drsquoIvoire 1044 1074 1205 1203 1092 01
Congo Dem Rep 1025 962 961 953 879 minus04
Djibouti
Equatorial Guinea 1483 1049 879 835 694 minus19
Eritrea 678
Ethiopia 899 908
Gabon 851 802 763 630 588 minus09
Gambia 1462 1241 703 638 535 minus25
Ghana 1041 990 977 986 939 minus03
Guinea 977 914 863 879 879 minus03
Guinea-Bissau 1055 950 881 871 1048 minus00
Kenya 1004 901 899 742 610 minus13
Lesotho 712 535 536
Liberia 878 823 855 654 707 minus06
Madagascar 1047 975 981 900 918 minus03
Malawi 970 1077 944 994 989 00
Mali 971 970 969 939 940 minus01
Mauritania 682
Mauritius 1057 815
Mozambique 1148 928 811 866 824 minus08
Namibia 691 650 555 564 minus05
Niger 1199 991 941 882 945 minus06
Nigeria 1049 871 982 940 900 minus04
Rwanda 982 977 951 927 890 minus03
Senegal 1095 839 866 817 686 minus12
Seychelles 1055 547
Sierra Leone 946 888 840 751 898 minus01
Somalia 921 765 851 693 524 minus14
Sudan 998 1027 935 923 795 minus06
South Africa 1173 1325 1107 980 940 minus06
Swaziland 2814 1201 minus22
Tanzania Utd Rep 1027 947 1001 902 914 minus03
Togo 1066 966 910 940 840 minus06
Uganda 1010 979 999 965 933 minus02
Zambia 797 711 901 976 1005 06
Zimbabwe 1242 1039 1307 1094 538 minus21
142
TABLE 19 Trade and food security - caloric self-sufficiency (continued)Caloric self-sufficiency
pa
1970 1980 1990 2000 2009 growth1970-2009
ASIA 980 970 987 969 943 03
Central Asia 1138 1002
Kazakhstan 1628 1235
Kyrgyzstan 918 808
Tajikistan 625 574
Turkmenistan 939 895
Uzbekistan 833 841
East Asia 995 982 1017 997 970 minus01
Brunei Darussalam
Cambodia 1075 883 990 939 951 minus03
China 982 953 963 970 895 minus02
Indonesia 1002 964 1036 1039 1247 06
Korea DPR 920 943 906 635 903 minus00
Korea Republic of 755 533
Lao PDR 904 982 987 976 1027 03
Malaysia 925 1336 1540 1340 1455 12
Mongolia 791 845 929 586 627 minus06
Myanmar 1094 1054 1009 1019 1003 minus02
Philippines 1245 1204 1012 922 893 minus08
Singapore
Thailand 1296 1552 1784 1390 1421 02
Viet Nam 797 932 1094 1074 961 05
South Asia 969 955 957 934 906 minus02
Afghanistan 968 984 881 680 812 minus04
Bangladesh 901 894 906 848 800 minus03
Bhutan 834 936 776 707 952 03
India 979 983 1000 986 957 minus01
Iran (Islamic Rep) 958 714 690 606 650 minus10
Maldives
Nepal 1092 991 982 943 920 minus04
Pakistan 991 982 900 926 909 minus02
Sri Lanka 717 792 778 682 721 00
West Asia 868 890 824 876 832
Armenia 539
Azerbaijan 693 734
Bahrain
Cyprus 631
Georgia
Iraq 858
Jordan
Kuwait
Lebanon
Occupied PalestinianTerritory
Saudi Arabia 692
Syrian Arab Republic 724 841 657 679 560 minus07
Turkey 966 1018 921 955 933 minus01
United Arab Emirates
Yemen 709 543
LATIN AMERICA amp THECARIBBEAN
1078 1040 1049 1026 1125 minus06
Argentina 1708 1895 2095 2454 2736 12
Bahamas
Barbados 1754 597 514
Belize 2460 1539
Bolivia (Plur State) 827 870 1024 1201 1421 14
Brazil 1058 1071 1123 1124 1406 07
Chile 843 677 964 680 697 minus05
Colombia 982 925 965 839 783 minus06
Costa Rica 1170 1086 1007 949 910 minus06
143
TABLE 19 Trade and food security - caloric self-sufficiency (continued)Caloric self-sufficiency
pa
1970 1980 1990 2000 2009 growth1970-2009
Cuba 2382 2213 1486 594
Dominica 941 555 527 517 minus15
Dominican Republic 2375 1259 815 508 538 minus37
Ecuador 1080 982 989 1015 1008 minus02
El Salvador 974 880 804 664 701 minus08
French Guiana
Grenada 776 653 501
Guatemala 1000 1099 1054 1267 1199 05
Guyana 2957 2046 1337 2674 1695 minus14
Haiti 958 818 652 528 510 minus16
Honduras 1124 1096 1010 868 880 minus06
Jamaica 1124 559 565
Mexico 997 771 744 669 696 minus09
Netherlands Antilles
Nicaragua 1195 867 913 937 951 minus06
Panama 1103 1105 922 637 544 minus18
Paraguay 1035 1132 1580 1663
Peru 952 636 668 684 661 minus09
St Kitts amp Nevis 1537 1019 524
St Lucia 1012 892 919
St Vincent amp Grenadines 827 517 826
Suriname 834 1163 886 793 792 minus01
Trinidad amp Tobago 1058
Uruguay 1106 1210 1663 1350 2324 19
Venezuela (Boliv Rep of) 724 616 584 619 minus04
OCEANIA 1177 1169 1342 1388 1369 minus04
Fiji 2610 1943 1322
French Polynesia 915 860 600
New Caledonia
Papua New Guinea 1162 1127 1192 1354 1431 05
Samoa 1172 1340 931 836 729 minus12
Solomon Islands 1331 1745 1903 1340 1222 minus02
Tonga 1216 1160 810 793 759 minus12
Vanuatu 1555 1329 1392 1323 1078 minus09
DEVELOPED REGIONS 1064 1190 1181 1122 1140 18
NORTH AMERICA 1260 1612 1353 1321 1290 01
Bermuda
Canada 1585 1717 1538 1607 1832 04
United States of America 1226 1599 1328 1286 1238 00
ASIA amp OCEANIA 2321 1787 2667 2720 2040 minus02
Australia 2416 2907 2931 2075 minus04
Israel
Japan
New Zealand 1833 1787 1443 1646 1859 00
EUROPE 913 873 935 967 1012 03
Albania 875 973 792 601 615 minus09
Belarus 775 1036
Bosnia amp Herzegovina 548 625
Croatia 1016 1086
European Union 851 877 982 987 925 02
Iceland
Macedonia FYR 727 681
Montenegro
Norway 588 621 714 643 501 minus04
Republic of Moldova 1074 1333
Russian Federation 884 1131
Serbia 1262
Switzerland 551 716 662 627
Ukraine 1081 1933
144
TABLE 20 Trade and food security - import billsFood import bills Food + energy import bills share of GDP
total per capita
millionUS$
millionUS$
pa US$ US$ pa pa
2000 2010 growth2000-2010
2000 2010 growth2000-2010
2000 2010 growth2000-2010
WORLD 3980557 10296380 100 651 1495 87 33 58 58
DEVELOPING REGIONS 1162631 3731805 124 236 660 108 44 73 52
AFRICA 179991 597794 128 222 585 102 57 82 38
North Africa 87973 250019 110 620 1507 93 53 86 50
Algeria 25413 78633 120 832 2217 103 49 60 20
Egypt 32784 97155 115 485 1198 95 44 89 74
Libya 7941 15315 68 1518 2410 47 28 42 41
Morocco 15154 40877 104 526 1279 93 96 142 40
Tunisia 6546 18039 107 692 1721 95 72 96 29
Sub-Saharan Africa 92018 347775 142 138 406 114 60 80 30
Angola 6384 22925 136 458 1201 101 92 33 minus97
Benin 1120 6475 192 172 732 156 92 166 61
Botswana 2561 5778 85 1457 2879 70 63 120 66
Burkina Faso 931 2586 107 76 157 76 89 79 minus12
Burundi 270 1011 141 42 121 110 69 109 47
Cameroon 2542 11843 166 162 604 141 60 89 41
Cape Verde 593 1768 115 1357 3566 101 137 166 20
Central African Republic 242 719 115 65 163 96 32 62 70
Chad 415 2940 216 51 262 179 37 67 61
Comoros 119 605 177 211 823 146 80 128 48
Congo 995 7212 219 317 1784 188 34 83 94
Cocircte drsquoIvoire 3884 15493 148 234 785 129 117 150 25
Congo Dem Rep 2055 7116 132 41 108 101 68 84 21
Djibouti 374 1080 112 511 1215 90 73 118 49
Equatorial Guinea 332 2025 198 639 2893 163 65 189 112
Eritrea 1741 2244 26 475 427 minus10 257 143 minus57
Ethiopia 818 10336 289 12 125 259 41 88 79
Gabon 1380 4160 117 1117 2764 95 33 47 38
Gambia 613 958 46 473 555 16 138 147 07
Ghana 3348 16092 170 175 660 142 133 118 minus12
Guinea 1047 2455 89 125 246 70 72 122 55
Guinea-Bissau 97 670 213 78 442 189 35 125 135
Kenya 3846 14908 145 123 368 116 83 140 53
Lesotho 1226 2628 79 624 1210 68 343 155 minus77
Liberia 86 144 52 30 36 17 49 58 17
Madagascar 1207 3988 127 79 193 94 87 92 06
Malawi 518 1664 124 46 112 92 60 82 33
Mali 1144 4073 135 101 265 101 114 106 minus07
Mauritania 1071 5483 177 405 1585 146 141 272 68
Mauritius 2822 8861 121 2360 6821 112 111 181 50
Mozambique 1931 5066 101 106 217 74 75 112 40
Namibia 2126 3940 64 1121 1726 44 64 63 minus01
Niger 558 4720 238 51 304 195 80 170 78
Nigeria 14703 57626 146 119 364 118 41 47 12
Rwanda 425 2459 192 52 231 160 40 60 41
Senegal 3349 10256 118 352 825 89 146 192 28
Seychelles 304 1867 199 3850 21458 187 170 521 118
Sierra Leone 413 1694 152 100 289 112 131 264 73
Somalia 1411 6048 157 191 648 130
Sudan 3594 14751 152 105 339 124 37 29 minus25
South Africa 11075 40750 139 247 813 126 37 70 65
Swaziland 1792 4013 84 1684 3384 72 207 140 minus38
Tanzania Utd Rep 2208 7585 131 65 169 101 54 142 101
Togo 714 2051 111 149 340 86 131 208 48
Uganda 1766 5306 116 73 159 81 66 80 20
Zambia 694 2334 129 68 178 101 55 66 20
Zimbabwe 759 7845 263 61 624 263 226
145
TABLE 20 Trade and food security - import bills (continued)Food import bills Food + energy import bills share of GDP
total per capita
millionUS$
millionUS$
pa US$ US$ pa pa
2000 2010 growth2000-2010
2000 2010 growth2000-2010
2000 2010 growth2000-2010
ASIA 714793 2459868 132 199 611 118 51 82 50
Central Asia 9547 39240 152 172 646 141 54 56 04
Kazakhstan 3726 17041 164 249 1063 156 50 38 minus27
Kyrgyzstan 635 4573 218 128 857 209 140 280 71
Tajikistan 652 4582 215 106 666 202 309 204 minus41
Turkmenistan 1803 4291 91 400 851 78 40
Uzbekistan 2732 8754 124 110 319 112 37 51 32
East Asia 409084 1480333 137 216 725 129 57 88 44
Brunei Darussalam 1727 4502 101 5282 11283 79 29 46 47
Cambodia 938 5678 197 75 402 182 117 167 37
China 207426 837460 150 160 610 143 35 61 57
Indonesia 53 73 33
Korea DPR 2315 2171 minus06 101 89 minus12
Korea Republic of 71923 215999 116 1564 4483 111 85 156 63
Lao PDR 481 1632 130 91 263 113 67 92 32
Malaysia 33406 120525 137 1427 4244 115 78 147 66
Mongolia 778 3684 168 323 1337 153 179 207 15
Myanmar 2184 4950 85 49 103 78 65 40 minus48
Philippines 24056 58852 94 311 631 73 86 90 05
Singapore 32231 80440 96 8224 15816 68 206 448 81
Thailand 24502 82275 129 388 1190 119 81 151 64
Viet Nam 7115 60078 238 90 684 224 91 159 58
South Asia 95776 322413 129 66 189 112 34 83 94
Afghanistan 4174 6659 48 183 212 15 96
Bangladesh 11087 53509 170 86 360 154 37 76 74
Bhutan 220 1100 175 385 1515 147 85 159 65
India 31571 124317 147 30 102 130 26 93 136
Iran (Islamic Rep) 22803 62356 106 349 843 92 28 35 23
Maldives 774 1624 77 2834 5138 61 155 208 30
Nepal 1752 5754 126 72 192 103 72 107 41
Pakistan 15200 48709 124 105 281 103 69 100 38
Sri Lanka 8195 18386 84 437 881 73 83 93 11
West Asia 200387 617881 119 1130 2765 94 44 60 33
Armenia 1753 5934 130 570 1919 129 161 132 minus20
Azerbaijan 1996 9581 170 246 1043 155 49 24 minus68
Bahrain 7491 12547 53 11742 9942 minus16 104 73 minus35
Cyprus 3369 9773 112 3572 8852 95 89 115 26
Georgia 1434 8223 191 302 1889 201 92 157 55
Iraq 33338 83450 96 1397 2635 65 153
Jordan 8045 23347 112 1667 3774 85 118 227 68
Kuwait 9231 34226 140 4756 12505 102 26 32 24
Lebanon 9576 27103 110 2559 6410 96 115 159 33
Occupied PalestinianTerritory
4541 6448 36 1420 1596 12
Saudi Arabia 49863 148133 115 2488 5397 81 27 40 41
Syrian Arab Republic 6831 24656 137 427 1208 110 43 110 99
Turkey 17633 69629 147 277 957 132 35 55 46
United Arab Emirates 31295 98922 122 10318 13168 25 36 50 32
Yemen 7901 29831 142 446 1240 108 110 191 57
LATIN AMERICA amp THECARIBBEAN
258747 650107 97 496 1102 83 27 43 47
Argentina 11905 20384 55 322 504 46 07 14 66
Bahamas 2826 4630 51 9483 13498 36 89 147 51
Barbados 1080 3170 114 4028 11610 112 75 129 55
Belize 591 850 37 2353 2724 15 182 155 minus16
Bolivia (Plur State) 2394 3798 47 288 383 29 39 59 42
Brazil 35101 78639 84 201 403 72 18 24 25
Chile 11818 44242 141 766 2585 129 56 113 73
Colombia 13256 38065 111 333 822 94 16 25 49
Costa Rica 4059 11415 109 1036 2450 90 59 96 51
146
TABLE 20 Trade and food security - import bills (continued)Food import bills Food + energy import bills share of GDP
total per capita
millionUS$
millionUS$
pa US$ US$ pa pa
2000 2010 growth2000-2010
2000 2010 growth2000-2010
2000 2010 growth2000-2010
Cuba 7509 18935 97 676 1682 95
Dominica 273 460 54 3896 6759 57 153 222 38
Dominican Republic 7653 18710 94 891 1885 78 97 108 11
Ecuador 2997 17957 196 243 1241 177 36 83 89
El Salvador 6871 13533 70 1157 2185 66 98 128 27
French Guiana
Grenada 391 570 38 3836 5481 36 140 161 14
Guatemala 5612 17487 120 499 1215 93 69 113 51
Guyana 1074 1680 46 1466 2229 43 186 253 31
Haiti 3301 14633 161 382 1464 144 100 246 94
Honduras 5388 11595 80 866 1526 58 127 188 40
Jamaica 4677 7485 48 1811 2731 42 117 209 60
Mexico 82457 186109 85 825 1641 71 20 48 91
Netherlands Antilles 1124 1466 27 6243 7292 16
Nicaragua 2562 7105 107 505 1228 93 141 278 70
Panama 3690 9770 102 1248 2778 83 86 51 minus51
Paraguay 1585 4199 102 297 651 82 72 114 46
Peru 8304 29975 137 321 1031 124 37 57 44
St Kitts amp Nevis 314 487 45 6828 9373 32 141 131 minus07
St Lucia 571 274 minus71 3639 1572 minus80 184 492 103
St Vincent amp Grenadines 398 708 59 3683 6494 58 163 271 52
Suriname 582 2033 133 1247 3873 120 99 107 08
Trinidad amp Tobago 2561 7088 107 1983 5286 103 162 130 minus22
Uruguay 3455 8785 98 1041 2608 96 38 102 103
Venezuela (Boliv Rep of) 17548 60738 132 721 2096 113 20 22 13
OCEANIA 9099 24035 102 1122 2414 80 336 346 03
Fiji 1023 2604 98 1259 3025 92 90 257 111
French Polynesia 1886 3682 69 7924 13585 55
New Caledonia 1242 3050 94 5859 12151 76
Papua New Guinea 1789 6057 130 333 883 103 116 141 20
Samoa 250 722 112 1411 3948 108 178 227 25
Solomon Islands 101 862 240 246 1602 206 87 271 120
Tonga 131 490 141 1341 4710 134 126 282 84
Vanuatu 124 507 151 672 2111 121 75 169 85
DEVELOPED REGIONS 2817926 6564575 88 2361 5288 84 30 51 56
NORTH AMERICA 523687 1042686 71 1672 3026 61 19 33 55
Bermuda 313 1349 157 4964 20751 154
Canada 107827 241046 84 3516 7086 73 32 47 40
United States of America 414893 798725 68 1469 2573 58 18 31 56
ASIA amp OCEANIA 41 3163 4565 37 26 48 63
Australia 25799 82915 124 1346 3724 107 20 35 56
Israel 17637 46462 102 2932 6263 79 43 34 minus22
Japan 436892 575640 28 3475 4549 27 26 51 70
New Zealand 9144 28151 119 2370 6445 105 44 63 35
EUROPE 1804766 4788721 103 2488 6500 101 44 68 44
Albania 1978 6375 124 644 1990 119 81 105 26
Belarus 9010 24432 105 896 2546 110 335 294 minus13
Bosnia amp Herzegovina 6704 14597 81 1815 3882 79 166 157 minus05
Croatia 5845 19002 125 1297 4316 128 81 90 10
European Union 1630103 4127225 97 3385 8245 93 44 70 47
Iceland 2054 3803 64 7310 11886 50 51 74 37
Macedonia FYR 2299 6631 112 1144 3217 109 145 156 08
Montenegro 4438 7033 173
Norway 19698 53402 105 4386 10936 96 19 27 38
Republic of Moldova 518 4516 242 126 1264 259 189 181 minus04
Russian Federation 83028 391496 168 566 2739 171 40 36 minus11
Serbia 8668 879 92
Switzerland 34857 82665 90 4863 10786 83 29 43 41
Ukraine 6999 48454 213 143 1066 222 214 208 minus03
147
TABLE 21 Dimensions of povertyPoverty gap at Poverty headcount ratio Multi-
dimensional
$125 aday (ppp)
$2 a day(ppp)
nationalpovertyline
ruralpovertyline
$125 aday (ppp)
$2 a day(ppp)
nationalpovertyline
ruralpovertyline
poverty(MPI)
0 to 1
2009 2009 2009 2009 2009 2009 2009 2009 2009
WORLD
DEVELOPING REGIONS
AFRICA
North Africa
Algeria 14 65 32 45 68 236 226 303
Egypt 04 35 36 20 185 220 300 00
Libya
Morocco 05 31 25 140 90 145 00
Tunisia 05 30 25 128 38 00
Sub-Saharan Africa
Angola 299 424 543 702 05
Benin 157 335 120 140 473 753 390 460 04
Botswana 110 223 117 184 312 494 306 448
Burkina Faso 203 393 153 176 565 812 464 524 05
Burundi 364 561 234 242 813 935 669 689 05
Cameroon 12 82 123 175 96 304 399 550 03
Cape Verde 60 152 81 143 210 409 266 443
Central African Republic 313 468 331 350 628 801 620 694 05
Chad 256 439 216 233 619 833 550 586 03
Comoros 208 342 163 178 461 650 448 487 04
Congo 228 388 189 206 541 744 501 577 02
Cocircte drsquoIvoire 75 178 153 203 238 463 427 542 04
Congo Dem Rep 253 424 322 349 592 796 713 757 04
Djibouti 53 146 188 412 01
Equatorial Guinea
Eritrea 690
Ethiopia 96 289 83 85 390 776 389 393 06
Gabon 09 50 100 160 48 196 327 446 02
Gambia 121 249 251 305 343 567 580 678 03
Ghana 105 223 96 135 300 536 285 392 01
Guinea 150 310 176 220 433 696 530 630 05
Guinea-Bissau 165 348 250 278 488 779 647 691
Kenya 61 151 163 175 197 399 459 491 02
Lesotho 208 331 379 265 434 623 566 605 02
Liberia 408 595 244 263 837 948 638 677 05
Madagascar 265 469 268 289 678 896 687 735 04
Malawi 323 518 80 86 739 905 524 559 04
Mali 188 365 167 514 771 474 576 06
Mauritania 57 159 170 241 212 441 463 612 04
Mauritius
Mozambique 252 429 212 222 600 816 547 569 05
Namibia 246 365 130 160 491 622 380 490 02
Niger 119 306 196 212 431 759 595 639 06
Nigeria 296 469 228 266 644 839 547 638 03
Rwanda 409 572 240 260 768 896 585 642 04
Senegal 108 247 164 215 335 604 508 619 04
Seychelles 01 03 02 18
Sierra Leone 203 375 275 346 534 761 664 785 04
Somalia 05
Sudan
South Africa 33 123 70 174 357 230 01
Swaziland 294 458 329 370 629 810 692 750 02
Tanzania Utd Rep 281 475 99 110 679 879 334 374 04
Togo 114 279 229 293 387 693 617 743 03
Uganda 83 213 68 76 287 553 245 272 04
Zambia 328 483 285 388 643 815 593 768 03
Zimbabwe 160 720 440 02
148
TABLE 21 Dimensions of poverty (continued)Poverty gap at Poverty headcount ratio Multi-
dimensional
$125 aday (ppp)
$2 a day(ppp)
nationalpovertyline
ruralpovertyline
$125 aday (ppp)
$2 a day(ppp)
nationalpovertyline
ruralpovertyline
poverty(MPI)
0 to 1
2009 2009 2009 2009 2009 2009 2009 2009 2009
ASIA
Central Asia
Kazakhstan 01 03 31 45 02 15 154 217 00
Kyrgyzstan 01 55 100 120 19 294 431 508 00
Tajikistan 51 168 124 124 215 509 472 492 01
Turkmenistan 70 184 248 497
Uzbekistan 150 332 463 767 00
East Asia
Brunei Darussalam
Cambodia 61 202 72 83 283 565 301 345 03
China 40 122 159 363 28 25
Indonesia 36 155 25 31 187 506 142 174 01
Korea DPR
Korea Republic of
Lao PDR 89 248 339 660 276 317 03
Malaysia 00 02 08 18 00 23 38 82
Mongolia 62 172 101 134 224 491 352 466 01
Myanmar 02
Philippines 55 164 27 152 226 450 265 507 01
Singapore
Thailand 19 83 30 108 265 81 104 00
Viet Nam 23 109 35 46 131 385 145 187 01
South Asia
Afghanistan 79 83 360 375
Bangladesh 131 338 90 98 496 813 400 438 03
Bhutan 70 188 61 81 262 495 232 309 01
India 105 295 416 756 275 283 03
Iran (Islamic Rep) 03 18 14 80
Maldives 01 25 15 122 00
Nepal 197 378 75 85 551 776 309 346 03
Pakistan 43 187 226 603 223 270 03
Sri Lanka 10 74 31 32 70 291 152 157 00
West Asia
Armenia 02 23 49 121 13 124 265 255 00
Azerbaijan 02 15 20 10 78 158 185 00
Bahrain
Cyprus
Georgia 46 118 72 92 147 326 236 297 00
Iraq 06 55 45 90 40 253 229 393 01
Jordan 01 06 26 04 35 133 190 00
Kuwait
Lebanon
Occupied PalestinianTerritory
Saudi Arabia
Syrian Arab Republic 02 33 17 169 00
Turkey 09 26 27 91 181 387 00
United Arab Emirates 00
Yemen 42 148 89 106 175 466 348 401 03
LATIN AMERICA amp THECARIBBEAN
Argentina 04 08 09 24 00
Bahamas
Barbados
Belize 47 97 121 240 335 442 00
Bolivia (Plur State) 58 109 140 247 601 773 01
Brazil 11 32 38 99 214 00
Chile 04 08 08 24 151 129
Colombia 57 119 160 279 455 643 00
Costa Rica 01 11 07 54 217 230
149
TABLE 21 Dimensions of poverty (continued)Poverty gap at Poverty headcount ratio Multi-
dimensional
$125 aday (ppp)
$2 a day(ppp)
nationalpovertyline
ruralpovertyline
$125 aday (ppp)
$2 a day(ppp)
nationalpovertyline
ruralpovertyline
poverty(MPI)
0 to 1
2009 2009 2009 2009 2009 2009 2009 2009 2009
Cuba
Dominica
Dominican Republic 09 39 43 136 505 571 00
Ecuador 16 44 51 134 360 575 00
El Salvador 11 45 51 152 378 465
French Guiana
Grenada
Guatemala 65 129 169 298 510 705 01
Guyana 39 69 77 168 01
Haiti 282 418 549 722 770 880 03
Honduras 119 182 233 354 588 644 02
Jamaica 00 09 02 58 99 251
Mexico 17 32 34 81 474 608 00
Netherlands Antilles
Nicaragua 52 123 158 319 462 679 01
Panama 31 71 95 179 327 598
Paraguay 15 43 51 132 351 498 01
Peru 14 47 59 147 348 603 01
St Kitts amp Nevis
St Lucia 72 155 209 406
St Vincent amp Grenadines
Suriname 59 117 155 272 00
Trinidad amp Tobago 11 39 42 135 00
Uruguay 00 00 00 02 205 222 00
Venezuela (Boliv Rep of) 11 32 35 101 290
OCEANIA
Fiji 101 148 310 433
French Polynesia
New Caledonia
Papua New Guinea 123 255 124 138 358 574 375 413
Samoa
Solomon Islands
Tonga
Vanuatu 01
DEVELOPED REGIONS
NORTH AMERICA
Bermuda
Canada
United States of America
ASIA amp OCEANIA
Australia
Israel
Japan
New Zealand
EUROPE
Albania 02 08 23 26 06 42 124 146 00
Belarus 00 00 00 00 54
Bosnia amp Herzegovina 00 01 46 49 00 02 140 178 00
Croatia 00 00 26 00 00 111 00
European Union
Iceland
Macedonia FYR 00 07 72 77 03 43 190 213 00
Montenegro 00 00 09 14 00 00 49 89 00
Norway
Republic of Moldova 03 26 19 125 290 00
Russian Federation 00 00 27 55 00 01 111 212 00
Serbia 01 02 13 20 01 07 66 98 00
Switzerland
Ukraine 00 01 15 23 01 05 79 113 00
150
TABLE 22 Dimensions of inequalityHuman Development Index Gender
inequalityIndex
Gini-index Income share held by
inequalityadjusted
incomedistribution
highest20
lowest20
index index index index
2010 2010 2008 2009 2009 2009
WORLD
DEVELOPING REGIONS
AFRICA
North Africa
Algeria 07 06 353
Egypt 06 04 07 321 415 90
Libya 07 05
Morocco 06 04 07 409 479 65
Tunisia 07 05 05 408 473 60
Sub-Saharan Africa
Angola 04 02 586 619 20
Benin 04 03 07 386 461 70
Botswana 06 06 610
Burkina Faso 03 02 396 471 70
Burundi 03 02 06 333 428 90
Cameroon 05 03 07 446 462 67
Cape Verde 05 504 559 45
Central African Republic 03 02 08 436 606 34
Chad 03 02 398 466 63
Comoros 04 02 643 680 25
Congo 05 03 07 473 531 50
Cocircte drsquoIvoire 04 03 07 415 476 56
Congo Dem Rep 02 02 08
Djibouti 04 03 399 465 60
Equatorial Guinea 05
Eritrea
Ethiopia 03 02 298 394 93
Gabon 06 05 06 415 482 62
Gambia 04 02 07 473 528 48
Ghana 05 03 07 428 485 52
Guinea 03 02 394 462 63
Guinea-Bissau 03 02 355 432 73
Kenya 05 03 07 477 532 48
Lesotho 04 03 07 525 564 30
Liberia 03 02 08 382 450 64
Madagascar 04 03 472 535 62
Malawi 04 03 07 390 465 70
Mali 03 02 08 390 460 65
Mauritania 04 03 07 390 457 62
Mauritius 07
Mozambique 03 02 07 456 515 52
Namibia 06 03 06 743
Niger 03 02 08 340 428 83
Nigeria 04 02 429 486 51
Rwanda 04 02 06 531 582 42
Senegal 04 03 07 392 459 62
Seychelles 658 696 37
Sierra Leone 03 02 08 425 493 61
Somalia
Sudan 04 07
South Africa 06 04 06 578 722 25
Swaziland 05 03 07 507 559 45
Tanzania Utd Rep 04 03 376 448 68
Togo 04 03 07 344 424 76
Uganda 04 03 07 443 493 61
Zambia 04 03 07 507 552 36
Zimbabwe 01 01 07 501
151
TABLE 22 Dimensions of inequality (continued)Human Development Index Gender
inequalityIndex
Gini-index Income share held by
inequalityadjusted
incomedistribution
highest20
lowest20
index index index index
2010 2010 2008 2009 2009 2009
ASIA
Central Asia
Kazakhstan 07 06 05 309 399 87
Kyrgyzstan 06 05 05 334 428 88
Tajikistan 06 05 05 336 417 78
Turkmenistan 07 05 408
Uzbekistan 06 05 367 442 71
East Asia
Brunei Darussalam 08
Cambodia 05 04 06 444 517 66
China 05 04 415 478 57
Indonesia 06 05 07 368 455 74
Korea DPR
Korea Republic of 09 07 03 316
Lao PDR 05 04 06 367 448 76
Malaysia 07 04 462 448 65
Mongolia 06 05 05 365 405 72
Myanmar 04
Philippines 06 05 06 440 504 56
Singapore 08 02 425
Thailand 06 05 05 536 493 62
Viet Nam 06 05 05 376 454 73
South Asia
Afghanistan 03 08 294 387 90
Bangladesh 05 03 07 310 408 94
Bhutan 467 530 54
India 05 04 07 368 453 81
Iran (Islamic Rep) 07 06 383 452 64
Maldives 06 05 05 374 442 65
Nepal 04 03 07 473 540 59
Pakistan 05 03 07 327 421 90
Sri Lanka 07 05 06 403 478 69
West Asia
Armenia 07 06 05 309 398 88
Azerbaijan 07 06 05 337 421 80
Bahrain 08 05
Cyprus 08 07 03
Georgia 07 06 06 413 471 53
Iraq 07 399 87
Jordan 07 06 06 377 455 73
Kuwait 08 05
Lebanon
Occupied PalestinianTerritory
Saudi Arabia 07 08
Syrian Arab Republic 06 05 06 358 439 77
Turkey 07 05 06 397 489 52
United Arab Emirates 08 04
Yemen 04 03 08 377
LATIN AMERICA amp THECARIBBEAN
Argentina 08 06 05 458 531 36
Bahamas 08 07
Barbados 08 05
Belize 07 05 06 544
Bolivia (Plur State) 06 04 06 573 610 28
Brazil 07 05 06 539 585 32
Chile 08 06 05 521 572 43
Colombia 07 05 06 585 621 25
Costa Rica 07 06 05 503 523 44
152
TABLE 22 Dimensions of inequality (continued)Human Development Index Gender
inequalityIndex
Gini-index Income share held by
inequalityadjusted
incomedistribution
highest20
lowest20
index index index index
2010 2010 2008 2009 2009 2009
Cuba 05
Dominica
Dominican Republic 07 05 06 484 536 44
Ecuador 07 06 06 490 589 36
El Salvador 07 05 06 469 519 47
French Guiana
Grenada
Guatemala 06 04 07 537 580 35
Guyana 06 05 06 432
Haiti 04 02 07 595 630 25
Honduras 06 04 06 577 607 20
Jamaica 07 06 06 455 516 53
Mexico 07 06 06 517 562 38
Netherlands Antilles
Nicaragua 06 04 06 523 569 38
Panama 08 05 06 523 586 27
Paraguay 06 05 06 520 565 38
Peru 07 05 06 480 543 40
St Kitts amp Nevis
St Lucia 426
St Vincent amp Grenadines
Suriname 06 05 528
Trinidad amp Tobago 07 06 05 403
Uruguay 08 06 05 424 515 46
Venezuela (Boliv Rep of) 07 05 06 435 490 49
OCEANIA
Fiji 07
French Polynesia
New Caledonia
Papua New Guinea 04 08 509
Samoa
Solomon Islands 05
Tonga 07
Vanuatu
DEVELOPED REGIONS
NORTH AMERICA
Bermuda
Canada 09 08 03 326 399 72
United States of America 09 08 05 408 458 54
ASIA amp OCEANIA
Australia 09 09 03 352
Israel 09 08 03 392 449 57
Japan 09 03 249
New Zealand 09 03 362
EUROPE
Albania 07 06 05 345 430 81
Belarus 07 07 272 364 92
Bosnia amp Herzegovina 07 06 362 432 67
Croatia 08 07 04 336 420 81
European Union
Iceland 09 08 03
Macedonia FYR 07 06 442 503 54
Montenegro 07 300 388 85
Norway 09 09 02 258 372 96
Republic of Moldova 06 05 05 380 453 68
Russian Federation 07 06 05 423 489 60
Serbia 07 282
Switzerland 09 08 02 337 413 75
Ukraine 07 07 05 275 371 94
153
TABLE 23 GovernanceVoice ampaccount-ability
Politicalstabilityabsence ofviolence ampterrorism
Govern-ment
effectiveness
Regulatoryquality
Rule oflaw
Control ofcorruption
Averagegovernance
-25 to 25(lowest tohighest)
-25 to 25(lowest tohighest)
-25 to 25(lowest tohighest)
-25 to 25(lowest tohighest)
-25 to 25(lowest tohighest)
-25 to 25(lowest tohighest)
-25 to 25(lowest tohighest)
2010 2010 2010 2010 2010 2010 2010
WORLD
DEVELOPING REGIONS
AFRICA
North Africa
Algeria minus10 minus13 minus06 minus11 minus08 minus05 minus09
Egypt minus12 minus09 minus04 minus02 minus01 minus06 minus06
Libya minus19 minus01 minus12 minus12 minus10 minus13 minus11
Morocco minus08 minus05 minus02 minus01 minus02 minus02 minus03
Tunisia minus13 01 02 minus00 01 minus01 minus02
Sub-Saharan Africa
Angola minus11 minus02 minus11 minus10 minus12 minus13 minus10
Benin 03 03 minus05 minus03 minus07 minus08 minus03
Botswana 04 09 05 05 07 10 07
Burkina Faso minus02 minus01 minus06 minus01 minus02 minus04 minus03
Burundi minus09 minus15 minus11 minus11 minus12 minus11 minus12
Cameroon minus11 minus06 minus09 minus07 minus10 minus10 minus09
Cape Verde 09 08 minus01 minus01 04 08 05
Central African Republic minus11 minus21 minus14 minus11 minus13 minus08 minus13
Chad minus14 minus15 minus15 minus11 minus15 minus13 minus14
Comoros minus04 minus04 minus17 minus15 minus11 minus07 minus10
Congo minus10 minus02 minus12 minus13 minus11 minus11 minus10
Cocircte drsquoIvoire minus11 minus16 minus13 minus09 minus12 minus11 minus12
Congo Dem Rep minus14 minus22 minus17 minus16 minus16 minus14 minus17
Djibouti minus11 03 minus10 minus07 minus07 minus03 minus06
Equatorial Guinea minus19 02 minus17 minus14 minus13 minus15 minus12
Eritrea minus22 minus09 minus14 minus22 minus13 minus05 minus14
Ethiopia minus13 minus17 minus03 minus09 minus08 minus07 minus10
Gabon minus09 02 minus09 minus06 minus05 minus08 minus06
Gambia minus11 01 minus07 minus04 minus05 minus06 minus05
Ghana 05 00 minus00 01 minus01 01 01
Guinea minus09 minus18 minus11 minus11 minus15 minus12 minus13
Guinea-Bissau minus09 minus08 minus10 minus11 minus14 minus11 minus10
Kenya minus02 minus12 minus05 minus01 minus10 minus09 minus07
Lesotho minus02 05 minus04 minus06 minus03 02 minus01
Liberia minus02 minus05 minus12 minus11 minus10 minus05 minus07
Madagascar minus08 minus11 minus08 minus06 minus08 minus03 minus07
Malawi minus02 01 minus04 minus06 minus01 minus04 minus03
Mali 02 minus03 minus09 minus05 minus05 minus07 minus04
Mauritania minus09 minus13 minus09 minus08 minus09 minus07 minus09
Mauritius 07 05 08 08 08 07 07
Mozambique minus01 03 minus05 minus04 minus05 minus04 minus03
Namibia 03 08 01 01 02 03 03
Niger minus06 minus11 minus07 minus05 minus06 minus07 minus07
Nigeria minus08 minus20 minus12 minus08 minus12 minus10 minus12
Rwanda minus13 minus01 minus01 minus02 minus03 05 minus02
Senegal minus03 minus04 minus05 minus03 minus04 minus07 minus04
Seychelles 01 08 02 minus06 00 03 01
Sierra Leone minus02 minus02 minus12 minus07 minus09 minus08 minus07
Somalia minus20 minus31 minus22 minus24 minus24 minus17 minus23
Sudan minus17 minus27 minus14 minus14 minus13 minus13 minus16
South Africa 05 minus00 03 04 01 01 02
Swaziland minus13 minus01 minus05 minus06 minus05 minus02 minus05
Tanzania Utd Rep minus01 minus00 minus05 minus04 minus05 minus05 minus03
Togo minus10 minus02 minus14 minus09 minus09 minus10 minus09
Uganda minus05 minus11 minus06 minus01 minus04 minus09 minus06
Zambia minus03 05 minus08 minus05 minus05 minus06 minus04
Zimbabwe minus15 minus12 minus16 minus20 minus18 minus14 minus16
154
TABLE 23 Governance (continued)Voice ampaccount-ability
Politicalstabilityabsence ofviolence ampterrorism
Govern-ment
effectiveness
Regulatoryquality
Rule oflaw
Control ofcorruption
Averagegovernance
-25 to 25(lowest tohighest)
-25 to 25(lowest tohighest)
-25 to 25(lowest tohighest)
-25 to 25(lowest tohighest)
-25 to 25(lowest tohighest)
-25 to 25(lowest tohighest)
-25 to 25(lowest tohighest)
2010 2010 2010 2010 2010 2010 2010
ASIA
Central Asia
Kazakhstan minus11 05 minus03 minus03 minus06 minus10 minus05
Kyrgyzstan minus10 minus10 minus06 minus02 minus13 minus11 minus09
Tajikistan minus14 minus09 minus09 minus11 minus12 minus12 minus11
Turkmenistan minus20 02 minus16 minus21 minus15 minus14 minus14
Uzbekistan minus20 minus08 minus08 minus16 minus14 minus13 minus13
East Asia
Brunei Darussalam minus07 12 09 11 08 09 07
Cambodia minus09 minus06 minus08 minus05 minus11 minus12 minus08
China minus16 minus08 01 minus02 minus03 minus06 minus06
Indonesia minus01 minus09 minus02 minus04 minus06 minus07 minus05
Korea DPR minus22 minus05 minus19 minus24 minus13 minus13 minus16
Korea Republic of 07 01 12 09 10 04 07
Lao PDR minus16 minus02 minus09 minus10 minus09 minus11 minus10
Malaysia minus05 01 11 06 05 01 03
Mongolia 00 05 minus06 minus03 minus04 minus07 minus03
Myanmar minus21 minus13 minus17 minus22 minus15 minus17 minus17
Philippines minus01 minus16 minus01 minus03 minus05 minus08 minus06
Singapore minus03 11 22 18 17 22 15
Thailand minus06 minus12 01 02 minus02 minus03 minus03
Viet Nam minus14 01 minus03 minus06 minus05 minus06 minus05
South Asia
Afghanistan minus15 minus26 minus15 minus16 minus19 minus16 minus18
Bangladesh minus03 minus14 minus08 minus09 minus08 minus10 minus09
Bhutan minus05 07 06 minus11 01 08 01
India 04 minus13 minus00 minus04 minus01 minus05 minus03
Iran (Islamic Rep) minus16 minus16 minus05 minus16 minus09 minus09 minus12
Maldives minus01 minus00 minus02 minus04 minus03 minus06 minus03
Nepal minus05 minus17 minus08 minus07 minus10 minus07 minus09
Pakistan minus08 minus27 minus08 minus06 minus08 minus11 minus11
Sri Lanka minus05 minus08 minus02 minus02 minus01 minus04 minus04
West Asia
Armenia minus09 00 minus02 03 minus05 minus07 minus03
Azerbaijan minus13 minus03 minus08 minus04 minus09 minus12 minus08
Bahrain minus09 minus03 06 08 04 02 01
Cyprus 11 04 15 14 12 11 11
Georgia minus02 minus07 03 06 minus02 minus02 minus01
Iraq minus11 minus23 minus12 minus11 minus16 minus13 minus14
Jordan minus08 minus03 01 02 02 00 minus01
Kuwait minus05 04 01 02 05 03 02
Lebanon minus03 minus15 minus03 00 minus07 minus08 minus06
Occupied PalestinianTerritory
Saudi Arabia minus18 minus02 minus01 01 02 01 minus03
Syrian Arab Republic minus17 minus08 minus06 minus09 minus05 minus11 minus09
Turkey minus02 minus10 04 04 01 00 minus01
United Arab Emirates minus09 08 08 04 04 10 04
Yemen minus13 minus22 minus10 minus06 minus11 minus11 minus12
LATIN AMERICA amp THECARIBBEAN
Argentina 03 minus00 minus02 minus07 minus06 minus04 minus03
Bahamas 10 10 10 05 07 14 09
Barbados 12 11 14 05 10 14 11
Belize 07 minus00 minus04 minus05 minus04 minus01 minus01
Bolivia (Plur State) minus01 minus04 minus05 minus08 minus11 minus05 minus06
Brazil 05 00 01 02 00 01 01
Chile 10 06 12 14 13 15 12
Colombia minus02 minus15 01 03 minus03 minus04 minus03
Costa Rica 10 06 03 05 05 07 06
155
TABLE 23 Governance (continued)Voice ampaccount-ability
Politicalstabilityabsence ofviolence ampterrorism
Govern-ment
effectiveness
Regulatoryquality
Rule oflaw
Control ofcorruption
Averagegovernance
-25 to 25(lowest tohighest)
-25 to 25(lowest tohighest)
-25 to 25(lowest tohighest)
-25 to 25(lowest tohighest)
-25 to 25(lowest tohighest)
-25 to 25(lowest tohighest)
-25 to 25(lowest tohighest)
2010 2010 2010 2010 2010 2010 2010
Cuba minus16 03 minus02 minus16 minus06 05 minus05
Dominica 10 10 07 04 07 07 08
Dominican Republic 01 00 minus06 minus02 minus08 minus08 minus04
Ecuador minus03 minus06 minus07 minus11 minus12 minus09 minus08
El Salvador 00 01 00 04 minus09 minus02 minus01
French Guiana 11 02 12 12 12 11 10
Grenada 08 06 02 04 01 04 04
Guatemala minus04 minus08 minus07 minus02 minus10 minus05 minus06
Guyana 00 minus05 minus01 minus05 minus05 minus06 minus04
Haiti minus07 minus09 minus16 minus11 minus14 minus13 minus12
Honduras minus05 minus05 minus07 minus02 minus09 minus09 minus06
Jamaica 04 minus04 02 03 minus05 minus04 minus01
Mexico 01 minus08 02 03 minus06 minus04 minus02
Netherlands Antilles 04 11 07 09 09 09 08
Nicaragua minus05 minus06 minus10 minus04 minus08 minus08 minus07
Panama 05 00 01 04 minus01 minus04 01
Paraguay minus01 minus09 minus09 minus04 minus09 minus08 minus07
Peru 00 minus09 minus02 05 minus06 minus02 minus02
St Kitts amp Nevis 11 11 07 04 07 10 09
St Lucia 12 08 08 04 08 12 09
St Vincent amp Grenadines 12 09 07 04 09 10 09
Suriname 04 01 minus01 minus07 minus01 minus04 minus01
Trinidad amp Tobago 05 minus00 03 05 minus02 minus04 01
Uruguay 11 09 07 04 07 13 08
Venezuela (Boliv Rep of) minus09 minus14 minus10 minus16 minus16 minus12 minus13
OCEANIA
Fiji minus10 minus01 minus07 minus07 minus09 minus09 minus07
French Polynesia
New Caledonia minus02
Papua New Guinea 01 minus08 minus08 minus05 minus09 minus11 minus07
Samoa
Solomon Islands 01 04 minus09 minus12 minus07 minus05 minus05
Tonga 03 08 minus03 minus05 01 minus03 minus00
Vanuatu 05 14 minus03 minus08 03 04 02
DEVELOPED REGIONS
NORTH AMERICA
Bermuda 10 09 10 14 12 13 11
Canada 14 09 19 17 18 21 16
United States of America 12 03 14 14 16 12 12
ASIA amp OCEANIA
Australia 14 08 18 17 18 21 16
Israel 06 minus15 12 12 09 06 05
Japan 10 09 14 10 13 15 12
New Zealand 15 12 19 18 19 24 18
EUROPE
Albania 01 minus02 minus03 02 minus04 minus04 minus02
Belarus minus16 minus01 minus11 minus12 minus10 minus08 minus10
Bosnia amp Herzegovina minus01 minus07 minus07 minus01 minus04 minus03 minus04
Croatia 04 06 06 06 02 00 04
European Union
Iceland 14 10 16 09 17 19 14
Macedonia FYR 01 minus05 minus02 03 minus03 minus01 minus01
Montenegro 02 05 01 minus01 minus00 minus03 01
Norway 16 13 18 15 19 21 17
Republic of Moldova minus01 minus04 minus06 minus01 minus04 minus07 minus04
Russian Federation minus09 minus09 minus04 minus04 minus08 minus11 minus07
Serbia 03 minus04 minus01 minus00 minus04 minus02 minus01
Switzerland 16 12 19 17 18 21 17
Ukraine minus01 minus01 minus08 minus06 minus08 minus10 minus06
156
TABLE 24 Education health and sanitationLiteracyratefemale
Ratio of girls-to-boys Expendi-ture perstudent
Public expon
education
Health expenditure Prevalenceof HIV
Access to improved
out ofprimaryschool
in primand seceducation
share ofGDP percapita
share ofGDP
currentper capita
share ofGDP
ages15-49
sanitationfacilities
water source
ratio US$ rur urb
2009 2009 2009 2009 2009 2009 2009 2009 2008 2008 2008
WORLD 792 963 44 8600 101 08 61 78 96
DEVELOPING REGIONS
AFRICA
North Africa
Algeria 639 07 993 285 43 2680 58 01 95 79 85
Egypt 578 05 951 38 1130 50 01 94 98 100
Libya 820 00 1050 239 27 4170 39 97
Morocco 439 08 881 872 56 1560 55 01 69 60 98
Tunisia 710 09 1030 507 71 2400 62 01 85 84 99
Sub-Saharan Africa
Angola 576 08 820 1269 26 2040 46 20 57 38 60
Benin 291 01 735 134 35 319 42 12 12 69 84
Botswana 844 12 1000 3014 89 6120 103 248 60 90 99
Burkina Faso 216 08 856 3663 46 381 64 12 11 72 95
Burundi 609 90 927 6009 83 198 131 33 46 71 83
Cameroon 630 02 856 728 37 611 56 53 47 51 92
Cape Verde 802 09 1030 828 59 1460 39 54 82 85
Central African Republic 421 05 687 1448 13 193 43 47 34 51 92
Chad 231 06 636 2488 32 418 70 34 9 44 67
Comoros 687 06 842 272 76 278 34 01 36 97 91
Congo 09 919 29 18 701 30 34 30 34 95
Cocircte drsquoIvoire 453 08 686 1191 46 553 51 34 23 68 93
Congo Dem Rep 549 768 156 95 23 80
Djibouti 09 820 573 84 845 70 25 56 52 98
Equatorial Guinea 898 10 825 40 06 7090 39 50
Eritrea 560 09 773 11356 20 101 21 08 14 57 74
Ethiopia 180 07 879 6642 55 147 43 12 26 98
Gabon 841 10 959 38 2660 35 52 33 41 95
Gambia 358 11 1020 322 20 256 60 20 67 86 96
Ghana 604 11 954 288 54 451 69 18 13 74 90
Guinea 281 07 772 1164 24 188 57 13 19 61 89
Guinea-Bissau 380 07 655 52 184 61 25 21 51 83
Kenya 835 11 954 436 70 332 43 63 31 52 83
Lesotho 953 12 1070 778 124 700 82 236 29 81 97
Liberia 545 04 719 141 28 294 132 15 17 51 79
Madagascar 616 53 969 1581 30 180 41 02 11 29 71
Malawi 670 18 1000 321 42 191 62 110 56 77 95
Mali 182 05 784 1633 44 384 56 10 36 44 81
Mauritania 503 13 1030 736 29 219 25 07 26 47 52
Mauritius 853 13 1010 245 32 3830 57 10 91 99 100
Mozambique 415 05 883 998 50 247 57 115 17 29 77
Namibia 881 16 1040 315 64 2580 60 131 33 88 99
Niger 151 08 753 5143 45 209 61 08 9 39 96
Nigeria 498 09 851 08 693 58 36 32 42 75
Rwanda 668 18 1000 2521 41 482 90 29 54 62 77
Senegal 387 11 955 2169 58 589 57 09 51 52 92
Seychelles 923 15 1030 340 50 3660 40 100
Sierra Leone 301 06 840 251 43 439 131 16 13 26 86
Somalia 09 535 04 07 23 9 67
Sudan 608 09 894 121 946 73 11 34 52 64
South Africa 870 12 994 328 54 4850 85 178 77 78 99
Swaziland 862 11 921 491 78 1560 63 259 55 61 92
Tanzania Utd Rep 669 15 961 409 68 253 51 56 24 45 80
Togo 444 04 753 130 46 289 59 32 12 41 87
Uganda 589 15 987 1339 32 425 82 65 48 64 91
Zambia 613 14 958 10 13 471 48 135 49 46 87
Zimbabwe 894 971 2143 52 143 44 72 99
157
TABLE 24 Education health and sanitation (continued)Literacyratefemale
Ratio of girls-to-boys Expendi-ture perstudent
Public expon
education
Health expenditure Prevalenceof HIV
Access to improved
out ofprimaryschool
in primand seceducation
share ofGDP percapita
share ofGDP
currentper capita
share ofGDP
ages15-49
sanitationfacilities
water source
ratio US$ rur urb
2009 2009 2009 2009 2009 2009 2009 2009 2008 2008 2008
ASIA
Central Asia
Kazakhstan 996 26 986 79 28 3300 45 01 97 90 99
Kyrgyzstan 990 11 1010 173 59 571 68 03 93 85 99
Tajikistan 996 01 906 218 35 380 53 02 94 61 94
Turkmenistan 994 43 771 23 98 97
Uzbekistan 991 08 987 74 622 52 01 100 81 98
East Asia
Brunei Darussalam 937 18 1010 37 7910 30
Cambodia 709 08 897 54 21 421 59 05 29 56 81
China 909 12 1050 1015 19 1770 46 01 55 82 98
Indonesia 891 04 977 397 28 554 24 02 52 71 89
Korea DPR 1000 100 100
Korea Republic of 00 972 528 42 11100 65 01 100 88 100
Lao PDR 632 09 872 100 23 358 41 02 53 51 72
Malaysia 903 10 1030 604 41 3360 48 05 96 99 100
Mongolia 979 15 1030 162 56 742 47 01 50 49 97
Myanmar 895 08 997 54 13 125 20 06 81 69 75
Philippines 958 14 1020 276 28 669 38 01 76 87 93
Singapore 920 116 30 15000 39 01 100 100
Thailand 915 09 1030 554 41 1680 43 13 96 98 99
Viet Nam 905 04 932 982 53 797 72 04 75 92 99
South Asia
Afghanistan 50 07 623 19 509 74 37 39 78
Bangladesh 510 21 1080 256 24 184 34 01 53 78 85
Bhutan 387 13 1000 387 48 980 55 02 65 88 99
India 508 05 922 777 31 448 42 03 31 84 96
Iran (Islamic Rep) 807 07 965 583 47 2690 55 02 98
Maldives 984 06 982 00 112 3310 80 01 98 86 99
Nepal 469 06 825 731 47 253 58 04 31 87 93
Pakistan 401 07 819 27 226 26 01 45 87 95
Sri Lanka 891 12 1040 30 836 40 01 91 88 98
West Asia
Armenia 994 17 1030 533 30 1290 47 01 90 93 98
Azerbaijan 992 10 1020 156 28 2850 58 01 45 71 88
Bahrain 902 03 1010 326 29 11100 45 100
Cyprus 969 05 1000 1352 41 60 100 100 100
Georgia 997 06 965 410 32 2560 101 01 95 96 100
Iraq 699 04 813 51 985 39 73 55 91
Jordan 889 14 1020 277 49 3360 93 98 91 98
Kuwait 918 08 1010 257 38 14200 33 100 99 99
Lebanon 860 09 1040 102 18 6630 81 01 100 100
Occupied PalestinianTerritory
Saudi Arabia 811 08 913 367 56 7140 50 97
Syrian Arab Republic 780 01 973 338 48 720 29 96 84 94
Turkey 853 07 929 547 31 5710 67 01 90 96 100
United Arab Emirates 915 06 998 270 12 15200 28 97 100 100
Yemen 447 06 657 52 640 56 52 57 72
LATIN AMERICA amp THECARIBBEAN
Argentina 977 22 1050 565 49 7300 95 05 90 80 98
Bahamas 14 1010 33 15600 72 31 100 98
Barbados 603 minus67 10400 68 14 100 100 100
Belize 703 44 1010 395 58 2170 49 23 90 100 99
Bolivia (Plur State) 868 12 988 282 63 848 48 02 25 67 96
Brazil 902 07 1030 650 51 7340 91 80 84 99
Chile 987 09 985 428 40 7870 82 04 96 75 99
Colombia 934 10 1050 580 48 3230 64 05 74 73 99
Costa Rica 963 12 1020 290 63 6680 105 03 95 91 100
158
TABLE 24 Education health and sanitation (continued)Literacyratefemale
Ratio of girls-to-boys Expendi-ture perstudent
Public expon
education
Health expenditure Prevalenceof HIV
Access to improved
out ofprimaryschool
in primand seceducation
share ofGDP percapita
share ofGDP
currentper capita
share ofGDP
ages15-49
sanitationfacilities
water source
ratio US$ rur urb
2009 2009 2009 2009 2009 2009 2009 2009 2008 2008 2008
Cuba 998 08 988 1553 136 7070 118 01 91 89 96
Dominica 15 1020 407 47 3610 64
Dominican Republic 883 11 965 147 23 2710 59 09 83 84 87
Ecuador 815 28 1030 92 10 2550 61 04 92 88 97
El Salvador 818 16 983 176 36 2290 63 08 87 76 94
French Guiana
Grenada 960 22 970 227 48 4470 74 97 97
Guatemala 695 04 938 166 32 1860 71 08 81 90 98
Guyana 06 997 447 61 1330 81 12 81 93 98
Haiti 446 10 946 15 396 61 19 17 55 71
Honduras 835 23 1070 36 1170 60 08 71 77 95
Jamaica 911 09 1000 850 58 2310 51 17 83 89 98
Mexico 921 17 1020 637 48 5150 65 03 85 87 96
Netherlands Antilles 964 1020
Nicaragua 779 12 1020 144 31 1050 96 02 52 68 98
Panama 930 08 1010 390 38 5910 83 09 69 83 97
Paraguay 935 10 995 530 40 1590 71 03 70 66 99
Peru 846 12 994 180 27 2010 46 04 68 61 90
St Kitts amp Nevis 15 1040 79 97 6340 60 96 99 99
St Lucia 10 994 368 45 4430 81 98 98
St Vincent amp Grenadines 01 977 455 66 3010 57
Suriname 938 09 1070 90 4290 76 10 84 81 97
Trinidad amp Tobago 983 05 1010 189 42 10700 57 15 92 93 98
Uruguay 986 08 1040 374 29 6980 75 05 100 100 100
Venezuela (Boliv Rep of) 949 11 1020 173 37 6860 60
OCEANIA
Fiji 10 1030 967 62 1300 34 01
French Polynesia 15 1090 98 100 100
New Caledonia 960
Papua New Guinea 565 08 835 65 367 31 09 45 33 87
Samoa 985 17 1050 120 58 2050 70 100
Solomon Islands 690 10 940 22 719 54
Tonga 991 06 999 1449 39 1610 62 96 100 100
Vanuatu 803 05 995 353 48 1060 40 52 79 96
DEVELOPED REGIONS
NORTH AMERICA
Bermuda 979 157 26
Canada 23 987 440 49 43800 109 02 100 99 100
United States of America 14 1000 682 55 74100 162 06 100 94 100
ASIA amp OCEANIA
Australia 14 973 509 45 38700 85 01 100 100 100
Israel 887 15 1010 611 59 19700 76 02 100 100 100
Japan 11 1000 647 35 33200 83 01 100 100 100
New Zealand 31 1030 675 61 26300 97 01 100 100
EUROPE
Albania 947 09 995 444 29 2650 69 98 98 96
Belarus 997 17 1010 150 45 2950 58 03 93 99 100
Bosnia amp Herzegovina 964 13 1020 4950 109 95 98 100
Croatia 981 12 1020 732 46 11200 78 01 99 97 100
European Union 1010 764 49 33700 103 02 98 100 100
Iceland 13 1020 771 74 31300 82 03 100 100 100
Macedonia FYR 956 13 983 238 35 3140 69 89 99 100
Montenegro 6170 93 92 96 100
Norway 13 990 895 68 76600 97 01 100 100 100
Republic of Moldova 980 10 1010 1286 96 1810 119 04 79 85 96
Russian Federation 994 12 980 142 39 4750 54 10 87 89 98
Serbia 09 1010 1105 48 4190 99 01 92 98 99
Switzerland 57 973 956 52 71400 113 04 100 100 100
Ukraine 996 11 988 251 53 1800 70 11 95 97 98
159
TABLE 25 Food aid receivedFood aid received
thousandtonnes
thousandtonnes
thousandtonnes
thousandtonnes
thousandtonnes
1990 1995 2000 2005 2010
WORLD 13172 10201 11345 8288 5682
DEVELOPING REGIONS 10922 9143 9462 8245 5682
AFRICA 5255 3562 4320 4656 3491
North Africa 2268 263 318 56 27
Algeria 10 27 33 42 24
Egypt 1606 207 41 14 3
Libya 0 0 0 0 0
Morocco 271 2 241 0 0
Tunisia 383 27 4 0 0
Sub-Saharan Africa 2986 3299 4002 4601 3464
Angola 124 220 296 57 4
Benin 15 21 12 15 19
Botswana 15 10 0 0 0
Burkina Faso 34 41 33 39 45
Burundi 3 103 11 73 34
Cameroon 3 7 4 14 14
Cape Verde 59 73 53 29 16
Central African Republic 3 1 3 5 10
Chad 26 21 23 74 111
Comoros 4 6 0 0 0
Congo 8 13 18 9 7
Cocircte drsquoIvoire 66 24 17 34 21
Congo Dem Rep 98 109 74 103 193
Djibouti 9 20 12 21 10
Equatorial Guinea 5 4 2 0 0
Eritrea 0 104 257 232 0
Ethiopia 864 636 1527 1122 1415
Gabon 0 0 1 0 0
Gambia 4 4 8 11 23
Ghana 66 97 101 66 7
Guinea 11 8 5 41 4
Guinea-Bissau 5 3 27 11 7
Kenya 90 80 291 155 258
Lesotho 42 34 6 44 7
Liberia 35 161 116 102 30
Madagascar 54 38 44 47 26
Malawi 219 236 36 153 38
Mali 39 20 12 41 25
Mauritania 45 45 17 92 39
Mauritius 11 1 0 0 0
Mozambique 423 386 185 117 80
Namibia 12 3 2 2 1
Niger 40 25 20 139 159
Nigeria 0 0 1 20 0
Rwanda 9 274 232 42 7
Senegal 63 21 54 30 41
Seychelles 1 0 0 0 0
Sierra Leone 11 34 28 39 24
Somalia 98 53 61 40 72
Sudan 230 82 182 931 476
South Africa 7 0 3 0 0
Swaziland 10 7 0 12 17
Tanzania Utd Rep 35 145 63 116 38
Togo 12 6 4 1 2
Uganda 47 77 87 293 80
Zambia 11 26 49 146 7
Zimbabwe 14 13 16 80 92
160
TABLE 25 Food aid received (continued)Food aid received
thousandtonnes
thousandtonnes
thousandtonnes
thousandtonnes
thousandtonnes
1990 1995 2000 2005 2010
ASIA 3357 4641 4314 2958 1775
Central Asia 0 432 195 239 75
Kazakhstan 0 1 0 0 0
Kyrgyzstan 0 150 60 166 50
Tajikistan 0 226 60 73 25
Turkmenistan 0 53 7 0 0
Uzbekistan 0 1 68 0 0
East Asia 530 952 2239 1663 232
Brunei Darussalam 0 0 0 0 0
Cambodia 25 91 62 24 17
China 78 128 90 49 0
Indonesia 56 19 429 197 0
Korea DPR 0 544 1264 1180 80
Korea Republic of 0 0 0 0 0
Lao PDR 0 27 5 19 20
Malaysia 0 0 0 0 0
Mongolia 0 12 46 55 0
Myanmar 0 4 10 16 31
Philippines 160 55 218 121 82
Singapore 0 0 0 0 0
Thailand 148 2 1 1 0
Viet Nam 62 70 82 0 0
South Asia 2288 1445 937 838 1247
Afghanistan 43 133 210 208 140
Bangladesh 1050 586 269 293 194
Bhutan 5 6 4 2 3
India 382 398 321 102 16
Iran (Islamic Rep) 26 13 3 2 5
Maldives 2 3 3 11 12
Nepal 8 38 53 54 53
Pakistan 462 119 20 30 763
Sri Lanka 310 148 55 136 60
West Asia 539 1812 943 218 222
Armenia 0 476 96 22 7
Azerbaijan 0 391 28 12 0
Bahrain 0 0 0 0 0
Cyprus 0 0 0 0 0
Georgia 0 598 71 20 1
Iraq 0 102 18 36 7
Jordan 261 122 401 3 0
Kuwait 0 0 0 0 0
Lebanon 43 11 42 12 0
Occupied PalestinianTerritory
26 48 57 83 90
Saudi Arabia 0 0 0 0 0
Syrian Arab Republic 38 45 35 10 35
Turkey 14 1 0 0 0
United Arab Emirates 0 0 0 0 0
Yemen 157 18 195 21 83
LATIN AMERICA amp THECARIBBEAN
2306 939 828 632 416
Argentina 0 0 0 0 0
Bahamas 0 0 0 0 0
Barbados 0 0 0 0 0
Belize 0 0 0 0 0
Bolivia (Plur State) 262 86 80 65 8
Brazil 29 1 0 0 0
Chile 8 0 0 0 0
Colombia 5 15 12 14 12
Costa Rica 7 3 0 0 0
161
TABLE 25 Food aid received (continued)Food aid received
thousandtonnes
thousandtonnes
thousandtonnes
thousandtonnes
thousandtonnes
1990 1995 2000 2005 2010
Cuba 3 6 24 7 0
Dominica 0 7 0 0 0
Dominican Republic 40 6 2 0 50
Ecuador 77 19 42 43 3
El Salvador 203 25 3 67 3
French Guiana 0 0 0 0 0
Grenada 0 0 0 0 0
Guatemala 185 70 137 69 70
Guyana 46 33 26 0 0
Haiti 108 168 164 137 266
Honduras 146 53 68 98 3
Jamaica 293 56 46 11 0
Mexico 280 46 2 0 0
Netherlands Antilles 0 0 0 0 0
Nicaragua 232 63 62 43 2
Panama 1 2 0 0 0
Paraguay 4 1 0 0 0
Peru 359 254 149 78 0
St Kitts amp Nevis 0 0 0 0 0
St Lucia 0 3 0 0 0
St Vincent amp Grenadines 0 0 0 0 0
Suriname 0 20 0 0 0
Trinidad amp Tobago 0 0 0 0 0
Uruguay 20 0 0 0 0
Venezuela (Boliv Rep of) 0 0 11 0 0
OCEANIA 3 0 0 0 0
Fiji 0 0 0 0 0
French Polynesia 0 0 0 0 0
New Caledonia 0 0 0 0 0
Papua New Guinea 0 0 0 0 0
Samoa 0 0 0 0 0
Solomon Islands 0 0 0 0 0
Tonga 0 0 0 0 0
Vanuatu 0 0 0 0 0
DEVELOPED REGIONS 2250 1058 1883 43 0
NORTH AMERICA 0 0 0 0 0
Bermuda 0 0 0 0 0
Canada 0 0 0 0 0
United States of America 0 0 0 0 0
ASIA amp OCEANIA 1 0 0 0 0
Australia 0 0 0 0 0
Israel 1 0 0 0 0
Japan 0 0 0 0 0
New Zealand 0 0 0 0 0
EUROPE 2249 1058 1883 43 0
Albania 0 10 18 6 0
Belarus 0 98 0 0 0
Bosnia amp Herzegovina 0 23 84 0 0
Croatia 0 14 0 0 0
European Union 2249 40 1 0 0
Iceland 0 0 0 0 0
Macedonia FYR 0 0 63 0 0
Montenegro 0 0 0 0 0
Norway 0 0 0 0 0
Republic of Moldova 0 244 14 10 0
Russian Federation 0 125 1403 26 0
Serbia 0 0 0 0 0
Switzerland 0 0 0 0 0
Ukraine 0 120 0 0 0
162
DEFINITIONS AND SOURCES
Definitions and sources
Countries in protracted crisesP2HUNFAOESARHSNPC
Page table 31 (p 86)
Protracted crises are those environments in which a sig-nificant proportion of the population is acutely vulnera-ble to death disease and disruption of livelihoods overa prolonged period of time The governance of these en-vironments is usually very weak with the state having alimited capacity to respond to and mitigate the threatsto the population or provide adequate levels of protec-tion
Source Trade and Markets Division
Owner FAO
Contribution in diets by typeP2HUNFAOESSDIETCPF
Page table 16 (p 135)
Dietary contribution refers to the amount of carbohy-dratesproteinsfats expressed in kilocalories (kcal) perday available for each individual in the total populationduring the reference period Caloric content is derived byapplying the appropriate food composition factors to thequantities of the commodities Per person supplies arederived from the total amount of food available for hu-man consumption by dividing total calories by total pop-ulation actually partaking of the food supplies during thereference period However per person figures representonly the average supply available for the population asa whole and do not necessarily indicate what is actuallyconsumed by individuals The actual food consumptionmay be lower than the quantity shown as food availabil-ity depending on the magnitude of wastage and lossesof food in the household eg during storage in prepa-ration and cooking as plate-waste or quantities fed todomestic animals and pets thrown or given away
Source Statistics Division
Owner FAO
Dietary Energy Supply per personP2HUNFAOESSDIETDES
Page table 16 (p 135) chart 37 (p 93) map 20 (p 92)
Dietary energy supply per person refers to the amountof food expressed in kilocalories (kcal) per day avail-able for each individual in the total population duringthe reference period Caloric content is derived by ap-plying the appropriate food composition factors to thequantities of the commodities Per person supplies arederived from the total amount of food available for hu-man consumption by dividing total calories by total pop-ulation actually partaking of the food supplies during thereference period However per person figures representonly the average supply available for the population asa whole and do not necessarily indicate what is actuallyconsumed by individuals The actual food consumptionmay be lower than the quantity shown as food availabil-ity depending on the magnitude of wastage and losses
of food in the household eg during storage in prepa-ration and cooking as plate-waste or quantities fed todomestic animals and pets thrown or given awaySource Statistics DivisionOwner FAO
Caloric contribution in diets by commodityP2HUNFAOESSDIETFDS
Page table 40 41 (p 95 95)Contribution of a food Group to total dietary energy sup-plySource Statistics DivisionOwner FAO
Percentage contribution in diets by commodityP2HUNFAOESSDIETFDSx
Page table 16 17 (p 135 138)Percentage contribution of a food group to total dietaryenergy supplySource Statistics DivisionOwner FAO
Depth of hungerP2HUNFAOESSUNMNTDEP
Page table 15 (p 132) chart 36 (p 91)The depth of food deprivation indicates how much food-deprived people fall short of minimum food needs interms of dietary energy It is measured as the differencebetween the minimum dietary energy and the averagedietary energy intake of the undernourished population(food-deprived) The depth of food deprivation is lowwhen it is less than 200 kilocalories per person per dayand high when it is higher than 300 kilocalories per per-son per day The greater the deficit the greater the sus-ceptibility for health risks related to undernutritionSource Statistics DivisionOwner FAO
Incidence of undernourishmentP2HUNFAOESSUNMNTNUM
Page table 15 (p 132) map 19 (p 91)Undernourishment refers to the condition of peoplewhose dietary energy consumption is continuously be-low a minimum dietary energy requirement for main-taining a healthy life and carrying out a light physicalactivity The incidence of undernourishment is the num-ber of people referring to those in this conditionSource Statistics DivisionOwner FAO
Global number of undernourishedP2HUNFAOESSUNMNTPNW
Page chart 33 35 (p 89 90)Undernourishment refers to the condition of peoplewhose dietary energy consumption is continuously be-low a minimum dietary energy requirement for main-taining a healthy life and carrying out a light physical
163
PART 2
activity The global incidence of undernourishment is thetotal number of people in the world referring to those inthis condition
Source Statistics Division
Owner FAO
Percentage of population undernourishedP2HUNFAOESSUNMNTPREV
Page table 15 (p 132) map 18 (p 88)
Undernourishment refers to the condition of peoplewhose dietary energy consumption is continuously be-low a minimum dietary energy requirement for main-taining a healthy life and carrying out a light physicalactivity The percentage of population undernourishedis the total number of people in each country referringto those in this condition divided by the population ofthat country
Source Statistics Division
Owner FAO
Regional percentage of undernourishedP2HUNFAOESSUNMNTPREVR
Page chart 34 (p 90)
Undernourishment refers to the condition of peoplewhose dietary energy consumption is continuously be-low a minimum dietary energy requirement for main-taining a healthy life and carrying out a light physicalactivity The regional percentage of population under-nourished is the total number of people in each regionreferring to those in this condition divided by the popu-lation of that region
Source Statistics Division
Owner FAO
Global affordability of foodP2HUNFAOFPVAFD
Page chart 54 (p 106)
FAO Food Price Index relative to GDP showing howmuchfood prices have risen relative to income from the baseperiod 2002-04 Higer (lower) index scores show greater(less) affordability
Source Statistics Division
Owner FAO
Food price inflationP2HUNFAOFPVFCPI
Page map 25 (p 104)
Annual change in the ILO food price indices The pricedata for the different items included in the computationof the index are normally weighted in order to take intoaccount the relative importance of each item with re-spect to total consumption expenditure In most coun-tries the indices are computed in a derived form suchas weighted arithmetic averages of price relatives fora selected number of representative items between theperiod under consideration and the base period using
one or other forms of Laspeyresrsquo formula The num-ber of items and the weights used to compute the in-dex are given according to expenditure group The termitem is used here to mean the smallest grouping ofgoods and services for which a specific weight is givenThe source(s) and the reference period of the weightsused for the index eg a household expenditure surveynational accounts etc If the reference period for theweights differs from the base period of the index theadjustments made to the weights to take account of theprice changes between the two periods are describedSee httplaborstailoorg for more informationSource LABORSTAOwner ILO
International food prices by food groupP2HUNFAOFPVFPI
Page chart 53 (p 106)The FAO Food Price Index is a measure of themonthly change in international prices of a bas-ket of food commodities It consists of the av-erage of five commodity group price indices (rep-resenting 55 quotations) weighted with the aver-age export shares of each of the groups for 2002-2004 See httpwwwfaoorgworldfoodsituationwfs-homefoodpricesindexen for more information on sub-index constructionSource Statistics DivisionOwner FAO
International food price volatility by food groupP2HUNFAOFPVFPV
Page chart 55 56 (p 107 107)Annualized historical volatility of the FAO Food Price In-dexSource Statistics DivisionOwner FAO
Food price volatility (annualized historical volatility)P2HUNFAOFPVFPVn
Page map 26 (p 108)Annualized historical volatility of the ILO food price in-dicesSource Statistics DivisionOwner FAO
FAO Global Consumption price volatilityP2HUNFAOFPVGCI
Page chart 52 57 (p 105 109)The FAO Global Food Consumption Price Index trackschanges in the cost of the global food basket as por-trayed by the latest FAO world food balance sheet Rep-resentative international prices for each of the commodi-ties or commodity groups appearing in the balance sheetare weighted by their contribution to total calorific in-takeSource Statistics DivisionOwner FAO
164
DEFINITIONS AND SOURCES
Dietary diversity in selected LIFDCs
P2HUNFAOFVDIETDIV
Page chart 39 (p 94)
The Herfindahl index H is calculated as H =sumN=1 S
2
where S is the consumption share of the starchy staple in diets and N is the number of staples consumed For asingle staple consumed the index would equate to oneand declines as the staple base becomes more diversi-fied
Source Statistics Division
Owner FAO
Starchy root consumption and DES
P2HUNFAOFVDIETRTDES
Page chart 38 (p 94)
Caloric equivalent of starchy roots available for con-sumption as a ratio of total dietary energy supply
Source Statistics Division
Owner FAO
Availability of dietary iron
P2HUNFAOMCNIRON
Page table 18 (p 141) chart 44 (p 98)
The dietary availability of iron is calculated by convert-ing the amount of food available for human consumptionas estimated by the FAO Food Balance Sheets in equiv-alent of iron derived from animal and vegetal productsHowever the actual food consumptionmay be lower thanthe quantity shown as food availability depending on themagnitude of wastage and losses of food in the house-hold eg during storage in preparation and cooking asplate-waste or quantities fed to domestic animals andpets thrown or given away
Source Statistics Division
Owner FAO
Food + energy import bills ( GDP)
P2HUNFAOTFSFDFL
Page table 20 (p 147)
The annual value of food imported under SITC sections0 + 22+ 4 plus fuels under SITC section 3 expressed asa ratio of GDP
Source Statistics Division (FAOSTAT) and UNCTADSTAT
Owner FAO UNCTAD
Food import bills
P2HUNFAOTFSFIB
Page table 20 (p 147) chart 49 50 51 (p 103 103103)
The annual value of food imported under SITC sections0 + 22+ 4 expressed in current US$
Source Statistics Division (FAOSTAT) and UNCTADSTAT
Owner FAO UNCTAD
Food + energy import bills per capita
P2HUNFAOTFSFUEL
Page chart 50 51 (p 103 103)
The annual value of food imported under SITC sections0 + 22+ 4 plus fuels under SITC section 3 expressed asa ratio of population
Source Statistics Division (FAOSTAT) and UNCTADSTAT
Owner FAO UNCTAD
Index of variability of food production
P2HUNFAOTFSQPVAR
Page chart 46 (p 102)
Rolling ten-year window of the coefficient of variation ofper capita production index
Source Statistics Division
Owner FAO
Food self-sufficiency (calories)
P2HUNFAOTFSSSCAL
Page table 19 (p 144) chart 45 (p 101) map 24 (p100)
The self-sufficiency ratio (SSR) is defined as SSR = pro-duction x 100(production + imports - exports) The SSRcan be calculated for individual commodities groups ofcommodities of similar nutritional values and after ap-propriate conversion of the commodity equations alsofor the aggregate of all commodities In the context offood security the SSR is often taken to indicate the ex-tent to which a country relies on its own production re-sources ie the higher the ratio the greater the self-sufficiency While the SSR can be the appropriate toolwhen assessing the supply situation for individual com-modities a certain degree of caution should be observedwhen looking at the overall food situation In the casehowever where a large part of a countryrsquos production ofone commodity eg other cereals is exported the SSRmay be very high but the country may still have to relyheavily on imports of food commodities to feed the pop-ulation The self-sufficiency rate (as defined above) can-not be the complement to 100 of the import dependencyrate or vice-versa
Source Statistics Division
Owner FAO
Months of cereal self-provisioning capacity
P2HUNFAOTFSSTU
Page chart 47 48 (p 102 103)
Stocks-to-utilization ratios for cereals (wheat rice andcoarse grains) where stocks refer to the carry-over ofthe preceding national crop season The ratio is thenmultiplied by 12 to calculate the number of months ofself-provisioning capacity in a given year
Source Trade and Markets Division
Owner FAO
165
PART 2
Persons affected by natural disastersP2HUNODFAEMDATRHSPPND
Page table 14 (p 129) chart 29 (p 85) map 16 (p 84)People requiring immediate assistance during a periodof emergency ie requiring basic survival needs suchas food water shelter sanitation and immediate med-ical assistance Appearance of a significant number ofcases of an infectious disease introduced in a region ora population that is usually free from that disease Seewwwemdatnet (Universiteacute catholique de Louvain Brus-sels Belgium)Source International Disaster Database EM-DATOwner OFDA and CRED
Total affected by natural disastersP2HUNODFAEMDATRHSPPNDT
Page chart 30 (p 86)Sum of (i) injured people suffering from physical injuriestrauma or an illness requiring medical treatment as a di-rect result of a disaster (ii) homeless people needing im-mediate assistance for shelter and (iii) affected peoplerequiring immediate assistance during a period of emer-gency it can also include displaced or evacuated peopleSee wwwemdatnet (Universiteacute catholique de LouvainBrussels Belgium)Source International Disaster Database EM-DATOwner OFDA and CRED
Multidimensional Poverty IndexP2HUNUNDPHDRMPI
Page table 21 (p 150)An international measure of poverty for 109 developingcountries the MPI complements income-based povertymeasures by reflecting the multiple deprivations thatpeople face at the same time The MPI identifies de-privations across health education and living standardsand shows the number of people who are multidimen-sionally poor and the deprivations that they face at thehousehold levelSource Alkire S Roche JM Santos ME and Seth S(November 2011) ophiqehoxacukOwner OPHI
Gender Inequality IndexP2HUNUNDPHDRPOVGEI
Page table 22 (p 153) map 29 (p 113)The Gender Inequality Index is a composite measure re-flecting inequality in achievements between women andmen in three dimensions reproductive health empow-erment and the labour market It varies between zero(when women and men fare equally) and one (when menor women fare poorly compared to the other in all di-mensions) The health dimension is measured by twoindicators maternal mortality ratio and the adolescentfertility rate The empowerment dimension is also mea-sured by two indicators the share of parliamentary seatsheld by each sex and by secondary and higher educationattainment levels The labour dimension is measured by
womenrsquos participation in the work force The Gender In-equality Index is designed to reveal the extent to whichnational human development achievements are erodedby gender inequality and to provide empirical founda-tions for policy analysis and advocacy effortsSource Human Development Report 2010Owner UNDP
Human Development IndexP2HUNUNDPHDRPOVHDI
Page table 22 (p 153)The HDI represents a national average of human de-velopment achievements in the three basic dimensionsmaking up the HDI health education and income Likeall averages it conceals disparities in human develop-ment across the population within the same countryTwo countries with different distributions of achieve-ments can have the same average HDI value The IHDItakes into account not only the average achievements ofa country on health education and income but also howthose achievements are distributed among its citizens bydiscounting each dimensionrsquos average value accordingto its level of inequalitySource Human Development Report 2010Owner UNDP
Human Development Index (inequality adjusted)P2HUNUNDPHDRPOVHDIi
Page table 22 (p 153) chart 59 (p 112)The Human Development Index (HDI) is a summary mea-sure of human development It measures the averageachievements in a country in three basic dimensionsof human development a long and healthy life ac-cess to knowledge and a decent standard of living TheInequality-adjusted Human Development Index (IHDI)adjusts the Human Development Index (HDI) for inequal-ity in distribution of each dimension across the popula-tion The IHDI accounts for inequalities in HDI dimen-sions by discounting each dimensionrsquos average valueaccording to its level of inequality The IHDI equals theHDI when there is no inequality across people but is lessthan the HDI as inequality rises In this sense the IHDI isthe actual level of human development (accounting forthis inequality) while the HDI can be viewed as an in-dex of potential human development (or the maximumlevel of HDI) that could be achieved if there was no in-equality The loss in potential human development dueto inequality is given by the difference between the HDIand the IHDI and can be expressed as a percentageSource Human Development Report 2010Owner UNDP
Population of concernP2HUNUNHCRGTRHSTPC
Page table 13 (p 126) map 17 (p 87)Refugees are individuals recognized under the 1951Convention relating to the Status of Refugees and alsopeople in a refugee-like situation such as those who
166
DEFINITIONS AND SOURCES
are outside their country or territory of origin and whoface protection risks similar to those of refugees butfor whom refugee status has for practical or other rea-sons not been ascertained Internally Displaced Persons(IDPs) are people or groups of individuals who have beenforced to leave their homes or places of habitual resi-dence in particular as a result of or in order to avoidthe effects of armed conflict situations of generalized vi-olence violations of human rights or natural- or human-made disasters and who have not crossed an interna-tional border Others include Asylum-seekers (personswho have applied for asylum or refugee status but whohave not yet received a final decision on their applica-tion) Returned IDPs and refugees Stateless Persons (in-dividuals not considered as nationals by any State underrelevant national laws) and other groups of concern towhom UNHCR has extended its protection andor assis-tance services based on humanitarian or other specialgrounds
Source Statistical Online Population Database
Owner UNHCR
Total population of concern
P2HUNUNHCRGTRHSTPCT
Page chart 32 (p 87)
Total population of concern is the sum of various groupsof people including refugees asylum-seekers internallydisplaced persons (IDPs) protectedassisted by UNHCRstateless persons and returnees (returned refugees andIDPs)
Source Statistical Online Population Database
Owner UNHCR
Average governance
P2HUNWBKPOVGOV
Page table 23 (p 156) chart 60 (p 115) map 30 (p114)
The Worldwide Governance Indicators project constructsaggregate indicators of six broad dimensions of gover-nance (i) Voice and Accountability (ii) Political Stabil-ity and Absence of ViolenceTerrorism (iii) GovernmentEffectiveness (iv) Regulatory Quality (v) Rule of Law(vi) Control of Corruption The six aggregate indicatorsare based on 30 underlying data sources reporting theperceptions of governance of a large number of surveyrespondents and expert assessments worldwide De-tails on the underlying data sources the aggregationmethod and the interpretation of the indicators can befound in the WGI methodology paper Daniel KaufmannAart Kraay and Massimo Mastruzzi (2010) The World-wide Governance Indicators A Summary of Methodol-ogy Data and Analytical Issues World Bank Policy Re-search Working Paper No 5430 httppapersssrncomsol3paperscfmabstract_id=1682130
Source World Bank
Owner Worldwide Governance Indicators (WGI) project
Ratio of girls-to-boys out of primary school
P2HUNWBKWDIEDUCOSR
Page table 24 (p 159)
Children out of school are the number of primary-school-age children not enrolled in primary or secondary school
Source World Bank (WDI)
Owner UNESCO
Public spending on education total ( of GDP)
P2HUNWBKWDIEDUEXPP
Page table 24 (p 159)
Public expenditure on education consists of current andcapital public expenditure on education includes gov-ernment spending on educational institutions (both pub-lic and private) education administration as well assubsidies for private entities (studentshouseholds andother privates entities)
Source World Bank (WDI)
Owner UNESCO
Expenditure per student
P2HUNWBKWDIEDUEXPS
Page table 24 (p 159)
Public expenditure per student is the public currentspending on education divided by the total number ofstudents by level as a percentage of GDP per capitaPublic expenditure (current and capital) includes govern-ment spending on educational institutions (both publicand private) education administration as well as subsi-dies for private entities (studentshouseholds and otherprivates entities)
Source World Bank (WDI)
Owner UNESCO
Literacy rate adult female ( of females ages 15 andabove)
P2HUNWBKWDIEDUFILT
Page table 24 (p 159) map 31 (p 116)
Adult literacy rate is the percentage of people ages 15and above who can with understanding read and writea short simple statement on their everyday life
Source World Bank (WDI)
Owner UNESCO
Ratio of girls to boys in primary and secondary education()
P2HUNWBKWDIEDUGEN
Page table 24 (p 159) chart 61 (p 117)
Ratio of girls to boys in primary and secondary educationis the ratio of the female to male gross enrolment ratesin primary and secondary school
Source World Bank (WDI)
Owner UNESCO
167
PART 2
Health expenditure per capita (current US$)P2HUNWBKWDIHAEHEPCP
Page table 24 (p 159) map 32 (p 118)
Total health expenditure is the sum of public and pri-vate health expenditures as a ratio of total populationIt covers the provision of health services (preventive andcurative) family planning activities nutrition activitiesand emergency aid designated for health but does notinclude provision of water and sanitation Data are incurrent US dollars
Source World Bank (WDI)
Owner WHO
Health expenditure total ( of GDP)P2HUNWBKWDIHAEHETOT
Page table 24 (p 159) chart 62 (p 119)
Total health expenditure is the sum of public and privatehealth expenditure It covers the provision of health ser-vices (preventive and curative) family planning activi-ties nutrition activities and emergency aid designatedfor health but does not include provision of water andsanitation
Source World Bank (WDI)
Owner WHO
Prevalence of HIV total ( of population ages 15-49)P2HUNWBKWDIHAEHIVPREV
Page table 24 (p 159)
Prevalence of HIV refers to the percentage of people ages15-49 who are infected with HIV
Source World Bank (WDI)
Owner UNAIDS and WHO
Improved sanitation facilities ( of population with ac-cess)P2HUNWBKWDIHAESANIMPS
Page table 24 (p 159) chart 63 (p 121)
Access to improved sanitation facilities refers to the per-centage of the population with at least adequate accessto excreta disposal facilities that can effectively preventhuman animal and insect contact with excreta Im-proved facilities range from simple but protected pit la-trines to flush toilets with a sewerage connection Tobe effective facilities must be correctly constructed andproperly maintained
Source World Bank (WDI)
Owner WHO and UNCF
Improved water source rural ( of rural population withaccess)P2HUNWBKWDIHAEWATIMPRU
Page table 24 (p 159) map 33 (p 120)
Access to an improved water source refers to the percent-age of the population with reasonable access to an ad-equate amount of water from an improved source suchas a household connection public standpipe borehole
protected well or spring and rainwater collection Unim-proved sources include vendors tanker trucks and un-protected wells and springs Reasonable access is de-fined as the availability of at least 20 litres a person aday from a source within one kilometre of the dwellingSource World Bank (WDI)Owner WHO and UNCF
Improved water source urban ( of urban populationwith access)P2HUNWBKWDIHAEWATIMPWU
Page table 24 (p 159)Access to an improved water source refers to the percent-age of the population with reasonable access to an ad-equate amount of water from an improved source suchas a household connection public standpipe boreholeprotected well or spring and rainwater collection Unim-proved sources include vendors tanker trucks and un-protected wells and springs Reasonable access is de-fined as the availability of at least 20 litres a person aday from a source within one kilometre of the dwellingSource World Bank (WDI)Owner WHO and UNCF
Poverty headcount ratio at $125 a day (PPP) ( of re-gional population)P2HUNWBKWDIPOVAGG
Page chart 58 (p 111)Data are from PovcalNet the on-line tool for povertymeasurement developed by the Development ResearchGroup of the World Bank See httpiresearchworldbankorgPovcalNetpovDuplichtmlSource PovcalNetOwner World Bank
Gini-index of income distributionP2HUNWBKWDIPOVGINI
Page table 22 (p 153) map 28 (p 113)Gini index measures the extent to which the distribu-tion of income among individuals or households withinan economy deviates from a perfectly equal distributionA Lorenz curve plots the cumulative percentages of totalincome received against the cumulative number of recip-ients starting with the poorest individual or householdThe Gini index measures the area between the Lorenzcurve and a hypothetical line of absolute equality ex-pressed as a percentage of the maximum area under theline Thus a Gini index of 0 represents perfect equalitywhile an index of 100 implies perfect inequalitySource World Bank (WDI)Owner World Bank
Poverty headcount ratio at $125 a day (PPP) ( of pop-ulation)P2HUNWBKWDIPOVH125
Page table 21 (p 150)Population below US$125 a day is the percentage of thepopulation living on less than US$125 a day at 2005
168
DEFINITIONS AND SOURCES
international prices As a result of revisions in PPP ex-change rates poverty rates for individual countries can-not be compared with poverty rates reported in earliereditionsSource World Bank (WDI)Owner World Bank
Income share held by highest 20P2HUNWBKWDIPOVH20
Page table 22 (p 153)Percentage share of income or consumption is the sharethat accrues to subgroups of population indicated bydeciles or quintiles Percentage shares by quintile maynot sum to 100 because of roundingSource World Bank (WDI)Owner World Bank
Poverty headcount ratio at $2 a day (PPP) ( of popula-tion)P2HUNWBKWDIPOVH200
Page table 21 (p 150)Population below US$2 a day is the percentage of thepopulation living on less than US$200 a day at 2005international prices As a result of revisions in PPP ex-change rates poverty rates for individual countries can-not be compared with poverty rates reported in earliereditionsSource World Bank (WDI)Owner World Bank
Poverty headcount ratio at national poverty line ( ofpopulation)P2HUNWBKWDIPOVHNPL
Page table 21 (p 150)National poverty rate is the percentage of the popula-tion living below the national poverty line National es-timates are based on population-weighted subgroup es-timates from household surveysSource World Bank (WDI)Owner World Bank
Poverty headcount ratio at rural poverty line ( of ruralpopulation)P2HUNWBKWDIPOVHRPL
Page table 21 (p 150)Rural poverty rate is the percentage of the rural popula-tion living below the national rural poverty lineSource World Bank (WDI)Owner World Bank
Income share held by lowest 20P2HUNWBKWDIPOVL20
Page table 22 (p 153)Percentage share of income or consumption is the sharethat accrues to subgroups of population indicated bydeciles or quintiles Percentage shares by quintile maynot sum to 100 because of roundingSource World Bank (WDI)Owner World Bank
Poverty gap at $125 a day (PPP) ()P2HUNWBKWDIPOVP125
Page table 21 (p 150) map 27 (p 110)Poverty gap is the mean shortfall from the poverty line(counting the nonpoor as having zero shortfall) ex-pressed as a percentage of the poverty line This mea-sure reflects the depth of poverty as well as its incidenceSource World Bank (WDI)Owner World Bank
Poverty gap at $2 a day (PPP) ()P2HUNWBKWDIPOVP200
Page table 21 (p 150)Poverty gap is the mean shortfall from the poverty line(counting the nonpoor as having zero shortfall) ex-pressed as a percentage of the poverty line This mea-sure reflects the depth of poverty as well as its incidenceSource World Bank (WDI)Owner World Bank
Poverty gap at national poverty line ()P2HUNWBKWDIPOVPNPL
Page table 21 (p 150)Poverty gap at national poverty line is the mean short-fall from the poverty line (counting the nonpoor as hav-ing zero shortfall) as a percentage of the poverty lineThis measure reflects the depth of poverty as well as itsincidenceSource World Bank (WDI)Owner World Bank
Poverty gap at rural poverty line ()P2HUNWBKWDIPOVPRPL
Page table 21 (p 150)Poverty gap at rural poverty line is the mean shortfallfrom the poverty line (counting the nonpoor as hav-ing zero shortfall) as a percentage of the national ruralpoverty line This measure reflects the depth of povertyas well as its incidenceSource World Bank (WDI)Owner World Bank
Food aid receivedP2HUNWFPFAISFDAID
Page table 25 (p 162) chart 64 (p 123) map 34 (p122)Quantity of food aid that reaches the recipient coun-try during a given period Quantities exported in GrainEquivalent The latter is a unit of measurement usedas alternative to Actual Ton for cereal-derived productsTo convert a product into grain equivalent a commodityspecific conversion factor is used For example if the fac-tor to convert wheat flour into wheat is 137 a tonne ofwheat flour corresponds to 0730 tons of wheat (1137)Source Food Aid Information SystemOwner WFP
169
PART 2
Percentage of adults with low body mass index (BMI)P2HUNWHOGHOADLTLBMI
Page table 18 (p 141)The indicator of weight adequacy in relation to height ofolder children adolescents and adults It is calculated asweight (kilograms) divided by height (metres) squaredThe acceptable range for adults is 185 to 249 and forchildren it varies with ageSource Global Health ObservatoryOwner WHO
Percentage of female adults with low body mass index(BMI)P2HUNWHOGHOADLTLBMIF
Page table 18 (p 141) map 22 (p 99)The indicator of weight adequacy in relation to height ofolder female children adolescents and adults It is cal-culated as weight (kilograms) divided by height (metres)squared The acceptable range for adults is 185 to 249 and for children it varies with ageSource Global Health ObservatoryOwner WHO
Percentage of adults who are obese by genderP2HUNWHOGHOADLTOBS
Page table 18 (p 141)Percentage of male and female defined population witha body mass index (BMI) of 25 kgm2 or higherSource Global Health ObservatoryOwner WHO
Percentage of adults who are obeseP2HUNWHOGHOADLTOBSx
Page map 23 (p 99)Percentage of adult defined population with a bodymassindex (BMI) of 25 kgm2 or higherSource Global Health ObservatoryOwner WHO
Percentage of children under 5 who are stuntedP2HUNWHOGHOCHLDSTNT
Page table 18 (p 141) chart 43 (p 98)Percentage of stunting (height-for-age less than -2 stan-dard deviations of the WHO Child Growth Standards me-dian) among children aged 0-5 yearsSource Global Health ObservatoryOwner WHO
Percentage of children under 5 who are underweightP2HUNWHOGHOCHLDUW
Page table 18 (p 141) chart 42 (p 97) map 21 (p 96)Percentage of underweight (weight-for-age less than -2standard deviations of the WHO Child Growth Standardsmedian) among children aged 0-5 yearsSource Global Health ObservatoryOwner WHO
Percentage of children under 5 who are wastedP2HUNWHOGHOCHLDWSTD
Page table 18 (p 141) chart 43 (p 98)Percentage of wasting (weight-for-height less than -2standard deviations of the WHO Child Growth Standardsmedian) among children aged 0-5 yearsSource Global Health ObservatoryOwner WHO
Percentage of newborns with low birth weightP2HUNWHOGHONEWLWB
Page table 18 (p 141)Low-birthweight babies are newborns weighing lessthan 2500 grams with the measurement taken withinthe first hours of life before significant postnatal weightloss has occurredSource Global Health ObservatoryOwner WHO
170
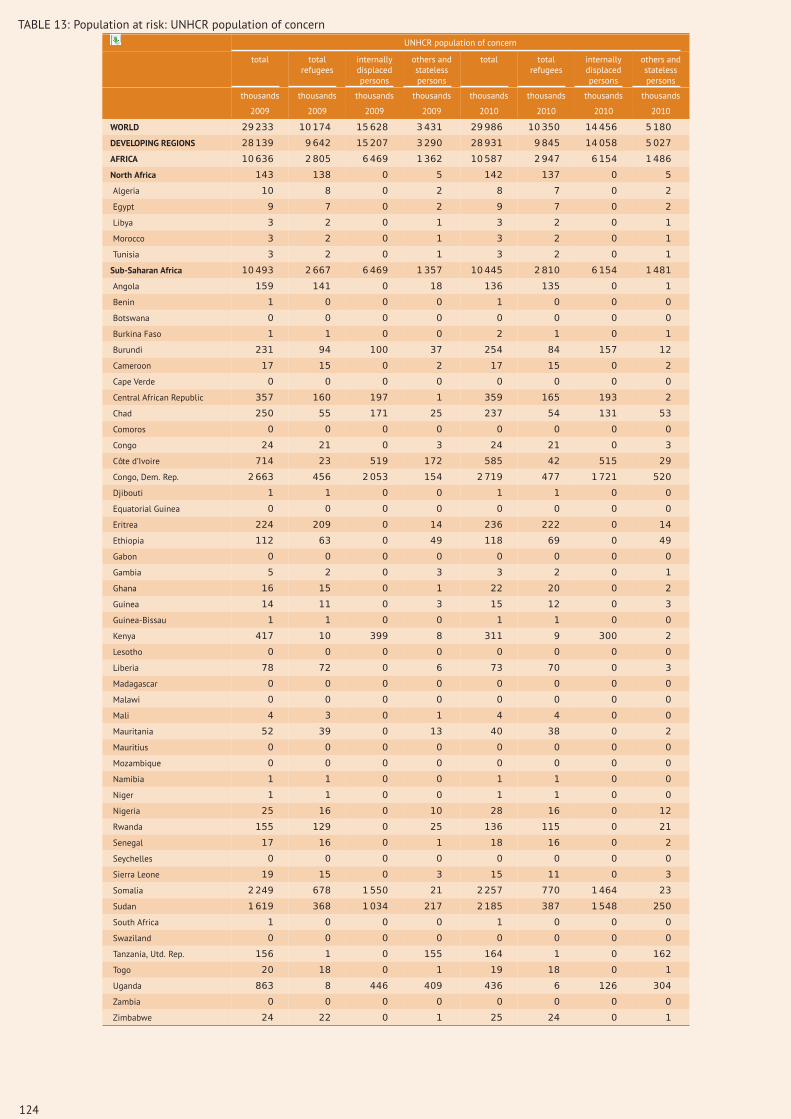
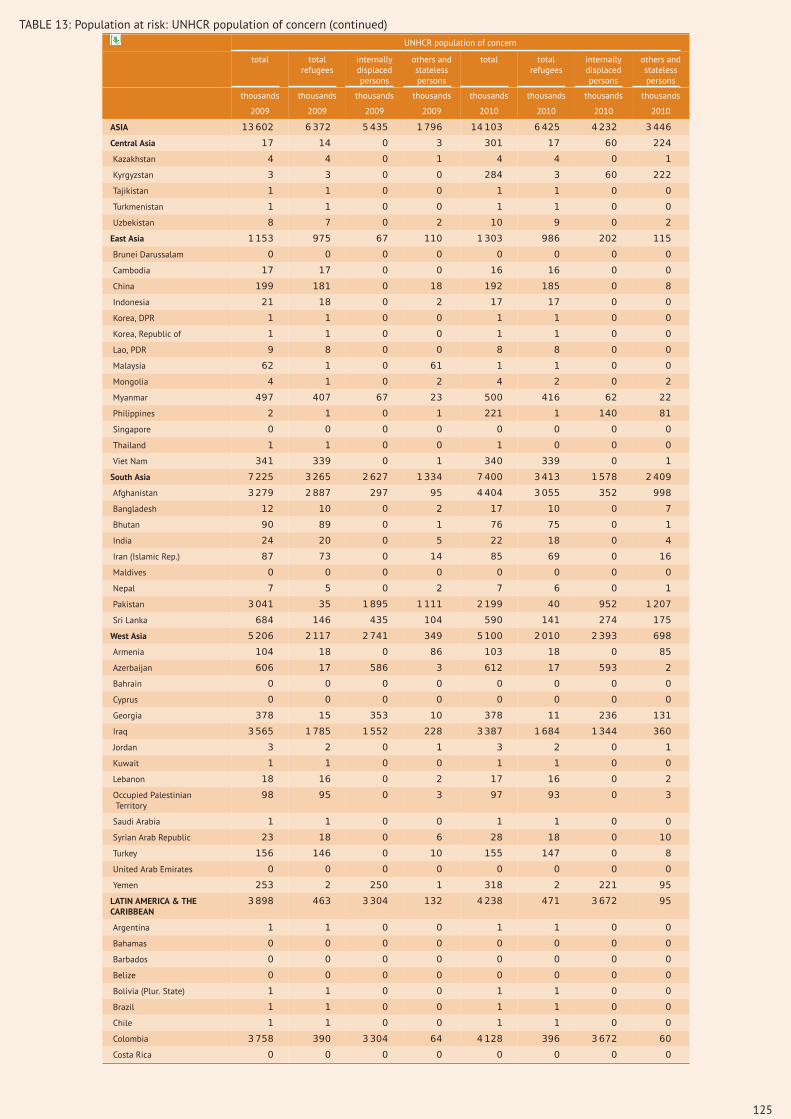
TABLE 13 Population at risk UNHCR population of concern (continued)UNHCR population of concern
total totalrefugees
internallydisplacedpersons
others andstatelesspersons
total totalrefugees
internallydisplacedpersons
others andstatelesspersons
thousands thousands thousands thousands thousands thousands thousands thousands
2009 2009 2009 2009 2010 2010 2010 2010
Cuba 10 8 0 2 12 7 0 4
Dominica 0 0 0 0 0 0 0 0
Dominican Republic 1 0 0 0 1 0 0 0
Ecuador 1 1 0 0 1 1 0 0
El Salvador 15 5 0 10 7 5 0 2
French Guiana 0 0 0 0 0 0 0 0
Grenada 0 0 0 0 0 0 0 0
Guatemala 15 6 0 9 7 6 0 1
Guyana 1 1 0 0 1 1 0 0
Haiti 36 24 0 12 33 26 0 7
Honduras 2 1 0 1 2 1 0 1
Jamaica 1 1 0 1 2 1 0 1
Mexico 27 6 0 20 17 7 0 10
Netherlands Antilles
Nicaragua 2 1 0 0 2 1 0 0
Panama 0 0 0 0 0 0 0 0
Paraguay 0 0 0 0 0 0 0 0
Peru 12 6 0 6 11 6 0 5
St Kitts amp Nevis 0 0 0 0 0 0 0 0
St Lucia 1 0 0 1 1 0 0 1
St Vincent amp Grenadines 2 1 0 1 2 1 0 1
Suriname 0 0 0 0 0 0 0 0
Trinidad amp Tobago 1 0 0 0 0 0 0 0
Uruguay 0 0 0 0 0 0 0 0
Venezuela (Boliv Rep of) 8 6 0 2 7 7 0 1
OCEANIA 2 2 0 0 2 2 0 0
Fiji 2 2 0 0 2 2 0 0
French Polynesia 0 0 0 0
New Caledonia 0 0 0 0 0 0 0 0
Papua New Guinea 0 0 0 0 0 0 0 0
Samoa 0 0 0 0 0 0 0 0
Solomon Islands 0 0 0 0 0 0 0 0
Tonga 0 0 0 0 0 0 0 0
Vanuatu 0 0 0 0 0 0 0 0
DEVELOPED REGIONS 1094 532 421 141 1055 505 397 153
NORTH AMERICA 4 2 0 1 4 3 0 1
Bermuda 0 0 0 0 0 0 0 0
Canada 0 0 0 0 0 0 0 0
United States of America 4 2 0 1 4 3 0 1
ASIA amp OCEANIA 3 1 0 1 2 2 0 1
Australia 0 0 0 0 0 0 0 0
Israel 2 1 0 1 2 1 0 1
Japan 0 0 0 0 0 0 0 0
New Zealand 0 0 0 0 0 0 0 0
EUROPE 1088 528 421 139 1048 500 397 151
Albania 17 16 0 2 16 15 0 1
Belarus 7 6 0 1 6 6 0 1
Bosnia amp Herzegovina 237 70 114 53 232 63 113 55
Croatia 103 76 2 25 89 66 2 21
European Union 39 14 0 24 20 13 0 7
Iceland 0 0 0 0 0 0 0 0
Macedonia FYR 9 8 0 1 11 8 0 3
Montenegro 3 3 0 0 3 3 0 0
Norway 0 0 0 0 0 0 0 0
Republic of Moldova 7 6 0 1 7 6 0 1
Russian Federation 204 109 80 14 199 112 53 34
Serbia 437 196 225 16 439 183 228 27
Switzerland 0 0 0 0 0 0 0 0
Ukraine 26 25 0 2 26 25 0 1
126
TABLE 14 Population at risk persons affected by natural disastersPersons affected by natural disasters
total droughtearthquake
extremetemperature
flood landslide storm volcanoeswildfiresand
epidemics
thousands thousands thousands thousands thousands thousands thousands thousands
2010 2010 2010 2010 2010 2010 2010 2010
WORLD 344655 106870 7485 3986 191861 2464 30954 1034
DEVELOPING REGIONS 342717 106870 6650 3971 191352 2464 30403 1007
AFRICA 43854 38810 0 0 4657 20 317 50
North Africa 81 0 0 0 81 0 0 0
Algeria 0 0 0 0 0 0 0 0
Egypt 4 0 0 0 4 0 0 0
Libya
Morocco 77 0 0 0 77 0 0 0
Tunisia
Sub-Saharan Africa 43773 38810 0 0 4577 20 317 50
Angola 255 0 0 0 255 0 0 0
Benin 832 0 0 0 831 0 0 1
Botswana 0 0 0 0 0 0 0 0
Burkina Faso 139 0 0 0 133 0 0 6
Burundi 184 180 0 0 3 0 2 0
Cameroon 6 0 0 0 3 0 0 3
Cape Verde
Central African Republic 2 0 0 0 2 0 0 0
Chad 2552 2400 0 0 145 0 0 7
Comoros
Congo 1 0 0 0 0 0 0 1
Cocircte drsquoIvoire 6 0 0 0 6 0 0 0
Congo Dem Rep 85 0 0 0 70 1 0 14
Djibouti 120 120 0 0 0 0 0 0
Equatorial Guinea
Eritrea
Ethiopia 9482 9400 0 0 81 0 0 1
Gabon 2 0 0 0 0 0 2 1
Gambia 39 0 0 0 39 0 0 0
Ghana 17 0 0 0 17 0 0 0
Guinea 48 0 0 0 48 0 0 0
Guinea-Bissau 57 0 0 0 57 0 0 0
Kenya 7514 7300 0 0 211 0 0 3
Lesotho 5 0 0 0 5 0 0 0
Liberia 15 0 0 0 15 0 0 0
Madagascar 1027 720 0 0 0 0 307 0
Malawi 79 0 0 0 79 0 0 0
Mali 619 600 0 0 19 0 0 0
Mauritania 309 300 0 0 9 0 0 0
Mauritius
Mozambique 544 460 0 0 81 0 0 4
Namibia 338 0 0 0 338 0 0 0
Niger 8134 7900 0 0 233 0 0 1
Nigeria 1509 0 0 0 1500 0 0 8
Rwanda 10 0 0 0 4 6 0 0
Senegal 103 0 0 0 103 0 0 0
Seychelles
Sierra Leone 0 0 0 0 0 0 0 0
Somalia 2866 2850 0 0 16 0 0 0
Sudan 4438 4300 0 0 138 0 0 0
South Africa 26 0 0 0 20 0 6 0
Swaziland
Tanzania Utd Rep
Togo 112 0 0 0 112 0 0 0
Uganda 613 600 0 0 0 13 0 0
Zambia 3 0 0 0 3 0 0 0
Zimbabwe 1681 1680 0 0 1 0 0 0
127
TABLE 14 Population at risk persons affected by natural disasters (continued)Persons affected by natural disasters
total droughtearthquake
extremetemperature
flood landslide storm volcanoeswildfiresand
epidemics
thousands thousands thousands thousands thousands thousands thousands thousands
2010 2010 2010 2010 2010 2010 2010 2010
ASIA 285231 67783 252 3900 181630 2388 28948 330
Central Asia 64 0 8 0 47 8 0 1
Kazakhstan 38 0 0 0 38 0 0 0
Kyrgyzstan 8 0 0 0 0 8 0 0
Tajikistan 17 0 8 0 9 0 0 0
Turkmenistan
Uzbekistan
East Asia 256254 66483 234 3800 154940 2294 28180 324
Brunei Darussalam
Cambodia 0 0 0 0 0 0 0 0
China 231535 60000 196 3800 140254 2148 25137 0
Indonesia 238 0 17 0 69 0 0 152
Korea DPR 96 0 0 0 56 0 40 0
Korea Republic of 42 0 0 0 0 0 42 0
Lao PDR
Malaysia 0 0 0 0 0 0 0 0
Mongolia
Myanmar 426 0 21 0 0 145 260 0
Philippines 6738 0 0 0 3901 1 2666 171
Singapore
Thailand 15654 6483 0 0 9171 0 0 1
Viet Nam 1524 0 0 0 1490 0 35 0
South Asia 27536 0 7 100 26570 86 768 5
Afghanistan 49 0 1 0 48 0 0 0
Bangladesh 987 0 0 100 575 55 257 0
Bhutan
India 4790 0 0 0 4283 0 507 0
Iran (Islamic Rep) 5 0 5 0 0 0 0 0
Maldives
Nepal 13 0 0 0 8 0 0 5
Pakistan 20399 0 1 0 20363 30 4 0
Sri Lanka 1292 0 0 0 1292 0 0 0
West Asia 1377 1300 4 0 74 0 0 0
Armenia
Azerbaijan 70 0 0 0 70 0 0 0
Bahrain
Cyprus
Georgia
Iraq 2 0 0 0 2 0 0 0
Jordan
Kuwait
Lebanon
Occupied PalestinianTerritory
0 0 0 0 0 0 0 0
Saudi Arabia 0 0 0 0 0 0 0 0
Syrian Arab Republic 1300 1300 0 0 0 0 0 0
Turkey 4 0 4 0 0 0 0 0
United Arab Emirates
Yemen 1 0 0 0 1 0 0 0
LATIN AMERICA amp THECARIBBEAN
13570 277 6397 71 5049 56 1093 628
Argentina 0 0 0 0 0 0 0 0
Bahamas
Barbados 2 0 0 0 0 0 2 0
Belize 0 0 0 0 0 0 0 0
Bolivia (Plur State) 428 62 0 0 358 4 0 3
Brazil 357 62 0 0 295 0 0 0
Chile 2676 0 2672 0 0 0 0 4
Colombia 3005 0 0 0 3005 0 0 0
Costa Rica 3 0 0 0 3 0 0 0
128
TABLE 14 Population at risk persons affected by natural disasters (continued)Persons affected by natural disasters
total droughtearthquake
extremetemperature
flood landslide storm volcanoeswildfiresand
epidemics
thousands thousands thousands thousands thousands thousands thousands thousands
2010 2010 2010 2010 2010 2010 2010 2010
Cuba
Dominica
Dominican Republic 52 0 0 0 39 0 12 0
Ecuador 121 108 0 0 11 0 0 2
El Salvador 12 0 0 0 0 0 12 0
French Guiana
Grenada 0 0 0 0 0 0 0 0
Guatemala 456 0 0 0 3 51 400 2
Guyana 0 0 0 0 0 0 0 0
Haiti 4310 0 3700 0 24 0 78 507
Honduras 102 45 0 0 5 0 25 27
Jamaica 3 0 0 0 0 0 3 0
Mexico 1600 0 25 0 1020 0 555 0
Netherlands Antilles
Nicaragua 76 0 0 0 76 0 0 0
Panama 33 0 0 0 33 0 0 0
Paraguay 16 0 0 0 0 0 0 16
Peru 154 0 0 71 80 1 0 2
St Kitts amp Nevis
St Lucia 3 0 0 0 2 0 1 0
St Vincent amp Grenadines
Suriname
Trinidad amp Tobago 0 0 0 0 0 0 0 0
Uruguay 0 0 0 0 0 0 0 0
Venezuela (Boliv Rep of) 95 0 0 0 95 0 0 0
OCEANIA 62 0 1 0 16 0 45 0
Fiji 39 0 0 0 0 0 39 0
French Polynesia 3 0 0 0 0 0 3 0
New Caledonia
Papua New Guinea 0 0 0 0 0 0 0 0
Samoa
Solomon Islands 18 0 1 0 16 0 1 0
Tonga 0 0 0 0 0 0 0 0
Vanuatu 0 0 0 0 0 0 0 0
DEVELOPED REGIONS 1922 0 835 15 509 0 536 27
NORTH AMERICA 36 0 1 0 7 0 29 0
Bermuda
Canada 0 0 0 0 0 0 0 0
United States of America 36 0 1 0 7 0 29 0
ASIA amp OCEANIA 1046 0 792 15 211 0 7 20
Australia 219 0 0 0 211 0 7 0
Israel 20 0 0 0 0 0 0 20
Japan 507 0 492 15 0 0 0 0
New Zealand 300 0 300 0 0 0 0 0
EUROPE 840 0 42 0 291 0 500 7
Albania 14 0 0 0 14 0 0 0
Belarus
Bosnia amp Herzegovina 35 0 0 0 35 0 0 0
Croatia 1 0 0 0 1 0 0 0
European Union 634 0 15 0 119 0 500 0
Iceland 0 0 0 0 0 0 0 0
Macedonia FYR
Montenegro 6 0 0 0 6 0 0 0
Norway
Republic of Moldova 12 0 0 0 12 0 0 0
Russian Federation 66 0 0 0 58 0 0 7
Serbia 32 0 27 0 5 0 0 0
Switzerland 0 0 0 0 0 0 0 0
Ukraine 40 0 0 0 40 0 0 0
129
TABLE 15 UndernourishmentShare of population undernourished Incidence of undernourishment Depth of hunger
pa millions millions pakcalcapday kcalcapday
pa
1995-97 2006-08 growth1995-97 -2006-08
1995-97 2006-08 growth1995-97 -2006-08
1995-97 2006-08 growth1995-97 -2006-08
WORLD 18 16 minus23 7012 7392 05 214 212 minus03
DEVELOPING REGIONS 18 16 minus23 7011 7392 05 234 234 minus03
AFRICA 29 23 minus24 1622 1603 minus01 253 234 minus05
North Africa 5 31 185 188 01
Algeria 5 15 180 180 00
Egypt 190 200 03
Libya 130 130 05
Morocco 6 16 210 200 minus03
Tunisia 120 120 00
Sub-Saharan Africa 31 23 minus23 1591 1603 01 268 243 minus05
Angola 61 41 minus35 78 72 minus07 390 320 minus17
Benin 18 12 minus36 10 10 00 230 210 minus08
Botswana 23 25 08 04 05 20 230 240 08
Burkina Faso 12 8 minus36 12 12 00 210 200 minus06
Burundi 56 62 09 35 49 31 350 390 14
Cameroon 34 22 minus39 50 42 minus16 260 230 minus08
Cape Verde 14 11 minus22 01 01 00 190 190 00
Central African Republic 47 40 minus15 16 17 06 320 300 minus02
Chad 53 39 minus27 39 41 05 370 320 minus12
Comoros 47 47 00 03 04 26 300 300 07
Congo 41 13 minus99 12 05 minus76 310 230 minus18
Cocircte drsquoIvoire 17 14 minus17 26 29 10 240 230 00
Congo Dem Rep
Djibouti 50 26 minus58 03 02 minus36 350 280 minus20
Equatorial Guinea
Eritrea 64 65 01 21 31 36 340 350 minus02
Ethiopia 62 41 minus37 362 326 minus09 390 320 minus17
Gabon 140 140 minus04
Gambia 23 19 minus17 03 03 00 250 240 05
Ghana 13 5 minus83 23 11 minus65 210 180 minus23
Guinea 19 16 minus15 15 16 06 270 260 minus02
Guinea-Bissau 26 22 minus15 03 03 00 260 250 00
Kenya 32 33 03 90 124 30 250 260 02
Lesotho 16 14 minus12 03 03 00 220 220 00
Liberia 32 32 00 07 11 42 330 330 02
Madagascar 26 25 minus04 35 47 27 250 250 05
Malawi 36 27 minus26 38 39 02 310 280 minus08
Mali 25 12 minus65 25 15 minus45 260 220 minus13
Mauritania 9 8 minus11 02 02 00 210 210 minus03
Mauritius 7 5 minus30 01 01 00 190 180 minus03
Mozambique 47 38 minus19 78 83 06 360 330 minus12
Namibia 30 18 minus45 05 04 minus20 250 220 minus08
Niger 37 16 minus73 35 23 minus37 300 240 minus14
Nigeria 10 6 minus45 109 94 minus13 200 180 minus12
Rwanda 53 32 minus45 30 30 00 360 300 minus06
Senegal 26 19 minus28 23 23 00 240 220 minus03
Seychelles 10 8 minus20 00 00 160 150 minus04
Sierra Leone 39 35 minus10 16 19 16 360 340 minus07
Somalia
Sudan 29 22 minus25 93 88 minus05 260 240 minus12
South Africa 160 150 00
Swaziland 21 19 minus09 02 02 00 220 220 09
Tanzania Utd Rep 42 34 minus19 128 139 08 300 280 05
Togo 36 30 minus16 17 19 10 290 280 minus06
Uganda 23 22 minus04 49 67 29 240 240 00
Zambia 38 44 13 36 54 38 300 320 06
Zimbabwe 44 30 minus34 53 37 minus32 340 300 minus06
130
TABLE 15 Undernourishment (continued)Share of population undernourished Incidence of undernourishment Depth of hunger
pa millions millions pakcalcapday kcalcapday
pa
1995-97 2006-08 growth1995-97 -2006-08
1995-97 2006-08 growth1995-97 -2006-08
1995-97 2006-08 growth1995-97 -2006-08
ASIA 16 15 minus21 4909 5372 08 233 238 minus02
Central Asia 12 13 minus20 46 55 16 171 172 minus01
Kazakhstan 130 120 00
Kyrgyzstan 13 11 minus15 06 06 00 210 210 minus03
Tajikistan 42 26 minus43 24 18 minus26 270 230 minus05
Turkmenistan 9 7 minus23 04 03 minus26 180 180 00
Uzbekistan 5 11 74 12 28 80 160 180 07
East Asia 13 11 minus18 2194 2058 minus06 241 241 minus04
Brunei Darussalam 140 130 minus05
Cambodia 40 25 minus42 47 36 minus24 280 250 minus05
China 12 10 minus16 1417 1296 minus08 250 250 minus05
Indonesia 11 13 15 220 297 28 210 220 00
Korea DPR 30 35 14 66 84 22 250 270 10
Korea Republic of 120 130 00
Lao PDR 29 22 minus25 14 14 00 270 260 minus05
Malaysia 120 130 minus05
Mongolia 33 27 minus18 08 07 minus12 260 260 02
Myanmar
Philippines 20 13 minus38 141 118 minus16 250 240 minus07
Singapore
Thailand 18 16 minus11 111 107 minus03 240 240 minus07
Viet Nam 22 11 minus61 167 96 minus49 270 240 minus12
South Asia 20 20 minus11 2570 3174 19 232 246 00
Afghanistan
Bangladesh 41 26 minus41 542 414 minus24 330 290 minus04
Bhutan
India 17 19 10 1671 2246 27 220 240 00
Iran (Islamic Rep) 170 180 07
Maldives 9 10 10 00 00 180 190 07
Nepal 20 17 minus15 44 47 06 230 220 minus03
Pakistan 20 25 20 268 428 43 260 280 00
Sri Lanka 25 20 minus20 45 39 minus13 260 250 minus02
West Asia 24 24 minus42 99 85 minus14 173 169 minus02
Armenia 36 21 minus48 11 06 minus54 230 200 minus14
Azerbaijan 27 22 220 140 minus28
Bahrain
Cyprus 120 120 00
Georgia 19 6 minus99 10 03 minus104 200 160 minus39
Iraq
Jordan 5 02 170 150 00
Kuwait 5 5 00 01 01 00 180 190 minus12
Lebanon 160 170 04
Occupied PalestinianTerritory
10 21 70 03 08 93 160 190
Saudi Arabia 130 130 minus05
Syrian Arab Republic 160 170 04
Turkey 160 160 04
United Arab Emirates 130 140 05
Yemen 31 30 minus03 50 67 27 260 260 02
LATIN AMERICA amp THECARIBBEAN
14 11 minus19 480 416 minus13 212 203 minus03
Argentina 120 130 00
Bahamas 8 6 minus26 00 00 160 160 00
Barbados 140 140 05
Belize 8 5 minus42 00 00 180 170 00
Bolivia (Plur State) 24 27 11 19 25 25 230 240 00
Brazil 10 6 minus45 166 117 minus31 240 220 minus05
Chile 150 140 minus08
Colombia 11 9 minus18 40 41 02 210 210 minus03
Costa Rica 150 150 04
131
TABLE 15 Undernourishment (continued)Share of population undernourished Incidence of undernourishment Depth of hunger
pa millions millions pakcalcapday kcalcapday
pa
1995-97 2006-08 growth1995-97 -2006-08
1995-97 2006-08 growth1995-97 -2006-08
1995-97 2006-08 growth1995-97 -2006-08
Cuba 14 15 190 120 minus18
Dominica 150 150 00
Dominican Republic 26 24 minus07 21 23 08 240 230 minus03
Ecuador 16 15 minus06 18 20 10 190 190 minus03
El Salvador 12 9 minus26 07 06 minus14 200 190 minus03
French Guiana
Grenada 18 21 14 00 00 240 250 08
Guatemala 20 22 09 21 29 30 220 230 06
Guyana 11 8 minus29 01 01 00 200 190 minus12
Haiti 60 57 minus05 48 55 12 430 420 minus03
Honduras 16 12 minus26 09 09 00 240 230 minus05
Jamaica 6 5 minus16 02 01 minus61 170 170 minus07
Mexico 190 190 00
Netherlands Antilles 150 150 minus11
Nicaragua 38 19 minus61 18 11 minus44 310 260 minus18
Panama 20 15 minus26 06 05 minus16 230 220 minus03
Paraguay 10 10 00 05 06 17 200 210 minus03
Peru 21 16 minus24 50 45 minus10 230 220 minus08
St Kitts amp Nevis 16 16 00 00 00 220 220 06
St Lucia 7 8 12 00 00 180 190 00
St Vincent amp Grenadines 16 5 minus100 00 00 210 170 minus10
Suriname 13 15 13 01 01 00 200 200 00
Trinidad amp Tobago 14 11 minus22 02 02 00 220 220 03
Uruguay 140 140 minus04
Venezuela (Boliv Rep of) 14 7 minus61 31 19 minus44 190 170 minus04
OCEANIA 8 9 00 01 182 173 minus06
Fiji 5 00 170 160 minus07
French Polynesia 5 00 160 150 minus11
New Caledonia 9 8 minus11 00 00 210 210 03
Papua New Guinea
Samoa 10 00 180 150 minus11
Solomon Islands 13 11 minus15 00 01 190 190 minus06
Tonga
Vanuatu 9 00 200 180 minus07
DEVELOPED REGIONS 5 01 125 116 01
NORTH AMERICA 111 101 minus02
Bermuda 180 200 07
Canada 120 110 minus10
United States of America 110 100 minus06
ASIA amp OCEANIA 128 126 00
Australia 130 120 00
Israel 90 90 00
Japan 130 130 00
New Zealand 120 120 00
EUROPE 5 01 131 121 01
Albania 160 160 minus07
Belarus 120 130 05
Bosnia amp Herzegovina 150 140 minus12
Croatia 180 150 minus18
European Union 5 01 120 115 minus02
Iceland 130 120 minus05
Macedonia FYR 180 150 minus11
Montenegro 170
Norway 120 110 minus05
Republic of Moldova 190 190 07
Russian Federation 160 130 minus09
Serbia 170
Switzerland 120 120 00
Ukraine 150 130 minus05
132
TABLE 16 Dietary energy supplies and changes in dietary compositionDietary energy supply per person Contribution in diets by type Contribution in diets by commodity
carbo-hydrates
proteins fats cereals starchy roots pulses
kcalcapday kcalcapday
1990-92 2006-08 2005-07 2005-07 2005-07 1990-92 2005-07 1990-92 2005-07 1990-92 2005-07
WORLD 2583 2805 65 11 24 53 48 8 7 5 5
DEVELOPING REGIONS 2430 2664 67 11 22 58 53 9 8 5 5
AFRICA 2266 2495 72 10 18 49 49 22 20 5 5
North Africa 3035 3175 71 11 17 62 60 2 3 2 2
Algeria 2890 3090 70 11 19 57 56 2 3
Egypt 3090 3160 73 12 15 66 64 2 2
Libya 3180 3150 63 10 27 47 47 2 3
Morocco 3000 3260 72 11 17 62 60 2 2
Tunisia 3120 3330 64 11 24 55 50 2 2
Sub-Saharan Africa 2102 2351 72 10 19 47 47 24 22 5 6
Angola 1580 1960 70 9 21 29 36 30 26 3 3
Benin 2250 2510 72 9 19 41 40 34 31 4 5
Botswana 2260 2230 67 11 22 43 43 6 6 5 6
Burkina Faso 2460 2690 68 12 20 75 73 5 5
Burundi 1860 1680 82 11 7 17 19 29 32 27 19
Cameroon 2020 2240 72 10 18 39 42 20 17 2 6
Cape Verde 2370 2530 63 11 26 50 45 4 4 4 3
Central African Republic 1880 1960 61 9 29 20 25 37 31
Chad 1700 2010 64 12 24 52 57 13 8 2 4
Comoros 1900 1840 69 9 22 41 38 17 15 6 9
Congo 1970 2570 69 8 23 19 26 41 34
Cocircte drsquoIvoire 2470 2500 74 8 18 35 33 31 33
Congo Dem Rep 80 6 14 16 23 57 55
Djibouti 1720 2300 63 10 27 52 52 2 3
Equatorial Guinea
Eritrea 1530 1590 73 12 15 72 74 5 3 8 5
Ethiopia 1550 1950 79 11 10 67 66 15 13 6 7
Gabon 2520 2710 69 12 19 25 33 21 17
Gambia 2470 2330 64 9 27 55 56
Ghana 2120 2900 77 8 15 32 29 39 37
Guinea 2420 2550 70 9 22 50 47 14 14
Guinea-Bissau 2290 2270 71 8 21 61 59 8 9
Kenya 1970 2030 68 11 21 47 49 8 5 6 7
Lesotho 2370 2460 77 11 12 76 78 2 3
Liberia 2220 2200 70 7 24 45 43 22 23
Madagascar 2200 2130 78 9 13 52 59 22 19
Malawi 1870 2150 77 10 13 69 59 4 15 7 6
Mali 2180 2590 70 11 19 69 67 1 3
Mauritania 2580 2810 63 12 25 55 51 4 4
Mauritius 2760 2930 62 11 26 48 46 3 3
Mozambique 1750 2070 76 7 17 34 40 41 37
Namibia 2060 2360 68 11 21 48 46 14 14 4 3
Niger 1970 2390 68 13 19 74 60 6 14
Nigeria 2310 2710 69 9 22 47 45 20 19 3 3
Rwanda 1830 2090 82 10 9 18 18 30 36 15 12
Senegal 2190 2280 65 10 25 64 60 1 3
Seychelles 2280 2400 60 14 26 46 41
Sierra Leone 1950 2120 67 10 24 55 50 5 10 4 5
Somalia
Sudan 1960 2280 61 13 26 57 50 2 3
South Africa 2820 3000 65 11 24 53 54
Swaziland 2380 2290 68 11 21 52 50 5 5
Tanzania Utd Rep 2080 2020 75 10 15 47 46 24 17 5 7
Togo 1890 2150 71 9 20 48 49 28 25 2 4
Uganda 2280 2220 74 9 17 19 23 25 23 9 8
Zambia 2010 1880 73 10 17 65 61 13 14
Zimbabwe 1980 2210 66 10 24 62 56 2 2
133
TABLE 16 Dietary energy supplies and changes in dietary composition (continued)Dietary energy supply per person Contribution in diets by type Contribution in diets by commodity
carbo-hydrates
proteins fats cereals starchy roots pulses
kcalcapday kcalcapday
1990-92 2006-08 2005-07 2005-07 2005-07 1990-92 2005-07 1990-92 2005-07 1990-92 2005-07
ASIA 2434 2667 67 11 22 63 56 6 5 5 5
Central Asia 2715 2793 64 12 25 59 54 4 6
Kazakhstan 3280 3510 61 12 27 57 43 4 6
Kyrgyzstan 2400 2660 68 12 20 57 48 5 8
Tajikistan 2020 2190 64 10 26 63 63
Turkmenistan 2550 2740 65 13 23 57 61
Uzbekistan 2650 2560 64 12 25 59 57
East Asia 2508 2872 64 11 24 63 53 7 5 3 6
Brunei Darussalam 2730 2980 64 12 25 48 45
Cambodia 1870 2180 75 10 14 82 72 2 4
China 2580 2990 61 12 27 63 50 7 5
Indonesia 2390 2550 73 9 18 66 63 7 6
Korea DPR 2340 2110 74 11 15 60 62 3 7 6 5
Korea Republic of 2970 3040 63 11 25 54 44
Lao PDR 2010 2240 76 11 13 78 70 6 4
Malaysia 2720 2890 63 11 26 42 47 3 2
Mongolia 2080 2240 56 13 32 42 46 2 4
Myanmar 67 11 22 73 59 2 6
Philippines 2230 2580 73 9 18 53 57 4 3
Singapore
Thailand 2250 2540 71 9 20 57 49
Viet Nam 2090 2780 70 10 19 76 66
South Asia 2279 2374 71 10 19 65 60 2 3 5 5
Afghanistan
Bangladesh 1960 2270 80 9 12 84 78 1 3
Bhutan
India 2290 2360 71 10 19 64 60 5 5
Iran (Islamic Rep) 2970 3050 69 11 20 60 53 3 4
Maldives 2400 2550 60 16 23 46 35
Nepal 2190 2340 74 10 15 74 69 3 5 3 3
Pakistan 2210 2280 63 10 27 55 47 3 3
Sri Lanka 2170 2370 73 9 18 56 56 4 2 3 3
West Asia 2963 3067 64 11 25 51 49 3 3 4 3
Armenia 1920 2260 64 12 24 59 44 8 5
Azerbaijan 2160 3020 73 11 16 66 60 2 6
Bahrain
Cyprus 3120 3190 48 12 41 28 21 3 3
Georgia 1850 2730 67 11 22 57 50 5 3
Iraq
Jordan 2840 3000 63 10 27 50 46 3 2
Kuwait 2350 3030 58 12 30 39 42 2 2
Lebanon 3010 3090 58 11 32 34 34 3 6 4 3
Occupied PalestinianTerritory
2080 66 11 23 0 51
Saudi Arabia 2850 3120 64 11 25 48 48
Syrian Arab Republic 2830 3040 59 10 30 50 45
Turkey 3590 3500 62 11 27 51 48 3 3 4 3
United Arab Emirates 3160 3170 63 13 24 33 43 3 4
Yemen 1980 2050 69 11 20 66 61 3 3
LATIN AMERICA amp THECARIBBEAN
2664 2915 62 11 27 39 37 6 6 5 5
Argentina 3010 3030 55 13 32 32 31 3 3
Bahamas 2610 2710 57 12 30 27 27 2 2
Barbados 3040 3020 59 12 29 30 27 3 3
Belize 2510 2710 67 11 23 37 39 4 4
Bolivia (Plur State) 2030 2100 71 11 18 43 47 9 7
Brazil 2760 3120 59 11 30 33 32 5 5 5 5
Chile 2600 2960 61 12 27 43 40 4 4
Colombia 2410 2690 66 10 24 33 34 8 6
Costa Rica 2820 2820 62 11 27 32 31 3 4
134
TABLE 16 Dietary energy supplies and changes in dietary composition (continued)Dietary energy supply per person Contribution in diets by type Contribution in diets by commodity
carbo-hydrates
proteins fats cereals starchy roots pulses
kcalcapday kcalcapday
1990-92 2006-08 2005-07 2005-07 2005-07 1990-92 2005-07 1990-92 2005-07 1990-92 2005-07
Cuba 2720 3420 73 10 17 34 40 5 7 4 7
Dominica 3000 3090 64 12 24 26 25 7 9
Dominican Republic 2160 2270 61 9 30 30 29 5 4
Ecuador 2110 2300 55 10 35 35 34
El Salvador 2400 2580 67 11 22 56 44 1 2 4 6
French Guiana
Grenada 2470 2400 54 12 34 28 22 2 3 3 3
Guatemala 2290 2150 67 11 23 58 51 6 4
Guyana 2300 2740 68 11 21 53 46 4 4 3 2
Haiti 1730 1850 74 9 17 44 46 11 9 8 5
Honduras 2300 2610 66 10 24 51 44 4 5
Jamaica 2510 2840 61 11 28 34 32 9 5
Mexico 3090 3260 62 11 26 47 44 4 4
Netherlands Antilles 3280 3260 64 11 24 36 36 4 3
Nicaragua 1770 2420 68 10 22 47 50 8 7
Panama 2320 2450 65 12 24 39 43 2 2
Paraguay 2390 2660 58 11 32 27 29 18 13 4 5
Peru 2110 2410 74 11 15 49 44 8 14 2 3
St Kitts amp Nevis 2580 2460 59 12 29 32 26 3 2 2 2
St Lucia 2580 2710 58 14 28 30 28 6 2
St Vincent amp Grenadines 2360 2860 64 11 25 30 33 7 5 2 2
Suriname 2440 2460 68 9 23 50 42 2 2
Trinidad amp Tobago 2610 2700 65 10 25 39 34 2 2 4 3
Uruguay 2660 2840 64 11 25 35 43 4 4
Venezuela (Boliv Rep of) 2460 2650 64 11 26 36 37 3 3
OCEANIA 2549 2850 60 10 30 32 34 15 14 3 2
Fiji 2640 3000 60 10 29 43 41 4 7 3 2
French Polynesia 2480 2880 48 14 39 25 31 5 4
New Caledonia 3210 3150 52 12 35 35 32 6 5
Papua New Guinea
Samoa 2550 2890 46 11 43 23 18 10 10
Solomon Islands 2120 2400 73 9 18 25 34 40 34 3 3
Tonga
Vanuatu 2530 2950 60 9 31 22 31 22 18
DEVELOPED REGIONS 3260 3426 53 12 35 29 28 5 5
NORTH AMERICA 3464 3728 49 12 38 23 22 3 3
Bermuda 2870 2650 48 12 40 19 24
Canada 3050 3530 51 12 37 21 25 4 4
United States of America 3510 3750 49 12 38 23 22 3 3
ASIA amp OCEANIA 2969 2892 56 13 31 36 35 3 3
Australia 3130 3220 46 13 40 22 22 3 3
Israel 3410 3530 49 14 37 35 33 2 2
Japan 2920 2800 58 13 29 39 38
New Zealand 2810 2810 54 12 34 23 24 3 4
EUROPE 3228 3401 54 12 34 30 30 6 5
Albania 2560 2890 58 14 29 57 40 1 2
Belarus 3180 3150 56 12 32 37 30 10 11
Bosnia amp Herzegovina 2670 3080 67 11 21 61 45 5 5
Croatia 2420 2990 57 11 32 30 31 7 4
European Union 3341 3453 51 12 37 26 28 5 4
Iceland 3090 3260 45 16 39 23 20 3 3
Macedonia FYR 2550 3060 55 10 34 44 34 3 3
Montenegro
Norway 3230 3450 51 12 36 27 28 5 4
Republic of Moldova 2880 2850 70 11 20 55 48 5 5
Russian Federation 2960 3320 63 12 25 40 36 8 7
Serbia
Switzerland 3370 3450 49 11 41 22 21
Ukraine 3040 3290 63 11 26 43 36 8 8
135
TABLE 17 Changes in dietary compositionContribution in diets by commodity
meat and fish dairy and eggs fruit and vegetables sugar vegetable oils other
1990-92 2005-07 1990-92 2005-07 1990-92 2005-07 1990-92 2005-07 1990-92 2005-07 1990-92 2005-07
WORLD 8 11 5 5 4 5 8 8 8 9 11 13
DEVELOPING REGIONS 7 10 4 4 4 5 7 7 7 8 10 12
AFRICA 4 4 5 6 6 6 6 6 9 9 11 11
North Africa 3 3 3 3 6 7 10 9 9 7 7 9
Algeria 3 3 6 6 3 5 9 9 14 10 6 8
Egypt 2 3 2 2 7 9 10 8 6 4 5 8
Libya 5 4 5 5 8 7 12 10 14 16 7 8
Morocco 3 3 4 6 10 11 8 8 11 10
Tunisia 3 3 4 5 6 6 9 10 15 14 6 10
Sub-Saharan Africa 4 4 7 7 6 6 5 5 9 9 12 12
Angola 5 5 7 8 14 12 12 10
Benin 2 2 6 8 13 14
Botswana 6 4 9 7 11 13 6 9 14 12
Burkina Faso 3 3 4 5 13 14
Burundi 10 15 17 15
Cameroon 3 3 10 8 3 4 8 8 15 12
Cape Verde 6 9 5 8 2 2 7 9 10 8 12 12
Central African Republic 7 8 4 4 3 4 14 14 15 14
Chad 4 4 5 5 24 22
Comoros 8 7 4 6 8 11 16 14
Congo 4 3 5 4 4 6 12 15 15 12
Cocircte drsquoIvoire 8 7 4 4 10 11 12 12
Congo Dem Rep 7 3 7 7 13 12
Djibouti 5 6 5 5 19 11 10 16 7 7
Equatorial Guinea
Eritrea 1 4 4 6 10 8
Ethiopia 3 2 2 3 7 9
Gabon 8 8 16 12 6 6 5 6 19 18
Gambia 2 2 17 12 13 17 13 13
Ghana 7 11 3 4 7 7 12 12
Guinea 13 10 4 5 11 14 8 10
Guinea-Bissau 4 4 4 3 1 6 13 12 9 7
Kenya 8 7 4 5 10 9 8 8 9 10
Lesotho 4 4 7 6 11 9
Liberia 4 4 2 3 16 19 11 8
Madagascar 6 4 3 3 3 3 3 4 11 8
Malawi 4 5 7 5 9 10
Mali 3 3 5 5 4 5 9 7 9 10
Mauritania 5 5 11 10 10 12 9 12 6 6
Mauritius 4 6 6 6 2 4 14 12 14 15 9 8
Mozambique 1 4 13 9 11 10
Namibia 6 6 4 5 16 10 2 7 6 9
Niger 4 5 3 3 2 3 3 5 8 10
Nigeria 3 3 2 3 13 13 12 14
Rwanda 21 18 2 4 14 12
Senegal 3 3 2 2 7 6 13 15 10 11
Seychelles 10 11 6 4 5 7 14 10 7 8 12 19
Sierra Leone 3 3 20 15 13 17
Somalia
Sudan 4 5 12 17 8 10 7 5 10 10
South Africa 8 9 3 3 12 10 8 12 16 12
Swaziland 5 6 4 5 3 3 15 13 7 6 9 12
Tanzania Utd Rep 3 6 3 5 5 7 13 12
Togo 9 10 13 12
Uganda 20 17 1 4 3 7 23 18
Zambia 3 3 8 6 4 6 7 10
Zimbabwe 3 4 11 12 8 10 14 16
136
TABLE 17 Changes in dietary composition (continued)Contribution in diets by commodity
meat and fish dairy and eggs fruit and vegetables sugar vegetable oils other
1990-92 2005-07 1990-92 2005-07 1990-92 2005-07 1990-92 2005-07 1990-92 2005-07 1990-92 2005-07
ASIA 8 12 3 4 3 4 6 6 7 8 9 12
Central Asia 7 7 9 10 2 4 5 6 9 9 8 9
Kazakhstan 10 9 8 13 1 3 6 9 5 8 9 9
Kyrgyzstan 11 7 12 12 2 4 6 9 4 5 3 7
Tajikistan 3 4 6 5 6 7 11 11 11 10
Turkmenistan 7 10 8 9 2 3 6 4 11 6 9 7
Uzbekistan 6 6 9 9 3 4 4 3 12 11 7 10
East Asia 9 14 1 2 3 5 4 4 6 7 9 13
Brunei Darussalam 9 8 7 9 5 5 12 13 7 8 12 12
Cambodia 5 5 1 4 2 3 8 12
China 9 15 1 2 3 6 3 2 6 7 8 13
Indonesia 2 3 6 6 7 8 12 14
Korea DPR 5 5 8 7 5 6 13 8
Korea Republic of 7 11 7 8 10 11 8 12 14 14
Lao PDR 4 5 2 5 1 2 9 14
Malaysia 12 11 4 3 3 3 13 12 14 12 9 10
Mongolia 30 17 8 11 8 6 1 6 9 10
Myanmar 2 6 2 2 3 6 10 9 8 12
Philippines 10 12 6 6 12 9 6 4 9 9
Singapore
Thailand 8 9 5 4 8 14 5 6 17 18
Viet Nam 6 12 4 5 3 4 2 3 9 10
South Asia 2 4 4 5 2 3 9 8 7 9 9 11
Afghanistan
Bangladesh 3 4 4 7 8 8
Bhutan
India 4 4 2 2 9 8 7 9 9 12
Iran (Islamic Rep) 3 5 3 3 8 12 9 9 9 7 5 7
Maldives 10 17 3 7 4 9 17 13 7 7 13 12
Nepal 3 4 1 2 6 7 10 10
Pakistan 2 3 9 12 12 12 10 11 9 12
Sri Lanka 3 3 3 2 11 11 3 4 17 19
West Asia 5 6 6 6 9 7 9 10 10 12 9 10
Armenia 6 8 7 10 8 13 4 8 2 5 6 7
Azerbaijan 5 4 7 6 5 3 6 6 1 4 8 11
Bahrain
Cyprus 12 13 10 10 8 7 12 13 13 15 14 18
Georgia 7 5 7 10 7 14 2 7 15 11
Iraq
Jordan 5 5 5 5 3 2 15 15 11 15 8 10
Kuwait 11 11 8 5 7 7 12 11 11 12 10 10
Lebanon 5 7 4 5 15 9 11 11 14 14 10 11
Occupied PalestinianTerritory
0 5 0 5 100 8 0 12 0 10 0 9
Saudi Arabia 7 7 5 5 10 10 10 10 13 12 7 8
Syrian Arab Republic 4 4 6 7 4 3 12 13 12 12 12 16
Turkey 6 6 8 8 8 8 11 14 9 10
United Arab Emirates 11 10 9 5 12 9 11 12 9 6 12 11
Yemen 3 4 2 3 10 12 9 10 7 7
LATIN AMERICA amp THECARIBBEAN
7 10 6 6 5 5 16 14 10 11 11 11
Argentina 17 17 8 9 14 16 11 11 15 13
Bahamas 18 17 7 6 9 9 16 15 3 6 18 18
Barbados 16 15 7 7 3 7 16 19 10 9 15 13
Belize 8 8 7 6 8 8 15 15 3 4 18 16
Bolivia (Plur State) 9 10 2 2 7 6 14 13 4 3 12 12
Brazil 8 12 6 7 4 4 17 13 13 13 9 9
Chile 9 14 6 5 3 3 15 14 9 8 11 12
Colombia 7 7 7 8 7 7 19 17 9 11 10 10
Costa Rica 5 5 8 10 6 5 21 19 12 12 13 14
137
TABLE 17 Changes in dietary composition (continued)Contribution in diets by commodity
meat and fish dairy and eggs fruit and vegetables sugar vegetable oils other
1990-92 2005-07 1990-92 2005-07 1990-92 2005-07 1990-92 2005-07 1990-92 2005-07 1990-92 2005-07
Cuba 6 5 6 3 4 6 21 15 9 6 11 11
Dominica 10 11 9 9 11 12 15 14 8 5 14 15
Dominican Republic 6 9 5 4 13 9 15 16 15 16 11 13
Ecuador 6 10 7 7 11 10 9 8 18 17 14 14
El Salvador 2 4 5 7 4 4 15 15 5 6 8 12
French Guiana
Grenada 10 15 10 9 8 7 17 16 9 11 13 14
Guatemala 2 4 3 3 2 3 17 15 6 9 6 11
Guyana 3 6 3 6 1 3 14 13 4 7 15 13
Haiti 3 4 8 6 10 12 5 7 11 11
Honduras 3 6 5 7 5 6 16 17 9 9 7 6
Jamaica 7 8 4 6 5 7 20 16 10 12 11 14
Mexico 6 9 5 5 3 4 16 15 8 8 11 11
Netherlands Antilles 15 13 8 6 10 18 7 6 20 18
Nicaragua 3 4 4 5 14 15 9 9 15 10
Panama 6 8 7 7 5 4 14 12 11 8 16 16
Paraguay 12 9 4 4 4 3 9 9 8 12 14 16
Peru 3 4 3 4 4 6 12 9 5 5 14 11
St Kitts amp Nevis 11 13 8 8 2 3 15 17 13 11 14 18
St Lucia 16 20 8 8 8 7 14 13 3 5 15 17
St Vincent amp Grenadines 11 12 5 5 4 6 18 17 9 8 14 12
Suriname 7 8 7 6 15 18 7 12 12 12
Trinidad amp Tobago 5 7 6 7 3 3 19 21 11 10 11 13
Uruguay 20 10 10 7 2 3 11 13 6 8 12 12
Venezuela (Boliv Rep of) 6 9 6 4 7 4 15 16 15 14 12 13
OCEANIA 11 10 6 7 4 4 7 8 8 8 22 21
Fiji 12 11 7 10 12 10 19 19
French Polynesia 18 19 6 6 2 2 11 7 9 11 24 20
New Caledonia 11 10 7 8 2 3 11 8 12 13 16 21
Papua New Guinea
Samoa 19 17 5 8 9 9 2 7 32 31
Solomon Islands 4 3 4 4 2 4 22 18
Tonga
Vanuatu 10 8 6 5 4 6 6 5 30 27
DEVELOPED REGIONS 11 11 9 9 4 4 13 13 12 14 19 18
NORTH AMERICA 12 12 11 10 3 3 17 17 16 18 16 15
Bermuda 19 17 6 6 11 6 11 14 10 12 24 21
Canada 11 10 8 6 7 6 14 14 14 16 21 19
United States of America 12 12 11 10 3 3 17 17 16 18 15 15
ASIA amp OCEANIA 12 12 8 7 3 4 12 10 11 14 18 17
Australia 15 15 12 10 3 4 15 13 13 16 17 17
Israel 8 12 7 6 9 9 12 7 14 19 13 12
Japan 12 12 7 7 3 3 11 10 10 13 18 17
New Zealand 13 15 9 4 7 8 16 17 7 7 22 21
EUROPE 11 10 9 9 5 5 11 12 10 12 20 19
Albania 4 8 12 18 5 10 6 7 8 6 7 9
Belarus 11 11 11 7 1 3 10 11 4 11 16 16
Bosnia amp Herzegovina 4 4 6 10 5 8 4 6 2 6 13 16
Croatia 6 7 10 11 4 4 17 13 8 13 18 17
European Union 12 11 9 9 5 5 11 11 12 14 22 19
Iceland 17 21 14 16 3 4 18 13 5 6 17 17
Macedonia FYR 9 7 5 6 8 7 12 12 5 14 14 17
Montenegro
Norway 14 14 11 9 3 4 13 12 10 11 17 18
Republic of Moldova 5 4 8 11 2 2 9 12 5 6 11 12
Russian Federation 10 8 8 8 12 13 5 9 17 19
Serbia
Switzerland 16 14 12 11 4 3 13 17 11 13 22 21
Ukraine 7 6 8 9 13 15 7 10 14 16
138
TABLE 18 Health effects of malnutritionShare of children under 5 share of
lowweightnewborns
Share of adults Dietaryironsupply
underweightstunted wasted total with
low BMIwomenwith lowBMI
overweight or obese per person
male female mg day
2009 2009 2009 2009 2009 2009 2009 2009 2005-07
WORLD 18 28 9 13 91 129 145
DEVELOPING REGIONS 20 30 10 14 64 107 144
AFRICA 22 39 10 111 65 135 152
North Africa 7 24 7 10 172 361 163
Algeria 4 16 4 6 107 243 136
Egypt 7 31 8 13 16 225 463 177
Libya 6 21 7 215 413 140
Morocco 10 23 11 53 73 111 231 163
Tunisia 3 9 3 5 139 334 157
Sub-Saharan Africa 25 42 11 126 44 92 150
Angola 28 51 8 38 102 98
Benin 20 45 8 15 92 35 95 154
Botswana 11 29 6 13 30 228 147
Burkina Faso 26 35 11 16 208 17 30 242
Burundi 39 63 8 11 28 37 135
Cameroon 17 36 7 11 67 70 151 158
Cape Verde 6 63 153 121
Central African Republic 22 45 11 13 153 20 53 123
Chad 37 45 16 22 203 24 38 180
Comoros 25 7 13 25 105 35 53 92
Congo 12 31 8 13 132 28 75 120
Cocircte drsquoIvoire 17 40 9 17 82 39 97 111
Congo Dem Rep 28 46 14 185 07 30 84
Djibouti 30 33 26 10 67 138 102
Equatorial Guinea 11 35 3 79 148
Eritrea 35 44 15 14 13 23 132
Ethiopia 35 51 12 20 09 16 154
Gabon 9 26 4 66 84 215 155
Gambia 16 28 7 20 23 144 113
Ghana 14 29 9 13 164 86 44 117 140
Guinea 23 39 11 132 43 51 107
Guinea-Bissau 17 48 9 26 81 91
Kenya 16 35 7 8 123 25 68 134
Lesotho 17 45 6 57 31 266 164
Liberia 20 39 8 14 100 31 77 117
Madagascar 37 53 15 16 192 18 15 113
Malawi 16 53 4 14 92 26 62 162
Mali 28 39 15 135 24 68 187
Mauritania 23 29 13 130 43 233 133
Mauritius 15 10 14 14 129 230 132
Mozambique 21 47 5 15 86 26 78 88
Namibia 18 30 8 16 159 43 168 140
Niger 40 55 12 192 15 37 235
Nigeria 27 41 14 12 122 51 90 196
Rwanda 18 52 5 6 98 49 40 174
Senegal 15 20 9 19 182 32 125 113
Seychelles 6 5 2 151 337 153
Sierra Leone 21 37 11 14 112 36 101 114
Somalia 33 42 13 34 71
Sudan 32 38 21 41 89 157
South Africa 86 232 428 143
Swaziland 6 30 3 9 32 61 371 138
Tanzania Utd Rep 17 44 4 104 40 68 147
Togo 22 28 16 109 30 61 131
Uganda 16 39 6 14 121 43 49 145
Zambia 15 46 6 11 96 12 70 113
Zimbabwe 14 36 7 99 92 28 138 143
139
TABLE 18 Health effects of malnutrition (continued)Share of children under 5 share of
lowweightnewborns
Share of adults Dietaryironsupply
underweightstunted wasted total with
low BMIwomenwith lowBMI
overweight or obese per person
male female mg day
2009 2009 2009 2009 2009 2009 2009 2009 2005-07
ASIA 22 30 11 15 45 75 143
Central Asia 7 21 5 6 68 150 206 113
Kazakhstan 7 18 4 6 74 202 274 133
Kyrgyzstan 3 18 3 5 37 69 117 216 120
Tajikistan 15 33 9 10 80 116 127
Turkmenistan 12 22 6 4 99 139 145 98
Uzbekistan 4 20 5 5 59 145 198 99
East Asia 9 19 5 4 43 67 174
Brunei Darussalam 85 72 174
Cambodia 29 40 9 9 161 16 28 104
China 5 14 3 3 80 46 65 200
Indonesia 20 40 15 25 69 102
Korea DPR 18 45 9 37 39 156
Korea Republic of 1 3 1 47 65 69 77 218
Lao PDR 32 48 7 11 135 145 17 41 121
Malaysia 17 21 15 11 96 104 179 158
Mongolia 5 28 3 5 49 39 119 207 111
Myanmar 30 41 11 20 61 124
Philippines 21 32 7 21 123 142 45 83 99
Singapore 3 4 4 8 92 146 66 62
Thailand 7 16 5 192 49 118 117
Viet Nam 20 1 10 5 265 12 20 130
South Asia 40 46 18 27 329 21 42 106
Afghanistan 33 59 9 15 33
Bangladesh 41 43 18 297 10 13 81
Bhutan 12 38 5 9 47 66
India 44 48 20 28 329 356 13 25 108
Iran (Islamic Rep) 10 20 6 7 57 54 136 295 135
Maldives 18 20 10 65 261 177
Nepal 39 49 13 21 244 14 16 152
Pakistan 31 42 14 32 312 316 35 84 89
Sri Lanka 22 19 12 17 162 26 73 118
West Asia 10 23 6 224 356 144
Armenia 4 18 5 7 52 144 302 118
Azerbaijan 8 27 7 10 48 158 321 120
Bahrain 8 14 7 289 382
Cyprus 43 69 248 219 188
Georgia 2 15 3 5 159 257 105
Iraq 7 28 6 15 223 362
Jordan 2 8 2 13 30 39 273 417 112
Kuwait 2 4 2 7 25 07 372 524 172
Lebanon 4 17 7 264 297 161
Occupied PalestinianTerritory
2 12 2 102
Saudi Arabia 5 9 12 70 49 295 435 159
Syrian Arab Republic 10 28 12 9 238 390 133
Turkey 4 16 1 11 35 16 228 356 158
United Arab Emirates 302 430 196
Yemen 43 58 15 252 105 227 103
LATIN AMERICA amp THECARIBBEAN
4 14 2 8 30 190 279 140
Argentina 2 8 1 7 34 274 310 122
Bahamas 11 267 426 174
Barbados 5 10 4 14 32 33 216 442 192
Belize 5 22 2 14 244 454 167
Bolivia (Plur State) 5 27 1 6 20 100 271 102
Brazil 2 7 2 8 40 35 165 221 137
Chile 1 2 0 08 11 245 336 138
Colombia 3 13 1 6 39 119 237 112
Costa Rica 1 6 1 7 209 283 140
140
TABLE 18 Health effects of malnutrition (continued)Share of children under 5 share of
lowweightnewborns
Share of adults Dietaryironsupply
underweightstunted wasted total with
low BMIwomenwith lowBMI
overweight or obese per person
male female mg day
2009 2009 2009 2009 2009 2009 2009 2009 2005-07
Cuba 5 73 62 133 275 186
Dominica 10 101 391 177
Dominican Republic 3 10 2 11 144 293 100
Ecuador 6 29 2 10 19 157 282 81
El Salvador 7 21 2 29 202 329 157
French Guiana
Grenada 9 149 321 137
Guatemala 13 48 1 20 138 267 131
Guyana 11 18 8 83 271 127
Haiti 19 30 10 155 84 84 99
Honduras 9 30 1 10 40 129 263 140
Jamaica 3 5 5 100 382 150
Mexico 4 15 2 8 14 267 384 178
Netherlands Antilles 128
Nicaragua 6 23 2 37 168 313 136
Panama 6 22 1 10 36 194 321 117
Paraguay 3 18 1 162 223 139
Peru 5 28 1 19 111 217 158
St Kitts amp Nevis 11 320 494 153
St Lucia 12 15 8 11 119 319 158
St Vincent amp Grenadines 8 164 335 130
Suriname 8 11 5 11 165 346 98
Trinidad amp Tobago 4 5 5 19 216 380 134
Uruguay 6 14 3 8 207 260 113
Venezuela (Boliv Rep of) 4 16 5 8 266 348 114
OCEANIA 17 42 4 11 158 265
Fiji 10 61 56 213 422 179
French Polynesia 195
New Caledonia 183
Papua New Guinea 18 44 4 11 118 201
Samoa 2 4 1 453 667 175
Solomon Islands 16 34 7 13 19 253 392 137
Tonga 3 491 703
Vanuatu 12 26 6 10 19 29 229 368 167
DEVELOPED REGIONS 216 230 149
NORTH AMERICA 1 4 1 296 323 142
Bermuda 148
Canada 26 246 239 165
United States of America 1 4 1 24 302 332 139
ASIA amp OCEANIA 3 8 1 94 96 82 191
Australia 7 10 28 252 249 149
Israel 8 232 276 197
Japan 3 8 1 115 108 55 35 199
New Zealand 6 13 16 262 277 152
EUROPE 205 219 144
Albania 6 23 9 217 205 128
Belarus 1 5 2 4 197 264 148
Bosnia amp Herzegovina 2 12 4 5 227 253 202
Croatia 0 1 2 5 02 228 194 116
European Union 215 196 148
Iceland 4 23 30 234 203 208
Macedonia FYR 2 12 3 6 216 189 130
Montenegro 2 8 4 228 207
Norway 5 50 70 216 179 158
Republic of Moldova 3 11 5 6 59 100 288 142
Russian Federation 6 184 298 134
Serbia 2 8 5 6 255 203
Switzerland 35 59 183 116 126
Ukraine 4 23 8 4 54 155 236 127
141
TABLE 19 Trade and food security - caloric self-sufficiencyCaloric self-sufficiency
pa
1970 1980 1990 2000 2009 growth1970-2009
WORLD 1002 1002 1002 1002 1006 00
DEVELOPING REGIONS 997 968 983 964 948 minus04
AFRICA 1021 883 866 821 822 minus06
North Africa 901 638 660 668 761 minus13
Algeria 860
Egypt 930 602 605 668 827 minus03
Libya
Morocco 939 721 813 643 minus10
Tunisia 703 669 612 608 minus04
Sub-Saharan Africa 1044 957 962 920 873 minus06
Angola 1137 697 652 731 779 minus10
Benin 1107 1022 898 992 909 minus05
Botswana
Burkina Faso 1004 967 941 911 922 minus02
Burundi 985 968 981 971 891 minus03
Cameroon 1037 997 977 926 888 minus04
Cape Verde
Central African Republic 964 981 937 951 924 minus01
Chad 968 984 952 970 930 minus01
Comoros 901 825 701 783 692 minus07
Congo 1272 799 880 607 908 minus09
Cocircte drsquoIvoire 1044 1074 1205 1203 1092 01
Congo Dem Rep 1025 962 961 953 879 minus04
Djibouti
Equatorial Guinea 1483 1049 879 835 694 minus19
Eritrea 678
Ethiopia 899 908
Gabon 851 802 763 630 588 minus09
Gambia 1462 1241 703 638 535 minus25
Ghana 1041 990 977 986 939 minus03
Guinea 977 914 863 879 879 minus03
Guinea-Bissau 1055 950 881 871 1048 minus00
Kenya 1004 901 899 742 610 minus13
Lesotho 712 535 536
Liberia 878 823 855 654 707 minus06
Madagascar 1047 975 981 900 918 minus03
Malawi 970 1077 944 994 989 00
Mali 971 970 969 939 940 minus01
Mauritania 682
Mauritius 1057 815
Mozambique 1148 928 811 866 824 minus08
Namibia 691 650 555 564 minus05
Niger 1199 991 941 882 945 minus06
Nigeria 1049 871 982 940 900 minus04
Rwanda 982 977 951 927 890 minus03
Senegal 1095 839 866 817 686 minus12
Seychelles 1055 547
Sierra Leone 946 888 840 751 898 minus01
Somalia 921 765 851 693 524 minus14
Sudan 998 1027 935 923 795 minus06
South Africa 1173 1325 1107 980 940 minus06
Swaziland 2814 1201 minus22
Tanzania Utd Rep 1027 947 1001 902 914 minus03
Togo 1066 966 910 940 840 minus06
Uganda 1010 979 999 965 933 minus02
Zambia 797 711 901 976 1005 06
Zimbabwe 1242 1039 1307 1094 538 minus21
142
TABLE 19 Trade and food security - caloric self-sufficiency (continued)Caloric self-sufficiency
pa
1970 1980 1990 2000 2009 growth1970-2009
ASIA 980 970 987 969 943 03
Central Asia 1138 1002
Kazakhstan 1628 1235
Kyrgyzstan 918 808
Tajikistan 625 574
Turkmenistan 939 895
Uzbekistan 833 841
East Asia 995 982 1017 997 970 minus01
Brunei Darussalam
Cambodia 1075 883 990 939 951 minus03
China 982 953 963 970 895 minus02
Indonesia 1002 964 1036 1039 1247 06
Korea DPR 920 943 906 635 903 minus00
Korea Republic of 755 533
Lao PDR 904 982 987 976 1027 03
Malaysia 925 1336 1540 1340 1455 12
Mongolia 791 845 929 586 627 minus06
Myanmar 1094 1054 1009 1019 1003 minus02
Philippines 1245 1204 1012 922 893 minus08
Singapore
Thailand 1296 1552 1784 1390 1421 02
Viet Nam 797 932 1094 1074 961 05
South Asia 969 955 957 934 906 minus02
Afghanistan 968 984 881 680 812 minus04
Bangladesh 901 894 906 848 800 minus03
Bhutan 834 936 776 707 952 03
India 979 983 1000 986 957 minus01
Iran (Islamic Rep) 958 714 690 606 650 minus10
Maldives
Nepal 1092 991 982 943 920 minus04
Pakistan 991 982 900 926 909 minus02
Sri Lanka 717 792 778 682 721 00
West Asia 868 890 824 876 832
Armenia 539
Azerbaijan 693 734
Bahrain
Cyprus 631
Georgia
Iraq 858
Jordan
Kuwait
Lebanon
Occupied PalestinianTerritory
Saudi Arabia 692
Syrian Arab Republic 724 841 657 679 560 minus07
Turkey 966 1018 921 955 933 minus01
United Arab Emirates
Yemen 709 543
LATIN AMERICA amp THECARIBBEAN
1078 1040 1049 1026 1125 minus06
Argentina 1708 1895 2095 2454 2736 12
Bahamas
Barbados 1754 597 514
Belize 2460 1539
Bolivia (Plur State) 827 870 1024 1201 1421 14
Brazil 1058 1071 1123 1124 1406 07
Chile 843 677 964 680 697 minus05
Colombia 982 925 965 839 783 minus06
Costa Rica 1170 1086 1007 949 910 minus06
143
TABLE 19 Trade and food security - caloric self-sufficiency (continued)Caloric self-sufficiency
pa
1970 1980 1990 2000 2009 growth1970-2009
Cuba 2382 2213 1486 594
Dominica 941 555 527 517 minus15
Dominican Republic 2375 1259 815 508 538 minus37
Ecuador 1080 982 989 1015 1008 minus02
El Salvador 974 880 804 664 701 minus08
French Guiana
Grenada 776 653 501
Guatemala 1000 1099 1054 1267 1199 05
Guyana 2957 2046 1337 2674 1695 minus14
Haiti 958 818 652 528 510 minus16
Honduras 1124 1096 1010 868 880 minus06
Jamaica 1124 559 565
Mexico 997 771 744 669 696 minus09
Netherlands Antilles
Nicaragua 1195 867 913 937 951 minus06
Panama 1103 1105 922 637 544 minus18
Paraguay 1035 1132 1580 1663
Peru 952 636 668 684 661 minus09
St Kitts amp Nevis 1537 1019 524
St Lucia 1012 892 919
St Vincent amp Grenadines 827 517 826
Suriname 834 1163 886 793 792 minus01
Trinidad amp Tobago 1058
Uruguay 1106 1210 1663 1350 2324 19
Venezuela (Boliv Rep of) 724 616 584 619 minus04
OCEANIA 1177 1169 1342 1388 1369 minus04
Fiji 2610 1943 1322
French Polynesia 915 860 600
New Caledonia
Papua New Guinea 1162 1127 1192 1354 1431 05
Samoa 1172 1340 931 836 729 minus12
Solomon Islands 1331 1745 1903 1340 1222 minus02
Tonga 1216 1160 810 793 759 minus12
Vanuatu 1555 1329 1392 1323 1078 minus09
DEVELOPED REGIONS 1064 1190 1181 1122 1140 18
NORTH AMERICA 1260 1612 1353 1321 1290 01
Bermuda
Canada 1585 1717 1538 1607 1832 04
United States of America 1226 1599 1328 1286 1238 00
ASIA amp OCEANIA 2321 1787 2667 2720 2040 minus02
Australia 2416 2907 2931 2075 minus04
Israel
Japan
New Zealand 1833 1787 1443 1646 1859 00
EUROPE 913 873 935 967 1012 03
Albania 875 973 792 601 615 minus09
Belarus 775 1036
Bosnia amp Herzegovina 548 625
Croatia 1016 1086
European Union 851 877 982 987 925 02
Iceland
Macedonia FYR 727 681
Montenegro
Norway 588 621 714 643 501 minus04
Republic of Moldova 1074 1333
Russian Federation 884 1131
Serbia 1262
Switzerland 551 716 662 627
Ukraine 1081 1933
144
TABLE 20 Trade and food security - import billsFood import bills Food + energy import bills share of GDP
total per capita
millionUS$
millionUS$
pa US$ US$ pa pa
2000 2010 growth2000-2010
2000 2010 growth2000-2010
2000 2010 growth2000-2010
WORLD 3980557 10296380 100 651 1495 87 33 58 58
DEVELOPING REGIONS 1162631 3731805 124 236 660 108 44 73 52
AFRICA 179991 597794 128 222 585 102 57 82 38
North Africa 87973 250019 110 620 1507 93 53 86 50
Algeria 25413 78633 120 832 2217 103 49 60 20
Egypt 32784 97155 115 485 1198 95 44 89 74
Libya 7941 15315 68 1518 2410 47 28 42 41
Morocco 15154 40877 104 526 1279 93 96 142 40
Tunisia 6546 18039 107 692 1721 95 72 96 29
Sub-Saharan Africa 92018 347775 142 138 406 114 60 80 30
Angola 6384 22925 136 458 1201 101 92 33 minus97
Benin 1120 6475 192 172 732 156 92 166 61
Botswana 2561 5778 85 1457 2879 70 63 120 66
Burkina Faso 931 2586 107 76 157 76 89 79 minus12
Burundi 270 1011 141 42 121 110 69 109 47
Cameroon 2542 11843 166 162 604 141 60 89 41
Cape Verde 593 1768 115 1357 3566 101 137 166 20
Central African Republic 242 719 115 65 163 96 32 62 70
Chad 415 2940 216 51 262 179 37 67 61
Comoros 119 605 177 211 823 146 80 128 48
Congo 995 7212 219 317 1784 188 34 83 94
Cocircte drsquoIvoire 3884 15493 148 234 785 129 117 150 25
Congo Dem Rep 2055 7116 132 41 108 101 68 84 21
Djibouti 374 1080 112 511 1215 90 73 118 49
Equatorial Guinea 332 2025 198 639 2893 163 65 189 112
Eritrea 1741 2244 26 475 427 minus10 257 143 minus57
Ethiopia 818 10336 289 12 125 259 41 88 79
Gabon 1380 4160 117 1117 2764 95 33 47 38
Gambia 613 958 46 473 555 16 138 147 07
Ghana 3348 16092 170 175 660 142 133 118 minus12
Guinea 1047 2455 89 125 246 70 72 122 55
Guinea-Bissau 97 670 213 78 442 189 35 125 135
Kenya 3846 14908 145 123 368 116 83 140 53
Lesotho 1226 2628 79 624 1210 68 343 155 minus77
Liberia 86 144 52 30 36 17 49 58 17
Madagascar 1207 3988 127 79 193 94 87 92 06
Malawi 518 1664 124 46 112 92 60 82 33
Mali 1144 4073 135 101 265 101 114 106 minus07
Mauritania 1071 5483 177 405 1585 146 141 272 68
Mauritius 2822 8861 121 2360 6821 112 111 181 50
Mozambique 1931 5066 101 106 217 74 75 112 40
Namibia 2126 3940 64 1121 1726 44 64 63 minus01
Niger 558 4720 238 51 304 195 80 170 78
Nigeria 14703 57626 146 119 364 118 41 47 12
Rwanda 425 2459 192 52 231 160 40 60 41
Senegal 3349 10256 118 352 825 89 146 192 28
Seychelles 304 1867 199 3850 21458 187 170 521 118
Sierra Leone 413 1694 152 100 289 112 131 264 73
Somalia 1411 6048 157 191 648 130
Sudan 3594 14751 152 105 339 124 37 29 minus25
South Africa 11075 40750 139 247 813 126 37 70 65
Swaziland 1792 4013 84 1684 3384 72 207 140 minus38
Tanzania Utd Rep 2208 7585 131 65 169 101 54 142 101
Togo 714 2051 111 149 340 86 131 208 48
Uganda 1766 5306 116 73 159 81 66 80 20
Zambia 694 2334 129 68 178 101 55 66 20
Zimbabwe 759 7845 263 61 624 263 226
145
TABLE 20 Trade and food security - import bills (continued)Food import bills Food + energy import bills share of GDP
total per capita
millionUS$
millionUS$
pa US$ US$ pa pa
2000 2010 growth2000-2010
2000 2010 growth2000-2010
2000 2010 growth2000-2010
ASIA 714793 2459868 132 199 611 118 51 82 50
Central Asia 9547 39240 152 172 646 141 54 56 04
Kazakhstan 3726 17041 164 249 1063 156 50 38 minus27
Kyrgyzstan 635 4573 218 128 857 209 140 280 71
Tajikistan 652 4582 215 106 666 202 309 204 minus41
Turkmenistan 1803 4291 91 400 851 78 40
Uzbekistan 2732 8754 124 110 319 112 37 51 32
East Asia 409084 1480333 137 216 725 129 57 88 44
Brunei Darussalam 1727 4502 101 5282 11283 79 29 46 47
Cambodia 938 5678 197 75 402 182 117 167 37
China 207426 837460 150 160 610 143 35 61 57
Indonesia 53 73 33
Korea DPR 2315 2171 minus06 101 89 minus12
Korea Republic of 71923 215999 116 1564 4483 111 85 156 63
Lao PDR 481 1632 130 91 263 113 67 92 32
Malaysia 33406 120525 137 1427 4244 115 78 147 66
Mongolia 778 3684 168 323 1337 153 179 207 15
Myanmar 2184 4950 85 49 103 78 65 40 minus48
Philippines 24056 58852 94 311 631 73 86 90 05
Singapore 32231 80440 96 8224 15816 68 206 448 81
Thailand 24502 82275 129 388 1190 119 81 151 64
Viet Nam 7115 60078 238 90 684 224 91 159 58
South Asia 95776 322413 129 66 189 112 34 83 94
Afghanistan 4174 6659 48 183 212 15 96
Bangladesh 11087 53509 170 86 360 154 37 76 74
Bhutan 220 1100 175 385 1515 147 85 159 65
India 31571 124317 147 30 102 130 26 93 136
Iran (Islamic Rep) 22803 62356 106 349 843 92 28 35 23
Maldives 774 1624 77 2834 5138 61 155 208 30
Nepal 1752 5754 126 72 192 103 72 107 41
Pakistan 15200 48709 124 105 281 103 69 100 38
Sri Lanka 8195 18386 84 437 881 73 83 93 11
West Asia 200387 617881 119 1130 2765 94 44 60 33
Armenia 1753 5934 130 570 1919 129 161 132 minus20
Azerbaijan 1996 9581 170 246 1043 155 49 24 minus68
Bahrain 7491 12547 53 11742 9942 minus16 104 73 minus35
Cyprus 3369 9773 112 3572 8852 95 89 115 26
Georgia 1434 8223 191 302 1889 201 92 157 55
Iraq 33338 83450 96 1397 2635 65 153
Jordan 8045 23347 112 1667 3774 85 118 227 68
Kuwait 9231 34226 140 4756 12505 102 26 32 24
Lebanon 9576 27103 110 2559 6410 96 115 159 33
Occupied PalestinianTerritory
4541 6448 36 1420 1596 12
Saudi Arabia 49863 148133 115 2488 5397 81 27 40 41
Syrian Arab Republic 6831 24656 137 427 1208 110 43 110 99
Turkey 17633 69629 147 277 957 132 35 55 46
United Arab Emirates 31295 98922 122 10318 13168 25 36 50 32
Yemen 7901 29831 142 446 1240 108 110 191 57
LATIN AMERICA amp THECARIBBEAN
258747 650107 97 496 1102 83 27 43 47
Argentina 11905 20384 55 322 504 46 07 14 66
Bahamas 2826 4630 51 9483 13498 36 89 147 51
Barbados 1080 3170 114 4028 11610 112 75 129 55
Belize 591 850 37 2353 2724 15 182 155 minus16
Bolivia (Plur State) 2394 3798 47 288 383 29 39 59 42
Brazil 35101 78639 84 201 403 72 18 24 25
Chile 11818 44242 141 766 2585 129 56 113 73
Colombia 13256 38065 111 333 822 94 16 25 49
Costa Rica 4059 11415 109 1036 2450 90 59 96 51
146
TABLE 20 Trade and food security - import bills (continued)Food import bills Food + energy import bills share of GDP
total per capita
millionUS$
millionUS$
pa US$ US$ pa pa
2000 2010 growth2000-2010
2000 2010 growth2000-2010
2000 2010 growth2000-2010
Cuba 7509 18935 97 676 1682 95
Dominica 273 460 54 3896 6759 57 153 222 38
Dominican Republic 7653 18710 94 891 1885 78 97 108 11
Ecuador 2997 17957 196 243 1241 177 36 83 89
El Salvador 6871 13533 70 1157 2185 66 98 128 27
French Guiana
Grenada 391 570 38 3836 5481 36 140 161 14
Guatemala 5612 17487 120 499 1215 93 69 113 51
Guyana 1074 1680 46 1466 2229 43 186 253 31
Haiti 3301 14633 161 382 1464 144 100 246 94
Honduras 5388 11595 80 866 1526 58 127 188 40
Jamaica 4677 7485 48 1811 2731 42 117 209 60
Mexico 82457 186109 85 825 1641 71 20 48 91
Netherlands Antilles 1124 1466 27 6243 7292 16
Nicaragua 2562 7105 107 505 1228 93 141 278 70
Panama 3690 9770 102 1248 2778 83 86 51 minus51
Paraguay 1585 4199 102 297 651 82 72 114 46
Peru 8304 29975 137 321 1031 124 37 57 44
St Kitts amp Nevis 314 487 45 6828 9373 32 141 131 minus07
St Lucia 571 274 minus71 3639 1572 minus80 184 492 103
St Vincent amp Grenadines 398 708 59 3683 6494 58 163 271 52
Suriname 582 2033 133 1247 3873 120 99 107 08
Trinidad amp Tobago 2561 7088 107 1983 5286 103 162 130 minus22
Uruguay 3455 8785 98 1041 2608 96 38 102 103
Venezuela (Boliv Rep of) 17548 60738 132 721 2096 113 20 22 13
OCEANIA 9099 24035 102 1122 2414 80 336 346 03
Fiji 1023 2604 98 1259 3025 92 90 257 111
French Polynesia 1886 3682 69 7924 13585 55
New Caledonia 1242 3050 94 5859 12151 76
Papua New Guinea 1789 6057 130 333 883 103 116 141 20
Samoa 250 722 112 1411 3948 108 178 227 25
Solomon Islands 101 862 240 246 1602 206 87 271 120
Tonga 131 490 141 1341 4710 134 126 282 84
Vanuatu 124 507 151 672 2111 121 75 169 85
DEVELOPED REGIONS 2817926 6564575 88 2361 5288 84 30 51 56
NORTH AMERICA 523687 1042686 71 1672 3026 61 19 33 55
Bermuda 313 1349 157 4964 20751 154
Canada 107827 241046 84 3516 7086 73 32 47 40
United States of America 414893 798725 68 1469 2573 58 18 31 56
ASIA amp OCEANIA 41 3163 4565 37 26 48 63
Australia 25799 82915 124 1346 3724 107 20 35 56
Israel 17637 46462 102 2932 6263 79 43 34 minus22
Japan 436892 575640 28 3475 4549 27 26 51 70
New Zealand 9144 28151 119 2370 6445 105 44 63 35
EUROPE 1804766 4788721 103 2488 6500 101 44 68 44
Albania 1978 6375 124 644 1990 119 81 105 26
Belarus 9010 24432 105 896 2546 110 335 294 minus13
Bosnia amp Herzegovina 6704 14597 81 1815 3882 79 166 157 minus05
Croatia 5845 19002 125 1297 4316 128 81 90 10
European Union 1630103 4127225 97 3385 8245 93 44 70 47
Iceland 2054 3803 64 7310 11886 50 51 74 37
Macedonia FYR 2299 6631 112 1144 3217 109 145 156 08
Montenegro 4438 7033 173
Norway 19698 53402 105 4386 10936 96 19 27 38
Republic of Moldova 518 4516 242 126 1264 259 189 181 minus04
Russian Federation 83028 391496 168 566 2739 171 40 36 minus11
Serbia 8668 879 92
Switzerland 34857 82665 90 4863 10786 83 29 43 41
Ukraine 6999 48454 213 143 1066 222 214 208 minus03
147
TABLE 21 Dimensions of povertyPoverty gap at Poverty headcount ratio Multi-
dimensional
$125 aday (ppp)
$2 a day(ppp)
nationalpovertyline
ruralpovertyline
$125 aday (ppp)
$2 a day(ppp)
nationalpovertyline
ruralpovertyline
poverty(MPI)
0 to 1
2009 2009 2009 2009 2009 2009 2009 2009 2009
WORLD
DEVELOPING REGIONS
AFRICA
North Africa
Algeria 14 65 32 45 68 236 226 303
Egypt 04 35 36 20 185 220 300 00
Libya
Morocco 05 31 25 140 90 145 00
Tunisia 05 30 25 128 38 00
Sub-Saharan Africa
Angola 299 424 543 702 05
Benin 157 335 120 140 473 753 390 460 04
Botswana 110 223 117 184 312 494 306 448
Burkina Faso 203 393 153 176 565 812 464 524 05
Burundi 364 561 234 242 813 935 669 689 05
Cameroon 12 82 123 175 96 304 399 550 03
Cape Verde 60 152 81 143 210 409 266 443
Central African Republic 313 468 331 350 628 801 620 694 05
Chad 256 439 216 233 619 833 550 586 03
Comoros 208 342 163 178 461 650 448 487 04
Congo 228 388 189 206 541 744 501 577 02
Cocircte drsquoIvoire 75 178 153 203 238 463 427 542 04
Congo Dem Rep 253 424 322 349 592 796 713 757 04
Djibouti 53 146 188 412 01
Equatorial Guinea
Eritrea 690
Ethiopia 96 289 83 85 390 776 389 393 06
Gabon 09 50 100 160 48 196 327 446 02
Gambia 121 249 251 305 343 567 580 678 03
Ghana 105 223 96 135 300 536 285 392 01
Guinea 150 310 176 220 433 696 530 630 05
Guinea-Bissau 165 348 250 278 488 779 647 691
Kenya 61 151 163 175 197 399 459 491 02
Lesotho 208 331 379 265 434 623 566 605 02
Liberia 408 595 244 263 837 948 638 677 05
Madagascar 265 469 268 289 678 896 687 735 04
Malawi 323 518 80 86 739 905 524 559 04
Mali 188 365 167 514 771 474 576 06
Mauritania 57 159 170 241 212 441 463 612 04
Mauritius
Mozambique 252 429 212 222 600 816 547 569 05
Namibia 246 365 130 160 491 622 380 490 02
Niger 119 306 196 212 431 759 595 639 06
Nigeria 296 469 228 266 644 839 547 638 03
Rwanda 409 572 240 260 768 896 585 642 04
Senegal 108 247 164 215 335 604 508 619 04
Seychelles 01 03 02 18
Sierra Leone 203 375 275 346 534 761 664 785 04
Somalia 05
Sudan
South Africa 33 123 70 174 357 230 01
Swaziland 294 458 329 370 629 810 692 750 02
Tanzania Utd Rep 281 475 99 110 679 879 334 374 04
Togo 114 279 229 293 387 693 617 743 03
Uganda 83 213 68 76 287 553 245 272 04
Zambia 328 483 285 388 643 815 593 768 03
Zimbabwe 160 720 440 02
148
TABLE 21 Dimensions of poverty (continued)Poverty gap at Poverty headcount ratio Multi-
dimensional
$125 aday (ppp)
$2 a day(ppp)
nationalpovertyline
ruralpovertyline
$125 aday (ppp)
$2 a day(ppp)
nationalpovertyline
ruralpovertyline
poverty(MPI)
0 to 1
2009 2009 2009 2009 2009 2009 2009 2009 2009
ASIA
Central Asia
Kazakhstan 01 03 31 45 02 15 154 217 00
Kyrgyzstan 01 55 100 120 19 294 431 508 00
Tajikistan 51 168 124 124 215 509 472 492 01
Turkmenistan 70 184 248 497
Uzbekistan 150 332 463 767 00
East Asia
Brunei Darussalam
Cambodia 61 202 72 83 283 565 301 345 03
China 40 122 159 363 28 25
Indonesia 36 155 25 31 187 506 142 174 01
Korea DPR
Korea Republic of
Lao PDR 89 248 339 660 276 317 03
Malaysia 00 02 08 18 00 23 38 82
Mongolia 62 172 101 134 224 491 352 466 01
Myanmar 02
Philippines 55 164 27 152 226 450 265 507 01
Singapore
Thailand 19 83 30 108 265 81 104 00
Viet Nam 23 109 35 46 131 385 145 187 01
South Asia
Afghanistan 79 83 360 375
Bangladesh 131 338 90 98 496 813 400 438 03
Bhutan 70 188 61 81 262 495 232 309 01
India 105 295 416 756 275 283 03
Iran (Islamic Rep) 03 18 14 80
Maldives 01 25 15 122 00
Nepal 197 378 75 85 551 776 309 346 03
Pakistan 43 187 226 603 223 270 03
Sri Lanka 10 74 31 32 70 291 152 157 00
West Asia
Armenia 02 23 49 121 13 124 265 255 00
Azerbaijan 02 15 20 10 78 158 185 00
Bahrain
Cyprus
Georgia 46 118 72 92 147 326 236 297 00
Iraq 06 55 45 90 40 253 229 393 01
Jordan 01 06 26 04 35 133 190 00
Kuwait
Lebanon
Occupied PalestinianTerritory
Saudi Arabia
Syrian Arab Republic 02 33 17 169 00
Turkey 09 26 27 91 181 387 00
United Arab Emirates 00
Yemen 42 148 89 106 175 466 348 401 03
LATIN AMERICA amp THECARIBBEAN
Argentina 04 08 09 24 00
Bahamas
Barbados
Belize 47 97 121 240 335 442 00
Bolivia (Plur State) 58 109 140 247 601 773 01
Brazil 11 32 38 99 214 00
Chile 04 08 08 24 151 129
Colombia 57 119 160 279 455 643 00
Costa Rica 01 11 07 54 217 230
149
TABLE 21 Dimensions of poverty (continued)Poverty gap at Poverty headcount ratio Multi-
dimensional
$125 aday (ppp)
$2 a day(ppp)
nationalpovertyline
ruralpovertyline
$125 aday (ppp)
$2 a day(ppp)
nationalpovertyline
ruralpovertyline
poverty(MPI)
0 to 1
2009 2009 2009 2009 2009 2009 2009 2009 2009
Cuba
Dominica
Dominican Republic 09 39 43 136 505 571 00
Ecuador 16 44 51 134 360 575 00
El Salvador 11 45 51 152 378 465
French Guiana
Grenada
Guatemala 65 129 169 298 510 705 01
Guyana 39 69 77 168 01
Haiti 282 418 549 722 770 880 03
Honduras 119 182 233 354 588 644 02
Jamaica 00 09 02 58 99 251
Mexico 17 32 34 81 474 608 00
Netherlands Antilles
Nicaragua 52 123 158 319 462 679 01
Panama 31 71 95 179 327 598
Paraguay 15 43 51 132 351 498 01
Peru 14 47 59 147 348 603 01
St Kitts amp Nevis
St Lucia 72 155 209 406
St Vincent amp Grenadines
Suriname 59 117 155 272 00
Trinidad amp Tobago 11 39 42 135 00
Uruguay 00 00 00 02 205 222 00
Venezuela (Boliv Rep of) 11 32 35 101 290
OCEANIA
Fiji 101 148 310 433
French Polynesia
New Caledonia
Papua New Guinea 123 255 124 138 358 574 375 413
Samoa
Solomon Islands
Tonga
Vanuatu 01
DEVELOPED REGIONS
NORTH AMERICA
Bermuda
Canada
United States of America
ASIA amp OCEANIA
Australia
Israel
Japan
New Zealand
EUROPE
Albania 02 08 23 26 06 42 124 146 00
Belarus 00 00 00 00 54
Bosnia amp Herzegovina 00 01 46 49 00 02 140 178 00
Croatia 00 00 26 00 00 111 00
European Union
Iceland
Macedonia FYR 00 07 72 77 03 43 190 213 00
Montenegro 00 00 09 14 00 00 49 89 00
Norway
Republic of Moldova 03 26 19 125 290 00
Russian Federation 00 00 27 55 00 01 111 212 00
Serbia 01 02 13 20 01 07 66 98 00
Switzerland
Ukraine 00 01 15 23 01 05 79 113 00
150
TABLE 22 Dimensions of inequalityHuman Development Index Gender
inequalityIndex
Gini-index Income share held by
inequalityadjusted
incomedistribution
highest20
lowest20
index index index index
2010 2010 2008 2009 2009 2009
WORLD
DEVELOPING REGIONS
AFRICA
North Africa
Algeria 07 06 353
Egypt 06 04 07 321 415 90
Libya 07 05
Morocco 06 04 07 409 479 65
Tunisia 07 05 05 408 473 60
Sub-Saharan Africa
Angola 04 02 586 619 20
Benin 04 03 07 386 461 70
Botswana 06 06 610
Burkina Faso 03 02 396 471 70
Burundi 03 02 06 333 428 90
Cameroon 05 03 07 446 462 67
Cape Verde 05 504 559 45
Central African Republic 03 02 08 436 606 34
Chad 03 02 398 466 63
Comoros 04 02 643 680 25
Congo 05 03 07 473 531 50
Cocircte drsquoIvoire 04 03 07 415 476 56
Congo Dem Rep 02 02 08
Djibouti 04 03 399 465 60
Equatorial Guinea 05
Eritrea
Ethiopia 03 02 298 394 93
Gabon 06 05 06 415 482 62
Gambia 04 02 07 473 528 48
Ghana 05 03 07 428 485 52
Guinea 03 02 394 462 63
Guinea-Bissau 03 02 355 432 73
Kenya 05 03 07 477 532 48
Lesotho 04 03 07 525 564 30
Liberia 03 02 08 382 450 64
Madagascar 04 03 472 535 62
Malawi 04 03 07 390 465 70
Mali 03 02 08 390 460 65
Mauritania 04 03 07 390 457 62
Mauritius 07
Mozambique 03 02 07 456 515 52
Namibia 06 03 06 743
Niger 03 02 08 340 428 83
Nigeria 04 02 429 486 51
Rwanda 04 02 06 531 582 42
Senegal 04 03 07 392 459 62
Seychelles 658 696 37
Sierra Leone 03 02 08 425 493 61
Somalia
Sudan 04 07
South Africa 06 04 06 578 722 25
Swaziland 05 03 07 507 559 45
Tanzania Utd Rep 04 03 376 448 68
Togo 04 03 07 344 424 76
Uganda 04 03 07 443 493 61
Zambia 04 03 07 507 552 36
Zimbabwe 01 01 07 501
151
TABLE 22 Dimensions of inequality (continued)Human Development Index Gender
inequalityIndex
Gini-index Income share held by
inequalityadjusted
incomedistribution
highest20
lowest20
index index index index
2010 2010 2008 2009 2009 2009
ASIA
Central Asia
Kazakhstan 07 06 05 309 399 87
Kyrgyzstan 06 05 05 334 428 88
Tajikistan 06 05 05 336 417 78
Turkmenistan 07 05 408
Uzbekistan 06 05 367 442 71
East Asia
Brunei Darussalam 08
Cambodia 05 04 06 444 517 66
China 05 04 415 478 57
Indonesia 06 05 07 368 455 74
Korea DPR
Korea Republic of 09 07 03 316
Lao PDR 05 04 06 367 448 76
Malaysia 07 04 462 448 65
Mongolia 06 05 05 365 405 72
Myanmar 04
Philippines 06 05 06 440 504 56
Singapore 08 02 425
Thailand 06 05 05 536 493 62
Viet Nam 06 05 05 376 454 73
South Asia
Afghanistan 03 08 294 387 90
Bangladesh 05 03 07 310 408 94
Bhutan 467 530 54
India 05 04 07 368 453 81
Iran (Islamic Rep) 07 06 383 452 64
Maldives 06 05 05 374 442 65
Nepal 04 03 07 473 540 59
Pakistan 05 03 07 327 421 90
Sri Lanka 07 05 06 403 478 69
West Asia
Armenia 07 06 05 309 398 88
Azerbaijan 07 06 05 337 421 80
Bahrain 08 05
Cyprus 08 07 03
Georgia 07 06 06 413 471 53
Iraq 07 399 87
Jordan 07 06 06 377 455 73
Kuwait 08 05
Lebanon
Occupied PalestinianTerritory
Saudi Arabia 07 08
Syrian Arab Republic 06 05 06 358 439 77
Turkey 07 05 06 397 489 52
United Arab Emirates 08 04
Yemen 04 03 08 377
LATIN AMERICA amp THECARIBBEAN
Argentina 08 06 05 458 531 36
Bahamas 08 07
Barbados 08 05
Belize 07 05 06 544
Bolivia (Plur State) 06 04 06 573 610 28
Brazil 07 05 06 539 585 32
Chile 08 06 05 521 572 43
Colombia 07 05 06 585 621 25
Costa Rica 07 06 05 503 523 44
152
TABLE 22 Dimensions of inequality (continued)Human Development Index Gender
inequalityIndex
Gini-index Income share held by
inequalityadjusted
incomedistribution
highest20
lowest20
index index index index
2010 2010 2008 2009 2009 2009
Cuba 05
Dominica
Dominican Republic 07 05 06 484 536 44
Ecuador 07 06 06 490 589 36
El Salvador 07 05 06 469 519 47
French Guiana
Grenada
Guatemala 06 04 07 537 580 35
Guyana 06 05 06 432
Haiti 04 02 07 595 630 25
Honduras 06 04 06 577 607 20
Jamaica 07 06 06 455 516 53
Mexico 07 06 06 517 562 38
Netherlands Antilles
Nicaragua 06 04 06 523 569 38
Panama 08 05 06 523 586 27
Paraguay 06 05 06 520 565 38
Peru 07 05 06 480 543 40
St Kitts amp Nevis
St Lucia 426
St Vincent amp Grenadines
Suriname 06 05 528
Trinidad amp Tobago 07 06 05 403
Uruguay 08 06 05 424 515 46
Venezuela (Boliv Rep of) 07 05 06 435 490 49
OCEANIA
Fiji 07
French Polynesia
New Caledonia
Papua New Guinea 04 08 509
Samoa
Solomon Islands 05
Tonga 07
Vanuatu
DEVELOPED REGIONS
NORTH AMERICA
Bermuda
Canada 09 08 03 326 399 72
United States of America 09 08 05 408 458 54
ASIA amp OCEANIA
Australia 09 09 03 352
Israel 09 08 03 392 449 57
Japan 09 03 249
New Zealand 09 03 362
EUROPE
Albania 07 06 05 345 430 81
Belarus 07 07 272 364 92
Bosnia amp Herzegovina 07 06 362 432 67
Croatia 08 07 04 336 420 81
European Union
Iceland 09 08 03
Macedonia FYR 07 06 442 503 54
Montenegro 07 300 388 85
Norway 09 09 02 258 372 96
Republic of Moldova 06 05 05 380 453 68
Russian Federation 07 06 05 423 489 60
Serbia 07 282
Switzerland 09 08 02 337 413 75
Ukraine 07 07 05 275 371 94
153
TABLE 23 GovernanceVoice ampaccount-ability
Politicalstabilityabsence ofviolence ampterrorism
Govern-ment
effectiveness
Regulatoryquality
Rule oflaw
Control ofcorruption
Averagegovernance
-25 to 25(lowest tohighest)
-25 to 25(lowest tohighest)
-25 to 25(lowest tohighest)
-25 to 25(lowest tohighest)
-25 to 25(lowest tohighest)
-25 to 25(lowest tohighest)
-25 to 25(lowest tohighest)
2010 2010 2010 2010 2010 2010 2010
WORLD
DEVELOPING REGIONS
AFRICA
North Africa
Algeria minus10 minus13 minus06 minus11 minus08 minus05 minus09
Egypt minus12 minus09 minus04 minus02 minus01 minus06 minus06
Libya minus19 minus01 minus12 minus12 minus10 minus13 minus11
Morocco minus08 minus05 minus02 minus01 minus02 minus02 minus03
Tunisia minus13 01 02 minus00 01 minus01 minus02
Sub-Saharan Africa
Angola minus11 minus02 minus11 minus10 minus12 minus13 minus10
Benin 03 03 minus05 minus03 minus07 minus08 minus03
Botswana 04 09 05 05 07 10 07
Burkina Faso minus02 minus01 minus06 minus01 minus02 minus04 minus03
Burundi minus09 minus15 minus11 minus11 minus12 minus11 minus12
Cameroon minus11 minus06 minus09 minus07 minus10 minus10 minus09
Cape Verde 09 08 minus01 minus01 04 08 05
Central African Republic minus11 minus21 minus14 minus11 minus13 minus08 minus13
Chad minus14 minus15 minus15 minus11 minus15 minus13 minus14
Comoros minus04 minus04 minus17 minus15 minus11 minus07 minus10
Congo minus10 minus02 minus12 minus13 minus11 minus11 minus10
Cocircte drsquoIvoire minus11 minus16 minus13 minus09 minus12 minus11 minus12
Congo Dem Rep minus14 minus22 minus17 minus16 minus16 minus14 minus17
Djibouti minus11 03 minus10 minus07 minus07 minus03 minus06
Equatorial Guinea minus19 02 minus17 minus14 minus13 minus15 minus12
Eritrea minus22 minus09 minus14 minus22 minus13 minus05 minus14
Ethiopia minus13 minus17 minus03 minus09 minus08 minus07 minus10
Gabon minus09 02 minus09 minus06 minus05 minus08 minus06
Gambia minus11 01 minus07 minus04 minus05 minus06 minus05
Ghana 05 00 minus00 01 minus01 01 01
Guinea minus09 minus18 minus11 minus11 minus15 minus12 minus13
Guinea-Bissau minus09 minus08 minus10 minus11 minus14 minus11 minus10
Kenya minus02 minus12 minus05 minus01 minus10 minus09 minus07
Lesotho minus02 05 minus04 minus06 minus03 02 minus01
Liberia minus02 minus05 minus12 minus11 minus10 minus05 minus07
Madagascar minus08 minus11 minus08 minus06 minus08 minus03 minus07
Malawi minus02 01 minus04 minus06 minus01 minus04 minus03
Mali 02 minus03 minus09 minus05 minus05 minus07 minus04
Mauritania minus09 minus13 minus09 minus08 minus09 minus07 minus09
Mauritius 07 05 08 08 08 07 07
Mozambique minus01 03 minus05 minus04 minus05 minus04 minus03
Namibia 03 08 01 01 02 03 03
Niger minus06 minus11 minus07 minus05 minus06 minus07 minus07
Nigeria minus08 minus20 minus12 minus08 minus12 minus10 minus12
Rwanda minus13 minus01 minus01 minus02 minus03 05 minus02
Senegal minus03 minus04 minus05 minus03 minus04 minus07 minus04
Seychelles 01 08 02 minus06 00 03 01
Sierra Leone minus02 minus02 minus12 minus07 minus09 minus08 minus07
Somalia minus20 minus31 minus22 minus24 minus24 minus17 minus23
Sudan minus17 minus27 minus14 minus14 minus13 minus13 minus16
South Africa 05 minus00 03 04 01 01 02
Swaziland minus13 minus01 minus05 minus06 minus05 minus02 minus05
Tanzania Utd Rep minus01 minus00 minus05 minus04 minus05 minus05 minus03
Togo minus10 minus02 minus14 minus09 minus09 minus10 minus09
Uganda minus05 minus11 minus06 minus01 minus04 minus09 minus06
Zambia minus03 05 minus08 minus05 minus05 minus06 minus04
Zimbabwe minus15 minus12 minus16 minus20 minus18 minus14 minus16
154
TABLE 23 Governance (continued)Voice ampaccount-ability
Politicalstabilityabsence ofviolence ampterrorism
Govern-ment
effectiveness
Regulatoryquality
Rule oflaw
Control ofcorruption
Averagegovernance
-25 to 25(lowest tohighest)
-25 to 25(lowest tohighest)
-25 to 25(lowest tohighest)
-25 to 25(lowest tohighest)
-25 to 25(lowest tohighest)
-25 to 25(lowest tohighest)
-25 to 25(lowest tohighest)
2010 2010 2010 2010 2010 2010 2010
ASIA
Central Asia
Kazakhstan minus11 05 minus03 minus03 minus06 minus10 minus05
Kyrgyzstan minus10 minus10 minus06 minus02 minus13 minus11 minus09
Tajikistan minus14 minus09 minus09 minus11 minus12 minus12 minus11
Turkmenistan minus20 02 minus16 minus21 minus15 minus14 minus14
Uzbekistan minus20 minus08 minus08 minus16 minus14 minus13 minus13
East Asia
Brunei Darussalam minus07 12 09 11 08 09 07
Cambodia minus09 minus06 minus08 minus05 minus11 minus12 minus08
China minus16 minus08 01 minus02 minus03 minus06 minus06
Indonesia minus01 minus09 minus02 minus04 minus06 minus07 minus05
Korea DPR minus22 minus05 minus19 minus24 minus13 minus13 minus16
Korea Republic of 07 01 12 09 10 04 07
Lao PDR minus16 minus02 minus09 minus10 minus09 minus11 minus10
Malaysia minus05 01 11 06 05 01 03
Mongolia 00 05 minus06 minus03 minus04 minus07 minus03
Myanmar minus21 minus13 minus17 minus22 minus15 minus17 minus17
Philippines minus01 minus16 minus01 minus03 minus05 minus08 minus06
Singapore minus03 11 22 18 17 22 15
Thailand minus06 minus12 01 02 minus02 minus03 minus03
Viet Nam minus14 01 minus03 minus06 minus05 minus06 minus05
South Asia
Afghanistan minus15 minus26 minus15 minus16 minus19 minus16 minus18
Bangladesh minus03 minus14 minus08 minus09 minus08 minus10 minus09
Bhutan minus05 07 06 minus11 01 08 01
India 04 minus13 minus00 minus04 minus01 minus05 minus03
Iran (Islamic Rep) minus16 minus16 minus05 minus16 minus09 minus09 minus12
Maldives minus01 minus00 minus02 minus04 minus03 minus06 minus03
Nepal minus05 minus17 minus08 minus07 minus10 minus07 minus09
Pakistan minus08 minus27 minus08 minus06 minus08 minus11 minus11
Sri Lanka minus05 minus08 minus02 minus02 minus01 minus04 minus04
West Asia
Armenia minus09 00 minus02 03 minus05 minus07 minus03
Azerbaijan minus13 minus03 minus08 minus04 minus09 minus12 minus08
Bahrain minus09 minus03 06 08 04 02 01
Cyprus 11 04 15 14 12 11 11
Georgia minus02 minus07 03 06 minus02 minus02 minus01
Iraq minus11 minus23 minus12 minus11 minus16 minus13 minus14
Jordan minus08 minus03 01 02 02 00 minus01
Kuwait minus05 04 01 02 05 03 02
Lebanon minus03 minus15 minus03 00 minus07 minus08 minus06
Occupied PalestinianTerritory
Saudi Arabia minus18 minus02 minus01 01 02 01 minus03
Syrian Arab Republic minus17 minus08 minus06 minus09 minus05 minus11 minus09
Turkey minus02 minus10 04 04 01 00 minus01
United Arab Emirates minus09 08 08 04 04 10 04
Yemen minus13 minus22 minus10 minus06 minus11 minus11 minus12
LATIN AMERICA amp THECARIBBEAN
Argentina 03 minus00 minus02 minus07 minus06 minus04 minus03
Bahamas 10 10 10 05 07 14 09
Barbados 12 11 14 05 10 14 11
Belize 07 minus00 minus04 minus05 minus04 minus01 minus01
Bolivia (Plur State) minus01 minus04 minus05 minus08 minus11 minus05 minus06
Brazil 05 00 01 02 00 01 01
Chile 10 06 12 14 13 15 12
Colombia minus02 minus15 01 03 minus03 minus04 minus03
Costa Rica 10 06 03 05 05 07 06
155
TABLE 23 Governance (continued)Voice ampaccount-ability
Politicalstabilityabsence ofviolence ampterrorism
Govern-ment
effectiveness
Regulatoryquality
Rule oflaw
Control ofcorruption
Averagegovernance
-25 to 25(lowest tohighest)
-25 to 25(lowest tohighest)
-25 to 25(lowest tohighest)
-25 to 25(lowest tohighest)
-25 to 25(lowest tohighest)
-25 to 25(lowest tohighest)
-25 to 25(lowest tohighest)
2010 2010 2010 2010 2010 2010 2010
Cuba minus16 03 minus02 minus16 minus06 05 minus05
Dominica 10 10 07 04 07 07 08
Dominican Republic 01 00 minus06 minus02 minus08 minus08 minus04
Ecuador minus03 minus06 minus07 minus11 minus12 minus09 minus08
El Salvador 00 01 00 04 minus09 minus02 minus01
French Guiana 11 02 12 12 12 11 10
Grenada 08 06 02 04 01 04 04
Guatemala minus04 minus08 minus07 minus02 minus10 minus05 minus06
Guyana 00 minus05 minus01 minus05 minus05 minus06 minus04
Haiti minus07 minus09 minus16 minus11 minus14 minus13 minus12
Honduras minus05 minus05 minus07 minus02 minus09 minus09 minus06
Jamaica 04 minus04 02 03 minus05 minus04 minus01
Mexico 01 minus08 02 03 minus06 minus04 minus02
Netherlands Antilles 04 11 07 09 09 09 08
Nicaragua minus05 minus06 minus10 minus04 minus08 minus08 minus07
Panama 05 00 01 04 minus01 minus04 01
Paraguay minus01 minus09 minus09 minus04 minus09 minus08 minus07
Peru 00 minus09 minus02 05 minus06 minus02 minus02
St Kitts amp Nevis 11 11 07 04 07 10 09
St Lucia 12 08 08 04 08 12 09
St Vincent amp Grenadines 12 09 07 04 09 10 09
Suriname 04 01 minus01 minus07 minus01 minus04 minus01
Trinidad amp Tobago 05 minus00 03 05 minus02 minus04 01
Uruguay 11 09 07 04 07 13 08
Venezuela (Boliv Rep of) minus09 minus14 minus10 minus16 minus16 minus12 minus13
OCEANIA
Fiji minus10 minus01 minus07 minus07 minus09 minus09 minus07
French Polynesia
New Caledonia minus02
Papua New Guinea 01 minus08 minus08 minus05 minus09 minus11 minus07
Samoa
Solomon Islands 01 04 minus09 minus12 minus07 minus05 minus05
Tonga 03 08 minus03 minus05 01 minus03 minus00
Vanuatu 05 14 minus03 minus08 03 04 02
DEVELOPED REGIONS
NORTH AMERICA
Bermuda 10 09 10 14 12 13 11
Canada 14 09 19 17 18 21 16
United States of America 12 03 14 14 16 12 12
ASIA amp OCEANIA
Australia 14 08 18 17 18 21 16
Israel 06 minus15 12 12 09 06 05
Japan 10 09 14 10 13 15 12
New Zealand 15 12 19 18 19 24 18
EUROPE
Albania 01 minus02 minus03 02 minus04 minus04 minus02
Belarus minus16 minus01 minus11 minus12 minus10 minus08 minus10
Bosnia amp Herzegovina minus01 minus07 minus07 minus01 minus04 minus03 minus04
Croatia 04 06 06 06 02 00 04
European Union
Iceland 14 10 16 09 17 19 14
Macedonia FYR 01 minus05 minus02 03 minus03 minus01 minus01
Montenegro 02 05 01 minus01 minus00 minus03 01
Norway 16 13 18 15 19 21 17
Republic of Moldova minus01 minus04 minus06 minus01 minus04 minus07 minus04
Russian Federation minus09 minus09 minus04 minus04 minus08 minus11 minus07
Serbia 03 minus04 minus01 minus00 minus04 minus02 minus01
Switzerland 16 12 19 17 18 21 17
Ukraine minus01 minus01 minus08 minus06 minus08 minus10 minus06
156
TABLE 24 Education health and sanitationLiteracyratefemale
Ratio of girls-to-boys Expendi-ture perstudent
Public expon
education
Health expenditure Prevalenceof HIV
Access to improved
out ofprimaryschool
in primand seceducation
share ofGDP percapita
share ofGDP
currentper capita
share ofGDP
ages15-49
sanitationfacilities
water source
ratio US$ rur urb
2009 2009 2009 2009 2009 2009 2009 2009 2008 2008 2008
WORLD 792 963 44 8600 101 08 61 78 96
DEVELOPING REGIONS
AFRICA
North Africa
Algeria 639 07 993 285 43 2680 58 01 95 79 85
Egypt 578 05 951 38 1130 50 01 94 98 100
Libya 820 00 1050 239 27 4170 39 97
Morocco 439 08 881 872 56 1560 55 01 69 60 98
Tunisia 710 09 1030 507 71 2400 62 01 85 84 99
Sub-Saharan Africa
Angola 576 08 820 1269 26 2040 46 20 57 38 60
Benin 291 01 735 134 35 319 42 12 12 69 84
Botswana 844 12 1000 3014 89 6120 103 248 60 90 99
Burkina Faso 216 08 856 3663 46 381 64 12 11 72 95
Burundi 609 90 927 6009 83 198 131 33 46 71 83
Cameroon 630 02 856 728 37 611 56 53 47 51 92
Cape Verde 802 09 1030 828 59 1460 39 54 82 85
Central African Republic 421 05 687 1448 13 193 43 47 34 51 92
Chad 231 06 636 2488 32 418 70 34 9 44 67
Comoros 687 06 842 272 76 278 34 01 36 97 91
Congo 09 919 29 18 701 30 34 30 34 95
Cocircte drsquoIvoire 453 08 686 1191 46 553 51 34 23 68 93
Congo Dem Rep 549 768 156 95 23 80
Djibouti 09 820 573 84 845 70 25 56 52 98
Equatorial Guinea 898 10 825 40 06 7090 39 50
Eritrea 560 09 773 11356 20 101 21 08 14 57 74
Ethiopia 180 07 879 6642 55 147 43 12 26 98
Gabon 841 10 959 38 2660 35 52 33 41 95
Gambia 358 11 1020 322 20 256 60 20 67 86 96
Ghana 604 11 954 288 54 451 69 18 13 74 90
Guinea 281 07 772 1164 24 188 57 13 19 61 89
Guinea-Bissau 380 07 655 52 184 61 25 21 51 83
Kenya 835 11 954 436 70 332 43 63 31 52 83
Lesotho 953 12 1070 778 124 700 82 236 29 81 97
Liberia 545 04 719 141 28 294 132 15 17 51 79
Madagascar 616 53 969 1581 30 180 41 02 11 29 71
Malawi 670 18 1000 321 42 191 62 110 56 77 95
Mali 182 05 784 1633 44 384 56 10 36 44 81
Mauritania 503 13 1030 736 29 219 25 07 26 47 52
Mauritius 853 13 1010 245 32 3830 57 10 91 99 100
Mozambique 415 05 883 998 50 247 57 115 17 29 77
Namibia 881 16 1040 315 64 2580 60 131 33 88 99
Niger 151 08 753 5143 45 209 61 08 9 39 96
Nigeria 498 09 851 08 693 58 36 32 42 75
Rwanda 668 18 1000 2521 41 482 90 29 54 62 77
Senegal 387 11 955 2169 58 589 57 09 51 52 92
Seychelles 923 15 1030 340 50 3660 40 100
Sierra Leone 301 06 840 251 43 439 131 16 13 26 86
Somalia 09 535 04 07 23 9 67
Sudan 608 09 894 121 946 73 11 34 52 64
South Africa 870 12 994 328 54 4850 85 178 77 78 99
Swaziland 862 11 921 491 78 1560 63 259 55 61 92
Tanzania Utd Rep 669 15 961 409 68 253 51 56 24 45 80
Togo 444 04 753 130 46 289 59 32 12 41 87
Uganda 589 15 987 1339 32 425 82 65 48 64 91
Zambia 613 14 958 10 13 471 48 135 49 46 87
Zimbabwe 894 971 2143 52 143 44 72 99
157
TABLE 24 Education health and sanitation (continued)Literacyratefemale
Ratio of girls-to-boys Expendi-ture perstudent
Public expon
education
Health expenditure Prevalenceof HIV
Access to improved
out ofprimaryschool
in primand seceducation
share ofGDP percapita
share ofGDP
currentper capita
share ofGDP
ages15-49
sanitationfacilities
water source
ratio US$ rur urb
2009 2009 2009 2009 2009 2009 2009 2009 2008 2008 2008
ASIA
Central Asia
Kazakhstan 996 26 986 79 28 3300 45 01 97 90 99
Kyrgyzstan 990 11 1010 173 59 571 68 03 93 85 99
Tajikistan 996 01 906 218 35 380 53 02 94 61 94
Turkmenistan 994 43 771 23 98 97
Uzbekistan 991 08 987 74 622 52 01 100 81 98
East Asia
Brunei Darussalam 937 18 1010 37 7910 30
Cambodia 709 08 897 54 21 421 59 05 29 56 81
China 909 12 1050 1015 19 1770 46 01 55 82 98
Indonesia 891 04 977 397 28 554 24 02 52 71 89
Korea DPR 1000 100 100
Korea Republic of 00 972 528 42 11100 65 01 100 88 100
Lao PDR 632 09 872 100 23 358 41 02 53 51 72
Malaysia 903 10 1030 604 41 3360 48 05 96 99 100
Mongolia 979 15 1030 162 56 742 47 01 50 49 97
Myanmar 895 08 997 54 13 125 20 06 81 69 75
Philippines 958 14 1020 276 28 669 38 01 76 87 93
Singapore 920 116 30 15000 39 01 100 100
Thailand 915 09 1030 554 41 1680 43 13 96 98 99
Viet Nam 905 04 932 982 53 797 72 04 75 92 99
South Asia
Afghanistan 50 07 623 19 509 74 37 39 78
Bangladesh 510 21 1080 256 24 184 34 01 53 78 85
Bhutan 387 13 1000 387 48 980 55 02 65 88 99
India 508 05 922 777 31 448 42 03 31 84 96
Iran (Islamic Rep) 807 07 965 583 47 2690 55 02 98
Maldives 984 06 982 00 112 3310 80 01 98 86 99
Nepal 469 06 825 731 47 253 58 04 31 87 93
Pakistan 401 07 819 27 226 26 01 45 87 95
Sri Lanka 891 12 1040 30 836 40 01 91 88 98
West Asia
Armenia 994 17 1030 533 30 1290 47 01 90 93 98
Azerbaijan 992 10 1020 156 28 2850 58 01 45 71 88
Bahrain 902 03 1010 326 29 11100 45 100
Cyprus 969 05 1000 1352 41 60 100 100 100
Georgia 997 06 965 410 32 2560 101 01 95 96 100
Iraq 699 04 813 51 985 39 73 55 91
Jordan 889 14 1020 277 49 3360 93 98 91 98
Kuwait 918 08 1010 257 38 14200 33 100 99 99
Lebanon 860 09 1040 102 18 6630 81 01 100 100
Occupied PalestinianTerritory
Saudi Arabia 811 08 913 367 56 7140 50 97
Syrian Arab Republic 780 01 973 338 48 720 29 96 84 94
Turkey 853 07 929 547 31 5710 67 01 90 96 100
United Arab Emirates 915 06 998 270 12 15200 28 97 100 100
Yemen 447 06 657 52 640 56 52 57 72
LATIN AMERICA amp THECARIBBEAN
Argentina 977 22 1050 565 49 7300 95 05 90 80 98
Bahamas 14 1010 33 15600 72 31 100 98
Barbados 603 minus67 10400 68 14 100 100 100
Belize 703 44 1010 395 58 2170 49 23 90 100 99
Bolivia (Plur State) 868 12 988 282 63 848 48 02 25 67 96
Brazil 902 07 1030 650 51 7340 91 80 84 99
Chile 987 09 985 428 40 7870 82 04 96 75 99
Colombia 934 10 1050 580 48 3230 64 05 74 73 99
Costa Rica 963 12 1020 290 63 6680 105 03 95 91 100
158
TABLE 24 Education health and sanitation (continued)Literacyratefemale
Ratio of girls-to-boys Expendi-ture perstudent
Public expon
education
Health expenditure Prevalenceof HIV
Access to improved
out ofprimaryschool
in primand seceducation
share ofGDP percapita
share ofGDP
currentper capita
share ofGDP
ages15-49
sanitationfacilities
water source
ratio US$ rur urb
2009 2009 2009 2009 2009 2009 2009 2009 2008 2008 2008
Cuba 998 08 988 1553 136 7070 118 01 91 89 96
Dominica 15 1020 407 47 3610 64
Dominican Republic 883 11 965 147 23 2710 59 09 83 84 87
Ecuador 815 28 1030 92 10 2550 61 04 92 88 97
El Salvador 818 16 983 176 36 2290 63 08 87 76 94
French Guiana
Grenada 960 22 970 227 48 4470 74 97 97
Guatemala 695 04 938 166 32 1860 71 08 81 90 98
Guyana 06 997 447 61 1330 81 12 81 93 98
Haiti 446 10 946 15 396 61 19 17 55 71
Honduras 835 23 1070 36 1170 60 08 71 77 95
Jamaica 911 09 1000 850 58 2310 51 17 83 89 98
Mexico 921 17 1020 637 48 5150 65 03 85 87 96
Netherlands Antilles 964 1020
Nicaragua 779 12 1020 144 31 1050 96 02 52 68 98
Panama 930 08 1010 390 38 5910 83 09 69 83 97
Paraguay 935 10 995 530 40 1590 71 03 70 66 99
Peru 846 12 994 180 27 2010 46 04 68 61 90
St Kitts amp Nevis 15 1040 79 97 6340 60 96 99 99
St Lucia 10 994 368 45 4430 81 98 98
St Vincent amp Grenadines 01 977 455 66 3010 57
Suriname 938 09 1070 90 4290 76 10 84 81 97
Trinidad amp Tobago 983 05 1010 189 42 10700 57 15 92 93 98
Uruguay 986 08 1040 374 29 6980 75 05 100 100 100
Venezuela (Boliv Rep of) 949 11 1020 173 37 6860 60
OCEANIA
Fiji 10 1030 967 62 1300 34 01
French Polynesia 15 1090 98 100 100
New Caledonia 960
Papua New Guinea 565 08 835 65 367 31 09 45 33 87
Samoa 985 17 1050 120 58 2050 70 100
Solomon Islands 690 10 940 22 719 54
Tonga 991 06 999 1449 39 1610 62 96 100 100
Vanuatu 803 05 995 353 48 1060 40 52 79 96
DEVELOPED REGIONS
NORTH AMERICA
Bermuda 979 157 26
Canada 23 987 440 49 43800 109 02 100 99 100
United States of America 14 1000 682 55 74100 162 06 100 94 100
ASIA amp OCEANIA
Australia 14 973 509 45 38700 85 01 100 100 100
Israel 887 15 1010 611 59 19700 76 02 100 100 100
Japan 11 1000 647 35 33200 83 01 100 100 100
New Zealand 31 1030 675 61 26300 97 01 100 100
EUROPE
Albania 947 09 995 444 29 2650 69 98 98 96
Belarus 997 17 1010 150 45 2950 58 03 93 99 100
Bosnia amp Herzegovina 964 13 1020 4950 109 95 98 100
Croatia 981 12 1020 732 46 11200 78 01 99 97 100
European Union 1010 764 49 33700 103 02 98 100 100
Iceland 13 1020 771 74 31300 82 03 100 100 100
Macedonia FYR 956 13 983 238 35 3140 69 89 99 100
Montenegro 6170 93 92 96 100
Norway 13 990 895 68 76600 97 01 100 100 100
Republic of Moldova 980 10 1010 1286 96 1810 119 04 79 85 96
Russian Federation 994 12 980 142 39 4750 54 10 87 89 98
Serbia 09 1010 1105 48 4190 99 01 92 98 99
Switzerland 57 973 956 52 71400 113 04 100 100 100
Ukraine 996 11 988 251 53 1800 70 11 95 97 98
159
TABLE 25 Food aid receivedFood aid received
thousandtonnes
thousandtonnes
thousandtonnes
thousandtonnes
thousandtonnes
1990 1995 2000 2005 2010
WORLD 13172 10201 11345 8288 5682
DEVELOPING REGIONS 10922 9143 9462 8245 5682
AFRICA 5255 3562 4320 4656 3491
North Africa 2268 263 318 56 27
Algeria 10 27 33 42 24
Egypt 1606 207 41 14 3
Libya 0 0 0 0 0
Morocco 271 2 241 0 0
Tunisia 383 27 4 0 0
Sub-Saharan Africa 2986 3299 4002 4601 3464
Angola 124 220 296 57 4
Benin 15 21 12 15 19
Botswana 15 10 0 0 0
Burkina Faso 34 41 33 39 45
Burundi 3 103 11 73 34
Cameroon 3 7 4 14 14
Cape Verde 59 73 53 29 16
Central African Republic 3 1 3 5 10
Chad 26 21 23 74 111
Comoros 4 6 0 0 0
Congo 8 13 18 9 7
Cocircte drsquoIvoire 66 24 17 34 21
Congo Dem Rep 98 109 74 103 193
Djibouti 9 20 12 21 10
Equatorial Guinea 5 4 2 0 0
Eritrea 0 104 257 232 0
Ethiopia 864 636 1527 1122 1415
Gabon 0 0 1 0 0
Gambia 4 4 8 11 23
Ghana 66 97 101 66 7
Guinea 11 8 5 41 4
Guinea-Bissau 5 3 27 11 7
Kenya 90 80 291 155 258
Lesotho 42 34 6 44 7
Liberia 35 161 116 102 30
Madagascar 54 38 44 47 26
Malawi 219 236 36 153 38
Mali 39 20 12 41 25
Mauritania 45 45 17 92 39
Mauritius 11 1 0 0 0
Mozambique 423 386 185 117 80
Namibia 12 3 2 2 1
Niger 40 25 20 139 159
Nigeria 0 0 1 20 0
Rwanda 9 274 232 42 7
Senegal 63 21 54 30 41
Seychelles 1 0 0 0 0
Sierra Leone 11 34 28 39 24
Somalia 98 53 61 40 72
Sudan 230 82 182 931 476
South Africa 7 0 3 0 0
Swaziland 10 7 0 12 17
Tanzania Utd Rep 35 145 63 116 38
Togo 12 6 4 1 2
Uganda 47 77 87 293 80
Zambia 11 26 49 146 7
Zimbabwe 14 13 16 80 92
160
TABLE 25 Food aid received (continued)Food aid received
thousandtonnes
thousandtonnes
thousandtonnes
thousandtonnes
thousandtonnes
1990 1995 2000 2005 2010
ASIA 3357 4641 4314 2958 1775
Central Asia 0 432 195 239 75
Kazakhstan 0 1 0 0 0
Kyrgyzstan 0 150 60 166 50
Tajikistan 0 226 60 73 25
Turkmenistan 0 53 7 0 0
Uzbekistan 0 1 68 0 0
East Asia 530 952 2239 1663 232
Brunei Darussalam 0 0 0 0 0
Cambodia 25 91 62 24 17
China 78 128 90 49 0
Indonesia 56 19 429 197 0
Korea DPR 0 544 1264 1180 80
Korea Republic of 0 0 0 0 0
Lao PDR 0 27 5 19 20
Malaysia 0 0 0 0 0
Mongolia 0 12 46 55 0
Myanmar 0 4 10 16 31
Philippines 160 55 218 121 82
Singapore 0 0 0 0 0
Thailand 148 2 1 1 0
Viet Nam 62 70 82 0 0
South Asia 2288 1445 937 838 1247
Afghanistan 43 133 210 208 140
Bangladesh 1050 586 269 293 194
Bhutan 5 6 4 2 3
India 382 398 321 102 16
Iran (Islamic Rep) 26 13 3 2 5
Maldives 2 3 3 11 12
Nepal 8 38 53 54 53
Pakistan 462 119 20 30 763
Sri Lanka 310 148 55 136 60
West Asia 539 1812 943 218 222
Armenia 0 476 96 22 7
Azerbaijan 0 391 28 12 0
Bahrain 0 0 0 0 0
Cyprus 0 0 0 0 0
Georgia 0 598 71 20 1
Iraq 0 102 18 36 7
Jordan 261 122 401 3 0
Kuwait 0 0 0 0 0
Lebanon 43 11 42 12 0
Occupied PalestinianTerritory
26 48 57 83 90
Saudi Arabia 0 0 0 0 0
Syrian Arab Republic 38 45 35 10 35
Turkey 14 1 0 0 0
United Arab Emirates 0 0 0 0 0
Yemen 157 18 195 21 83
LATIN AMERICA amp THECARIBBEAN
2306 939 828 632 416
Argentina 0 0 0 0 0
Bahamas 0 0 0 0 0
Barbados 0 0 0 0 0
Belize 0 0 0 0 0
Bolivia (Plur State) 262 86 80 65 8
Brazil 29 1 0 0 0
Chile 8 0 0 0 0
Colombia 5 15 12 14 12
Costa Rica 7 3 0 0 0
161
TABLE 25 Food aid received (continued)Food aid received
thousandtonnes
thousandtonnes
thousandtonnes
thousandtonnes
thousandtonnes
1990 1995 2000 2005 2010
Cuba 3 6 24 7 0
Dominica 0 7 0 0 0
Dominican Republic 40 6 2 0 50
Ecuador 77 19 42 43 3
El Salvador 203 25 3 67 3
French Guiana 0 0 0 0 0
Grenada 0 0 0 0 0
Guatemala 185 70 137 69 70
Guyana 46 33 26 0 0
Haiti 108 168 164 137 266
Honduras 146 53 68 98 3
Jamaica 293 56 46 11 0
Mexico 280 46 2 0 0
Netherlands Antilles 0 0 0 0 0
Nicaragua 232 63 62 43 2
Panama 1 2 0 0 0
Paraguay 4 1 0 0 0
Peru 359 254 149 78 0
St Kitts amp Nevis 0 0 0 0 0
St Lucia 0 3 0 0 0
St Vincent amp Grenadines 0 0 0 0 0
Suriname 0 20 0 0 0
Trinidad amp Tobago 0 0 0 0 0
Uruguay 20 0 0 0 0
Venezuela (Boliv Rep of) 0 0 11 0 0
OCEANIA 3 0 0 0 0
Fiji 0 0 0 0 0
French Polynesia 0 0 0 0 0
New Caledonia 0 0 0 0 0
Papua New Guinea 0 0 0 0 0
Samoa 0 0 0 0 0
Solomon Islands 0 0 0 0 0
Tonga 0 0 0 0 0
Vanuatu 0 0 0 0 0
DEVELOPED REGIONS 2250 1058 1883 43 0
NORTH AMERICA 0 0 0 0 0
Bermuda 0 0 0 0 0
Canada 0 0 0 0 0
United States of America 0 0 0 0 0
ASIA amp OCEANIA 1 0 0 0 0
Australia 0 0 0 0 0
Israel 1 0 0 0 0
Japan 0 0 0 0 0
New Zealand 0 0 0 0 0
EUROPE 2249 1058 1883 43 0
Albania 0 10 18 6 0
Belarus 0 98 0 0 0
Bosnia amp Herzegovina 0 23 84 0 0
Croatia 0 14 0 0 0
European Union 2249 40 1 0 0
Iceland 0 0 0 0 0
Macedonia FYR 0 0 63 0 0
Montenegro 0 0 0 0 0
Norway 0 0 0 0 0
Republic of Moldova 0 244 14 10 0
Russian Federation 0 125 1403 26 0
Serbia 0 0 0 0 0
Switzerland 0 0 0 0 0
Ukraine 0 120 0 0 0
162
DEFINITIONS AND SOURCES
Definitions and sources
Countries in protracted crisesP2HUNFAOESARHSNPC
Page table 31 (p 86)
Protracted crises are those environments in which a sig-nificant proportion of the population is acutely vulnera-ble to death disease and disruption of livelihoods overa prolonged period of time The governance of these en-vironments is usually very weak with the state having alimited capacity to respond to and mitigate the threatsto the population or provide adequate levels of protec-tion
Source Trade and Markets Division
Owner FAO
Contribution in diets by typeP2HUNFAOESSDIETCPF
Page table 16 (p 135)
Dietary contribution refers to the amount of carbohy-dratesproteinsfats expressed in kilocalories (kcal) perday available for each individual in the total populationduring the reference period Caloric content is derived byapplying the appropriate food composition factors to thequantities of the commodities Per person supplies arederived from the total amount of food available for hu-man consumption by dividing total calories by total pop-ulation actually partaking of the food supplies during thereference period However per person figures representonly the average supply available for the population asa whole and do not necessarily indicate what is actuallyconsumed by individuals The actual food consumptionmay be lower than the quantity shown as food availabil-ity depending on the magnitude of wastage and lossesof food in the household eg during storage in prepa-ration and cooking as plate-waste or quantities fed todomestic animals and pets thrown or given away
Source Statistics Division
Owner FAO
Dietary Energy Supply per personP2HUNFAOESSDIETDES
Page table 16 (p 135) chart 37 (p 93) map 20 (p 92)
Dietary energy supply per person refers to the amountof food expressed in kilocalories (kcal) per day avail-able for each individual in the total population duringthe reference period Caloric content is derived by ap-plying the appropriate food composition factors to thequantities of the commodities Per person supplies arederived from the total amount of food available for hu-man consumption by dividing total calories by total pop-ulation actually partaking of the food supplies during thereference period However per person figures representonly the average supply available for the population asa whole and do not necessarily indicate what is actuallyconsumed by individuals The actual food consumptionmay be lower than the quantity shown as food availabil-ity depending on the magnitude of wastage and losses
of food in the household eg during storage in prepa-ration and cooking as plate-waste or quantities fed todomestic animals and pets thrown or given awaySource Statistics DivisionOwner FAO
Caloric contribution in diets by commodityP2HUNFAOESSDIETFDS
Page table 40 41 (p 95 95)Contribution of a food Group to total dietary energy sup-plySource Statistics DivisionOwner FAO
Percentage contribution in diets by commodityP2HUNFAOESSDIETFDSx
Page table 16 17 (p 135 138)Percentage contribution of a food group to total dietaryenergy supplySource Statistics DivisionOwner FAO
Depth of hungerP2HUNFAOESSUNMNTDEP
Page table 15 (p 132) chart 36 (p 91)The depth of food deprivation indicates how much food-deprived people fall short of minimum food needs interms of dietary energy It is measured as the differencebetween the minimum dietary energy and the averagedietary energy intake of the undernourished population(food-deprived) The depth of food deprivation is lowwhen it is less than 200 kilocalories per person per dayand high when it is higher than 300 kilocalories per per-son per day The greater the deficit the greater the sus-ceptibility for health risks related to undernutritionSource Statistics DivisionOwner FAO
Incidence of undernourishmentP2HUNFAOESSUNMNTNUM
Page table 15 (p 132) map 19 (p 91)Undernourishment refers to the condition of peoplewhose dietary energy consumption is continuously be-low a minimum dietary energy requirement for main-taining a healthy life and carrying out a light physicalactivity The incidence of undernourishment is the num-ber of people referring to those in this conditionSource Statistics DivisionOwner FAO
Global number of undernourishedP2HUNFAOESSUNMNTPNW
Page chart 33 35 (p 89 90)Undernourishment refers to the condition of peoplewhose dietary energy consumption is continuously be-low a minimum dietary energy requirement for main-taining a healthy life and carrying out a light physical
163
PART 2
activity The global incidence of undernourishment is thetotal number of people in the world referring to those inthis condition
Source Statistics Division
Owner FAO
Percentage of population undernourishedP2HUNFAOESSUNMNTPREV
Page table 15 (p 132) map 18 (p 88)
Undernourishment refers to the condition of peoplewhose dietary energy consumption is continuously be-low a minimum dietary energy requirement for main-taining a healthy life and carrying out a light physicalactivity The percentage of population undernourishedis the total number of people in each country referringto those in this condition divided by the population ofthat country
Source Statistics Division
Owner FAO
Regional percentage of undernourishedP2HUNFAOESSUNMNTPREVR
Page chart 34 (p 90)
Undernourishment refers to the condition of peoplewhose dietary energy consumption is continuously be-low a minimum dietary energy requirement for main-taining a healthy life and carrying out a light physicalactivity The regional percentage of population under-nourished is the total number of people in each regionreferring to those in this condition divided by the popu-lation of that region
Source Statistics Division
Owner FAO
Global affordability of foodP2HUNFAOFPVAFD
Page chart 54 (p 106)
FAO Food Price Index relative to GDP showing howmuchfood prices have risen relative to income from the baseperiod 2002-04 Higer (lower) index scores show greater(less) affordability
Source Statistics Division
Owner FAO
Food price inflationP2HUNFAOFPVFCPI
Page map 25 (p 104)
Annual change in the ILO food price indices The pricedata for the different items included in the computationof the index are normally weighted in order to take intoaccount the relative importance of each item with re-spect to total consumption expenditure In most coun-tries the indices are computed in a derived form suchas weighted arithmetic averages of price relatives fora selected number of representative items between theperiod under consideration and the base period using
one or other forms of Laspeyresrsquo formula The num-ber of items and the weights used to compute the in-dex are given according to expenditure group The termitem is used here to mean the smallest grouping ofgoods and services for which a specific weight is givenThe source(s) and the reference period of the weightsused for the index eg a household expenditure surveynational accounts etc If the reference period for theweights differs from the base period of the index theadjustments made to the weights to take account of theprice changes between the two periods are describedSee httplaborstailoorg for more informationSource LABORSTAOwner ILO
International food prices by food groupP2HUNFAOFPVFPI
Page chart 53 (p 106)The FAO Food Price Index is a measure of themonthly change in international prices of a bas-ket of food commodities It consists of the av-erage of five commodity group price indices (rep-resenting 55 quotations) weighted with the aver-age export shares of each of the groups for 2002-2004 See httpwwwfaoorgworldfoodsituationwfs-homefoodpricesindexen for more information on sub-index constructionSource Statistics DivisionOwner FAO
International food price volatility by food groupP2HUNFAOFPVFPV
Page chart 55 56 (p 107 107)Annualized historical volatility of the FAO Food Price In-dexSource Statistics DivisionOwner FAO
Food price volatility (annualized historical volatility)P2HUNFAOFPVFPVn
Page map 26 (p 108)Annualized historical volatility of the ILO food price in-dicesSource Statistics DivisionOwner FAO
FAO Global Consumption price volatilityP2HUNFAOFPVGCI
Page chart 52 57 (p 105 109)The FAO Global Food Consumption Price Index trackschanges in the cost of the global food basket as por-trayed by the latest FAO world food balance sheet Rep-resentative international prices for each of the commodi-ties or commodity groups appearing in the balance sheetare weighted by their contribution to total calorific in-takeSource Statistics DivisionOwner FAO
164
DEFINITIONS AND SOURCES
Dietary diversity in selected LIFDCs
P2HUNFAOFVDIETDIV
Page chart 39 (p 94)
The Herfindahl index H is calculated as H =sumN=1 S
2
where S is the consumption share of the starchy staple in diets and N is the number of staples consumed For asingle staple consumed the index would equate to oneand declines as the staple base becomes more diversi-fied
Source Statistics Division
Owner FAO
Starchy root consumption and DES
P2HUNFAOFVDIETRTDES
Page chart 38 (p 94)
Caloric equivalent of starchy roots available for con-sumption as a ratio of total dietary energy supply
Source Statistics Division
Owner FAO
Availability of dietary iron
P2HUNFAOMCNIRON
Page table 18 (p 141) chart 44 (p 98)
The dietary availability of iron is calculated by convert-ing the amount of food available for human consumptionas estimated by the FAO Food Balance Sheets in equiv-alent of iron derived from animal and vegetal productsHowever the actual food consumptionmay be lower thanthe quantity shown as food availability depending on themagnitude of wastage and losses of food in the house-hold eg during storage in preparation and cooking asplate-waste or quantities fed to domestic animals andpets thrown or given away
Source Statistics Division
Owner FAO
Food + energy import bills ( GDP)
P2HUNFAOTFSFDFL
Page table 20 (p 147)
The annual value of food imported under SITC sections0 + 22+ 4 plus fuels under SITC section 3 expressed asa ratio of GDP
Source Statistics Division (FAOSTAT) and UNCTADSTAT
Owner FAO UNCTAD
Food import bills
P2HUNFAOTFSFIB
Page table 20 (p 147) chart 49 50 51 (p 103 103103)
The annual value of food imported under SITC sections0 + 22+ 4 expressed in current US$
Source Statistics Division (FAOSTAT) and UNCTADSTAT
Owner FAO UNCTAD
Food + energy import bills per capita
P2HUNFAOTFSFUEL
Page chart 50 51 (p 103 103)
The annual value of food imported under SITC sections0 + 22+ 4 plus fuels under SITC section 3 expressed asa ratio of population
Source Statistics Division (FAOSTAT) and UNCTADSTAT
Owner FAO UNCTAD
Index of variability of food production
P2HUNFAOTFSQPVAR
Page chart 46 (p 102)
Rolling ten-year window of the coefficient of variation ofper capita production index
Source Statistics Division
Owner FAO
Food self-sufficiency (calories)
P2HUNFAOTFSSSCAL
Page table 19 (p 144) chart 45 (p 101) map 24 (p100)
The self-sufficiency ratio (SSR) is defined as SSR = pro-duction x 100(production + imports - exports) The SSRcan be calculated for individual commodities groups ofcommodities of similar nutritional values and after ap-propriate conversion of the commodity equations alsofor the aggregate of all commodities In the context offood security the SSR is often taken to indicate the ex-tent to which a country relies on its own production re-sources ie the higher the ratio the greater the self-sufficiency While the SSR can be the appropriate toolwhen assessing the supply situation for individual com-modities a certain degree of caution should be observedwhen looking at the overall food situation In the casehowever where a large part of a countryrsquos production ofone commodity eg other cereals is exported the SSRmay be very high but the country may still have to relyheavily on imports of food commodities to feed the pop-ulation The self-sufficiency rate (as defined above) can-not be the complement to 100 of the import dependencyrate or vice-versa
Source Statistics Division
Owner FAO
Months of cereal self-provisioning capacity
P2HUNFAOTFSSTU
Page chart 47 48 (p 102 103)
Stocks-to-utilization ratios for cereals (wheat rice andcoarse grains) where stocks refer to the carry-over ofthe preceding national crop season The ratio is thenmultiplied by 12 to calculate the number of months ofself-provisioning capacity in a given year
Source Trade and Markets Division
Owner FAO
165
PART 2
Persons affected by natural disastersP2HUNODFAEMDATRHSPPND
Page table 14 (p 129) chart 29 (p 85) map 16 (p 84)People requiring immediate assistance during a periodof emergency ie requiring basic survival needs suchas food water shelter sanitation and immediate med-ical assistance Appearance of a significant number ofcases of an infectious disease introduced in a region ora population that is usually free from that disease Seewwwemdatnet (Universiteacute catholique de Louvain Brus-sels Belgium)Source International Disaster Database EM-DATOwner OFDA and CRED
Total affected by natural disastersP2HUNODFAEMDATRHSPPNDT
Page chart 30 (p 86)Sum of (i) injured people suffering from physical injuriestrauma or an illness requiring medical treatment as a di-rect result of a disaster (ii) homeless people needing im-mediate assistance for shelter and (iii) affected peoplerequiring immediate assistance during a period of emer-gency it can also include displaced or evacuated peopleSee wwwemdatnet (Universiteacute catholique de LouvainBrussels Belgium)Source International Disaster Database EM-DATOwner OFDA and CRED
Multidimensional Poverty IndexP2HUNUNDPHDRMPI
Page table 21 (p 150)An international measure of poverty for 109 developingcountries the MPI complements income-based povertymeasures by reflecting the multiple deprivations thatpeople face at the same time The MPI identifies de-privations across health education and living standardsand shows the number of people who are multidimen-sionally poor and the deprivations that they face at thehousehold levelSource Alkire S Roche JM Santos ME and Seth S(November 2011) ophiqehoxacukOwner OPHI
Gender Inequality IndexP2HUNUNDPHDRPOVGEI
Page table 22 (p 153) map 29 (p 113)The Gender Inequality Index is a composite measure re-flecting inequality in achievements between women andmen in three dimensions reproductive health empow-erment and the labour market It varies between zero(when women and men fare equally) and one (when menor women fare poorly compared to the other in all di-mensions) The health dimension is measured by twoindicators maternal mortality ratio and the adolescentfertility rate The empowerment dimension is also mea-sured by two indicators the share of parliamentary seatsheld by each sex and by secondary and higher educationattainment levels The labour dimension is measured by
womenrsquos participation in the work force The Gender In-equality Index is designed to reveal the extent to whichnational human development achievements are erodedby gender inequality and to provide empirical founda-tions for policy analysis and advocacy effortsSource Human Development Report 2010Owner UNDP
Human Development IndexP2HUNUNDPHDRPOVHDI
Page table 22 (p 153)The HDI represents a national average of human de-velopment achievements in the three basic dimensionsmaking up the HDI health education and income Likeall averages it conceals disparities in human develop-ment across the population within the same countryTwo countries with different distributions of achieve-ments can have the same average HDI value The IHDItakes into account not only the average achievements ofa country on health education and income but also howthose achievements are distributed among its citizens bydiscounting each dimensionrsquos average value accordingto its level of inequalitySource Human Development Report 2010Owner UNDP
Human Development Index (inequality adjusted)P2HUNUNDPHDRPOVHDIi
Page table 22 (p 153) chart 59 (p 112)The Human Development Index (HDI) is a summary mea-sure of human development It measures the averageachievements in a country in three basic dimensionsof human development a long and healthy life ac-cess to knowledge and a decent standard of living TheInequality-adjusted Human Development Index (IHDI)adjusts the Human Development Index (HDI) for inequal-ity in distribution of each dimension across the popula-tion The IHDI accounts for inequalities in HDI dimen-sions by discounting each dimensionrsquos average valueaccording to its level of inequality The IHDI equals theHDI when there is no inequality across people but is lessthan the HDI as inequality rises In this sense the IHDI isthe actual level of human development (accounting forthis inequality) while the HDI can be viewed as an in-dex of potential human development (or the maximumlevel of HDI) that could be achieved if there was no in-equality The loss in potential human development dueto inequality is given by the difference between the HDIand the IHDI and can be expressed as a percentageSource Human Development Report 2010Owner UNDP
Population of concernP2HUNUNHCRGTRHSTPC
Page table 13 (p 126) map 17 (p 87)Refugees are individuals recognized under the 1951Convention relating to the Status of Refugees and alsopeople in a refugee-like situation such as those who
166
DEFINITIONS AND SOURCES
are outside their country or territory of origin and whoface protection risks similar to those of refugees butfor whom refugee status has for practical or other rea-sons not been ascertained Internally Displaced Persons(IDPs) are people or groups of individuals who have beenforced to leave their homes or places of habitual resi-dence in particular as a result of or in order to avoidthe effects of armed conflict situations of generalized vi-olence violations of human rights or natural- or human-made disasters and who have not crossed an interna-tional border Others include Asylum-seekers (personswho have applied for asylum or refugee status but whohave not yet received a final decision on their applica-tion) Returned IDPs and refugees Stateless Persons (in-dividuals not considered as nationals by any State underrelevant national laws) and other groups of concern towhom UNHCR has extended its protection andor assis-tance services based on humanitarian or other specialgrounds
Source Statistical Online Population Database
Owner UNHCR
Total population of concern
P2HUNUNHCRGTRHSTPCT
Page chart 32 (p 87)
Total population of concern is the sum of various groupsof people including refugees asylum-seekers internallydisplaced persons (IDPs) protectedassisted by UNHCRstateless persons and returnees (returned refugees andIDPs)
Source Statistical Online Population Database
Owner UNHCR
Average governance
P2HUNWBKPOVGOV
Page table 23 (p 156) chart 60 (p 115) map 30 (p114)
The Worldwide Governance Indicators project constructsaggregate indicators of six broad dimensions of gover-nance (i) Voice and Accountability (ii) Political Stabil-ity and Absence of ViolenceTerrorism (iii) GovernmentEffectiveness (iv) Regulatory Quality (v) Rule of Law(vi) Control of Corruption The six aggregate indicatorsare based on 30 underlying data sources reporting theperceptions of governance of a large number of surveyrespondents and expert assessments worldwide De-tails on the underlying data sources the aggregationmethod and the interpretation of the indicators can befound in the WGI methodology paper Daniel KaufmannAart Kraay and Massimo Mastruzzi (2010) The World-wide Governance Indicators A Summary of Methodol-ogy Data and Analytical Issues World Bank Policy Re-search Working Paper No 5430 httppapersssrncomsol3paperscfmabstract_id=1682130
Source World Bank
Owner Worldwide Governance Indicators (WGI) project
Ratio of girls-to-boys out of primary school
P2HUNWBKWDIEDUCOSR
Page table 24 (p 159)
Children out of school are the number of primary-school-age children not enrolled in primary or secondary school
Source World Bank (WDI)
Owner UNESCO
Public spending on education total ( of GDP)
P2HUNWBKWDIEDUEXPP
Page table 24 (p 159)
Public expenditure on education consists of current andcapital public expenditure on education includes gov-ernment spending on educational institutions (both pub-lic and private) education administration as well assubsidies for private entities (studentshouseholds andother privates entities)
Source World Bank (WDI)
Owner UNESCO
Expenditure per student
P2HUNWBKWDIEDUEXPS
Page table 24 (p 159)
Public expenditure per student is the public currentspending on education divided by the total number ofstudents by level as a percentage of GDP per capitaPublic expenditure (current and capital) includes govern-ment spending on educational institutions (both publicand private) education administration as well as subsi-dies for private entities (studentshouseholds and otherprivates entities)
Source World Bank (WDI)
Owner UNESCO
Literacy rate adult female ( of females ages 15 andabove)
P2HUNWBKWDIEDUFILT
Page table 24 (p 159) map 31 (p 116)
Adult literacy rate is the percentage of people ages 15and above who can with understanding read and writea short simple statement on their everyday life
Source World Bank (WDI)
Owner UNESCO
Ratio of girls to boys in primary and secondary education()
P2HUNWBKWDIEDUGEN
Page table 24 (p 159) chart 61 (p 117)
Ratio of girls to boys in primary and secondary educationis the ratio of the female to male gross enrolment ratesin primary and secondary school
Source World Bank (WDI)
Owner UNESCO
167
PART 2
Health expenditure per capita (current US$)P2HUNWBKWDIHAEHEPCP
Page table 24 (p 159) map 32 (p 118)
Total health expenditure is the sum of public and pri-vate health expenditures as a ratio of total populationIt covers the provision of health services (preventive andcurative) family planning activities nutrition activitiesand emergency aid designated for health but does notinclude provision of water and sanitation Data are incurrent US dollars
Source World Bank (WDI)
Owner WHO
Health expenditure total ( of GDP)P2HUNWBKWDIHAEHETOT
Page table 24 (p 159) chart 62 (p 119)
Total health expenditure is the sum of public and privatehealth expenditure It covers the provision of health ser-vices (preventive and curative) family planning activi-ties nutrition activities and emergency aid designatedfor health but does not include provision of water andsanitation
Source World Bank (WDI)
Owner WHO
Prevalence of HIV total ( of population ages 15-49)P2HUNWBKWDIHAEHIVPREV
Page table 24 (p 159)
Prevalence of HIV refers to the percentage of people ages15-49 who are infected with HIV
Source World Bank (WDI)
Owner UNAIDS and WHO
Improved sanitation facilities ( of population with ac-cess)P2HUNWBKWDIHAESANIMPS
Page table 24 (p 159) chart 63 (p 121)
Access to improved sanitation facilities refers to the per-centage of the population with at least adequate accessto excreta disposal facilities that can effectively preventhuman animal and insect contact with excreta Im-proved facilities range from simple but protected pit la-trines to flush toilets with a sewerage connection Tobe effective facilities must be correctly constructed andproperly maintained
Source World Bank (WDI)
Owner WHO and UNCF
Improved water source rural ( of rural population withaccess)P2HUNWBKWDIHAEWATIMPRU
Page table 24 (p 159) map 33 (p 120)
Access to an improved water source refers to the percent-age of the population with reasonable access to an ad-equate amount of water from an improved source suchas a household connection public standpipe borehole
protected well or spring and rainwater collection Unim-proved sources include vendors tanker trucks and un-protected wells and springs Reasonable access is de-fined as the availability of at least 20 litres a person aday from a source within one kilometre of the dwellingSource World Bank (WDI)Owner WHO and UNCF
Improved water source urban ( of urban populationwith access)P2HUNWBKWDIHAEWATIMPWU
Page table 24 (p 159)Access to an improved water source refers to the percent-age of the population with reasonable access to an ad-equate amount of water from an improved source suchas a household connection public standpipe boreholeprotected well or spring and rainwater collection Unim-proved sources include vendors tanker trucks and un-protected wells and springs Reasonable access is de-fined as the availability of at least 20 litres a person aday from a source within one kilometre of the dwellingSource World Bank (WDI)Owner WHO and UNCF
Poverty headcount ratio at $125 a day (PPP) ( of re-gional population)P2HUNWBKWDIPOVAGG
Page chart 58 (p 111)Data are from PovcalNet the on-line tool for povertymeasurement developed by the Development ResearchGroup of the World Bank See httpiresearchworldbankorgPovcalNetpovDuplichtmlSource PovcalNetOwner World Bank
Gini-index of income distributionP2HUNWBKWDIPOVGINI
Page table 22 (p 153) map 28 (p 113)Gini index measures the extent to which the distribu-tion of income among individuals or households withinan economy deviates from a perfectly equal distributionA Lorenz curve plots the cumulative percentages of totalincome received against the cumulative number of recip-ients starting with the poorest individual or householdThe Gini index measures the area between the Lorenzcurve and a hypothetical line of absolute equality ex-pressed as a percentage of the maximum area under theline Thus a Gini index of 0 represents perfect equalitywhile an index of 100 implies perfect inequalitySource World Bank (WDI)Owner World Bank
Poverty headcount ratio at $125 a day (PPP) ( of pop-ulation)P2HUNWBKWDIPOVH125
Page table 21 (p 150)Population below US$125 a day is the percentage of thepopulation living on less than US$125 a day at 2005
168
DEFINITIONS AND SOURCES
international prices As a result of revisions in PPP ex-change rates poverty rates for individual countries can-not be compared with poverty rates reported in earliereditionsSource World Bank (WDI)Owner World Bank
Income share held by highest 20P2HUNWBKWDIPOVH20
Page table 22 (p 153)Percentage share of income or consumption is the sharethat accrues to subgroups of population indicated bydeciles or quintiles Percentage shares by quintile maynot sum to 100 because of roundingSource World Bank (WDI)Owner World Bank
Poverty headcount ratio at $2 a day (PPP) ( of popula-tion)P2HUNWBKWDIPOVH200
Page table 21 (p 150)Population below US$2 a day is the percentage of thepopulation living on less than US$200 a day at 2005international prices As a result of revisions in PPP ex-change rates poverty rates for individual countries can-not be compared with poverty rates reported in earliereditionsSource World Bank (WDI)Owner World Bank
Poverty headcount ratio at national poverty line ( ofpopulation)P2HUNWBKWDIPOVHNPL
Page table 21 (p 150)National poverty rate is the percentage of the popula-tion living below the national poverty line National es-timates are based on population-weighted subgroup es-timates from household surveysSource World Bank (WDI)Owner World Bank
Poverty headcount ratio at rural poverty line ( of ruralpopulation)P2HUNWBKWDIPOVHRPL
Page table 21 (p 150)Rural poverty rate is the percentage of the rural popula-tion living below the national rural poverty lineSource World Bank (WDI)Owner World Bank
Income share held by lowest 20P2HUNWBKWDIPOVL20
Page table 22 (p 153)Percentage share of income or consumption is the sharethat accrues to subgroups of population indicated bydeciles or quintiles Percentage shares by quintile maynot sum to 100 because of roundingSource World Bank (WDI)Owner World Bank
Poverty gap at $125 a day (PPP) ()P2HUNWBKWDIPOVP125
Page table 21 (p 150) map 27 (p 110)Poverty gap is the mean shortfall from the poverty line(counting the nonpoor as having zero shortfall) ex-pressed as a percentage of the poverty line This mea-sure reflects the depth of poverty as well as its incidenceSource World Bank (WDI)Owner World Bank
Poverty gap at $2 a day (PPP) ()P2HUNWBKWDIPOVP200
Page table 21 (p 150)Poverty gap is the mean shortfall from the poverty line(counting the nonpoor as having zero shortfall) ex-pressed as a percentage of the poverty line This mea-sure reflects the depth of poverty as well as its incidenceSource World Bank (WDI)Owner World Bank
Poverty gap at national poverty line ()P2HUNWBKWDIPOVPNPL
Page table 21 (p 150)Poverty gap at national poverty line is the mean short-fall from the poverty line (counting the nonpoor as hav-ing zero shortfall) as a percentage of the poverty lineThis measure reflects the depth of poverty as well as itsincidenceSource World Bank (WDI)Owner World Bank
Poverty gap at rural poverty line ()P2HUNWBKWDIPOVPRPL
Page table 21 (p 150)Poverty gap at rural poverty line is the mean shortfallfrom the poverty line (counting the nonpoor as hav-ing zero shortfall) as a percentage of the national ruralpoverty line This measure reflects the depth of povertyas well as its incidenceSource World Bank (WDI)Owner World Bank
Food aid receivedP2HUNWFPFAISFDAID
Page table 25 (p 162) chart 64 (p 123) map 34 (p122)Quantity of food aid that reaches the recipient coun-try during a given period Quantities exported in GrainEquivalent The latter is a unit of measurement usedas alternative to Actual Ton for cereal-derived productsTo convert a product into grain equivalent a commodityspecific conversion factor is used For example if the fac-tor to convert wheat flour into wheat is 137 a tonne ofwheat flour corresponds to 0730 tons of wheat (1137)Source Food Aid Information SystemOwner WFP
169
PART 2
Percentage of adults with low body mass index (BMI)P2HUNWHOGHOADLTLBMI
Page table 18 (p 141)The indicator of weight adequacy in relation to height ofolder children adolescents and adults It is calculated asweight (kilograms) divided by height (metres) squaredThe acceptable range for adults is 185 to 249 and forchildren it varies with ageSource Global Health ObservatoryOwner WHO
Percentage of female adults with low body mass index(BMI)P2HUNWHOGHOADLTLBMIF
Page table 18 (p 141) map 22 (p 99)The indicator of weight adequacy in relation to height ofolder female children adolescents and adults It is cal-culated as weight (kilograms) divided by height (metres)squared The acceptable range for adults is 185 to 249 and for children it varies with ageSource Global Health ObservatoryOwner WHO
Percentage of adults who are obese by genderP2HUNWHOGHOADLTOBS
Page table 18 (p 141)Percentage of male and female defined population witha body mass index (BMI) of 25 kgm2 or higherSource Global Health ObservatoryOwner WHO
Percentage of adults who are obeseP2HUNWHOGHOADLTOBSx
Page map 23 (p 99)Percentage of adult defined population with a bodymassindex (BMI) of 25 kgm2 or higherSource Global Health ObservatoryOwner WHO
Percentage of children under 5 who are stuntedP2HUNWHOGHOCHLDSTNT
Page table 18 (p 141) chart 43 (p 98)Percentage of stunting (height-for-age less than -2 stan-dard deviations of the WHO Child Growth Standards me-dian) among children aged 0-5 yearsSource Global Health ObservatoryOwner WHO
Percentage of children under 5 who are underweightP2HUNWHOGHOCHLDUW
Page table 18 (p 141) chart 42 (p 97) map 21 (p 96)Percentage of underweight (weight-for-age less than -2standard deviations of the WHO Child Growth Standardsmedian) among children aged 0-5 yearsSource Global Health ObservatoryOwner WHO
Percentage of children under 5 who are wastedP2HUNWHOGHOCHLDWSTD
Page table 18 (p 141) chart 43 (p 98)Percentage of wasting (weight-for-height less than -2standard deviations of the WHO Child Growth Standardsmedian) among children aged 0-5 yearsSource Global Health ObservatoryOwner WHO
Percentage of newborns with low birth weightP2HUNWHOGHONEWLWB
Page table 18 (p 141)Low-birthweight babies are newborns weighing lessthan 2500 grams with the measurement taken withinthe first hours of life before significant postnatal weightloss has occurredSource Global Health ObservatoryOwner WHO
170

TABLE 14 Population at risk persons affected by natural disasters (continued)Persons affected by natural disasters
total droughtearthquake
extremetemperature
flood landslide storm volcanoeswildfiresand
epidemics
thousands thousands thousands thousands thousands thousands thousands thousands
2010 2010 2010 2010 2010 2010 2010 2010
Cuba
Dominica
Dominican Republic 52 0 0 0 39 0 12 0
Ecuador 121 108 0 0 11 0 0 2
El Salvador 12 0 0 0 0 0 12 0
French Guiana
Grenada 0 0 0 0 0 0 0 0
Guatemala 456 0 0 0 3 51 400 2
Guyana 0 0 0 0 0 0 0 0
Haiti 4310 0 3700 0 24 0 78 507
Honduras 102 45 0 0 5 0 25 27
Jamaica 3 0 0 0 0 0 3 0
Mexico 1600 0 25 0 1020 0 555 0
Netherlands Antilles
Nicaragua 76 0 0 0 76 0 0 0
Panama 33 0 0 0 33 0 0 0
Paraguay 16 0 0 0 0 0 0 16
Peru 154 0 0 71 80 1 0 2
St Kitts amp Nevis
St Lucia 3 0 0 0 2 0 1 0
St Vincent amp Grenadines
Suriname
Trinidad amp Tobago 0 0 0 0 0 0 0 0
Uruguay 0 0 0 0 0 0 0 0
Venezuela (Boliv Rep of) 95 0 0 0 95 0 0 0
OCEANIA 62 0 1 0 16 0 45 0
Fiji 39 0 0 0 0 0 39 0
French Polynesia 3 0 0 0 0 0 3 0
New Caledonia
Papua New Guinea 0 0 0 0 0 0 0 0
Samoa
Solomon Islands 18 0 1 0 16 0 1 0
Tonga 0 0 0 0 0 0 0 0
Vanuatu 0 0 0 0 0 0 0 0
DEVELOPED REGIONS 1922 0 835 15 509 0 536 27
NORTH AMERICA 36 0 1 0 7 0 29 0
Bermuda
Canada 0 0 0 0 0 0 0 0
United States of America 36 0 1 0 7 0 29 0
ASIA amp OCEANIA 1046 0 792 15 211 0 7 20
Australia 219 0 0 0 211 0 7 0
Israel 20 0 0 0 0 0 0 20
Japan 507 0 492 15 0 0 0 0
New Zealand 300 0 300 0 0 0 0 0
EUROPE 840 0 42 0 291 0 500 7
Albania 14 0 0 0 14 0 0 0
Belarus
Bosnia amp Herzegovina 35 0 0 0 35 0 0 0
Croatia 1 0 0 0 1 0 0 0
European Union 634 0 15 0 119 0 500 0
Iceland 0 0 0 0 0 0 0 0
Macedonia FYR
Montenegro 6 0 0 0 6 0 0 0
Norway
Republic of Moldova 12 0 0 0 12 0 0 0
Russian Federation 66 0 0 0 58 0 0 7
Serbia 32 0 27 0 5 0 0 0
Switzerland 0 0 0 0 0 0 0 0
Ukraine 40 0 0 0 40 0 0 0
129
TABLE 15 UndernourishmentShare of population undernourished Incidence of undernourishment Depth of hunger
pa millions millions pakcalcapday kcalcapday
pa
1995-97 2006-08 growth1995-97 -2006-08
1995-97 2006-08 growth1995-97 -2006-08
1995-97 2006-08 growth1995-97 -2006-08
WORLD 18 16 minus23 7012 7392 05 214 212 minus03
DEVELOPING REGIONS 18 16 minus23 7011 7392 05 234 234 minus03
AFRICA 29 23 minus24 1622 1603 minus01 253 234 minus05
North Africa 5 31 185 188 01
Algeria 5 15 180 180 00
Egypt 190 200 03
Libya 130 130 05
Morocco 6 16 210 200 minus03
Tunisia 120 120 00
Sub-Saharan Africa 31 23 minus23 1591 1603 01 268 243 minus05
Angola 61 41 minus35 78 72 minus07 390 320 minus17
Benin 18 12 minus36 10 10 00 230 210 minus08
Botswana 23 25 08 04 05 20 230 240 08
Burkina Faso 12 8 minus36 12 12 00 210 200 minus06
Burundi 56 62 09 35 49 31 350 390 14
Cameroon 34 22 minus39 50 42 minus16 260 230 minus08
Cape Verde 14 11 minus22 01 01 00 190 190 00
Central African Republic 47 40 minus15 16 17 06 320 300 minus02
Chad 53 39 minus27 39 41 05 370 320 minus12
Comoros 47 47 00 03 04 26 300 300 07
Congo 41 13 minus99 12 05 minus76 310 230 minus18
Cocircte drsquoIvoire 17 14 minus17 26 29 10 240 230 00
Congo Dem Rep
Djibouti 50 26 minus58 03 02 minus36 350 280 minus20
Equatorial Guinea
Eritrea 64 65 01 21 31 36 340 350 minus02
Ethiopia 62 41 minus37 362 326 minus09 390 320 minus17
Gabon 140 140 minus04
Gambia 23 19 minus17 03 03 00 250 240 05
Ghana 13 5 minus83 23 11 minus65 210 180 minus23
Guinea 19 16 minus15 15 16 06 270 260 minus02
Guinea-Bissau 26 22 minus15 03 03 00 260 250 00
Kenya 32 33 03 90 124 30 250 260 02
Lesotho 16 14 minus12 03 03 00 220 220 00
Liberia 32 32 00 07 11 42 330 330 02
Madagascar 26 25 minus04 35 47 27 250 250 05
Malawi 36 27 minus26 38 39 02 310 280 minus08
Mali 25 12 minus65 25 15 minus45 260 220 minus13
Mauritania 9 8 minus11 02 02 00 210 210 minus03
Mauritius 7 5 minus30 01 01 00 190 180 minus03
Mozambique 47 38 minus19 78 83 06 360 330 minus12
Namibia 30 18 minus45 05 04 minus20 250 220 minus08
Niger 37 16 minus73 35 23 minus37 300 240 minus14
Nigeria 10 6 minus45 109 94 minus13 200 180 minus12
Rwanda 53 32 minus45 30 30 00 360 300 minus06
Senegal 26 19 minus28 23 23 00 240 220 minus03
Seychelles 10 8 minus20 00 00 160 150 minus04
Sierra Leone 39 35 minus10 16 19 16 360 340 minus07
Somalia
Sudan 29 22 minus25 93 88 minus05 260 240 minus12
South Africa 160 150 00
Swaziland 21 19 minus09 02 02 00 220 220 09
Tanzania Utd Rep 42 34 minus19 128 139 08 300 280 05
Togo 36 30 minus16 17 19 10 290 280 minus06
Uganda 23 22 minus04 49 67 29 240 240 00
Zambia 38 44 13 36 54 38 300 320 06
Zimbabwe 44 30 minus34 53 37 minus32 340 300 minus06
130
TABLE 15 Undernourishment (continued)Share of population undernourished Incidence of undernourishment Depth of hunger
pa millions millions pakcalcapday kcalcapday
pa
1995-97 2006-08 growth1995-97 -2006-08
1995-97 2006-08 growth1995-97 -2006-08
1995-97 2006-08 growth1995-97 -2006-08
ASIA 16 15 minus21 4909 5372 08 233 238 minus02
Central Asia 12 13 minus20 46 55 16 171 172 minus01
Kazakhstan 130 120 00
Kyrgyzstan 13 11 minus15 06 06 00 210 210 minus03
Tajikistan 42 26 minus43 24 18 minus26 270 230 minus05
Turkmenistan 9 7 minus23 04 03 minus26 180 180 00
Uzbekistan 5 11 74 12 28 80 160 180 07
East Asia 13 11 minus18 2194 2058 minus06 241 241 minus04
Brunei Darussalam 140 130 minus05
Cambodia 40 25 minus42 47 36 minus24 280 250 minus05
China 12 10 minus16 1417 1296 minus08 250 250 minus05
Indonesia 11 13 15 220 297 28 210 220 00
Korea DPR 30 35 14 66 84 22 250 270 10
Korea Republic of 120 130 00
Lao PDR 29 22 minus25 14 14 00 270 260 minus05
Malaysia 120 130 minus05
Mongolia 33 27 minus18 08 07 minus12 260 260 02
Myanmar
Philippines 20 13 minus38 141 118 minus16 250 240 minus07
Singapore
Thailand 18 16 minus11 111 107 minus03 240 240 minus07
Viet Nam 22 11 minus61 167 96 minus49 270 240 minus12
South Asia 20 20 minus11 2570 3174 19 232 246 00
Afghanistan
Bangladesh 41 26 minus41 542 414 minus24 330 290 minus04
Bhutan
India 17 19 10 1671 2246 27 220 240 00
Iran (Islamic Rep) 170 180 07
Maldives 9 10 10 00 00 180 190 07
Nepal 20 17 minus15 44 47 06 230 220 minus03
Pakistan 20 25 20 268 428 43 260 280 00
Sri Lanka 25 20 minus20 45 39 minus13 260 250 minus02
West Asia 24 24 minus42 99 85 minus14 173 169 minus02
Armenia 36 21 minus48 11 06 minus54 230 200 minus14
Azerbaijan 27 22 220 140 minus28
Bahrain
Cyprus 120 120 00
Georgia 19 6 minus99 10 03 minus104 200 160 minus39
Iraq
Jordan 5 02 170 150 00
Kuwait 5 5 00 01 01 00 180 190 minus12
Lebanon 160 170 04
Occupied PalestinianTerritory
10 21 70 03 08 93 160 190
Saudi Arabia 130 130 minus05
Syrian Arab Republic 160 170 04
Turkey 160 160 04
United Arab Emirates 130 140 05
Yemen 31 30 minus03 50 67 27 260 260 02
LATIN AMERICA amp THECARIBBEAN
14 11 minus19 480 416 minus13 212 203 minus03
Argentina 120 130 00
Bahamas 8 6 minus26 00 00 160 160 00
Barbados 140 140 05
Belize 8 5 minus42 00 00 180 170 00
Bolivia (Plur State) 24 27 11 19 25 25 230 240 00
Brazil 10 6 minus45 166 117 minus31 240 220 minus05
Chile 150 140 minus08
Colombia 11 9 minus18 40 41 02 210 210 minus03
Costa Rica 150 150 04
131
TABLE 15 Undernourishment (continued)Share of population undernourished Incidence of undernourishment Depth of hunger
pa millions millions pakcalcapday kcalcapday
pa
1995-97 2006-08 growth1995-97 -2006-08
1995-97 2006-08 growth1995-97 -2006-08
1995-97 2006-08 growth1995-97 -2006-08
Cuba 14 15 190 120 minus18
Dominica 150 150 00
Dominican Republic 26 24 minus07 21 23 08 240 230 minus03
Ecuador 16 15 minus06 18 20 10 190 190 minus03
El Salvador 12 9 minus26 07 06 minus14 200 190 minus03
French Guiana
Grenada 18 21 14 00 00 240 250 08
Guatemala 20 22 09 21 29 30 220 230 06
Guyana 11 8 minus29 01 01 00 200 190 minus12
Haiti 60 57 minus05 48 55 12 430 420 minus03
Honduras 16 12 minus26 09 09 00 240 230 minus05
Jamaica 6 5 minus16 02 01 minus61 170 170 minus07
Mexico 190 190 00
Netherlands Antilles 150 150 minus11
Nicaragua 38 19 minus61 18 11 minus44 310 260 minus18
Panama 20 15 minus26 06 05 minus16 230 220 minus03
Paraguay 10 10 00 05 06 17 200 210 minus03
Peru 21 16 minus24 50 45 minus10 230 220 minus08
St Kitts amp Nevis 16 16 00 00 00 220 220 06
St Lucia 7 8 12 00 00 180 190 00
St Vincent amp Grenadines 16 5 minus100 00 00 210 170 minus10
Suriname 13 15 13 01 01 00 200 200 00
Trinidad amp Tobago 14 11 minus22 02 02 00 220 220 03
Uruguay 140 140 minus04
Venezuela (Boliv Rep of) 14 7 minus61 31 19 minus44 190 170 minus04
OCEANIA 8 9 00 01 182 173 minus06
Fiji 5 00 170 160 minus07
French Polynesia 5 00 160 150 minus11
New Caledonia 9 8 minus11 00 00 210 210 03
Papua New Guinea
Samoa 10 00 180 150 minus11
Solomon Islands 13 11 minus15 00 01 190 190 minus06
Tonga
Vanuatu 9 00 200 180 minus07
DEVELOPED REGIONS 5 01 125 116 01
NORTH AMERICA 111 101 minus02
Bermuda 180 200 07
Canada 120 110 minus10
United States of America 110 100 minus06
ASIA amp OCEANIA 128 126 00
Australia 130 120 00
Israel 90 90 00
Japan 130 130 00
New Zealand 120 120 00
EUROPE 5 01 131 121 01
Albania 160 160 minus07
Belarus 120 130 05
Bosnia amp Herzegovina 150 140 minus12
Croatia 180 150 minus18
European Union 5 01 120 115 minus02
Iceland 130 120 minus05
Macedonia FYR 180 150 minus11
Montenegro 170
Norway 120 110 minus05
Republic of Moldova 190 190 07
Russian Federation 160 130 minus09
Serbia 170
Switzerland 120 120 00
Ukraine 150 130 minus05
132
TABLE 16 Dietary energy supplies and changes in dietary compositionDietary energy supply per person Contribution in diets by type Contribution in diets by commodity
carbo-hydrates
proteins fats cereals starchy roots pulses
kcalcapday kcalcapday
1990-92 2006-08 2005-07 2005-07 2005-07 1990-92 2005-07 1990-92 2005-07 1990-92 2005-07
WORLD 2583 2805 65 11 24 53 48 8 7 5 5
DEVELOPING REGIONS 2430 2664 67 11 22 58 53 9 8 5 5
AFRICA 2266 2495 72 10 18 49 49 22 20 5 5
North Africa 3035 3175 71 11 17 62 60 2 3 2 2
Algeria 2890 3090 70 11 19 57 56 2 3
Egypt 3090 3160 73 12 15 66 64 2 2
Libya 3180 3150 63 10 27 47 47 2 3
Morocco 3000 3260 72 11 17 62 60 2 2
Tunisia 3120 3330 64 11 24 55 50 2 2
Sub-Saharan Africa 2102 2351 72 10 19 47 47 24 22 5 6
Angola 1580 1960 70 9 21 29 36 30 26 3 3
Benin 2250 2510 72 9 19 41 40 34 31 4 5
Botswana 2260 2230 67 11 22 43 43 6 6 5 6
Burkina Faso 2460 2690 68 12 20 75 73 5 5
Burundi 1860 1680 82 11 7 17 19 29 32 27 19
Cameroon 2020 2240 72 10 18 39 42 20 17 2 6
Cape Verde 2370 2530 63 11 26 50 45 4 4 4 3
Central African Republic 1880 1960 61 9 29 20 25 37 31
Chad 1700 2010 64 12 24 52 57 13 8 2 4
Comoros 1900 1840 69 9 22 41 38 17 15 6 9
Congo 1970 2570 69 8 23 19 26 41 34
Cocircte drsquoIvoire 2470 2500 74 8 18 35 33 31 33
Congo Dem Rep 80 6 14 16 23 57 55
Djibouti 1720 2300 63 10 27 52 52 2 3
Equatorial Guinea
Eritrea 1530 1590 73 12 15 72 74 5 3 8 5
Ethiopia 1550 1950 79 11 10 67 66 15 13 6 7
Gabon 2520 2710 69 12 19 25 33 21 17
Gambia 2470 2330 64 9 27 55 56
Ghana 2120 2900 77 8 15 32 29 39 37
Guinea 2420 2550 70 9 22 50 47 14 14
Guinea-Bissau 2290 2270 71 8 21 61 59 8 9
Kenya 1970 2030 68 11 21 47 49 8 5 6 7
Lesotho 2370 2460 77 11 12 76 78 2 3
Liberia 2220 2200 70 7 24 45 43 22 23
Madagascar 2200 2130 78 9 13 52 59 22 19
Malawi 1870 2150 77 10 13 69 59 4 15 7 6
Mali 2180 2590 70 11 19 69 67 1 3
Mauritania 2580 2810 63 12 25 55 51 4 4
Mauritius 2760 2930 62 11 26 48 46 3 3
Mozambique 1750 2070 76 7 17 34 40 41 37
Namibia 2060 2360 68 11 21 48 46 14 14 4 3
Niger 1970 2390 68 13 19 74 60 6 14
Nigeria 2310 2710 69 9 22 47 45 20 19 3 3
Rwanda 1830 2090 82 10 9 18 18 30 36 15 12
Senegal 2190 2280 65 10 25 64 60 1 3
Seychelles 2280 2400 60 14 26 46 41
Sierra Leone 1950 2120 67 10 24 55 50 5 10 4 5
Somalia
Sudan 1960 2280 61 13 26 57 50 2 3
South Africa 2820 3000 65 11 24 53 54
Swaziland 2380 2290 68 11 21 52 50 5 5
Tanzania Utd Rep 2080 2020 75 10 15 47 46 24 17 5 7
Togo 1890 2150 71 9 20 48 49 28 25 2 4
Uganda 2280 2220 74 9 17 19 23 25 23 9 8
Zambia 2010 1880 73 10 17 65 61 13 14
Zimbabwe 1980 2210 66 10 24 62 56 2 2
133
TABLE 16 Dietary energy supplies and changes in dietary composition (continued)Dietary energy supply per person Contribution in diets by type Contribution in diets by commodity
carbo-hydrates
proteins fats cereals starchy roots pulses
kcalcapday kcalcapday
1990-92 2006-08 2005-07 2005-07 2005-07 1990-92 2005-07 1990-92 2005-07 1990-92 2005-07
ASIA 2434 2667 67 11 22 63 56 6 5 5 5
Central Asia 2715 2793 64 12 25 59 54 4 6
Kazakhstan 3280 3510 61 12 27 57 43 4 6
Kyrgyzstan 2400 2660 68 12 20 57 48 5 8
Tajikistan 2020 2190 64 10 26 63 63
Turkmenistan 2550 2740 65 13 23 57 61
Uzbekistan 2650 2560 64 12 25 59 57
East Asia 2508 2872 64 11 24 63 53 7 5 3 6
Brunei Darussalam 2730 2980 64 12 25 48 45
Cambodia 1870 2180 75 10 14 82 72 2 4
China 2580 2990 61 12 27 63 50 7 5
Indonesia 2390 2550 73 9 18 66 63 7 6
Korea DPR 2340 2110 74 11 15 60 62 3 7 6 5
Korea Republic of 2970 3040 63 11 25 54 44
Lao PDR 2010 2240 76 11 13 78 70 6 4
Malaysia 2720 2890 63 11 26 42 47 3 2
Mongolia 2080 2240 56 13 32 42 46 2 4
Myanmar 67 11 22 73 59 2 6
Philippines 2230 2580 73 9 18 53 57 4 3
Singapore
Thailand 2250 2540 71 9 20 57 49
Viet Nam 2090 2780 70 10 19 76 66
South Asia 2279 2374 71 10 19 65 60 2 3 5 5
Afghanistan
Bangladesh 1960 2270 80 9 12 84 78 1 3
Bhutan
India 2290 2360 71 10 19 64 60 5 5
Iran (Islamic Rep) 2970 3050 69 11 20 60 53 3 4
Maldives 2400 2550 60 16 23 46 35
Nepal 2190 2340 74 10 15 74 69 3 5 3 3
Pakistan 2210 2280 63 10 27 55 47 3 3
Sri Lanka 2170 2370 73 9 18 56 56 4 2 3 3
West Asia 2963 3067 64 11 25 51 49 3 3 4 3
Armenia 1920 2260 64 12 24 59 44 8 5
Azerbaijan 2160 3020 73 11 16 66 60 2 6
Bahrain
Cyprus 3120 3190 48 12 41 28 21 3 3
Georgia 1850 2730 67 11 22 57 50 5 3
Iraq
Jordan 2840 3000 63 10 27 50 46 3 2
Kuwait 2350 3030 58 12 30 39 42 2 2
Lebanon 3010 3090 58 11 32 34 34 3 6 4 3
Occupied PalestinianTerritory
2080 66 11 23 0 51
Saudi Arabia 2850 3120 64 11 25 48 48
Syrian Arab Republic 2830 3040 59 10 30 50 45
Turkey 3590 3500 62 11 27 51 48 3 3 4 3
United Arab Emirates 3160 3170 63 13 24 33 43 3 4
Yemen 1980 2050 69 11 20 66 61 3 3
LATIN AMERICA amp THECARIBBEAN
2664 2915 62 11 27 39 37 6 6 5 5
Argentina 3010 3030 55 13 32 32 31 3 3
Bahamas 2610 2710 57 12 30 27 27 2 2
Barbados 3040 3020 59 12 29 30 27 3 3
Belize 2510 2710 67 11 23 37 39 4 4
Bolivia (Plur State) 2030 2100 71 11 18 43 47 9 7
Brazil 2760 3120 59 11 30 33 32 5 5 5 5
Chile 2600 2960 61 12 27 43 40 4 4
Colombia 2410 2690 66 10 24 33 34 8 6
Costa Rica 2820 2820 62 11 27 32 31 3 4
134
TABLE 16 Dietary energy supplies and changes in dietary composition (continued)Dietary energy supply per person Contribution in diets by type Contribution in diets by commodity
carbo-hydrates
proteins fats cereals starchy roots pulses
kcalcapday kcalcapday
1990-92 2006-08 2005-07 2005-07 2005-07 1990-92 2005-07 1990-92 2005-07 1990-92 2005-07
Cuba 2720 3420 73 10 17 34 40 5 7 4 7
Dominica 3000 3090 64 12 24 26 25 7 9
Dominican Republic 2160 2270 61 9 30 30 29 5 4
Ecuador 2110 2300 55 10 35 35 34
El Salvador 2400 2580 67 11 22 56 44 1 2 4 6
French Guiana
Grenada 2470 2400 54 12 34 28 22 2 3 3 3
Guatemala 2290 2150 67 11 23 58 51 6 4
Guyana 2300 2740 68 11 21 53 46 4 4 3 2
Haiti 1730 1850 74 9 17 44 46 11 9 8 5
Honduras 2300 2610 66 10 24 51 44 4 5
Jamaica 2510 2840 61 11 28 34 32 9 5
Mexico 3090 3260 62 11 26 47 44 4 4
Netherlands Antilles 3280 3260 64 11 24 36 36 4 3
Nicaragua 1770 2420 68 10 22 47 50 8 7
Panama 2320 2450 65 12 24 39 43 2 2
Paraguay 2390 2660 58 11 32 27 29 18 13 4 5
Peru 2110 2410 74 11 15 49 44 8 14 2 3
St Kitts amp Nevis 2580 2460 59 12 29 32 26 3 2 2 2
St Lucia 2580 2710 58 14 28 30 28 6 2
St Vincent amp Grenadines 2360 2860 64 11 25 30 33 7 5 2 2
Suriname 2440 2460 68 9 23 50 42 2 2
Trinidad amp Tobago 2610 2700 65 10 25 39 34 2 2 4 3
Uruguay 2660 2840 64 11 25 35 43 4 4
Venezuela (Boliv Rep of) 2460 2650 64 11 26 36 37 3 3
OCEANIA 2549 2850 60 10 30 32 34 15 14 3 2
Fiji 2640 3000 60 10 29 43 41 4 7 3 2
French Polynesia 2480 2880 48 14 39 25 31 5 4
New Caledonia 3210 3150 52 12 35 35 32 6 5
Papua New Guinea
Samoa 2550 2890 46 11 43 23 18 10 10
Solomon Islands 2120 2400 73 9 18 25 34 40 34 3 3
Tonga
Vanuatu 2530 2950 60 9 31 22 31 22 18
DEVELOPED REGIONS 3260 3426 53 12 35 29 28 5 5
NORTH AMERICA 3464 3728 49 12 38 23 22 3 3
Bermuda 2870 2650 48 12 40 19 24
Canada 3050 3530 51 12 37 21 25 4 4
United States of America 3510 3750 49 12 38 23 22 3 3
ASIA amp OCEANIA 2969 2892 56 13 31 36 35 3 3
Australia 3130 3220 46 13 40 22 22 3 3
Israel 3410 3530 49 14 37 35 33 2 2
Japan 2920 2800 58 13 29 39 38
New Zealand 2810 2810 54 12 34 23 24 3 4
EUROPE 3228 3401 54 12 34 30 30 6 5
Albania 2560 2890 58 14 29 57 40 1 2
Belarus 3180 3150 56 12 32 37 30 10 11
Bosnia amp Herzegovina 2670 3080 67 11 21 61 45 5 5
Croatia 2420 2990 57 11 32 30 31 7 4
European Union 3341 3453 51 12 37 26 28 5 4
Iceland 3090 3260 45 16 39 23 20 3 3
Macedonia FYR 2550 3060 55 10 34 44 34 3 3
Montenegro
Norway 3230 3450 51 12 36 27 28 5 4
Republic of Moldova 2880 2850 70 11 20 55 48 5 5
Russian Federation 2960 3320 63 12 25 40 36 8 7
Serbia
Switzerland 3370 3450 49 11 41 22 21
Ukraine 3040 3290 63 11 26 43 36 8 8
135
TABLE 17 Changes in dietary compositionContribution in diets by commodity
meat and fish dairy and eggs fruit and vegetables sugar vegetable oils other
1990-92 2005-07 1990-92 2005-07 1990-92 2005-07 1990-92 2005-07 1990-92 2005-07 1990-92 2005-07
WORLD 8 11 5 5 4 5 8 8 8 9 11 13
DEVELOPING REGIONS 7 10 4 4 4 5 7 7 7 8 10 12
AFRICA 4 4 5 6 6 6 6 6 9 9 11 11
North Africa 3 3 3 3 6 7 10 9 9 7 7 9
Algeria 3 3 6 6 3 5 9 9 14 10 6 8
Egypt 2 3 2 2 7 9 10 8 6 4 5 8
Libya 5 4 5 5 8 7 12 10 14 16 7 8
Morocco 3 3 4 6 10 11 8 8 11 10
Tunisia 3 3 4 5 6 6 9 10 15 14 6 10
Sub-Saharan Africa 4 4 7 7 6 6 5 5 9 9 12 12
Angola 5 5 7 8 14 12 12 10
Benin 2 2 6 8 13 14
Botswana 6 4 9 7 11 13 6 9 14 12
Burkina Faso 3 3 4 5 13 14
Burundi 10 15 17 15
Cameroon 3 3 10 8 3 4 8 8 15 12
Cape Verde 6 9 5 8 2 2 7 9 10 8 12 12
Central African Republic 7 8 4 4 3 4 14 14 15 14
Chad 4 4 5 5 24 22
Comoros 8 7 4 6 8 11 16 14
Congo 4 3 5 4 4 6 12 15 15 12
Cocircte drsquoIvoire 8 7 4 4 10 11 12 12
Congo Dem Rep 7 3 7 7 13 12
Djibouti 5 6 5 5 19 11 10 16 7 7
Equatorial Guinea
Eritrea 1 4 4 6 10 8
Ethiopia 3 2 2 3 7 9
Gabon 8 8 16 12 6 6 5 6 19 18
Gambia 2 2 17 12 13 17 13 13
Ghana 7 11 3 4 7 7 12 12
Guinea 13 10 4 5 11 14 8 10
Guinea-Bissau 4 4 4 3 1 6 13 12 9 7
Kenya 8 7 4 5 10 9 8 8 9 10
Lesotho 4 4 7 6 11 9
Liberia 4 4 2 3 16 19 11 8
Madagascar 6 4 3 3 3 3 3 4 11 8
Malawi 4 5 7 5 9 10
Mali 3 3 5 5 4 5 9 7 9 10
Mauritania 5 5 11 10 10 12 9 12 6 6
Mauritius 4 6 6 6 2 4 14 12 14 15 9 8
Mozambique 1 4 13 9 11 10
Namibia 6 6 4 5 16 10 2 7 6 9
Niger 4 5 3 3 2 3 3 5 8 10
Nigeria 3 3 2 3 13 13 12 14
Rwanda 21 18 2 4 14 12
Senegal 3 3 2 2 7 6 13 15 10 11
Seychelles 10 11 6 4 5 7 14 10 7 8 12 19
Sierra Leone 3 3 20 15 13 17
Somalia
Sudan 4 5 12 17 8 10 7 5 10 10
South Africa 8 9 3 3 12 10 8 12 16 12
Swaziland 5 6 4 5 3 3 15 13 7 6 9 12
Tanzania Utd Rep 3 6 3 5 5 7 13 12
Togo 9 10 13 12
Uganda 20 17 1 4 3 7 23 18
Zambia 3 3 8 6 4 6 7 10
Zimbabwe 3 4 11 12 8 10 14 16
136
TABLE 17 Changes in dietary composition (continued)Contribution in diets by commodity
meat and fish dairy and eggs fruit and vegetables sugar vegetable oils other
1990-92 2005-07 1990-92 2005-07 1990-92 2005-07 1990-92 2005-07 1990-92 2005-07 1990-92 2005-07
ASIA 8 12 3 4 3 4 6 6 7 8 9 12
Central Asia 7 7 9 10 2 4 5 6 9 9 8 9
Kazakhstan 10 9 8 13 1 3 6 9 5 8 9 9
Kyrgyzstan 11 7 12 12 2 4 6 9 4 5 3 7
Tajikistan 3 4 6 5 6 7 11 11 11 10
Turkmenistan 7 10 8 9 2 3 6 4 11 6 9 7
Uzbekistan 6 6 9 9 3 4 4 3 12 11 7 10
East Asia 9 14 1 2 3 5 4 4 6 7 9 13
Brunei Darussalam 9 8 7 9 5 5 12 13 7 8 12 12
Cambodia 5 5 1 4 2 3 8 12
China 9 15 1 2 3 6 3 2 6 7 8 13
Indonesia 2 3 6 6 7 8 12 14
Korea DPR 5 5 8 7 5 6 13 8
Korea Republic of 7 11 7 8 10 11 8 12 14 14
Lao PDR 4 5 2 5 1 2 9 14
Malaysia 12 11 4 3 3 3 13 12 14 12 9 10
Mongolia 30 17 8 11 8 6 1 6 9 10
Myanmar 2 6 2 2 3 6 10 9 8 12
Philippines 10 12 6 6 12 9 6 4 9 9
Singapore
Thailand 8 9 5 4 8 14 5 6 17 18
Viet Nam 6 12 4 5 3 4 2 3 9 10
South Asia 2 4 4 5 2 3 9 8 7 9 9 11
Afghanistan
Bangladesh 3 4 4 7 8 8
Bhutan
India 4 4 2 2 9 8 7 9 9 12
Iran (Islamic Rep) 3 5 3 3 8 12 9 9 9 7 5 7
Maldives 10 17 3 7 4 9 17 13 7 7 13 12
Nepal 3 4 1 2 6 7 10 10
Pakistan 2 3 9 12 12 12 10 11 9 12
Sri Lanka 3 3 3 2 11 11 3 4 17 19
West Asia 5 6 6 6 9 7 9 10 10 12 9 10
Armenia 6 8 7 10 8 13 4 8 2 5 6 7
Azerbaijan 5 4 7 6 5 3 6 6 1 4 8 11
Bahrain
Cyprus 12 13 10 10 8 7 12 13 13 15 14 18
Georgia 7 5 7 10 7 14 2 7 15 11
Iraq
Jordan 5 5 5 5 3 2 15 15 11 15 8 10
Kuwait 11 11 8 5 7 7 12 11 11 12 10 10
Lebanon 5 7 4 5 15 9 11 11 14 14 10 11
Occupied PalestinianTerritory
0 5 0 5 100 8 0 12 0 10 0 9
Saudi Arabia 7 7 5 5 10 10 10 10 13 12 7 8
Syrian Arab Republic 4 4 6 7 4 3 12 13 12 12 12 16
Turkey 6 6 8 8 8 8 11 14 9 10
United Arab Emirates 11 10 9 5 12 9 11 12 9 6 12 11
Yemen 3 4 2 3 10 12 9 10 7 7
LATIN AMERICA amp THECARIBBEAN
7 10 6 6 5 5 16 14 10 11 11 11
Argentina 17 17 8 9 14 16 11 11 15 13
Bahamas 18 17 7 6 9 9 16 15 3 6 18 18
Barbados 16 15 7 7 3 7 16 19 10 9 15 13
Belize 8 8 7 6 8 8 15 15 3 4 18 16
Bolivia (Plur State) 9 10 2 2 7 6 14 13 4 3 12 12
Brazil 8 12 6 7 4 4 17 13 13 13 9 9
Chile 9 14 6 5 3 3 15 14 9 8 11 12
Colombia 7 7 7 8 7 7 19 17 9 11 10 10
Costa Rica 5 5 8 10 6 5 21 19 12 12 13 14
137
TABLE 17 Changes in dietary composition (continued)Contribution in diets by commodity
meat and fish dairy and eggs fruit and vegetables sugar vegetable oils other
1990-92 2005-07 1990-92 2005-07 1990-92 2005-07 1990-92 2005-07 1990-92 2005-07 1990-92 2005-07
Cuba 6 5 6 3 4 6 21 15 9 6 11 11
Dominica 10 11 9 9 11 12 15 14 8 5 14 15
Dominican Republic 6 9 5 4 13 9 15 16 15 16 11 13
Ecuador 6 10 7 7 11 10 9 8 18 17 14 14
El Salvador 2 4 5 7 4 4 15 15 5 6 8 12
French Guiana
Grenada 10 15 10 9 8 7 17 16 9 11 13 14
Guatemala 2 4 3 3 2 3 17 15 6 9 6 11
Guyana 3 6 3 6 1 3 14 13 4 7 15 13
Haiti 3 4 8 6 10 12 5 7 11 11
Honduras 3 6 5 7 5 6 16 17 9 9 7 6
Jamaica 7 8 4 6 5 7 20 16 10 12 11 14
Mexico 6 9 5 5 3 4 16 15 8 8 11 11
Netherlands Antilles 15 13 8 6 10 18 7 6 20 18
Nicaragua 3 4 4 5 14 15 9 9 15 10
Panama 6 8 7 7 5 4 14 12 11 8 16 16
Paraguay 12 9 4 4 4 3 9 9 8 12 14 16
Peru 3 4 3 4 4 6 12 9 5 5 14 11
St Kitts amp Nevis 11 13 8 8 2 3 15 17 13 11 14 18
St Lucia 16 20 8 8 8 7 14 13 3 5 15 17
St Vincent amp Grenadines 11 12 5 5 4 6 18 17 9 8 14 12
Suriname 7 8 7 6 15 18 7 12 12 12
Trinidad amp Tobago 5 7 6 7 3 3 19 21 11 10 11 13
Uruguay 20 10 10 7 2 3 11 13 6 8 12 12
Venezuela (Boliv Rep of) 6 9 6 4 7 4 15 16 15 14 12 13
OCEANIA 11 10 6 7 4 4 7 8 8 8 22 21
Fiji 12 11 7 10 12 10 19 19
French Polynesia 18 19 6 6 2 2 11 7 9 11 24 20
New Caledonia 11 10 7 8 2 3 11 8 12 13 16 21
Papua New Guinea
Samoa 19 17 5 8 9 9 2 7 32 31
Solomon Islands 4 3 4 4 2 4 22 18
Tonga
Vanuatu 10 8 6 5 4 6 6 5 30 27
DEVELOPED REGIONS 11 11 9 9 4 4 13 13 12 14 19 18
NORTH AMERICA 12 12 11 10 3 3 17 17 16 18 16 15
Bermuda 19 17 6 6 11 6 11 14 10 12 24 21
Canada 11 10 8 6 7 6 14 14 14 16 21 19
United States of America 12 12 11 10 3 3 17 17 16 18 15 15
ASIA amp OCEANIA 12 12 8 7 3 4 12 10 11 14 18 17
Australia 15 15 12 10 3 4 15 13 13 16 17 17
Israel 8 12 7 6 9 9 12 7 14 19 13 12
Japan 12 12 7 7 3 3 11 10 10 13 18 17
New Zealand 13 15 9 4 7 8 16 17 7 7 22 21
EUROPE 11 10 9 9 5 5 11 12 10 12 20 19
Albania 4 8 12 18 5 10 6 7 8 6 7 9
Belarus 11 11 11 7 1 3 10 11 4 11 16 16
Bosnia amp Herzegovina 4 4 6 10 5 8 4 6 2 6 13 16
Croatia 6 7 10 11 4 4 17 13 8 13 18 17
European Union 12 11 9 9 5 5 11 11 12 14 22 19
Iceland 17 21 14 16 3 4 18 13 5 6 17 17
Macedonia FYR 9 7 5 6 8 7 12 12 5 14 14 17
Montenegro
Norway 14 14 11 9 3 4 13 12 10 11 17 18
Republic of Moldova 5 4 8 11 2 2 9 12 5 6 11 12
Russian Federation 10 8 8 8 12 13 5 9 17 19
Serbia
Switzerland 16 14 12 11 4 3 13 17 11 13 22 21
Ukraine 7 6 8 9 13 15 7 10 14 16
138
TABLE 18 Health effects of malnutritionShare of children under 5 share of
lowweightnewborns
Share of adults Dietaryironsupply
underweightstunted wasted total with
low BMIwomenwith lowBMI
overweight or obese per person
male female mg day
2009 2009 2009 2009 2009 2009 2009 2009 2005-07
WORLD 18 28 9 13 91 129 145
DEVELOPING REGIONS 20 30 10 14 64 107 144
AFRICA 22 39 10 111 65 135 152
North Africa 7 24 7 10 172 361 163
Algeria 4 16 4 6 107 243 136
Egypt 7 31 8 13 16 225 463 177
Libya 6 21 7 215 413 140
Morocco 10 23 11 53 73 111 231 163
Tunisia 3 9 3 5 139 334 157
Sub-Saharan Africa 25 42 11 126 44 92 150
Angola 28 51 8 38 102 98
Benin 20 45 8 15 92 35 95 154
Botswana 11 29 6 13 30 228 147
Burkina Faso 26 35 11 16 208 17 30 242
Burundi 39 63 8 11 28 37 135
Cameroon 17 36 7 11 67 70 151 158
Cape Verde 6 63 153 121
Central African Republic 22 45 11 13 153 20 53 123
Chad 37 45 16 22 203 24 38 180
Comoros 25 7 13 25 105 35 53 92
Congo 12 31 8 13 132 28 75 120
Cocircte drsquoIvoire 17 40 9 17 82 39 97 111
Congo Dem Rep 28 46 14 185 07 30 84
Djibouti 30 33 26 10 67 138 102
Equatorial Guinea 11 35 3 79 148
Eritrea 35 44 15 14 13 23 132
Ethiopia 35 51 12 20 09 16 154
Gabon 9 26 4 66 84 215 155
Gambia 16 28 7 20 23 144 113
Ghana 14 29 9 13 164 86 44 117 140
Guinea 23 39 11 132 43 51 107
Guinea-Bissau 17 48 9 26 81 91
Kenya 16 35 7 8 123 25 68 134
Lesotho 17 45 6 57 31 266 164
Liberia 20 39 8 14 100 31 77 117
Madagascar 37 53 15 16 192 18 15 113
Malawi 16 53 4 14 92 26 62 162
Mali 28 39 15 135 24 68 187
Mauritania 23 29 13 130 43 233 133
Mauritius 15 10 14 14 129 230 132
Mozambique 21 47 5 15 86 26 78 88
Namibia 18 30 8 16 159 43 168 140
Niger 40 55 12 192 15 37 235
Nigeria 27 41 14 12 122 51 90 196
Rwanda 18 52 5 6 98 49 40 174
Senegal 15 20 9 19 182 32 125 113
Seychelles 6 5 2 151 337 153
Sierra Leone 21 37 11 14 112 36 101 114
Somalia 33 42 13 34 71
Sudan 32 38 21 41 89 157
South Africa 86 232 428 143
Swaziland 6 30 3 9 32 61 371 138
Tanzania Utd Rep 17 44 4 104 40 68 147
Togo 22 28 16 109 30 61 131
Uganda 16 39 6 14 121 43 49 145
Zambia 15 46 6 11 96 12 70 113
Zimbabwe 14 36 7 99 92 28 138 143
139
TABLE 18 Health effects of malnutrition (continued)Share of children under 5 share of
lowweightnewborns
Share of adults Dietaryironsupply
underweightstunted wasted total with
low BMIwomenwith lowBMI
overweight or obese per person
male female mg day
2009 2009 2009 2009 2009 2009 2009 2009 2005-07
ASIA 22 30 11 15 45 75 143
Central Asia 7 21 5 6 68 150 206 113
Kazakhstan 7 18 4 6 74 202 274 133
Kyrgyzstan 3 18 3 5 37 69 117 216 120
Tajikistan 15 33 9 10 80 116 127
Turkmenistan 12 22 6 4 99 139 145 98
Uzbekistan 4 20 5 5 59 145 198 99
East Asia 9 19 5 4 43 67 174
Brunei Darussalam 85 72 174
Cambodia 29 40 9 9 161 16 28 104
China 5 14 3 3 80 46 65 200
Indonesia 20 40 15 25 69 102
Korea DPR 18 45 9 37 39 156
Korea Republic of 1 3 1 47 65 69 77 218
Lao PDR 32 48 7 11 135 145 17 41 121
Malaysia 17 21 15 11 96 104 179 158
Mongolia 5 28 3 5 49 39 119 207 111
Myanmar 30 41 11 20 61 124
Philippines 21 32 7 21 123 142 45 83 99
Singapore 3 4 4 8 92 146 66 62
Thailand 7 16 5 192 49 118 117
Viet Nam 20 1 10 5 265 12 20 130
South Asia 40 46 18 27 329 21 42 106
Afghanistan 33 59 9 15 33
Bangladesh 41 43 18 297 10 13 81
Bhutan 12 38 5 9 47 66
India 44 48 20 28 329 356 13 25 108
Iran (Islamic Rep) 10 20 6 7 57 54 136 295 135
Maldives 18 20 10 65 261 177
Nepal 39 49 13 21 244 14 16 152
Pakistan 31 42 14 32 312 316 35 84 89
Sri Lanka 22 19 12 17 162 26 73 118
West Asia 10 23 6 224 356 144
Armenia 4 18 5 7 52 144 302 118
Azerbaijan 8 27 7 10 48 158 321 120
Bahrain 8 14 7 289 382
Cyprus 43 69 248 219 188
Georgia 2 15 3 5 159 257 105
Iraq 7 28 6 15 223 362
Jordan 2 8 2 13 30 39 273 417 112
Kuwait 2 4 2 7 25 07 372 524 172
Lebanon 4 17 7 264 297 161
Occupied PalestinianTerritory
2 12 2 102
Saudi Arabia 5 9 12 70 49 295 435 159
Syrian Arab Republic 10 28 12 9 238 390 133
Turkey 4 16 1 11 35 16 228 356 158
United Arab Emirates 302 430 196
Yemen 43 58 15 252 105 227 103
LATIN AMERICA amp THECARIBBEAN
4 14 2 8 30 190 279 140
Argentina 2 8 1 7 34 274 310 122
Bahamas 11 267 426 174
Barbados 5 10 4 14 32 33 216 442 192
Belize 5 22 2 14 244 454 167
Bolivia (Plur State) 5 27 1 6 20 100 271 102
Brazil 2 7 2 8 40 35 165 221 137
Chile 1 2 0 08 11 245 336 138
Colombia 3 13 1 6 39 119 237 112
Costa Rica 1 6 1 7 209 283 140
140
TABLE 18 Health effects of malnutrition (continued)Share of children under 5 share of
lowweightnewborns
Share of adults Dietaryironsupply
underweightstunted wasted total with
low BMIwomenwith lowBMI
overweight or obese per person
male female mg day
2009 2009 2009 2009 2009 2009 2009 2009 2005-07
Cuba 5 73 62 133 275 186
Dominica 10 101 391 177
Dominican Republic 3 10 2 11 144 293 100
Ecuador 6 29 2 10 19 157 282 81
El Salvador 7 21 2 29 202 329 157
French Guiana
Grenada 9 149 321 137
Guatemala 13 48 1 20 138 267 131
Guyana 11 18 8 83 271 127
Haiti 19 30 10 155 84 84 99
Honduras 9 30 1 10 40 129 263 140
Jamaica 3 5 5 100 382 150
Mexico 4 15 2 8 14 267 384 178
Netherlands Antilles 128
Nicaragua 6 23 2 37 168 313 136
Panama 6 22 1 10 36 194 321 117
Paraguay 3 18 1 162 223 139
Peru 5 28 1 19 111 217 158
St Kitts amp Nevis 11 320 494 153
St Lucia 12 15 8 11 119 319 158
St Vincent amp Grenadines 8 164 335 130
Suriname 8 11 5 11 165 346 98
Trinidad amp Tobago 4 5 5 19 216 380 134
Uruguay 6 14 3 8 207 260 113
Venezuela (Boliv Rep of) 4 16 5 8 266 348 114
OCEANIA 17 42 4 11 158 265
Fiji 10 61 56 213 422 179
French Polynesia 195
New Caledonia 183
Papua New Guinea 18 44 4 11 118 201
Samoa 2 4 1 453 667 175
Solomon Islands 16 34 7 13 19 253 392 137
Tonga 3 491 703
Vanuatu 12 26 6 10 19 29 229 368 167
DEVELOPED REGIONS 216 230 149
NORTH AMERICA 1 4 1 296 323 142
Bermuda 148
Canada 26 246 239 165
United States of America 1 4 1 24 302 332 139
ASIA amp OCEANIA 3 8 1 94 96 82 191
Australia 7 10 28 252 249 149
Israel 8 232 276 197
Japan 3 8 1 115 108 55 35 199
New Zealand 6 13 16 262 277 152
EUROPE 205 219 144
Albania 6 23 9 217 205 128
Belarus 1 5 2 4 197 264 148
Bosnia amp Herzegovina 2 12 4 5 227 253 202
Croatia 0 1 2 5 02 228 194 116
European Union 215 196 148
Iceland 4 23 30 234 203 208
Macedonia FYR 2 12 3 6 216 189 130
Montenegro 2 8 4 228 207
Norway 5 50 70 216 179 158
Republic of Moldova 3 11 5 6 59 100 288 142
Russian Federation 6 184 298 134
Serbia 2 8 5 6 255 203
Switzerland 35 59 183 116 126
Ukraine 4 23 8 4 54 155 236 127
141
TABLE 19 Trade and food security - caloric self-sufficiencyCaloric self-sufficiency
pa
1970 1980 1990 2000 2009 growth1970-2009
WORLD 1002 1002 1002 1002 1006 00
DEVELOPING REGIONS 997 968 983 964 948 minus04
AFRICA 1021 883 866 821 822 minus06
North Africa 901 638 660 668 761 minus13
Algeria 860
Egypt 930 602 605 668 827 minus03
Libya
Morocco 939 721 813 643 minus10
Tunisia 703 669 612 608 minus04
Sub-Saharan Africa 1044 957 962 920 873 minus06
Angola 1137 697 652 731 779 minus10
Benin 1107 1022 898 992 909 minus05
Botswana
Burkina Faso 1004 967 941 911 922 minus02
Burundi 985 968 981 971 891 minus03
Cameroon 1037 997 977 926 888 minus04
Cape Verde
Central African Republic 964 981 937 951 924 minus01
Chad 968 984 952 970 930 minus01
Comoros 901 825 701 783 692 minus07
Congo 1272 799 880 607 908 minus09
Cocircte drsquoIvoire 1044 1074 1205 1203 1092 01
Congo Dem Rep 1025 962 961 953 879 minus04
Djibouti
Equatorial Guinea 1483 1049 879 835 694 minus19
Eritrea 678
Ethiopia 899 908
Gabon 851 802 763 630 588 minus09
Gambia 1462 1241 703 638 535 minus25
Ghana 1041 990 977 986 939 minus03
Guinea 977 914 863 879 879 minus03
Guinea-Bissau 1055 950 881 871 1048 minus00
Kenya 1004 901 899 742 610 minus13
Lesotho 712 535 536
Liberia 878 823 855 654 707 minus06
Madagascar 1047 975 981 900 918 minus03
Malawi 970 1077 944 994 989 00
Mali 971 970 969 939 940 minus01
Mauritania 682
Mauritius 1057 815
Mozambique 1148 928 811 866 824 minus08
Namibia 691 650 555 564 minus05
Niger 1199 991 941 882 945 minus06
Nigeria 1049 871 982 940 900 minus04
Rwanda 982 977 951 927 890 minus03
Senegal 1095 839 866 817 686 minus12
Seychelles 1055 547
Sierra Leone 946 888 840 751 898 minus01
Somalia 921 765 851 693 524 minus14
Sudan 998 1027 935 923 795 minus06
South Africa 1173 1325 1107 980 940 minus06
Swaziland 2814 1201 minus22
Tanzania Utd Rep 1027 947 1001 902 914 minus03
Togo 1066 966 910 940 840 minus06
Uganda 1010 979 999 965 933 minus02
Zambia 797 711 901 976 1005 06
Zimbabwe 1242 1039 1307 1094 538 minus21
142
TABLE 19 Trade and food security - caloric self-sufficiency (continued)Caloric self-sufficiency
pa
1970 1980 1990 2000 2009 growth1970-2009
ASIA 980 970 987 969 943 03
Central Asia 1138 1002
Kazakhstan 1628 1235
Kyrgyzstan 918 808
Tajikistan 625 574
Turkmenistan 939 895
Uzbekistan 833 841
East Asia 995 982 1017 997 970 minus01
Brunei Darussalam
Cambodia 1075 883 990 939 951 minus03
China 982 953 963 970 895 minus02
Indonesia 1002 964 1036 1039 1247 06
Korea DPR 920 943 906 635 903 minus00
Korea Republic of 755 533
Lao PDR 904 982 987 976 1027 03
Malaysia 925 1336 1540 1340 1455 12
Mongolia 791 845 929 586 627 minus06
Myanmar 1094 1054 1009 1019 1003 minus02
Philippines 1245 1204 1012 922 893 minus08
Singapore
Thailand 1296 1552 1784 1390 1421 02
Viet Nam 797 932 1094 1074 961 05
South Asia 969 955 957 934 906 minus02
Afghanistan 968 984 881 680 812 minus04
Bangladesh 901 894 906 848 800 minus03
Bhutan 834 936 776 707 952 03
India 979 983 1000 986 957 minus01
Iran (Islamic Rep) 958 714 690 606 650 minus10
Maldives
Nepal 1092 991 982 943 920 minus04
Pakistan 991 982 900 926 909 minus02
Sri Lanka 717 792 778 682 721 00
West Asia 868 890 824 876 832
Armenia 539
Azerbaijan 693 734
Bahrain
Cyprus 631
Georgia
Iraq 858
Jordan
Kuwait
Lebanon
Occupied PalestinianTerritory
Saudi Arabia 692
Syrian Arab Republic 724 841 657 679 560 minus07
Turkey 966 1018 921 955 933 minus01
United Arab Emirates
Yemen 709 543
LATIN AMERICA amp THECARIBBEAN
1078 1040 1049 1026 1125 minus06
Argentina 1708 1895 2095 2454 2736 12
Bahamas
Barbados 1754 597 514
Belize 2460 1539
Bolivia (Plur State) 827 870 1024 1201 1421 14
Brazil 1058 1071 1123 1124 1406 07
Chile 843 677 964 680 697 minus05
Colombia 982 925 965 839 783 minus06
Costa Rica 1170 1086 1007 949 910 minus06
143
TABLE 19 Trade and food security - caloric self-sufficiency (continued)Caloric self-sufficiency
pa
1970 1980 1990 2000 2009 growth1970-2009
Cuba 2382 2213 1486 594
Dominica 941 555 527 517 minus15
Dominican Republic 2375 1259 815 508 538 minus37
Ecuador 1080 982 989 1015 1008 minus02
El Salvador 974 880 804 664 701 minus08
French Guiana
Grenada 776 653 501
Guatemala 1000 1099 1054 1267 1199 05
Guyana 2957 2046 1337 2674 1695 minus14
Haiti 958 818 652 528 510 minus16
Honduras 1124 1096 1010 868 880 minus06
Jamaica 1124 559 565
Mexico 997 771 744 669 696 minus09
Netherlands Antilles
Nicaragua 1195 867 913 937 951 minus06
Panama 1103 1105 922 637 544 minus18
Paraguay 1035 1132 1580 1663
Peru 952 636 668 684 661 minus09
St Kitts amp Nevis 1537 1019 524
St Lucia 1012 892 919
St Vincent amp Grenadines 827 517 826
Suriname 834 1163 886 793 792 minus01
Trinidad amp Tobago 1058
Uruguay 1106 1210 1663 1350 2324 19
Venezuela (Boliv Rep of) 724 616 584 619 minus04
OCEANIA 1177 1169 1342 1388 1369 minus04
Fiji 2610 1943 1322
French Polynesia 915 860 600
New Caledonia
Papua New Guinea 1162 1127 1192 1354 1431 05
Samoa 1172 1340 931 836 729 minus12
Solomon Islands 1331 1745 1903 1340 1222 minus02
Tonga 1216 1160 810 793 759 minus12
Vanuatu 1555 1329 1392 1323 1078 minus09
DEVELOPED REGIONS 1064 1190 1181 1122 1140 18
NORTH AMERICA 1260 1612 1353 1321 1290 01
Bermuda
Canada 1585 1717 1538 1607 1832 04
United States of America 1226 1599 1328 1286 1238 00
ASIA amp OCEANIA 2321 1787 2667 2720 2040 minus02
Australia 2416 2907 2931 2075 minus04
Israel
Japan
New Zealand 1833 1787 1443 1646 1859 00
EUROPE 913 873 935 967 1012 03
Albania 875 973 792 601 615 minus09
Belarus 775 1036
Bosnia amp Herzegovina 548 625
Croatia 1016 1086
European Union 851 877 982 987 925 02
Iceland
Macedonia FYR 727 681
Montenegro
Norway 588 621 714 643 501 minus04
Republic of Moldova 1074 1333
Russian Federation 884 1131
Serbia 1262
Switzerland 551 716 662 627
Ukraine 1081 1933
144
TABLE 20 Trade and food security - import billsFood import bills Food + energy import bills share of GDP
total per capita
millionUS$
millionUS$
pa US$ US$ pa pa
2000 2010 growth2000-2010
2000 2010 growth2000-2010
2000 2010 growth2000-2010
WORLD 3980557 10296380 100 651 1495 87 33 58 58
DEVELOPING REGIONS 1162631 3731805 124 236 660 108 44 73 52
AFRICA 179991 597794 128 222 585 102 57 82 38
North Africa 87973 250019 110 620 1507 93 53 86 50
Algeria 25413 78633 120 832 2217 103 49 60 20
Egypt 32784 97155 115 485 1198 95 44 89 74
Libya 7941 15315 68 1518 2410 47 28 42 41
Morocco 15154 40877 104 526 1279 93 96 142 40
Tunisia 6546 18039 107 692 1721 95 72 96 29
Sub-Saharan Africa 92018 347775 142 138 406 114 60 80 30
Angola 6384 22925 136 458 1201 101 92 33 minus97
Benin 1120 6475 192 172 732 156 92 166 61
Botswana 2561 5778 85 1457 2879 70 63 120 66
Burkina Faso 931 2586 107 76 157 76 89 79 minus12
Burundi 270 1011 141 42 121 110 69 109 47
Cameroon 2542 11843 166 162 604 141 60 89 41
Cape Verde 593 1768 115 1357 3566 101 137 166 20
Central African Republic 242 719 115 65 163 96 32 62 70
Chad 415 2940 216 51 262 179 37 67 61
Comoros 119 605 177 211 823 146 80 128 48
Congo 995 7212 219 317 1784 188 34 83 94
Cocircte drsquoIvoire 3884 15493 148 234 785 129 117 150 25
Congo Dem Rep 2055 7116 132 41 108 101 68 84 21
Djibouti 374 1080 112 511 1215 90 73 118 49
Equatorial Guinea 332 2025 198 639 2893 163 65 189 112
Eritrea 1741 2244 26 475 427 minus10 257 143 minus57
Ethiopia 818 10336 289 12 125 259 41 88 79
Gabon 1380 4160 117 1117 2764 95 33 47 38
Gambia 613 958 46 473 555 16 138 147 07
Ghana 3348 16092 170 175 660 142 133 118 minus12
Guinea 1047 2455 89 125 246 70 72 122 55
Guinea-Bissau 97 670 213 78 442 189 35 125 135
Kenya 3846 14908 145 123 368 116 83 140 53
Lesotho 1226 2628 79 624 1210 68 343 155 minus77
Liberia 86 144 52 30 36 17 49 58 17
Madagascar 1207 3988 127 79 193 94 87 92 06
Malawi 518 1664 124 46 112 92 60 82 33
Mali 1144 4073 135 101 265 101 114 106 minus07
Mauritania 1071 5483 177 405 1585 146 141 272 68
Mauritius 2822 8861 121 2360 6821 112 111 181 50
Mozambique 1931 5066 101 106 217 74 75 112 40
Namibia 2126 3940 64 1121 1726 44 64 63 minus01
Niger 558 4720 238 51 304 195 80 170 78
Nigeria 14703 57626 146 119 364 118 41 47 12
Rwanda 425 2459 192 52 231 160 40 60 41
Senegal 3349 10256 118 352 825 89 146 192 28
Seychelles 304 1867 199 3850 21458 187 170 521 118
Sierra Leone 413 1694 152 100 289 112 131 264 73
Somalia 1411 6048 157 191 648 130
Sudan 3594 14751 152 105 339 124 37 29 minus25
South Africa 11075 40750 139 247 813 126 37 70 65
Swaziland 1792 4013 84 1684 3384 72 207 140 minus38
Tanzania Utd Rep 2208 7585 131 65 169 101 54 142 101
Togo 714 2051 111 149 340 86 131 208 48
Uganda 1766 5306 116 73 159 81 66 80 20
Zambia 694 2334 129 68 178 101 55 66 20
Zimbabwe 759 7845 263 61 624 263 226
145
TABLE 20 Trade and food security - import bills (continued)Food import bills Food + energy import bills share of GDP
total per capita
millionUS$
millionUS$
pa US$ US$ pa pa
2000 2010 growth2000-2010
2000 2010 growth2000-2010
2000 2010 growth2000-2010
ASIA 714793 2459868 132 199 611 118 51 82 50
Central Asia 9547 39240 152 172 646 141 54 56 04
Kazakhstan 3726 17041 164 249 1063 156 50 38 minus27
Kyrgyzstan 635 4573 218 128 857 209 140 280 71
Tajikistan 652 4582 215 106 666 202 309 204 minus41
Turkmenistan 1803 4291 91 400 851 78 40
Uzbekistan 2732 8754 124 110 319 112 37 51 32
East Asia 409084 1480333 137 216 725 129 57 88 44
Brunei Darussalam 1727 4502 101 5282 11283 79 29 46 47
Cambodia 938 5678 197 75 402 182 117 167 37
China 207426 837460 150 160 610 143 35 61 57
Indonesia 53 73 33
Korea DPR 2315 2171 minus06 101 89 minus12
Korea Republic of 71923 215999 116 1564 4483 111 85 156 63
Lao PDR 481 1632 130 91 263 113 67 92 32
Malaysia 33406 120525 137 1427 4244 115 78 147 66
Mongolia 778 3684 168 323 1337 153 179 207 15
Myanmar 2184 4950 85 49 103 78 65 40 minus48
Philippines 24056 58852 94 311 631 73 86 90 05
Singapore 32231 80440 96 8224 15816 68 206 448 81
Thailand 24502 82275 129 388 1190 119 81 151 64
Viet Nam 7115 60078 238 90 684 224 91 159 58
South Asia 95776 322413 129 66 189 112 34 83 94
Afghanistan 4174 6659 48 183 212 15 96
Bangladesh 11087 53509 170 86 360 154 37 76 74
Bhutan 220 1100 175 385 1515 147 85 159 65
India 31571 124317 147 30 102 130 26 93 136
Iran (Islamic Rep) 22803 62356 106 349 843 92 28 35 23
Maldives 774 1624 77 2834 5138 61 155 208 30
Nepal 1752 5754 126 72 192 103 72 107 41
Pakistan 15200 48709 124 105 281 103 69 100 38
Sri Lanka 8195 18386 84 437 881 73 83 93 11
West Asia 200387 617881 119 1130 2765 94 44 60 33
Armenia 1753 5934 130 570 1919 129 161 132 minus20
Azerbaijan 1996 9581 170 246 1043 155 49 24 minus68
Bahrain 7491 12547 53 11742 9942 minus16 104 73 minus35
Cyprus 3369 9773 112 3572 8852 95 89 115 26
Georgia 1434 8223 191 302 1889 201 92 157 55
Iraq 33338 83450 96 1397 2635 65 153
Jordan 8045 23347 112 1667 3774 85 118 227 68
Kuwait 9231 34226 140 4756 12505 102 26 32 24
Lebanon 9576 27103 110 2559 6410 96 115 159 33
Occupied PalestinianTerritory
4541 6448 36 1420 1596 12
Saudi Arabia 49863 148133 115 2488 5397 81 27 40 41
Syrian Arab Republic 6831 24656 137 427 1208 110 43 110 99
Turkey 17633 69629 147 277 957 132 35 55 46
United Arab Emirates 31295 98922 122 10318 13168 25 36 50 32
Yemen 7901 29831 142 446 1240 108 110 191 57
LATIN AMERICA amp THECARIBBEAN
258747 650107 97 496 1102 83 27 43 47
Argentina 11905 20384 55 322 504 46 07 14 66
Bahamas 2826 4630 51 9483 13498 36 89 147 51
Barbados 1080 3170 114 4028 11610 112 75 129 55
Belize 591 850 37 2353 2724 15 182 155 minus16
Bolivia (Plur State) 2394 3798 47 288 383 29 39 59 42
Brazil 35101 78639 84 201 403 72 18 24 25
Chile 11818 44242 141 766 2585 129 56 113 73
Colombia 13256 38065 111 333 822 94 16 25 49
Costa Rica 4059 11415 109 1036 2450 90 59 96 51
146
TABLE 20 Trade and food security - import bills (continued)Food import bills Food + energy import bills share of GDP
total per capita
millionUS$
millionUS$
pa US$ US$ pa pa
2000 2010 growth2000-2010
2000 2010 growth2000-2010
2000 2010 growth2000-2010
Cuba 7509 18935 97 676 1682 95
Dominica 273 460 54 3896 6759 57 153 222 38
Dominican Republic 7653 18710 94 891 1885 78 97 108 11
Ecuador 2997 17957 196 243 1241 177 36 83 89
El Salvador 6871 13533 70 1157 2185 66 98 128 27
French Guiana
Grenada 391 570 38 3836 5481 36 140 161 14
Guatemala 5612 17487 120 499 1215 93 69 113 51
Guyana 1074 1680 46 1466 2229 43 186 253 31
Haiti 3301 14633 161 382 1464 144 100 246 94
Honduras 5388 11595 80 866 1526 58 127 188 40
Jamaica 4677 7485 48 1811 2731 42 117 209 60
Mexico 82457 186109 85 825 1641 71 20 48 91
Netherlands Antilles 1124 1466 27 6243 7292 16
Nicaragua 2562 7105 107 505 1228 93 141 278 70
Panama 3690 9770 102 1248 2778 83 86 51 minus51
Paraguay 1585 4199 102 297 651 82 72 114 46
Peru 8304 29975 137 321 1031 124 37 57 44
St Kitts amp Nevis 314 487 45 6828 9373 32 141 131 minus07
St Lucia 571 274 minus71 3639 1572 minus80 184 492 103
St Vincent amp Grenadines 398 708 59 3683 6494 58 163 271 52
Suriname 582 2033 133 1247 3873 120 99 107 08
Trinidad amp Tobago 2561 7088 107 1983 5286 103 162 130 minus22
Uruguay 3455 8785 98 1041 2608 96 38 102 103
Venezuela (Boliv Rep of) 17548 60738 132 721 2096 113 20 22 13
OCEANIA 9099 24035 102 1122 2414 80 336 346 03
Fiji 1023 2604 98 1259 3025 92 90 257 111
French Polynesia 1886 3682 69 7924 13585 55
New Caledonia 1242 3050 94 5859 12151 76
Papua New Guinea 1789 6057 130 333 883 103 116 141 20
Samoa 250 722 112 1411 3948 108 178 227 25
Solomon Islands 101 862 240 246 1602 206 87 271 120
Tonga 131 490 141 1341 4710 134 126 282 84
Vanuatu 124 507 151 672 2111 121 75 169 85
DEVELOPED REGIONS 2817926 6564575 88 2361 5288 84 30 51 56
NORTH AMERICA 523687 1042686 71 1672 3026 61 19 33 55
Bermuda 313 1349 157 4964 20751 154
Canada 107827 241046 84 3516 7086 73 32 47 40
United States of America 414893 798725 68 1469 2573 58 18 31 56
ASIA amp OCEANIA 41 3163 4565 37 26 48 63
Australia 25799 82915 124 1346 3724 107 20 35 56
Israel 17637 46462 102 2932 6263 79 43 34 minus22
Japan 436892 575640 28 3475 4549 27 26 51 70
New Zealand 9144 28151 119 2370 6445 105 44 63 35
EUROPE 1804766 4788721 103 2488 6500 101 44 68 44
Albania 1978 6375 124 644 1990 119 81 105 26
Belarus 9010 24432 105 896 2546 110 335 294 minus13
Bosnia amp Herzegovina 6704 14597 81 1815 3882 79 166 157 minus05
Croatia 5845 19002 125 1297 4316 128 81 90 10
European Union 1630103 4127225 97 3385 8245 93 44 70 47
Iceland 2054 3803 64 7310 11886 50 51 74 37
Macedonia FYR 2299 6631 112 1144 3217 109 145 156 08
Montenegro 4438 7033 173
Norway 19698 53402 105 4386 10936 96 19 27 38
Republic of Moldova 518 4516 242 126 1264 259 189 181 minus04
Russian Federation 83028 391496 168 566 2739 171 40 36 minus11
Serbia 8668 879 92
Switzerland 34857 82665 90 4863 10786 83 29 43 41
Ukraine 6999 48454 213 143 1066 222 214 208 minus03
147
TABLE 21 Dimensions of povertyPoverty gap at Poverty headcount ratio Multi-
dimensional
$125 aday (ppp)
$2 a day(ppp)
nationalpovertyline
ruralpovertyline
$125 aday (ppp)
$2 a day(ppp)
nationalpovertyline
ruralpovertyline
poverty(MPI)
0 to 1
2009 2009 2009 2009 2009 2009 2009 2009 2009
WORLD
DEVELOPING REGIONS
AFRICA
North Africa
Algeria 14 65 32 45 68 236 226 303
Egypt 04 35 36 20 185 220 300 00
Libya
Morocco 05 31 25 140 90 145 00
Tunisia 05 30 25 128 38 00
Sub-Saharan Africa
Angola 299 424 543 702 05
Benin 157 335 120 140 473 753 390 460 04
Botswana 110 223 117 184 312 494 306 448
Burkina Faso 203 393 153 176 565 812 464 524 05
Burundi 364 561 234 242 813 935 669 689 05
Cameroon 12 82 123 175 96 304 399 550 03
Cape Verde 60 152 81 143 210 409 266 443
Central African Republic 313 468 331 350 628 801 620 694 05
Chad 256 439 216 233 619 833 550 586 03
Comoros 208 342 163 178 461 650 448 487 04
Congo 228 388 189 206 541 744 501 577 02
Cocircte drsquoIvoire 75 178 153 203 238 463 427 542 04
Congo Dem Rep 253 424 322 349 592 796 713 757 04
Djibouti 53 146 188 412 01
Equatorial Guinea
Eritrea 690
Ethiopia 96 289 83 85 390 776 389 393 06
Gabon 09 50 100 160 48 196 327 446 02
Gambia 121 249 251 305 343 567 580 678 03
Ghana 105 223 96 135 300 536 285 392 01
Guinea 150 310 176 220 433 696 530 630 05
Guinea-Bissau 165 348 250 278 488 779 647 691
Kenya 61 151 163 175 197 399 459 491 02
Lesotho 208 331 379 265 434 623 566 605 02
Liberia 408 595 244 263 837 948 638 677 05
Madagascar 265 469 268 289 678 896 687 735 04
Malawi 323 518 80 86 739 905 524 559 04
Mali 188 365 167 514 771 474 576 06
Mauritania 57 159 170 241 212 441 463 612 04
Mauritius
Mozambique 252 429 212 222 600 816 547 569 05
Namibia 246 365 130 160 491 622 380 490 02
Niger 119 306 196 212 431 759 595 639 06
Nigeria 296 469 228 266 644 839 547 638 03
Rwanda 409 572 240 260 768 896 585 642 04
Senegal 108 247 164 215 335 604 508 619 04
Seychelles 01 03 02 18
Sierra Leone 203 375 275 346 534 761 664 785 04
Somalia 05
Sudan
South Africa 33 123 70 174 357 230 01
Swaziland 294 458 329 370 629 810 692 750 02
Tanzania Utd Rep 281 475 99 110 679 879 334 374 04
Togo 114 279 229 293 387 693 617 743 03
Uganda 83 213 68 76 287 553 245 272 04
Zambia 328 483 285 388 643 815 593 768 03
Zimbabwe 160 720 440 02
148
TABLE 21 Dimensions of poverty (continued)Poverty gap at Poverty headcount ratio Multi-
dimensional
$125 aday (ppp)
$2 a day(ppp)
nationalpovertyline
ruralpovertyline
$125 aday (ppp)
$2 a day(ppp)
nationalpovertyline
ruralpovertyline
poverty(MPI)
0 to 1
2009 2009 2009 2009 2009 2009 2009 2009 2009
ASIA
Central Asia
Kazakhstan 01 03 31 45 02 15 154 217 00
Kyrgyzstan 01 55 100 120 19 294 431 508 00
Tajikistan 51 168 124 124 215 509 472 492 01
Turkmenistan 70 184 248 497
Uzbekistan 150 332 463 767 00
East Asia
Brunei Darussalam
Cambodia 61 202 72 83 283 565 301 345 03
China 40 122 159 363 28 25
Indonesia 36 155 25 31 187 506 142 174 01
Korea DPR
Korea Republic of
Lao PDR 89 248 339 660 276 317 03
Malaysia 00 02 08 18 00 23 38 82
Mongolia 62 172 101 134 224 491 352 466 01
Myanmar 02
Philippines 55 164 27 152 226 450 265 507 01
Singapore
Thailand 19 83 30 108 265 81 104 00
Viet Nam 23 109 35 46 131 385 145 187 01
South Asia
Afghanistan 79 83 360 375
Bangladesh 131 338 90 98 496 813 400 438 03
Bhutan 70 188 61 81 262 495 232 309 01
India 105 295 416 756 275 283 03
Iran (Islamic Rep) 03 18 14 80
Maldives 01 25 15 122 00
Nepal 197 378 75 85 551 776 309 346 03
Pakistan 43 187 226 603 223 270 03
Sri Lanka 10 74 31 32 70 291 152 157 00
West Asia
Armenia 02 23 49 121 13 124 265 255 00
Azerbaijan 02 15 20 10 78 158 185 00
Bahrain
Cyprus
Georgia 46 118 72 92 147 326 236 297 00
Iraq 06 55 45 90 40 253 229 393 01
Jordan 01 06 26 04 35 133 190 00
Kuwait
Lebanon
Occupied PalestinianTerritory
Saudi Arabia
Syrian Arab Republic 02 33 17 169 00
Turkey 09 26 27 91 181 387 00
United Arab Emirates 00
Yemen 42 148 89 106 175 466 348 401 03
LATIN AMERICA amp THECARIBBEAN
Argentina 04 08 09 24 00
Bahamas
Barbados
Belize 47 97 121 240 335 442 00
Bolivia (Plur State) 58 109 140 247 601 773 01
Brazil 11 32 38 99 214 00
Chile 04 08 08 24 151 129
Colombia 57 119 160 279 455 643 00
Costa Rica 01 11 07 54 217 230
149
TABLE 21 Dimensions of poverty (continued)Poverty gap at Poverty headcount ratio Multi-
dimensional
$125 aday (ppp)
$2 a day(ppp)
nationalpovertyline
ruralpovertyline
$125 aday (ppp)
$2 a day(ppp)
nationalpovertyline
ruralpovertyline
poverty(MPI)
0 to 1
2009 2009 2009 2009 2009 2009 2009 2009 2009
Cuba
Dominica
Dominican Republic 09 39 43 136 505 571 00
Ecuador 16 44 51 134 360 575 00
El Salvador 11 45 51 152 378 465
French Guiana
Grenada
Guatemala 65 129 169 298 510 705 01
Guyana 39 69 77 168 01
Haiti 282 418 549 722 770 880 03
Honduras 119 182 233 354 588 644 02
Jamaica 00 09 02 58 99 251
Mexico 17 32 34 81 474 608 00
Netherlands Antilles
Nicaragua 52 123 158 319 462 679 01
Panama 31 71 95 179 327 598
Paraguay 15 43 51 132 351 498 01
Peru 14 47 59 147 348 603 01
St Kitts amp Nevis
St Lucia 72 155 209 406
St Vincent amp Grenadines
Suriname 59 117 155 272 00
Trinidad amp Tobago 11 39 42 135 00
Uruguay 00 00 00 02 205 222 00
Venezuela (Boliv Rep of) 11 32 35 101 290
OCEANIA
Fiji 101 148 310 433
French Polynesia
New Caledonia
Papua New Guinea 123 255 124 138 358 574 375 413
Samoa
Solomon Islands
Tonga
Vanuatu 01
DEVELOPED REGIONS
NORTH AMERICA
Bermuda
Canada
United States of America
ASIA amp OCEANIA
Australia
Israel
Japan
New Zealand
EUROPE
Albania 02 08 23 26 06 42 124 146 00
Belarus 00 00 00 00 54
Bosnia amp Herzegovina 00 01 46 49 00 02 140 178 00
Croatia 00 00 26 00 00 111 00
European Union
Iceland
Macedonia FYR 00 07 72 77 03 43 190 213 00
Montenegro 00 00 09 14 00 00 49 89 00
Norway
Republic of Moldova 03 26 19 125 290 00
Russian Federation 00 00 27 55 00 01 111 212 00
Serbia 01 02 13 20 01 07 66 98 00
Switzerland
Ukraine 00 01 15 23 01 05 79 113 00
150
TABLE 22 Dimensions of inequalityHuman Development Index Gender
inequalityIndex
Gini-index Income share held by
inequalityadjusted
incomedistribution
highest20
lowest20
index index index index
2010 2010 2008 2009 2009 2009
WORLD
DEVELOPING REGIONS
AFRICA
North Africa
Algeria 07 06 353
Egypt 06 04 07 321 415 90
Libya 07 05
Morocco 06 04 07 409 479 65
Tunisia 07 05 05 408 473 60
Sub-Saharan Africa
Angola 04 02 586 619 20
Benin 04 03 07 386 461 70
Botswana 06 06 610
Burkina Faso 03 02 396 471 70
Burundi 03 02 06 333 428 90
Cameroon 05 03 07 446 462 67
Cape Verde 05 504 559 45
Central African Republic 03 02 08 436 606 34
Chad 03 02 398 466 63
Comoros 04 02 643 680 25
Congo 05 03 07 473 531 50
Cocircte drsquoIvoire 04 03 07 415 476 56
Congo Dem Rep 02 02 08
Djibouti 04 03 399 465 60
Equatorial Guinea 05
Eritrea
Ethiopia 03 02 298 394 93
Gabon 06 05 06 415 482 62
Gambia 04 02 07 473 528 48
Ghana 05 03 07 428 485 52
Guinea 03 02 394 462 63
Guinea-Bissau 03 02 355 432 73
Kenya 05 03 07 477 532 48
Lesotho 04 03 07 525 564 30
Liberia 03 02 08 382 450 64
Madagascar 04 03 472 535 62
Malawi 04 03 07 390 465 70
Mali 03 02 08 390 460 65
Mauritania 04 03 07 390 457 62
Mauritius 07
Mozambique 03 02 07 456 515 52
Namibia 06 03 06 743
Niger 03 02 08 340 428 83
Nigeria 04 02 429 486 51
Rwanda 04 02 06 531 582 42
Senegal 04 03 07 392 459 62
Seychelles 658 696 37
Sierra Leone 03 02 08 425 493 61
Somalia
Sudan 04 07
South Africa 06 04 06 578 722 25
Swaziland 05 03 07 507 559 45
Tanzania Utd Rep 04 03 376 448 68
Togo 04 03 07 344 424 76
Uganda 04 03 07 443 493 61
Zambia 04 03 07 507 552 36
Zimbabwe 01 01 07 501
151
TABLE 22 Dimensions of inequality (continued)Human Development Index Gender
inequalityIndex
Gini-index Income share held by
inequalityadjusted
incomedistribution
highest20
lowest20
index index index index
2010 2010 2008 2009 2009 2009
ASIA
Central Asia
Kazakhstan 07 06 05 309 399 87
Kyrgyzstan 06 05 05 334 428 88
Tajikistan 06 05 05 336 417 78
Turkmenistan 07 05 408
Uzbekistan 06 05 367 442 71
East Asia
Brunei Darussalam 08
Cambodia 05 04 06 444 517 66
China 05 04 415 478 57
Indonesia 06 05 07 368 455 74
Korea DPR
Korea Republic of 09 07 03 316
Lao PDR 05 04 06 367 448 76
Malaysia 07 04 462 448 65
Mongolia 06 05 05 365 405 72
Myanmar 04
Philippines 06 05 06 440 504 56
Singapore 08 02 425
Thailand 06 05 05 536 493 62
Viet Nam 06 05 05 376 454 73
South Asia
Afghanistan 03 08 294 387 90
Bangladesh 05 03 07 310 408 94
Bhutan 467 530 54
India 05 04 07 368 453 81
Iran (Islamic Rep) 07 06 383 452 64
Maldives 06 05 05 374 442 65
Nepal 04 03 07 473 540 59
Pakistan 05 03 07 327 421 90
Sri Lanka 07 05 06 403 478 69
West Asia
Armenia 07 06 05 309 398 88
Azerbaijan 07 06 05 337 421 80
Bahrain 08 05
Cyprus 08 07 03
Georgia 07 06 06 413 471 53
Iraq 07 399 87
Jordan 07 06 06 377 455 73
Kuwait 08 05
Lebanon
Occupied PalestinianTerritory
Saudi Arabia 07 08
Syrian Arab Republic 06 05 06 358 439 77
Turkey 07 05 06 397 489 52
United Arab Emirates 08 04
Yemen 04 03 08 377
LATIN AMERICA amp THECARIBBEAN
Argentina 08 06 05 458 531 36
Bahamas 08 07
Barbados 08 05
Belize 07 05 06 544
Bolivia (Plur State) 06 04 06 573 610 28
Brazil 07 05 06 539 585 32
Chile 08 06 05 521 572 43
Colombia 07 05 06 585 621 25
Costa Rica 07 06 05 503 523 44
152
TABLE 22 Dimensions of inequality (continued)Human Development Index Gender
inequalityIndex
Gini-index Income share held by
inequalityadjusted
incomedistribution
highest20
lowest20
index index index index
2010 2010 2008 2009 2009 2009
Cuba 05
Dominica
Dominican Republic 07 05 06 484 536 44
Ecuador 07 06 06 490 589 36
El Salvador 07 05 06 469 519 47
French Guiana
Grenada
Guatemala 06 04 07 537 580 35
Guyana 06 05 06 432
Haiti 04 02 07 595 630 25
Honduras 06 04 06 577 607 20
Jamaica 07 06 06 455 516 53
Mexico 07 06 06 517 562 38
Netherlands Antilles
Nicaragua 06 04 06 523 569 38
Panama 08 05 06 523 586 27
Paraguay 06 05 06 520 565 38
Peru 07 05 06 480 543 40
St Kitts amp Nevis
St Lucia 426
St Vincent amp Grenadines
Suriname 06 05 528
Trinidad amp Tobago 07 06 05 403
Uruguay 08 06 05 424 515 46
Venezuela (Boliv Rep of) 07 05 06 435 490 49
OCEANIA
Fiji 07
French Polynesia
New Caledonia
Papua New Guinea 04 08 509
Samoa
Solomon Islands 05
Tonga 07
Vanuatu
DEVELOPED REGIONS
NORTH AMERICA
Bermuda
Canada 09 08 03 326 399 72
United States of America 09 08 05 408 458 54
ASIA amp OCEANIA
Australia 09 09 03 352
Israel 09 08 03 392 449 57
Japan 09 03 249
New Zealand 09 03 362
EUROPE
Albania 07 06 05 345 430 81
Belarus 07 07 272 364 92
Bosnia amp Herzegovina 07 06 362 432 67
Croatia 08 07 04 336 420 81
European Union
Iceland 09 08 03
Macedonia FYR 07 06 442 503 54
Montenegro 07 300 388 85
Norway 09 09 02 258 372 96
Republic of Moldova 06 05 05 380 453 68
Russian Federation 07 06 05 423 489 60
Serbia 07 282
Switzerland 09 08 02 337 413 75
Ukraine 07 07 05 275 371 94
153
TABLE 23 GovernanceVoice ampaccount-ability
Politicalstabilityabsence ofviolence ampterrorism
Govern-ment
effectiveness
Regulatoryquality
Rule oflaw
Control ofcorruption
Averagegovernance
-25 to 25(lowest tohighest)
-25 to 25(lowest tohighest)
-25 to 25(lowest tohighest)
-25 to 25(lowest tohighest)
-25 to 25(lowest tohighest)
-25 to 25(lowest tohighest)
-25 to 25(lowest tohighest)
2010 2010 2010 2010 2010 2010 2010
WORLD
DEVELOPING REGIONS
AFRICA
North Africa
Algeria minus10 minus13 minus06 minus11 minus08 minus05 minus09
Egypt minus12 minus09 minus04 minus02 minus01 minus06 minus06
Libya minus19 minus01 minus12 minus12 minus10 minus13 minus11
Morocco minus08 minus05 minus02 minus01 minus02 minus02 minus03
Tunisia minus13 01 02 minus00 01 minus01 minus02
Sub-Saharan Africa
Angola minus11 minus02 minus11 minus10 minus12 minus13 minus10
Benin 03 03 minus05 minus03 minus07 minus08 minus03
Botswana 04 09 05 05 07 10 07
Burkina Faso minus02 minus01 minus06 minus01 minus02 minus04 minus03
Burundi minus09 minus15 minus11 minus11 minus12 minus11 minus12
Cameroon minus11 minus06 minus09 minus07 minus10 minus10 minus09
Cape Verde 09 08 minus01 minus01 04 08 05
Central African Republic minus11 minus21 minus14 minus11 minus13 minus08 minus13
Chad minus14 minus15 minus15 minus11 minus15 minus13 minus14
Comoros minus04 minus04 minus17 minus15 minus11 minus07 minus10
Congo minus10 minus02 minus12 minus13 minus11 minus11 minus10
Cocircte drsquoIvoire minus11 minus16 minus13 minus09 minus12 minus11 minus12
Congo Dem Rep minus14 minus22 minus17 minus16 minus16 minus14 minus17
Djibouti minus11 03 minus10 minus07 minus07 minus03 minus06
Equatorial Guinea minus19 02 minus17 minus14 minus13 minus15 minus12
Eritrea minus22 minus09 minus14 minus22 minus13 minus05 minus14
Ethiopia minus13 minus17 minus03 minus09 minus08 minus07 minus10
Gabon minus09 02 minus09 minus06 minus05 minus08 minus06
Gambia minus11 01 minus07 minus04 minus05 minus06 minus05
Ghana 05 00 minus00 01 minus01 01 01
Guinea minus09 minus18 minus11 minus11 minus15 minus12 minus13
Guinea-Bissau minus09 minus08 minus10 minus11 minus14 minus11 minus10
Kenya minus02 minus12 minus05 minus01 minus10 minus09 minus07
Lesotho minus02 05 minus04 minus06 minus03 02 minus01
Liberia minus02 minus05 minus12 minus11 minus10 minus05 minus07
Madagascar minus08 minus11 minus08 minus06 minus08 minus03 minus07
Malawi minus02 01 minus04 minus06 minus01 minus04 minus03
Mali 02 minus03 minus09 minus05 minus05 minus07 minus04
Mauritania minus09 minus13 minus09 minus08 minus09 minus07 minus09
Mauritius 07 05 08 08 08 07 07
Mozambique minus01 03 minus05 minus04 minus05 minus04 minus03
Namibia 03 08 01 01 02 03 03
Niger minus06 minus11 minus07 minus05 minus06 minus07 minus07
Nigeria minus08 minus20 minus12 minus08 minus12 minus10 minus12
Rwanda minus13 minus01 minus01 minus02 minus03 05 minus02
Senegal minus03 minus04 minus05 minus03 minus04 minus07 minus04
Seychelles 01 08 02 minus06 00 03 01
Sierra Leone minus02 minus02 minus12 minus07 minus09 minus08 minus07
Somalia minus20 minus31 minus22 minus24 minus24 minus17 minus23
Sudan minus17 minus27 minus14 minus14 minus13 minus13 minus16
South Africa 05 minus00 03 04 01 01 02
Swaziland minus13 minus01 minus05 minus06 minus05 minus02 minus05
Tanzania Utd Rep minus01 minus00 minus05 minus04 minus05 minus05 minus03
Togo minus10 minus02 minus14 minus09 minus09 minus10 minus09
Uganda minus05 minus11 minus06 minus01 minus04 minus09 minus06
Zambia minus03 05 minus08 minus05 minus05 minus06 minus04
Zimbabwe minus15 minus12 minus16 minus20 minus18 minus14 minus16
154
TABLE 23 Governance (continued)Voice ampaccount-ability
Politicalstabilityabsence ofviolence ampterrorism
Govern-ment
effectiveness
Regulatoryquality
Rule oflaw
Control ofcorruption
Averagegovernance
-25 to 25(lowest tohighest)
-25 to 25(lowest tohighest)
-25 to 25(lowest tohighest)
-25 to 25(lowest tohighest)
-25 to 25(lowest tohighest)
-25 to 25(lowest tohighest)
-25 to 25(lowest tohighest)
2010 2010 2010 2010 2010 2010 2010
ASIA
Central Asia
Kazakhstan minus11 05 minus03 minus03 minus06 minus10 minus05
Kyrgyzstan minus10 minus10 minus06 minus02 minus13 minus11 minus09
Tajikistan minus14 minus09 minus09 minus11 minus12 minus12 minus11
Turkmenistan minus20 02 minus16 minus21 minus15 minus14 minus14
Uzbekistan minus20 minus08 minus08 minus16 minus14 minus13 minus13
East Asia
Brunei Darussalam minus07 12 09 11 08 09 07
Cambodia minus09 minus06 minus08 minus05 minus11 minus12 minus08
China minus16 minus08 01 minus02 minus03 minus06 minus06
Indonesia minus01 minus09 minus02 minus04 minus06 minus07 minus05
Korea DPR minus22 minus05 minus19 minus24 minus13 minus13 minus16
Korea Republic of 07 01 12 09 10 04 07
Lao PDR minus16 minus02 minus09 minus10 minus09 minus11 minus10
Malaysia minus05 01 11 06 05 01 03
Mongolia 00 05 minus06 minus03 minus04 minus07 minus03
Myanmar minus21 minus13 minus17 minus22 minus15 minus17 minus17
Philippines minus01 minus16 minus01 minus03 minus05 minus08 minus06
Singapore minus03 11 22 18 17 22 15
Thailand minus06 minus12 01 02 minus02 minus03 minus03
Viet Nam minus14 01 minus03 minus06 minus05 minus06 minus05
South Asia
Afghanistan minus15 minus26 minus15 minus16 minus19 minus16 minus18
Bangladesh minus03 minus14 minus08 minus09 minus08 minus10 minus09
Bhutan minus05 07 06 minus11 01 08 01
India 04 minus13 minus00 minus04 minus01 minus05 minus03
Iran (Islamic Rep) minus16 minus16 minus05 minus16 minus09 minus09 minus12
Maldives minus01 minus00 minus02 minus04 minus03 minus06 minus03
Nepal minus05 minus17 minus08 minus07 minus10 minus07 minus09
Pakistan minus08 minus27 minus08 minus06 minus08 minus11 minus11
Sri Lanka minus05 minus08 minus02 minus02 minus01 minus04 minus04
West Asia
Armenia minus09 00 minus02 03 minus05 minus07 minus03
Azerbaijan minus13 minus03 minus08 minus04 minus09 minus12 minus08
Bahrain minus09 minus03 06 08 04 02 01
Cyprus 11 04 15 14 12 11 11
Georgia minus02 minus07 03 06 minus02 minus02 minus01
Iraq minus11 minus23 minus12 minus11 minus16 minus13 minus14
Jordan minus08 minus03 01 02 02 00 minus01
Kuwait minus05 04 01 02 05 03 02
Lebanon minus03 minus15 minus03 00 minus07 minus08 minus06
Occupied PalestinianTerritory
Saudi Arabia minus18 minus02 minus01 01 02 01 minus03
Syrian Arab Republic minus17 minus08 minus06 minus09 minus05 minus11 minus09
Turkey minus02 minus10 04 04 01 00 minus01
United Arab Emirates minus09 08 08 04 04 10 04
Yemen minus13 minus22 minus10 minus06 minus11 minus11 minus12
LATIN AMERICA amp THECARIBBEAN
Argentina 03 minus00 minus02 minus07 minus06 minus04 minus03
Bahamas 10 10 10 05 07 14 09
Barbados 12 11 14 05 10 14 11
Belize 07 minus00 minus04 minus05 minus04 minus01 minus01
Bolivia (Plur State) minus01 minus04 minus05 minus08 minus11 minus05 minus06
Brazil 05 00 01 02 00 01 01
Chile 10 06 12 14 13 15 12
Colombia minus02 minus15 01 03 minus03 minus04 minus03
Costa Rica 10 06 03 05 05 07 06
155
TABLE 23 Governance (continued)Voice ampaccount-ability
Politicalstabilityabsence ofviolence ampterrorism
Govern-ment
effectiveness
Regulatoryquality
Rule oflaw
Control ofcorruption
Averagegovernance
-25 to 25(lowest tohighest)
-25 to 25(lowest tohighest)
-25 to 25(lowest tohighest)
-25 to 25(lowest tohighest)
-25 to 25(lowest tohighest)
-25 to 25(lowest tohighest)
-25 to 25(lowest tohighest)
2010 2010 2010 2010 2010 2010 2010
Cuba minus16 03 minus02 minus16 minus06 05 minus05
Dominica 10 10 07 04 07 07 08
Dominican Republic 01 00 minus06 minus02 minus08 minus08 minus04
Ecuador minus03 minus06 minus07 minus11 minus12 minus09 minus08
El Salvador 00 01 00 04 minus09 minus02 minus01
French Guiana 11 02 12 12 12 11 10
Grenada 08 06 02 04 01 04 04
Guatemala minus04 minus08 minus07 minus02 minus10 minus05 minus06
Guyana 00 minus05 minus01 minus05 minus05 minus06 minus04
Haiti minus07 minus09 minus16 minus11 minus14 minus13 minus12
Honduras minus05 minus05 minus07 minus02 minus09 minus09 minus06
Jamaica 04 minus04 02 03 minus05 minus04 minus01
Mexico 01 minus08 02 03 minus06 minus04 minus02
Netherlands Antilles 04 11 07 09 09 09 08
Nicaragua minus05 minus06 minus10 minus04 minus08 minus08 minus07
Panama 05 00 01 04 minus01 minus04 01
Paraguay minus01 minus09 minus09 minus04 minus09 minus08 minus07
Peru 00 minus09 minus02 05 minus06 minus02 minus02
St Kitts amp Nevis 11 11 07 04 07 10 09
St Lucia 12 08 08 04 08 12 09
St Vincent amp Grenadines 12 09 07 04 09 10 09
Suriname 04 01 minus01 minus07 minus01 minus04 minus01
Trinidad amp Tobago 05 minus00 03 05 minus02 minus04 01
Uruguay 11 09 07 04 07 13 08
Venezuela (Boliv Rep of) minus09 minus14 minus10 minus16 minus16 minus12 minus13
OCEANIA
Fiji minus10 minus01 minus07 minus07 minus09 minus09 minus07
French Polynesia
New Caledonia minus02
Papua New Guinea 01 minus08 minus08 minus05 minus09 minus11 minus07
Samoa
Solomon Islands 01 04 minus09 minus12 minus07 minus05 minus05
Tonga 03 08 minus03 minus05 01 minus03 minus00
Vanuatu 05 14 minus03 minus08 03 04 02
DEVELOPED REGIONS
NORTH AMERICA
Bermuda 10 09 10 14 12 13 11
Canada 14 09 19 17 18 21 16
United States of America 12 03 14 14 16 12 12
ASIA amp OCEANIA
Australia 14 08 18 17 18 21 16
Israel 06 minus15 12 12 09 06 05
Japan 10 09 14 10 13 15 12
New Zealand 15 12 19 18 19 24 18
EUROPE
Albania 01 minus02 minus03 02 minus04 minus04 minus02
Belarus minus16 minus01 minus11 minus12 minus10 minus08 minus10
Bosnia amp Herzegovina minus01 minus07 minus07 minus01 minus04 minus03 minus04
Croatia 04 06 06 06 02 00 04
European Union
Iceland 14 10 16 09 17 19 14
Macedonia FYR 01 minus05 minus02 03 minus03 minus01 minus01
Montenegro 02 05 01 minus01 minus00 minus03 01
Norway 16 13 18 15 19 21 17
Republic of Moldova minus01 minus04 minus06 minus01 minus04 minus07 minus04
Russian Federation minus09 minus09 minus04 minus04 minus08 minus11 minus07
Serbia 03 minus04 minus01 minus00 minus04 minus02 minus01
Switzerland 16 12 19 17 18 21 17
Ukraine minus01 minus01 minus08 minus06 minus08 minus10 minus06
156
TABLE 24 Education health and sanitationLiteracyratefemale
Ratio of girls-to-boys Expendi-ture perstudent
Public expon
education
Health expenditure Prevalenceof HIV
Access to improved
out ofprimaryschool
in primand seceducation
share ofGDP percapita
share ofGDP
currentper capita
share ofGDP
ages15-49
sanitationfacilities
water source
ratio US$ rur urb
2009 2009 2009 2009 2009 2009 2009 2009 2008 2008 2008
WORLD 792 963 44 8600 101 08 61 78 96
DEVELOPING REGIONS
AFRICA
North Africa
Algeria 639 07 993 285 43 2680 58 01 95 79 85
Egypt 578 05 951 38 1130 50 01 94 98 100
Libya 820 00 1050 239 27 4170 39 97
Morocco 439 08 881 872 56 1560 55 01 69 60 98
Tunisia 710 09 1030 507 71 2400 62 01 85 84 99
Sub-Saharan Africa
Angola 576 08 820 1269 26 2040 46 20 57 38 60
Benin 291 01 735 134 35 319 42 12 12 69 84
Botswana 844 12 1000 3014 89 6120 103 248 60 90 99
Burkina Faso 216 08 856 3663 46 381 64 12 11 72 95
Burundi 609 90 927 6009 83 198 131 33 46 71 83
Cameroon 630 02 856 728 37 611 56 53 47 51 92
Cape Verde 802 09 1030 828 59 1460 39 54 82 85
Central African Republic 421 05 687 1448 13 193 43 47 34 51 92
Chad 231 06 636 2488 32 418 70 34 9 44 67
Comoros 687 06 842 272 76 278 34 01 36 97 91
Congo 09 919 29 18 701 30 34 30 34 95
Cocircte drsquoIvoire 453 08 686 1191 46 553 51 34 23 68 93
Congo Dem Rep 549 768 156 95 23 80
Djibouti 09 820 573 84 845 70 25 56 52 98
Equatorial Guinea 898 10 825 40 06 7090 39 50
Eritrea 560 09 773 11356 20 101 21 08 14 57 74
Ethiopia 180 07 879 6642 55 147 43 12 26 98
Gabon 841 10 959 38 2660 35 52 33 41 95
Gambia 358 11 1020 322 20 256 60 20 67 86 96
Ghana 604 11 954 288 54 451 69 18 13 74 90
Guinea 281 07 772 1164 24 188 57 13 19 61 89
Guinea-Bissau 380 07 655 52 184 61 25 21 51 83
Kenya 835 11 954 436 70 332 43 63 31 52 83
Lesotho 953 12 1070 778 124 700 82 236 29 81 97
Liberia 545 04 719 141 28 294 132 15 17 51 79
Madagascar 616 53 969 1581 30 180 41 02 11 29 71
Malawi 670 18 1000 321 42 191 62 110 56 77 95
Mali 182 05 784 1633 44 384 56 10 36 44 81
Mauritania 503 13 1030 736 29 219 25 07 26 47 52
Mauritius 853 13 1010 245 32 3830 57 10 91 99 100
Mozambique 415 05 883 998 50 247 57 115 17 29 77
Namibia 881 16 1040 315 64 2580 60 131 33 88 99
Niger 151 08 753 5143 45 209 61 08 9 39 96
Nigeria 498 09 851 08 693 58 36 32 42 75
Rwanda 668 18 1000 2521 41 482 90 29 54 62 77
Senegal 387 11 955 2169 58 589 57 09 51 52 92
Seychelles 923 15 1030 340 50 3660 40 100
Sierra Leone 301 06 840 251 43 439 131 16 13 26 86
Somalia 09 535 04 07 23 9 67
Sudan 608 09 894 121 946 73 11 34 52 64
South Africa 870 12 994 328 54 4850 85 178 77 78 99
Swaziland 862 11 921 491 78 1560 63 259 55 61 92
Tanzania Utd Rep 669 15 961 409 68 253 51 56 24 45 80
Togo 444 04 753 130 46 289 59 32 12 41 87
Uganda 589 15 987 1339 32 425 82 65 48 64 91
Zambia 613 14 958 10 13 471 48 135 49 46 87
Zimbabwe 894 971 2143 52 143 44 72 99
157
TABLE 24 Education health and sanitation (continued)Literacyratefemale
Ratio of girls-to-boys Expendi-ture perstudent
Public expon
education
Health expenditure Prevalenceof HIV
Access to improved
out ofprimaryschool
in primand seceducation
share ofGDP percapita
share ofGDP
currentper capita
share ofGDP
ages15-49
sanitationfacilities
water source
ratio US$ rur urb
2009 2009 2009 2009 2009 2009 2009 2009 2008 2008 2008
ASIA
Central Asia
Kazakhstan 996 26 986 79 28 3300 45 01 97 90 99
Kyrgyzstan 990 11 1010 173 59 571 68 03 93 85 99
Tajikistan 996 01 906 218 35 380 53 02 94 61 94
Turkmenistan 994 43 771 23 98 97
Uzbekistan 991 08 987 74 622 52 01 100 81 98
East Asia
Brunei Darussalam 937 18 1010 37 7910 30
Cambodia 709 08 897 54 21 421 59 05 29 56 81
China 909 12 1050 1015 19 1770 46 01 55 82 98
Indonesia 891 04 977 397 28 554 24 02 52 71 89
Korea DPR 1000 100 100
Korea Republic of 00 972 528 42 11100 65 01 100 88 100
Lao PDR 632 09 872 100 23 358 41 02 53 51 72
Malaysia 903 10 1030 604 41 3360 48 05 96 99 100
Mongolia 979 15 1030 162 56 742 47 01 50 49 97
Myanmar 895 08 997 54 13 125 20 06 81 69 75
Philippines 958 14 1020 276 28 669 38 01 76 87 93
Singapore 920 116 30 15000 39 01 100 100
Thailand 915 09 1030 554 41 1680 43 13 96 98 99
Viet Nam 905 04 932 982 53 797 72 04 75 92 99
South Asia
Afghanistan 50 07 623 19 509 74 37 39 78
Bangladesh 510 21 1080 256 24 184 34 01 53 78 85
Bhutan 387 13 1000 387 48 980 55 02 65 88 99
India 508 05 922 777 31 448 42 03 31 84 96
Iran (Islamic Rep) 807 07 965 583 47 2690 55 02 98
Maldives 984 06 982 00 112 3310 80 01 98 86 99
Nepal 469 06 825 731 47 253 58 04 31 87 93
Pakistan 401 07 819 27 226 26 01 45 87 95
Sri Lanka 891 12 1040 30 836 40 01 91 88 98
West Asia
Armenia 994 17 1030 533 30 1290 47 01 90 93 98
Azerbaijan 992 10 1020 156 28 2850 58 01 45 71 88
Bahrain 902 03 1010 326 29 11100 45 100
Cyprus 969 05 1000 1352 41 60 100 100 100
Georgia 997 06 965 410 32 2560 101 01 95 96 100
Iraq 699 04 813 51 985 39 73 55 91
Jordan 889 14 1020 277 49 3360 93 98 91 98
Kuwait 918 08 1010 257 38 14200 33 100 99 99
Lebanon 860 09 1040 102 18 6630 81 01 100 100
Occupied PalestinianTerritory
Saudi Arabia 811 08 913 367 56 7140 50 97
Syrian Arab Republic 780 01 973 338 48 720 29 96 84 94
Turkey 853 07 929 547 31 5710 67 01 90 96 100
United Arab Emirates 915 06 998 270 12 15200 28 97 100 100
Yemen 447 06 657 52 640 56 52 57 72
LATIN AMERICA amp THECARIBBEAN
Argentina 977 22 1050 565 49 7300 95 05 90 80 98
Bahamas 14 1010 33 15600 72 31 100 98
Barbados 603 minus67 10400 68 14 100 100 100
Belize 703 44 1010 395 58 2170 49 23 90 100 99
Bolivia (Plur State) 868 12 988 282 63 848 48 02 25 67 96
Brazil 902 07 1030 650 51 7340 91 80 84 99
Chile 987 09 985 428 40 7870 82 04 96 75 99
Colombia 934 10 1050 580 48 3230 64 05 74 73 99
Costa Rica 963 12 1020 290 63 6680 105 03 95 91 100
158
TABLE 24 Education health and sanitation (continued)Literacyratefemale
Ratio of girls-to-boys Expendi-ture perstudent
Public expon
education
Health expenditure Prevalenceof HIV
Access to improved
out ofprimaryschool
in primand seceducation
share ofGDP percapita
share ofGDP
currentper capita
share ofGDP
ages15-49
sanitationfacilities
water source
ratio US$ rur urb
2009 2009 2009 2009 2009 2009 2009 2009 2008 2008 2008
Cuba 998 08 988 1553 136 7070 118 01 91 89 96
Dominica 15 1020 407 47 3610 64
Dominican Republic 883 11 965 147 23 2710 59 09 83 84 87
Ecuador 815 28 1030 92 10 2550 61 04 92 88 97
El Salvador 818 16 983 176 36 2290 63 08 87 76 94
French Guiana
Grenada 960 22 970 227 48 4470 74 97 97
Guatemala 695 04 938 166 32 1860 71 08 81 90 98
Guyana 06 997 447 61 1330 81 12 81 93 98
Haiti 446 10 946 15 396 61 19 17 55 71
Honduras 835 23 1070 36 1170 60 08 71 77 95
Jamaica 911 09 1000 850 58 2310 51 17 83 89 98
Mexico 921 17 1020 637 48 5150 65 03 85 87 96
Netherlands Antilles 964 1020
Nicaragua 779 12 1020 144 31 1050 96 02 52 68 98
Panama 930 08 1010 390 38 5910 83 09 69 83 97
Paraguay 935 10 995 530 40 1590 71 03 70 66 99
Peru 846 12 994 180 27 2010 46 04 68 61 90
St Kitts amp Nevis 15 1040 79 97 6340 60 96 99 99
St Lucia 10 994 368 45 4430 81 98 98
St Vincent amp Grenadines 01 977 455 66 3010 57
Suriname 938 09 1070 90 4290 76 10 84 81 97
Trinidad amp Tobago 983 05 1010 189 42 10700 57 15 92 93 98
Uruguay 986 08 1040 374 29 6980 75 05 100 100 100
Venezuela (Boliv Rep of) 949 11 1020 173 37 6860 60
OCEANIA
Fiji 10 1030 967 62 1300 34 01
French Polynesia 15 1090 98 100 100
New Caledonia 960
Papua New Guinea 565 08 835 65 367 31 09 45 33 87
Samoa 985 17 1050 120 58 2050 70 100
Solomon Islands 690 10 940 22 719 54
Tonga 991 06 999 1449 39 1610 62 96 100 100
Vanuatu 803 05 995 353 48 1060 40 52 79 96
DEVELOPED REGIONS
NORTH AMERICA
Bermuda 979 157 26
Canada 23 987 440 49 43800 109 02 100 99 100
United States of America 14 1000 682 55 74100 162 06 100 94 100
ASIA amp OCEANIA
Australia 14 973 509 45 38700 85 01 100 100 100
Israel 887 15 1010 611 59 19700 76 02 100 100 100
Japan 11 1000 647 35 33200 83 01 100 100 100
New Zealand 31 1030 675 61 26300 97 01 100 100
EUROPE
Albania 947 09 995 444 29 2650 69 98 98 96
Belarus 997 17 1010 150 45 2950 58 03 93 99 100
Bosnia amp Herzegovina 964 13 1020 4950 109 95 98 100
Croatia 981 12 1020 732 46 11200 78 01 99 97 100
European Union 1010 764 49 33700 103 02 98 100 100
Iceland 13 1020 771 74 31300 82 03 100 100 100
Macedonia FYR 956 13 983 238 35 3140 69 89 99 100
Montenegro 6170 93 92 96 100
Norway 13 990 895 68 76600 97 01 100 100 100
Republic of Moldova 980 10 1010 1286 96 1810 119 04 79 85 96
Russian Federation 994 12 980 142 39 4750 54 10 87 89 98
Serbia 09 1010 1105 48 4190 99 01 92 98 99
Switzerland 57 973 956 52 71400 113 04 100 100 100
Ukraine 996 11 988 251 53 1800 70 11 95 97 98
159
TABLE 25 Food aid receivedFood aid received
thousandtonnes
thousandtonnes
thousandtonnes
thousandtonnes
thousandtonnes
1990 1995 2000 2005 2010
WORLD 13172 10201 11345 8288 5682
DEVELOPING REGIONS 10922 9143 9462 8245 5682
AFRICA 5255 3562 4320 4656 3491
North Africa 2268 263 318 56 27
Algeria 10 27 33 42 24
Egypt 1606 207 41 14 3
Libya 0 0 0 0 0
Morocco 271 2 241 0 0
Tunisia 383 27 4 0 0
Sub-Saharan Africa 2986 3299 4002 4601 3464
Angola 124 220 296 57 4
Benin 15 21 12 15 19
Botswana 15 10 0 0 0
Burkina Faso 34 41 33 39 45
Burundi 3 103 11 73 34
Cameroon 3 7 4 14 14
Cape Verde 59 73 53 29 16
Central African Republic 3 1 3 5 10
Chad 26 21 23 74 111
Comoros 4 6 0 0 0
Congo 8 13 18 9 7
Cocircte drsquoIvoire 66 24 17 34 21
Congo Dem Rep 98 109 74 103 193
Djibouti 9 20 12 21 10
Equatorial Guinea 5 4 2 0 0
Eritrea 0 104 257 232 0
Ethiopia 864 636 1527 1122 1415
Gabon 0 0 1 0 0
Gambia 4 4 8 11 23
Ghana 66 97 101 66 7
Guinea 11 8 5 41 4
Guinea-Bissau 5 3 27 11 7
Kenya 90 80 291 155 258
Lesotho 42 34 6 44 7
Liberia 35 161 116 102 30
Madagascar 54 38 44 47 26
Malawi 219 236 36 153 38
Mali 39 20 12 41 25
Mauritania 45 45 17 92 39
Mauritius 11 1 0 0 0
Mozambique 423 386 185 117 80
Namibia 12 3 2 2 1
Niger 40 25 20 139 159
Nigeria 0 0 1 20 0
Rwanda 9 274 232 42 7
Senegal 63 21 54 30 41
Seychelles 1 0 0 0 0
Sierra Leone 11 34 28 39 24
Somalia 98 53 61 40 72
Sudan 230 82 182 931 476
South Africa 7 0 3 0 0
Swaziland 10 7 0 12 17
Tanzania Utd Rep 35 145 63 116 38
Togo 12 6 4 1 2
Uganda 47 77 87 293 80
Zambia 11 26 49 146 7
Zimbabwe 14 13 16 80 92
160
TABLE 25 Food aid received (continued)Food aid received
thousandtonnes
thousandtonnes
thousandtonnes
thousandtonnes
thousandtonnes
1990 1995 2000 2005 2010
ASIA 3357 4641 4314 2958 1775
Central Asia 0 432 195 239 75
Kazakhstan 0 1 0 0 0
Kyrgyzstan 0 150 60 166 50
Tajikistan 0 226 60 73 25
Turkmenistan 0 53 7 0 0
Uzbekistan 0 1 68 0 0
East Asia 530 952 2239 1663 232
Brunei Darussalam 0 0 0 0 0
Cambodia 25 91 62 24 17
China 78 128 90 49 0
Indonesia 56 19 429 197 0
Korea DPR 0 544 1264 1180 80
Korea Republic of 0 0 0 0 0
Lao PDR 0 27 5 19 20
Malaysia 0 0 0 0 0
Mongolia 0 12 46 55 0
Myanmar 0 4 10 16 31
Philippines 160 55 218 121 82
Singapore 0 0 0 0 0
Thailand 148 2 1 1 0
Viet Nam 62 70 82 0 0
South Asia 2288 1445 937 838 1247
Afghanistan 43 133 210 208 140
Bangladesh 1050 586 269 293 194
Bhutan 5 6 4 2 3
India 382 398 321 102 16
Iran (Islamic Rep) 26 13 3 2 5
Maldives 2 3 3 11 12
Nepal 8 38 53 54 53
Pakistan 462 119 20 30 763
Sri Lanka 310 148 55 136 60
West Asia 539 1812 943 218 222
Armenia 0 476 96 22 7
Azerbaijan 0 391 28 12 0
Bahrain 0 0 0 0 0
Cyprus 0 0 0 0 0
Georgia 0 598 71 20 1
Iraq 0 102 18 36 7
Jordan 261 122 401 3 0
Kuwait 0 0 0 0 0
Lebanon 43 11 42 12 0
Occupied PalestinianTerritory
26 48 57 83 90
Saudi Arabia 0 0 0 0 0
Syrian Arab Republic 38 45 35 10 35
Turkey 14 1 0 0 0
United Arab Emirates 0 0 0 0 0
Yemen 157 18 195 21 83
LATIN AMERICA amp THECARIBBEAN
2306 939 828 632 416
Argentina 0 0 0 0 0
Bahamas 0 0 0 0 0
Barbados 0 0 0 0 0
Belize 0 0 0 0 0
Bolivia (Plur State) 262 86 80 65 8
Brazil 29 1 0 0 0
Chile 8 0 0 0 0
Colombia 5 15 12 14 12
Costa Rica 7 3 0 0 0
161
TABLE 25 Food aid received (continued)Food aid received
thousandtonnes
thousandtonnes
thousandtonnes
thousandtonnes
thousandtonnes
1990 1995 2000 2005 2010
Cuba 3 6 24 7 0
Dominica 0 7 0 0 0
Dominican Republic 40 6 2 0 50
Ecuador 77 19 42 43 3
El Salvador 203 25 3 67 3
French Guiana 0 0 0 0 0
Grenada 0 0 0 0 0
Guatemala 185 70 137 69 70
Guyana 46 33 26 0 0
Haiti 108 168 164 137 266
Honduras 146 53 68 98 3
Jamaica 293 56 46 11 0
Mexico 280 46 2 0 0
Netherlands Antilles 0 0 0 0 0
Nicaragua 232 63 62 43 2
Panama 1 2 0 0 0
Paraguay 4 1 0 0 0
Peru 359 254 149 78 0
St Kitts amp Nevis 0 0 0 0 0
St Lucia 0 3 0 0 0
St Vincent amp Grenadines 0 0 0 0 0
Suriname 0 20 0 0 0
Trinidad amp Tobago 0 0 0 0 0
Uruguay 20 0 0 0 0
Venezuela (Boliv Rep of) 0 0 11 0 0
OCEANIA 3 0 0 0 0
Fiji 0 0 0 0 0
French Polynesia 0 0 0 0 0
New Caledonia 0 0 0 0 0
Papua New Guinea 0 0 0 0 0
Samoa 0 0 0 0 0
Solomon Islands 0 0 0 0 0
Tonga 0 0 0 0 0
Vanuatu 0 0 0 0 0
DEVELOPED REGIONS 2250 1058 1883 43 0
NORTH AMERICA 0 0 0 0 0
Bermuda 0 0 0 0 0
Canada 0 0 0 0 0
United States of America 0 0 0 0 0
ASIA amp OCEANIA 1 0 0 0 0
Australia 0 0 0 0 0
Israel 1 0 0 0 0
Japan 0 0 0 0 0
New Zealand 0 0 0 0 0
EUROPE 2249 1058 1883 43 0
Albania 0 10 18 6 0
Belarus 0 98 0 0 0
Bosnia amp Herzegovina 0 23 84 0 0
Croatia 0 14 0 0 0
European Union 2249 40 1 0 0
Iceland 0 0 0 0 0
Macedonia FYR 0 0 63 0 0
Montenegro 0 0 0 0 0
Norway 0 0 0 0 0
Republic of Moldova 0 244 14 10 0
Russian Federation 0 125 1403 26 0
Serbia 0 0 0 0 0
Switzerland 0 0 0 0 0
Ukraine 0 120 0 0 0
162
DEFINITIONS AND SOURCES
Definitions and sources
Countries in protracted crisesP2HUNFAOESARHSNPC
Page table 31 (p 86)
Protracted crises are those environments in which a sig-nificant proportion of the population is acutely vulnera-ble to death disease and disruption of livelihoods overa prolonged period of time The governance of these en-vironments is usually very weak with the state having alimited capacity to respond to and mitigate the threatsto the population or provide adequate levels of protec-tion
Source Trade and Markets Division
Owner FAO
Contribution in diets by typeP2HUNFAOESSDIETCPF
Page table 16 (p 135)
Dietary contribution refers to the amount of carbohy-dratesproteinsfats expressed in kilocalories (kcal) perday available for each individual in the total populationduring the reference period Caloric content is derived byapplying the appropriate food composition factors to thequantities of the commodities Per person supplies arederived from the total amount of food available for hu-man consumption by dividing total calories by total pop-ulation actually partaking of the food supplies during thereference period However per person figures representonly the average supply available for the population asa whole and do not necessarily indicate what is actuallyconsumed by individuals The actual food consumptionmay be lower than the quantity shown as food availabil-ity depending on the magnitude of wastage and lossesof food in the household eg during storage in prepa-ration and cooking as plate-waste or quantities fed todomestic animals and pets thrown or given away
Source Statistics Division
Owner FAO
Dietary Energy Supply per personP2HUNFAOESSDIETDES
Page table 16 (p 135) chart 37 (p 93) map 20 (p 92)
Dietary energy supply per person refers to the amountof food expressed in kilocalories (kcal) per day avail-able for each individual in the total population duringthe reference period Caloric content is derived by ap-plying the appropriate food composition factors to thequantities of the commodities Per person supplies arederived from the total amount of food available for hu-man consumption by dividing total calories by total pop-ulation actually partaking of the food supplies during thereference period However per person figures representonly the average supply available for the population asa whole and do not necessarily indicate what is actuallyconsumed by individuals The actual food consumptionmay be lower than the quantity shown as food availabil-ity depending on the magnitude of wastage and losses
of food in the household eg during storage in prepa-ration and cooking as plate-waste or quantities fed todomestic animals and pets thrown or given awaySource Statistics DivisionOwner FAO
Caloric contribution in diets by commodityP2HUNFAOESSDIETFDS
Page table 40 41 (p 95 95)Contribution of a food Group to total dietary energy sup-plySource Statistics DivisionOwner FAO
Percentage contribution in diets by commodityP2HUNFAOESSDIETFDSx
Page table 16 17 (p 135 138)Percentage contribution of a food group to total dietaryenergy supplySource Statistics DivisionOwner FAO
Depth of hungerP2HUNFAOESSUNMNTDEP
Page table 15 (p 132) chart 36 (p 91)The depth of food deprivation indicates how much food-deprived people fall short of minimum food needs interms of dietary energy It is measured as the differencebetween the minimum dietary energy and the averagedietary energy intake of the undernourished population(food-deprived) The depth of food deprivation is lowwhen it is less than 200 kilocalories per person per dayand high when it is higher than 300 kilocalories per per-son per day The greater the deficit the greater the sus-ceptibility for health risks related to undernutritionSource Statistics DivisionOwner FAO
Incidence of undernourishmentP2HUNFAOESSUNMNTNUM
Page table 15 (p 132) map 19 (p 91)Undernourishment refers to the condition of peoplewhose dietary energy consumption is continuously be-low a minimum dietary energy requirement for main-taining a healthy life and carrying out a light physicalactivity The incidence of undernourishment is the num-ber of people referring to those in this conditionSource Statistics DivisionOwner FAO
Global number of undernourishedP2HUNFAOESSUNMNTPNW
Page chart 33 35 (p 89 90)Undernourishment refers to the condition of peoplewhose dietary energy consumption is continuously be-low a minimum dietary energy requirement for main-taining a healthy life and carrying out a light physical
163
PART 2
activity The global incidence of undernourishment is thetotal number of people in the world referring to those inthis condition
Source Statistics Division
Owner FAO
Percentage of population undernourishedP2HUNFAOESSUNMNTPREV
Page table 15 (p 132) map 18 (p 88)
Undernourishment refers to the condition of peoplewhose dietary energy consumption is continuously be-low a minimum dietary energy requirement for main-taining a healthy life and carrying out a light physicalactivity The percentage of population undernourishedis the total number of people in each country referringto those in this condition divided by the population ofthat country
Source Statistics Division
Owner FAO
Regional percentage of undernourishedP2HUNFAOESSUNMNTPREVR
Page chart 34 (p 90)
Undernourishment refers to the condition of peoplewhose dietary energy consumption is continuously be-low a minimum dietary energy requirement for main-taining a healthy life and carrying out a light physicalactivity The regional percentage of population under-nourished is the total number of people in each regionreferring to those in this condition divided by the popu-lation of that region
Source Statistics Division
Owner FAO
Global affordability of foodP2HUNFAOFPVAFD
Page chart 54 (p 106)
FAO Food Price Index relative to GDP showing howmuchfood prices have risen relative to income from the baseperiod 2002-04 Higer (lower) index scores show greater(less) affordability
Source Statistics Division
Owner FAO
Food price inflationP2HUNFAOFPVFCPI
Page map 25 (p 104)
Annual change in the ILO food price indices The pricedata for the different items included in the computationof the index are normally weighted in order to take intoaccount the relative importance of each item with re-spect to total consumption expenditure In most coun-tries the indices are computed in a derived form suchas weighted arithmetic averages of price relatives fora selected number of representative items between theperiod under consideration and the base period using
one or other forms of Laspeyresrsquo formula The num-ber of items and the weights used to compute the in-dex are given according to expenditure group The termitem is used here to mean the smallest grouping ofgoods and services for which a specific weight is givenThe source(s) and the reference period of the weightsused for the index eg a household expenditure surveynational accounts etc If the reference period for theweights differs from the base period of the index theadjustments made to the weights to take account of theprice changes between the two periods are describedSee httplaborstailoorg for more informationSource LABORSTAOwner ILO
International food prices by food groupP2HUNFAOFPVFPI
Page chart 53 (p 106)The FAO Food Price Index is a measure of themonthly change in international prices of a bas-ket of food commodities It consists of the av-erage of five commodity group price indices (rep-resenting 55 quotations) weighted with the aver-age export shares of each of the groups for 2002-2004 See httpwwwfaoorgworldfoodsituationwfs-homefoodpricesindexen for more information on sub-index constructionSource Statistics DivisionOwner FAO
International food price volatility by food groupP2HUNFAOFPVFPV
Page chart 55 56 (p 107 107)Annualized historical volatility of the FAO Food Price In-dexSource Statistics DivisionOwner FAO
Food price volatility (annualized historical volatility)P2HUNFAOFPVFPVn
Page map 26 (p 108)Annualized historical volatility of the ILO food price in-dicesSource Statistics DivisionOwner FAO
FAO Global Consumption price volatilityP2HUNFAOFPVGCI
Page chart 52 57 (p 105 109)The FAO Global Food Consumption Price Index trackschanges in the cost of the global food basket as por-trayed by the latest FAO world food balance sheet Rep-resentative international prices for each of the commodi-ties or commodity groups appearing in the balance sheetare weighted by their contribution to total calorific in-takeSource Statistics DivisionOwner FAO
164
DEFINITIONS AND SOURCES
Dietary diversity in selected LIFDCs
P2HUNFAOFVDIETDIV
Page chart 39 (p 94)
The Herfindahl index H is calculated as H =sumN=1 S
2
where S is the consumption share of the starchy staple in diets and N is the number of staples consumed For asingle staple consumed the index would equate to oneand declines as the staple base becomes more diversi-fied
Source Statistics Division
Owner FAO
Starchy root consumption and DES
P2HUNFAOFVDIETRTDES
Page chart 38 (p 94)
Caloric equivalent of starchy roots available for con-sumption as a ratio of total dietary energy supply
Source Statistics Division
Owner FAO
Availability of dietary iron
P2HUNFAOMCNIRON
Page table 18 (p 141) chart 44 (p 98)
The dietary availability of iron is calculated by convert-ing the amount of food available for human consumptionas estimated by the FAO Food Balance Sheets in equiv-alent of iron derived from animal and vegetal productsHowever the actual food consumptionmay be lower thanthe quantity shown as food availability depending on themagnitude of wastage and losses of food in the house-hold eg during storage in preparation and cooking asplate-waste or quantities fed to domestic animals andpets thrown or given away
Source Statistics Division
Owner FAO
Food + energy import bills ( GDP)
P2HUNFAOTFSFDFL
Page table 20 (p 147)
The annual value of food imported under SITC sections0 + 22+ 4 plus fuels under SITC section 3 expressed asa ratio of GDP
Source Statistics Division (FAOSTAT) and UNCTADSTAT
Owner FAO UNCTAD
Food import bills
P2HUNFAOTFSFIB
Page table 20 (p 147) chart 49 50 51 (p 103 103103)
The annual value of food imported under SITC sections0 + 22+ 4 expressed in current US$
Source Statistics Division (FAOSTAT) and UNCTADSTAT
Owner FAO UNCTAD
Food + energy import bills per capita
P2HUNFAOTFSFUEL
Page chart 50 51 (p 103 103)
The annual value of food imported under SITC sections0 + 22+ 4 plus fuels under SITC section 3 expressed asa ratio of population
Source Statistics Division (FAOSTAT) and UNCTADSTAT
Owner FAO UNCTAD
Index of variability of food production
P2HUNFAOTFSQPVAR
Page chart 46 (p 102)
Rolling ten-year window of the coefficient of variation ofper capita production index
Source Statistics Division
Owner FAO
Food self-sufficiency (calories)
P2HUNFAOTFSSSCAL
Page table 19 (p 144) chart 45 (p 101) map 24 (p100)
The self-sufficiency ratio (SSR) is defined as SSR = pro-duction x 100(production + imports - exports) The SSRcan be calculated for individual commodities groups ofcommodities of similar nutritional values and after ap-propriate conversion of the commodity equations alsofor the aggregate of all commodities In the context offood security the SSR is often taken to indicate the ex-tent to which a country relies on its own production re-sources ie the higher the ratio the greater the self-sufficiency While the SSR can be the appropriate toolwhen assessing the supply situation for individual com-modities a certain degree of caution should be observedwhen looking at the overall food situation In the casehowever where a large part of a countryrsquos production ofone commodity eg other cereals is exported the SSRmay be very high but the country may still have to relyheavily on imports of food commodities to feed the pop-ulation The self-sufficiency rate (as defined above) can-not be the complement to 100 of the import dependencyrate or vice-versa
Source Statistics Division
Owner FAO
Months of cereal self-provisioning capacity
P2HUNFAOTFSSTU
Page chart 47 48 (p 102 103)
Stocks-to-utilization ratios for cereals (wheat rice andcoarse grains) where stocks refer to the carry-over ofthe preceding national crop season The ratio is thenmultiplied by 12 to calculate the number of months ofself-provisioning capacity in a given year
Source Trade and Markets Division
Owner FAO
165
PART 2
Persons affected by natural disastersP2HUNODFAEMDATRHSPPND
Page table 14 (p 129) chart 29 (p 85) map 16 (p 84)People requiring immediate assistance during a periodof emergency ie requiring basic survival needs suchas food water shelter sanitation and immediate med-ical assistance Appearance of a significant number ofcases of an infectious disease introduced in a region ora population that is usually free from that disease Seewwwemdatnet (Universiteacute catholique de Louvain Brus-sels Belgium)Source International Disaster Database EM-DATOwner OFDA and CRED
Total affected by natural disastersP2HUNODFAEMDATRHSPPNDT
Page chart 30 (p 86)Sum of (i) injured people suffering from physical injuriestrauma or an illness requiring medical treatment as a di-rect result of a disaster (ii) homeless people needing im-mediate assistance for shelter and (iii) affected peoplerequiring immediate assistance during a period of emer-gency it can also include displaced or evacuated peopleSee wwwemdatnet (Universiteacute catholique de LouvainBrussels Belgium)Source International Disaster Database EM-DATOwner OFDA and CRED
Multidimensional Poverty IndexP2HUNUNDPHDRMPI
Page table 21 (p 150)An international measure of poverty for 109 developingcountries the MPI complements income-based povertymeasures by reflecting the multiple deprivations thatpeople face at the same time The MPI identifies de-privations across health education and living standardsand shows the number of people who are multidimen-sionally poor and the deprivations that they face at thehousehold levelSource Alkire S Roche JM Santos ME and Seth S(November 2011) ophiqehoxacukOwner OPHI
Gender Inequality IndexP2HUNUNDPHDRPOVGEI
Page table 22 (p 153) map 29 (p 113)The Gender Inequality Index is a composite measure re-flecting inequality in achievements between women andmen in three dimensions reproductive health empow-erment and the labour market It varies between zero(when women and men fare equally) and one (when menor women fare poorly compared to the other in all di-mensions) The health dimension is measured by twoindicators maternal mortality ratio and the adolescentfertility rate The empowerment dimension is also mea-sured by two indicators the share of parliamentary seatsheld by each sex and by secondary and higher educationattainment levels The labour dimension is measured by
womenrsquos participation in the work force The Gender In-equality Index is designed to reveal the extent to whichnational human development achievements are erodedby gender inequality and to provide empirical founda-tions for policy analysis and advocacy effortsSource Human Development Report 2010Owner UNDP
Human Development IndexP2HUNUNDPHDRPOVHDI
Page table 22 (p 153)The HDI represents a national average of human de-velopment achievements in the three basic dimensionsmaking up the HDI health education and income Likeall averages it conceals disparities in human develop-ment across the population within the same countryTwo countries with different distributions of achieve-ments can have the same average HDI value The IHDItakes into account not only the average achievements ofa country on health education and income but also howthose achievements are distributed among its citizens bydiscounting each dimensionrsquos average value accordingto its level of inequalitySource Human Development Report 2010Owner UNDP
Human Development Index (inequality adjusted)P2HUNUNDPHDRPOVHDIi
Page table 22 (p 153) chart 59 (p 112)The Human Development Index (HDI) is a summary mea-sure of human development It measures the averageachievements in a country in three basic dimensionsof human development a long and healthy life ac-cess to knowledge and a decent standard of living TheInequality-adjusted Human Development Index (IHDI)adjusts the Human Development Index (HDI) for inequal-ity in distribution of each dimension across the popula-tion The IHDI accounts for inequalities in HDI dimen-sions by discounting each dimensionrsquos average valueaccording to its level of inequality The IHDI equals theHDI when there is no inequality across people but is lessthan the HDI as inequality rises In this sense the IHDI isthe actual level of human development (accounting forthis inequality) while the HDI can be viewed as an in-dex of potential human development (or the maximumlevel of HDI) that could be achieved if there was no in-equality The loss in potential human development dueto inequality is given by the difference between the HDIand the IHDI and can be expressed as a percentageSource Human Development Report 2010Owner UNDP
Population of concernP2HUNUNHCRGTRHSTPC
Page table 13 (p 126) map 17 (p 87)Refugees are individuals recognized under the 1951Convention relating to the Status of Refugees and alsopeople in a refugee-like situation such as those who
166
DEFINITIONS AND SOURCES
are outside their country or territory of origin and whoface protection risks similar to those of refugees butfor whom refugee status has for practical or other rea-sons not been ascertained Internally Displaced Persons(IDPs) are people or groups of individuals who have beenforced to leave their homes or places of habitual resi-dence in particular as a result of or in order to avoidthe effects of armed conflict situations of generalized vi-olence violations of human rights or natural- or human-made disasters and who have not crossed an interna-tional border Others include Asylum-seekers (personswho have applied for asylum or refugee status but whohave not yet received a final decision on their applica-tion) Returned IDPs and refugees Stateless Persons (in-dividuals not considered as nationals by any State underrelevant national laws) and other groups of concern towhom UNHCR has extended its protection andor assis-tance services based on humanitarian or other specialgrounds
Source Statistical Online Population Database
Owner UNHCR
Total population of concern
P2HUNUNHCRGTRHSTPCT
Page chart 32 (p 87)
Total population of concern is the sum of various groupsof people including refugees asylum-seekers internallydisplaced persons (IDPs) protectedassisted by UNHCRstateless persons and returnees (returned refugees andIDPs)
Source Statistical Online Population Database
Owner UNHCR
Average governance
P2HUNWBKPOVGOV
Page table 23 (p 156) chart 60 (p 115) map 30 (p114)
The Worldwide Governance Indicators project constructsaggregate indicators of six broad dimensions of gover-nance (i) Voice and Accountability (ii) Political Stabil-ity and Absence of ViolenceTerrorism (iii) GovernmentEffectiveness (iv) Regulatory Quality (v) Rule of Law(vi) Control of Corruption The six aggregate indicatorsare based on 30 underlying data sources reporting theperceptions of governance of a large number of surveyrespondents and expert assessments worldwide De-tails on the underlying data sources the aggregationmethod and the interpretation of the indicators can befound in the WGI methodology paper Daniel KaufmannAart Kraay and Massimo Mastruzzi (2010) The World-wide Governance Indicators A Summary of Methodol-ogy Data and Analytical Issues World Bank Policy Re-search Working Paper No 5430 httppapersssrncomsol3paperscfmabstract_id=1682130
Source World Bank
Owner Worldwide Governance Indicators (WGI) project
Ratio of girls-to-boys out of primary school
P2HUNWBKWDIEDUCOSR
Page table 24 (p 159)
Children out of school are the number of primary-school-age children not enrolled in primary or secondary school
Source World Bank (WDI)
Owner UNESCO
Public spending on education total ( of GDP)
P2HUNWBKWDIEDUEXPP
Page table 24 (p 159)
Public expenditure on education consists of current andcapital public expenditure on education includes gov-ernment spending on educational institutions (both pub-lic and private) education administration as well assubsidies for private entities (studentshouseholds andother privates entities)
Source World Bank (WDI)
Owner UNESCO
Expenditure per student
P2HUNWBKWDIEDUEXPS
Page table 24 (p 159)
Public expenditure per student is the public currentspending on education divided by the total number ofstudents by level as a percentage of GDP per capitaPublic expenditure (current and capital) includes govern-ment spending on educational institutions (both publicand private) education administration as well as subsi-dies for private entities (studentshouseholds and otherprivates entities)
Source World Bank (WDI)
Owner UNESCO
Literacy rate adult female ( of females ages 15 andabove)
P2HUNWBKWDIEDUFILT
Page table 24 (p 159) map 31 (p 116)
Adult literacy rate is the percentage of people ages 15and above who can with understanding read and writea short simple statement on their everyday life
Source World Bank (WDI)
Owner UNESCO
Ratio of girls to boys in primary and secondary education()
P2HUNWBKWDIEDUGEN
Page table 24 (p 159) chart 61 (p 117)
Ratio of girls to boys in primary and secondary educationis the ratio of the female to male gross enrolment ratesin primary and secondary school
Source World Bank (WDI)
Owner UNESCO
167
PART 2
Health expenditure per capita (current US$)P2HUNWBKWDIHAEHEPCP
Page table 24 (p 159) map 32 (p 118)
Total health expenditure is the sum of public and pri-vate health expenditures as a ratio of total populationIt covers the provision of health services (preventive andcurative) family planning activities nutrition activitiesand emergency aid designated for health but does notinclude provision of water and sanitation Data are incurrent US dollars
Source World Bank (WDI)
Owner WHO
Health expenditure total ( of GDP)P2HUNWBKWDIHAEHETOT
Page table 24 (p 159) chart 62 (p 119)
Total health expenditure is the sum of public and privatehealth expenditure It covers the provision of health ser-vices (preventive and curative) family planning activi-ties nutrition activities and emergency aid designatedfor health but does not include provision of water andsanitation
Source World Bank (WDI)
Owner WHO
Prevalence of HIV total ( of population ages 15-49)P2HUNWBKWDIHAEHIVPREV
Page table 24 (p 159)
Prevalence of HIV refers to the percentage of people ages15-49 who are infected with HIV
Source World Bank (WDI)
Owner UNAIDS and WHO
Improved sanitation facilities ( of population with ac-cess)P2HUNWBKWDIHAESANIMPS
Page table 24 (p 159) chart 63 (p 121)
Access to improved sanitation facilities refers to the per-centage of the population with at least adequate accessto excreta disposal facilities that can effectively preventhuman animal and insect contact with excreta Im-proved facilities range from simple but protected pit la-trines to flush toilets with a sewerage connection Tobe effective facilities must be correctly constructed andproperly maintained
Source World Bank (WDI)
Owner WHO and UNCF
Improved water source rural ( of rural population withaccess)P2HUNWBKWDIHAEWATIMPRU
Page table 24 (p 159) map 33 (p 120)
Access to an improved water source refers to the percent-age of the population with reasonable access to an ad-equate amount of water from an improved source suchas a household connection public standpipe borehole
protected well or spring and rainwater collection Unim-proved sources include vendors tanker trucks and un-protected wells and springs Reasonable access is de-fined as the availability of at least 20 litres a person aday from a source within one kilometre of the dwellingSource World Bank (WDI)Owner WHO and UNCF
Improved water source urban ( of urban populationwith access)P2HUNWBKWDIHAEWATIMPWU
Page table 24 (p 159)Access to an improved water source refers to the percent-age of the population with reasonable access to an ad-equate amount of water from an improved source suchas a household connection public standpipe boreholeprotected well or spring and rainwater collection Unim-proved sources include vendors tanker trucks and un-protected wells and springs Reasonable access is de-fined as the availability of at least 20 litres a person aday from a source within one kilometre of the dwellingSource World Bank (WDI)Owner WHO and UNCF
Poverty headcount ratio at $125 a day (PPP) ( of re-gional population)P2HUNWBKWDIPOVAGG
Page chart 58 (p 111)Data are from PovcalNet the on-line tool for povertymeasurement developed by the Development ResearchGroup of the World Bank See httpiresearchworldbankorgPovcalNetpovDuplichtmlSource PovcalNetOwner World Bank
Gini-index of income distributionP2HUNWBKWDIPOVGINI
Page table 22 (p 153) map 28 (p 113)Gini index measures the extent to which the distribu-tion of income among individuals or households withinan economy deviates from a perfectly equal distributionA Lorenz curve plots the cumulative percentages of totalincome received against the cumulative number of recip-ients starting with the poorest individual or householdThe Gini index measures the area between the Lorenzcurve and a hypothetical line of absolute equality ex-pressed as a percentage of the maximum area under theline Thus a Gini index of 0 represents perfect equalitywhile an index of 100 implies perfect inequalitySource World Bank (WDI)Owner World Bank
Poverty headcount ratio at $125 a day (PPP) ( of pop-ulation)P2HUNWBKWDIPOVH125
Page table 21 (p 150)Population below US$125 a day is the percentage of thepopulation living on less than US$125 a day at 2005
168
DEFINITIONS AND SOURCES
international prices As a result of revisions in PPP ex-change rates poverty rates for individual countries can-not be compared with poverty rates reported in earliereditionsSource World Bank (WDI)Owner World Bank
Income share held by highest 20P2HUNWBKWDIPOVH20
Page table 22 (p 153)Percentage share of income or consumption is the sharethat accrues to subgroups of population indicated bydeciles or quintiles Percentage shares by quintile maynot sum to 100 because of roundingSource World Bank (WDI)Owner World Bank
Poverty headcount ratio at $2 a day (PPP) ( of popula-tion)P2HUNWBKWDIPOVH200
Page table 21 (p 150)Population below US$2 a day is the percentage of thepopulation living on less than US$200 a day at 2005international prices As a result of revisions in PPP ex-change rates poverty rates for individual countries can-not be compared with poverty rates reported in earliereditionsSource World Bank (WDI)Owner World Bank
Poverty headcount ratio at national poverty line ( ofpopulation)P2HUNWBKWDIPOVHNPL
Page table 21 (p 150)National poverty rate is the percentage of the popula-tion living below the national poverty line National es-timates are based on population-weighted subgroup es-timates from household surveysSource World Bank (WDI)Owner World Bank
Poverty headcount ratio at rural poverty line ( of ruralpopulation)P2HUNWBKWDIPOVHRPL
Page table 21 (p 150)Rural poverty rate is the percentage of the rural popula-tion living below the national rural poverty lineSource World Bank (WDI)Owner World Bank
Income share held by lowest 20P2HUNWBKWDIPOVL20
Page table 22 (p 153)Percentage share of income or consumption is the sharethat accrues to subgroups of population indicated bydeciles or quintiles Percentage shares by quintile maynot sum to 100 because of roundingSource World Bank (WDI)Owner World Bank
Poverty gap at $125 a day (PPP) ()P2HUNWBKWDIPOVP125
Page table 21 (p 150) map 27 (p 110)Poverty gap is the mean shortfall from the poverty line(counting the nonpoor as having zero shortfall) ex-pressed as a percentage of the poverty line This mea-sure reflects the depth of poverty as well as its incidenceSource World Bank (WDI)Owner World Bank
Poverty gap at $2 a day (PPP) ()P2HUNWBKWDIPOVP200
Page table 21 (p 150)Poverty gap is the mean shortfall from the poverty line(counting the nonpoor as having zero shortfall) ex-pressed as a percentage of the poverty line This mea-sure reflects the depth of poverty as well as its incidenceSource World Bank (WDI)Owner World Bank
Poverty gap at national poverty line ()P2HUNWBKWDIPOVPNPL
Page table 21 (p 150)Poverty gap at national poverty line is the mean short-fall from the poverty line (counting the nonpoor as hav-ing zero shortfall) as a percentage of the poverty lineThis measure reflects the depth of poverty as well as itsincidenceSource World Bank (WDI)Owner World Bank
Poverty gap at rural poverty line ()P2HUNWBKWDIPOVPRPL
Page table 21 (p 150)Poverty gap at rural poverty line is the mean shortfallfrom the poverty line (counting the nonpoor as hav-ing zero shortfall) as a percentage of the national ruralpoverty line This measure reflects the depth of povertyas well as its incidenceSource World Bank (WDI)Owner World Bank
Food aid receivedP2HUNWFPFAISFDAID
Page table 25 (p 162) chart 64 (p 123) map 34 (p122)Quantity of food aid that reaches the recipient coun-try during a given period Quantities exported in GrainEquivalent The latter is a unit of measurement usedas alternative to Actual Ton for cereal-derived productsTo convert a product into grain equivalent a commodityspecific conversion factor is used For example if the fac-tor to convert wheat flour into wheat is 137 a tonne ofwheat flour corresponds to 0730 tons of wheat (1137)Source Food Aid Information SystemOwner WFP
169
PART 2
Percentage of adults with low body mass index (BMI)P2HUNWHOGHOADLTLBMI
Page table 18 (p 141)The indicator of weight adequacy in relation to height ofolder children adolescents and adults It is calculated asweight (kilograms) divided by height (metres) squaredThe acceptable range for adults is 185 to 249 and forchildren it varies with ageSource Global Health ObservatoryOwner WHO
Percentage of female adults with low body mass index(BMI)P2HUNWHOGHOADLTLBMIF
Page table 18 (p 141) map 22 (p 99)The indicator of weight adequacy in relation to height ofolder female children adolescents and adults It is cal-culated as weight (kilograms) divided by height (metres)squared The acceptable range for adults is 185 to 249 and for children it varies with ageSource Global Health ObservatoryOwner WHO
Percentage of adults who are obese by genderP2HUNWHOGHOADLTOBS
Page table 18 (p 141)Percentage of male and female defined population witha body mass index (BMI) of 25 kgm2 or higherSource Global Health ObservatoryOwner WHO
Percentage of adults who are obeseP2HUNWHOGHOADLTOBSx
Page map 23 (p 99)Percentage of adult defined population with a bodymassindex (BMI) of 25 kgm2 or higherSource Global Health ObservatoryOwner WHO
Percentage of children under 5 who are stuntedP2HUNWHOGHOCHLDSTNT
Page table 18 (p 141) chart 43 (p 98)Percentage of stunting (height-for-age less than -2 stan-dard deviations of the WHO Child Growth Standards me-dian) among children aged 0-5 yearsSource Global Health ObservatoryOwner WHO
Percentage of children under 5 who are underweightP2HUNWHOGHOCHLDUW
Page table 18 (p 141) chart 42 (p 97) map 21 (p 96)Percentage of underweight (weight-for-age less than -2standard deviations of the WHO Child Growth Standardsmedian) among children aged 0-5 yearsSource Global Health ObservatoryOwner WHO
Percentage of children under 5 who are wastedP2HUNWHOGHOCHLDWSTD
Page table 18 (p 141) chart 43 (p 98)Percentage of wasting (weight-for-height less than -2standard deviations of the WHO Child Growth Standardsmedian) among children aged 0-5 yearsSource Global Health ObservatoryOwner WHO
Percentage of newborns with low birth weightP2HUNWHOGHONEWLWB
Page table 18 (p 141)Low-birthweight babies are newborns weighing lessthan 2500 grams with the measurement taken withinthe first hours of life before significant postnatal weightloss has occurredSource Global Health ObservatoryOwner WHO
170