educating kids about gun violence (ekg) evaluation results
TRANSCRIPT

1
Educating Kids about Gun Violence
(EKG) Evaluation Results Year 1:
Sept. 2014-May 2015
March 2016
Stacy Sechrist, Ph.D. & John Weil
North Carolina Network for Safe Communities

2
EKG Evaluation Results Year 1: Sept. 2014-May 2015
The results for the first year of the EKG program are presented in this report. The report is divided into several
separate sections for purposes of presenting, interpreting, and understanding the results. Sections are briefly
outlined below:
1. Description of the EKG Program
2. Research Methodology
3. Research Sample Description & Baseline Characteristics
a. Entire Sample
b. Breakdown by School
4. Creation of Factor Scores through Factor Analysis
a. Factor Scale Scores for Sample
b. Factor Scale Scores by School
5. Student Risk Level Categorization
a. Characteristics of High Risk Students
6. EKG Program Impact
a. Changes in Attitudes, Beliefs, and Intended Behaviors Over Time
i. Pre- and Post-Comparisons
ii. Interactions between Student Risk Level and EKG Program Impact
b. Longitudinal Outcomes
i. Retention of EKG Impact
ii. Interactions between Student Risk Level and Longitudinal Impact
7. Conclusions & Recommendations
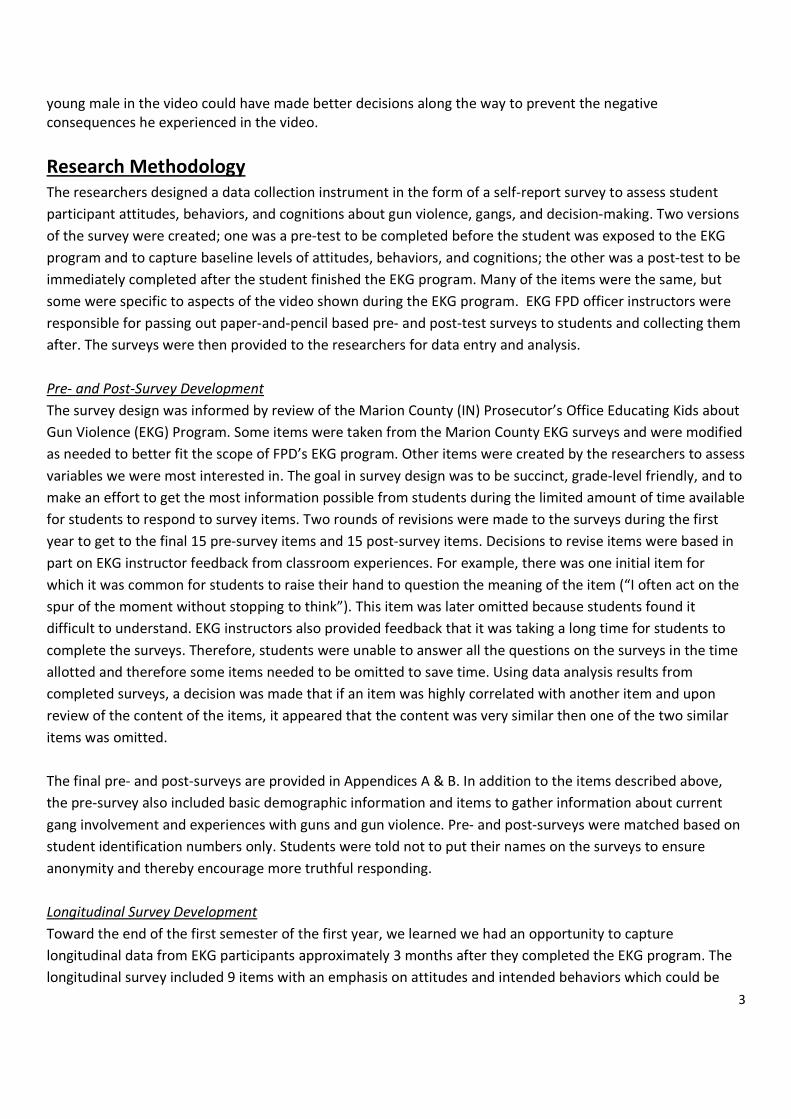
Description of the EKG Program
The Educating Kids about Gun Violence (EKG) program is part of the Fayetteville Police Department’s
Operation Ceasefire initiative, The EKG program began in 2014 and is designed to teach kids about gun and
gang violence and prepare them for healthy decision-making. The program is taught by Fayetteville Police
Department officers to youth in all 7th and 9th grade health classes in the Cumberland County School System,
representing a unique partnership between law enforcement and the schools. By the end of the 2014-2015
school year, the Department will have reached over 8600 students county-wide with its gun and gang violence
prevention and education message.
The EKG program uses a video called “Decision Points” (which was created and produced in Fayetteville, NC)
featuring a number of scenarios involving a young male who is faced with various decision points about gun
and gang violence. The video exposes the classroom participants to the potential consequences of poor
decision-making about guns and gangs. Classroom participants then discuss decision-making and how the
3
young male in the video could have made better decisions along the way to prevent the negative
consequences he experienced in the video.
Research Methodology
The researchers designed a data collection instrument in the form of a self-report survey to assess student
participant attitudes, behaviors, and cognitions about gun violence, gangs, and decision-making. Two versions
of the survey were created; one was a pre-test to be completed before the student was exposed to the EKG
program and to capture baseline levels of attitudes, behaviors, and cognitions; the other was a post-test to be
immediately completed after the student finished the EKG program. Many of the items were the same, but
some were specific to aspects of the video shown during the EKG program. EKG FPD officer instructors were
responsible for passing out paper-and-pencil based pre- and post-test surveys to students and collecting them
after. The surveys were then provided to the researchers for data entry and analysis.
Pre- and Post-Survey Development
The survey design was informed by review of the Marion County (IN) Prosecutor’s Office Educating Kids about
Gun Violence (EKG) Program. Some items were taken from the Marion County EKG surveys and were modified
as needed to better fit the scope of FPD’s EKG program. Other items were created by the researchers to assess
variables we were most interested in. The goal in survey design was to be succinct, grade-level friendly, and to
make an effort to get the most information possible from students during the limited amount of time available
for students to respond to survey items. Two rounds of revisions were made to the surveys during the first
year to get to the final 15 pre-survey items and 15 post-survey items. Decisions to revise items were based in
part on EKG instructor feedback from classroom experiences. For example, there was one initial item for
which it was common for students to raise their hand to question the meaning of the item (“I often act on the
spur of the moment without stopping to think”). This item was later omitted because students found it
difficult to understand. EKG instructors also provided feedback that it was taking a long time for students to
complete the surveys. Therefore, students were unable to answer all the questions on the surveys in the time
allotted and therefore some items needed to be omitted to save time. Using data analysis results from
completed surveys, a decision was made that if an item was highly correlated with another item and upon
review of the content of the items, it appeared that the content was very similar then one of the two similar
items was omitted.
The final pre- and post-surveys are provided in Appendices A & B. In addition to the items described above,
the pre-survey also included basic demographic information and items to gather information about current
gang involvement and experiences with guns and gun violence. Pre- and post-surveys were matched based on
student identification numbers only. Students were told not to put their names on the surveys to ensure
anonymity and thereby encourage more truthful responding.
Longitudinal Survey Development
Toward the end of the first semester of the first year, we learned we had an opportunity to capture
longitudinal data from EKG participants approximately 3 months after they completed the EKG program. The
longitudinal survey included 9 items with an emphasis on attitudes and intended behaviors which could be
4
assessed again and in a similar manner as they were at baseline in the pre-survey and in the post-survey after
EKG program completion. Again, longitudinal surveys were matched by ID number where possible to the
student’s ID on the pre- and post-surveys. In some cases, matching was not possible, meaning a student’s
longitudinal data could not be paired with their data gathered at the time they were participating in the EKG
program. The longitudinal survey is provided in Appendix C. The longitudinal paper-and-pencil based surveys
were distributed to students and collected upon completion by their health classroom teacher. The surveys
were then given to FPD and then given to the researchers for data entry and analysis.
Research Sample Description & Baseline Characteristics
In reporting and interpreting research findings, it is important to describe the characteristics of the sample of
individuals who participated in the research. A general demographic breakdown of EKG student participants is
provided below along with the sample’s experiences related to gangs and gun violence as assessed in the pre-
EKG survey.
General Sample Description
Data from 6562 students were entered for final analysis for Year 1 (note that not all 6562 students provided data for
each point below; in other words, students did not have to answer any questions on the surveys that they did not want
to):
• 3045 7th
graders (46.2%); 3529 9th
graders (53.6%); 14 had no grade level and were from youth detention
facilities (.2%)
• 3075 males (49.8%); 3098 females (50.2%)
• 2337 Black/African American (37.5%); 1633 White/Caucasian (26.2%); 1178 Other (18.9%); 576 Hispanic/Latino
(9.2%); 296 Native American (4.7%); 156 Asian/Asian American (2.5%); 58 Native Hawaiian/Pacific Islander (.9%)
(where race was provided)
• 97 (1.6%) identified as a member of a street gang (373 students did not respond)
• 182 (3.0%) would consider joining a gang
• 720 (11.6%) have been threatened with a gun or shot at
• 2756 (44.7%) have had a close family member or friend shot with a gun
• 156 (2.5%) have threatened someone with a gun or shot at someone
The breakdown of number of respondents from each school is presented in the table below. Students from JBHS had the
most participants of all the schools, representing 7.5% of the total sample.

5
Breakdown of EKG Respondents from Each School
Frequency Percent
Valid ACMS 75 1.1
CCEC 73 1.1
CFHS 400 6.1
DBHS 249 3.8
DBMS 278 4.2
EESHS 267 4.1
GCHS 280 4.3
GCMS 267 4.1
HHLSHS 43 .7
HMMS 194 3.0
JBHS 497 7.6
JDC 14 .2
JGMS 203 3.1
LCMS 176 2.7
LNJMS 113 1.7
MAMS 203 3.1
MHCHS 89 1.4
MWMS 290 4.4
NCIMS 145 2.2
PFHS 366 5.6
PFMS 219 3.3
PJMS 21 .3
RRCHS 59 .9
RRCMS 72 1.1
RSHS 48 .7
SFCMS 182 2.8
SFHS 422 6.4
SLMS 171 2.6
SVHS 285 4.3
SVMS 215 3.3
TSHS 185 2.8
WOHS 266 4.1
WOMS 195 3.0
Total 6562 100.0
6
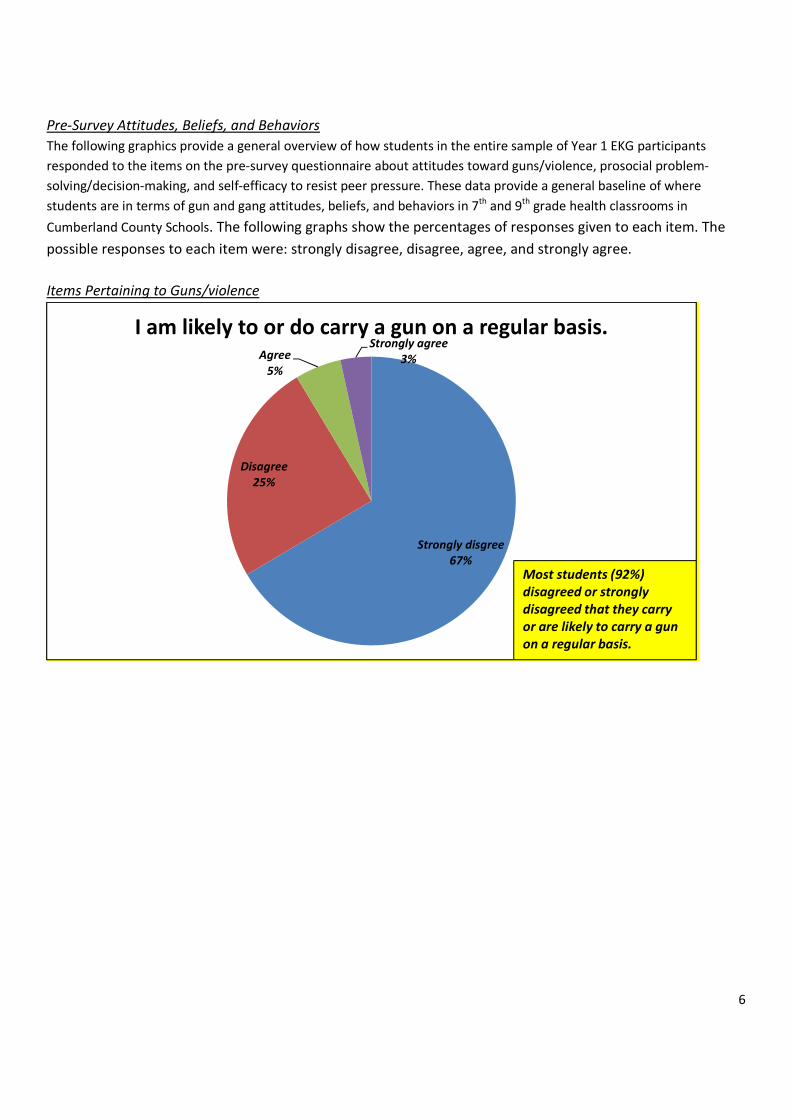
Pre-Survey Attitudes, Beliefs, and Behaviors
The following graphics provide a general overview of how students in the entire sample of Year 1 EKG participants
responded to the items on the pre-survey questionnaire about attitudes toward guns/violence, prosocial problem-
solving/decision-making, and self-efficacy to resist peer pressure. These data provide a general baseline of where
students are in terms of gun and gang attitudes, beliefs, and behaviors in 7th
and 9th
grade health classrooms in
Cumberland County Schools. The following graphs show the percentages of responses given to each item. The
possible responses to each item were: strongly disagree, disagree, agree, and strongly agree.
Items Pertaining to Guns/violence
Strongly disgree
67%
Disagree
25%
Agree
5%
Strongly agree
3%
I am likely to or do carry a gun on a regular basis.
Most students (92%)
disagreed or strongly
disagreed that they carry
or are likely to carry a gun
on a regular basis.

7
Strongly disagree
60%
Disagree
35%
Agree
4%
Strongly agree
1%
Carrying a gun is a good way to get respect from
other people.
Most students (95%)
disagreed or strongly
disagreed that carrying
a gun is a good way to
get respect.
Strongly disagree
14%
Disagree
14%
Agree
25%
Strongly agree
47%
It is illegal for me to carry a gun.
While most students
(72%) knew that
carrying a gun is illegal,
there appears to be a
need for students to
learn this fact evidenced
by the 28% who
disagreed or strongly
disgreed with this fact.

8
Strongly disagree
46%
Disagree
21%
Agree
17%
Strongly agree
16%
The stuff I get into may someday put me in prison.
Nearly a quarter (23%)
of students agreed or
strongly agreed that
the activities they are
involved in may lead to
prison, suggesting that
a rather large sub-
sample of students are
at-risk for criminal
beavhior.
Strongly disagree
13%
Disagree
29%
Agree
28%
Strongly agree
30%
If one of my close friends started carrying a gun, I
would no longer hang out with them.
58% of students agreed
or strongly agreed that
they would stop
associating with a
friend who started
carrying a gun. 42%
who disagreed or
strongly disgreed may
be putting themselves
at risk by continuing to
associate with negative
peer influences,
thereby indicating a
need to educate
studentes about the
risks of negative peer
influecnes.

9
Strongly disgree
54%
Disagree
25%
Agree
13%
Strongly agree
8%
It would be easy for me to get a gun if I wanted one.
21% of students agreed
or strongly agreed that
it would be easy to get a
gun if they wanted one.
This is a potential risk
factor for future violence
or even suicide. Students
need to be educated on
potential dangers of gun
carrying if not handled
responsibly. Access to
guns may need to be
addressed at the
community level.
Strongly disgree
9%
Disagree
15%
Agree
27%
Strongly agree
49%
Carrying a gun is dangerous.
76% of students agreed or
strongly agreed that
carrying a gun is
dangerous.

10
Strongly disgree
71%
Disagree
21%
Agree
5%
Strongly agree
3%
Many of my friends carry guns regularly.
Most students (92%)
disagreed or strongly
disagreed that many of
their friends carry guns
regularly.
Strongly disgree
33%
Disagree
29%
Agree
23%
Strongly agree
15%
Members of gangs always have each other's backs
and stand up for one another.
A large minority (38%)
agreed or strongly
agreed with the belief
that gang members
always have each other's
backs, indicating that
gang culture and
prevailing myths about
gangs are content areas
in which students need
education.

11
Items pertaining to prosocial problem-solving/decision-making
Strongly disagree
3%Disagree
7%
Agree
43%
Strongly agree
47%
The best way to solve an argument is to talk things
out, even it it takes an hour or two.
Most students (90%)
agreed or strongly
agreed that the best
way to solve an
argument is to talk
things out.
Strongly disagree
4%
Disagree
9%
Agree
39%
Strongly agree
48%
I need to think more about the consequences of my
actions before acting.
87% of students agreed or
strongly agreed that they
need to think more about
consequences of actions
before acting. The other
13% of the sample may
need to further explore this
concept and receive
guidance on how to
develop skills to do so. For
example, use of cognitive-
behavioral interventions
may be helpful.
12
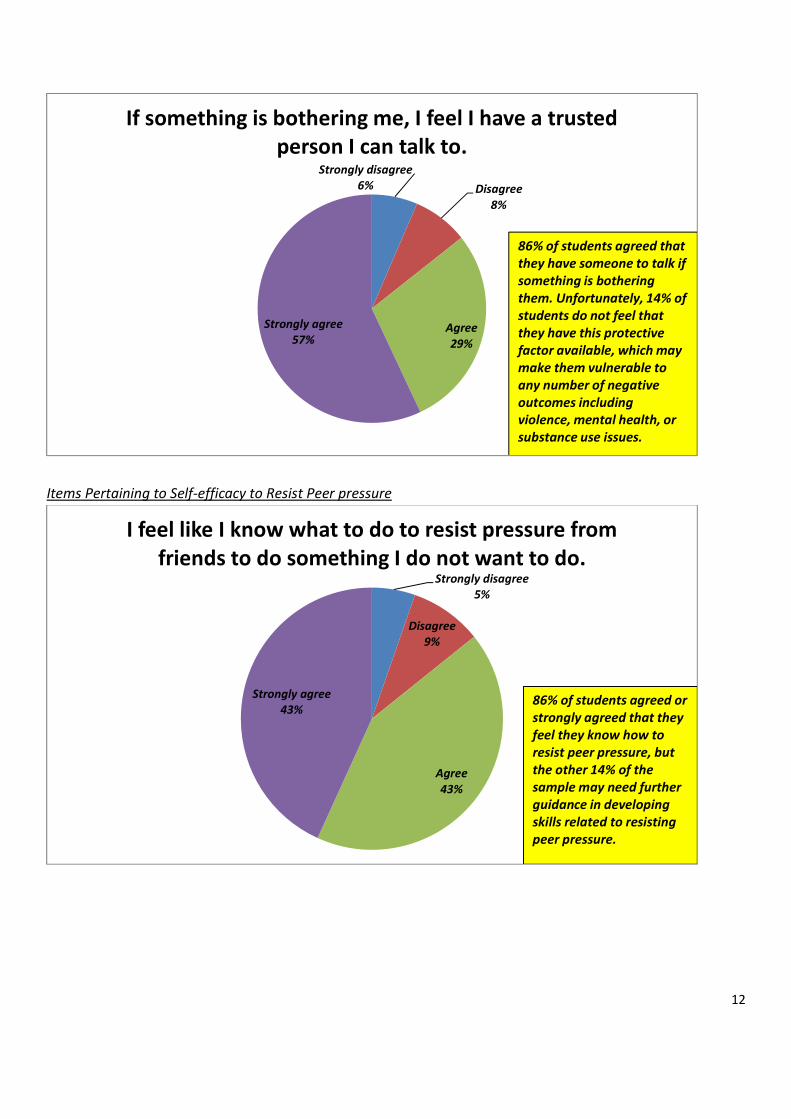
Items Pertaining to Self-efficacy to Resist Peer pressure
Strongly disagree
6% Disagree
8%
Agree
29%
Strongly agree
57%
If something is bothering me, I feel I have a trusted
person I can talk to.
86% of students agreed that
they have someone to talk if
something is bothering
them. Unfortunately, 14% of
students do not feel that
they have this protective
factor available, which may
make them vulnerable to
any number of negative
outcomes including
violence, mental health, or
substance use issues.
Strongly disagree
5%
Disagree
9%
Agree
43%
Strongly agree
43%
I feel like I know what to do to resist pressure from
friends to do something I do not want to do.
86% of students agreed or
strongly agreed that they
feel they know how to
resist peer pressure, but
the other 14% of the
sample may need further
guidance in developing
skills related to resisting
peer pressure.
13
Strongly disagree
54%Disagree
35%
Agree
8%
Strongly agree
3%
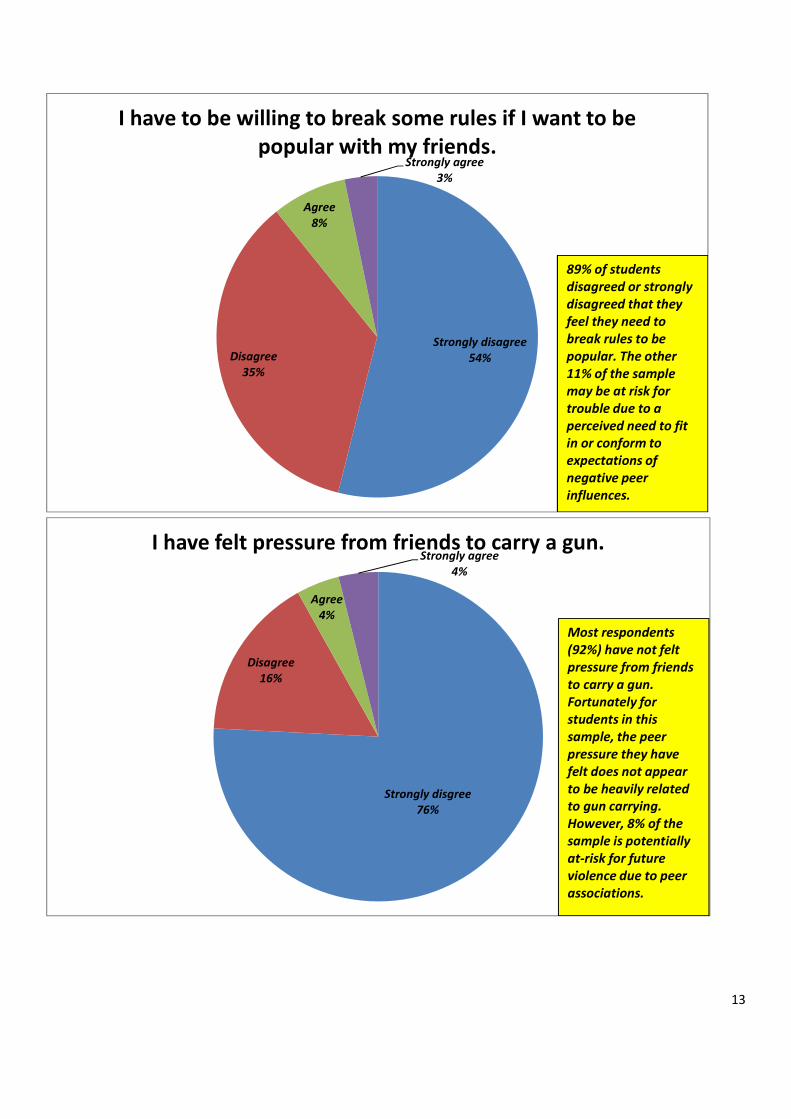
I have to be willing to break some rules if I want to be
popular with my friends.
89% of students
disagreed or strongly
disagreed that they
feel they need to
break rules to be
popular. The other
11% of the sample
may be at risk for
trouble due to a
perceived need to fit
in or conform to
expectations of
negative peer
influences.
Strongly disgree
76%
Disagree
16%
Agree
4%
Strongly agree
4%
I have felt pressure from friends to carry a gun.
Most respondents
(92%) have not felt
pressure from friends
to carry a gun.
Fortunately for
students in this
sample, the peer
pressure they have
felt does not appear
to be heavily related
to gun carrying.
However, 8% of the
sample is potentially
at-risk for future
violence due to peer
associations.

14
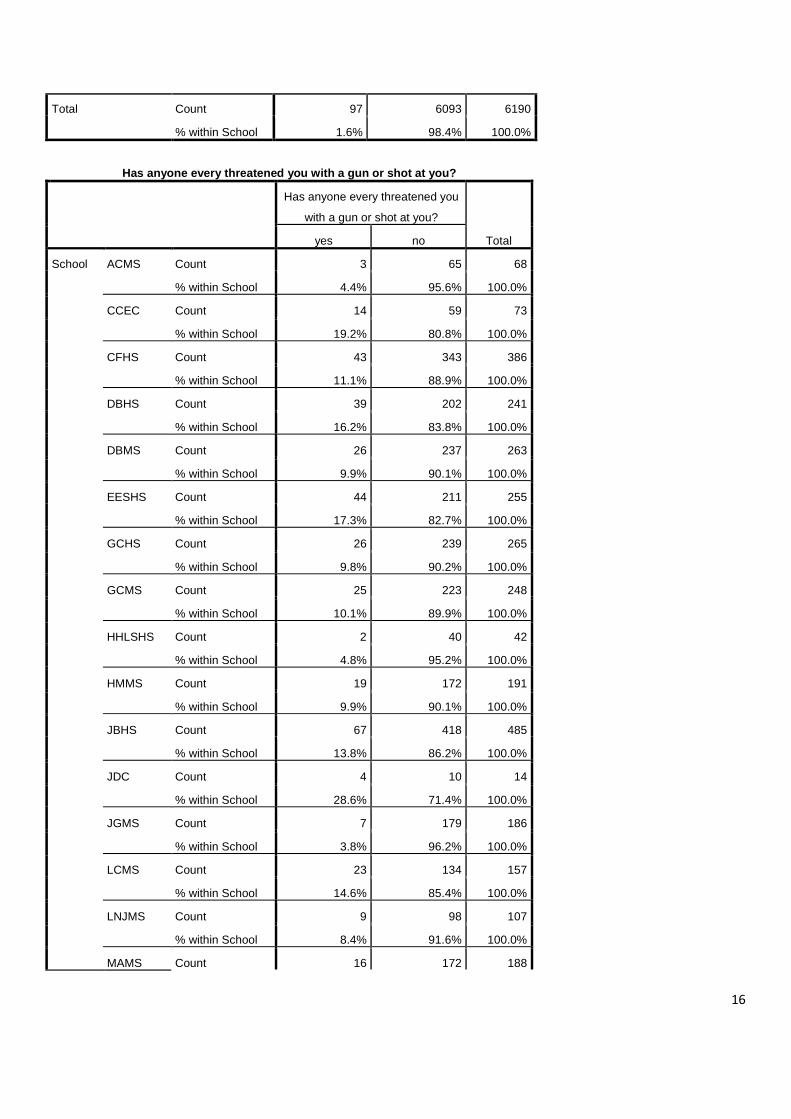
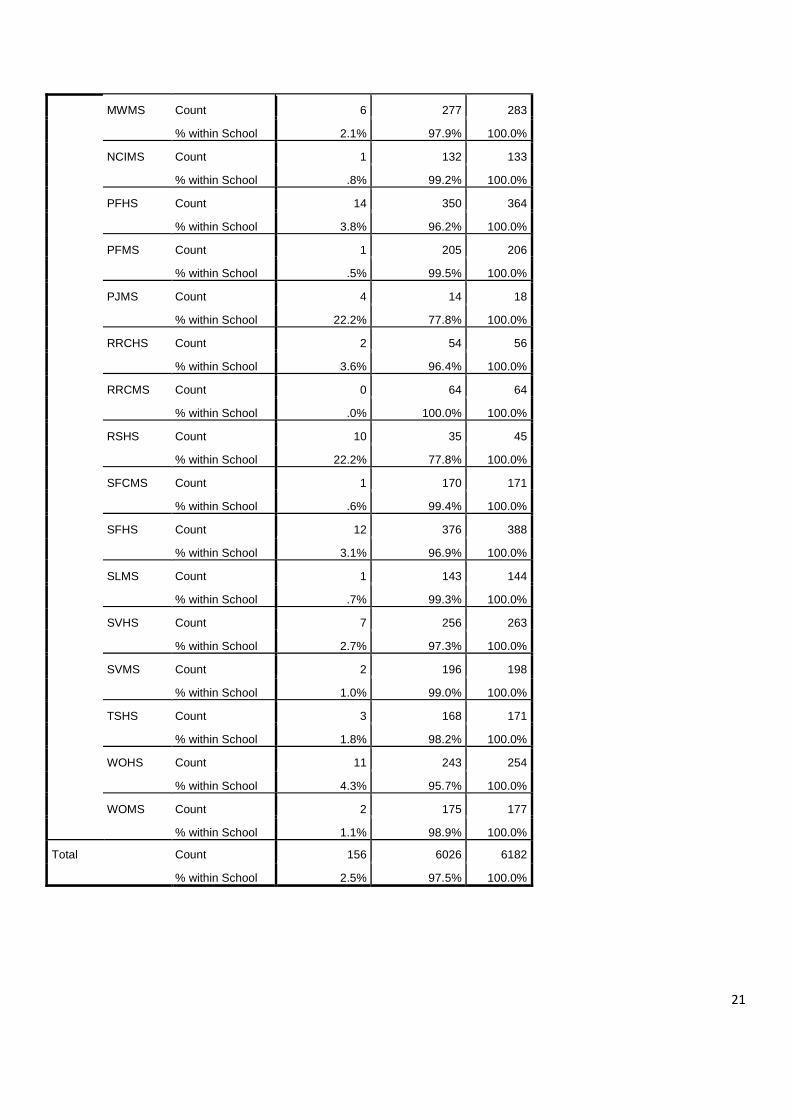
Gang Involvement and Experience with Gun Violence: Breakdown by School
The following tables show how students at each school answered the pre-survey questions about gang
involvement and experiences with gun violence. Each table represents a different question item from the pre-
survey. The rows within the table show how students within each school answered the question. The table
includes both the raw counts for student responses and the percentages of student responses within each
school. Schools are listed in alphabetical order by row in each table.
Are you a member of a street gang?
Are you a member of a street
gang?
Total yes no
School ACMS Count 4 64 68
% within School 5.9% 94.1% 100.0%
CCEC Count 0 73 73
% within School .0% 100.0% 100.0%
CFHS Count 6 381 387
% within School 1.6% 98.4% 100.0%
DBHS Count 4 236 240
% within School 1.7% 98.3% 100.0%
DBMS Count 2 263 265
% within School .8% 99.2% 100.0%
EESHS Count 8 246 254
% within School 3.1% 96.9% 100.0%
GCHS Count 1 264 265
% within School .4% 99.6% 100.0%
GCMS Count 3 247 250
% within School 1.2% 98.8% 100.0%
HHLSHS Count 0 42 42
% within School .0% 100.0% 100.0%
HMMS Count 2 188 190
% within School 1.1% 98.9% 100.0%
JBHS Count 3 482 485
% within School .6% 99.4% 100.0%
JDC Count 0 14 14
% within School .0% 100.0% 100.0%
JGMS Count 2 186 188
% within School 1.1% 98.9% 100.0%
LCMS Count 4 155 159
% within School 2.5% 97.5% 100.0%

15
LNJMS Count 1 103 104
% within School 1.0% 99.0% 100.0%
MAMS Count 2 184 186
% within School 1.1% 98.9% 100.0%
MHCHS Count 0 88 88
% within School .0% 100.0% 100.0%
MWMS Count 3 280 283
% within School 1.1% 98.9% 100.0%
NCIMS Count 1 131 132
% within School .8% 99.2% 100.0%
PFHS Count 9 355 364
% within School 2.5% 97.5% 100.0%
PFMS Count 1 208 209
% within School .5% 99.5% 100.0%
PJMS Count 4 13 17
% within School 23.5% 76.5% 100.0%
RRCHS Count 0 56 56
% within School .0% 100.0% 100.0%
RRCMS Count 0 63 63
% within School .0% 100.0% 100.0%
RSHS Count 9 33 42
% within School 21.4% 78.6% 100.0%
SFCMS Count 1 170 171
% within School .6% 99.4% 100.0%
SFHS Count 7 380 387
% within School 1.8% 98.2% 100.0%
SLMS Count 2 145 147
% within School 1.4% 98.6% 100.0%
SVHS Count 6 255 261
% within School 2.3% 97.7% 100.0%
SVMS Count 1 199 200
% within School .5% 99.5% 100.0%
TSHS Count 2 170 172
% within School 1.2% 98.8% 100.0%
WOHS Count 8 245 253
% within School 3.2% 96.8% 100.0%
WOMS Count 1 174 175
% within School .6% 99.4% 100.0%
16
Total Count 97 6093 6190
% within School 1.6% 98.4% 100.0%
Has anyone every threatened you with a gun or shot at you?
Has anyone every threatened you
with a gun or shot at you?
Total yes no
School ACMS Count 3 65 68
% within School 4.4% 95.6% 100.0%
CCEC Count 14 59 73
% within School 19.2% 80.8% 100.0%
CFHS Count 43 343 386
% within School 11.1% 88.9% 100.0%
DBHS Count 39 202 241
% within School 16.2% 83.8% 100.0%
DBMS Count 26 237 263
% within School 9.9% 90.1% 100.0%
EESHS Count 44 211 255
% within School 17.3% 82.7% 100.0%
GCHS Count 26 239 265
% within School 9.8% 90.2% 100.0%
GCMS Count 25 223 248
% within School 10.1% 89.9% 100.0%
HHLSHS Count 2 40 42
% within School 4.8% 95.2% 100.0%
HMMS Count 19 172 191
% within School 9.9% 90.1% 100.0%
JBHS Count 67 418 485
% within School 13.8% 86.2% 100.0%
JDC Count 4 10 14
% within School 28.6% 71.4% 100.0%
JGMS Count 7 179 186
% within School 3.8% 96.2% 100.0%
LCMS Count 23 134 157
% within School 14.6% 85.4% 100.0%
LNJMS Count 9 98 107
% within School 8.4% 91.6% 100.0%
MAMS Count 16 172 188

17
% within School 8.5% 91.5% 100.0%
MHCHS Count 3 85 88
% within School 3.4% 96.6% 100.0%
MWMS Count 27 255 282
% within School 9.6% 90.4% 100.0%
NCIMS Count 7 126 133
% within School 5.3% 94.7% 100.0%
PFHS Count 41 323 364
% within School 11.3% 88.7% 100.0%
PFMS Count 5 204 209
% within School 2.4% 97.6% 100.0%
PJMS Count 11 7 18
% within School 61.1% 38.9% 100.0%
RRCHS Count 6 50 56
% within School 10.7% 89.3% 100.0%
RRCMS Count 5 59 64
% within School 7.8% 92.2% 100.0%
RSHS Count 23 22 45
% within School 51.1% 48.9% 100.0%
SFCMS Count 11 159 170
% within School 6.5% 93.5% 100.0%
SFHS Count 58 329 387
% within School 15.0% 85.0% 100.0%
SLMS Count 17 129 146
% within School 11.6% 88.4% 100.0%
SVHS Count 46 218 264
% within School 17.4% 82.6% 100.0%
SVMS Count 19 181 200
% within School 9.5% 90.5% 100.0%
TSHS Count 23 149 172
% within School 13.4% 86.6% 100.0%
WOHS Count 38 218 256
% within School 14.8% 85.2% 100.0%
WOMS Count 13 164 177
% within School 7.3% 92.7% 100.0%
Total Count 720 5480 6200
% within School 11.6% 88.4% 100.0%
18
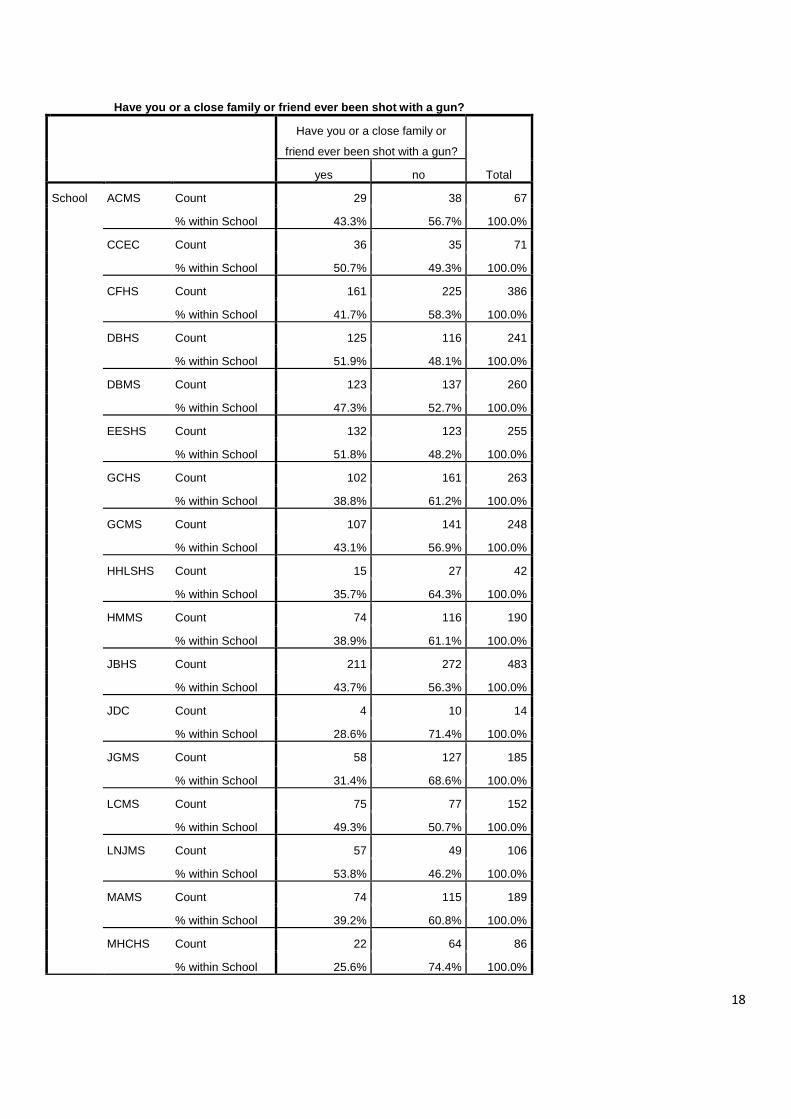
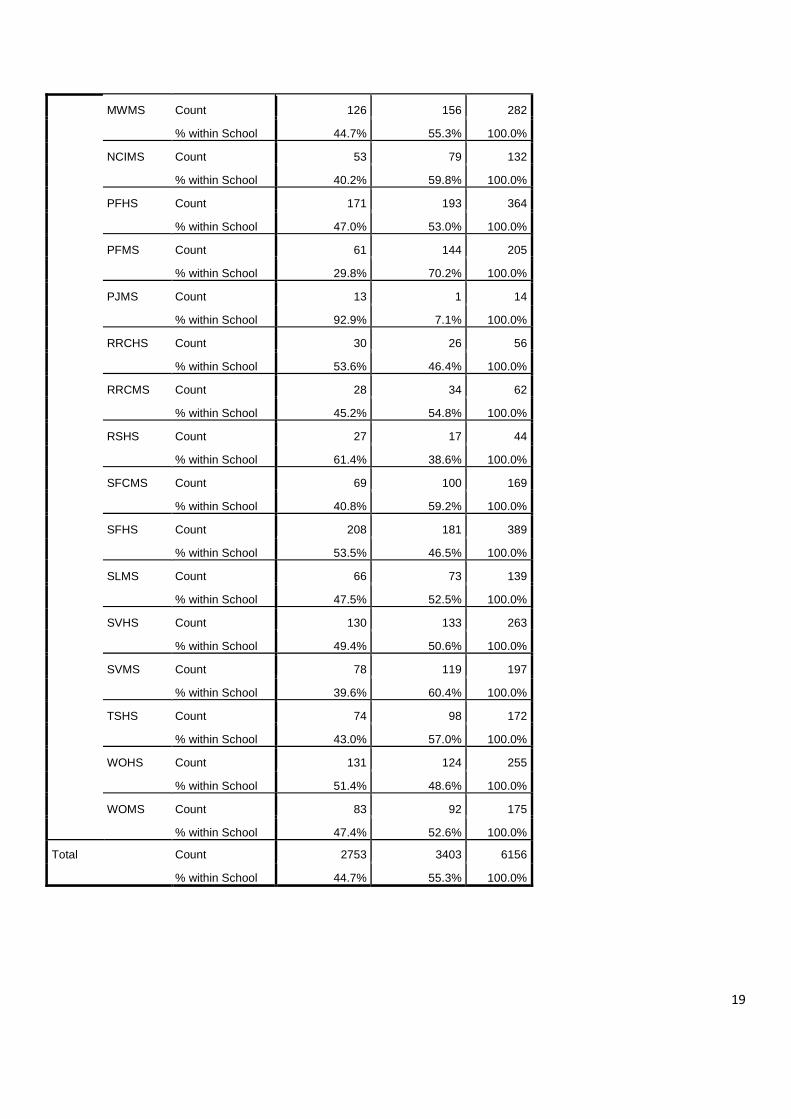
Have you or a close family or friend ever been shot with a gun?
Have you or a close family or
friend ever been shot with a gun?
Total yes no
School ACMS Count 29 38 67
% within School 43.3% 56.7% 100.0%
CCEC Count 36 35 71
% within School 50.7% 49.3% 100.0%
CFHS Count 161 225 386
% within School 41.7% 58.3% 100.0%
DBHS Count 125 116 241
% within School 51.9% 48.1% 100.0%
DBMS Count 123 137 260
% within School 47.3% 52.7% 100.0%
EESHS Count 132 123 255
% within School 51.8% 48.2% 100.0%
GCHS Count 102 161 263
% within School 38.8% 61.2% 100.0%
GCMS Count 107 141 248
% within School 43.1% 56.9% 100.0%
HHLSHS Count 15 27 42
% within School 35.7% 64.3% 100.0%
HMMS Count 74 116 190
% within School 38.9% 61.1% 100.0%
JBHS Count 211 272 483
% within School 43.7% 56.3% 100.0%
JDC Count 4 10 14
% within School 28.6% 71.4% 100.0%
JGMS Count 58 127 185
% within School 31.4% 68.6% 100.0%
LCMS Count 75 77 152
% within School 49.3% 50.7% 100.0%
LNJMS Count 57 49 106
% within School 53.8% 46.2% 100.0%
MAMS Count 74 115 189
% within School 39.2% 60.8% 100.0%
MHCHS Count 22 64 86
% within School 25.6% 74.4% 100.0%
19
MWMS Count 126 156 282
% within School 44.7% 55.3% 100.0%
NCIMS Count 53 79 132
% within School 40.2% 59.8% 100.0%
PFHS Count 171 193 364
% within School 47.0% 53.0% 100.0%
PFMS Count 61 144 205
% within School 29.8% 70.2% 100.0%
PJMS Count 13 1 14
% within School 92.9% 7.1% 100.0%
RRCHS Count 30 26 56
% within School 53.6% 46.4% 100.0%
RRCMS Count 28 34 62
% within School 45.2% 54.8% 100.0%
RSHS Count 27 17 44
% within School 61.4% 38.6% 100.0%
SFCMS Count 69 100 169
% within School 40.8% 59.2% 100.0%
SFHS Count 208 181 389
% within School 53.5% 46.5% 100.0%
SLMS Count 66 73 139
% within School 47.5% 52.5% 100.0%
SVHS Count 130 133 263
% within School 49.4% 50.6% 100.0%
SVMS Count 78 119 197
% within School 39.6% 60.4% 100.0%
TSHS Count 74 98 172
% within School 43.0% 57.0% 100.0%
WOHS Count 131 124 255
% within School 51.4% 48.6% 100.0%
WOMS Count 83 92 175
% within School 47.4% 52.6% 100.0%
Total Count 2753 3403 6156
% within School 44.7% 55.3% 100.0%

20
Have you ever threatened anyone with a gun or shot at anyone?
Have you ever threatened anyone
with a gun or shot at anyone?
Total yes no
School ACMS Count 0 68 68
% within School .0% 100.0% 100.0%
CCEC Count 2 68 70
% within School 2.9% 97.1% 100.0%
CFHS Count 5 382 387
% within School 1.3% 98.7% 100.0%
DBHS Count 14 225 239
% within School 5.9% 94.1% 100.0%
DBMS Count 8 255 263
% within School 3.0% 97.0% 100.0%
EESHS Count 9 243 252
% within School 3.6% 96.4% 100.0%
GCHS Count 10 255 265
% within School 3.8% 96.2% 100.0%
GCMS Count 5 243 248
% within School 2.0% 98.0% 100.0%
HHLSHS Count 1 41 42
% within School 2.4% 97.6% 100.0%
HMMS Count 0 191 191
% within School .0% 100.0% 100.0%
JBHS Count 10 474 484
% within School 2.1% 97.9% 100.0%
JDC Count 2 12 14
% within School 14.3% 85.7% 100.0%
JGMS Count 4 182 186
% within School 2.2% 97.8% 100.0%
LCMS Count 4 151 155
% within School 2.6% 97.4% 100.0%
LNJMS Count 2 104 106
% within School 1.9% 98.1% 100.0%
MAMS Count 3 186 189
% within School 1.6% 98.4% 100.0%
MHCHS Count 0 88 88
% within School .0% 100.0% 100.0%
21
MWMS Count 6 277 283
% within School 2.1% 97.9% 100.0%
NCIMS Count 1 132 133
% within School .8% 99.2% 100.0%
PFHS Count 14 350 364
% within School 3.8% 96.2% 100.0%
PFMS Count 1 205 206
% within School .5% 99.5% 100.0%
PJMS Count 4 14 18
% within School 22.2% 77.8% 100.0%
RRCHS Count 2 54 56
% within School 3.6% 96.4% 100.0%
RRCMS Count 0 64 64
% within School .0% 100.0% 100.0%
RSHS Count 10 35 45
% within School 22.2% 77.8% 100.0%
SFCMS Count 1 170 171
% within School .6% 99.4% 100.0%
SFHS Count 12 376 388
% within School 3.1% 96.9% 100.0%
SLMS Count 1 143 144
% within School .7% 99.3% 100.0%
SVHS Count 7 256 263
% within School 2.7% 97.3% 100.0%
SVMS Count 2 196 198
% within School 1.0% 99.0% 100.0%
TSHS Count 3 168 171
% within School 1.8% 98.2% 100.0%
WOHS Count 11 243 254
% within School 4.3% 95.7% 100.0%
WOMS Count 2 175 177
% within School 1.1% 98.9% 100.0%
Total Count 156 6026 6182
% within School 2.5% 97.5% 100.0%
22
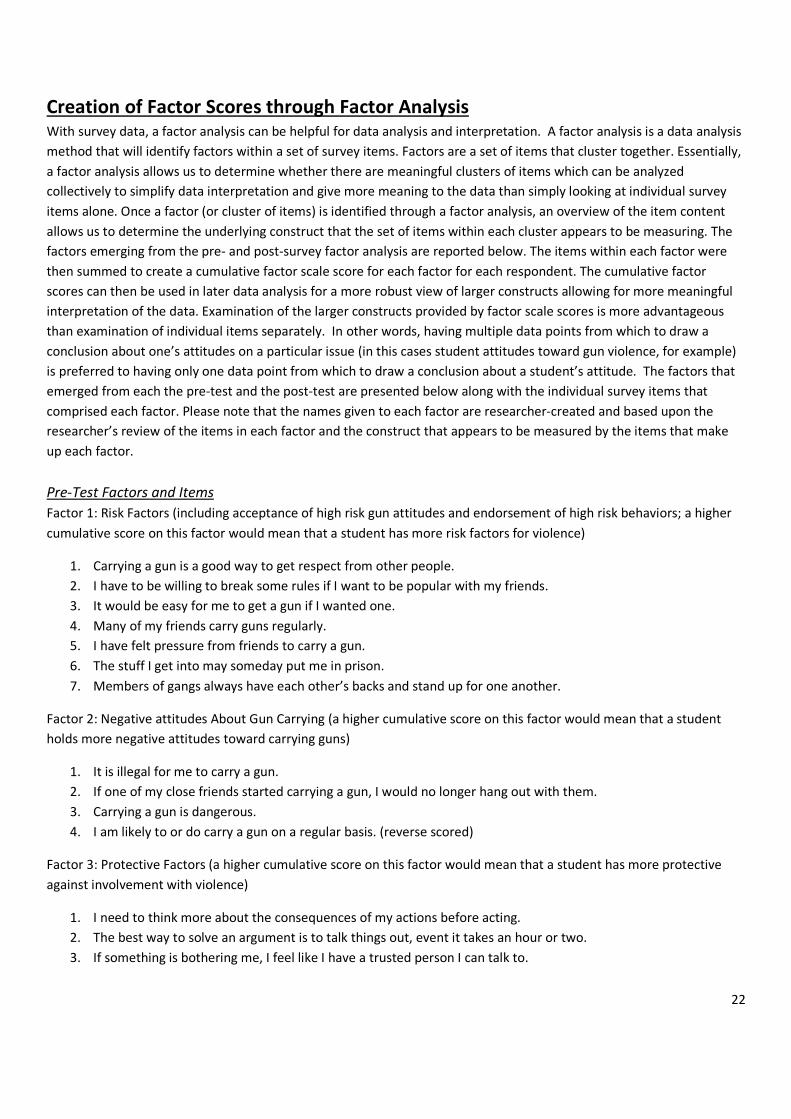
Creation of Factor Scores through Factor Analysis
With survey data, a factor analysis can be helpful for data analysis and interpretation. A factor analysis is a data analysis
method that will identify factors within a set of survey items. Factors are a set of items that cluster together. Essentially,
a factor analysis allows us to determine whether there are meaningful clusters of items which can be analyzed
collectively to simplify data interpretation and give more meaning to the data than simply looking at individual survey
items alone. Once a factor (or cluster of items) is identified through a factor analysis, an overview of the item content
allows us to determine the underlying construct that the set of items within each cluster appears to be measuring. The
factors emerging from the pre- and post-survey factor analysis are reported below. The items within each factor were
then summed to create a cumulative factor scale score for each factor for each respondent. The cumulative factor
scores can then be used in later data analysis for a more robust view of larger constructs allowing for more meaningful
interpretation of the data. Examination of the larger constructs provided by factor scale scores is more advantageous
than examination of individual items separately. In other words, having multiple data points from which to draw a
conclusion about one’s attitudes on a particular issue (in this cases student attitudes toward gun violence, for example)
is preferred to having only one data point from which to draw a conclusion about a student’s attitude. The factors that
emerged from each the pre-test and the post-test are presented below along with the individual survey items that
comprised each factor. Please note that the names given to each factor are researcher-created and based upon the
researcher’s review of the items in each factor and the construct that appears to be measured by the items that make
up each factor.
Pre-Test Factors and Items
Factor 1: Risk Factors (including acceptance of high risk gun attitudes and endorsement of high risk behaviors; a higher
cumulative score on this factor would mean that a student has more risk factors for violence)
1. Carrying a gun is a good way to get respect from other people.
2. I have to be willing to break some rules if I want to be popular with my friends.
3. It would be easy for me to get a gun if I wanted one.
4. Many of my friends carry guns regularly.
5. I have felt pressure from friends to carry a gun.
6. The stuff I get into may someday put me in prison.
7. Members of gangs always have each other’s backs and stand up for one another.
Factor 2: Negative attitudes About Gun Carrying (a higher cumulative score on this factor would mean that a student
holds more negative attitudes toward carrying guns)
1. It is illegal for me to carry a gun.
2. If one of my close friends started carrying a gun, I would no longer hang out with them.
3. Carrying a gun is dangerous.
4. I am likely to or do carry a gun on a regular basis. (reverse scored)
Factor 3: Protective Factors (a higher cumulative score on this factor would mean that a student has more protective
against involvement with violence)
1. I need to think more about the consequences of my actions before acting.
2. The best way to solve an argument is to talk things out, event it takes an hour or two.
3. If something is bothering me, I feel like I have a trusted person I can talk to.

23
Factor 4: Perceived self-efficacy to resist peer pressure (a higher cumulative score on this factor, which is comprised of
only item, would mean that student has higher perceived self-efficacy to resist peer pressure)
1. I feel like I know what to do to resist pressure from friends to do something I do not want to do.
Post-Test Factors and Items
Factor 1: Direct Program Impact (a higher cumulative score on this factor would mean that a student reported a greater
positive impact from the program)
1. After this program, I feel like I will be able to make better decisions in my life.
2. After this program, I feel like I know more about the dangers of having a gun.
3. After this program, I learned that I need to think more about the consequences of my actions before acting.
4. The best way to solve an argument is to talk things out, even if it takes an hour or two.
Factor 2: Risk Factors (including acceptance of high risk gun attitudes and endorsement of high risk behaviors; a higher
cumulative score on this factor would mean that a student has more risk factors)
1. I feel like Jamari’s boys will have his back and stand up for him even after he goes to jail for the shooting.
2. Jamari made a good decision when accepted the gun from his friends.
3. Jamari got respect from other people by carrying a gun.
4. I have to be willing to break some rules if I want to be popular with my friends.
5. I sometimes feel like violence is my only way to deal with problems.
Factor 3: Attitudes About Gun Carrying (a higher cumulative score on this factor would mean that a student holds less
favorable attitudes toward carrying guns)
1. It is illegal for me to carry a gun.
2. If one of my close friends started carrying a gun, I would no longer hang out with them.
3. Carrying a gun is dangerous.
Factor 4: Perceived Efficacy to Make Good Decisions/Understanding of Consequences (a higher cumulative score on this
factor would mean that a student has greater understanding of the consequences of actions)
1. Jamari could have made better decisions throughout the video to avoid shooting his sister and going to jail.
2. Being a member of a gang makes it more likely that someone would get in trouble at school or with police.
3. I feel like I know what to do to resist pressure from friends to something I do not want to do.
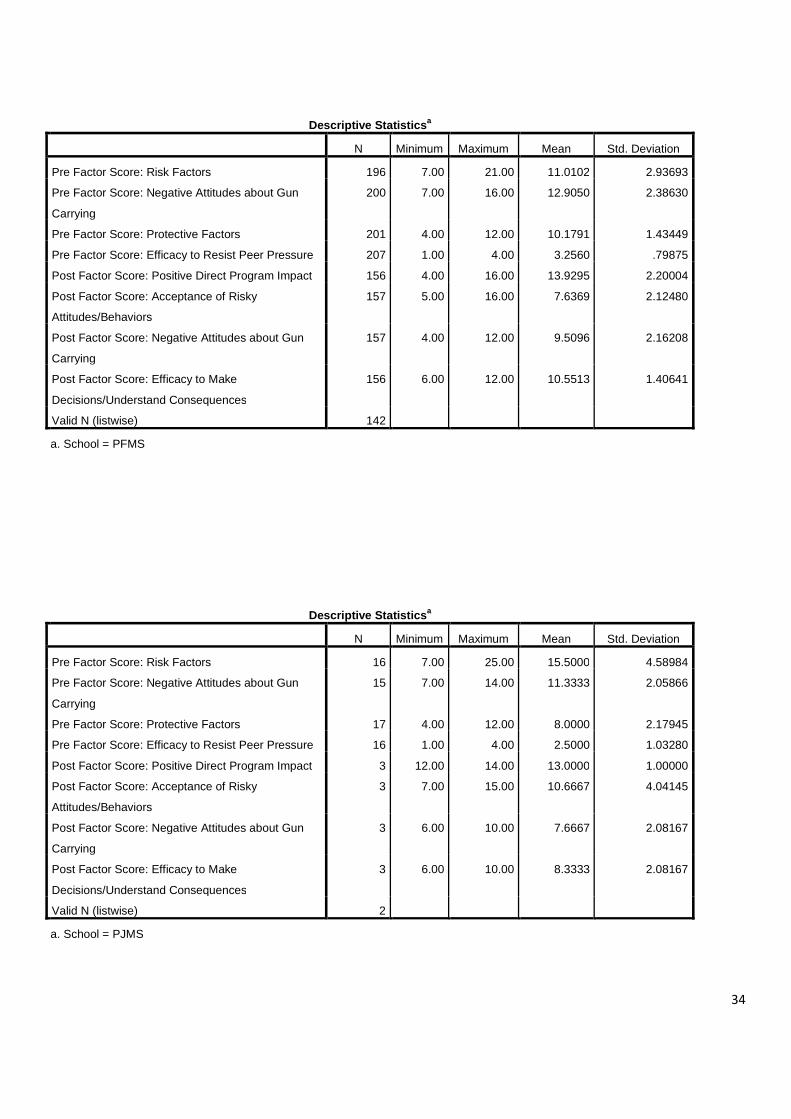
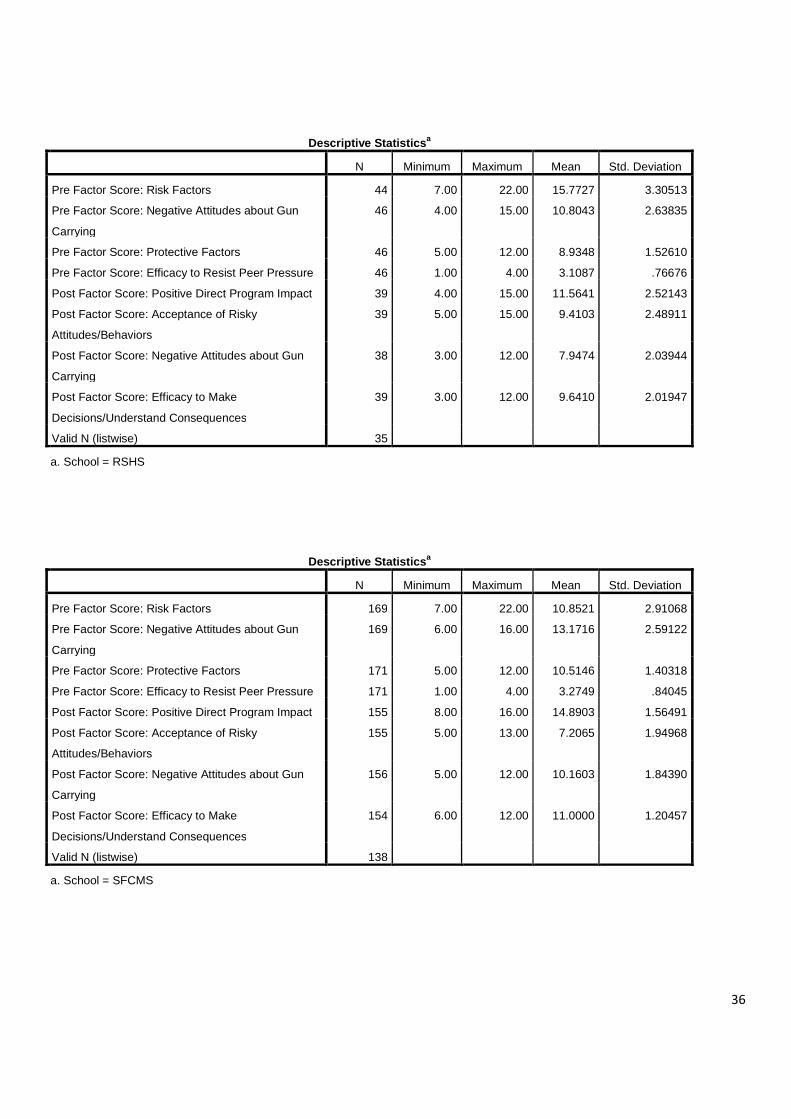
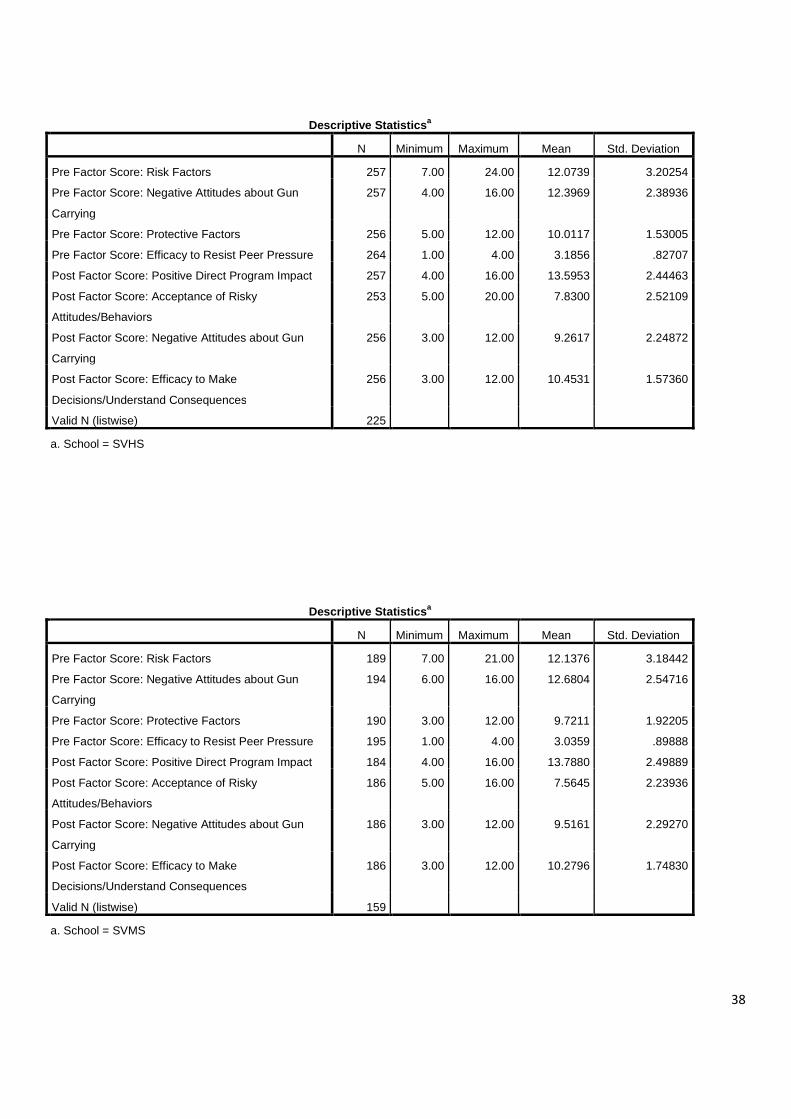
Creation of Factor Scale Scores
The items within each factor were summed together to create a factor scale score. The following table provides the
average factor scale scores, also called the “mean”, for students in the overall sample. For a student’s factor score to be
calculated, a respondent had to have responded to each item that comprises the factor. The total number of students
who answered all items for each factor is found in the column labeled, “N”. The minimum score and maximum scores for
each factor are reported next. The mean (or average) score for each factor is reported next followed by the standard
deviation for each factor score.

24
Descriptive Statistics for Factor Scale Scores
N Minimum Maximum Mean Std. Deviation
Pre Factor 1: Risk Factors 5883 7.00 28.00 11.7899 3.27760
Pre Factor 2: Negative Attitudes About
Gun Carrying
5969 4.00 16.00 12.5254 2.51824
Pre Factor 3: Protective Factors 5978 3.00 12.00 10.0360 1.64364
Pre Factor 4: Resisting Peer Pressure 6088 1.00 4.00 3.2362 .82394
Post Factor 1: Direct Program Impact 5502 4.00 16.00 13.9331 2.25865
Post Factor 2: Risk Factors 5509 5.00 20.00 7.6061 2.38692
Post Factor 3: Negative Attitudes
About Gun Carrying
5534 3.00 12.00 9.4256 2.19074
Post Factor 4: Efficacy to Make Good
Decisions/Understand Consequences
5516 3.00 12.00 10.5587 1.54697
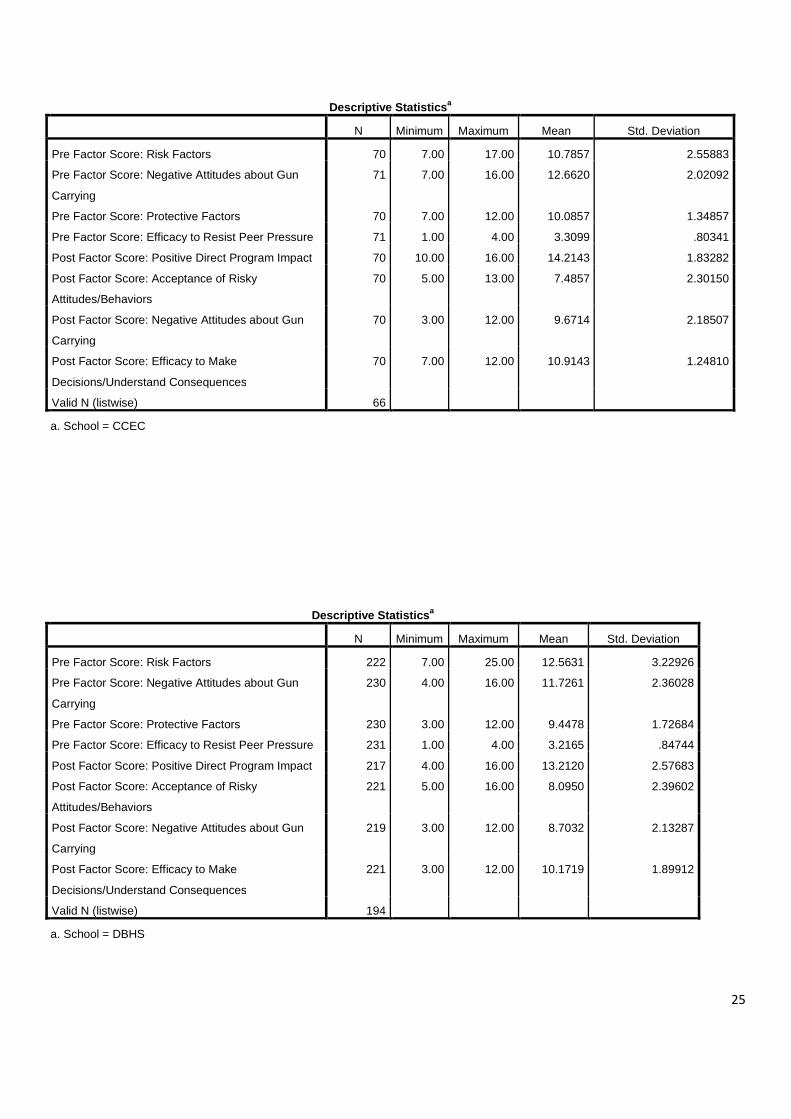
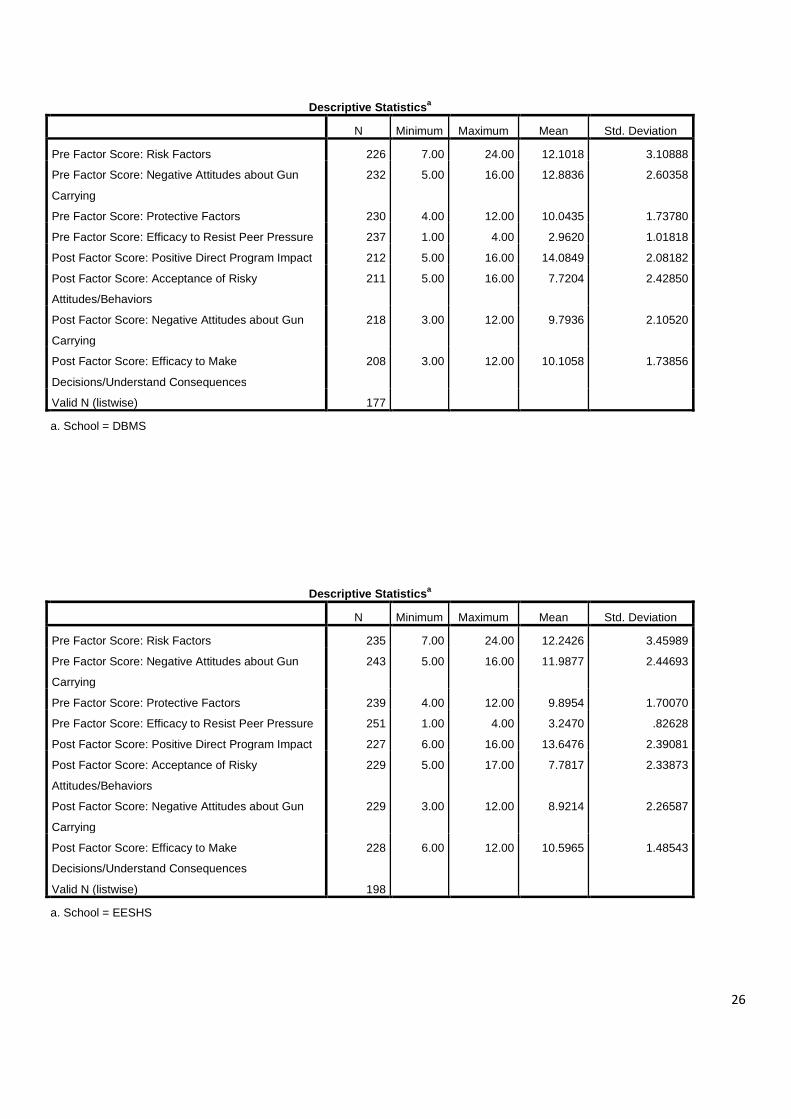
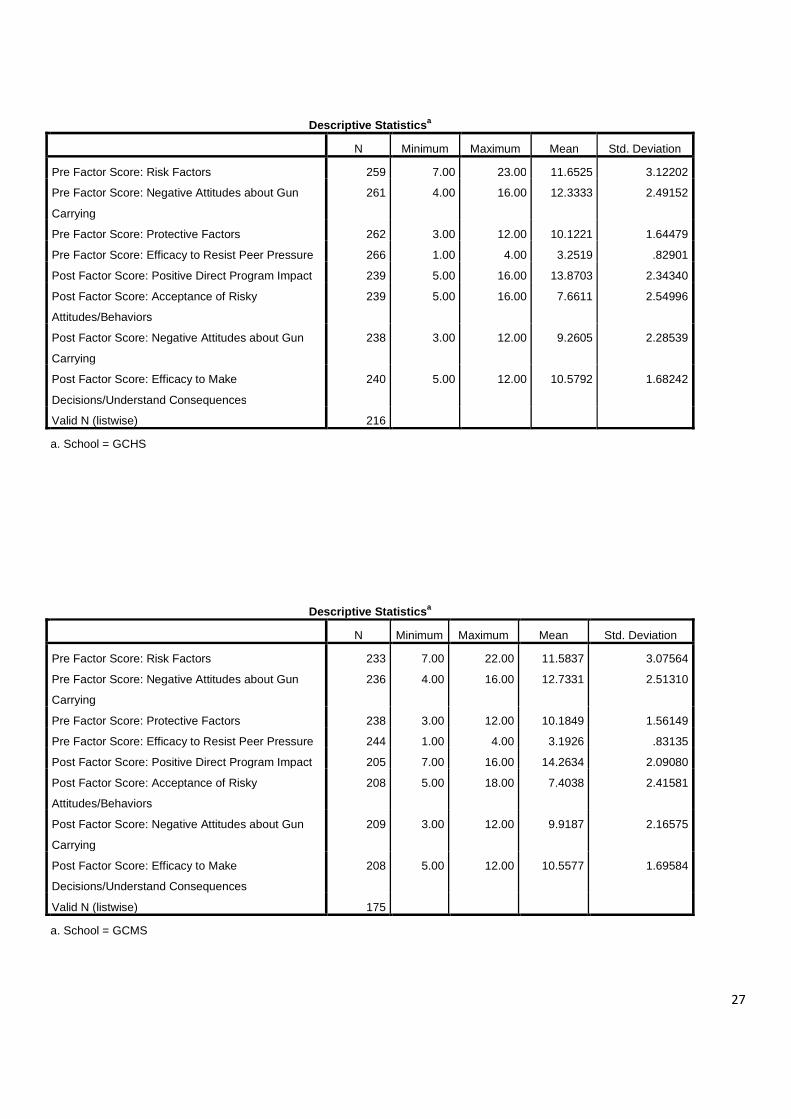
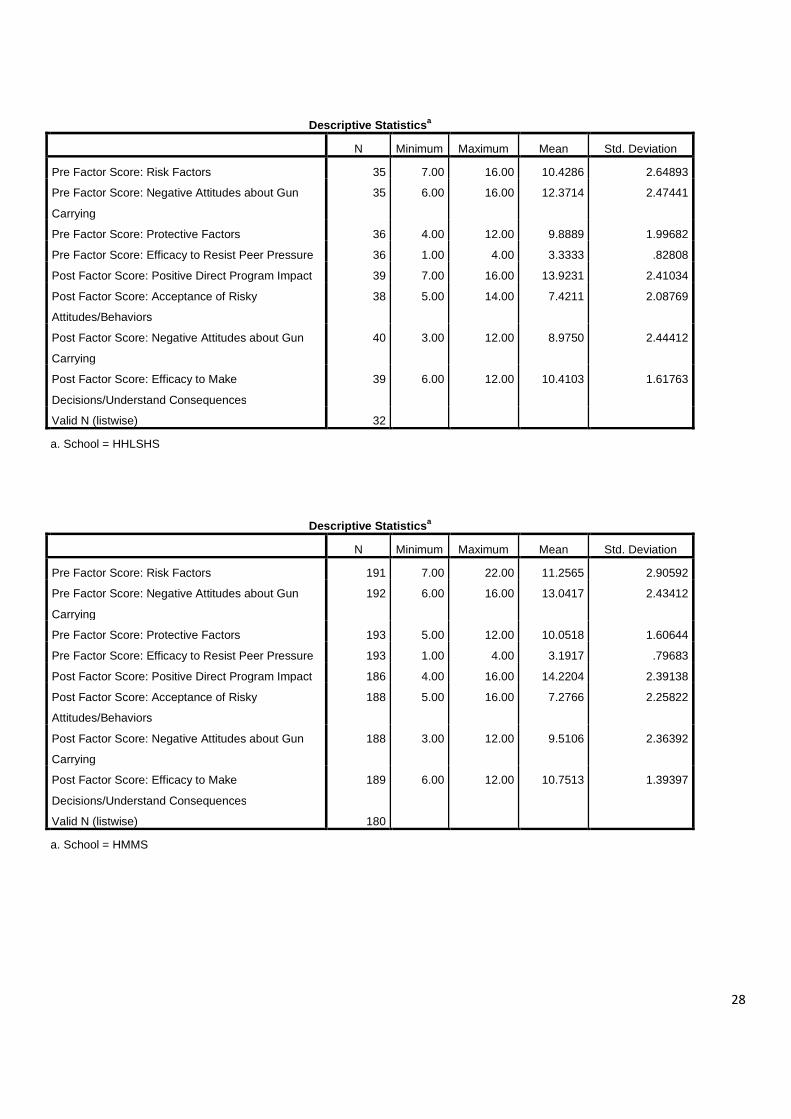
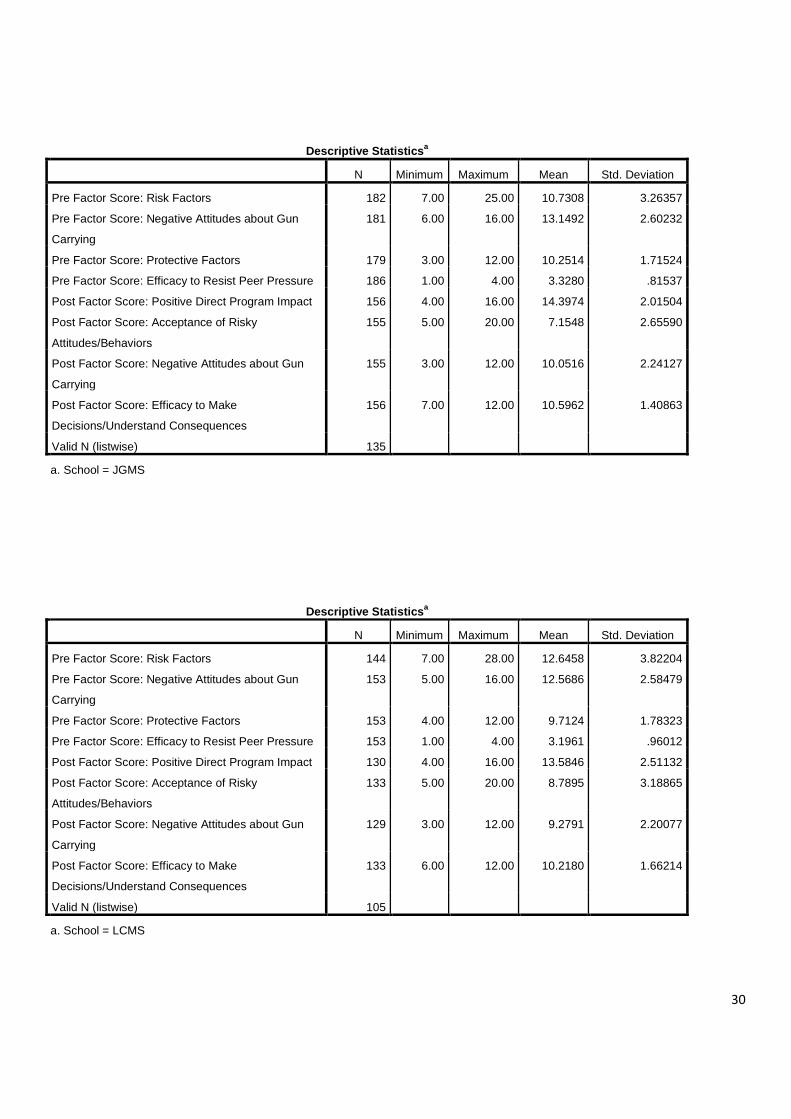
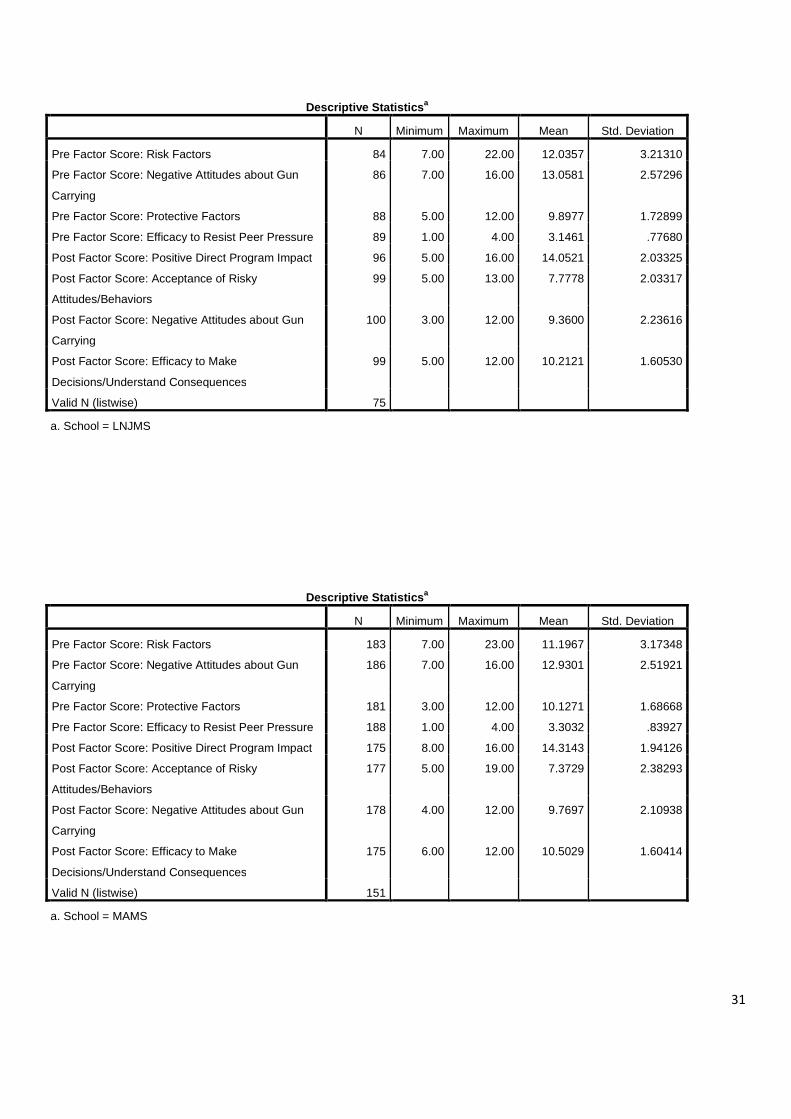
Factor Scale Score Trends by School
Examination of the larger constructs provided by the factor scale scores is more advantageous than examination of
individual items separately. In other words, having multiple data points from which to draw a conclusion about one’s
attitudes on a particular issue is preferred to having only one data point (or one individual survey item) from which to
draw a conclusion. Each table below represents a different school. The rows in each table identify for each factor the
number of students for which a factor scale score could be created (‘N”), the minimum and maximum scores of students
in that school on that particular factor, and the average (or “mean”) score of students in that school for that factors
along with the standard deviation. The tables appear in alphabetical order based on school name. There is a separate
table for each school. The school name for each table appears directly underneath the table.
Descriptive Statisticsa
N Minimum Maximum Mean Std. Deviation
Pre Factor Score: Risk Factors 62 7.00 18.00 12.7097 2.85948
Pre Factor Score: Negative Attitudes about Gun
Carrying
64 7.00 16.00 12.3281 2.55141
Pre Factor Score: Protective Factors 64 5.00 12.00 10.0781 1.56656
Pre Factor Score: Efficacy to Resist Peer Pressure 65 1.00 4.00 3.0923 .74421
Post Factor Score: Positive Direct Program Impact 65 8.00 16.00 13.9538 1.92379
Post Factor Score: Acceptance of Risky
Attitudes/Behaviors
66 5.00 18.00 8.4394 2.53668
Post Factor Score: Negative Attitudes about Gun
Carrying
63 6.00 12.00 9.8095 1.78576
Post Factor Score: Efficacy to Make
Decisions/Understand Consequences
65 7.00 12.00 10.5077 1.30052
Valid N (listwise) 53
a. School = ACMS
25
Descriptive Statisticsa
N Minimum Maximum Mean Std. Deviation
Pre Factor Score: Risk Factors 70 7.00 17.00 10.7857 2.55883
Pre Factor Score: Negative Attitudes about Gun
Carrying
71 7.00 16.00 12.6620 2.02092
Pre Factor Score: Protective Factors 70 7.00 12.00 10.0857 1.34857
Pre Factor Score: Efficacy to Resist Peer Pressure 71 1.00 4.00 3.3099 .80341
Post Factor Score: Positive Direct Program Impact 70 10.00 16.00 14.2143 1.83282
Post Factor Score: Acceptance of Risky
Attitudes/Behaviors
70 5.00 13.00 7.4857 2.30150
Post Factor Score: Negative Attitudes about Gun
Carrying
70 3.00 12.00 9.6714 2.18507
Post Factor Score: Efficacy to Make
Decisions/Understand Consequences
70 7.00 12.00 10.9143 1.24810
Valid N (listwise) 66
a. School = CCEC
Descriptive Statisticsa
N Minimum Maximum Mean Std. Deviation
Pre Factor Score: Risk Factors 222 7.00 25.00 12.5631 3.22926
Pre Factor Score: Negative Attitudes about Gun
Carrying
230 4.00 16.00 11.7261 2.36028
Pre Factor Score: Protective Factors 230 3.00 12.00 9.4478 1.72684
Pre Factor Score: Efficacy to Resist Peer Pressure 231 1.00 4.00 3.2165 .84744
Post Factor Score: Positive Direct Program Impact 217 4.00 16.00 13.2120 2.57683
Post Factor Score: Acceptance of Risky
Attitudes/Behaviors
221 5.00 16.00 8.0950 2.39602
Post Factor Score: Negative Attitudes about Gun
Carrying
219 3.00 12.00 8.7032 2.13287
Post Factor Score: Efficacy to Make
Decisions/Understand Consequences
221 3.00 12.00 10.1719 1.89912
Valid N (listwise) 194
a. School = DBHS
26
Descriptive Statisticsa
N Minimum Maximum Mean Std. Deviation
Pre Factor Score: Risk Factors 226 7.00 24.00 12.1018 3.10888
Pre Factor Score: Negative Attitudes about Gun
Carrying
232 5.00 16.00 12.8836 2.60358
Pre Factor Score: Protective Factors 230 4.00 12.00 10.0435 1.73780
Pre Factor Score: Efficacy to Resist Peer Pressure 237 1.00 4.00 2.9620 1.01818
Post Factor Score: Positive Direct Program Impact 212 5.00 16.00 14.0849 2.08182
Post Factor Score: Acceptance of Risky
Attitudes/Behaviors
211 5.00 16.00 7.7204 2.42850
Post Factor Score: Negative Attitudes about Gun
Carrying
218 3.00 12.00 9.7936 2.10520
Post Factor Score: Efficacy to Make
Decisions/Understand Consequences
208 3.00 12.00 10.1058 1.73856
Valid N (listwise) 177
a. School = DBMS
Descriptive Statisticsa
N Minimum Maximum Mean Std. Deviation
Pre Factor Score: Risk Factors 235 7.00 24.00 12.2426 3.45989
Pre Factor Score: Negative Attitudes about Gun
Carrying
243 5.00 16.00 11.9877 2.44693
Pre Factor Score: Protective Factors 239 4.00 12.00 9.8954 1.70070
Pre Factor Score: Efficacy to Resist Peer Pressure 251 1.00 4.00 3.2470 .82628
Post Factor Score: Positive Direct Program Impact 227 6.00 16.00 13.6476 2.39081
Post Factor Score: Acceptance of Risky
Attitudes/Behaviors
229 5.00 17.00 7.7817 2.33873
Post Factor Score: Negative Attitudes about Gun
Carrying
229 3.00 12.00 8.9214 2.26587
Post Factor Score: Efficacy to Make
Decisions/Understand Consequences
228 6.00 12.00 10.5965 1.48543
Valid N (listwise) 198
a. School = EESHS
27
Descriptive Statisticsa
N Minimum Maximum Mean Std. Deviation
Pre Factor Score: Risk Factors 259 7.00 23.00 11.6525 3.12202
Pre Factor Score: Negative Attitudes about Gun
Carrying
261 4.00 16.00 12.3333 2.49152
Pre Factor Score: Protective Factors 262 3.00 12.00 10.1221 1.64479
Pre Factor Score: Efficacy to Resist Peer Pressure 266 1.00 4.00 3.2519 .82901
Post Factor Score: Positive Direct Program Impact 239 5.00 16.00 13.8703 2.34340
Post Factor Score: Acceptance of Risky
Attitudes/Behaviors
239 5.00 16.00 7.6611 2.54996
Post Factor Score: Negative Attitudes about Gun
Carrying
238 3.00 12.00 9.2605 2.28539
Post Factor Score: Efficacy to Make
Decisions/Understand Consequences
240 5.00 12.00 10.5792 1.68242
Valid N (listwise) 216
a. School = GCHS
Descriptive Statisticsa
N Minimum Maximum Mean Std. Deviation
Pre Factor Score: Risk Factors 233 7.00 22.00 11.5837 3.07564
Pre Factor Score: Negative Attitudes about Gun
Carrying
236 4.00 16.00 12.7331 2.51310
Pre Factor Score: Protective Factors 238 3.00 12.00 10.1849 1.56149
Pre Factor Score: Efficacy to Resist Peer Pressure 244 1.00 4.00 3.1926 .83135
Post Factor Score: Positive Direct Program Impact 205 7.00 16.00 14.2634 2.09080
Post Factor Score: Acceptance of Risky
Attitudes/Behaviors
208 5.00 18.00 7.4038 2.41581
Post Factor Score: Negative Attitudes about Gun
Carrying
209 3.00 12.00 9.9187 2.16575
Post Factor Score: Efficacy to Make
Decisions/Understand Consequences
208 5.00 12.00 10.5577 1.69584
Valid N (listwise) 175
a. School = GCMS
28
Descriptive Statisticsa
N Minimum Maximum Mean Std. Deviation
Pre Factor Score: Risk Factors 35 7.00 16.00 10.4286 2.64893
Pre Factor Score: Negative Attitudes about Gun
Carrying
35 6.00 16.00 12.3714 2.47441
Pre Factor Score: Protective Factors 36 4.00 12.00 9.8889 1.99682
Pre Factor Score: Efficacy to Resist Peer Pressure 36 1.00 4.00 3.3333 .82808
Post Factor Score: Positive Direct Program Impact 39 7.00 16.00 13.9231 2.41034
Post Factor Score: Acceptance of Risky
Attitudes/Behaviors
38 5.00 14.00 7.4211 2.08769
Post Factor Score: Negative Attitudes about Gun
Carrying
40 3.00 12.00 8.9750 2.44412
Post Factor Score: Efficacy to Make
Decisions/Understand Consequences
39 6.00 12.00 10.4103 1.61763
Valid N (listwise) 32
a. School = HHLSHS
Descriptive Statisticsa
N Minimum Maximum Mean Std. Deviation
Pre Factor Score: Risk Factors 191 7.00 22.00 11.2565 2.90592
Pre Factor Score: Negative Attitudes about Gun
Carrying
192 6.00 16.00 13.0417 2.43412
Pre Factor Score: Protective Factors 193 5.00 12.00 10.0518 1.60644
Pre Factor Score: Efficacy to Resist Peer Pressure 193 1.00 4.00 3.1917 .79683
Post Factor Score: Positive Direct Program Impact 186 4.00 16.00 14.2204 2.39138
Post Factor Score: Acceptance of Risky
Attitudes/Behaviors
188 5.00 16.00 7.2766 2.25822
Post Factor Score: Negative Attitudes about Gun
Carrying
188 3.00 12.00 9.5106 2.36392
Post Factor Score: Efficacy to Make
Decisions/Understand Consequences
189 6.00 12.00 10.7513 1.39397
Valid N (listwise) 180
a. School = HMMS

29
Descriptive Statisticsa
N Minimum Maximum Mean Std. Deviation
Pre Factor Score: Risk Factors 474 7.00 25.00 11.4262 3.05133
Pre Factor Score: Negative Attitudes about Gun
Carrying
473 4.00 16.00 12.3531 2.51438
Pre Factor Score: Protective Factors 474 3.00 12.00 10.1414 1.53158
Pre Factor Score: Efficacy to Resist Peer Pressure 478 1.00 4.00 3.4059 .69930
Post Factor Score: Positive Direct Program Impact 461 4.00 16.00 13.9805 2.29405
Post Factor Score: Acceptance of Risky
Attitudes/Behaviors
462 5.00 20.00 7.2900 2.13286
Post Factor Score: Negative Attitudes about Gun
Carrying
462 3.00 12.00 9.2922 2.22369
Post Factor Score: Efficacy to Make
Decisions/Understand Consequences
460 3.00 12.00 10.7413 1.47323
Valid N (listwise) 433
a. School = JBHS
Descriptive Statisticsa
N Minimum Maximum Mean Std. Deviation
Pre Factor Score: Risk Factors 14 7.00 19.00 15.4286 3.95580
Pre Factor Score: Negative Attitudes about Gun
Carrying
12 9.00 16.00 11.6667 2.22928
Pre Factor Score: Protective Factors 14 6.00 12.00 9.5714 2.06488
Pre Factor Score: Efficacy to Resist Peer Pressure 14 2.00 4.00 3.4286 .75593
Post Factor Score: Positive Direct Program Impact 14 12.00 16.00 14.1429 1.29241
Post Factor Score: Acceptance of Risky
Attitudes/Behaviors
14 6.00 10.00 9.0000 1.35873
Post Factor Score: Negative Attitudes about Gun
Carrying
14 7.00 12.00 8.8571 1.70326
Post Factor Score: Efficacy to Make
Decisions/Understand Consequences
14 7.00 12.00 10.0000 1.56893
Valid N (listwise) 12
a. School = JDC
30
Descriptive Statisticsa
N Minimum Maximum Mean Std. Deviation
Pre Factor Score: Risk Factors 182 7.00 25.00 10.7308 3.26357
Pre Factor Score: Negative Attitudes about Gun
Carrying
181 6.00 16.00 13.1492 2.60232
Pre Factor Score: Protective Factors 179 3.00 12.00 10.2514 1.71524
Pre Factor Score: Efficacy to Resist Peer Pressure 186 1.00 4.00 3.3280 .81537
Post Factor Score: Positive Direct Program Impact 156 4.00 16.00 14.3974 2.01504
Post Factor Score: Acceptance of Risky
Attitudes/Behaviors
155 5.00 20.00 7.1548 2.65590
Post Factor Score: Negative Attitudes about Gun
Carrying
155 3.00 12.00 10.0516 2.24127
Post Factor Score: Efficacy to Make
Decisions/Understand Consequences
156 7.00 12.00 10.5962 1.40863
Valid N (listwise) 135
a. School = JGMS
Descriptive Statisticsa
N Minimum Maximum Mean Std. Deviation
Pre Factor Score: Risk Factors 144 7.00 28.00 12.6458 3.82204
Pre Factor Score: Negative Attitudes about Gun
Carrying
153 5.00 16.00 12.5686 2.58479
Pre Factor Score: Protective Factors 153 4.00 12.00 9.7124 1.78323
Pre Factor Score: Efficacy to Resist Peer Pressure 153 1.00 4.00 3.1961 .96012
Post Factor Score: Positive Direct Program Impact 130 4.00 16.00 13.5846 2.51132
Post Factor Score: Acceptance of Risky
Attitudes/Behaviors
133 5.00 20.00 8.7895 3.18865
Post Factor Score: Negative Attitudes about Gun
Carrying
129 3.00 12.00 9.2791 2.20077
Post Factor Score: Efficacy to Make
Decisions/Understand Consequences
133 6.00 12.00 10.2180 1.66214
Valid N (listwise) 105
a. School = LCMS
31
Descriptive Statisticsa
N Minimum Maximum Mean Std. Deviation
Pre Factor Score: Risk Factors 84 7.00 22.00 12.0357 3.21310
Pre Factor Score: Negative Attitudes about Gun
Carrying
86 7.00 16.00 13.0581 2.57296
Pre Factor Score: Protective Factors 88 5.00 12.00 9.8977 1.72899
Pre Factor Score: Efficacy to Resist Peer Pressure 89 1.00 4.00 3.1461 .77680
Post Factor Score: Positive Direct Program Impact 96 5.00 16.00 14.0521 2.03325
Post Factor Score: Acceptance of Risky
Attitudes/Behaviors
99 5.00 13.00 7.7778 2.03317
Post Factor Score: Negative Attitudes about Gun
Carrying
100 3.00 12.00 9.3600 2.23616
Post Factor Score: Efficacy to Make
Decisions/Understand Consequences
99 5.00 12.00 10.2121 1.60530
Valid N (listwise) 75
a. School = LNJMS
Descriptive Statisticsa
N Minimum Maximum Mean Std. Deviation
Pre Factor Score: Risk Factors 183 7.00 23.00 11.1967 3.17348
Pre Factor Score: Negative Attitudes about Gun
Carrying
186 7.00 16.00 12.9301 2.51921
Pre Factor Score: Protective Factors 181 3.00 12.00 10.1271 1.68668
Pre Factor Score: Efficacy to Resist Peer Pressure 188 1.00 4.00 3.3032 .83927
Post Factor Score: Positive Direct Program Impact 175 8.00 16.00 14.3143 1.94126
Post Factor Score: Acceptance of Risky
Attitudes/Behaviors
177 5.00 19.00 7.3729 2.38293
Post Factor Score: Negative Attitudes about Gun
Carrying
178 4.00 12.00 9.7697 2.10938
Post Factor Score: Efficacy to Make
Decisions/Understand Consequences
175 6.00 12.00 10.5029 1.60414
Valid N (listwise) 151
a. School = MAMS

32
Descriptive Statisticsa
N Minimum Maximum Mean Std. Deviation
Pre Factor Score: Risk Factors 82 7.00 20.00 11.0610 2.58365
Pre Factor Score: Negative Attitudes about Gun
Carrying
83 7.00 16.00 12.3133 2.33702
Pre Factor Score: Protective Factors 85 4.00 12.00 9.7529 1.56529
Pre Factor Score: Efficacy to Resist Peer Pressure 86 2.00 4.00 3.3837 .57739
Post Factor Score: Positive Direct Program Impact 88 4.00 16.00 13.5568 2.21727
Post Factor Score: Acceptance of Risky
Attitudes/Behaviors
87 5.00 12.00 7.4138 1.93229
Post Factor Score: Negative Attitudes about Gun
Carrying
87 3.00 12.00 9.2529 2.14161
Post Factor Score: Efficacy to Make
Decisions/Understand Consequences
88 7.00 12.00 10.6591 1.21188
Valid N (listwise) 80
a. School = MHCHS
Descriptive Statisticsa
N Minimum Maximum Mean Std. Deviation
Pre Factor Score: Risk Factors 269 7.00 22.00 11.5279 3.20159
Pre Factor Score: Negative Attitudes about Gun
Carrying
272 5.00 16.00 12.7684 2.81562
Pre Factor Score: Protective Factors 274 3.00 12.00 10.3796 1.54366
Pre Factor Score: Efficacy to Resist Peer Pressure 278 1.00 4.00 3.2410 .80802
Post Factor Score: Positive Direct Program Impact 199 8.00 16.00 14.5578 1.85468
Post Factor Score: Acceptance of Risky
Attitudes/Behaviors
198 5.00 15.00 7.1717 2.18690
Post Factor Score: Negative Attitudes about Gun
Carrying
203 3.00 12.00 9.8571 2.11414
Post Factor Score: Efficacy to Make
Decisions/Understand Consequences
200 3.00 12.00 10.7500 1.60636
Valid N (listwise) 182
a. School = MWMS

33
Descriptive Statisticsa
N Minimum Maximum Mean Std. Deviation
Pre Factor Score: Risk Factors 129 7.00 22.00 11.3953 3.02443
Pre Factor Score: Negative Attitudes about Gun
Carrying
128 6.00 16.00 12.6719 2.72957
Pre Factor Score: Protective Factors 129 3.00 12.00 10.2248 1.76883
Pre Factor Score: Efficacy to Resist Peer Pressure 132 1.00 4.00 3.1970 .89476
Post Factor Score: Positive Direct Program Impact 134 6.00 16.00 13.9701 2.13788
Post Factor Score: Acceptance of Risky
Attitudes/Behaviors
134 5.00 15.00 7.8507 2.24616
Post Factor Score: Negative Attitudes about Gun
Carrying
135 4.00 12.00 9.2963 2.26615
Post Factor Score: Efficacy to Make
Decisions/Understand Consequences
134 6.00 12.00 10.3731 1.41778
Valid N (listwise) 119
a. School = NCIMS
Descriptive Statisticsa
N Minimum Maximum Mean Std. Deviation
Pre Factor Score: Risk Factors 357 7.00 25.00 12.1597 3.45269
Pre Factor Score: Negative Attitudes about Gun
Carrying
361 4.00 16.00 12.3435 2.33417
Pre Factor Score: Protective Factors 364 3.00 12.00 9.9533 1.62301
Pre Factor Score: Efficacy to Resist Peer Pressure 365 1.00 4.00 3.2466 .79457
Post Factor Score: Positive Direct Program Impact 356 6.00 16.00 13.5871 2.28547
Post Factor Score: Acceptance of Risky
Attitudes/Behaviors
353 5.00 20.00 7.5637 2.49819
Post Factor Score: Negative Attitudes about Gun
Carrying
356 3.00 12.00 9.3511 2.12239
Post Factor Score: Efficacy to Make
Decisions/Understand Consequences
355 3.00 12.00 10.6817 1.47582
Valid N (listwise) 337
a. School = PFHS
34
Descriptive Statisticsa
N Minimum Maximum Mean Std. Deviation
Pre Factor Score: Risk Factors 196 7.00 21.00 11.0102 2.93693
Pre Factor Score: Negative Attitudes about Gun
Carrying
200 7.00 16.00 12.9050 2.38630
Pre Factor Score: Protective Factors 201 4.00 12.00 10.1791 1.43449
Pre Factor Score: Efficacy to Resist Peer Pressure 207 1.00 4.00 3.2560 .79875
Post Factor Score: Positive Direct Program Impact 156 4.00 16.00 13.9295 2.20004
Post Factor Score: Acceptance of Risky
Attitudes/Behaviors
157 5.00 16.00 7.6369 2.12480
Post Factor Score: Negative Attitudes about Gun
Carrying
157 4.00 12.00 9.5096 2.16208
Post Factor Score: Efficacy to Make
Decisions/Understand Consequences
156 6.00 12.00 10.5513 1.40641
Valid N (listwise) 142
a. School = PFMS
Descriptive Statisticsa
N Minimum Maximum Mean Std. Deviation
Pre Factor Score: Risk Factors 16 7.00 25.00 15.5000 4.58984
Pre Factor Score: Negative Attitudes about Gun
Carrying
15 7.00 14.00 11.3333 2.05866
Pre Factor Score: Protective Factors 17 4.00 12.00 8.0000 2.17945
Pre Factor Score: Efficacy to Resist Peer Pressure 16 1.00 4.00 2.5000 1.03280
Post Factor Score: Positive Direct Program Impact 3 12.00 14.00 13.0000 1.00000
Post Factor Score: Acceptance of Risky
Attitudes/Behaviors
3 7.00 15.00 10.6667 4.04145
Post Factor Score: Negative Attitudes about Gun
Carrying
3 6.00 10.00 7.6667 2.08167
Post Factor Score: Efficacy to Make
Decisions/Understand Consequences
3 6.00 10.00 8.3333 2.08167
Valid N (listwise) 2
a. School = PJMS

35
Descriptive Statisticsa
N Minimum Maximum Mean Std. Deviation
Pre Factor Score: Risk Factors 54 7.00 20.00 12.7407 3.16338
Pre Factor Score: Negative Attitudes about Gun
Carrying
55 7.00 16.00 12.1091 2.71943
Pre Factor Score: Protective Factors 55 6.00 12.00 9.6909 1.48913
Pre Factor Score: Efficacy to Resist Peer Pressure 56 1.00 4.00 3.3929 .80178
Post Factor Score: Postive Direct Program Impact 52 6.00 16.00 13.4808 2.58571
Post Factor Score: Acceptance of Risky
Attitudes/Behaviors
52 5.00 15.00 8.0385 2.44116
Post Factor Score: Negative Attitudes about Gun
Carrying
51 3.00 12.00 9.0196 2.14000
Post Factor Score: Efficacy to Make
Decisions/Understand Consequences
52 6.00 12.00 10.5577 1.46077
Valid N (listwise) 47
a. School = RRCHS
Descriptive Statisticsa
N Minimum Maximum Mean Std. Deviation
Pre Factor Score: Risk Factors 62 7.00 18.00 11.1613 2.85263
Pre Factor Score: Negative Attitudes about Gun
Carrying
62 4.00 16.00 12.1452 2.77487
Pre Factor Score: Protective Factors 64 4.00 12.00 9.8750 1.88982
Pre Factor Score: Efficacy to Resist Peer Pressure 63 1.00 4.00 3.3492 .67582
Post Factor Score: Positive Direct Program Impact 63 6.00 16.00 13.6508 2.29416
Post Factor Score: Acceptance of Risky
Attitudes/Behaviors
65 5.00 13.00 7.5385 1.77726
Post Factor Score: Negative Attitudes about Gun
Carrying
65 3.00 12.00 9.3231 2.15861
Post Factor Score: Efficacy to Make
Decisions/Understand Consequences
63 7.00 12.00 10.6667 1.23131
Valid N (listwise) 52
a. School = RRCMS
36
Descriptive Statisticsa
N Minimum Maximum Mean Std. Deviation
Pre Factor Score: Risk Factors 44 7.00 22.00 15.7727 3.30513
Pre Factor Score: Negative Attitudes about Gun
Carrying
46 4.00 15.00 10.8043 2.63835
Pre Factor Score: Protective Factors 46 5.00 12.00 8.9348 1.52610
Pre Factor Score: Efficacy to Resist Peer Pressure 46 1.00 4.00 3.1087 .76676
Post Factor Score: Positive Direct Program Impact 39 4.00 15.00 11.5641 2.52143
Post Factor Score: Acceptance of Risky
Attitudes/Behaviors
39 5.00 15.00 9.4103 2.48911
Post Factor Score: Negative Attitudes about Gun
Carrying
38 3.00 12.00 7.9474 2.03944
Post Factor Score: Efficacy to Make
Decisions/Understand Consequences
39 3.00 12.00 9.6410 2.01947
Valid N (listwise) 35
a. School = RSHS
Descriptive Statisticsa
N Minimum Maximum Mean Std. Deviation
Pre Factor Score: Risk Factors 169 7.00 22.00 10.8521 2.91068
Pre Factor Score: Negative Attitudes about Gun
Carrying
169 6.00 16.00 13.1716 2.59122
Pre Factor Score: Protective Factors 171 5.00 12.00 10.5146 1.40318
Pre Factor Score: Efficacy to Resist Peer Pressure 171 1.00 4.00 3.2749 .84045
Post Factor Score: Positive Direct Program Impact 155 8.00 16.00 14.8903 1.56491
Post Factor Score: Acceptance of Risky
Attitudes/Behaviors
155 5.00 13.00 7.2065 1.94968
Post Factor Score: Negative Attitudes about Gun
Carrying
156 5.00 12.00 10.1603 1.84390
Post Factor Score: Efficacy to Make
Decisions/Understand Consequences
154 6.00 12.00 11.0000 1.20457
Valid N (listwise) 138
a. School = SFCMS

37
Descriptive Statisticsa
N Minimum Maximum Mean Std. Deviation
Pre Factor Score: Risk Factors 367 7.00 25.00 11.9537 3.43726
Pre Factor Score: Negative Attitudes about Gun
Carrying
369 4.00 16.00 12.4201 2.45829
Pre Factor Score: Protective Factors 375 3.00 12.00 10.1893 1.54397
Pre Factor Score: Efficacy to Resist Peer Pressure 380 1.00 4.00 3.2868 .81499
Post Factor Score: Positive Direct Program Impact 344 6.00 16.00 13.9797 2.28754
Post Factor Score: Acceptance of Risky
Attitudes/Behaviors
344 5.00 19.00 7.2297 2.10985
Post Factor Score: Negative Attitudes about Gun
Carrying
342 3.00 12.00 9.4678 2.13142
Post Factor Score: Efficacy to Make
Decisions/Understand Consequences
343 3.00 12.00 10.6356 1.49213
Valid N (listwise) 307
a. School = SFHS
Descriptive Statisticsa
N Minimum Maximum Mean Std. Deviation
Pre Factor Score: Risk Factors 114 7.00 28.00 12.1579 3.38811
Pre Factor Score: Negative Attitudes about Gun
Carrying
119 7.00 16.00 12.9244 2.40818
Pre Factor Score: Protective Factors 122 4.00 12.00 9.8361 1.70735
Pre Factor Score: Efficacy to Resist Peer Pressure 127 1.00 4.00 3.0709 .93589
Post Factor Score: Positive Direct Program Impact 117 5.00 16.00 14.0855 2.23827
Post Factor Score: Acceptance of Risky
Attitudes/Behaviors
117 5.00 20.00 8.0256 2.44407
Post Factor Score: Negative Attitudes about Gun
Carrying
121 4.00 12.00 9.6612 2.12349
Post Factor Score: Efficacy to Make
Decisions/Understand Consequences
118 6.00 12.00 10.4068 1.53165
Valid N (listwise) 83
a. School = SLMS
38
Descriptive Statisticsa
N Minimum Maximum Mean Std. Deviation
Pre Factor Score: Risk Factors 257 7.00 24.00 12.0739 3.20254
Pre Factor Score: Negative Attitudes about Gun
Carrying
257 4.00 16.00 12.3969 2.38936
Pre Factor Score: Protective Factors 256 5.00 12.00 10.0117 1.53005
Pre Factor Score: Efficacy to Resist Peer Pressure 264 1.00 4.00 3.1856 .82707
Post Factor Score: Positive Direct Program Impact 257 4.00 16.00 13.5953 2.44463
Post Factor Score: Acceptance of Risky
Attitudes/Behaviors
253 5.00 20.00 7.8300 2.52109
Post Factor Score: Negative Attitudes about Gun
Carrying
256 3.00 12.00 9.2617 2.24872
Post Factor Score: Efficacy to Make
Decisions/Understand Consequences
256 3.00 12.00 10.4531 1.57360
Valid N (listwise) 225
a. School = SVHS
Descriptive Statisticsa
N Minimum Maximum Mean Std. Deviation
Pre Factor Score: Risk Factors 189 7.00 21.00 12.1376 3.18442
Pre Factor Score: Negative Attitudes about Gun
Carrying
194 6.00 16.00 12.6804 2.54716
Pre Factor Score: Protective Factors 190 3.00 12.00 9.7211 1.92205
Pre Factor Score: Efficacy to Resist Peer Pressure 195 1.00 4.00 3.0359 .89888
Post Factor Score: Positive Direct Program Impact 184 4.00 16.00 13.7880 2.49889
Post Factor Score: Acceptance of Risky
Attitudes/Behaviors
186 5.00 16.00 7.5645 2.23936
Post Factor Score: Negative Attitudes about Gun
Carrying
186 3.00 12.00 9.5161 2.29270
Post Factor Score: Efficacy to Make
Decisions/Understand Consequences
186 3.00 12.00 10.2796 1.74830
Valid N (listwise) 159
a. School = SVMS

39
Descriptive Statisticsa
N Minimum Maximum Mean Std. Deviation
Pre Factor Score: Risk Factors 164 7.00 20.00 11.3720 3.08600
Pre Factor Score: Negative Attitudes about Gun
Carrying
169 4.00 16.00 12.4852 2.48593
Pre Factor Score: Protective Factors 165 4.00 12.00 9.7515 1.60565
Pre Factor Score: Efficacy to Resist Peer Pressure 170 1.00 4.00 3.3529 .79504
Post Factor Score: Positive Direct Program Impact 107 6.00 16.00 13.3458 2.33958
Post Factor Score: Acceptance of Risky
Attitudes/Behaviors
109 5.00 16.00 7.8716 2.53165
Post Factor Score: Negative Attitudes about Gun
Carrying
110 3.00 12.00 9.0727 2.27354
Post Factor Score: Efficacy to Make
Decisions/Understand Consequences
110 5.00 12.00 10.2636 1.75404
Valid N (listwise) 91
a. School = TSHS
Descriptive Statisticsa
N Minimum Maximum Mean Std. Deviation
Pre Factor Score: Risk Factors 241 7.00 28.00 12.3776 3.82788
Pre Factor Score: Negative Attitudes about Gun
Carrying
247 6.00 16.00 12.1741 2.48042
Pre Factor Score: Protective Factors 246 4.00 12.00 9.8780 1.67374
Pre Factor Score: Efficacy to Resist Peer Pressure 248 1.00 4.00 3.2621 .79971
Post Factor Score: Positive Direct Program Impact 226 4.00 16.00 13.8142 2.28249
Post Factor Score: Acceptance of Risky
Attitudes/Behaviors
217 5.00 20.00 8.0276 2.80363
Post Factor Score: Negative Attitudes about Gun
Carrying
228 3.00 12.00 9.1228 2.20188
Post Factor Score: Efficacy to Make
Decisions/Understand Consequences
226 6.00 12.00 10.5796 1.50121
Valid N (listwise) 198
a. School = WOHS

40
Descriptive Statisticsa
N Minimum Maximum Mean Std. Deviation
Pre Factor Score: Risk Factors 159 7.00 21.00 11.4969 2.83485
Pre Factor Score: Negative Attitudes about Gun
Carrying
163 4.00 16.00 12.9080 2.54056
Pre Factor Score: Protective Factors 164 3.00 12.00 10.0976 1.65866
Pre Factor Score: Efficacy to Resist Peer Pressure 170 1.00 4.00 3.0765 .84966
Post Factor Score: Positive Direct Program Impact 134 7.00 16.00 13.9925 2.19533
Post Factor Score: Acceptance of Risky
Attitudes/Behaviors
135 5.00 14.00 7.6741 2.15042
Post Factor Score: Negative Attitudes about Gun
Carrying
135 3.00 12.00 9.6741 1.97684
Post Factor Score: Efficacy to Make
Decisions/Understand Consequences
133 6.00 12.00 10.5489 1.41135
Valid N (listwise) 110
a. School = WOMS

41
EKG Program Impact
In the previous two sections, we have fully described the sample of students who participated in the EKG program in
Year 1. Now we will begin to report findings which will demonstrate the actual impact of the EKG program on the
student participants. To review, students were given a survey questionnaire before exposure to the EKG training
program and again after exposure to the EKG training program to assess their attitudes, behaviors, and cognitions about
guns, gangs, violence, and decision-making.
Changes Over Time
Data analyses were conducted to look for changes over time from pre- to post-survey where possible for student
participants. The pre- and post-surveys were compared to assess for any attitudinal, behavioral, and/or cognitive shifts
that may be attributed to the EKG training program. Paired samples t-tests were used to analyze the pre- and post-
survey data. Results of paired samples t-test provide an associated p-value which is used to determine whether the pre-
to post-change in attitude, behavior, or cognition we are analyzing is statistically significant. A statistically significant p-
value of ≤ .05 means that the change that we see from pre- to post-test is unlikely to have occurred due to chance alone
and can therefore be attributed to the EKG program intervention.
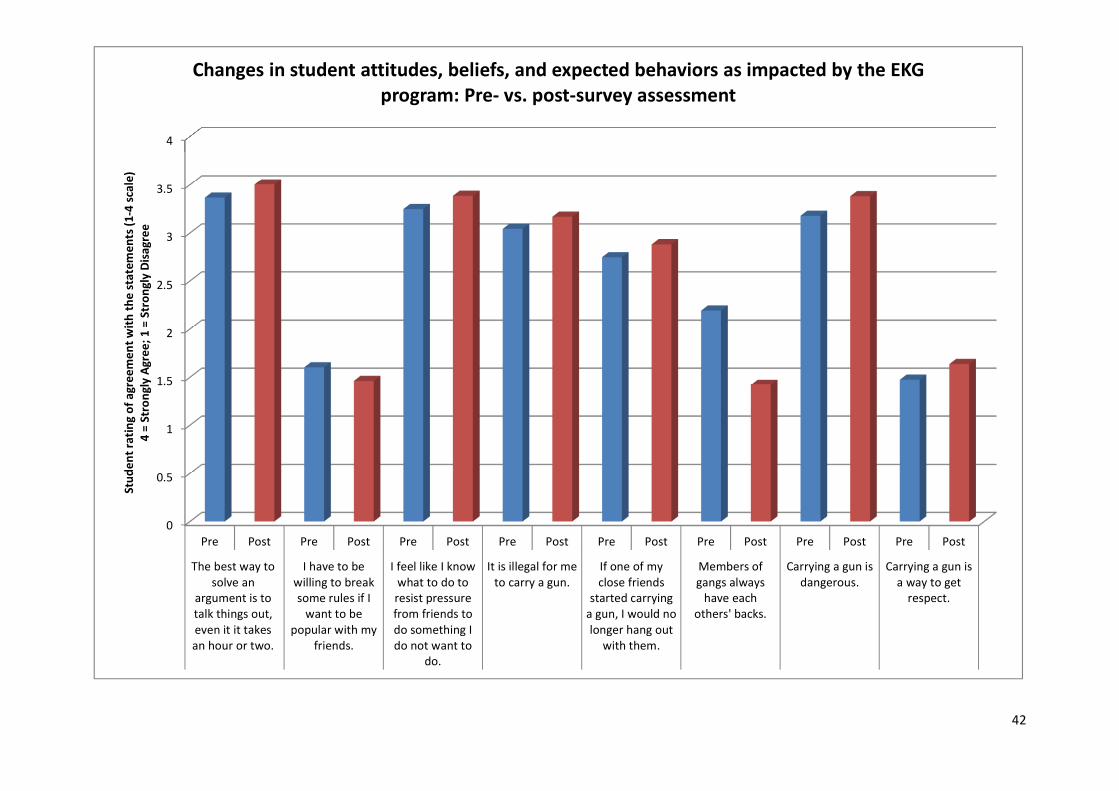
Students showed statistically significant (p ≤ .05) attitudinal/cognitive and intended behavioral shifts in the desired
direction from pre- to post-survey, indicating that exposure to the EKG training program was successful in leading to
student attitudinal, behavioral, and cognitive changes. Specifically, students reported the following shifts after exposure
to the EKG training based on their pre- and post-survey data. All differences from pre-to-post were statistically
significant at the p < .001 level. After the EKG program as compared to before, students:
• Were more likely to know that it would be illegal for them carry a gun.
• Agreed more that the best way to solve arguments was to talk things out.
• Felt more strongly that they knew what to do resist peer pressure.
• Were less likely to agree that they had to be willing to break rules to fit in with their peers.
• Were more likely to stop hanging out with a friend known to carry a gun.
• Were more likely to agree that carrying a gun is dangerous.
• Were likely to debunk the myth that gang members stand up for each other. Specifically, after the video,
students were less likely to feel that Jamari’s gang would have his back after going to prison even though before
the video, students were more likely to feel that gangs in general have each other’s backs.
All of the above trends in the data are presented in the graphic on the next page.
Interestingly, there was a significant trend upward in agreement between the pre-test question, “Carrying a gun is a
good way to get respect from other people”, where the average agreement rating was 1.47 on a 4-point scale and the
post-test question, “Jamari got respect from other people by carrying a gun”, where the average agreement rating was
significantly higher at 1.63 on a 4-point scale, t(5307) = -12.40, p < .001. So, while students in general were more likely
to disagree that carrying a gun is a way to get respect, they were more likely to agree that in the specific situation of
Jamari, he was able to get respect by carrying a gun. For further elaboration on this finding, see the section comparing
high vs. low risk students. It was the low risk students driving this upward trend. Maybe a point to consider for EKG
instructors in their lesson planning is a discussion with students about how students are defining “respect.” Instructors
may ask students: “Was Jamari respected or was he feared because he had the gun?” Further students may consider the
idea of how long Jamari’s perceived respect or fear lasted due to him having the gun? Jamari’s control of others through
the fear elicited by his gun was very short-lived and certainly not worth the long-term consequences.
42
0
0.5
1
1.5
2
2.5
3
3.5
4
Pre Post Pre Post Pre Post Pre Post Pre Post Pre Post Pre Post Pre Post
The best way to
solve an
argument is to
talk things out,
even it it takes
an hour or two.
I have to be
willing to break
some rules if I
want to be
popular with my
friends.
I feel like I know
what to do to
resist pressure
from friends to
do something I
do not want to
do.
It is illegal for me
to carry a gun.
If one of my
close friends
started carrying
a gun, I would no
longer hang out
with them.
Members of
gangs always
have each
others' backs.
Carrying a gun is
dangerous.
Carrying a gun is
a way to get
respect.
Stu
de
nt
rati
ng
of
ag
ree
me
nt
wit
h t
he
sta
tem
en
ts (
1-4
sca
le)
4 =
Str
on
gly
Ag
ree
; 1
= S
tro
ng
ly D
isa
gre
e
Changes in student attitudes, beliefs, and expected behaviors as impacted by the EKG
program: Pre- vs. post-survey assessment

43
Among all the factors that were identified and explained in the previous section, two factors were able to be analyzed
for pre- to post-survey differences because the items that comprised the factors were the same or similar enough on
both the pre- and post-surveys. A pre-factor and post-factor score was created using the items that were the same
across the pre- and post-surveys for “Risk Factors” and “Negative Attitudes About Gun Carrying.” A paired-samples t-test
was conducted for each factor scale score to see if there were changes from pre-to-post survey for student factor
scores. The average scores for the pre- and post-factor scores are reported in the table below.
Factor Scale Scores Pre- vs. Post-EKG Program
Mean N Std. Deviation
Pair 1 Pre Factor: Risk Factors 5.2632 5130 1.65561
Post Factor: Risk Factors 4.5080 5130 1.57667
Pair 2 Pre Factor: Negative Attitudes About Gun Carrying 8.9714 5137 2.17653
Post Factor: Negative Attitudes About Gun Carrying 9.4345 5137 2.18917
The difference from pre- to post-test in the factor scale scores was statistically significant for both factors and in the
desired direction, p < .001. Specifically, the average score for acceptance of risky attitudes and behavior (Risk Factors)
decreased from 5.26 on the pre-survey to 4.51 on the post-survey. The average score for negative attitudes about gun
carrying increased from 8.97 on the pre-survey to 9.43 on the post-survey, indicating that students became less
accepting of attitudes related to gun carrying after the EKG program.
High Risk vs. Low Risk Students
To further drill down the impact of the EKG program, the researchers believed it would be important to examine trends
for the students at most risk for involvement with future gang/gun violence to see if high risk students were impacted
differently by the EKG program than lower risk students. Using the pre-survey Risk Factors scale score described
previously, students were categorized as either “High Risk”, meaning that they scored approximately two standard
deviations above the mean on the Risk Factors scale (score of 18 or greater) or “Low Risk”, meaning that they scored
approximately one standard deviation below the mean on the Risk Factors scale (score of 9 or less). The “Average Risk”
students were those who scored above 9 and below 18 on the Risk Factors scale.
High Risk Student Characteristics
327 EKG student participants were characterized as “High Risk” based on their Risk Factors scale score (score of 18 or
greater) on the pre-survey questionnaire.
• 62.5% were 9th
graders; 37.5% were 7th
graders
• 65.6% were male; 34.4% were female
• 13.2% identified as street gang members
• 17.7% said they would consider joining a gang
• 38.3% said they have been threatened or shot at with a gun
• 68.3% said either they or a close family member or friend had been shot with a gun
• 14% said they had threatened or shot at someone with a gun
• The racial composition of high risk EKG participants is provided in the graphic below. The largest racial category
of high risk EKG participants was Black/African American (43%).

44
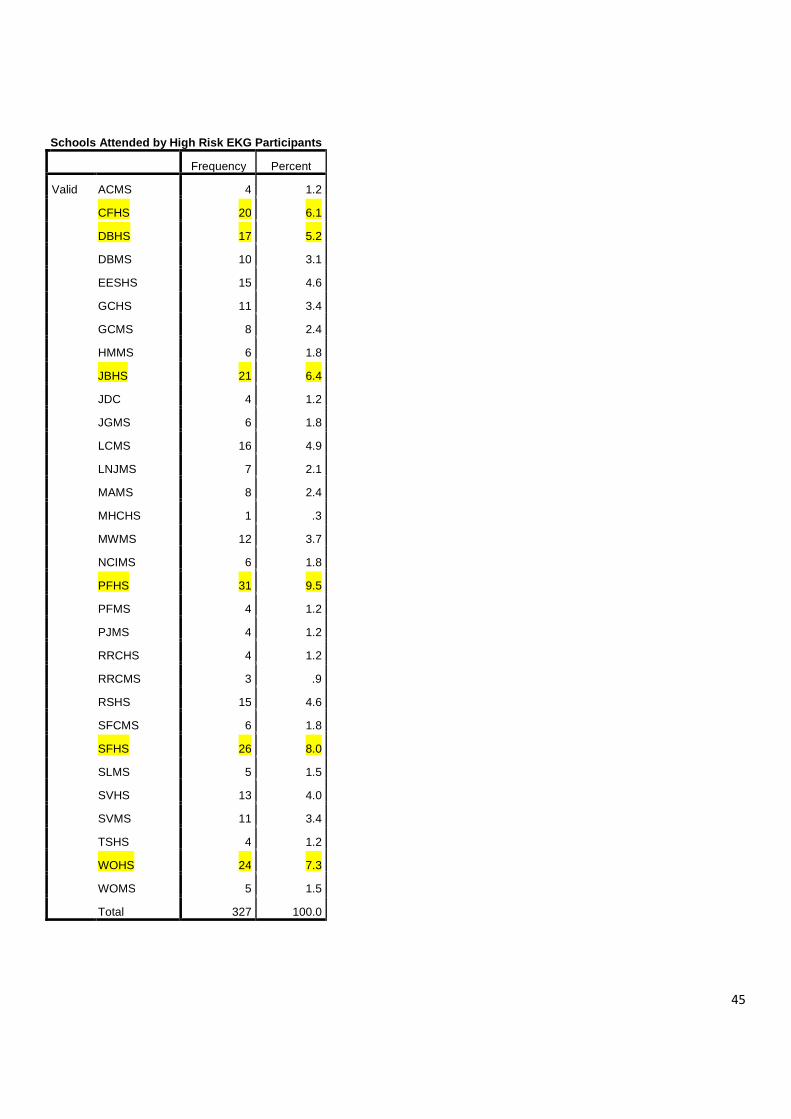
The top schools that high risk students attended are presented in the table below. The six schools with the most high
risk student representation are highlighted in yellow. At least 5% of all high risk students came from these six schools:
CFHS (6.1% of all high risk students), DBHS (5.2% of all high risk students), JBHS (6.4% of all high risk students), and PFHS
(9.5% of all high risk students), SFHS (8.0% of all high risk students), and WOHS (7.3% of all high risk students).
American Indian/Alaska
Native
5%
Native Hawaiian/Pacific
Islander
1%
Asian/Asian American
1%
Other
24%
Hispanic/Latino
11%
White/Caucasian (non-
Hispanic)
15%
Black/African American
(non-Hispanic)
43%
Racial Composition of High Risk Students Participating in the EKG
Program
45
Schools Attended by High Risk EKG Participants
Frequency Percent
Valid ACMS 4 1.2
CFHS 20 6.1
DBHS 17 5.2
DBMS 10 3.1
EESHS 15 4.6
GCHS 11 3.4
GCMS 8 2.4
HMMS 6 1.8
JBHS 21 6.4
JDC 4 1.2
JGMS 6 1.8
LCMS 16 4.9
LNJMS 7 2.1
MAMS 8 2.4
MHCHS 1 .3
MWMS 12 3.7
NCIMS 6 1.8
PFHS 31 9.5
PFMS 4 1.2
PJMS 4 1.2
RRCHS 4 1.2
RRCMS 3 .9
RSHS 15 4.6
SFCMS 6 1.8
SFHS 26 8.0
SLMS 5 1.5
SVHS 13 4.0
SVMS 11 3.4
TSHS 4 1.2
WOHS 24 7.3
WOMS 5 1.5
Total 327 100.0

46
There were 121 high risk middle school participants and 202 high risk high school participants. The top middle schools
attended by high risk students are highlighted in yellow in the table below. At least 8% of high risk middle school
students came from these schools: DBMS (8.3% of all high risk middle school students), LCMS (13.2% of all high risk
middle school students), MWMS (9.9% of all high risk middle school students), and SVMS (9.1% of all high risk middle
school students.
Schools Attended by High Risk Middle School EKG Participants
Frequency Percent
Valid ACMS 4 3.3
DBMS 10 8.3
GCMS 8 6.6
HMMS 6 5.0
JGMS 6 5.0
LCMS 16 13.2
LNJMS 7 5.8
MAMS 8 6.6
MWMS 12 9.9
NCIMS 6 5.0
PFMS 4 3.3
PJMS 4 3.3
RRCMS 3 2.5
SFCMS 6 5.0
SLMS 5 4.1
SVMS 11 9.1
WOMS 5 4.1
Total 121 100.0
47
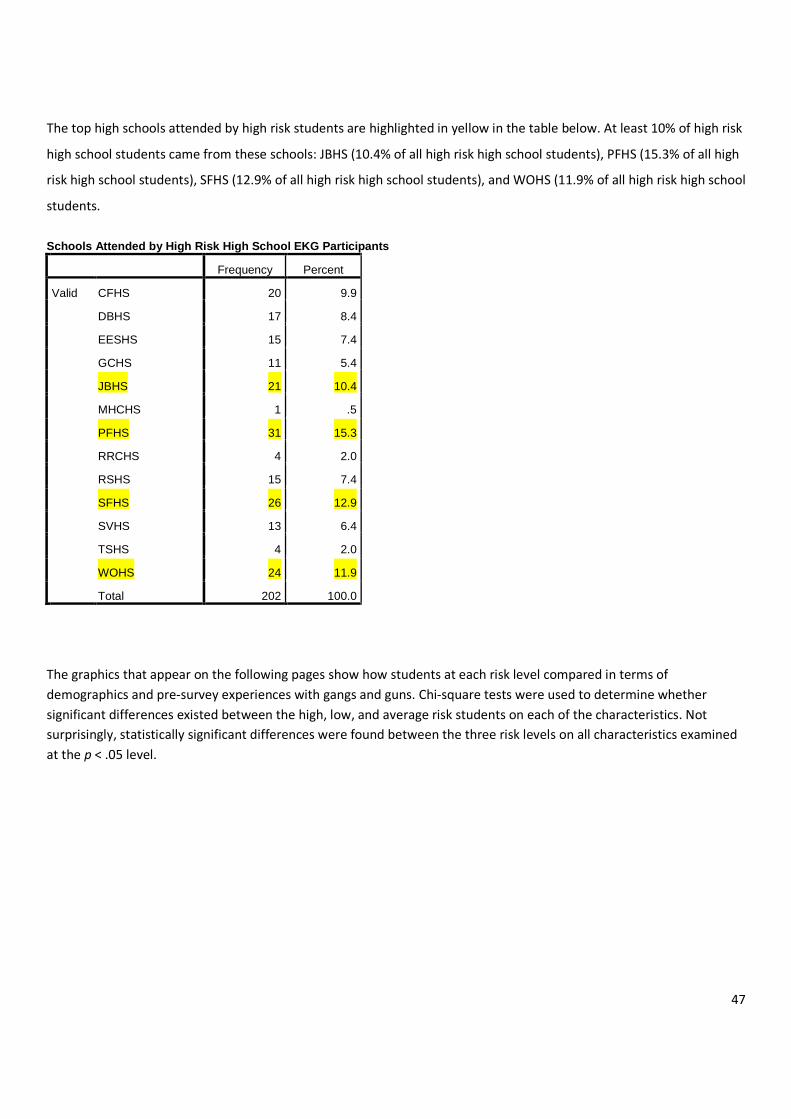
The top high schools attended by high risk students are highlighted in yellow in the table below. At least 10% of high risk
high school students came from these schools: JBHS (10.4% of all high risk high school students), PFHS (15.3% of all high
risk high school students), SFHS (12.9% of all high risk high school students), and WOHS (11.9% of all high risk high school
students.
Schools Attended by High Risk High School EKG Participants
Frequency Percent
Valid CFHS 20 9.9
DBHS 17 8.4
EESHS 15 7.4
GCHS 11 5.4
JBHS 21 10.4
MHCHS 1 .5
PFHS 31 15.3
RRCHS 4 2.0
RSHS 15 7.4
SFHS 26 12.9
SVHS 13 6.4
TSHS 4 2.0
WOHS 24 11.9
Total 202 100.0
The graphics that appear on the following pages show how students at each risk level compared in terms of
demographics and pre-survey experiences with gangs and guns. Chi-square tests were used to determine whether
significant differences existed between the high, low, and average risk students on each of the characteristics. Not
surprisingly, statistically significant differences were found between the three risk levels on all characteristics examined
at the p < .05 level.

48
Grade Level
High risk students were significantly older (as determined by grade level) than students categorized as low or average
risk. Low risk students were significantly younger (as determined by grade level) than students categorized as average or
high risk, X2(2, N = 5845) = 10.27, p = .006.
Gender
High risk students were more likely to be male than either average or low risk students. Low risk students were more
likely than average or high risk students to be female, X2(2, N = 5759) = 79.17, p < .001.
47%44%
38%
53%56%
63%
0%
10%
20%
30%
40%
50%
60%
70%
Low Average High
Risk Level Category Based on Pre-Test Risk Factor Scale Score
Risk Level of Students by Grade
7th
9th
41%
51%
66%
59%
49%
34%
0%
10%
20%
30%
40%
50%
60%
70%
Low Average High
Risk Level Category Based on Pre-Test Risk Factor Scale Score
Risk Level of Students by Gender
Male
Female
49
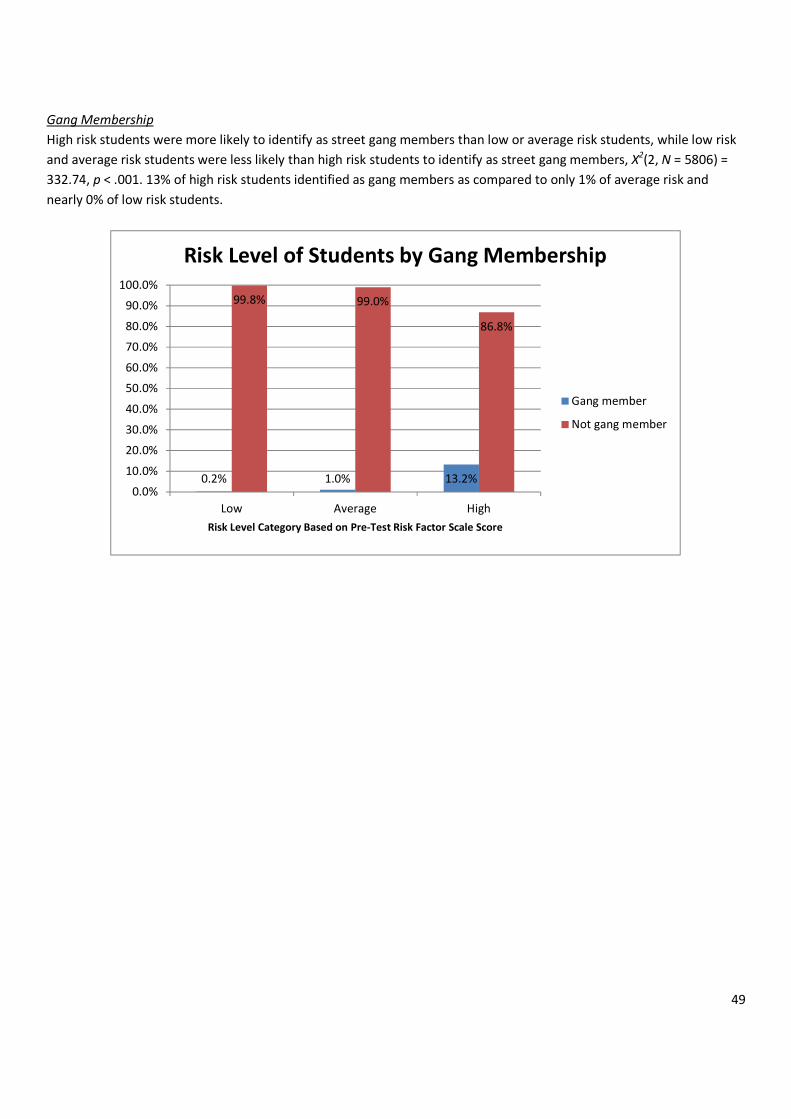
Gang Membership
High risk students were more likely to identify as street gang members than low or average risk students, while low risk
and average risk students were less likely than high risk students to identify as street gang members, X2(2, N = 5806) =
332.74, p < .001. 13% of high risk students identified as gang members as compared to only 1% of average risk and
nearly 0% of low risk students.
0.2% 1.0% 13.2%
99.8% 99.0%
86.8%
0.0%
10.0%
20.0%
30.0%
40.0%
50.0%
60.0%
70.0%
80.0%
90.0%
100.0%
Low Average High
Risk Level Category Based on Pre-Test Risk Factor Scale Score
Risk Level of Students by Gang Membership
Gang member
Not gang member

50
Consider Joining a Gang
High risk students were more likely to consider joining a gang than low or average risk students. Low risk students were
less likely to consider joining a gang than average or high risk students, X2(2, N = 5628) = 256.84, p < .001. Nearly 18% of
high risk students stated that they would consider joining a gang compared to only 3% of average risk and nearly 0% of
low risk students.
0.3% 2.7%17.7%
99.7% 97.3%
82.3%
0.0%
10.0%
20.0%
30.0%
40.0%
50.0%
60.0%
70.0%
80.0%
90.0%
100.0%
Low Average High
Risk Level Category Based on Pre-Test Risk Factor Score
Risk Level of Students by Whether They
Would Consider Joining a Gang
Yes
No
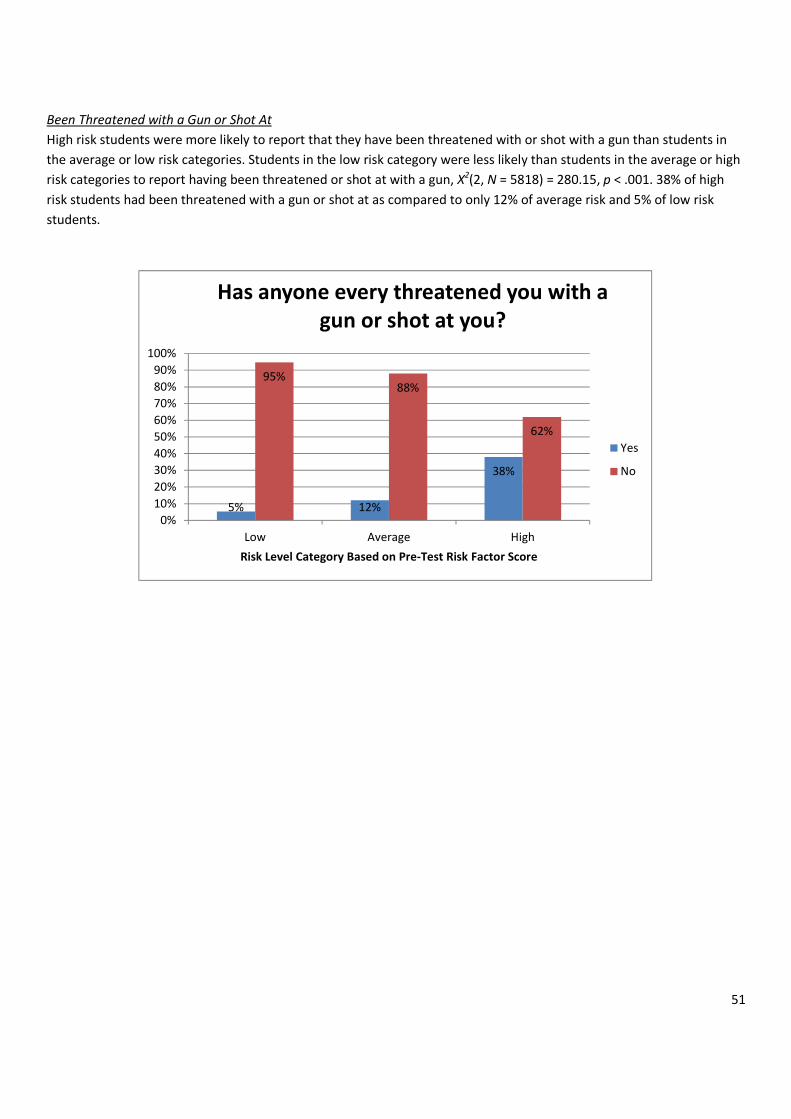
51
Been Threatened with a Gun or Shot At
High risk students were more likely to report that they have been threatened with or shot with a gun than students in
the average or low risk categories. Students in the low risk category were less likely than students in the average or high
risk categories to report having been threatened or shot at with a gun, X2(2, N = 5818) = 280.15, p < .001. 38% of high
risk students had been threatened with a gun or shot at as compared to only 12% of average risk and 5% of low risk
students.
5% 12%
38%
95%88%
62%
0%
10%
20%
30%
40%
50%
60%
70%
80%
90%
100%
Low Average High
Risk Level Category Based on Pre-Test Risk Factor Score
Has anyone every threatened you with a
gun or shot at you?
Yes
No
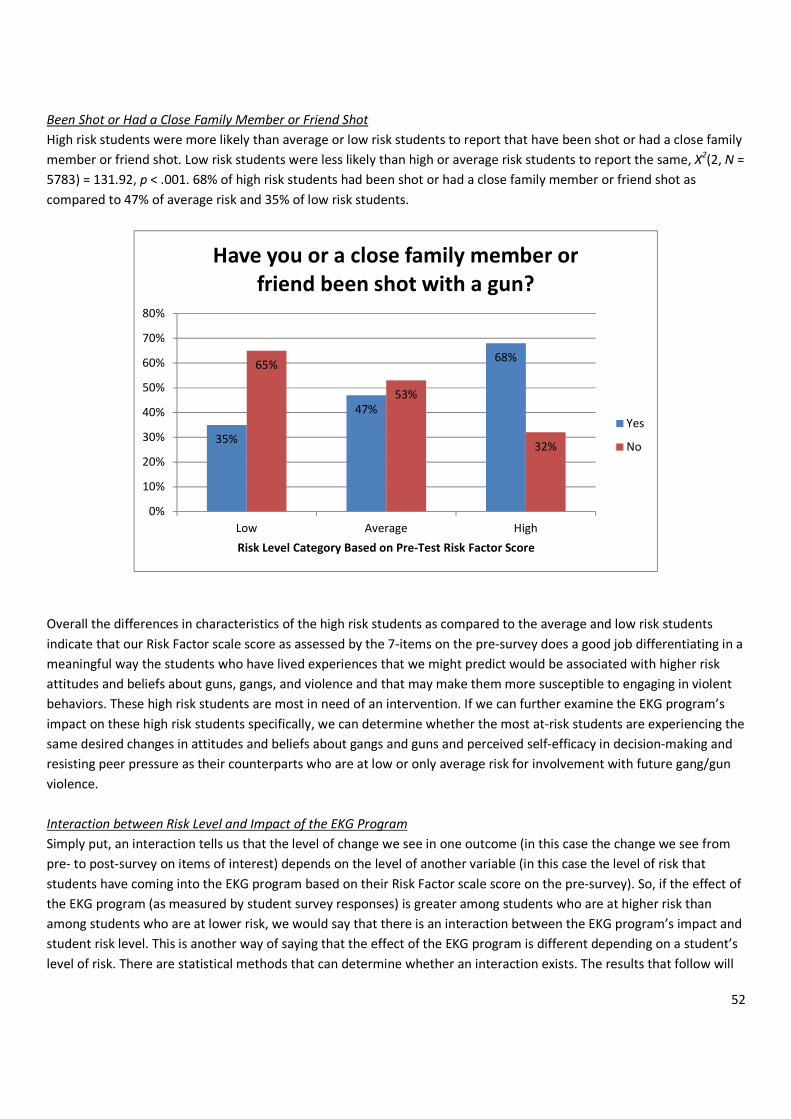
52
Been Shot or Had a Close Family Member or Friend Shot
High risk students were more likely than average or low risk students to report that have been shot or had a close family
member or friend shot. Low risk students were less likely than high or average risk students to report the same, X2(2, N =
5783) = 131.92, p < .001. 68% of high risk students had been shot or had a close family member or friend shot as
compared to 47% of average risk and 35% of low risk students.
Overall the differences in characteristics of the high risk students as compared to the average and low risk students
indicate that our Risk Factor scale score as assessed by the 7-items on the pre-survey does a good job differentiating in a
meaningful way the students who have lived experiences that we might predict would be associated with higher risk
attitudes and beliefs about guns, gangs, and violence and that may make them more susceptible to engaging in violent
behaviors. These high risk students are most in need of an intervention. If we can further examine the EKG program’s
impact on these high risk students specifically, we can determine whether the most at-risk students are experiencing the
same desired changes in attitudes and beliefs about gangs and guns and perceived self-efficacy in decision-making and
resisting peer pressure as their counterparts who are at low or only average risk for involvement with future gang/gun
violence.
Interaction between Risk Level and Impact of the EKG Program
Simply put, an interaction tells us that the level of change we see in one outcome (in this case the change we see from
pre- to post-survey on items of interest) depends on the level of another variable (in this case the level of risk that
students have coming into the EKG program based on their Risk Factor scale score on the pre-survey). So, if the effect of
the EKG program (as measured by student survey responses) is greater among students who are at higher risk than
among students who are at lower risk, we would say that there is an interaction between the EKG program’s impact and
student risk level. This is another way of saying that the effect of the EKG program is different depending on a student’s
level of risk. There are statistical methods that can determine whether an interaction exists. The results that follow will
35%
47%
68%65%
53%
32%
0%
10%
20%
30%
40%
50%
60%
70%
80%
Low Average High
Risk Level Category Based on Pre-Test Risk Factor Score
Have you or a close family member or
friend been shot with a gun?
Yes
No

53
indicate whether there was an interaction between EKG and student risk level. The following pre- vs. post-survey items
were examined for interactions and only those where a statistically significant interaction was found are represented in
the graphics that follow.
• Risk Factor scale score for pre- vs. post-survey consisting of the sum of three individual items: 1) gang members
always have each other’s backs + 2) carrying a gun gets respect + 3) have to be willing to break rules to be
popular, F (1, 1567) = 536.77, p < .001
o Significant interaction, meaning that the level of change from pre- to post- test in the Risk Factor score
depended upon the student’s risk level. Graph and more detailed explanation to follow.
• Negative Gun Carrying Attitudes scale score on pre- vs. post-survey consisting of the sum of three individual
items: 1) it is illegal to carry a gun + 2) if a close friend started carrying a gun, no longer hang out + 3) carrying a
gun is dangerous, F (1, 1556) = .552, p = .458
o No significant interaction, meaning that the increase in negative attitudes toward carrying guns from
pre- to post-survey was the same regardless of a student’s level of risk. Basically all students, regardless
of their pre-existing risk level became more negative toward gun carrying after the EKG program.
• The best way to solve an argument is to talk it out, F (1, 1568) = .591, p = .442
o No significant interaction, meaning that the increase in agreement with this item from pre- to post-test
was the same regardless of a student’s level of risk. Basically all students, regardless of their pre-existing
risk level agreed more with this item after the EKG program.
• Carrying a gun is a way to get respect as assessed using pre-survey item: “Carrying a gun is a good way to get
respect from other people” vs. post-survey item: “Jamari got respect from other people by carrying a gun”, F (1,
1575) = 53.72, p < .001
o Significant interaction, meaning that the level of change from pre- to post-survey in the belief that gun
carrying is a way to get respect depended upon the student’s risk level. Graph and more detailed
explanation to follow.
• Perceived self-efficacy to resist peer pressure, F (1, 1563) = .004, p = .951
o No significant interaction, meaning that the increase in agreement with this item from pre- to post-
survey was the same regardless of a student’s level of risk. Basically all students, regardless of their pre-
existing risk level agreed more with this item after the EKG program.
• Have to be willing to break some rules if I want to be popular, F (1, 1575) = 96.99, p < .001
o Significant interaction, meaning that the level of change from pre- to post-survey in the agreement with
this item depended upon the student’s risk level. Graph and more detailed explanation to follow.
• It is illegal for me to carry a gun, F (1, 1571) = 1.08, p = .299
o No significant interaction, meaning that the increase in agreement with this item from pre- to post-
survey was the same regardless of a student’s level of risk. Basically all students, regardless of their pre-
existing risk level agreed more with this item after the EKG program.
• Need to think more about consequences before acting, F (1, 1564) = 12.19, p < .001
o Significant interaction, meaning that the level of change from pre- to post-survey in the agreement with
this item depended upon the student’s risk level. Graph and more detailed explanation to follow.
• If a close friend started carrying a gun, I would no longer hang out with them, F (1, 1566) = 4.31, p = .038
o Significant interaction, meaning that the level of change from pre- to post-survey in the agreement with
this item depended upon the student’s risk level. Graph and more detailed explanation to follow.
• Carrying a gun is dangerous, F (1, 1572) = .483, p = .487

54
o No significant interaction, meaning that the increase in agreement with this item from pre- to post-
survey was the same regardless of a student’s level of risk. Basically all students, regardless of their pre-
existing risk level agreed more with this item after the EKG program.
• Gang members have each other’s backs as assessed using pre-survey item: “Members of gangs always each
other’s backs and stand up for one another” and post-survey item: “I feel like Jamari’s boys will have his back
and stand up for him even after he goes to jail for the shooting”, F (1, 1575) = 534.36, p < .001
o Significant interaction, meaning that the level of change from pre- to post-survey in the agreement with
this item depended upon the student’s risk level. Graph and more detailed explanation to follow.
• High risk student showed a significant decrease in scores on the Risk Factor scale from pre-survey (average =
8.14) to post-survey (average = 5.96). Low risk students did not show any significant change in Risk Factor scale
scores from pre-survey (average = 3.74) to post-survey (average = 3.75). This finding indicates that the EKG
program’s impact in terms of affecting Risk Factor beliefs that are pro-gun and pro-gang are greatest for and
specific to students in most need of an intervention—the high risk students.
3.74 3.75
8.14
5.96
0
2
4
6
8
10
12
Pre Post
Av
era
ge
on
Ris
k F
act
or
Sca
le o
ut
of
12
Pre- vs. Post-Risk Factor Scale Scores
Low Risk
High Risk

55
• Both high and low risk students showed change in level of agreement with this belief from pre-survey to post-
survey. However, the direction of the change was different for high risk and low risk students. Specifically, after
the EKG program, high risk students were less likely to agree that carrying gun a is a way to get respect (though
keep in mind that the item used to measure this belief on the post-survey was worded such that students were
asked if they believed that Jamari got respect by carrying a gun). Low risk students, on the other hand, were
more likely to agree that carrying a gun is a way to get respect. As noted in the previous section, maybe a point
to consider for EKG instructors in their lesson planning is a discussion with students about how students are
defining “respect.” Instructors may ask students: “Was Jamari respected or was he feared because he had the
gun?” Further students may consider the idea of how long Jamari’s perceived respect or fear lasted due to him
having the gun? Jamari’s control of others through the fear elicited by his gun was very short-lived and certainly
not worth the long-term consequences.
1.13
1.38
2.292.11
0
0.5
1
1.5
2
2.5
3
3.5
4
Pre Post
Av
era
ge
sco
re o
n i
tem
ou
t o
f 4
Pre- vs. Post-Endorsement of Belief:
Carrying a Gun = Respect
Low Risk
High Risk
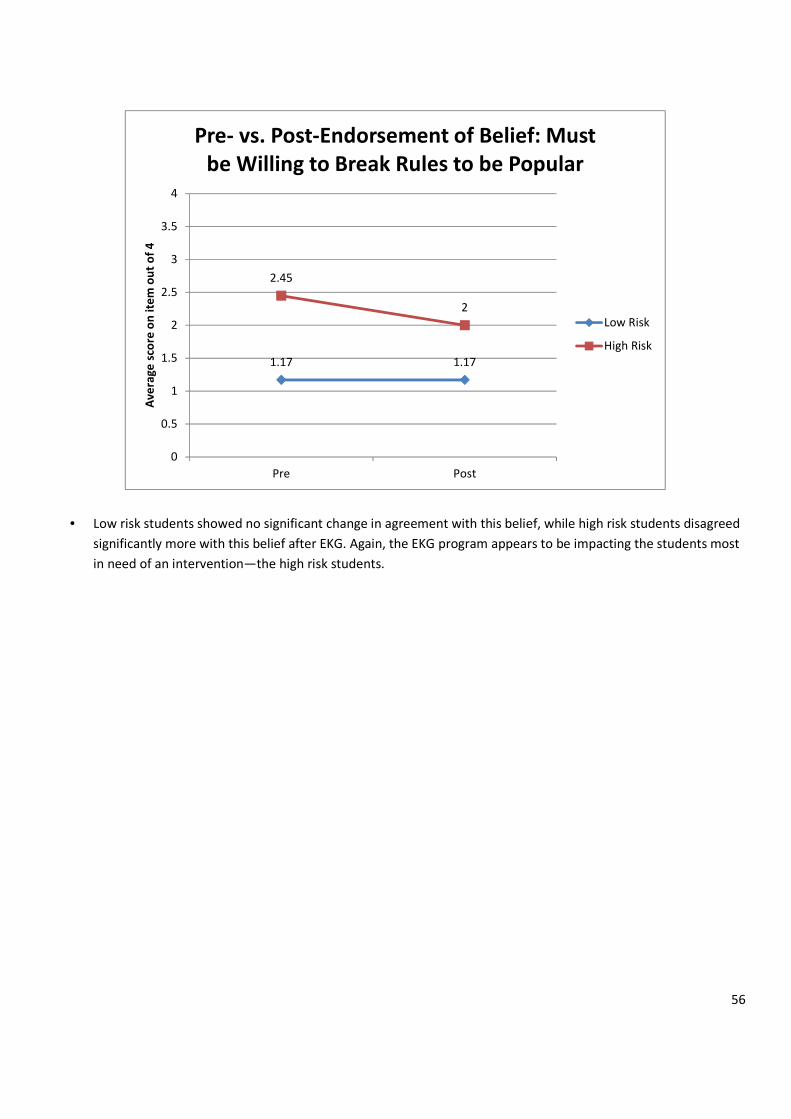
56
• Low risk students showed no significant change in agreement with this belief, while high risk students disagreed
significantly more with this belief after EKG. Again, the EKG program appears to be impacting the students most
in need of an intervention—the high risk students.
1.17 1.17
2.45
2
0
0.5
1
1.5
2
2.5
3
3.5
4
Pre Post
Av
era
ge
sco
re o
n i
tem
ou
t o
f 4
Pre- vs. Post-Endorsement of Belief: Must
be Willing to Break Rules to be Popular
Low Risk
High Risk
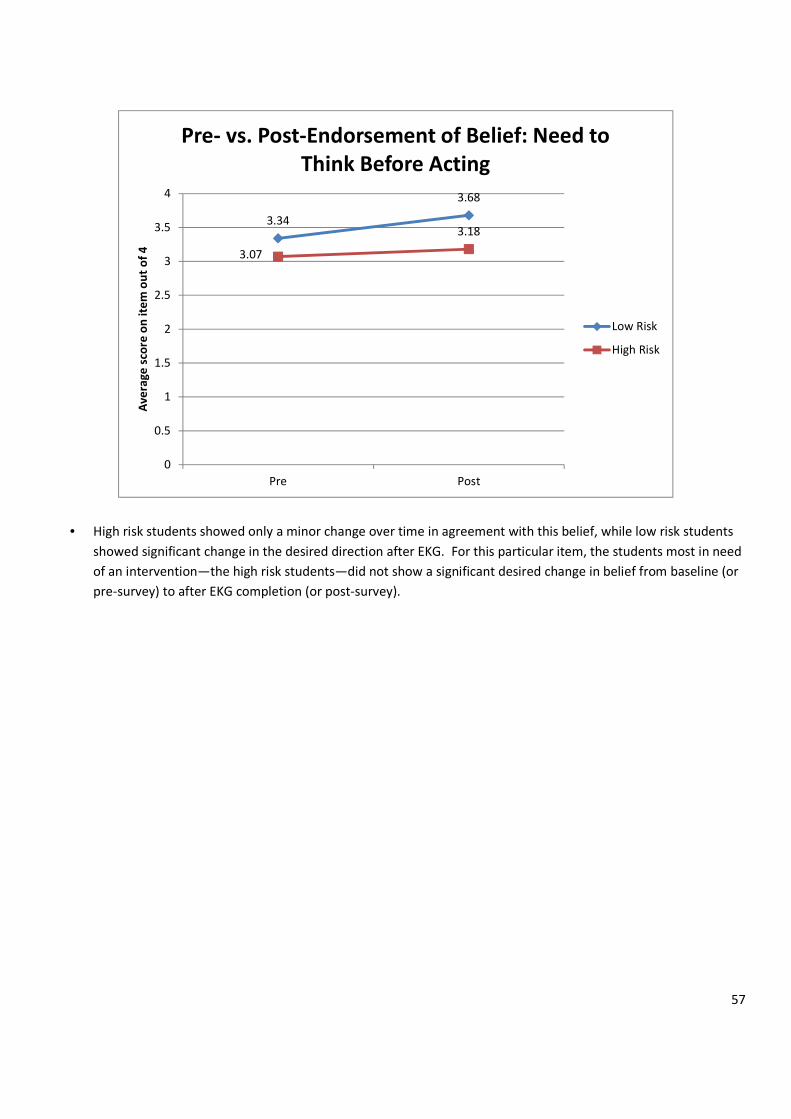
57
• High risk students showed only a minor change over time in agreement with this belief, while low risk students
showed significant change in the desired direction after EKG. For this particular item, the students most in need
of an intervention—the high risk students—did not show a significant desired change in belief from baseline (or
pre-survey) to after EKG completion (or post-survey).
3.34
3.68
3.07
3.18
0
0.5
1
1.5
2
2.5
3
3.5
4
Pre Post
Av
era
ge
sco
re o
n i
tem
ou
t o
f 4
Pre- vs. Post-Endorsement of Belief: Need to
Think Before Acting
Low Risk
High Risk

58
• The low risk students showed little change in agreement with this statement from pre-survey to post-survey,
while the high risk students showed a significant change in the desired direction. High risk students agreed that
they would be more willing to stop hanging out with a friend that started carrying a gun after the EKG program
as compared to before the EKG program.
3.033.16
2.03
2.31
0
0.5
1
1.5
2
2.5
3
3.5
Pre Post
Av
era
ge
sco
re o
n i
tem
ou
t o
f 4
Pre- vs. Post-Agreement with Intended
Behavior: If a close friend started carrying a
gun, I would no longer hang out with them
Low Risk
High Risk

59
• Low risk students showed no significant change in agreement with this statement from pre- to post-survey, but
high risk students showed a significant change in the desired direction from pre- to post-survey. Specifically,
high risk students were less likely to agree that gang members have each other’s backs after the EKG program
(post-survey) as compared to what they believed at baseline (pre-survey).
Positive Direct Program Impact & Efficacy to Make Decisions/Understand Consequences Scores
There were two factor scales on the post-survey that did not have a direct comparison on the pre-survey, but which
could be used to determine whether there was a significant difference between average scale scores for high risk vs. low
risk students. The low risk students scored significantly higher on average on the Positive Direct Program Impact scale
(average = 14.58) from the post-survey than did the high risk students (average = 12.19), t (1561) = 16.07, p < .001. This
means that low risk students as compared to high risk students felt that because of the EKG program that they were
better able to make good decisions, were more knowledgeable about the dangers of guns, were more likely to agree
that they learned that they need to think more about consequences of their actions, and were more likely to support the
belief that the best way to solve arguments is to talk things out. Also, the low risk students scored higher on the Efficacy
to Make Decisions/Understand Consequences scale (average = 11.02) than high risk students (average = 9.56), t (1562) =
11.73m p < .001. This means that after the EKG program, low risk students were more likely than high risk students to
agree that Jamari could have made better decisions throughout the video, that being a member of a gang makes it more
likely that someone would get in trouble at school or with police, and that they feel like they know what to do to resist
peer pressure.
1.44
1.2
3.38
1.85
0
0.5
1
1.5
2
2.5
3
3.5
4
Pre Post
Av
era
ge
sco
re o
n i
tem
ou
t o
f 4
Pre- vs. Post-Agreement with Belief: Gang
Members Always Have Each Other's Backs
Low Risk
High Risk

60
Longitudinal Outcomes
A 9-item longitudinal follow-up survey was given to EKG student respondents approximately three months after
students completed the EKG program. The purpose of the longitudinal survey was to determine whether the changes in
attitudes and intended behaviors were retained over time. To examine longitudinal retention, we compared the
students’ post-survey item scores to scores on the longitudinal survey items. If students retained the same level of
attitude change on the longitudinal survey that they had on the post-survey, then we can say that students retained the
effect. In other words, statistically we would hope to see no significant difference between post-survey and longitudinal
survey items scores. The p-value would be greater than .05.
In the event that students do not retain the same level of attitude or behavioral change from post-survey to longitudinal
survey, we may expect to still see a significant difference between student incoming baseline attitudes as measured
using the pre-survey as compared to the longitudinal survey. Thus, we can compare the longitudinal survey items scores
to the pre-survey item scores for students. When comparing the pre-survey item scores to the longitudinal survey item
scores, we would hope to see a statistically significant difference with a p-value of less than or equal to .05.
The bars in the graphic below show the average scores for each item on the pre (blue bar), post (red bar), and
longitudinal (green bar) surveys. The red line in the middle is the post-survey score which, in most cases, is the
highest/lowest of the three bars and demonstrates that students showed an increase/decrease in attitude or intended
behavior in the desired direction as compared to where they were when they began the EKG program (the blue line).
The green line shows how well the students retained the level of attitude/intended behavioral change as assessed on
the longitudinal follow-up survey. In most cases, the green line drops below or rises above the initial change level seen
in the red line (meaning that the effects of the EKG program did not last as strongly from the time that students
completed the EKG program to the point of longitudinal follow-up). However, in most cases, the green line does not fall
all the way back down or rise back to the level where students were at baseline (the blue line), meaning that some level
of attitude or intended behavioral change still persisted at the longitudinal follow-up period. Please note that two items
were not included in the post-survey and therefore no result are reported for the post-survey for those two items (i.e.,
no red line will be included). The two items were: 1) I feel like I know how to make smart decisions and 2) I do carry or
am likely to carry a gun on a regular basis.

61
0.0
0.5
1.0
1.5
2.0
2.5
3.0
3.5
4.0
Best way to
solve an
argument is to
talk it out
Gangs have each
other's backs
Illegal to carry
gun
Close friend
started carrying
gun, no longer
hang
Know how to
make smart
decisions
Carrying a gun is
dangerous
Know how to
resist peer
pressure
I carry a gun Have to be
willing to break
rules
Average Item Scores for EKG Participants on the Pre, Post, and Longitudinal
Surveys
Pre
Post
Long

62
For the item: “The best way to solve an argument is to talk things out”, students retained the same level of
attitude/intended behavioral change from post-survey to the longitudinal follow-up. This means that this particular item
was “sticky” for the students and that change was persistent over time. The change in score from post-survey to
longitudinal survey was NOT statistically significant (p = .078), meaning that the level of the desired attitude change
stayed the same.
For the rest of the items analyzed, there was statistically significant change in attitude/intended behavior from post-
survey to longitudinal follow-up meaning that students did not retain the same level of impact as seen immediately
following the EKG program on the post-survey. To determine if the longitudinal level of change was statistically and
significantly different from baseline, student pre-survey scores were compared to the longitudinal scores. If the change
was statistically significant at the p ≤ .05 level, then the score at longitudinal follow-up would be significantly different
from the score of the student as assessed at baseline (or pre-test), indicating that some level of impact still persisted
even though it was not as great as initially seen immediately following the EKG program (on the post-survey).
• Member of gangs have each other’s backs
o For this item, students did not retain the same level of disagreement at longitudinal follow-up as they
had on the post-survey. However, their level of disagreement at longitudinal follow-up was still
statistically significantly different from where the level of disagreement was at baseline (or pre-survey),
p = .008. This means that even though the students did not retain the same level of attitude change
longitudinally as they had immediately after the EKG program, they still retained a level of desired
attitude change at longitudinal follow-up that was different from where they were at baseline.
• It is illegal for me to carry a gun
o For this item, students did not retain the same level of agreement at longitudinal follow-up as they had
on the post-survey. Further, their level of agreement at longitudinal follow-up was not statistically
significantly different from where the level of agreement was at baseline (or pre-survey), p = .264. This
means students did not retain the same level of attitude change longitudinally as they had immediately
after the EKG program, nor was their level of attitude change at longitudinal follow-up different from
where they were at baseline.
• If a close friend started carrying a gun, I would no longer hang out with them
o For this item, students did not retain the same level of agreement at longitudinal follow-up as they had
at post-test. Further, their level of agreement at longitudinal follow-up was not statistically significantly
different from where the level of agreement was at baseline (or pre-survey), p = .537. This means
students did not retain the same level of intended behavioral change longitudinally as they had
immediately after the EKG program, nor was their level of intended behavioral change at longitudinal
follow-up different from where they were at baseline.
• Carrying a gun is dangerous
o For this item, students did not retain the same level of agreement at longitudinal follow-up as they had
on the post-survey. However, their level of agreement at longitudinal follow-up was still statistically
significantly different from where the level of disagreement was at baseline (or pre-test), p = .002. This
means that even though the students did not retain the same level of attitude change longitudinally as
they had immediately after the EKG program, they still retained a level of desired attitude change that
was different from where they were at baseline.

63
• I feel like I know how to resist peer pressure
o For this item, students did not retain the same level of agreement at longitudinal follow-up as they had
on the post-survey. However, their level of agreement at longitudinal follow-up was still statistically
significantly different from where the level of disagreement was at baseline (or pre-survey), p < .001.
This means that even though the students did not retain the same level of attitude change longitudinally
as they had immediately after the EKG program, they still retained a level of desired attitude change at
longitudinal follow-up that was different from where they were at baseline.
• I have to be willing to break some rules to be popular
o For this item, students did not retain the same level of agreement at longitudinal follow-up as they had
on the post-survey. Further, their level of agreement at longitudinal follow-up was not statistically
significantly different from where the level of agreement was at baseline (or pre-survey), p = .264. This
means students did not retain the same level of attitude change longitudinally as they had immediately
after the EKG program, nor was their level of attitude change at longitudinal follow-up different from
where they were at baseline.
• I know how to make smart decisions
o For this item, there was no post-survey comparison score available. However, the longitudinal change
for this item from pre-survey was in the desired direction and was statistically significant, p = .002.
• I am likely to or do carry a gun on a regular basis
o For this item, there was no post-survey comparison score available. However, the longitudinal change
for this item from the pre-survey was in the desired direction and was statistically significant, p < .001.

64
Like with the results reported previously, we were interested in understanding the longitudinal retention of EKG’s
impact on the high risk students specifically as the high risk students are the students who are most vulnerable to
potential violence and involvement with gangs/guns.
The best way to solve a problem is to talk it out
• Results revealed a statistically significant interaction, F (1, 198) = 19.80, p < .001. The high risk students agreed
more with this statement at longitudinal follow up than they did on the post-survey immediately following the
EKG program. Thus, the attitude strengthened over time for high risk students. For low risk students, there was
no significant change in agreement with this item from post-survey to longitudinal follow-up.
0
0.5
1
1.5
2
2.5
3
3.5
4
Post Long
Av
era
ge
le
ve
l o
f a
gre
em
en
t o
ut
of
4
High vs. Low Risk Post Retention of Attitude ChangeAgreement with: "The best way to solve an argument is to talk it out"
Low
High

65
Gang members have each other’s backs
Note that the item on the post-survey to measure this belief was: “I feel like Jamari’s boys will have his back and stand
up for him even after he goes to jail.” On the pre-survey and longitudinal survey, the item was worded: “Members of
gangs always have each other’s back and stand up for one another.”
• Results revealed a statistically significant interaction, F (1, 196) = 3.77, p = .054. The high risk students agreed
more with this statement at longitudinal follow up than they did on the post-survey immediately following the
EKG program. Thus, the attitude strengthened over time (which is not a desired outcome) for high risk students.
For low risk students, they agreed more with the statement from post-survey to longitudinal follow-up, though
the level of the increase in agreement was not as great as for the high risk students. Note the above statement
about the difference in the wording of the items from post-survey to longitudinal survey.
0
0.5
1
1.5
2
2.5
3
3.5
4
Post Long
Av
era
ge
le
ve
l o
f a
gre
em
en
t o
ut
of
4
High vs. Low Risk Post Retention of Attitude ChangeAgreement with: "Members of gangs have each other's back"
Low
High
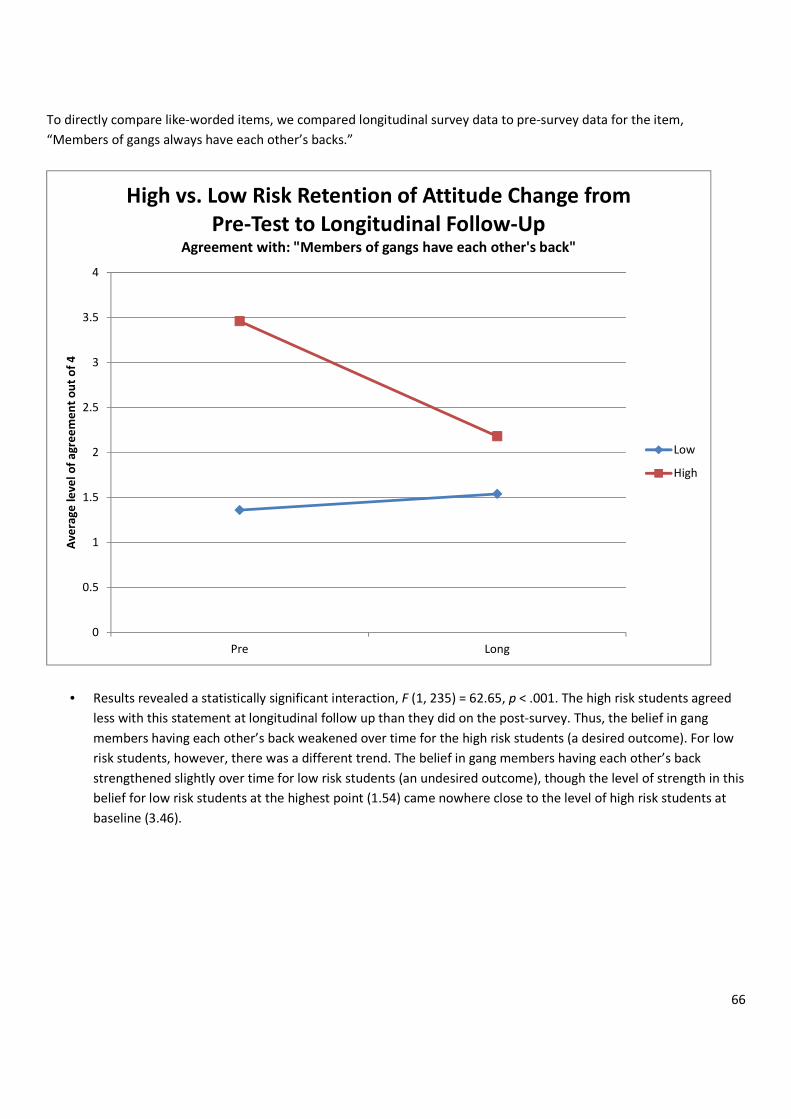
66
To directly compare like-worded items, we compared longitudinal survey data to pre-survey data for the item,
“Members of gangs always have each other’s backs.”
• Results revealed a statistically significant interaction, F (1, 235) = 62.65, p < .001. The high risk students agreed
less with this statement at longitudinal follow up than they did on the post-survey. Thus, the belief in gang
members having each other’s back weakened over time for the high risk students (a desired outcome). For low
risk students, however, there was a different trend. The belief in gang members having each other’s back
strengthened slightly over time for low risk students (an undesired outcome), though the level of strength in this
belief for low risk students at the highest point (1.54) came nowhere close to the level of high risk students at
baseline (3.46).
0
0.5
1
1.5
2
2.5
3
3.5
4
Pre Long
Av
era
ge
le
ve
l o
f a
gre
em
en
t o
ut
of
4
High vs. Low Risk Retention of Attitude Change from
Pre-Test to Longitudinal Follow-UpAgreement with: "Members of gangs have each other's back"
Low
High

67
Carrying a gun is illegal
• There was no statistically significant interaction for level of agreement with this item based on student risk level,
though the low risk students were less likely to agree at longitudinal follow-up as compared to directly after the
EKG program (on the post-survey) that carrying a gun was illegal.
0
0.5
1
1.5
2
2.5
3
3.5
4
Post Long
Av
era
ge
le
ve
l o
f a
gre
em
en
t o
ut
of
4
High vs. Low Risk Post Retention of Attitude ChangeAgreement with: "It is illegal for me to carry a gun"
Low
High

68
I feel like I know how to make smart decisions
• Note this item was only asked on the pre-survey and longitudinal survey. No post-survey data was available for
analysis. Results revealed a statistically significant interaction, F (1, 235) = 19.71, p < .001. The high risk students
agreed more with this statement at longitudinal follow up than they did on the pre-survey. The attitude
strengthened over time (which a desired outcome) for high risk students. For low risk students, there was not a
statistically significant change in level of agreement with this item. The low risk students had a very high average
level of agreement with this statement at baseline.
0
0.5
1
1.5
2
2.5
3
3.5
4
Pre Long
Av
era
ge
le
ve
l o
f a
gre
em
en
t o
ut
of
4
High vs. Low Risk Post Retention of Attitude ChangeAgreement with: "I feel like I know how to make smart decisions"
Low
High
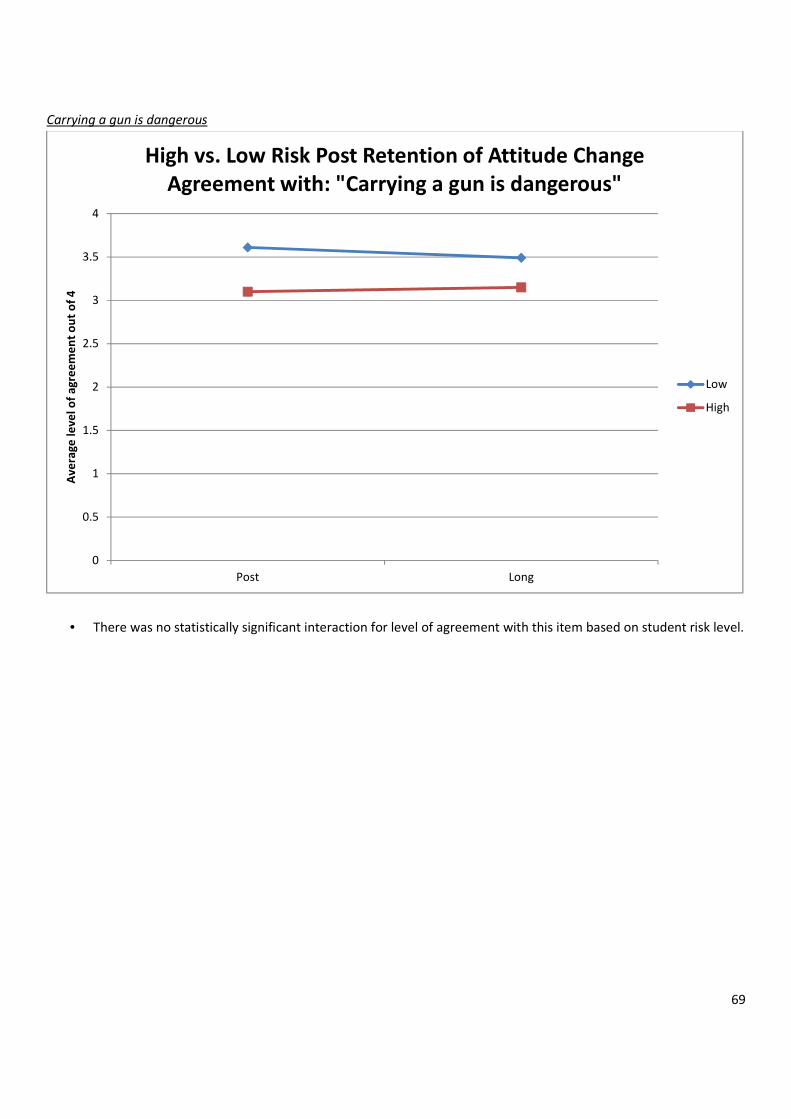
69
Carrying a gun is dangerous
• There was no statistically significant interaction for level of agreement with this item based on student risk level.
0
0.5
1
1.5
2
2.5
3
3.5
4
Post Long
Av
era
ge
le
ve
l o
f a
gre
em
en
t o
ut
of
4
High vs. Low Risk Post Retention of Attitude Change
Agreement with: "Carrying a gun is dangerous"
Low
High

70
I feel like I know what to do to resist peer pressure
• Results revealed a statistically significant interaction, F (1, 196) = 43.33, p < .001. The high risk students agreed
more with this statement at longitudinal follow up than they did on the post-survey immediately following the
EKG program. The attitude strengthened over time for high risk students. For low risk students, there was no
significant change in agreement with this item from post-survey to longitudinal follow-up. Again, low risk
students had a high average baseline level of agreement with this statement.
0
0.5
1
1.5
2
2.5
3
3.5
4
Post Long
Av
era
ge
le
ve
l o
f a
gre
em
en
t o
ut
of
4
High vs. Low Risk Post Retention of Attitude ChangeAgreement with: "I know what to do resist peer pressure"
Low
High
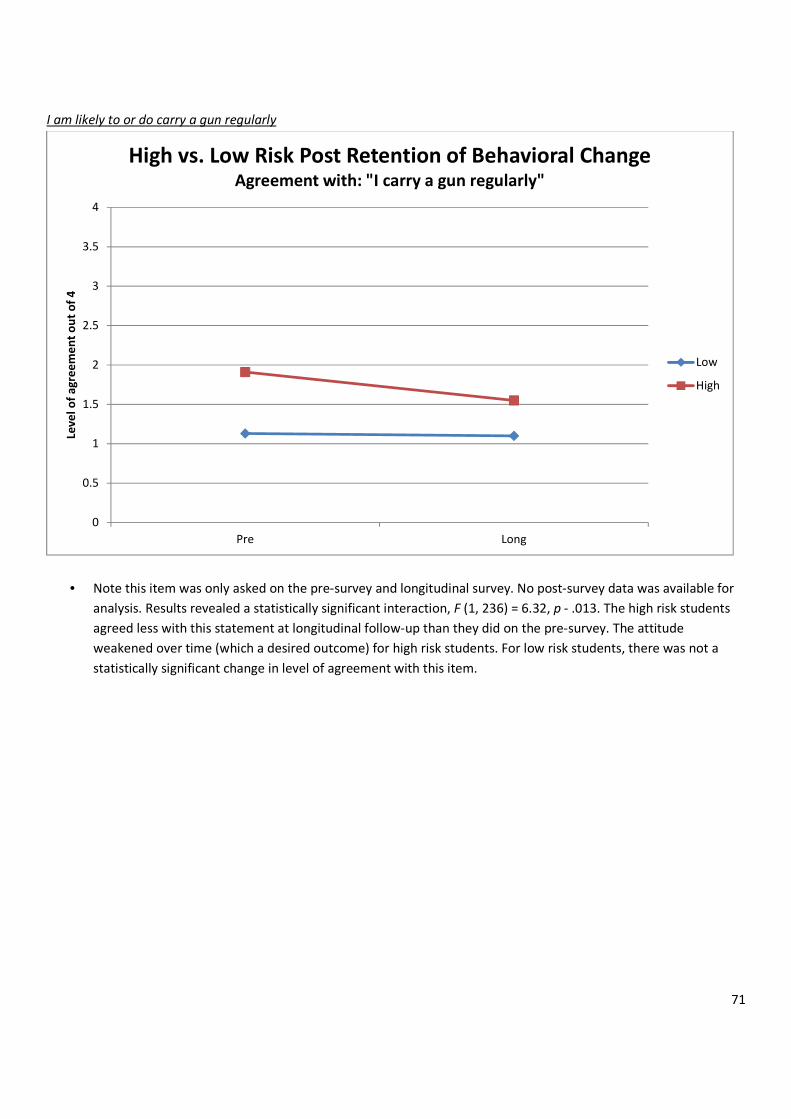
71
I am likely to or do carry a gun regularly
• Note this item was only asked on the pre-survey and longitudinal survey. No post-survey data was available for
analysis. Results revealed a statistically significant interaction, F (1, 236) = 6.32, p - .013. The high risk students
agreed less with this statement at longitudinal follow-up than they did on the pre-survey. The attitude
weakened over time (which a desired outcome) for high risk students. For low risk students, there was not a
statistically significant change in level of agreement with this item.
0
0.5
1
1.5
2
2.5
3
3.5
4
Pre Long
Lev
el
of
ag
ree
me
nt
ou
t o
f 4
High vs. Low Risk Post Retention of Behavioral ChangeAgreement with: "I carry a gun regularly"
Low
High

72
I have to be willing to break rules to be popular
• There was no statistically significant interaction for level of agreement with this item based on student risk level,
though the low risk students were more likely to agree with the item at longitudinal follow-up than they were on
the post-survey immediately following the EKG program.
0
0.5
1
1.5
2
2.5
3
3.5
4
Post Long
Av
era
ge
le
ve
l o
f a
gre
em
en
t o
ut
of
4
High vs. Low Risk Post Retention of Attitude ChangeAgreement with: "I have to be willing to break rules to be popular"
Low
High

73
Conclusions and Recommendations
• The EKG program showed desired effects on participant attitudes, beliefs, and intended behaviors. Specifically,
the program is reducing attitudes supportive of violence, gun carrying, and gangs and increasing attitudes
toward pro-social decision-making and abilities to think about consequences of actions.
o Importantly, the EKG program is making an impact on students most in need of an intervention—the
high risk students. The impact on high risk students appears to be retained longitudinally for most
content areas, and in some cases even strengthened over time for some content areas when comparing
the longitudinal data for data at the time of EKG program completion. For example, high risk students
showed continued and increased strength in the attitude that the best way to solve an argument is to
talk things out, decreased strength in the belief that gang members have each other’s backs, and
increased strength in perceived self-efficacy to resist peer pressure. It would be interesting to examine
what factors may be leading to the continued increase in pro-social attitudes and continued decrease in
undesirable attitudes for high risk students over time.
� One caveat to note about the longitudinal data is that a student had to present in school on the
day that the longitudinal follow-up survey was given. Our students who at highest risk may have
been the least likely to maintain regular attendance at school and therefore these students may
not have been represented in the longitudinal data used in our analyses. Though keep in mind
that students were identified as high risk based on their pre-survey risk factor scores, which had
to be greater than or equal to 18 out of 28).
• The longitudinal impact of the program persists in most content areas, though the strength of the effect is not as
great as it was immediately after the EKG program for most areas. Even when longitudinal impact was not as
strong as the effect immediately following the EKG program, in most areas the retained impact was still greater
than where students were at baseline upon entering the EKG program.
o It would be worthwhile to consider ways to continue to strengthen the EKG program’s longitudinal
impact, particularly for content areas where the longitudinal effect seems to wane some over time. Are
there ways to work with school officials to ensure that anti-gun and anti-gang messaging is sustained
over the school year and across all grade levels, either through booster programs as part of or as an
extension of EKG or through some other means? Further, are there programs that can involve parents
and the community to further strengthen attitude change? By educating students’ extended networks, it
can help reinforce anti-gun and anti-gang messaging by having student social networks also sending the
same messages that the received at school. Also, educating the community on issues, such as students’
reported ease of access to firearm and associated negative consequences for youth who have easy
access to firearms may be beneficial.
� One content area where students did not retain attitude change even from where they started
at baseline was that is illegal for the student to carry a gun. There appears to be some confusion
about this topic and this could be a content area where EKG instructors may want to spend
more time, possibly detailing differences in “carrying” guns for hunting or target shooting, laws
and regulations about who can “carry” a gun, and other scenarios which help students
understand laws and regulations specific to different ways to handle, carry, or possess a gun /
firearm.
� For most items, taking into account the student’s level of risk in interpreting the longitudinal
results was important. In other words, the level of sustained or even increased attitude change
depended upon the student’s level of risk.

74
• For EKG instructors, perhaps knowing the level of risk of students in their EKG classroom
may help EKG instructors tailor their discussions. For example, EKG instructors in the
schools with the highest representation of high risk students may want to review the
content that they are delivering to be sure that it is best suited for high risk students.
Are there ways the EKG program and/or discussion within the classrooms can be
strengthened for delivery in classroom in schools that are likely to have higher risk
students?
� It would be helpful to collect more longitudinal data from students with the Cumberland County
Schools to determine if the effects of the EKG program can be sustained for periods longer than
three months.
• One of the greatest perceived strengths of the EKG program is that it has normalized discussion of a once taboo
topic for students and staff within Cumberland County Schools. The EKG program promotes real discussion
about violence and what it takes to make good decisions when it is often not all that easy due to peer
influences. It would be interesting to do a few focus groups with students who have been through the EKG
program, EKG instructors, and staff at participating schools to better understand that changes that they have
seen in the school climate around attitudes and behaviors related to gun and gang violence since the EKG
program has been implemented.
• Another one of the perceived strengths of the EKG program involves the access and relationship building
between students and law enforcement officers. The EKG program allows for officers and students to engage in
a positive setting, and quite possibly allows for changes in attitudes about one another through a positive
learning experience. Many students have relatively few interactions with law enforcement officers, and those
types of interactions can be either scary or in response to a negative or violent situation.
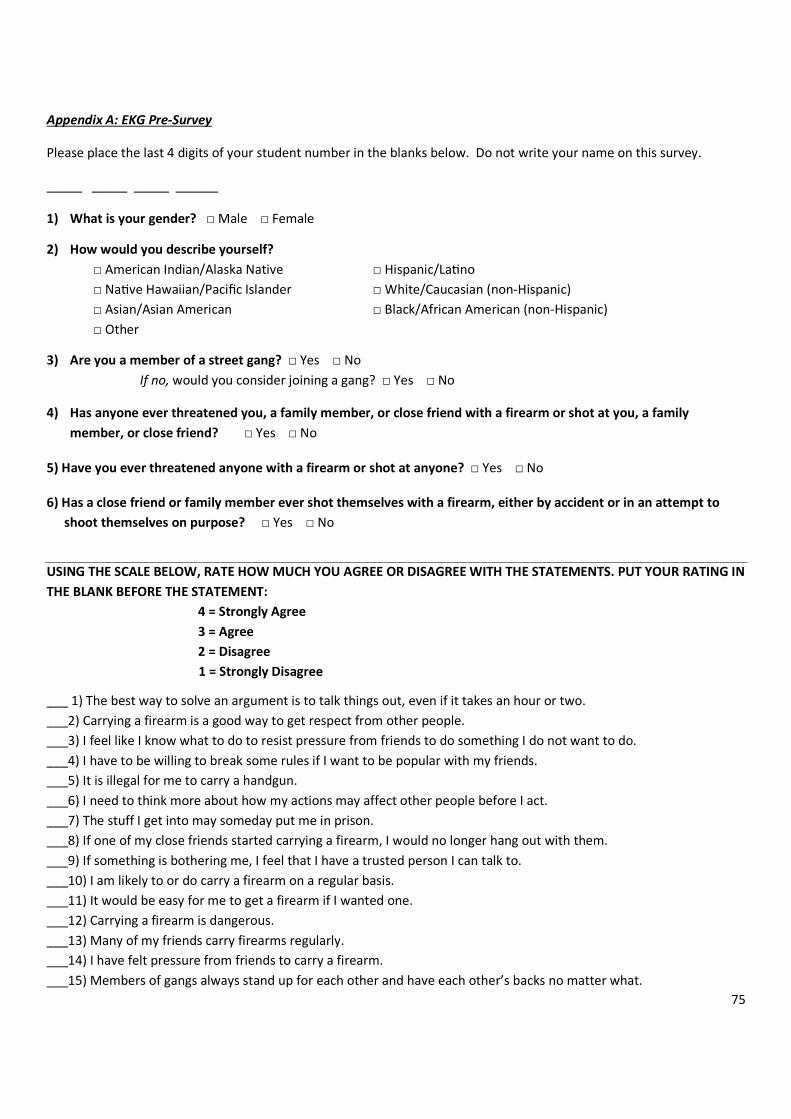
75
Appendix A: EKG Pre-Survey
Please place the last 4 digits of your student number in the blanks below. Do not write your name on this survey.
_____ _____ _____ ______
1) What is your gender? □ Male □ Female
2) How would you describe yourself?
□ American Indian/Alaska Native □ Hispanic/LaTno
□ NaTve Hawaiian/Pacific Islander □ White/Caucasian (non-Hispanic)
□ Asian/Asian American □ Black/African American (non-Hispanic)
□ Other
3) Are you a member of a street gang? □ Yes □ No
If no, would you consider joining a gang? □ Yes □ No
4) Has anyone ever threatened you, a family member, or close friend with a firearm or shot at you, a family
member, or close friend? □ Yes □ No
5) Have you ever threatened anyone with a firearm or shot at anyone? □ Yes □ No
6) Has a close friend or family member ever shot themselves with a firearm, either by accident or in an attempt to
shoot themselves on purpose? □ Yes □ No
USING THE SCALE BELOW, RATE HOW MUCH YOU AGREE OR DISAGREE WITH THE STATEMENTS. PUT YOUR RATING IN
THE BLANK BEFORE THE STATEMENT:
4 = Strongly Agree
3 = Agree
2 = Disagree
1 = Strongly Disagree
___ 1) The best way to solve an argument is to talk things out, even if it takes an hour or two.
___2) Carrying a firearm is a good way to get respect from other people.
___3) I feel like I know what to do to resist pressure from friends to do something I do not want to do.
___4) I have to be willing to break some rules if I want to be popular with my friends.
___5) It is illegal for me to carry a handgun.
___6) I need to think more about how my actions may affect other people before I act.
___7) The stuff I get into may someday put me in prison.
___8) If one of my close friends started carrying a firearm, I would no longer hang out with them.
___9) If something is bothering me, I feel that I have a trusted person I can talk to.
___10) I am likely to or do carry a firearm on a regular basis.
___11) It would be easy for me to get a firearm if I wanted one.
___12) Carrying a firearm is dangerous.
___13) Many of my friends carry firearms regularly.
___14) I have felt pressure from friends to carry a firearm.
___15) Members of gangs always stand up for each other and have each other’s backs no matter what.

76
Appendix B: EKG Post-Survey
Please place the last 4 digits of your student number in the blanks below. Do not write your name on this survey.
_____ _____ _____ ______
5) What is your gender? □ Male □ Female
6) How would you describe yourself?
□ American Indian/Alaska NaTve □ Hispanic/LaTno
□ NaTve Hawaiian/Pacific Islander □ White/Caucasian (non-Hispanic)
□ Asian/Asian American □ Black/African American (non-Hispanic)
□ Other
USING THE SCALE BELOW, RATE HOW MUCH YOU AGREE OR DISAGREE WITH THE STATEMENTS. PUT YOUR RATING IN
THE BLANK BEFORE THE STATEMENT:
4 = Strongly Agree
3 = Agree
2 = Disagree
1 = Strongly Disagree
___1) Jamari could have made better decisions throughout the video to avoid shooting his sister and going to jail.
___2) I feel like Jamari’s boys will have his back and stand up for him even after he goes to jail for the shooting.
___3) Jamari made a good decision when he accepted the firearm from his friends.
___4) Jamari got respect from other people by carrying a firearm.
___5) The best way to solve an argument is to talk things out, even if it takes an hour or two.
___6) I have to be willing to break some rules if I want to be popular with my friends.
___7) Being a member of a gang makes it more likely that someone would get in trouble at school or with police.
___8) It is illegal for me to carry a handgun.
___9) If one of my close friends started carrying a firearm, I would no longer hang out with them.
___10) Carrying a firearm is dangerous.
___11) I feel like I know what to do to resist pressure from friends to do something I do not want to do.
___12) I sometimes feel that violence is my only way to deal with problems.
___13) After this program, I feel like I will be able to make better decisions in my life.
___14) After this program, I feel like I know more about the dangers of having a firearm.
___15) After this program, I learned that I need to think about how my actions may affect other people before I act.
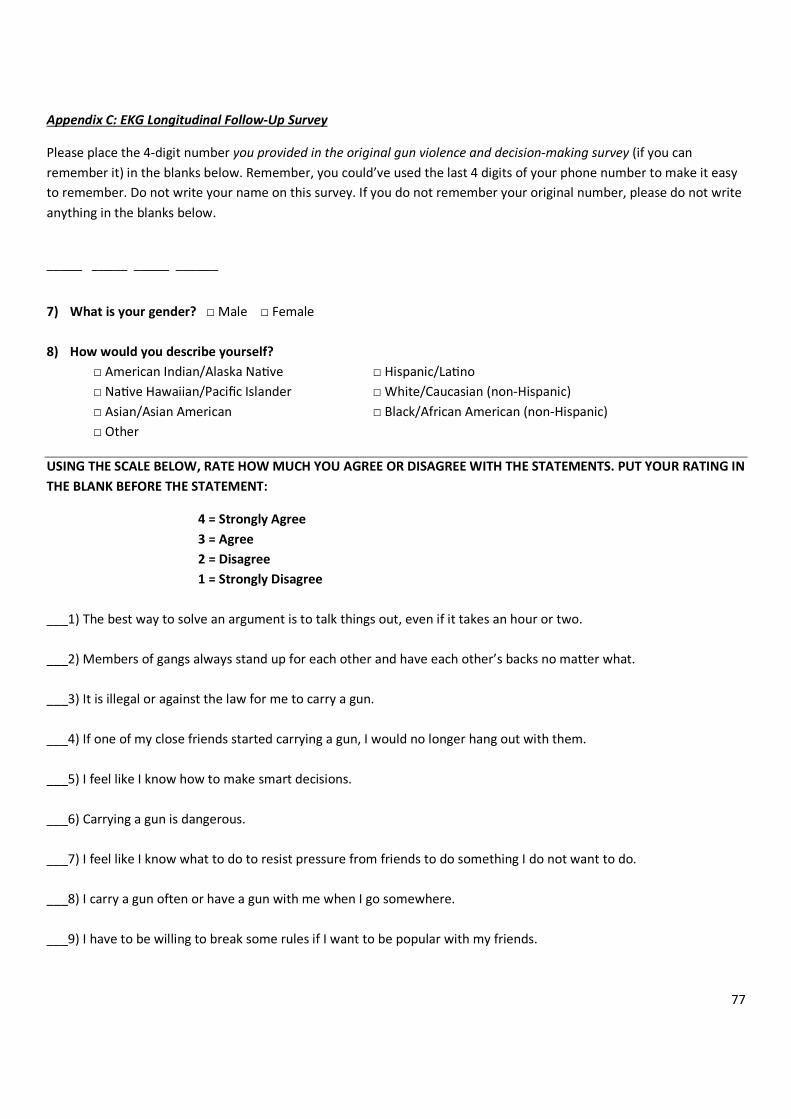
77
Appendix C: EKG Longitudinal Follow-Up Survey
Please place the 4-digit number you provided in the original gun violence and decision-making survey (if you can
remember it) in the blanks below. Remember, you could’ve used the last 4 digits of your phone number to make it easy
to remember. Do not write your name on this survey. If you do not remember your original number, please do not write
anything in the blanks below.
_____ _____ _____ ______
7) What is your gender? □ Male □ Female
8) How would you describe yourself?
□ American Indian/Alaska NaTve □ Hispanic/LaTno
□ NaTve Hawaiian/Pacific Islander □ White/Caucasian (non-Hispanic)
□ Asian/Asian American □ Black/African American (non-Hispanic)
□ Other
USING THE SCALE BELOW, RATE HOW MUCH YOU AGREE OR DISAGREE WITH THE STATEMENTS. PUT YOUR RATING IN
THE BLANK BEFORE THE STATEMENT:
4 = Strongly Agree
3 = Agree
2 = Disagree
1 = Strongly Disagree
___1) The best way to solve an argument is to talk things out, even if it takes an hour or two.
___2) Members of gangs always stand up for each other and have each other’s backs no matter what.
___3) It is illegal or against the law for me to carry a gun.
___4) If one of my close friends started carrying a gun, I would no longer hang out with them.
___5) I feel like I know how to make smart decisions.
___6) Carrying a gun is dangerous.
___7) I feel like I know what to do to resist pressure from friends to do something I do not want to do.
___8) I carry a gun often or have a gun with me when I go somewhere.
___9) I have to be willing to break some rules if I want to be popular with my friends.