edinburgh research explorer · materials and methods mice phospho1-r74x null mutant (phospho1-/-)...
TRANSCRIPT

Edinburgh Research Explorer
Skeletal Mineralization Deficits and Impaired Biogenesis andFunction of Chondrocyte-Derived Matrix Vesicles in Phospho1(-/-) and Phospho1/Pit1 Double Knockout Mice
Citation for published version:Yadav, MC, Bottini, M, Cory, E, Bhattacharya, K, Kuss, P, Narisawa, S, Sah, RL, Beck, L, Fadeel, B,Farquharson, C & Millán, JL 2016, 'Skeletal Mineralization Deficits and Impaired Biogenesis and Function ofChondrocyte-Derived Matrix Vesicles in Phospho1(-/-) and Phospho1/Pit1 Double Knockout Mice' Journal ofBone and Mineral Research, vol 31, no. 6, pp. 1275-1286. DOI: 10.1002/jbmr.2790
Digital Object Identifier (DOI):10.1002/jbmr.2790
Link:Link to publication record in Edinburgh Research Explorer
Document Version:Peer reviewed version
Published In:Journal of Bone and Mineral Research
General rightsCopyright for the publications made accessible via the Edinburgh Research Explorer is retained by the author(s)and / or other copyright owners and it is a condition of accessing these publications that users recognise andabide by the legal requirements associated with these rights.
Take down policyThe University of Edinburgh has made every reasonable effort to ensure that Edinburgh Research Explorercontent complies with UK legislation. If you believe that the public display of this file breaches copyright pleasecontact [email protected] providing details, and we will remove access to the work immediately andinvestigate your claim.
Download date: 30. Jul. 2018

Matrix vesicle-mediated initiation of skeletal mineralization depends on
PHOSPHO1 and PiT-1 function
Manisha C. Yadav1, Massimo Bottini1, Pia Kuss1, Esther Cory2, Robert L. Sah2, Laurent
Beck3, Colin Farquharson4 and José Luis Millán1
1Sanford Children’s Health Research Center, Sanford-Burnham Medical Research
Institute, La Jolla, CA, USA. 2Department of Bioengineering, University of California
San Diego, La Jolla, CA, USA. 3INSERM U791, Centre for Osteoarticular and Dental
Tissue Engineering (LIOAD), Nantes, Cedex, France. 4The Roslin Institute, The
University of Edinburgh, Easter Bush, Roslin, Midlothian, EH25 9RG, Scotland, UK
Running title: MV-mediated initiation of mineralization
Corresponding author:
José Luis Millán, Ph. D.
Professor
Sanford-Burnham Medical Research Institute
10901 North Torrey Pines Road
La Jolla, CA 92037
Tel: 858-646-3130
Email: [email protected]
Word count:
Conflict of interest: All authors report no conflicts of interest.
ABSTRACT
We have previously shown that ablation of either the Phospho1 or Alpl gene, encoding
PHOSPHO1 and tissue-nonspecific alkaline phosphatase (TNAP) respectively, lead to
hyperosteoidosis but that their chondrocyte- and osteoblast-derived matrix vesicles
(MVs) are able to initiate mineralization. In contrast, the double ablation of Phospho1
and Alpl completely abolishes initiation and progression of skeletal mineralization. We
argued that MVs initiate mineralization by a dual mechanism: PHOSPHO1-mediated
intravesicular generation of Pi and phosphate transporter-mediated influx of Pi generated
perivesicularly. To test this hypothesis, we generated mice with the col2a1-driven cre-
mediated ablation of Pit1 alone or in combination with a Phospho1 gene deletion.
Pit1col2/col2 mice did not show any major phenotypic abnormalities, while severe skeletal
deformities were observed in the [Phospho1-/-; Pit1col2/col2] double knockout mice that
were more pronounced than those observed in the Phospho1-/- mice. Histological analysis
of 15 day old [Phospho1-/-; Pit1col2/col2] bones showed growth plate abnormalities with a
shorter hypertrophic chondrocyte zone and extensive hyperosteoidosis. The [Phospho1-/-;
Pit1col2/col2] skeleton displayed significantly decreases in BV/TV%, trabecular number and
bone mineral density (BMD) with increased trabecular separation for both tibia and
femur compared to Phospho1-/- mice. Three-point bending analysis also showed that
[Phospho1-/-; Pit1col2/col2] bones take longer deflection to break and show decreased
maximum load and increased post-yield deflection suggesting the elastic nature of these
bones. By atomic force microscopy (AFM) we found that approximately 70% of
[Phospho1-/-; Pit1col2/col2] MVs were empty, in comparison to about 20-30 % empty MVs
for the WT, Phospho1-/- and Pit1col2/col2 MVs. We also found a significant decrease in the

number of MVs produced by both Phospho1-/- and [Phospho1-/-; Pit1col2/col2] chondrocytes.
These data proves the involvement of PiT-1 function in the initiation of skeletal
mineralization and it provides compelling evidence that PHOSPHO1 mediates MV
biogenesis.

INTRODUCTION
Mineralization of cartilage and bone occurs by a series of physicochemical and
biochemical processes that together facilitate the deposition of hydroxyapatite in specific
areas of the extracellular matrix (ECM). Tissue-nonspecific alkaline phosphatase (TNAP)
plays a crucial role in restricting the concentration of the mineralization inhibitor
inorganic pyrophosphate (PPi) to maintain a Pi/PPi ratio permissive for normal
propagation of mineral in the extracellular matrix (Moss et al., 1967; Majeska et al.,
1975; Johnson et al., 2000; Hessle et al., 2002; Murshed et al., 2005; Yadav et al., 2011;
Millán, 2012; McKee et al., 2013). Alpl-/- mice chondrocyte and osteoblast-derived matrix
vesicles (MVs) however are still able to initiate mineralization (Anderson et al., 1997,
2004), indicating that other enzymes or mechanisms are involved in the intravesicular
initiation of mineralization. Subsequently, we showed that PHOSPHO1, an enzyme that
uses phosphocholine and phosphoethanolamine to concentrate Pi inside MVs, is also
required for proper bone mineralization (Roberts et al., 2007; Huesa et al., 2011; Yadav
et al., 2011; McKee et al., 2013), as the lack of PHOSPHO1 (Phospho1-/- mice) also
leads to skeletal and dental hypomineralization. Importantly, the [Alpl-/-; Phospho1-/-]
double knockout mice are embryonic lethal and the E16.5 embryos show complete
absence of skeletal mineralization and MVs devoid of mineral (Yadav et al., 2011). We
hypothesized that MV-mediated initiation of mineralization results from a dual
mechanism, i.e. PHOSPHO1-mediated intra-vesicular production and transporter-
mediated influx of Pi. Two related type III Na/Pi co-transporters, PiT-1/Glvr1 and PiT-
2/Ram, are both expressed by chondrocytes and osteoblasts, but literature reports that
PiT-1 is the major mediator of Pi influx in these cell types (Nielsen et al., 2001; Yoshiko

et al., 2007; Polewski et al., 2010). Thus, to test this hypothesis we generated mice with a
conditional ablation of PiT-1 gene (Slc20a1, here referred to as Pit1) alone or in the
Phospho1-/- background. Our data proves the involvement of PiT-1 function in the
initiation of endochondral ossification and also points to PHOSPHO1 as an enzyme
controlling MV biogenesis.

MATERIALS AND METHODS
Mice
Phospho1-R74X null mutant (Phospho1-/-) mice were generated as described (Yadav et
al., 2011). The generation and characterization of the Pit1flox/flox mice was reported earlier
(Beck et al., 2010). To generate mice lacking both PHOSPHO1 and PiT-11, Phospho1-/-
mice were crossed to Pit1flox/flox mice and double heterozygote mice were used to generate
[Phospho1-/-; Pit1flox/flox] double mutant mice. These mice were then bred with Col2a1-cre
mice to generate [Pit1flox/flox; Col2a1-cre], here named Pit1col2/col2 and [Phospho1-/-;
Pit1col2/col2] mice. Phospho1-/- genotypes were determined using genomic DNA, PCR and
restriction digestion by BsrD1 restriction enzyme (Yadav et al., 2011). Pit1col2/col2 and
[Phospho1-/-; Pit1col2/col2] mice were genotyped by PCR. The primer sequences for
genotyping were: Phospho1: F 5’ TCCTCCTCACCTTCGACTTC -3’, R 5’-
ATGCGGCGGAATAAACTGT -3’, Pit1flox/flox: F 5’ AAGGCATTTGTCAGCCCAGTC-
3’, R 5’ ATCGATCCACTCAGTCTAGTGC-3’ and Col2a1-cre: zndhhc14 F-5’
GGCAGGAAAGAGTCCAGGTATG-3’, zndhhc14 R-5’ –
TAAGCACTGACAGATGACCTGC-3’, Col2a1-cre F-5’
TTAGCCTGGATAGAGCAACCGC-3’.
Tissue and plasma collection and histological studies
Mice were anesthetized by intraperitoneal injection of Avertin and blood was collected
by cardiac puncture. Whole-body, long bones and spine radiographic images were taken
using an MX20 Specimen Radiograph System (Faxitron X-ray Corporation, Chicago, IL,
USA) at 1 month of age. The lumbar spines, tibias, and femurs of 15-days-old mice were
fixed in PBS containing 4% (vol/vol) paraformaldehyde. Paraffin or plastic sections were
stained with Von Kossa/Van Gieson stain using standard procedures (Murshed et al.,
2005; Millan et al., 2008 and Narisawa et al., 2001). Von Kossa/Van Gieson–stained
slides were used for quantification of osteoid volume using the Bioquant Osteo Software
(Bioquant Osteoanalysis Co., Nashville, TN, USA.
For PiT-1 immunohistochemistry, bone tissues were decalcified with 0.125 M
EDTA/10% formalin in H2O (pH 7.2) for five days after fixation, and processed for
paraffin sectioning. Immunostaining was performed using a standard avidin-biotin
complex protocol using the Vectastatin ABC kit (Vector laboratories Inc, Burlingame,
CA). Rabbit anti-mouse OPN antibody (Santa Cruz Biotechnology Inc, Santa Cruz, CA,
USA) was used for detection of PiT-1.
Pit1 gene expression
Primary chondrocytes from WT and Pit1col2/col2 mice were isolated from the knee joint
growth plates of 5 day-old pups by collagenase digestion, as described previously (Yadav
et al., 2011). RNA was extracted using RNAeasy Pus Kit (Qiagen, Valencia, CA, USA).
Specific RNA transcript (mRNA) for Pit1 was quantified by real-time PCR using dual-
labeled hydrolysis probes (FAM-TAMRA). Pit1 primers and probe sequences are as
follows: F-5’GGCTCAGGTGTAGTGACCCT3’, R-5’
CACATCTATCAAGCCGTTCC3’ and FAM-TAMRA Probe-
5’CGAAACTGTGGGCTCCGCC3’.
Biochemical assays
Blood was collected by cardiac puncture into lithium heparin tubes and plasma was
collected by centrifugation at 5000 rpm for 10min. Alkaline phosphatase activity in
plasma was measured using a previously reported method (Millán et al., 2008). PPi levels
were measured using activated charcoal and 3H method as we previously reported
(Mcguire et al., 1980; Yadav et al, 2011). Calcium levels were measured using the
cresolphthalein complexone liquicolor test kit (Stanbio, Boerne, Tx, USA) according to
the manufacturer’s protocol.
Micro–computed tomography (µCT)
Mice were euthanized at 1 month of age, the tibias and femurs dissected and fixed in 4%
paraformaldehyde. Samples were imaged on a µCT scanner (Skyscan 1076, Kontich,
Belgium). Samples were wrapped in tissue paper that was moistened with phosphate
buffered saline (PBS), and scanned at 9µm voxel size, applying an electrical potential of
50 kVp and current of 200uA, using a 0.5mm aluminum filter. Mineral density was
determined by calibration of images against 2mm diameter hydroxyapatite (HA) rods
(0.25 and 0.75 gHA/cm3). Additionally, a beam hardening correction algorithm was
applied prior to image reconstruction.
To visualize and determine bone histomorphometric parameters, the software,
Dataviewer, CTAn, CTVol and CTVox (all Skyscan, Kontich, Belgium) was used.
Cortical bone analysis was performed on the femur and tibia midshafts. The volumes of
interest were selected in reference to an identified landmark1. Since all animals were 1

month of age, the volumes of interest were (1) 3600-4500 µm proximal to the distal
femur growth plate and (2) 3600-4500 µm distal to the tibia proximal growth plate. The
cortical bone in this region was selected by automatic contouring of the periosteal tissue
excluding the marrow cavity. A global threshold was used to identify cortical bone and
an erosion of one pixel was performed to eliminate partial volume effects. From these
regions of femoral and tibial cortical bone, the following parameters were determined:
cross-sectional tissue area (T.Ar), cross-sectional cortical bone area (B.Ar), cortical bone
area fraction (B.Ar/T.Ar), cross-sectional bone thickness (Cs.Th) and tissue mineral
density (TMD).
Trabecular bone analysis was performed at the distal femoral metaphysis and proximal
tibial metaphysis. The regions of interest were (1) 360-2160 µm proximal to the distal
femoral growth plate, and (2) 360-2160 µm distal to the proximal tibial growth plate. The
trabecular region was selected by automatic contouring. An adaptive threshold (using the
mean maximum and minimum pixel intensity values of the surrounding ten pixels) was
used to identify trabecular bone and an erosion of one pixel was performed to eliminate
partial volume effects. From these regions of femoral and tibial trabecular bone the
following parameters were determined: tissue volume (TV), trabecular bone volume
(BV), trabecular bone volume fraction (BV/TV), trabecular thickness (Tb.Th), trabecular
separation (Tb.Sp), trabecular number (Tb.N), structure model index (SMI), trabecular
pattern factor (Tb.Pf), and bone mineral density (BMD). µCT analyses of the trabecular
bone was performed on a 2mm section of the right tibial and femoral metaphysis 250 µm
distal to the growth plate using a Skyscan 1172 instrument (Kontlich, Belgium) set at 60

kV, 150 µA and at a resolution of 5 µm. The cortical analysis was conducted on a 250 µm
section 2.25 mm distal of the reference growth plate. The spines were dissected from the
cervical to the second lumbar vertebrae and the thoracic vertebrae scanned at a resolution
of 20µm. The images were reconstructed using the Skyscan NRecon program, analyzed
using Skyscan CTAn and the 3 dimensional (3D) models visualized in CTvol software
(Yadav et al., 2011).
3-point bending for the determination of bone stiffness and breaking strength
An Instron 3342 materials testing machine (Instron, Norwood, MA, USA) fitted with a 2
kN load cell was used to determine bone stiffness and breaking strength (Aspden, 2003).
The span was fixed at 5.12 mm for femurs. The cross-head was lowered at 1 mm/min and
data were recorded after every 0.2 N change in load and every 0.1 mm change in
deflection. Each bone was tested to fracture. Failure and fracture points were identified
from the load-extension curve as the point of maximum load and where the load rapidly
decreased to zero, respectively. The maximum stiffness was defined as the maximum
gradient of the rising portion of this curve, and the yield point, the point at which the
gradient reduced to 95% of this value. Both values were calculated from a polynomial
curve fitted to the rising region of the load-extension curve in Mathcad (Mathsoft
Engineering and Education Inc., Cambridge, MA, USA).
Atomic force microscopy (AFM)
A drop (5 µL) of each MV solution in Tris-buffered-saline was spotted on freshly cleaved
mica substrates (Ted Pella, Redding, CA) and allowed to stand for 5 min. Next, 5 µL of
glutaraldehyde solution (8% in H2O, Sigma-Aldrich, St. Louis, MO) was dropped onto
the samples. The substrates were stored inside a desiccators at room temperature for 24 h.
AFM images of dried samples were recorded in air by means of an 5500 atomic force
microscope (Agilent Technologies, Santa Clara, CA) equipped with an open-loop probe
working in non-contact (AAC) mode. Silicon-nitride cantilevers having a nominal
resonance frequency of ~190 kHz (NanosensorsTM, Neuchatel, Switzerland) were used.
Tridimensional AFM images were generated by PicoView software (Agilent
Technologies).
AFM images were used to gather information about the morphology and number of MVs
in each sample. The cross section of N=100 MVs in each sample was recorded and the
MVs' diameter was calculated as the peak value in the cross section. The number of MVs
in each sample was calculated as number of MVs per µm2 by counting the globular
features in N=20 scan fields (2 × 2 µm). Mean and SD values were obtained through
Gaussian fit of the value distributions.
Statistical analysis
All measurements were performed at least in triplicate. Results are expressed as mean ±
SEM. The data were analyzed using Student’s t test. P values less than 0.05 were
considered significant. For AFM, statistical differences among samples were calculated
by non-parametric Mann–Whitney U analysis performed by SPSS Statistics (IBM
Corporation, Armonk, NY).
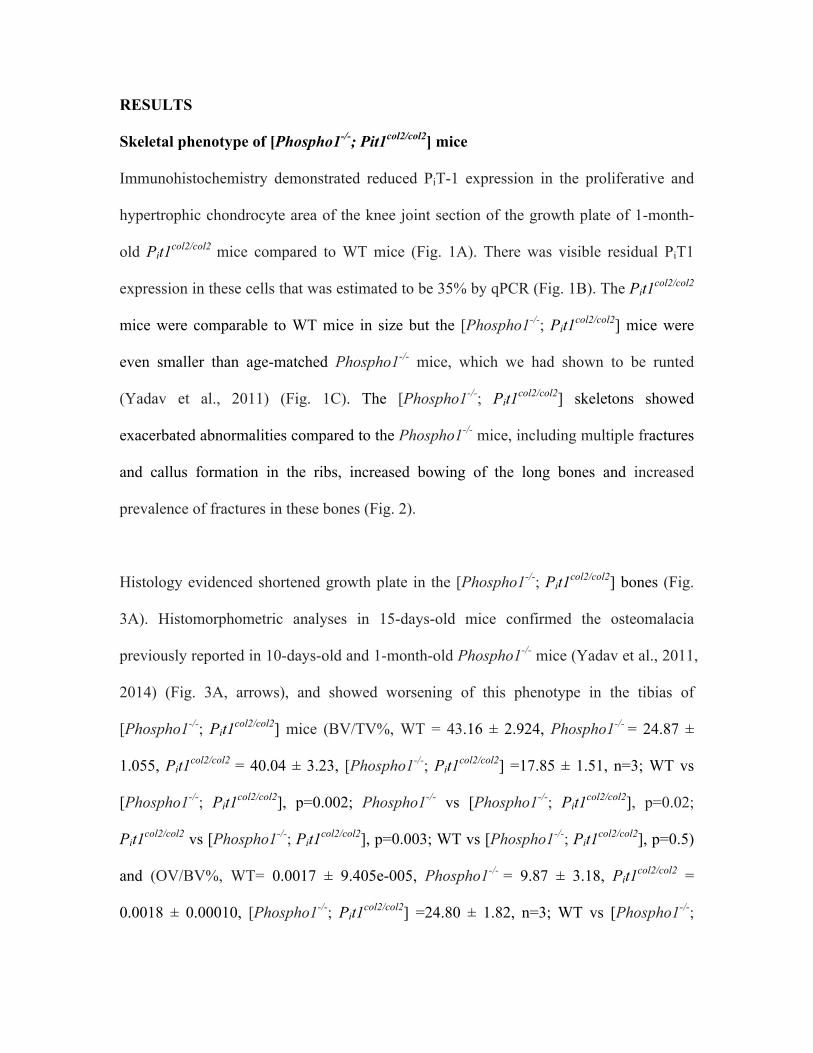
RESULTS
Skeletal phenotype of [Phospho1-/-; Pit1col2/col2] mice
Immunohistochemistry demonstrated reduced PiT-1 expression in the proliferative and
hypertrophic chondrocyte area of the knee joint section of the growth plate of 1-month-
old Pit1col2/col2 mice compared to WT mice (Fig. 1A). There was visible residual PiT1
expression in these cells that was estimated to be 35% by qPCR (Fig. 1B). The Pit1col2/col2
mice were comparable to WT mice in size but the [Phospho1-/-; Pit1col2/col2] mice were
even smaller than age-matched Phospho1-/- mice, which we had shown to be runted
(Yadav et al., 2011) (Fig. 1C). The [Phospho1-/-; Pit1col2/col2] skeletons showed
exacerbated abnormalities compared to the Phospho1-/- mice, including multiple fractures
and callus formation in the ribs, increased bowing of the long bones and increased
prevalence of fractures in these bones (Fig. 2).
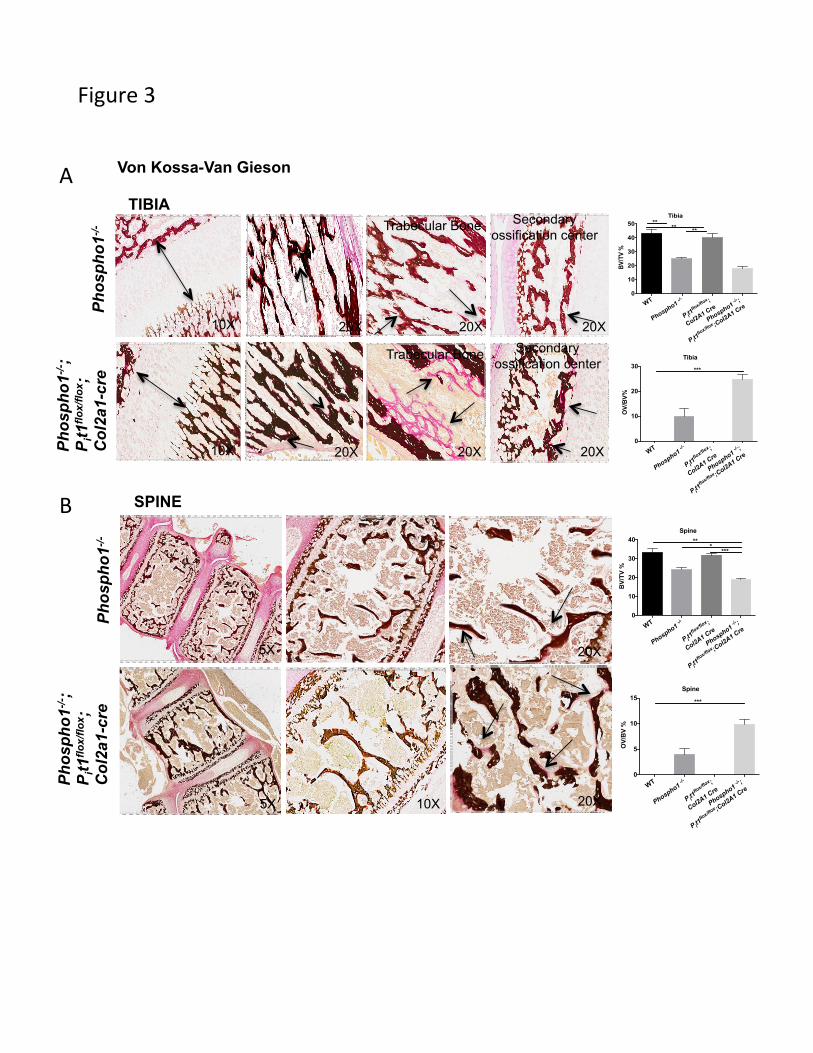
Histology evidenced shortened growth plate in the [Phospho1-/-; Pit1col2/col2] bones (Fig.
3A). Histomorphometric analyses in 15-days-old mice confirmed the osteomalacia
previously reported in 10-days-old and 1-month-old Phospho1-/- mice (Yadav et al., 2011,
2014) (Fig. 3A, arrows), and showed worsening of this phenotype in the tibias of
[Phospho1-/-; Pit1col2/col2] mice (BV/TV%, WT = 43.16 ± 2.924, Phospho1-/- = 24.87 ±
1.055, Pit1col2/col2 = 40.04 ± 3.23, [Phospho1-/-; Pit1col2/col2] =17.85 ± 1.51, n=3; WT vs
[Phospho1-/-; Pit1col2/col2], p=0.002; Phospho1-/- vs [Phospho1-/-; Pit1col2/col2], p=0.02;
Pit1col2/col2 vs [Phospho1-/-; Pit1col2/col2], p=0.003; WT vs [Phospho1-/-; Pit1col2/col2], p=0.5)
and (OV/BV%, WT= 0.0017 ± 9.405e-005, Phospho1-/- = 9.87 ± 3.18, Pit1col2/col2 =
0.0018 ± 0.00010, [Phospho1-/-; Pit1col2/col2] =24.80 ± 1.82, n=3; WT vs [Phospho1-/-;

Pit1col2/col2], p=0.0002; Phospho1-/- vs [Phospho1-/-; Pit1col2/col2], p=0.04; Pit1col2/col2 vs
[Phospho1-/-; Pit1col2/col2], p=0.0002; WT vs [Phospho1-/-; Pit1col2/col2], p=0.75) (Fig. 2A).
There was a complete absence of mineralization in the trabecular bone in certain areas
(arrows). The secondary ossification centers also show increased amount of osteoid in
these mice. The vertebral sections also showed the presence of widespread
hyperosteoidosis in the Phospho1-/- mice (Fig. 3B, arrows), which further increased in
[Phospho1-/-; Pit1col2/col2] mice (BV/TV%, WT= 33.22 ± 2.01, Phospho1-/- = 24.08 ± 1.35,
Pit1col2/col2 =31.96±0.61, [Phospho1-/-; Pit1col2/col2] =18.87±0.64, n=3; WT vs [Phospho1-/-;
Pit1col2/col2], p=0.002; Phospho1-/- vs [Phospho1-/-; Pit1col2/col2], p=0.02; Pit1col2/col2 vs
[Phospho1-/-; Pit1col2/col2], p=0.0001; WT vs [Phospho1-/-; Pit1col2/col2], p=0.58) and
(OV/BV%, WT= 0.0028 ± 0.00017, Phospho1-/- = 3.96 ± 1.16, Pit1col2/col2 = 0.0027 ±
0.00011, [Phospho1-/-; Pit1col2/col2] =9.82 ± 0.99, n=3; WT vs [Phospho1-/-; Pit1col2/col2],
p=0.0006; Phospho1-/- vs [Phospho1-/-; Pit1col2/col2], p=0.02; Pit1col2/col2 vs [Phospho1-/-;
Pit1col2/col2], p=0.0006; WT vs [Phospho1-/-; Pit1col2/col2], p=0.68) (Fig. 3B).
!
μCT analysis concurred with the radiographic and histology data showing enhanced
bowing of the long bones in both tibia and femur of the [Phospho1-/-; Pit1col2/col2]
compared to the Phospho1-/- mice (Fig. 4A, B). Trabecular parameters of the femur
(Table 1) of [Phospho1-/-; Pit1col2/col2] compared to Phospho1-/- mice showed
significantly decreased BV/TV% (p=0.003), increased trabecular separation (p= 0.02),
decreased trabecular number p=0.002) and decreased bone mineral density (p=0.002).
Similarly for the tibia (Table 2) the [Phospho1-/-; Pit1col2/col2] compared to Phospho1-/-
mice showed significantly decreased BV/TV% (p=0.003) increased trabecular separation
(p= 0.002), decreased trabecular number (p=0.001) and decreased bone mineral density
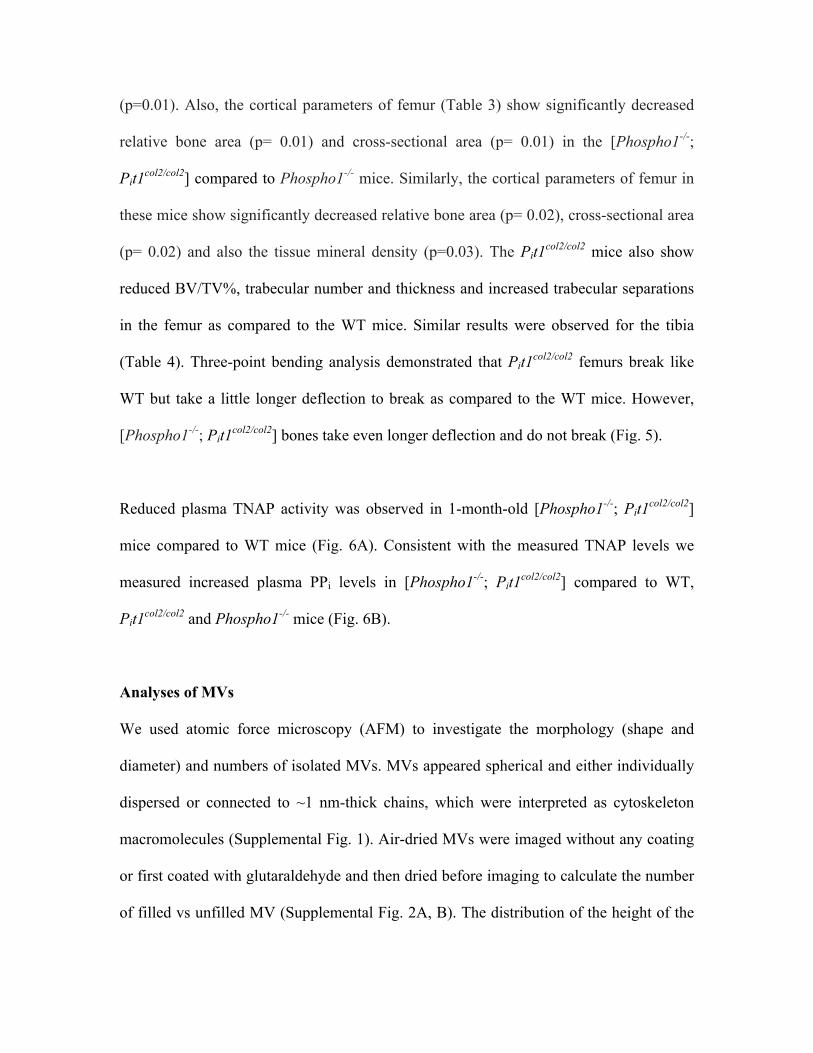
(p=0.01). Also, the cortical parameters of femur (Table 3) show significantly decreased
relative bone area (p= 0.01) and cross-sectional area (p= 0.01) in the [Phospho1-/-;
Pit1col2/col2] compared to Phospho1-/- mice. Similarly, the cortical parameters of femur in
these mice show significantly decreased relative bone area (p= 0.02), cross-sectional area
(p= 0.02) and also the tissue mineral density (p=0.03). The Pit1col2/col2 mice also show
reduced BV/TV%, trabecular number and thickness and increased trabecular separations
in the femur as compared to the WT mice. Similar results were observed for the tibia
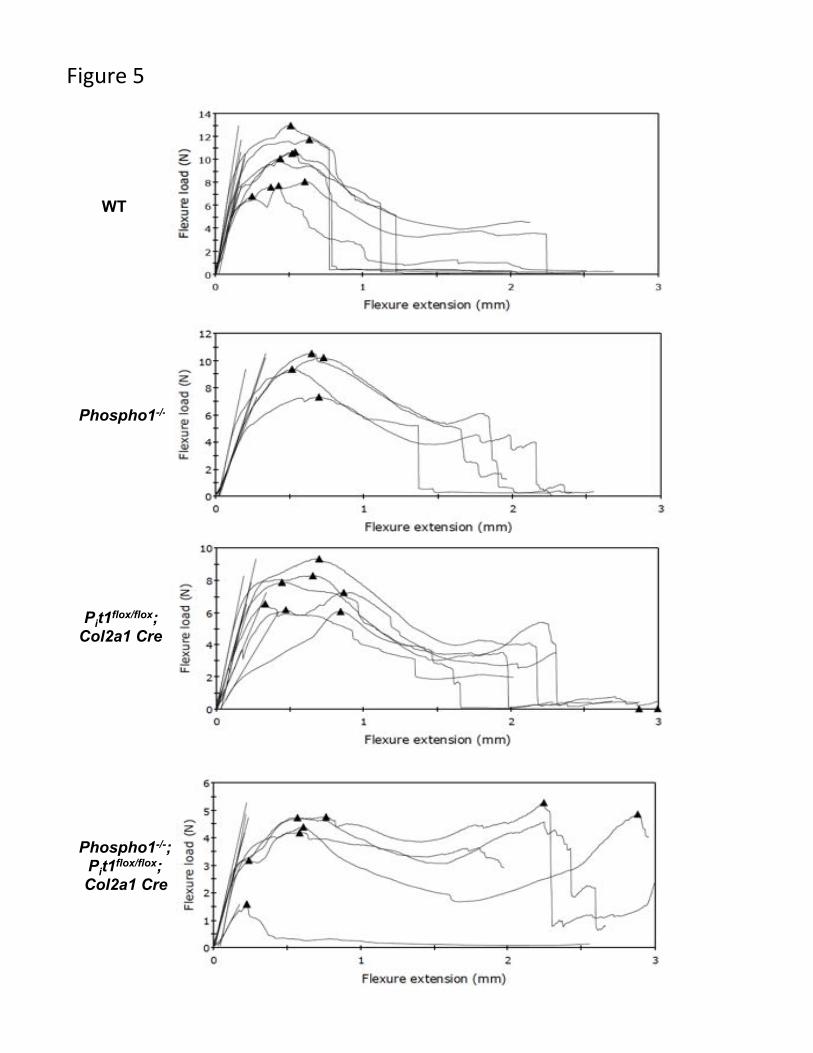
(Table 4). Three-point bending analysis demonstrated that Pit1col2/col2 femurs break like
WT but take a little longer deflection to break as compared to the WT mice. However,
[Phospho1-/-; Pit1col2/col2] bones take even longer deflection and do not break (Fig. 5).
Reduced plasma TNAP activity was observed in 1-month-old [Phospho1-/-; Pit1col2/col2]
mice compared to WT mice (Fig. 6A). Consistent with the measured TNAP levels we
measured increased plasma PPi levels in [Phospho1-/-; Pit1col2/col2] compared to WT,
Pit1col2/col2 and Phospho1-/- mice (Fig. 6B).
Analyses of MVs
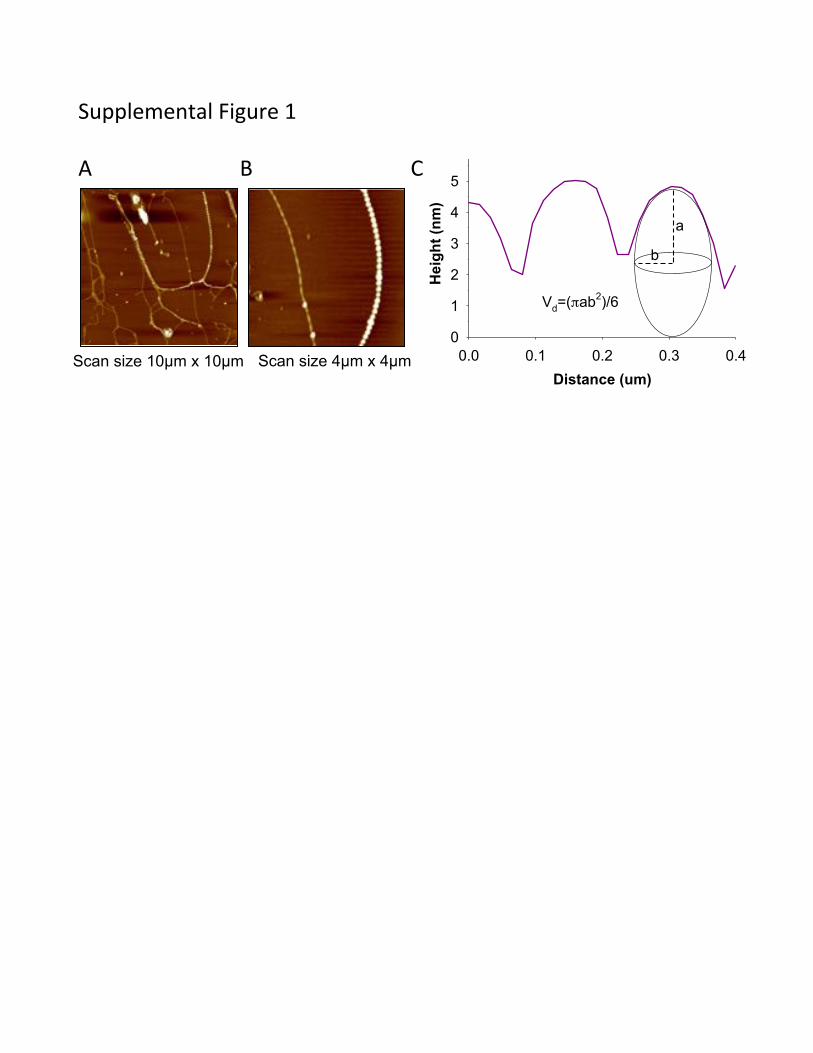
We used atomic force microscopy (AFM) to investigate the morphology (shape and
diameter) and numbers of isolated MVs. MVs appeared spherical and either individually
dispersed or connected to ~1 nm-thick chains, which were interpreted as cytoskeleton
macromolecules (Supplemental Fig. 1). Air-dried MVs were imaged without any coating
or first coated with glutaraldehyde and then dried before imaging to calculate the number
of filled vs unfilled MV (Supplemental Fig. 2A, B). The distribution of the height of the

vesicles was different among samples. WT MVs showed a bi-modal distribution of height
values with a narrow peak centered at ~ 2.3 nm and a broad one centered at ~7.4 nm,
respectively (Supplemental Fig. 2C). Similar bi-modal distribution of height values was
found for Pit1col2/col2 MVs. Phospho1-/- MVs and [Phospho1-/-; Pit1col2/col2] MVs also
show a bimodal distribution but with much smaller values. For Phospho1-/- the broad
peak was at 4.8 nm and the narrow peak was at 1.8nm. The [Phospho1-/-; Pit1col2/col2]
mice show even smaller heights as compared to Phospho1-/-, as the broad peak was at 3.9
nm and the narrow peak was at 1.9 nm. We interpreted the MVs with a height lower than
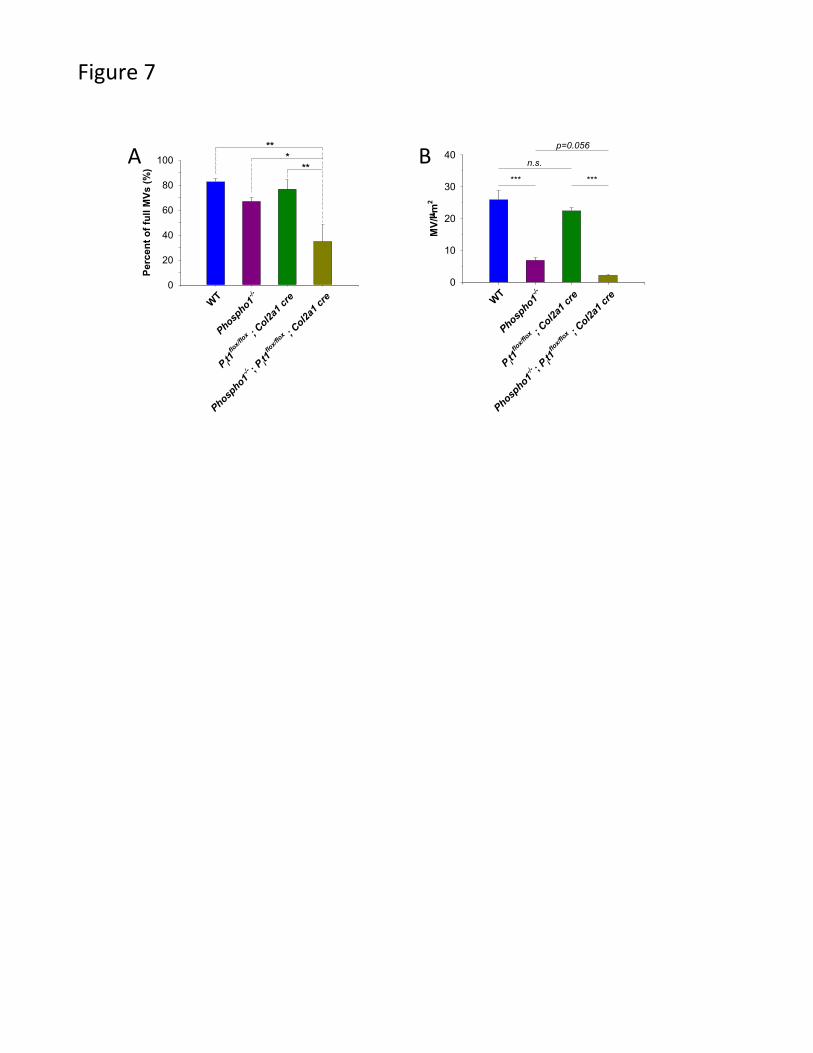
7 nm as unfilled MVs, whereas those with a height greater than 7 nm as filled MVs. Thus,
we found that WT and Pit1col2/col2 MVs were mostly filled (xx% and xx% of filled MVs,
respectively), whereas Phospho1-/- MVs and [Phospho1-/-; Pit1col2/col2] MVs were mostly
unfilled (xx% and xx% of filled MVs, respectively) (Fig. 7A). Additionally, we found
that empty MVs in the [Phospho1-/-; Pit1col2/col2] preparations were smaller than those in
the Phospho1-/- samples. We also determined the volume of these MVs (Supplemental
Fig. 2D) and observed that WT and Pit1col2/col2 MVs have broader volume peaks
corresponding to 143 x 103 nm3 and 135 x103 nm3. However, the Phospho1-/- MVs had a
volume peak at 35 x 103 nm3 and the [Phospho1-/-; Pit1col2/col2] MVs had even lesser
volume of 16 x 103 nm3, in agreement with our interpretation based on the height data
that these vesicles were mostly unfilled. Finally, we found that the number of MVs per
µm2 for the Phospho1-/- and [Phospho1-/-; Pit1col2/col2] samples was significantly lower
than the number of MVs in the WT and Pit1col2/col2 samples (Fig. 7B). The slight
difference in number of MVs per µm2 was not statistically significant. These data clearly
point to a role of PHOSPHO1 in MV biogenesis.

DISCUSSION
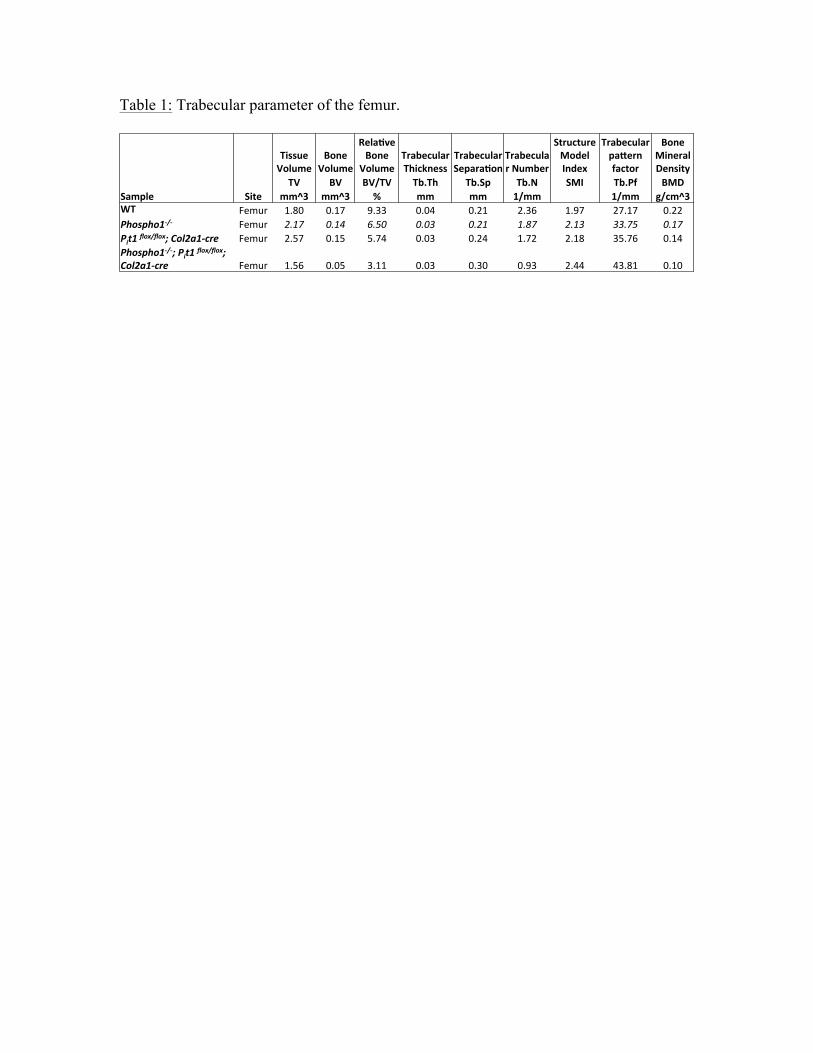
Table 1: Trabecular parameter of the femur.
!!
Site%
Tissue%Volume%
Bone%Volume%
Rela1ve%Bone%
Volume%Trabecular%Thickness%
Trabecular%Separa1on%
Trabecular%Number%
Structure%Model%Index%
Trabecular%pa>ern%factor%
Bone%Mineral%Density%
!! TV% BV% BV/TV% Tb.Th% Tb.Sp% Tb.N% SMI% Tb.Pf% BMD%Sample% mm^3% mm^3% %% mm% mm% 1/mm% %% 1/mm% g/cm^3%WT% Femur! 1.80! 0.17! 9.33! 0.04! 0.21! 2.36! 1.97! 27.17! 0.22!Phospho1'/') Femur! 2.17% 0.14% 6.50% 0.03% 0.21% 1.87% 2.13% 33.75% 0.17%Pit1)flox/flox;)Col2a1'cre) Femur! 2.57! 0.15! 5.74! 0.03! 0.24! 1.72! 2.18! 35.76! 0.14!Phospho1'/';)Pit1)flox/flox;)Col2a1'cre) Femur! 1.56! 0.05! 3.11! 0.03! 0.30! 0.93! 2.44! 43.81! 0.10!

Table 2: Trabecular parameters of the tibia
!!
Site%
Tissue%Volume%
Bone%Volume%
Rela1ve%Bone%
Volume%Trabecular%Thickness%
Trabecular%Separa1on%
Trabecular%Number%
Structure%Model%Index%
Trabecular%pa>ern%factor%
Bone%Mineral%Density%!!
Sample%
TV% BV% BV/TV% Tb.Th% Tb.Sp% Tb.N% SMI% Tb.Pf% BMD%
mm^3% mm^3% %% mm% mm% 1/mm% %% 1/mm% g/cm^3%WT% Tibia! 1.10! 0.05! 4.57! 0.03! 0.23! 1.53! 2.18! 39.37! 0.17!
Phospho1'/') Tibia! 1.64! 0.07! 4.49! 0.03! 0.22! 1.56! 2.15! 39.63! 0.16!
Pit1)flox/flox;)Col2a1'cre) Tibia! 1.87! 0.07! 3.52! 0.03! 0.26! 1.24! 2.23! 41.52! 0.12!Phospho1'/';)Pit1)flox/flox;)Col2a1'cre) Tibia! 1.09! 0.04! 3.30! 0.03! 0.26! 1.10! 2.34! 43.31! 0.11!

Table 3: Cortical parameters of the femur
Sample'
''Cross,sec.onal'Tissue'Area'
Cross,sec.onal'Bone'Area'
Rela.ve'Bone'Area'
Cross,sec.onal'thickness'
Tissue'Mineral'Density'
'' T.Ar' B.Ar' B.Ar/T.Ar' Cs.Th' TMD'Site' mm^2' mm^2' %' mm' g/cm3'
WT' Femur& 1.500& 0.654& 42.95& 0.160& 0.892&Phospho1'/') Femur& 1.824& 0.732& 40.19& 0.147& 0.866&Pit1)flox/flox;)Col2a1'cre) Femur& 1.668& 0.651& 38.97& 0.140& 0.904&Phospho1'/';)Pit1)flox/flox;)Col2a1'cre) Femur& 1.533& 0.478& 30.846& 0.107& 0.846&
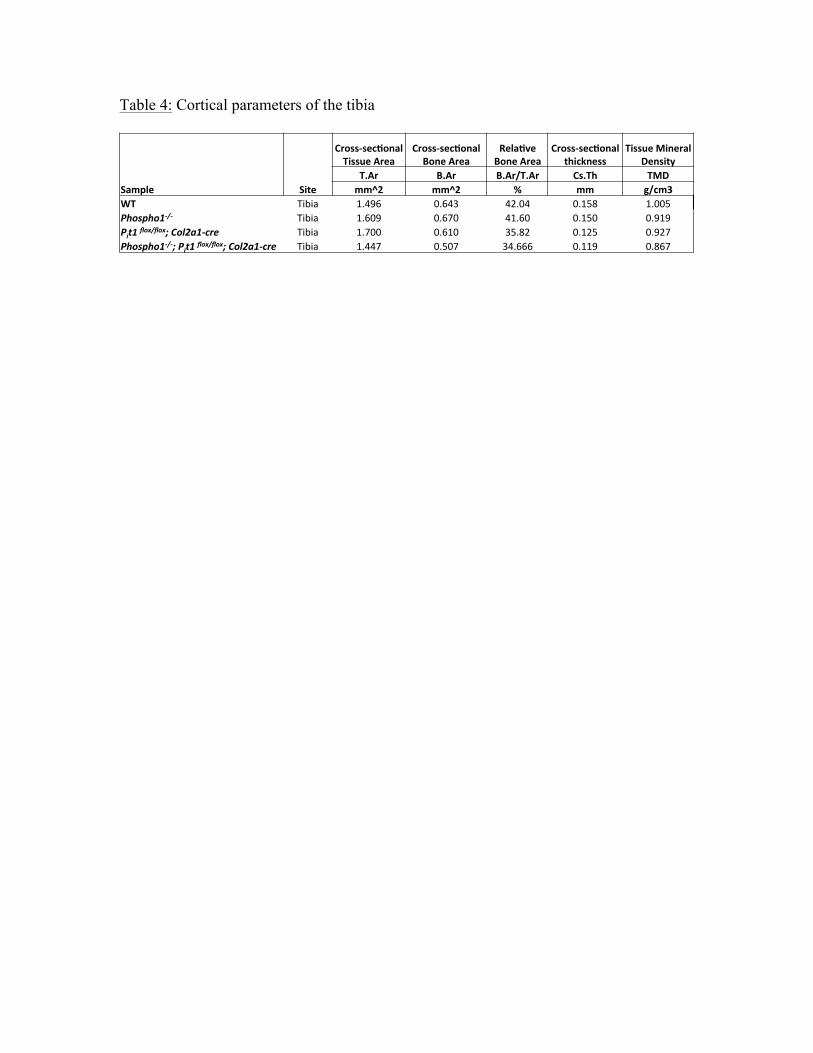
Table 4: Cortical parameters of the tibia
Sample'
''Cross,sec.onal'Tissue'Area'
Cross,sec.onal'Bone'Area'
Rela.ve'Bone'Area'
Cross,sec.onal'thickness'
Tissue'Mineral'Density'
'' T.Ar' B.Ar' B.Ar/T.Ar' Cs.Th' TMD'Site' mm^2' mm^2' %' mm' g/cm3'
WT' Tibia% 1.496% 0.643% 42.04% 0.158% 1.005%Phospho1'/') Tibia% 1.609% 0.670% 41.60% 0.150% 0.919%Pit1)flox/flox;)Col2a1'cre) Tibia% 1.700% 0.610% 35.82% 0.125% 0.927%Phospho1'/';)Pit1)flox/flox;)Col2a1'cre) Tibia% 1.447% 0.507% 34.666% 0.119% 0.867%

LEGEND TO FIGURES
Fig.1: Phenotypic abnormalities in [Phospho1-/-; Pit1col2/col2] mice. (A)
Immunohistochemistry using anti-PiT1 antibody on the femur from Phospho1-/- and
Pit1col2/col2 mice shows reduced PiT-1 expression in the hypertrophic chondrocyte region
of Pit1col2/col2 mice. B) qRT-PCR showing visible residual Pit1 gene expression (~35%) in
chondrocytes (C) Phospho1-/- mice are smaller than WT mice and the [Phospho1-/-;
Pit1col2/col2] mice were even smaller than the Phospho1-/- mice.
Fig. 2: X-ray images. Radiographic images showed worsening of the skeletal
abnormalities (arrows) in [Phospho1-/-; Pit1col2/col2] mice as compared to the Phospho1-/-
mice. Arrows show highly bowed long bones and multiple fractures in the spine and
limbs in [Phospho1-/-; Pit1col2/col2] mice.
Fig. 3: Histomorphometric analyses of tibias (A) and spines (B) of Phospho1-/- and
[Phospho1-/-; Pit1col2/col2] mice at 15-days of age. Images for WT and Pit1col2/col2 not
shown. Histograms show comparison between WT, Phospho1-/-, Pit1col2/col2 and
[Phospho1-/-; Pit1col2/col2] mice for BV/TV% and OV/BV% for tibia (A) and spine (B).
Von Kossa/van Gieson staining of the tibial section at the knee joint reveals trabecular
bone surrounded by widespread, extended osteoid in 15-day-old Phospho1-/- mice (arrows
the areas where the osteoid is present) as compared to the WT mice. The Pit1col2/col2 mice
appear similar to the WT mice with no osteoid. However, the [Phospho1-/-; Pit1col2/col2]
mice show even more unmineralized bone in tibia (trabecular bone, secondary

ossification center) as well as in the spine (vertebrae).
Fig. 4: µCT analysis of femur and tibia in WT, Phospho1-/-, Pit1col2/col2 and [Phospho1-/-;
Pit1col2/col2] mice at 1 month of age. (A) 3D volume renders of the full samples (side view
–full leg, front view-tibia, anterior view-femur) 2D orthogonal cross-sections of femurs
and tibiae. Both 2d volume renders and 3d orthogonal cross-sections show highly bowed/
twisted long bones in [Phospho1-/-; Pit1col2/col2] mice compared to WT, Pit1col2/col2 and
even Phospho1-/- mice.
!!
Fig. 5: Three-point bending load vs extension graphs on WT (n=6) (A), Phospho1-/-
(n=4) (B), Pit1col2/col2 (n=7) (C) and [Phospho1-/-; Pit1col2/col2] (n=5) (D) mice femurs.
Pit1col2/col2 mice show similar break pattern to the WT mice. In contrast, Phospho1-/- mice
femurs take longer deflection to break and the [Phospho1-/-; Pit1col2/col2] femurs take even
longer to break.
Fig. 6: Plasma levels of TNAP and PPi. (A) TNAP activity (B) and PPi concentration in
plasma of 1-month-old mice. TNAP levels were lower and PPi levels were higher in the
plasma of Pit1col2/col2 and [Phospho1-/-; Pit1col2/col2] mice than in WT and Phospho1-/- mice.
Data are represented as mean ± SEM, n= 6 mice per group, experiments performed in
duplicate.
Fig. 7. Determination of percentage of filled MVs and total number of MVs. A) We
observed a statistically significant decrease in the number of filled MVs in the
[Phospho1-/-; Pit1col2/col2] samples compared to WT, Phospho1-/- and Pit1col2/col2 samples.
B) The Phospho1-/- MV preparations show a statistically significant decrease in the total
number of MVs. The [Phospho1-/-; Pit1col2/col2] MV preparations show a comparable
decrease in the number of MVs.
Supplemental Fig. 1: MVs were found in chains (A, B) and considered as spheroids with
the polar diameter (a) as the MV height and the polar diameter (b) as the MV’s width at
half height (C).
Supplemental Fig. 2: Atomic force microscopy (AFM) of filled (A) and unfilled (B) MVs.
From left to right: topography, amplitude and three-dimensional reconstruction. AFM
images were recorded in non-contact (AAC) mode. Height (C) and volume (D)
distribution for isolated MVs from WT, Phospho1-/-, Pit1flox/flox; Col2a1-cre and
[Phospho1-/-; Pit1flox/flox; Col2a1-cre] mice. Peaks were fitted by Gaussian curves. MVs’
volumes have been calculated by assuming MVs as spheroidal structures.
!
REFERENCES Anderson HC, Garimella R, Tague SE 2005 The role of matrix vesicles in growth plate development and biomineralization. Front Biosci 10:822–837. Anderson HC, Hsu HHT, Morris DC, Fedde KN, Whyte MP. Matrix vesicles in osteomalacic hypophosphatasia bone contain apatite-like mineral crystals. Am J Pathol. 1997;151:1555–1561. Anderson HC, Sipe JE, Hessle L, et al. Impaired calcification around matrix vesicles of growth plate and bone in alkaline phosphatase deficient mice. Am J Pathol. 2004;164:841–847. Aspden RM. Mechanical testing of bone ex vivo. Methods Mol Med. 2003; 80:369–379. Caverzasio J, Bonjour JP 1996 Characteristics and regulation of Pi transport in osteogenic cells for bone metabolism. Kidney Int 49:975–980. Caverzasio J, Montessuit C, Bonjour JP 1996 Functional role of Pi transport in osteogenic cells. News Physiol Sci 11:119–125. Caverzasio J, Murer H, Tenenhouse HS 2003 Phosphate Homeostasis, Regulatory Mechanisms. Pediatric Bone. Biology & Diseases. Elsevier Science, San Diego, CA, USA. Cecil DL, Rose DM, Terkeltaub R, Liu-Bryan R 2005 Role of interleukin-8 in PiT-1 expression and CXCR1-mediated inorganic phosphate uptake in chondrocytes. Arthritis Rheum 52:144–154. Fedde KN, Blair L, Silverstein J, et al. Alkaline phosphatase knock-out mice recapitulate the metabolic and skeletal defects of infantile hypophosphatasia. J Bone Miner Res. 1999;14:2015–2026. Giachelli CM, Speer MY, Li X, Rajachar RM, Yang H 2005 Regulation of vascular calcification: Roles of phosphate and osteopontin. Circ Res 96:717–722. Hessle L, Johnson KA, Anderson HC, et al. Tissue-nonspecific alkaline phosphatase and plasma cell membrane glycoprotein-1 are central antagonistic regulators of bone mineralization. Proc Natl Acad Sci USA. 2002;99:9445–9449. Huesa C, Yadav MC, Finnila MAJ, Goodyear SR, Robins SP, Tanner KR, Aspden RM, Millán, JL, Farquharson C. PHOSPHO1 is essential for mechanically competent mineralization and the avoidance of spontaneous fractures. Bone. 2011;48:1066-1077. Johnson KA, Hessle L, Vaingankar S, et al. Osteoblast tissue-nonspecific alkaline phosphatase antagonizes and regulates PC-1. Am J Physiol Regul Integr Comp Physiol.

2000;279:R1365–1377. Kuzynski, M., Goss, M., Bottini, M., Yadav, M.C., Mobley, C., Winters, T., Poliard, A., Kellermann, O., Lee, B., Millan, J. L., and Napierala, D. Dual role of the Trps1 transcription factor in dentin mineralization. J Biol Chem. 2014 Oct 3;289(40):27481-93. Loghman-Adham M, Szczepanska-Konkel M, Yusufi AN, Van Scoy M, Dousa TP 1987 Inhibition of Na+-Pi cotransporter in small gut brush border by phosphonocarboxylic acids. Am J Physiol 252:G244–G249. Majeska RJ, Wuthier RE. Studies on matrix vesicles isolated from chick epiphyseal cartilage. Association of pyrophosphatase and ATPase activities with alkaline phosphatase. Biochem Biophys Acta. 1975; 391:51–50. McGuire, M B, Olman, CH, Baghat, N. and Russell, RG. Radiometric measurement of pyrophosphate in cell cultures. Biochem. Soc. Trans. 1980;8:529-530. McKee MD, Yadav MC, Foster BL, Somerman MJ, Farquharson C, Millán, JL. Compounded PHOSPHO1/ALPL Deficiencies Reduce Dentin Mineralization. J Dent Res. 2013;92:721-727. Millán J.L. The Role of Phosphatases in the Initiation of Skeletal Mineralization. Calcif Tissue Int. 2012:ePub ahead of print. Epub 2012/11/28. doi: 10.1007/s00223-012-9672-8. Moss DW, Eaton RH, Smith JK, Whitby LG. Association of inorganicpyrophosphatase activity with human alkaline-phosphatase preparations. Biochem J. 1967;102:53–57. Murshed M, Harmey D, Milla´n JL, McKee MD, Karsenty G. Unique coexpression in osteoblasts of broadly expressed genes accounts for the spatial restriction of ECM mineralization to bone. Genes Dev. 2005;19:1093–1104. Narisawa S, Fro¨ hlander N, Milla´n JL. Inactivation of two mouse alkaline phosphatase genes and establishment of a model of infantile hypophosphatasia. Dev Dyn. 1997;208:432–446. Nielsen LB, Pedersen FS, Pedersen L. Expression of type III sodium-dependent phosphate transporters/ retroviral receptors mRNAs during osteoblast differentiation. Bone. 2001;28(2):160-6. Palmer G, Zhao J, Bonjour J, Hofstetter W, Caverzasio J 1999 In vivo expression of transcripts encoding the Glvr-1 phosphate transporter/retrovirus receptor during bone development. Bone 24:1–7 Palmer G, Guicheux J, Bonjour JP, Caverzasio J 2000 Transforming growth factor-beta stimulates inorganic phosphate transport and expression of the type III phosphate transporter Glvr-1 in chondrogenic ATDC5 cells. Endocrinology 141:2236–2243.

Polewski MD, Johnson KA, Foster M, Millán JL, Terkeltaub R. Inorganic pyrophosphatase induces type I collagen in osteoblasts. Bone. 2010;46(1):81-90. PMCID: 2818162. Roberts S., Narisawa S., Harmey D., Millán J.L., Farquharson C. Functional involvement of PHOSPHO1 in matrix vesicle-mediated skeletal mineralization. J. Bone Miner. Res. 2007;22(4):617-627. Yadav MC, Simao AMS, Narisawa S, Huesa C, McKee MD, Farquharson C, Millán, JL. Loss of skeletal mineralization by the simultaneous ablation of PHOSPHO1 and alkaline phosphatase function: a unified model of the mechanisms of initiation of skeletal calcification. J Bone Miner Res. 2011;26:286-97. Yoshiko Y, Candeliere GA, Maeda N, Aubin JE. Osteoblast autonomous Pi regulation via Pit1 plays a role in bone mineralization. Mol Cell Biol. 2007;27(12):4465-74. PMCID: 1900051.

Phospho1-/- Pit1flox/flox; Col2a1-cre
Phospho1-/-; Pit1flox/flox; Col2a1-cre
WT Pit1flox/flox; Col2a1-cre
A" C"Figure1."
Femur,"20X" Femur,"20X"
WT
P it1flox/flo
x ;
Col2a1 Cre
0
50
100
150
Pit1
mR
NA
(Rel
ativ
e U
nits
)
*B"

WT Phospho1-/- Pit1flox/flox; Col2a1-cre
Phospho1-/-; Pit1flox/flox; Col2a1-cre
Figure"2"
A"
B"
Figure"3"
WT
Phospho1 -/-
P it1flo
x/flox ;
Col2A1 Cre
Phospho1 -/- ;
P it1flo
x/flox ;Col2A1 Cre
0
10
20
30
40
50
BV/T
V %
Tibia**
** **
WT
Phospho1 -/-
P it1flo
x/flox ;
Col2A1 Cre
Phospho1 -/- ;
P it1flo
x/flox ;Col2A1 Cre
0
5
10
15
OV/
BV
%
Spine
***
WT
Phospho1 -/-
P it1flo
x/flox ;
Col2A1 Cre
Phospho1 -/- ;
P it1flo
x/flox ;Col2A1 Cre
0
10
20
30
OV/BV%
Tibia
***
WT
Phospho1 -/-
P it1flo
x/flox ;
Col2A1 Cre
Phospho1 -/- ;
P it1flo
x/flox ;Col2A1 Cre
0
10
20
30
40
BV/
TV %
Spine**
****
TIBIA
Von Kossa-Van Gieson
20X
Pho
spho
1-/-
Pho
spho
1-/- ;
P
it1flo
x/flo
x ;
Col
2a1-
cre
20X 10X 20X 20X
20X 20X
Secondary ossification center
Secondary ossification center
Trabecular Bone
Trabecular Bone
Pho
spho
1-/-
Pho
spho
1-/- ;
P
it1flo
x/flo
x ;
Col
2a1-
cre
SPINE
5X
10X
20X
20X 5X
10X

Femur Tibia
WT Phospho1-/- Pit1flox/flox; Col2a1-cre
Phospho1-/-; Pit1flox/flox; Col2a1-cre
Tibia Femur Tibia Femur Tibia Femur Tibia Femur
A"
B"
Figure"4"
WT
Phospho1-/-
Pit1flox/flox; Col2a1 Cre
Phospho1-/-; Pit1flox/flox; Col2a1 Cre
Figure"5"

Figure"6"
WT
Phospho1 -/-
P it1flox/flo
x ;Col2a1 Cre
Phospho1 -/- ; P it1
flox/flox ;Col2a1 Cre
0
1
2
3
4
PP
i (µ
M)
1-months-oldA" B"
Per
cent
of f
ull M
Vs
(%)
0
20
40
60
80
100 ***
**
WT
Phospho1
-/-
P it1flo
x/flo
x ; Col2a
1 cre
Phospho1
-/- ; P
it1flo
x/flo
x ; Col2a
1 cre
MV/µ
m2
0
10
20
30
40p=0.056
*** ***
WT
Phospho1
-/-
P it1flo
x/flo
x ; Col2a
1 cre
Phospho1
-/- ; P it1
flox/f
lox ;
Col2a1 c
re
n.s.
Figure"7"
A" B"
Supplemental"Figure"1"
Scan size 10µm x 10µm Scan size 4µm x 4µm
Phospho1-/-
Distance (um)0.0 0.1 0.2 0.3 0.4
Hei
ght (
nm)
0
1
2
3
4
5
6
a
b
Vd=(πab2)/6
A" B" C"

Fille
d M
Vs
Unf
illed
MV
s
WT
Height (nm)0 5 10 15 20 25
Freq
uenc
y (%
)
0
5
10
15
20
7.4±1.4 nm2.3±1.2 nm
WT
Volume (103 nm3)
0 50 100 150 200 250 300
Freq
uenc
y (%
)
0
5
10
15
20
(143±38)◊103 nm3
Phospho1-/-
Height (nm)0 5 10 15 20 25
Freq
uenc
y (%
)
0
10
20
30
40
1.8±0.5 nm 4.8±0.9 nm
Phospho1-/-
Volume (103 nm3)
0 50 100 150 200 250 300
Freq
uenc
y (%
)
0
10
20
30
40
50
60
(37±15)◊103 nm3
A"
B"
C"
D"
Pit1flox/flox ; Col2a1 cre
Height (nm)0 5 10 15 20 25
Freq
uenc
y (%
)
0
5
10
15
20
7.1±2.3 nm2.1±0.9 nm
Phospho1-/- ; Pit1flox/flox ; Col2a1 cre
Height (nm)0 5 10 15 20 25
Freq
uenc
y (%
)
0
10
20
30
40
3.9±0.4 nm1.9±0.4 nm
Pit1flox/flox ; Col2a1 cre
Volume (103 nm3)
0 50 100 150 200 250 300
Freq
uenc
y (%
)
0
5
10
15
20
(135±45)◊103 nm3
Phospho1-/- ; Pit1flox/flox ; Col2a1 cre
Volume (103 nm3)
0 50 100 150 200 250 300
Freq
uenc
y (%
)
0
10
20
30
40
50
60
(16±11)◊103 nm3
Supplemental"Figure"2"