edinburgh research explorer · available online xxxx keywords: antioxidant defences oxidative...
TRANSCRIPT

Edinburgh Research Explorer
Selective dendritic susceptibility to bioenergetic, excitotoxic andredox perturbations in cortical neurons
Citation for published version:Hasel, P, Mckay, S, Qiu, J & Hardingham, GE 2015, 'Selective dendritic susceptibility to bioenergetic,excitotoxic and redox perturbations in cortical neurons' Biochimica et Biophysica Acta - Molecular CellResearch, vol 1853, no. 9, pp. 2066-2076. DOI: 10.1016/j.bbamcr.2014.12.021
Digital Object Identifier (DOI):10.1016/j.bbamcr.2014.12.021
Link:Link to publication record in Edinburgh Research Explorer
Document Version:Publisher's PDF, also known as Version of record
Published In:Biochimica et Biophysica Acta - Molecular Cell Research
Publisher Rights Statement:Under a Creative Commons license
General rightsCopyright for the publications made accessible via the Edinburgh Research Explorer is retained by the author(s)and / or other copyright owners and it is a condition of accessing these publications that users recognise andabide by the legal requirements associated with these rights.
Take down policyThe University of Edinburgh has made every reasonable effort to ensure that Edinburgh Research Explorercontent complies with UK legislation. If you believe that the public display of this file breaches copyright pleasecontact [email protected] providing details, and we will remove access to the work immediately andinvestigate your claim.
Download date: 16. Jul. 2018

Biochimica et Biophysica Acta xxx (2015) xxx–xxx
BBAMCR-17452; No. of pages: 11; 4C:3, 4, 5, 6
Contents lists available at ScienceDirect
Biochimica et Biophysica Acta
j ourna l homepage: www.e lsev ie r .com/ locate /bbamcr
Selective dendritic susceptibility to bioenergetic, excitotoxicand redox perturbations in cortical neurons☆
Philip Hasel, Sean Mckay, Jing Qiu, Giles E. Hardingham ⁎
Centre for Integrative Physiology, University of Edinburgh, Edinburgh EH8 9XD, UK
☆ This article is part of a Special Issue entitled: 13th Eur⁎ Corresponding author.
E-mail address: [email protected] (G.E. Hard
http://dx.doi.org/10.1016/j.bbamcr.2014.12.0210167-4889/© 2014 The Authors. Published by Elsevier B.V
Please cite this article as: P. Hasel, et al., SelecBiochim. Biophys. Acta (2015), http://dx.doi
a b s t r a c t
a r t i c l e i n f oArticle history:Received 17 October 2014Received in revised form 12 December 2014Accepted 13 December 2014Available online xxxx
Keywords:Antioxidant defencesOxidative stressExcitotoxicityMitochondriaCalcium signallingBioenergetics
Neurodegenerative and neurological disorders are often characterised by pathological changes to dendrites, inadvance of neuronal death. Oxidative stress, energy deficits and excitotoxicity are implicated in many suchdisorders, suggesting a potential vulnerability of dendrites to these situations. Here we have studied dendriticvs. somatic responses of primary cortical neurons to these types of challenges in real-time.Using a genetically encoded indicator of intracellular redox potential (Grx1-roGFP2) we found that, compared tothe soma, dendritic regions exhibitedmore dramaticfluctuations in redox potential in response to sub-lethal ROSexposure, and existed in a basally more oxidised state. We also studied the responses of dendritic and somaticregions to excitotoxic NMDA receptor activity. Both dendritic and somatic regions experienced similar increasesin cytoplasmic Ca2+. Interestingly, while mitochondrial Ca2+ uptake and initial mitochondrial depolarisationwere similar in both regions, secondary delayed mitochondrial depolarisation was far weaker in dendrites, po-tentially as a result of less NADH depletion. Despite this, ATP levels were found to fall faster in dendritic regions.Finally we studied the responses of dendritic and somatic regions to energetically demanding action potentialburst activity. Burst activity triggered PDH dephosphorylation, increases in oxygen consumption and cellularNADH:NAD ratio. Compared to somatic regions, dendritic regions exhibited a smaller degree of mitochondrialCa2+ uptake, lower fold-induction of NADH and larger reduction in ATP levels. Collectively, these data revealthat dendritic regions of primary neurons are vulnerable to greater energetic and redox fluctuations than thecell body, which may contribute to disease-associated dendritic damage. This article is part of a Special Issue en-titled: 13th European Symposium on Calcium.
© 2014 The Authors. Published by Elsevier B.V. This is an open access article under the CC BY license(http://creativecommons.org/licenses/by/4.0/).
1. Introduction
In many chronic and acute conditions of the brain involving neuro-nal dysfunction there is substantial evidence that the effects of a diversearray of disease-causing events, agents and mutations at least partlyconverge on a common set of consequences centred on excitotoxicity,energy imbalance, oxidative stress and mitochondrial dysfunction [55,70,71,74,91].
Excitotoxicity is caused by the global or local accumulation ofglutamate, leading to inappropriate activity of the NMDA subtype ofglutamate receptor (NMDAR) which mediates Ca2+-dependent celldeath and dysfunction [17,61]. This ‘excitotoxicity’ is a major contribu-tor to neuronal loss and dysfunction in acute neurological disordersincluding stroke and traumatic brain injury [60]. However, more local,progressive excitotoxicity is also implicated in the pathogenesis ofneurodegenerative disease [62,80]. For example, synaptic loss in
opean Symposium on Calcium.
ingham).
. This is an open access article under
tive dendritic susceptibility to.org/10.1016/j.bbamcr.2014.1
Alzheimer's disease (AD) models induced by oligomeric Aβ is thoughtto proceed at least in part via a local NMDAR-dependent excitotoxicmechanism [53,66]. Huntington's disease is also a disorder associatedwith aberrant NMDAR activity and excitotoxicity [29], in part due toan elevation of extrasynaptic NMDAR activity which promotes neuronaldysfunction as well as preventing non-toxic mHtt inclusion formation[72,77].
The principle cause of excitotoxicity in stroke is a loss of bioenergetichomeostasis, leading to dysfunctional glutamate uptake mechanismsand accumulation of extracellular glutamate. Furthermore there is con-siderable evidence that energetic and metabolic perturbations occur inchronic neurodegenerative diseases, not just acute disorders such asstroke or traumatic brain injury [58]. Central to energy homeostasis, ofcourse, is the requirement that functional mitochondria are able to re-spond to the changing demands of a neuron (for example duringperiods of strong synaptic activity). Dysfunctional mitochondria are ahall-mark of many chronic and acute neurological disorders, whichcan be triggered by both excitotoxic and non-excitotoxic mechanisms.An example of the latter is oxidative stress, which is not only triggeredby excitotoxicity and a variety of disease-causing agents andmutations,but can also be further exacerbated by mitochondrial dysfunction.
the CC BY license (http://creativecommons.org/licenses/by/4.0/).
bioenergetic, excitotoxic and redox perturbations in cortical neurons,2.021

2 P. Hasel et al. / Biochimica et Biophysica Acta xxx (2015) xxx–xxx
Given that neurons are highly polarised cells with many spatiallyand biochemically distinct regions, it is perhaps not surprising thatthese regions are differentially affected under pathological conditions.For example, there is good evidence that changes in dendritic andaxonalmorphology and properties take place in neurodegenerative dis-ease in advance of neuronal loss [65]. In AD and mouse models of AD,dystrophic neurites and spine alterations correlate with proximity toamyloid plaques [35,87]. Moreover, in animalmodels of AD dendritic al-terations have been observed in advance of plaque formation [84] andrecent evidence suggests that structural dendritic deficits in an ADmodel are functionally linked to hyperexcitability [85]. α-Synuclein in-clusions promote mitochondrial oxidative stress in dopaminergic neu-rons that is higher in dendritic regions than in the soma, suggestive ofdendritic vulnerability in Parkinson's disease [25]. Even normal ageingis associated with a reduction in dendritic complexity and spine num-bers [23]. Acute excitotoxicity such as exposure to NMDA or oxygen–glucose deprivation also triggers early dendritic alterations in the formof neuritic beads [36], although their role (protective or pathological)is not well understood.
Despite this, we have an incomplete picture of how dendritic vs.somatic regions respond in real-time to metabolic, oxidative andexcitotoxic stress. This knowledge could help understand the types ofinsult that trigger selective vulnerability to more peripheral regions ofa neuron, as well as indicate whether classical neuroprotective strate-gies are appropriate for preventingmore localised dendritic or synapticdamage. Key to gaining a better understanding of real-time responses ofneurons to various forms of stress has been the development of anexpanding array of genetically encoded indicators designed to reporton a variety of metabolic intermediates, second messenger levels, andsignal pathway activity. Particularly important for studying dynamicneuronal responses to excitotoxic, metabolic and oxidative stress in-clude mitochondrially targeted Ca2+ indicators, probes for NADH:NADratio, ATP levels, AMPK activity and cellular redox state (GSH:GSSGratio). These indicators can be usefully employed in parallel with moreclassical imaging techniques, such as charged dye reporting ofmitochondrial membrane potential, and NAD(P)H autofluorescencemeasurements.
Herewe have employed these existing probes, plus a newly targetedversion of GCaMP2, to compare dendritic vs. somatic responses of corti-cal neurons to excitotoxic insults (lethal and sub-lethal), a sub-lethaloxidative challenge, and finally the metabolic demands of intense syn-aptic activity. As well as illustrating the utility of these probes, wefound that compared to the soma, dendrites were more susceptible tostrong fluctuations in redox state and ATP levels. However, dendriticmitochondria appeared more resistant to catastrophic depolarisationduring exposure to excitotoxic insults.
2. Results
2.1. Analysis of subcellular redox potential changes following H2O2
exposure
We first decided to compare dendritic vs. somatic responses to anoxidative challenge. Classical probes are based on non-fluorescentdyes which, upon oxidation, become fluorescent. However, this is aone-way reaction and so does not indicate recovery of redox status. Tovisualise the redox potential of the cell directly, we transfected neuronswith a vector encoding theGrx1-roGFP2 genetically encoded reporter ofthe glutathione redox potential [42] (Fig. 1A). The 390/480 nm excita-tion ratio of Grx1-roGFP2 is highly sensitive to small fluctuations inredox potential. Its dynamic range (−320 to −240 mV [42]) meansthat small changes in the degree of GSH oxidation lead to large changesin Grx1-roGFP2 signal [42] and so it is ideal for measuring cellularresponses to sub-toxic oxidative challenges. We found that low dosesof H2O2 produced strong fluctuations in the probe signal which werefrequently saturated at above 25 μM H2O2. Using a H2O2 dose well
Please cite this article as: P. Hasel, et al., Selective dendritic susceptibility toBiochim. Biophys. Acta (2015), http://dx.doi.org/10.1016/j.bbamcr.2014.1
within the dynamic range (10 μM H2O2) we monitored the fluctuationin glutathione redox potential in somatic vs. dendritic regions, normal-ised to the maximal response elicited by a high dose of H2O2 (100 μM).We found that dendritic regions exhibited stronger perturbations to theglutathione redox potential, compared to the soma of that same cell.Fig. 1B shows an example recording from the dendritic and somaticregions of a single cell, and Fig. 1C shows the full data set, and Fig. 1Eshows the 10 μM H2O2-induced change in both regions. We also ob-served that dendritic Grx1-roGFP2 ratios tended to be higher in dendrit-ic regions compared to their soma, suggesting an elevated basaloxidation state. To test this, in a set of cells we treated them with DTTto provide highly reducing conditions in order to minimize the 390/480 nm excitation ratio. We found that the effect of DTT was greaterin dendritic regions than in somatic regions, suggesting that dendritesare indeed in an elevated basal oxidation state.
2.2. Analysis of subcellular metabolic and mitochondrial changes duringexcitotoxicity
Wenext investigated somatic and dendritic responses to excitotoxicCa2+ influx through the NMDA receptor (NMDAR). We first studied theconsequences of excitotoxic NMDAR activity for cellular ATP levels indendritic and somatic regions. We used the genetically encoded ATPFRET probe AT1.03 [52], which shows a YFP/CFP emission ratio ofaround 1.6 in resting neurons, and which falls to around 0.6 upondepletion of cellular ATP achieved by treatment with the mitochondrialuncoupler FCCP (data not shown). Application of NMDA (100 μM) elic-ited similar increases in cytoplasmic Ca2+,measured using the cytoplas-mic indicator GCaMP2 (Fig. 2A). However, we found that the rate of lossof ATP, as measured using AT1.03, was more rapid in dendritic regionsthan in the soma over early time points (Fig. 2B, C).
Loss of mitochondrial membrane potential (Ψm) is an early event inexcitotoxicity, initially triggered by mitochondrial Ca2+ uptake [1,82],but later irreversible and Ca2+-independent, involving PARP-mediateddepletion of NADH [1]. We therefore decided to investigate whetherthe mitochondria in these different regions respond differently toexcitotoxic Ca2+ influx. Using the Ψm probe rhodamine-123 (Rh123),we studied the loss of Ψm in response to bath application of NMDA.Rh123 partitions into the polarised mitochondria of neurons where itsaccumulation causes self-quenching. When the mitochondriadepolarise during exposure to excitotoxic insults, Rh123moves increas-ingly into the cytoplasm, whereupon it de-quenches and its fluorescentsignal increases [57,86]. The fluorescence signal is normalised cell-to-cell and region-to-region by calculating the maximal fluorescence atthe end of the experiment upon completemitochondrial depolarisation(achieved by FCCP treatment). We observed an initial slow modestdepolarisation in the soma of neurons, followed by a secondary, moredramatic loss of Ψm (Fig. 2D, E). This has been described by othersand may involve cellular NADH loss and permeability transition [1]. Indendritic regions however, while the initial slowmodest depolarisationwas also observed, the secondary loss ofΨmwas far less dramatic, andin some cases missing entirely (Fig. 2D, E).
To investigate a potential reason for this, we measured Ca2+ uptakeinto the mitochondria using matrix-targeted mito-GCaMP2, and foundno significant differences between uptake in dendritic vs. somaticregions (Fig. 2F). The fact that matrix Ca2+ rises to similar levels in thesomatic and dendritic mitochondria is consistent with the similar levelsof initial mitochondrial depolarisation, but begs the question as to whysecondary depolarisation is much stronger in somatic regions. SinceNADH depletion is an important mediator of the secondary componentof mitochondrial depolarisation [1], differences in NADH depletion offeranother explanation. We studied NAD(P)H autofluorescence which,since NADH is in excess over NADPH, primarily reports NADH levels.As with previous studies, we observed that NADH autofluorescencewas concentrated in the mitochondria throughout the neuron. Wefound that the proportional drop in NADH in somatic regions was
bioenergetic, excitotoxic and redox perturbations in cortical neurons,2.021
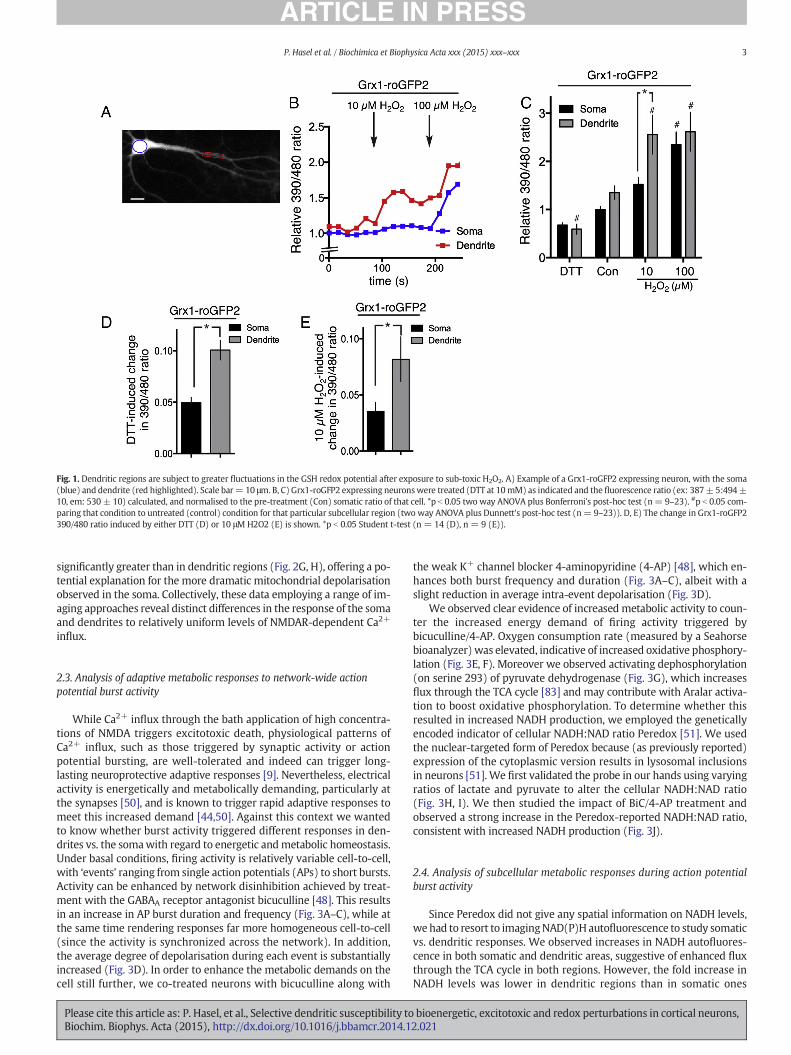
Fig. 1. Dendritic regions are subject to greater fluctuations in the GSH redox potential after exposure to sub-toxic H2O2. A) Example of a Grx1-roGFP2 expressing neuron, with the soma(blue) and dendrite (red highlighted). Scale bar= 10 μm. B, C) Grx1-roGFP2 expressing neuronswere treated (DTT at 10mM) as indicated and the fluorescence ratio (ex: 387± 5:494±10, em: 530 ± 10) calculated, and normalised to the pre-treatment (Con) somatic ratio of that cell. *p b 0.05 two way ANOVA plus Bonferroni's post-hoc test (n= 9–23). #p b 0.05 com-paring that condition to untreated (control) condition for that particular subcellular region (two way ANOVA plus Dunnett's post-hoc test (n= 9–23)). D, E) The change in Grx1-roGFP2390/480 ratio induced by either DTT (D) or 10 μM H2O2 (E) is shown. *p b 0.05 Student t-test (n = 14 (D), n = 9 (E)).
3P. Hasel et al. / Biochimica et Biophysica Acta xxx (2015) xxx–xxx
significantly greater than in dendritic regions (Fig. 2G, H), offering a po-tential explanation for the more dramatic mitochondrial depolarisationobserved in the soma. Collectively, these data employing a range of im-aging approaches reveal distinct differences in the response of the somaand dendrites to relatively uniform levels of NMDAR-dependent Ca2+
influx.
2.3. Analysis of adaptive metabolic responses to network-wide actionpotential burst activity
While Ca2+ influx through the bath application of high concentra-tions of NMDA triggers excitotoxic death, physiological patterns ofCa2+ influx, such as those triggered by synaptic activity or actionpotential bursting, are well-tolerated and indeed can trigger long-lasting neuroprotective adaptive responses [9]. Nevertheless, electricalactivity is energetically and metabolically demanding, particularly atthe synapses [50], and is known to trigger rapid adaptive responses tomeet this increased demand [44,50]. Against this context we wantedto know whether burst activity triggered different responses in den-drites vs. the somawith regard to energetic andmetabolic homeostasis.Under basal conditions, firing activity is relatively variable cell-to-cell,with ‘events’ ranging from single action potentials (APs) to short bursts.Activity can be enhanced by network disinhibition achieved by treat-ment with the GABAA receptor antagonist bicuculline [48]. This resultsin an increase in AP burst duration and frequency (Fig. 3A–C), while atthe same time rendering responses far more homogeneous cell-to-cell(since the activity is synchronized across the network). In addition,the average degree of depolarisation during each event is substantiallyincreased (Fig. 3D). In order to enhance the metabolic demands on thecell still further, we co-treated neurons with bicuculline along with
Please cite this article as: P. Hasel, et al., Selective dendritic susceptibility toBiochim. Biophys. Acta (2015), http://dx.doi.org/10.1016/j.bbamcr.2014.1
the weak K+ channel blocker 4-aminopyridine (4-AP) [48], which en-hances both burst frequency and duration (Fig. 3A–C), albeit with aslight reduction in average intra-event depolarisation (Fig. 3D).
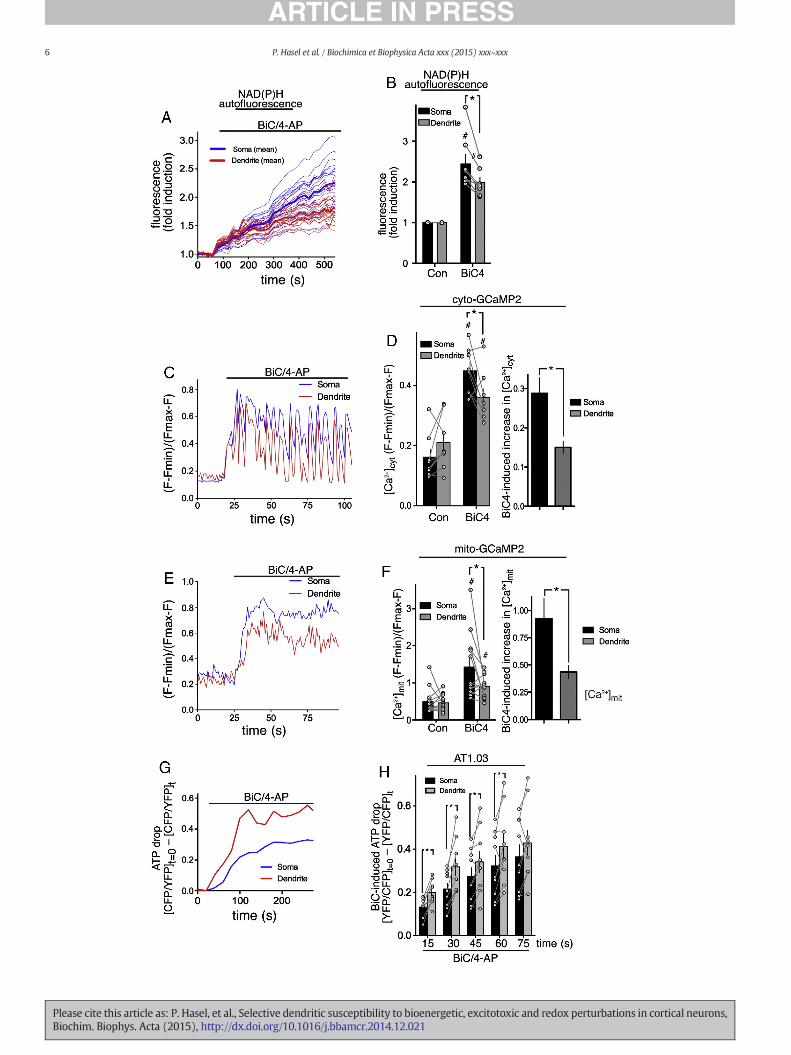
We observed clear evidence of increased metabolic activity to coun-ter the increased energy demand of firing activity triggered bybicuculline/4-AP. Oxygen consumption rate (measured by a Seahorsebioanalyzer) was elevated, indicative of increased oxidative phosphory-lation (Fig. 3E, F). Moreover we observed activating dephosphorylation(on serine 293) of pyruvate dehydrogenase (Fig. 3G), which increasesflux through the TCA cycle [83] and may contribute with Aralar activa-tion to boost oxidative phosphorylation. To determine whether thisresulted in increased NADH production, we employed the geneticallyencoded indicator of cellular NADH:NAD ratio Peredox [51]. We usedthe nuclear-targeted form of Peredox because (as previously reported)expression of the cytoplasmic version results in lysosomal inclusionsin neurons [51]. We first validated the probe in our hands using varyingratios of lactate and pyruvate to alter the cellular NADH:NAD ratio(Fig. 3H, I). We then studied the impact of BiC/4-AP treatment andobserved a strong increase in the Peredox-reported NADH:NAD ratio,consistent with increased NADH production (Fig. 3J).
2.4. Analysis of subcellular metabolic responses during action potentialburst activity
Since Peredox did not give any spatial information on NADH levels,we had to resort to imagingNAD(P)Hautofluorescence to study somaticvs. dendritic responses. We observed increases in NADH autofluores-cence in both somatic and dendritic areas, suggestive of enhanced fluxthrough the TCA cycle in both regions. However, the fold increase inNADH levels was lower in dendritic regions than in somatic ones
bioenergetic, excitotoxic and redox perturbations in cortical neurons,2.021

Fig. 2.During excitotoxicity dendrites suffermore rapid ATP loss but lessmitochondrial dysfunction. A) Ca2+ imaging of neurons expressing Cyt–GCaMP2 before and after treatment withNMDA.AverageCa2+ concentration over the 60 s post NMDA treatment in somata anddendrites is shown. *pb 0.05 paired t-test compared to pre-stimulation level (n=28). B, C)Neuronsexpressing AT1.03 were treated with NMDA as indicated and the YFP:CFP FRET ratio was calculated (ex: 427 ± 5 nm; em: 427 ± 15: 542 ± 13). The change in FRET ratio post-NMDAtreatment is shown (value at t= 0minus value at t), with an increasing value indicating a decreasing FRET ratio (meaning a reduction in ATP). (B) shows example trace, (C) shows quan-titation. *p b 0.05 twoway ANOVAplus Bonferroni's post-hoc test (n= 8). D, E) Neurons loadedwith rhodamine-123were treatedwith NMDA and fluorescencemeasured in somatic anddendritic regions, expressed as a percentage of themaximumobtained upon addition of FCCP. (D) shows a single experiment tracking 20 somatic and 20 dendritic regions (thin lines) andtheir means (thick lines). (E) shows the maximum depolarisation within two time windows that correspond to primary (50–100 s post-NMDA) and secondary (250–350 s post-NMDA)phases of somatic depolarisation. *p b 0.05 t-test (80 somatic and dendritic regions within n= 4 independent experiments). F) Ca2+ imaging of neurons expressing mito-GCaMP2 beforeand after treatment with NMDA. Average Ca2+ concentration over the 60 s post-NMDA treatment in somata and dendrites is shown. #p b 0.05 paired t-test compared to pre-stimulationlevel (n= 12). G, H) NAD(P)H autofluorescence (ex: 387± 5, em: 447± 30) was measured before and after NMDA treatment. (G) shows an example of a single experiment tracking 10somatic and 10 dendritic regions (thin lines) and their means (thick lines). (H) shows the % drop in NAD(P)H autofluorescence (recorded until autofluorescence plateaued at ~300 s postNMDA). *p b 0.05 t-test (80 somatic and dendritic regions within n = 8 independent experiments).
4 P. Hasel et al. / Biochimica et Biophysica Acta xxx (2015) xxx–xxx
(Fig. 4A, B). Since Ca2+ influx and uptake into themitochondria is likelyto be a driver of enhanced NADH production, we investigated whetherthere were any differences in activity-dependent Ca2+ dynamics atsomatic vs. dendritic locations. Using cytoplasmic GCaMP2we observed
Please cite this article as: P. Hasel, et al., Selective dendritic susceptibility toBiochim. Biophys. Acta (2015), http://dx.doi.org/10.1016/j.bbamcr.2014.1
that Ca2+ elevation in somatic regions was on average higher than indendritic regions (Fig. 4C, D). In particular we observed that somaticCa2+ levels remained high between bursts, while in dendritic regionsthey tended to fall down towards baseline levels (Fig. 4C). We have
bioenergetic, excitotoxic and redox perturbations in cortical neurons,2.021

Fig. 3.Network disinhibition triggers strong AP bursting and increasedmetabolic activity. A) Examplewhole-cell current clamp recording of a neuron treated as indicatedwith bicuculline(50 μM) ± 4-aminopyridine (250 μM). Regions marked in red in the upper picture are expanded in the lower pictures. Scale bars: 10 mV/10s (upper); 10 mV/50 ms (lower left); and10 mV/1 s (lower middle and left). B–D) Effect of bicuculline (BiC) or BiC/4-AP (BiC4) on neuronal activity. The frequency of episodes of firing activity (B), their duration (C) and theaverage amount of intra-episode depolarisation (D) are shown. *p b 0.05 ANOVA plus Bonferroni's post-hoc test (n = 14). E, F) Example experiment showing an increase in oxygen con-sumption rate (OCR) by BiC/4-AP treatment (BiC4). Subsequent treatment with oligomycin (1 μM) illustrates that OCR is driven primarily by mitochondrial ATP production. Treatmentwith the uncoupler FCCP (0.125 μM) uncovers the maximal OCR rate, and the OCR after treatment with antimycin (2 μM) plus rotenone (2 μM) (Ant/Rot) represents non-mitochondrialoxygen consumption. (F) shows quantitation of BiC/4-AP-induced OCR. *p b 0.05 t-test (n = 17). G) Western analysis of PDH dephosphorylation in response to BiC/4-AP-induced burstactivity. *p b 0.05 t-test (n=3). H) Example trace showing thefluorescence of Peredox (ex: 387±5, em: 530±10, normalised to itsmCherry tag ex: 575±12, em: 628±24) in neuronsexposed to different ratios of lactate:pyruvate, which alters the cellular NADH:NAD ratio. I) From the calibration data in (H), plus knowledge of the equilibrium constant k = 1.11 ∗ 10−4
of lactate dehydrogenase (to convert lactate:pyruvate to NADH:NAD), the relationship of Peredox fluorescence to NADH:NAD is calculated. Seemethods for further details. J) Effect of BiC/4-AP (BiC4)-induced burst activity on cellular NADH:NAD ratio. *p b 0.05 t-test (n = 19).
5P. Hasel et al. / Biochimica et Biophysica Acta xxx (2015) xxx–xxx
reported these differences in Ca2+ dynamics previously in rat hippo-campal neurons which we attributed to more efficient Ca2+ clearancefrom dendritic regions [48]. As a likely consequence of these differencesin cytoplasmic Ca2+ dynamics, levels of activity-dependent mitochon-drial Ca2+ elevationwere also lower in dendritic regions than in somaticregions (Fig. 4E, F). Finallywe looked at ATP levels, to determinewheth-er the adaptive responses of somatic vs. dendritic regions differed intheir capacity to counter the energetic demands in their respective sub-cellular locations. We found that firing activity caused a depression ofcellular ATP levels, smaller than those observed in response to
Please cite this article as: P. Hasel, et al., Selective dendritic susceptibility toBiochim. Biophys. Acta (2015), http://dx.doi.org/10.1016/j.bbamcr.2014.1
excitotoxic insults but significant nonetheless. Of note, we found thatthe drop in ATP levels was more pronounced in dendritic regions thanin the soma (Fig. 4G, H), suggestive of a greater imbalance betweenenergy use and supply in dendrites during periods of intense activity.
3. Discussion
Here we have shown significant differences in how dendrites andsoma respond to the same challenge, be it oxidative, excitotoxic oractivity-dependent. This adds to a body of work reporting selective
bioenergetic, excitotoxic and redox perturbations in cortical neurons,2.021
6 P. Hasel et al. / Biochimica et Biophysica Acta xxx (2015) xxx–xxx
Please cite this article as: P. Hasel, et al., Selective dendritic susceptibility to bioenergetic, excitotoxic and redox perturbations in cortical neurons,Biochim. Biophys. Acta (2015), http://dx.doi.org/10.1016/j.bbamcr.2014.12.021

7P. Hasel et al. / Biochimica et Biophysica Acta xxx (2015) xxx–xxx
dendritic responses to these types of insult, but raises the question as towhat the basis for these differences is.
3.1. Dendritic vs. somatic responses to ROS exposure
Oxidative stress occurs when there is an imbalance between thelevel of ROS and a cell's ability to neutralise them utilising their intrinsicantioxidant defences, while mild oxidative perturbations can triggeradaptive protective responses [10,11,45,47]. Our study revealed thatexposure of cortical neurons to low levels of H2O2 triggered a greatershift in the GSH redox potential in dendrites compared to the soma ofthe same neuron. Several factors can influence how strongly the GSHredox potential is perturbed, including the rate of production of GSH,the reduction of oxidised GSSG back to GSH, and of course the oxidationof GSH by GSH peroxidases to neutralise H2O2. The stronger perturba-tion of the GSH:GSSG ratio in dendrites upon exposure to H2O2 couldconceivably be due to dendritic vs. somatic differences in one or all ofthese factors. However, an additional consideration is the greatersurface area: volume ratio of dendrites compared to somata, resultingin a higher amount of H2O2 flux into the cytoplasm relative to the vol-ume of cytoplasm available to reduce it. It will also be of interest toknow whether very prolonged exposure to H2O2 results in the GSH:GSSG ratios in both compartments becoming more similar. Deregula-tion of glutathione homeostasis and other antioxidant systems is impli-cated in the aetiology of several neurodegenerative disorders associatedwith dendritic pathologies, including: Alzheimer's disease, Huntington'sdisease, ALS Friedreich's ataxia, and Parkinson's disease [8,54,65], andactivation of GSH pathway enzymes, particularly in astrocytes, is a po-tential therapeutic strategy for combating oxidative stress in the brain[39,41]. Moreover, deficits in the GSH system have been implicated inthe pathophysiology of neuropsychiatric disorders, including schizo-phrenia, bipolar disorder and autistic spectrum disorder [24,30,31,33,38,43,59,69], associated with more subtle dendritic disturbances suchas spine alterations. One would expect that any perturbations to theGSH system would disproportionately affect dendritic (and axonal)regions upon exposure to ROS, either generated endogenously orexogenously (e.g. by microglia).
3.2. Dendritic vs. somatic responses to excitotoxic Ca2+ influx
The neurotoxicity of sustained glutamate exposure [64], latertermed excitotoxicity [78] is predominantly down to excessive Ca2+
influx through the NMDAR [16,18,19], and can kill human neurons aswell as rodent ones [40]. Thework of many laboratories have contribut-ed to our understanding of how glutamate dyshomeostasis, ionic imbal-ance and abnormal NMDAR activity can contribute to excitotoxicity in avariety of acute and chronic disorders [5,14,21,28,29,56,62,76].
Mechanisms of excitotoxicity can differ depending on the intensityof insult [4,12], although other factors such as synaptic/extrasynaptic lo-cation and subunit composition also matter [46,88,89]. Acuteexcitotoxicity (as used in this current study) is associated with a rapiddrop of ATP, loss of mitochondrial membrane potential, and delayedCa2+ deregulation [1,26]. Collapse of the mitochondrial membrane po-tential following NMDAR activation requires Ca2+ influx and isprevented by inhibitors of the potential driven mitochondrial Ca2+
Fig. 4. In response to AP bursting dendritic regions experience lower Ca2+ levels, exhibit weameasured before and after BiC/4-AP (BiC4) treatment. (A) shows an example of a single expelines). (B) shows the fold increase in NAD(P)H autofluorescence 10–16 min post-BiC/4-AP (BiCments). C–F) Ca2+ imaging of neurons expressing cyto-GCaMP2 (C, D) or mito-GCaMP2 (E, F)Ca2+ levels within a single cell (dendrite vs. mitochondria). (D, left) and (F, left) show the ave(D, right) and (F, right) show thedifferencebetween pre- and post-BiC/4-AP stimulation Ca2+ levGCaMP2 and n = 8 cyto-GCaMP2 cells). G, H) Neurons expressing AT1.03 were treated with Btreatment is shown (value at t = 0minus value at t), with an increasing value indicating a decrquantitation. *p b 0.05 two way ANOVA plus Bonferroni's post-hoc test (n = 7).
Please cite this article as: P. Hasel, et al., Selective dendritic susceptibility toBiochim. Biophys. Acta (2015), http://dx.doi.org/10.1016/j.bbamcr.2014.1
uniporter [57], a channel whose molecular identity and accessoryfactors have been recently uncovered [7,20,22]. However, events otherthan mitochondrial Ca2+ uptake are required for mitochondrial mem-brane potential collapse. Current models suggest that increased ROS(especially superoxide) production induced by mitochondrial Ca2+ up-take [26], and by cytoplasmically-activated ROS sources such as NADPHoxidase [13], combined with NO induced by nNOS activation leads toperoxynitrite-induced DNA damage, resulting in PARP-1 activation[26]. PARP-1 activation can then lead to the release of apoptotic factorsfrom the mitochondria [90] as well as cellular NAD depletion and/or in-hibition of glycolysis [3], leading to collapse ofmitochondrialmembranepotential due to a loss of the supply of reducing equivalents to theelectron transport chain [1]. Our observations regarding the subcellularresponses of somata vs. dendrites to excitotoxic insults suggest adisconnection between the severity of ATP depletion and the degreeof mitochondrial depolarisation.
Following NMDA application, matrix Ca2+ levels rise equally insomata and dendrites (Fig. 2), and the immediate modest loss of mito-chondrial membrane potential (likely a direct consequence of positivelycharged Ca2+ uptake), is also similar in both regions. However, whilemitochondrial depolarisation and NADH depletion is more modest indendritic regions, ATP loss is actually more rapid (Fig. 2). One possibleexplanation for the reduced NADH depletion is that PARP-1 activity islower in dendritic regions, which is certainly a possibility since the cur-rent dogma states that PARP-1 activation is triggered by DNAdamage inthe nucleus. This could then explain why mitochondrial depolarisationis more modest in dendritic regions. However, it does not explain therapid loss of ATP observed in dendrites. One possibility is that ATP utili-zation is much higher in dendritic regions, for example to maintaincytoplasmic Ca2+ concentrations at healthy levels in the face of highrates of Ca2+ influx. It is easy to envisage that dendritic regions have ahigher ratio of NMDARs to cytoplasmic volume than somatic regions,meaning a greater demand on ATP-utilising plasma membrane and ERCa2+ pumps. Regardless, it is clear that in both regions mitochondrialdepolarisation is not themain trigger for ATP loss, given that the formeroccurs well after the latter. Accelerated ATP loss within dendrites maybe a consequence of unsustainable demands on the Na+/K+ ATPase indendrites due to Ca2+ and Na+ influx [37]. This increased ion flux alsocontributes to morphological changes to dendrites, such as dendriticbeading [37,73] and spine loss [73].
3.3. Dendritic vs. somatic responses to firing activity
Here we have shown that bicuculline method of network disinhibi-tion is a good stimulation paradigmwithwhich to study energy use andenergy production during network activity. Bicuculline-induced firingactivity results in increased oxygen consumption, indicative of in-creased oxidative phosphorylation. This is likely to be mediated sub-stantially by the cytoplasmic Ca2+-dependent activation of the Aralarcomponent of the malate–aspartate shuttle (MAS) which functions todeliver reducing equivalents into the mitochondria (to reduce mito-chondrial NAD+ toNADH) aswell as promoting generation of pyruvate[32,63]. Additionally, increased flux through the glycolytic pathway issuggested by the fact that the cellular NADH:NAD ratio (as measuredby Peredox) increases sharply. Moreover, increased mitochondrial
ker NADH production, and suffer higher ATP losses. A, B) NAD(P)H autofluorescence wasriment tracking 20 somatic and 20 dendritic regions (thin lines) and their means (thick4). *p b 0.05 t-test (160 somatic and dendritic regions within n = 8 independent experi-before and after treatment with BiC/4-AP. (C) and (E) show example traces depicting therage Ca2+ concentration over the 60 s pre- and post-stimulation in somata and dendrites.els. #p b 0.05 compared to pre-stimulation level; *pb 0.05 somavs. dendrite (n=12mito-iC/4-AP as indicated and the YFP:CFP FRET ratio calculated. The change in FRET ratio post-easing FRET ratio (meaning a reduction in ATP). (G) shows example trace, and (H) shows
bioenergetic, excitotoxic and redox perturbations in cortical neurons,2.021

8 P. Hasel et al. / Biochimica et Biophysica Acta xxx (2015) xxx–xxx
NADH levels in response to burst activity are clearly visible in the NADHautofluorescence imaging experiments. This increase is potentially dueto both increased supply of electrons via the MAS, as well as activa-tion/dephosphorylation of pyruvate dehydrogenase (Fig. 3G) andactivation of Ca2+ dependent enzymes within the TCA cycle [27,34].
The energy cost of synaptic transmission and action potential firingis dealt with in excellent reviews elsewhere [50]. However, a key con-clusion of previous studies is the very high energy cost associatedwith glutamate receptor activation (and recovery therefrom), whichrepresents around 50% of all energy associated with synaptic transmis-sion and AP firing [44]. As such, dendrites are likely to be associatedwith particularly strong ATP consumption during network activity, po-tentially explaining the higher rate of ATP loss in this region, comparedto the soma (Fig. 4F, G). Of course though, there may also be differencesin the ability of dendritic mitochondria to boost energy production,compared to those at the soma, for example due to a more limited sub-strate supply. The activity-dependent increase in NADH withindendrites was observed to be lower than at the soma (Fig. 4A), hintingat such a scenario. Alternatively, the temporal Ca2+ dynamics withindendrites may be less efficient at promoting the type of adaptive pro-cesses described in the previous paragraph. During burst activity, bothcytoplasmic and mitochondrial Ca2+ levels are lower than at the soma(Fig. 4C, E), at least in part due to more rapid clearance of Ca2+ fromthe dendrites in between bursts (see Fig. 4B and [48]). As a result, theCa2+-dependent activation of Aralar or of matrix dehydrogenasescould potentially be weaker within dendrites.
4. Concluding remarks
The development of genetically encoded probes by a number oflaboratories for a variety of second messengers and metabolites isenabling changes in these to be tracked with greater accuracy andspatio-temporal resolution. The considerable differences in the re-sponses of dendrites and soma to a variety of challenges describedin this study have been illuminated thanks to these newly devel-oped probes as well as more established ones. Collectively theypoint to dendrites being particularly vulnerable to both oxidativestress aswell as energy deficits. Sincemanyneurodegenerative diseasesand disease-causing agents are associated with excessive reactive spe-cies production and metabolic/bioenergetic perturbations, this in-creased vulnerability is potentially a contributing factor to earlydendritic changes in a variety of neurodegenerative diseases.
5. Methods
5.1. Cell culture
Cortical neurons were cultured from E17.5 CD1 mouse embryos,essentially as previously described [2,81], at a density of between 9–13 × 104 neurons per cm2. Cultures were prepared in Neurobasalgrowth medium plus 1% rat serum (Harlan Laboratories), B27 (LifeTechnologies Ltd), 1 mM glutamine and 1x antibiotic/antimycotic (LifeTechnologies Ltd). To prevent excessive astrocyte proliferation in neu-ronal cultures, the anti-mitotic drug cytosine β-D-arabino-furanosidehydrochloride (1.2 mM) was applied on DIV4. Cultures were utilisedas indicated between DIV9–11, and were fed with the above describedappropriate growthmediumonDIV4. Prior to transfection cellswere re-moved from growth medium and washed and placed in a minimal de-fined medium [79] containing 10% Minimum Essential Media (MEM,Life Technologies Ltd) and 90% salt–glucose–glycine (SGG) medium[6], which is comprised of 114 mM NaCl, 0.219% NaHCO3, 5.292 mMKCl, 1 mM MgCl2, 2 mM CaCl2, 10 mM HEPES, 1 mM glycine, 30 mMglucose, 0.5 mM sodium pyruvate, and 0.1% Phenol Red; osmolarity325 mosm/l for at least 3 h.
Please cite this article as: P. Hasel, et al., Selective dendritic susceptibility toBiochim. Biophys. Acta (2015), http://dx.doi.org/10.1016/j.bbamcr.2014.1
5.2. General imaging parameters
Imaging was performed at 37 °C in ACSF (in mM): NaCl (150), KCl(3), HEPES (10), glycine (0.1), CaCl2 (2), MgCl2 (1), and glucose (10),pH 7.4 (this was used in all imaging experiments). Images werecaptured using a DFC350 FX digital camera as part of a Leica AF6000LX imaging system. Dendritic ROIs chosen were greater than 2 cellbodies away from the soma and at least 5x narrower.
5.3. Peredox calibration, imaging and data analysis
Peredox is a genetically encoded, circularly permuted fluorescentreporter of the NADH/NAD+ ratio. The probe was excited at 387 ±5 nm and 575 ± 12 nm and emission collected at 530 ± 20 nm and628 ± 14 nm. Peredox can be calibrated by replacing the glucose inthe aCSF with lactate and/or pyruvate (both Sigma), which are theproducts and substrates of the lactate dehydrogenase (LDH). Lactatewill cause LDH to produce NADH (hence increase Peredox fluores-cence), while adding pyruvate will have the opposite effect. Differentlactate:pyruvate ratios were applied to neurons transfected withPeredox in order to obtain a relationship between the lactate:pyru-vate ratio and the percentage of maximum Peredox fluorescence,with lactate alone set to 100%. Lactate:pyruvate ratios were convert-ed into NADH/NAD+ levels by using the LDH equilibrium constant(k), with k = (pyruvate ∗ NADH) / (lactate ∗ NAD+) and k =1.11 ∗ 10−4. This allows to convert the % of maximum fluorescence(achieved by washing on lactate only) into NADH/NAD+ ratios. To cal-ibrate single experiments, at the end of each recording, aCSF containinglactate (10 mM) was applied to obtain the maximum fluorescence ofPeredox and fluorescence was converted into NADH/NAD+ ratios. Allmeasured valueswere normalised to the signal obtained frommCherry,which is tagged to the Peredox protein. Images were taken every 20 s.
5.4. GCaMP2 Ca2+ imaging
Neurons were transfectedwith GCaMP2-encoding vectors (targetedto various locations), the fluorescence signal of which was detectedusing a standard GFP filter set (ex 480 ± 20; em 527 ± 15). Changesin Ca2+were expressed as (F− Fmin) / (Fmax− F) according to the equa-tion [Ca2+] = Kd*(F− Fmin) / (Fmax−F). Fmax was obtained when cellswere treatedwith the cell-permeable Ca2+ ionophore ionomycinwhichboth inserts into the plasma membrane and passes into the cell,inserting into mitochondrial membranes [75], leading to saturation ofthe indicator when in regular medium (2mMCa2+). Fmin was obtainedunder the same conditions except in zero Ca2+medium. The linear rela-tionship between [Ca2+] and (F− Fmin) / (Fmax− F) has been previouslyconfirmed by calibrating the indicator as expressed in neurons, expos-ing them to ionomycin in the presence of sequentially different solu-tions of precise [Ca2+], obtained by mixing K2EGTA and CaEGTAsolutions (Calcium Calibration Buffer Kit, Invitrogen) at different ratios[82].
5.5. Mitochondrial membrane potential imaging, and data analysis
Mitochondrial membrane potential was analysed as described [49,57] using Rh123 (Molecular Probes). Briefly, neurons were loadedwith Rh123 (10 μg/ml or 26 μM) in SGG medium for 10 min followedby extensive washing with SGG. Rh123 partitions into the polarisedmitochondria where it self-quenches at the concentration used. Whenthe mitochondria depolarise, Rh123 leaks out of the mitochondria intothe cytoplasm where it dequenches and fluoresces strongly. MaximumRh123 signal (ex 480 ± 20; em 527 ± 15) was obtained by completelyeliminating themitochondrial potential by exposing the neurons to themitochondrial uncoupler FCCP (5 μM; Sigma). The NMDA-inducedchange in Rh123 fluorescencewasmonitored in a number of cell bodies,plus in adjacent dendritic regions, normalised to the maximal (FCCP-
bioenergetic, excitotoxic and redox perturbations in cortical neurons,2.021
9P. Hasel et al. / Biochimica et Biophysica Acta xxx (2015) xxx–xxx
induced) signal within that region of interest. Background fluorescence(the signal obtained in an area devoid of cells) was subtracted fromimages prior to any analysis.
5.6. NAD(P)H autofluorescence imaging
To measure NAD(P)H autofluorescence, cells were excited at 387 ±5 nm and emitted light was collected at 447 ± 30 nm. Images wereacquired every 20 s. 10–20 somas and dendritic areas were selectedper recording. The drop in NAD(P)H autofluorescence was recordeduntil levels plateaued (~300 s post-NMDA). For experiments whereBiC/4-AP was applied to the cells, NAD(P)H autofluorescence was mea-sured for 10–16 min.
5.7. ATP (AT1.03) imaging and data analysis
AT1.03 is a YFP/CFP based FRET probe reporting ATP levels.Transfected cells were excited at 427 ± 5 nm and CFP and YFP/FRETemission was collected at 472 ± 15 nm and 542 ± 13 nm, respectively.Images were acquired every 5 s. To calibrate AT1.03, the mitochondrialuncoupler FCCP (10 μM) was applied, which deprives cells of ATP andgives the minimum AT1.03 fluorescence. After background subtraction,the YFP/CFP ratio was calculated for each region of interest. The YFP/CFPratio obtained with FCCP was subtracted from the raw YFP/CFP ratio.The drop in ATP following the application of NMDA or BiC/4-AP wasdescribed as the change in the YFP/CFP ratio from the baseline.
5.8. GSH redox potential imaging (Grx1-roGFP2) and data analysis
Grx1-roGFP2 is a genetically encoded reporter of the glutathioneredox potential. It was excited at 387 ± 5 and 494 ± 10 nm and emis-sion collected at 530 ± 10. Images were acquired every 20 s. The 387/494 ratiowas calculated after background subtraction. In order to inves-tigate perturbations of the redox potential, 10 μM H2O2 (Sigma) wasadded to Grx1-roGFP2 transfected cells, which causes a non-saturatingincrease in the 387/494 ratio (peak responses were calculated). Inorder to calibrate the sensor, 100 μM H2O2 was applied to the cells, atwhich Grx1-roGFP2 reaches saturation.
5.9. Electrophysiological recording and analysis
Coverslips containing cortical DIV9–10 neurons were transferred toa recording chamber perfused (at a flow rate of 3–5ml/min)with an ex-ternal recording solution composed of (in mM): 150 NaCl, 2.8 KCl, 10HEPES, 2 CaCl2, 1 MgCl2, 10 glucose, and 0.1 glycine, pH 7.3 (320–330mOsm). Patch-pipettes were made from thick-walled borosilicateglass (Harvard Apparatus, Kent, UK), with a tip resistance ranging be-tween 4–8 MΩ, and filled with a K-gluconate-based internal solutioncontaining (in mM): K-gluconate 141, NaCl 2.5, HEPES 10, and EGTA11; pH 7.3 with KOH. Recordings were at room temperature (21 ±2 °C) using a Multiclamp 200B amplifier (Molecular Devices, UnionCity, CA). Both before and after current-clamp recordings, neuronswere voltage-clamped at −60 mV, and recordings were rejected if theholding current was greater than −100 pA or if the series resistancedrifted by more than 20% of its initial value (b30 MΩ). Synaptic eventswere filtered at 5 kHz and digitized online at 20 kHz via a BNC-2090A/PCI-6251 DAQ board interface (National Instruments, Austin, TX, USA)and analysed usingWinEDR3.2 software (Dr JohnDempster, Universityof Strathclyde, Glasgow, UK).
5.10. Transfection and plasmids
Neuronal transfections were carried out using Lipofectamine 2000(2.33 μl/well, 1 μg/ml, Life Technologies Ltd) on DIV8 neurons. Plasmidsused have been previously described: pCAGGS–GCaMP2was a gift fromKarel Svoboda [67]; GCaMP2-mt was a gift from Xianhua Wang [15];
Please cite this article as: P. Hasel, et al., Selective dendritic susceptibility toBiochim. Biophys. Acta (2015), http://dx.doi.org/10.1016/j.bbamcr.2014.1
Grx1-roGFP2 was a gift from Tobias Dick [42]; and Peredox-NLS was agift from Gary Yellen [51].
5.11. Measurement of oxygen consumption rate
Oxygen consumption rate (OCR) was measured using the SeahorseXF24 extracellular flux analyser (Seahorse Bioscience). Cells wereplated on poly-D-lysine and laminin coated XF24 plates. One hour be-fore the experiment, the medium was changed to XF assay medium(modified DMEM),which does not include sodiumbicarbonate, supple-mented with 10 mM glucose and pH adjusted to 7.4. The followingdrugs were added sequentially: BiC/4-AP (50/250 μM), oligomycin(1 μM), FCCP (0.125 μM) and antimycin A/rotenone (both 2 μM; exceptfor BiC/4-AP, all from Seahorse Bioscience). Oligomycinwill inhibit oxy-gen consumption that is due to ATP production, while FCCP will uncou-ple the mitochondria and thus increase mitochondrial respiration,showing the cell's maximal respiratory capacity. After addition ofantimycin A and rotenone, which will fully inhibit mitochondrial respi-ration, only non-mitochondrial oxygen consumption will be measured.
5.12. Western blotting
Gel electrophoresis and western blotting were performed usingthe Xcell Surelock system (Invitrogen) using precast gradient gels(4–20%) as described [68]. The following antibodies were used: Anti-PDH-E1α (pSer293), Merck Millipore 1:10,000; and Anti-PDH-E1α,Abcam, 1:10,000. For visualisation ofWestern blots, HRP-based second-ary antibodies were used followed by chemiluminescent detection onKodak X-Omat film. Western blots were analysed by digitally scanningthe blots, followed by densitometric analysis (ImageJ). For figure prep-aration of example western blots, linear adjustment of brightness/con-trast was applied (Photoshop) equally across the image.
5.13. Statistical analysis
Paired Student t-tests were used to compare non-independent datapairs, while Student t-tests were utilisedwhen the two groupswere notrelated. For studies employing multiple testing, we used a one-or two-way ANOVA followed by Bonferroni's post-hoc test. In most cases den-dritic and somatic responseswithin the same cell were being compared,meaning that a repeated measure ANOVA was appropriate. For all testssignificance was set at *p b 0.05. Error bars represent standard error ofthe mean.
Acknowledgements
We are very grateful to Michael Ashford, John Findlay and AlisonMilne for advice and assistance in using their Seahourse Bioanalysermachine. We are also grateful to, Tobias Dick, Hiromi Imamura, GaryYellen, and Xianhua Wang for plasmids. This work was supported bythe MRC (G0902044), the Wellcome Trust (WT088156), the BBSRC(D011388), the Royal Society (516002.K5704), and ‘Nplast’ Marie-Curie Initial Training Network (EC289581).
References
[1] A.Y. Abramov, M.R. Duchen, Mechanisms underlying the loss of mitochondrialmembrane potential in glutamate excitotoxicity, Biochim. Biophys. Acta 1777(2008) 953–964.
[2] B. Al-Mubarak, F.X. Soriano, G.E. Hardingham, Synaptic NMDAR activity suppressesFOXO1 expression via a cis-acting FOXO binding site: FOXO1 is a FOXO target gene,Channels (Austin) 3 (2009) 233–238.
[3] S.A. Andrabi, G.K. Umanah, C. Chang, D.A. Stevens, S.S. Karuppagounder, J.P. Gagne,G.G. Poirier, V.L. Dawson, T.M. Dawson, Poly(ADP-ribose) polymerase-dependent en-ergy depletion occurs through inhibition of glycolysis, Proc. Natl. Acad. Sci. U. S. A. 111(2014) 10209–10214.
bioenergetic, excitotoxic and redox perturbations in cortical neurons,2.021

10 P. Hasel et al. / Biochimica et Biophysica Acta xxx (2015) xxx–xxx
[4] M. Ankarcrona, J.M. Dypbukt, E. Bonfoco, B. Zhivotovsky, S. Orrenius, S.A. Lipton, P.Nicotera, Glutamate-induced neuronal death: a succession of necrosis or apoptosisdepending on mitochondrial function, Neuron 15 (1995) 961–973.
[5] M. Arundine, M. Tymianski, Molecular mechanisms of glutamate-dependent neuro-degeneration in ischemia and traumatic brain injury, Cell. Mol. Life Sci. 61 (2004)657–668.
[6] H. Bading, D.D. Ginty, M.E. Greenberg, Regulation of gene expression in hippocam-pal neurons by distinct calcium signaling pathways, Science 260 (1993) 181–186.
[7] J.M. Baughman, F. Perocchi, H.S. Girgis, M. Plovanich, C.A. Belcher-Timme, Y.Sancak, X.R. Bao, L. Strittmatter, O. Goldberger, R.L. Bogorad, V. Koteliansky,V.K. Mootha, Integrative genomics identifies MCU as an essential componentof the mitochondrial calcium uniporter, Nature 476 (2011) 341–345.
[8] K.F. Bell, G.E. Hardingham, CNS peroxiredoxins and their regulation in health anddisease, Antioxid. Redox Signal. 14 (2011) 1467–1477.
[9] K.F. Bell, G.E. Hardingham, The influence of synaptic activity on neuronal health,Curr. Opin. Neurobiol. 21 (2011) 299–305.
[10] K.F. Bell, J.H. Fowler, B. Al-Mubarak, K. Horsburgh, G.E. Hardingham, Activation ofNrf2-regulated glutathione pathway genes by ischemic preconditioning, Oxid.Med. Cell. Longev. 2011 (2011) 689524.
[11] K.F. Bell, B. Al-Mubarak, J.H. Fowler, P.S. Baxter, K. Gupta, T. Tsujita, S. Chowdhry,R. Patani, S. Chandran, K. Horsburgh, J.D. Hayes, G.E. Hardingham, Mild oxidativestress activates Nrf2 in astrocytes, which contributes to neuroprotectiveischemic preconditioning, Proc. Natl. Acad. Sci. U. S. A. 108 (2011) E1–E2 (authorreply E3-4).
[12] E. Bonfoco, D. Krainc, M. Ankarcrona, P. Nicotera, S.A. Lipton, Apoptosis and necrosis:two distinct events induced, respectively, by mild and intense insults with N-methyl-D-aspartate or nitric oxide/superoxide in cortical cell cultures, Proc. Natl.Acad. Sci. U. S. A. 92 (1995) 7162–7166.
[13] A.M. Brennan, S.W. Suh, S.J. Won, P. Narasimhan, T.M. Kauppinen, H. Lee, Y. Edling,P.H. Chan, R.A. Swanson, NADPH oxidase is the primary source of superoxide in-duced by NMDA receptor activation, Nat. Neurosci. 12 (2009) 857–863.
[14] A. Camacho, L. Massieu, Role of glutamate transporters in the clearance and releaseof glutamate during ischemia and its relation to neuronal death, Arch. Med. Res. 37(2006) 11–18.
[15] M. Chen, Y. Wang, T. Hou, H. Zhang, A. Qu, X. Wang, Differential mitochondrialcalcium responses in different cell types detected with a mitochondrial calciumfluorescent indicator, mito-GCaMP2, Acta Biochim. Biophys. Sin. (Shanghai) 43(2011) 822–830.
[16] D.W. Choi, Ionic dependence of glutamate neurotoxicity, J. Neurosci. 7 (1987)369–379.
[17] D.W. Choi, Excitotoxic cell death, J. Neurobiol. 23 (1992) 1261–1276.[18] D.W. Choi, M. Maulucci-Gedde, A.R. Kriegstein, Glutamate neurotoxicity in cortical
cell culture, J. Neurosci. 7 (1987) 357–368.[19] D.W. Choi, J.Y. Koh, S. Peters, Pharmacology of glutamate neurotoxicity in cortical
cell culture: attenuation by NMDA antagonists, J. Neurosci. 8 (1988) 185–196.[20] G. Csordas, P. Varnai, T. Golenar, S.S. Sheu, G. Hajnoczky, Calcium transport across
the inner mitochondrial membrane: molecular mechanisms and pharmacology,Mol. Cell. Endocrinol. 353 (2012) 109–113.
[21] T.M. Dawson, J. Zhang, V.L. Dawson, S.H. Snyder, Nitric oxide: cellular regulation andneuronal injury, Prog. Brain Res. 103 (1994) 365–369.
[22] D. De Stefani, A. Raffaello, E. Teardo, I. Szabo, R. Rizzuto, A forty-kilodalton protein ofthe inner membrane is the mitochondrial calcium uniporter, Nature 476 (2011)336–340.
[23] D.L. Dickstein, D. Kabaso, A.B. Rocher, J.I. Luebke, S.L. Wearne, P.R. Hof, Changes inthe structural complexity of the aged brain, Aging Cell 6 (2007) 275–284.
[24] K.Q. Do, A.H. Trabesinger, M. Kirsten-Kruger, C.J. Lauer, U. Dydak, D. Hell, F. Holsboer,P. Boesiger, M. Cuenod, Schizophrenia: glutathione deficit in cerebrospinal fluid andprefrontal cortex in vivo, Eur. J. Neurosci. 12 (2000) 3721–3728.
[25] D.I. Dryanovski, J.N. Guzman, Z. Xie, D.J. Galteri, L.A. Volpicelli-Daley, V.M. Lee, R.J.Miller, P.T. Schumacker, D.J. Surmeier, Calcium entry and alpha-synuclein inclusionselevate dendritic mitochondrial oxidant stress in dopaminergic neurons, J. Neurosci.33 (2013) 10154–10164.
[26] Y. Duan, R.A. Gross, S.S. Sheu, Ca2+-dependent generation ofmitochondrial reactiveoxygen species serves as a signal for poly(ADP-ribose) polymerase-1 activationduring glutamate excitotoxicity, J. Physiol. 585 (2007) 741–758.
[27] M.R. Duchen, Ca(2+)-dependent changes in the mitochondrial energetics in singledissociated mouse sensory neurons, Biochem. J. 283 (Pt 1) (1992) 41–50.
[28] M.R. Duchen, Mitochondria, calcium-dependent neuronal death and neurodegener-ative disease, Pflugers Arch. 464 (2012) 111–121.
[29] M.M. Fan, L.A. Raymond, N-methyl-D-aspartate (NMDA) receptor function andexcitotoxicity in Huntington's disease, Prog. Neurobiol. 81 (2007) 272–293.
[30] A. Frustaci, M. Neri, A. Cesario, J.B. Adams, E. Domenici, B. Dalla Bernardina, S.Bonassi, Oxidative stress-related biomarkers in autism: systematic review andmeta-analyses, Free Radic. Biol. Med. 52 (2012) 2128–2141.
[31] J.W. Gawryluk, J.F. Wang, A.C. Andreazza, L. Shao, L.T. Young, Decreased levels ofglutathione, the major brain antioxidant, in post-mortem prefrontal cortex frompatients with psychiatric disorders, Int. J. Neuropsychopharmacol. 14 (2011)123–130.
[32] F.N. Gellerich, Z. Gizatullina, T. Gainutdinov, K. Muth, E. Seppet, Z. Orynbayeva, S.Vielhaber, The control of brain mitochondrial energization by cytosolic calcium:the mitochondrial gas pedal, IUBMB Life 65 (2013) 180–190.
[33] A. Ghanizadeh, S. Akhondzadeh, M. Hormozi, A. Makarem, M. Abotorabi-Zarchi, A.Firoozabadi, Glutathione-related factors and oxidative stress in autism, a review,Curr. Med. Chem. 19 (2012) 4000–4005.
[34] B. Glancy, R.S. Balaban, Role of mitochondrial Ca2+ in the regulation of cellularenergetics, Biochemistry 51 (2012) 2959–2973.
Please cite this article as: P. Hasel, et al., Selective dendritic susceptibility toBiochim. Biophys. Acta (2015), http://dx.doi.org/10.1016/j.bbamcr.2014.1
[35] T. Gomez-Isla, T. Spires, A. De Calignon, B.T. Hyman, Neuropathology of Alzheimer'sdisease, Handb. Clin. Neurol. 89 (2008) 233–243.
[36] S.M. Greenwood, C.N. Connolly, Dendritic and mitochondrial changes during gluta-mate excitotoxicity, Neuropharmacology 53 (2007) 891–898.
[37] S.M. Greenwood, S.M. Mizielinska, B.G. Frenguelli, J. Harvey, C.N. Connolly, Mito-chondrial dysfunction and dendritic beading during neuronal toxicity, J. Biol.Chem. 282 (2007) 26235–26244.
[38] G. Grima, B. Benz, V. Parpura, M. Cuenod, K.Q. Do, Dopamine-induced oxidativestress in neurons with glutathione deficit: implication for schizophrenia, Schizophr.Res. 62 (2003) 213–224.
[39] K. Gupta, S. Chandran, G.E. Hardingham, Human stem cell-derived astrocytesand their application to studying Nrf2-mediated neuroprotective pathwaysand therapeutics in neurodegeneration, Br. J. Clin. Pharmacol. 75 (2012)907–918.
[40] K. Gupta, G.E. Hardingham, S. Chandran, NMDA receptor-dependent glutamateexcitotoxicity in human embryonic stem cell-derived neurons, Neurosci. Lett. 543(2013) 95–100.
[41] K. Gupta, R. Patani, P. Baxter, A. Serio, D. Story, T. Tsujita, J.D. Hayes, R.A. Pedersen,G.E. Hardingham, S. Chandran, Human embryonic stem cell derived astrocytesmediate non-cell-autonomous neuroprotection through endogenous and drug-induced mechanisms, Cell Death Differ. 19 (2012) 779–787.
[42] M. Gutscher, A.L. Pauleau, L. Marty, T. Brach, G.H. Wabnitz, Y. Samstag, A.J. Meyer,T.P. Dick, Real-time imaging of the intracellular glutathione redox potential, Nat.Methods 5 (2008) 553–559.
[43] R. Gysin, R. Kraftsik, J. Sandell, P. Bovet, C. Chappuis, P. Conus, P. Deppen, M.Preisig, V. Ruiz, P. Steullet, M. Tosic, T. Werge, M. Cuenod, K.Q. Do, Impairedglutathione synthesis in schizophrenia: convergent genetic and functionalevidence, Proc. Natl. Acad. Sci. U. S. A. 104 (2007) 16621–16626.
[44] C.N. Hall, M.C. Klein-Flugge, C. Howarth, D. Attwell, Oxidative phosphorylation, notglycolysis, powers presynaptic and postsynaptic mechanisms underlying brain in-formation processing, J. Neurosci. 32 (2012) 8940–8951.
[45] B. Halliwell, Oxidative stress and neurodegeneration: where are we now? J.Neurochem. 97 (2006) 1634–1658.
[46] G.E. Hardingham, H. Bading, Synaptic versus extrasynaptic NMDA receptor signal-ling: implications for neurodegenerative disorders, Nat. Rev. Neurosci. 11 (2010)682–696.
[47] G.E. Hardingham, S.A. Lipton, Regulation of neuronal oxidative and nitrosative stressby endogenous protective pathways and disease processes, Antioxid. Redox Signal.14 (2011) 1421–1424.
[48] G.E. Hardingham, F.J. Arnold, H. Bading, Nuclear calcium signaling controls CREB-mediated gene expression triggered by synaptic activity, Nat. Neurosci. 4 (2001)261–267.
[49] G.E. Hardingham, Y. Fukunaga, H. Bading, Extrasynaptic NMDARs oppose synapticNMDARs by triggering CREB shut-off and cell death pathways, Nat. Neurosci. 5(2002) 405–414.
[50] J.J. Harris, R. Jolivet, D. Attwell, Synaptic energy use and supply, Neuron 75 (2012)762–777.
[51] Y.P. Hung, J.G. Albeck, M. Tantama, G. Yellen, Imaging cytosolic NADH–NAD(+)redox state with a genetically encoded fluorescent biosensor, Cell Metab. 14(2011) 545–554.
[52] H. Imamura, K.P. Nhat, H. Togawa, K. Saito, R. Iino, Y. Kato-Yamada, T. Nagai, H.Noji, Visualization of ATP levels inside single living cells with fluorescence reso-nance energy transfer-based genetically encoded indicators, Proc. Natl. Acad.Sci. U. S. A. 106 (2009) 15651–15656.
[53] L.M. Ittner, Y.D. Ke, F. Delerue, M. Bi, A. Gladbach, J. van Eersel, H. Wolfing, B.C.Chieng, M.J. Christie, I.A. Napier, A. Eckert, M. Staufenbiel, E. Hardeman, J. Gotz,Dendritic function of Tau mediates amyloid-beta toxicity in Alzheimer's diseasemouse models, Cell 142 (2010) 387–397.
[54] W.M. Johnson, A.L. Wilson-Delfosse, J.J. Mieyal, Dysregulation of glutathione homeo-stasis in neurodegenerative diseases, Nutrients 4 (2012) 1399–1440.
[55] A. Johri, M.F. Beal, Mitochondrial dysfunction in neurodegenerative diseases, J.Pharmacol. Exp. Ther. 342 (2012) 619–630.
[56] L.V. Kalia, S.K. Kalia, M.W. Salter, NMDA receptors in clinical neurology: excitatorytimes ahead, Lancet Neurol. 7 (2008) 742–755.
[57] J. Keelan, O. Vergun, M.R. Duchen, Excitotoxic mitochondrial depolarisation requiresboth calcium and nitric oxide in rat hippocampal neurons, J. Physiol. 520 (Pt 3)(1999) 797–813.
[58] N. Khatri, H.Y. Man, Synaptic activity and bioenergy homeostasis: implications inbrain trauma and neurodegenerative diseases, Front. Neurol. 4 (2013) 199.
[59] A. Kulak, P. Steullet, J.H. Cabungcal, T. Werge, A. Ingason, M. Cuenod, K.Q. Do, Redoxdysregulation in the pathophysiology of schizophrenia and bipolar disorder:insights from animal models, Antioxid. Redox Signal. 18 (2013) 1428–1443.
[60] A. Lau, M. Tymianski, Glutamate receptors, neurotoxicity and neurodegeneration,Pflugers Arch. 460 (2010) 525–542.
[61] S.A. Lipton, Paradigm shift in neuroprotection by NMDA receptor blockade:memantine and beyond, Nat. Rev. Drug Discov. 5 (2006) 160–170.
[62] S.A. Lipton, P.A. Rosenberg, Excitatory amino acids as a final common pathway forneurologic disorders, N. Engl. J. Med. 330 (1994) 613–621.
[63] I. Llorente-Folch, C.B. Rueda, I. Amigo, A. del Arco, T. Saheki, B. Pardo, J. Satrustegui,Calcium-regulation of mitochondrial respiration maintains ATP homeostasis andrequires ARALAR/AGC1-malate aspartate shuttle in intact cortical neurons, J.Neurosci. 33 (2013) 13957–13971 (13971a).
[64] D.R. Lucas, J.P. Newhouse, The toxic effect of sodium L-glutamate on the inner layersof the retina, AMA Arch. Ophthalmol. 58 (1957) 193–201.
[65] J.I. Luebke, C.M. Weaver, A.B. Rocher, A. Rodriguez, J.L. Crimins, D.L. Dickstein, S.L.Wearne, P.R. Hof, Dendritic vulnerability in neurodegenerative disease: insights
bioenergetic, excitotoxic and redox perturbations in cortical neurons,2.021

11P. Hasel et al. / Biochimica et Biophysica Acta xxx (2015) xxx–xxx
from analyses of cortical pyramidal neurons in transgenic mouse models, BrainStruct. Funct. 214 (2010) 181–199.
[66] G. Mairet-Coello, J. Courchet, S. Pieraut, V. Courchet, A. Maximov, F. Polleux, TheCAMKK2–AMPK kinase pathway mediates the synaptotoxic effects of Abetaoligomers through Tau phosphorylation, Neuron 78 (2013) 94–108.
[67] T. Mao, D.H. O'Connor, V. Scheuss, J. Nakai, K. Svoboda, Characterization and subcel-lular targeting of GCaMP-type genetically-encoded calcium indicators, PLoS One 3(2008) e1796.
[68] M.A. Martel, T.J. Ryan, K.F. Bell, J.H. Fowler, A. McMahon, B. Al-Mubarak, N.H.Komiyama, K. Horsburgh, P.C. Kind, S.G. Grant, D.J. Wyllie, G.E. Hardingham, Thesubtype of GluN2 C-terminal domain determines the response to excitotoxic insults,Neuron 74 (2012) 543–556.
[69] D. Matsuzawa, K. Hashimoto, Magnetic resonance spectroscopy study of the antiox-idant defense system in schizophrenia, Antioxid. Redox Signal. 15 (2011)2057–2065.
[70] A. Mehta, M. Prabhakar, P. Kumar, R. Deshmukh, P.L. Sharma, Excitotoxicity: bridgeto various triggers in neurodegenerative disorders, Eur. J. Pharmacol. 698 (2013)6–18.
[71] A. Melo, L. Monteiro, R.M. Lima, D.M. Oliveira, M.D. Cerqueira, R.S. El-Bacha, Oxida-tive stress in neurodegenerative diseases: mechanisms and therapeutic perspec-tives, Oxid. Med. Cell. Longev. 2011 (2011) 467180.
[72] A. Milnerwood, C. Gladding, M. Pouladi, A. Kaufman, R. Hines, J. Boyd, R. Ko, O.Vasuta, R. Graham, M. Hayden, T. Murphy, L. Raymond, Early increase inextrasynaptic NMDA receptor signalling and expression contributes to phenotypeonset in Huntington's disease mice, Neuron 65 (2010) 178–190.
[73] S.M. Mizielinska, S.M. Greenwood, H. Tummala, C.N. Connolly, Rapid dendritic andaxonal responses to neuronal insults, Biochem. Soc. Trans. 37 (2009) 1389–1393.
[74] T. Nakamura, D.H. Cho, S.A. Lipton, Redox regulation of protein misfolding,mitochondrial dysfunction, synaptic damage, and cell death in neurodegenerativediseases, Exp. Neurol. 238 (2012) 12–21.
[75] D.G. Nicholls, Simultaneous monitoring of ionophore- and inhibitor-mediatedplasma and mitochondrial membrane potential changes in cultured neurons, J.Biol. Chem. 281 (2006) 14864–14874.
[76] D.G. Nicholls, Mitochondrial calcium function and dysfunction in the centralnervous system, Biochim. Biophys. Acta 1787 (2009) 1416–1424.
[77] S. Okamoto, M.A. Pouladi, M. Talantova, D. Yao, P. Xia, D.E. Ehrnhoefer, R. Zaidi, A.Clemente, M. Kaul, R.K. Graham, D. Zhang, H.S. Vincent Chen, G. Tong, M.R.Hayden, S.A. Lipton, Balance between synaptic versus extrasynaptic NMDA receptoractivity influences inclusions and neurotoxicity of mutant huntingtin, Nat. Med. 15(2009) 1407–1413.
[78] J.W. Olney, Brain lesions, obesity, and other disturbances in mice treated withmonosodium glutamate, Science 164 (1969) 719–721.
Please cite this article as: P. Hasel, et al., Selective dendritic susceptibility toBiochim. Biophys. Acta (2015), http://dx.doi.org/10.1016/j.bbamcr.2014.1
[79] S. Papadia, P. Stevenson, N.R. Hardingham, H. Bading, G.E. Hardingham, NuclearCa2+ and the cAMP response element-binding protein family mediate a latephase of activity-dependent neuroprotection, J. Neurosci. 25 (2005) 4279–4287.
[80] M.P. Parsons, L.A. Raymond, Extrasynaptic NMDA receptor involvement in centralnervous system disorders, Neuron 82 (2014) 279–293.
[81] C. Puddifoot, M.A. Martel, F.X. Soriano, A. Camacho, A. Vidal-Puig, D.J. Wyllie, G.E.Hardingham, PGC-1alpha negatively regulates extrasynaptic NMDAR activity andexcitotoxicity, J. Neurosci. 32 (2012) 6995–7000.
[82] J. Qiu, Y.W. Tan, A.M. Hagenston, M.A. Martel, N. Kneisel, P.A. Skehel, D.J. Wyllie, H.Bading, G.E. Hardingham, Mitochondrial calcium uniporter Mcu controlsexcitotoxicity and is transcriptionally repressed by neuroprotective nuclear calciumsignals, Nat. Commun. 4 (2013) 2034.
[83] M.J. Rardin, S.E. Wiley, R.K. Naviaux, A.N. Murphy, J.E. Dixon, Monitoringphosphorylation of the pyruvate dehydrogenase complex, Anal. Biochem. 389(2009) 157–164.
[84] A.B. Rocher, M.S. Kinson, J.I. Luebke, Significant structural but not physiologicalchanges in cortical neurons of 12-month-old Tg2576 mice, Neurobiol. Dis. 32(2008) 309–318.
[85] Z. Siskova, D. Justus, H. Kaneko, D. Friedrichs, N. Henneberg, T. Beutel, J. Pitsch, S.Schoch, A. Becker, H. von der Kammer, S. Remy, Dendritic structural degenerationis functionally linked to cellular hyperexcitability in a mouse model of Alzheimer'sdisease, Neuron 84 (2014) 1023–1033.
[86] F.X. Soriano, S. Papadia, F. Hofmann, N.R. Hardingham, H. Bading, G.E. Hardingham,Preconditioning doses of NMDA promote neuroprotection by enhancing neuronalexcitability, J. Neurosci. 26 (2006) 4509–4518.
[87] T.L. Spires, B.T. Hyman, Neuronal structure is altered by amyloid plaques, Rev.Neurosci. 15 (2004) 267–278.
[88] A.S.Wahl, B. Buchthal, F. Rode, S.F. Bomholt, H.E. Freitag, G.E. Hardingham, L.C. Ronn,H. Bading, Hypoxic/ischemic conditions induce expression of the putative pro-deathgene Clca1 via activation of extrasynaptic N-methyl-D-aspartate receptors,Neuroscience 158 (2009) 344–352.
[89] D.J. Wyllie, M.R. Livesey, G.E. Hardingham, Influence of GluN2 subunit identity onNMDA receptor function, Neuropharmacology 74 (2013) 4–17.
[90] S.W. Yu, H. Wang, M.F. Poitras, C. Coombs, W.J. Bowers, H.J. Federoff, G.G. Poirier,T.M. Dawson, V.L. Dawson, Mediation of poly(ADP-ribose) polymerase-1-dependent cell death by apoptosis-inducing factor, Science 297 (2002) 259–263.
[91] G. Zundorf, G. Reiser, Calcium dysregulation and homeostasis of neural calcium inthe molecular mechanisms of neurodegenerative diseases provide multiple targetsfor neuroprotection, Antioxid. Redox Signal. 14 (2011) 1275–1288.
bioenergetic, excitotoxic and redox perturbations in cortical neurons,2.021