edexcel international gcse (9 –1)...
TRANSCRIPT
EDEXCEL INTERNATIONAL GCSE (9 –1)
MATHEMATICS AStudent Book 1David Turner, Ian Potts
eBookincluded 1

Online access to your ActiveBookThank you for buying this Edexcel International GCSE (9-1) Mathematics A Student Book 1. It comes with three years’ access* to ActiveBook – an online, digital version of your textbook. You can personalise your ActiveBook with notes, highlights and links to your wider reading. It is perfect for supporting your coursework and revision activities.
* For new purchases only. If this access code has already been revealed, it may no longer be valid. If you have bought this textbook second hand, the code may already have been used by the fi rst owner of the book.
How to access your ActiveBook
1 Scratch the panel off with a coin to reveal your unique access code. Do not use a knife or other sharp object as it may damage the code.
2 Go to www.pearsonactivelearn.com
3If you already have an ActiveLearn Digital Services account (ActiveTeach or ActiveLearn), log in and click ‘I have a new access code’ in the top right of the screen.• Type in the code above and select ‘Activate’.
4If you do not have an ActiveLearn Digital Services account, click ‘Register’. It is free to do this.• Type in the code above and select ‘Activate’.• Simply follow the instructions on screen to register.
Important information• The access code can only be used once.• Please activate your access code as soon as possible, as it does have a ‘use by date’. If your code has expired
when you enter it, please contact our ActiveLearn support site at [email protected] • The ActiveBook will be valid for three years upon activation.
Getting help• To check that you will be able to access an ActiveBook, go to www.pearsonactivelearn.com/support
and choose ‘Will ActiveLearn Digital Service work on my computer?’ then select ‘Run system check’.• If you have any questions about accessing your ActiveBook, please contact our ActiveLearn support site at
www.pearsonactivelearn.com/support
EDEXCEL INTERNATIONAL GCSE (9 –1)
MATHEMATICS AStudent Book 1
David Turner,Ian Potts
Published by Pearson Education Limited, 80 Strand, London, WC2R 0RL.
www.pearsonglobalschools.com
Copies of official specifications for all Edexcel qualifications may be found
on the website: www.qualifications.pearson.com
Text © Pearson Education Limited 2016
Edited by Lyn Imeson
Answers checked by Laurice Suess
Designed by Cobalt id
Typeset by Cobalt id
Original illustrations © Pearson Education Limited 2016
Illustrated by © Cobalt id
Cover design by Pearson Education Limited
Picture research by Ann Thomson
Cover photo/illustration © Shutterstock.com: Filip Fuxa
The rights of David Turner and Ian Potts to be identified as authors of this work have been asserted by them in accordance with the Copyright, Designs and Patents Act 1988.
First published 2016
19 18 17 16
10 9 8 7 6 5 4 3 2 1
British Library Cataloguing in Publication DataA catalogue record for this book is available from the British Library
ISBN 978 0 435 18144 4
Copyright notice
All rights reserved. No part of this publication may be reproduced in any form or by any means (including photocopying or storing it in any medium by electronic means and whether or not transiently or incidentally to some other use of this publication) without the written permission of the copyright owner, except in accordance with the provisions of the Copyright, Designs and Patents Act 1988 or under the terms of a licence issued by the Copyright Licensing Agency, Saffron House, 6–10 Kirby Street, London EC1N 8TS (www.cla.co.uk). Applications for the copyright owner’s
written permission should be addressed to the publisher.
Printed by Neografia in Slovakia
Dedicated to Viv Hony who started the whole project.
Grateful for contributions from Jack Barraclough, Chris Baston, Ian Bettison, Sharon Bolger, Phil Boor, Ian Boote, Judith Chadwick, Tony Cushen, Tara Doyle, Kath Hipkiss, Ian Jacques, Catherine Murphy, Su Nicholson, Naomi Norman, Diane Oliver, Katherine Pate, Glyn Payne, Jenny Roach, Carol Roberts, Peter Sherran, Robert Ward-Penny and our Development Editor: Gwen Burns.
Websites
There are links to relevant websites in this book. In order to ensure that the links are up to date and that the links work we have made the links available on our website at www.pearsonhotlinks.co.uk. Search for ISBN 978 0 435 18144 4.
Endorsement Statement
In order to ensure that this resource offers high-quality support for the
associated Pearson qualification, it has been through a review process by
the awarding body. This process confirms that this resource fully covers the
teaching and learning content of the specification or part of a specification at
which it is aimed. It also confirms that it demonstrates an appropriate balance
between the development of subject skills, knowledge and understanding, in
addition to preparation for assessment.
Endorsement does not cover any guidance on assessment activities or
processes (e.g. practice questions or advice on how to answer assessment
questions), included in the resource nor does it prescribe any particular
approach to the teaching or delivery of a related course.
While the publishers have made every attempt to ensure that advice on the
qualification and its assessment is accurate, the official specification and
associated assessment guidance materials are the only authoritative source
of information and should always be referred to for definitive guidance.
Pearson examiners have not contributed to any sections in this resource
relevant to examination papers for which they have responsibility.
Examiners will not use endorsed resources as a source of material for any
assessment set by Pearson. Endorsement of a resource does not mean that
the resource is required to achieve this Pearson qualification, nor does it mean
that it is the only suitable material available to support the qualification, and
any resource lists produced by the awarding body shall include this and other
appropriate resources.
CONTENTS iii
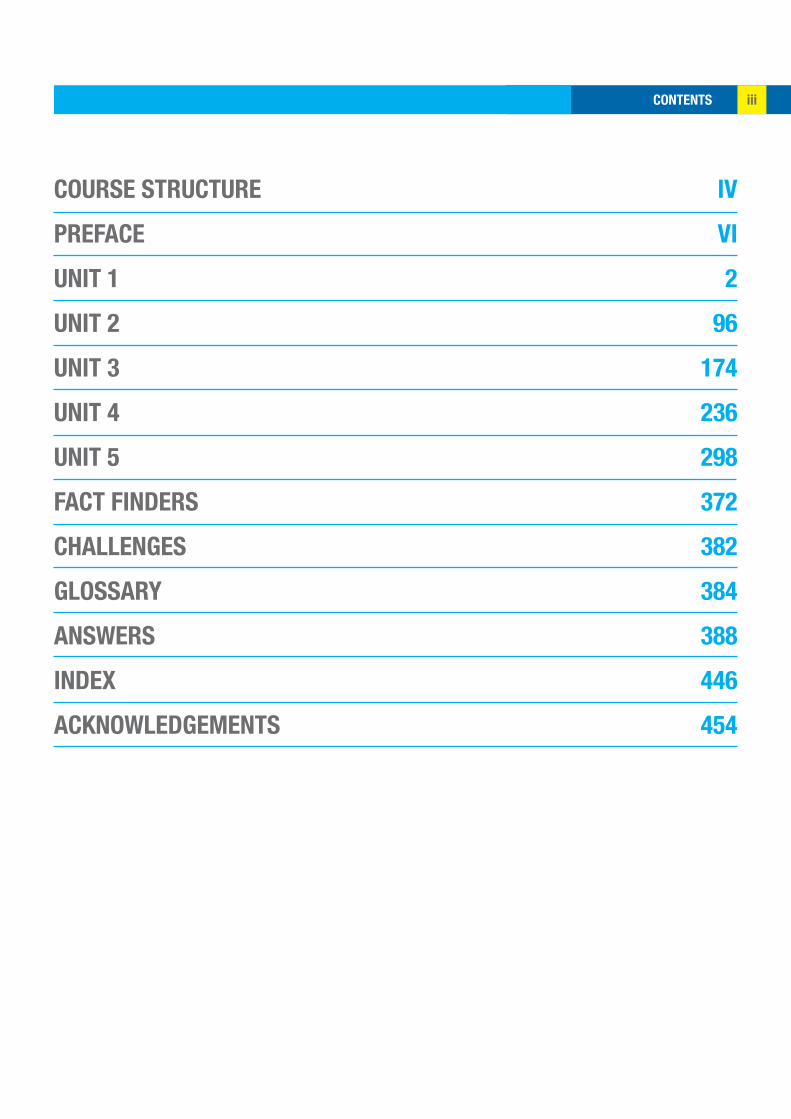
COURSE STRUCTURE
PREFACE
UNIT 1
UNIT 2
UNIT 3
UNIT 4
UNIT 5
FACT FINDERS
CHALLENGES
GLOSSARY
ANSWERS
INDEX
ACKNOWLEDGEMENTS
IV
VI
2
96
174
236
298
372
382
384
388
446
454
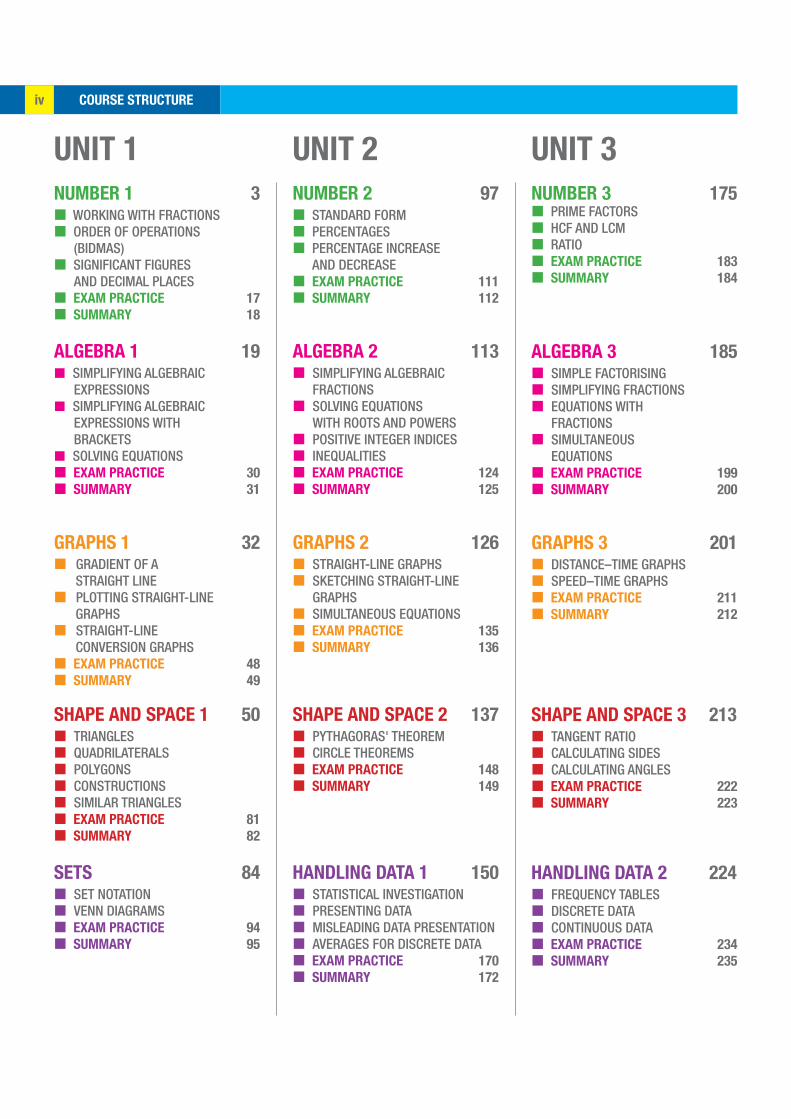
COURSE STRUCTUREiv
UNIT 1
NUMBER 1 3◼ WORKING WITH FRACTIONS◼ ORDER OF OPERATIONS
(BIDMAS)◼ SIGNIFICANT FIGURES
AND DECIMAL PLACES◼ EXAM PRACTICE 17
◼ SUMMARY 18
ALGEBRA 1 19◼ SIMPLIFYING ALGEBRAIC
EXPRESSIONS◼ SIMPLIFYING ALGEBRAIC
EXPRESSIONS WITH BRACKETS
◼ SOLVING EQUATIONS◼ EXAM PRACTICE 30
◼ SUMMARY 31
GRAPHS 1 32◼ GRADIENT OF A
STRAIGHT LINE◼ PLOTTING STRAIGHT-LINE
GRAPHS◼ STRAIGHT-LINE
CONVERSION GRAPHS◼ EXAM PRACTICE 48
◼ SUMMARY 49
SHAPE AND SPACE 1 50◼ TRIANGLES◼ QUADRILATERALS◼ POLYGONS◼ CONSTRUCTIONS◼ SIMILAR TRIANGLES◼ EXAM PRACTICE 81
◼ SUMMARY 82
SETS 84◼ SET NOTATION◼ VENN DIAGRAMS◼ EXAM PRACTICE 94
◼ SUMMARY 95
UNIT 2
NUMBER 2 97◼ STANDARD FORM ◼ PERCENTAGES ◼ PERCENTAGE INCREASE
AND DECREASE ◼ EXAM PRACTICE 111
◼ SUMMARY 112
ALGEBRA 2 113◼ SIMPLIFYING ALGEBRAIC
FRACTIONS◼ SOLVING EQUATIONS
WITH ROOTS AND POWERS◼ POSITIVE INTEGER INDICES ◼ INEQUALITIES◼ EXAM PRACTICE 124
◼ SUMMARY 125
GRAPHS 2 126◼ STRAIGHT-LINE GRAPHS◼ SKETCHING STRAIGHT-LINE
GRAPHS◼ SIMULTANEOUS EQUATIONS◼ EXAM PRACTICE 135
◼ SUMMARY 136
SHAPE AND SPACE 2 137◼ PYTHAGORAS' THEOREM◼ CIRCLE THEOREMS ◼ EXAM PRACTICE 148
◼ SUMMARY 149
HANDLING DATA 1 150◼ STATISTICAL INVESTIGATION◼ PRESENTING DATA◼ MISLEADING DATA PRESENTATION◼ AVERAGES FOR DISCRETE DATA◼ EXAM PRACTICE 170
◼ SUMMARY 172
UNIT 3
NUMBER 3 175◼ PRIME FACTORS◼ HCF AND LCM◼ RATIO◼ EXAM PRACTICE 183
◼ SUMMARY 184
ALGEBRA 3 185◼ SIMPLE FACTORISING◼ SIMPLIFYING FRACTIONS◼ EQUATIONS WITH
FRACTIONS◼ SIMULTANEOUS
EQUATIONS◼ EXAM PRACTICE 199
◼ SUMMARY 200
GRAPHS 3 201◼ DISTANCE–TIME GRAPHS◼ SPEED–TIME GRAPHS◼ EXAM PRACTICE 211
◼ SUMMARY 212
SHAPE AND SPACE 3 213◼ TANGENT RATIO◼ CALCULATING SIDES◼ CALCULATING ANGLES◼ EXAM PRACTICE 222
◼ SUMMARY 223
HANDLING DATA 2 224◼ FREQUENCY TABLES◼ DISCRETE DATA ◼ CONTINUOUS DATA◼ EXAM PRACTICE 234
◼ SUMMARY 235
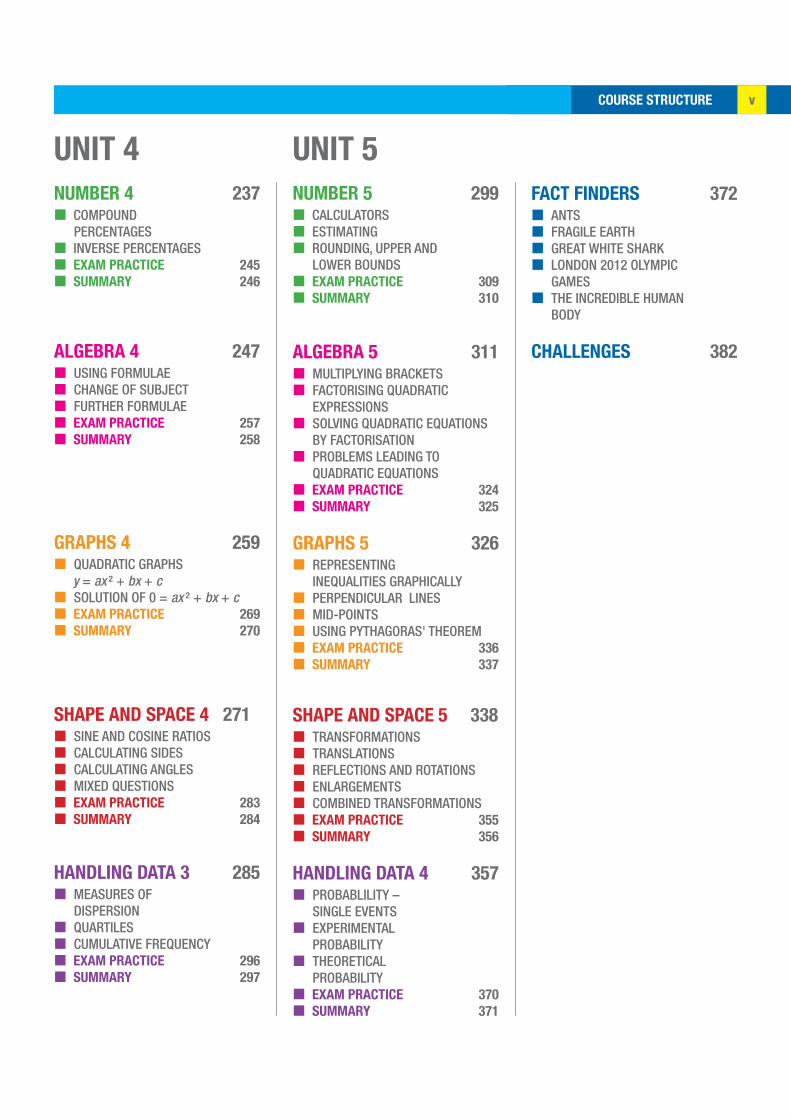
COURSE STRUCTURE v
UNIT 4
NUMBER 4 237◼ COMPOUND
PERCENTAGES◼ INVERSE PERCENTAGES◼ EXAM PRACTICE 245
◼ SUMMARY 246
ALGEBRA 4 247◼ USING FORMULAE◼ CHANGE OF SUBJECT◼ FURTHER FORMULAE◼ EXAM PRACTICE 257
◼ SUMMARY 258
GRAPHS 4 259◼ QUADRATIC GRAPHS y = ax ² + bx + c◼ SOLUTION OF 0 = ax ² + bx + c◼ EXAM PRACTICE 269
◼ SUMMARY 270
SHAPE AND SPACE 4 271◼ SINE AND COSINE RATIOS◼ CALCULATING SIDES◼ CALCULATING ANGLES◼ MIXED QUESTIONS◼ EXAM PRACTICE 283
◼ SUMMARY 284
HANDLING DATA 3 285◼ MEASURES OF
DISPERSION◼ QUARTILES◼ CUMULATIVE FREQUENCY◼ EXAM PRACTICE 296
◼ SUMMARY 297
UNIT 5
NUMBER 5 299◼ CALCULATORS◼ ESTIMATING◼ ROUNDING, UPPER AND
LOWER BOUNDS◼ EXAM PRACTICE 309
◼ SUMMARY 310
ALGEBRA 5 311◼ MULTIPLYING BRACKETS◼ FACTORISING QUADRATIC
EXPRESSIONS◼ SOLVING QUADRATIC EQUATIONS
BY FACTORISATION◼ PROBLEMS LEADING TO
QUADRATIC EQUATIONS◼ EXAM PRACTICE 324
◼ SUMMARY 325
GRAPHS 5 326◼ REPRESENTING
INEQUALITIES GRAPHICALLY◼ PERPENDICULAR LINES◼ MID-POINTS◼ USING PYTHAGORAS' THEOREM◼ EXAM PRACTICE 336
◼ SUMMARY 337
SHAPE AND SPACE 5 338◼ TRANSFORMATIONS◼ TRANSLATIONS◼ REFLECTIONS AND ROTATIONS◼ ENLARGEMENTS◼ COMBINED TRANSFORMATIONS◼ EXAM PRACTICE 355
◼ SUMMARY 356
HANDLING DATA 4 357◼ PROBABLILITY –
SINGLE EVENTS◼ EXPERIMENTAL
PROBABILITY◼ THEORETICAL
PROBABILITY◼ EXAM PRACTICE 370
◼ SUMMARY 371
FACT FINDERS 372◼ ANTS◼ FRAGILE EARTH◼ GREAT WHITE SHARK◼ LONDON 2012 OLYMPIC
GAMES◼ THE INCREDIBLE HUMAN
BODY
CHALLENGES 382

PREFACEvi
ALGEBRA 1UNIT 1 19
LEARNING OBJECTIVES
BASIC PRINCIPLES
ACTIVITY 1
ALGEBRA 1
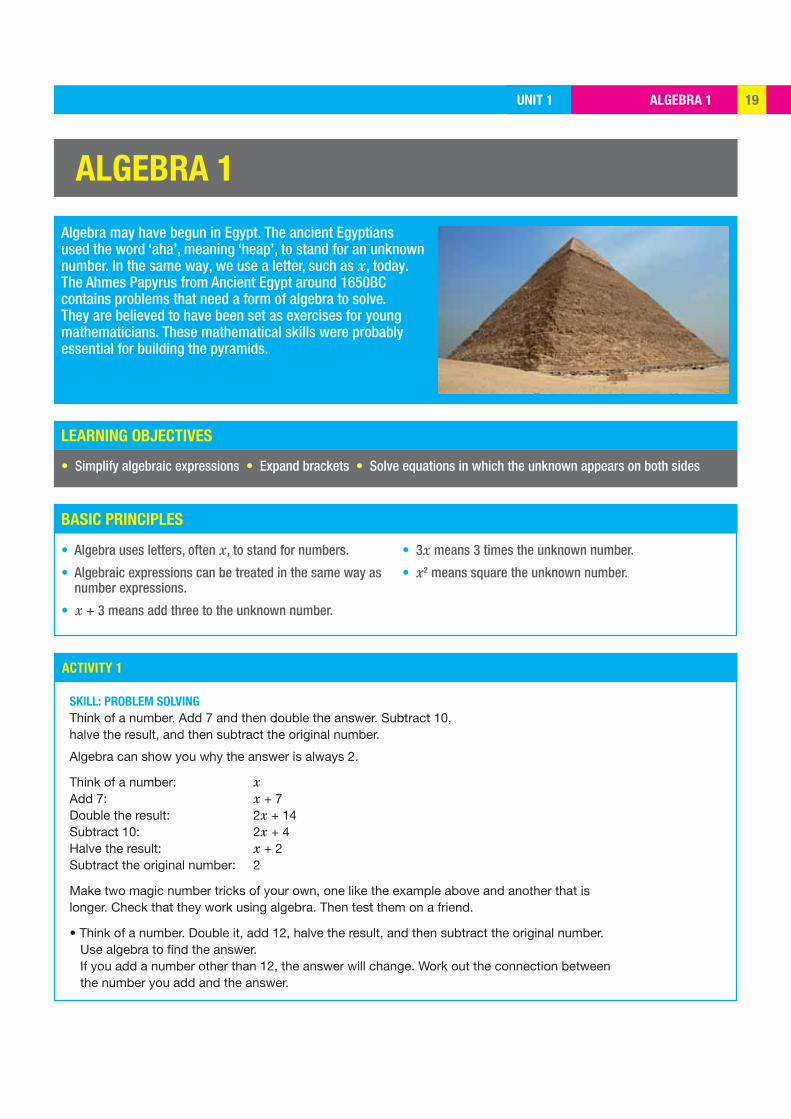
Algebra may have begun in Egypt. The ancient Egyptians used the word ‘aha’, meaning ‘heap’, to stand for an unknown number. In the same way, we use a letter, such as x, today. The Ahmes Papyrus from Ancient Egypt around 1650BC contains problems that need a form of algebra to solve. They are believed to have been set as exercises for young mathematicians. These mathematical skills were probably essential for building the pyramids.
• Simplify algebraic expressions • Expand brackets • Solve equations in which the unknown appears on both sides
• Algebra uses letters, often x, to stand for numbers.
• Algebraic expressions can be treated in the same way as number expressions.
• x + 3 means add three to the unknown number.
• 3x means 3 times the unknown number.
• x2 means square the unknown number.
SKILL: PROBLEM SOLVING Think of a number. Add 7 and then double the answer. Subtract 10, halve the result, and then subtract the original number.
Algebra can show you why the answer is always 2.
Think of a number: xAdd 7: x + 7Double the result: 2x + 14Subtract 10: 2x + 4Halve the result: x + 2Subtract the original number: 2
Make two magic number tricks of your own, one like the example above and another that is longer. Check that they work using algebra. Then test them on a friend.
• Think of a number. Double it, add 12, halve the result, and then subtract the original number. Use algebra to fi nd the answer. If you add a number other than 12, the answer will change. Work out the connection between
the number you add and the answer.
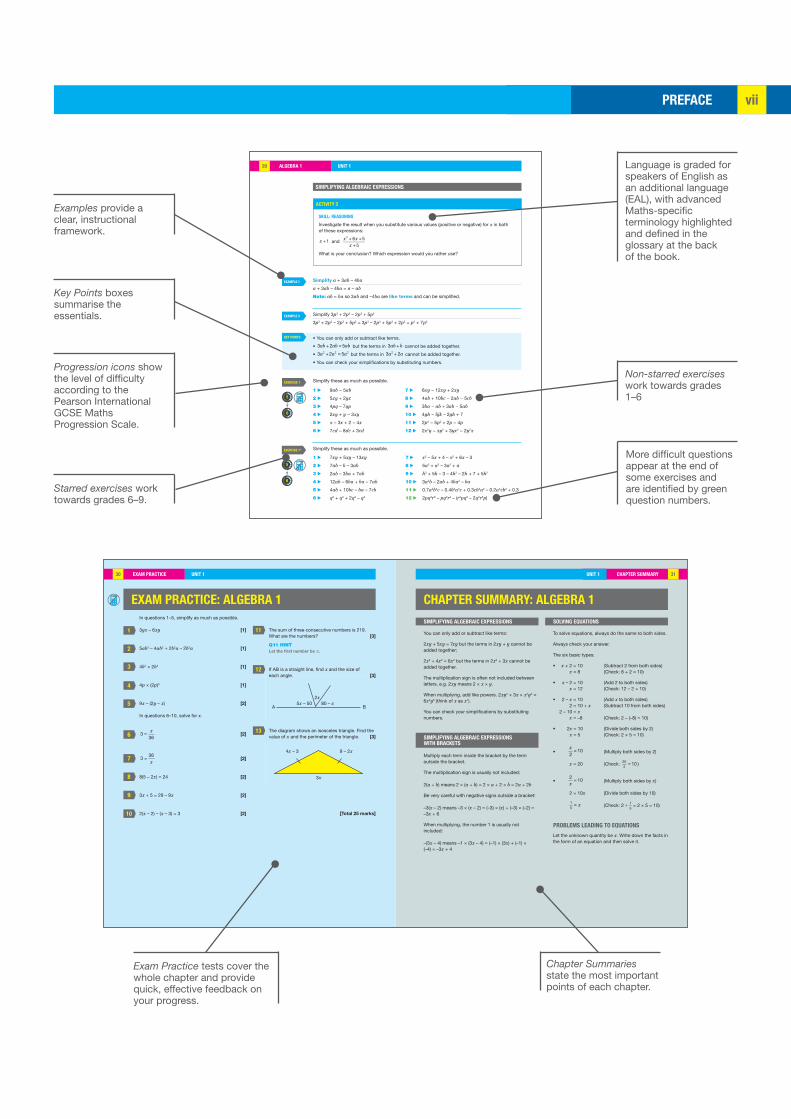
Activities are a gentle way of introducing a topic.
Transferable Skills are highlighted to show what skill you are using and where.
Basic Principles outline assumed knowledge and key concepts from the beginning.
Learning Objectives show what you will learn in each lesson.
Points of Interest put the maths you are about to learn in a real-world context.
ABOUT THIS BOOKThis two-book series is written for students following the Edexcel International GCSE (9-1) Maths A Higher Tier specification. There is a Student Book for each year of the course.
The course has been structured so that these two books can be used in order, both in the classroom and for independent learning.
Each book contains five units of work. Each unit contains five sections in the topic areas: Number, Algebra, Graphs, Shape and Space and Handling Data.
In each unit, there are concise explanations and worked examples, plus numerous exercises that will help you build up confidence.
Parallel exercises, non-starred and starred, are provided, to bring together basic principles before being challenged with more difficult questions. These are supported by parallel revision exercises at the end of each chapter.
Challenges, which provide questions applying the basic principles in unusual situations, feature at the back of the book along with Fact Finders which allow you to practise comprehension of real data.
PREFACE vii
EXAM PRACTICE UNIT 130
CHAPTER SUMMARYUNIT 1 31
1
2
3
4
5
6
7
8
9
10
11
12
13
2x5x – 50
A B80 – x
4x – 3
3x
9 – 2x
EXAM PRACTICE: ALGEBRA 1In questions 1–5, simplify as much as possible.
3yx – 6xy [1]
5ab3 – 4ab2 + 2b2a – 2b3a [1]
4b2 × 2b4 [1]
4p × (2p)3 [1]
9x – (2y – x) [2]
In questions 6–10, solve for x.
=336x
[2]
=36
3x
[2]
8(5 – 2x) = 24 [2]
3x + 5 = 29 – 9x [2]
2(x – 2) – (x – 3) = 3 [2]
The sum of three consecutive numbers is 219. What are the numbers? [3]
Q11 HINT Let the fi rst number be x.
If AB is a straight line, fi nd x and the size of each angle. [3]
The diagram shows an isosceles triangle. Find the value of x and the perimeter of the triangle. [3]
CHAPTER SUMMARY: ALGEBRA 1SIMPLIFYING ALGEBRAIC EXPRESSIONS
You can only add or subtract like terms:
2xy + 5xy = 7xy but the terms in 2xy + y cannot be added together;
2x2 + 4x2 = 6x2 but the terms in 2x2 + 3x cannot be added together.
The multiplication sign is often not included between letters, e.g. 2xy means 2 × x × y.
When multiplying, add like powers. 2xy2 × 3x × x2y3 = 6x4y5 (think of x as x1).
You can check your simplifications by substituting numbers.
SIMPLIFYING ALGEBRAIC EXPRESSIONS WITH BRACKETS
To solve equations, always do the same to both sides.
Always check your answer.
The six basic types:
• x + 2 = 10 (Subtract 2 from both sides) x = 8 (Check: 8 + 2 = 10)
• x – 2 = 10 (Add 2 to both sides) x = 12 (Check: 12 – 2 = 10)
• 2 – x = 10 (Add x to both sides) 2 = 10 + x (Subtract 10 from both sides) 2 – 10 = x x = –8 (Check: 2 – (–8) = 10)
• 2x = 10 (Divide both sides by 2) x = 5 (Check: 2 × 5 = 10)
• = 102x
(Multiply both sides by 2)
x = 20 (Check: =202
10 )
• =2
10x
(Multiply both sides by x)
2 = 10x (Divide both sides by 10)
=15
x (Check: 2 ÷ = 2 × 5 = 10)
Let the unknown quantity be x. Write down the facts in the form of an equation and then solve it.
SOLVING EQUATIONS
PROBLEMS LEADING TO EQUATIONS
Multiply each term inside the bracket by the term outside the bracket.
The multiplication sign is usually not included:
2(a + b) means 2 × (a + b) = 2 × a + 2 × b = 2a + 2b
Be very careful with negative signs outside a bracket:
–3(x – 2) means –3 × (x – 2) = (–3) × (x) + (–3) × (–2) = –3x + 6
When multiplying, the number 1 is usually not included:
–(3x – 4) means –1 × (3x – 4) = (–1) × (3x) + (–1) × (–4) = –3x + 4
[Total 25 marks]
ALGEBRA 1 UNIT 120
ACTIVITY 2
EXAMPLE 1
EXAMPLE 2
KEY POINTS
EXERCISE 1
EXERCISE 1*
5
6
5
6
SIMPLIFYING ALGEBRAIC EXPRESSIONS
SKILL: REASONING
Investigate the result when you substitute various values (positive or negative) for x in both of these expressions:
x +1 and x2 + 6x +5
x +5
What is your conclusion? Which expression would you rather use?
Simplify a + 3ab – 4ba
a + 3ab – 4ba = a – ab
Note: ab = ba so 3ab and –4ba are like terms and can be simplified.
Simplify 3p3 + 2p2 – 2p3 + 5p2
3p3 + 2p2 – 2p3 + 5p2 = 3p3 – 2p3 + 5p2 + 2p2 = p3 + 7p2
• You can only add or subtract like terms.
• 3ab + 2ab = 5ab but the terms in 3ab +b cannot be added together.
• 3a2 + 2a2 = 5a2 but the terms in 3a2 + 2a cannot be added together.
• You can check your simplifications by substituting numbers.
Simplify these as much as possible.
1 ▶ 9ab − 5ab
2 ▶ 5xy + 2yx
3 ▶ 4pq – 7qp
4 ▶ 2xy + y − 3xy
5 ▶ x − 3x + 2 − 4x
6 ▶ 7cd − 8dc + 3cd
7 ▶ 6xy − 12xy + 2xy
8 ▶ 4ab + 10bc − 2ab − 5cb
9 ▶ 3ba − ab + 3ab − 5ab
10 ▶ 4gh − 5jk – 2gh + 7
11 ▶ 2p2 − 5p2 + 2p − 4p
12 ▶ 2x2y − xy2 + 3yx2 − 2y2x
1 ▶ 7xy + 5xy – 13xy
2 ▶ 7ab – b – 3ab
3 ▶ 2ab – 3ba + 7ab
4 ▶ 12ab – 6ba + ba – 7ab
5 ▶ 4ab + 10bc – ba – 7cb
6 ▶ q2 + q3 + 2q2 – q3
Simplify these as much as possible.
7 ▶ x2 – 5x + 4 – x2 + 6x – 3
8 ▶ 5a2 + a3 – 3a2 + a
9 ▶ h3 + 5h – 3 – 4h2 – 2h + 7 + 5h2
10 ▶ 3a2b – 2ab + 4ba2 – ba
11 ▶ 0.7a2b3c – 0.4b2a3c + 0.3cb3a2 – 0.2a3cb2 + 0.3
12 ▶ 2pq2r5 – pq2r4 – (r4pq2 – 2q2r5p)
Language is graded for speakers of English as an additional language (EAL), with advanced Maths-specific terminology highlighted and defined in the glossary at the back of the book.
Non-starred exercises work towards grades 1–6
More difficult questions appear at the end of some exercises and are identified by green question numbers.
Examples provide a clear, instructional framework.
Key Points boxes summarise the essentials.
Progression icons show the level of difficulty according to the Pearson International GCSE Maths Progression Scale.
Starred exercises work towards grades 6–9.
Exam Practice tests cover the whole chapter and provide quick, effective feedback on your progress.
Chapter Summaries state the most important points of each chapter.
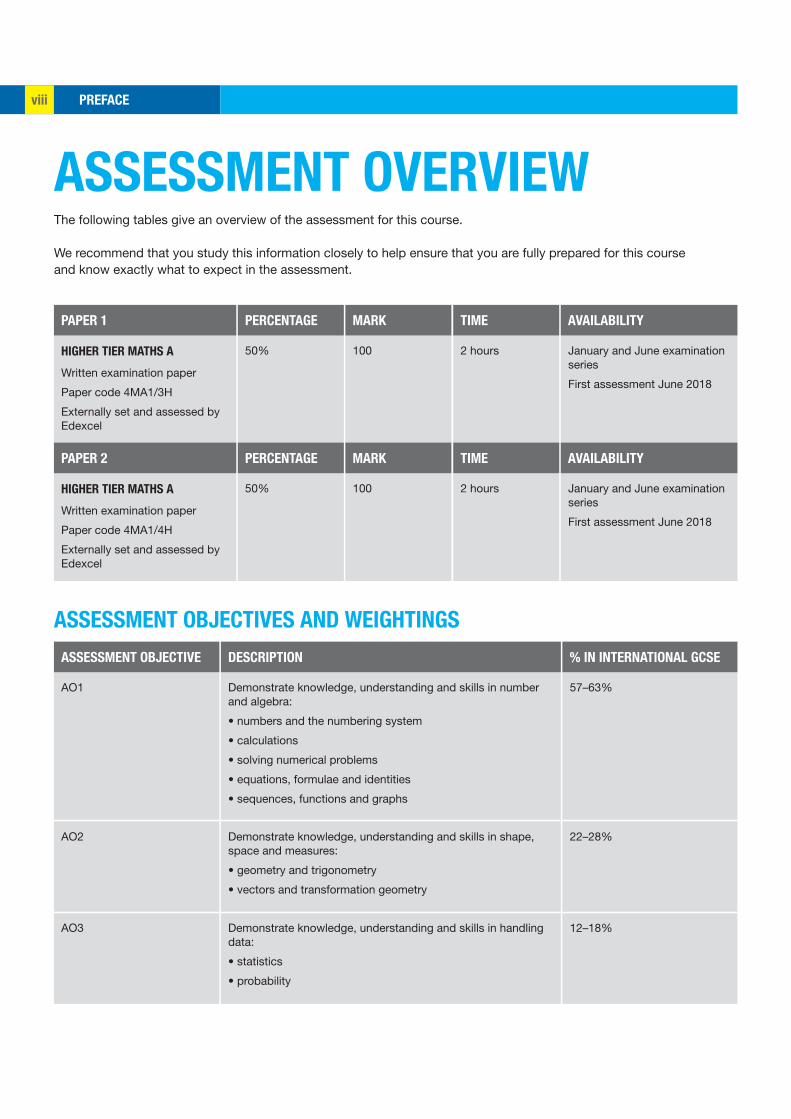
PREFACEviii
PAPER 1
PAPER 2
ASSESSMENT OBJECTIVE
PERCENTAGE
PERCENTAGE
DESCRIPTION
MARK
MARK
% IN INTERNATIONAL GCSE
50%
50%
100
100
AVAILABILITY
AVAILABILITY
January and June examination series
First assessment June 2018
January and June examination series
First assessment June 2018
TIME
TIME
2 hours
2 hours
HIGHER TIER MATHS A
Written examination paper
Paper code 4MA1/3H
Externally set and assessed by Edexcel
HIGHER TIER MATHS A
Written examination paper
Paper code 4MA1/4H
Externally set and assessed by Edexcel
Demonstrate knowledge, understanding and skills in number and algebra:
• numbers and the numbering system
• calculations
• solving numerical problems
• equations, formulae and identities
• sequences, functions and graphs
57–63%AO1
Demonstrate knowledge, understanding and skills in shape, space and measures:
• geometry and trigonometry
• vectors and transformation geometry
22–28%AO2
Demonstrate knowledge, understanding and skills in handling data:
• statistics
• probability
12–18%AO3
ASSESSMENT OBJECTIVES AND WEIGHTINGS
ASSESSMENT OVERVIEWThe following tables give an overview of the assessment for this course.
We recommend that you study this information closely to help ensure that you are fully prepared for this course and know exactly what to expect in the assessment.

PREFACE ix
ASSESSMENT SUMMARY
CALCULATORS
PROHIBITIONS
The Edexcel International GCSE in Mathematics (Specification A) Higher Tier requires students to demonstrate application and understanding of the following topics.
Students will be expected to have access to a suitable electronic calculator for both examination papers. The electronic calculator to be used by students attempting Higher Tier examination papers (3H and 4H) should have these functions as a minimum:
x x, , , , , ,2+ − × ÷ memory, brackets, x , x , x, ∑x, ∑ fx,1yy standard form, sine, cosine, tangent and their inverses.
Calculators with any of the following facilities are prohibited in all examinations:• databanks• retrieval of text or formulae• QWERTY keyboards• built-in symbolic algebra manipulations• symbolic differentiation or integration.
NUMBER
• Use numerical skills in a purely mathematical way and in real-life situations.
ALGEBRA
• Use letters as equivalent to numbers and as variables.• Understand the distinction between expressions,
equations and formulae.• Use algebra to set up and solve problems.• Demonstrate manipulative skills.• Construct and use graphs.
GEOMETRY
• Use the properties of angles.• Understand a range of transformations.• Work within the metric system.• Understand ideas of space and shape.• Use ruler, compasses and protractor appropriately.
STATISTICS
• Understand basic ideas of statistical averages.• Use a range of statistical techniques.• Use basic ideas of probability.
Students should also be able to demonstrate problem-
solving skills by translating problems in mathematical or non-mathematical contexts into a process or a series of mathematical processes.
Students should be able to demonstrate reasoning
skills by• making deductions and drawing conclusions from
mathematical information• constructing chains of reasoning• presenting arguments and proofs• interpreting and communicating information accurately.
UNIT 1 NUMBER 3 ALGEBRA 19 GRAPHS 32 SHAPE AND SPACE 50 HANDLING DATA 84
1 is not a prime number. Any number multiplied by 1 is itself. Computer systems use the binary system that contains only two numbers (1 and 0) which represent numbers and instructions. It is also the most likely first number to appear in a list of numerical data as first described by Benford’s Law.
NUMBER 1UNIT 1 3
LEARNING OBJECTIVES
BASIC PRINCIPLES
NUMBER 1
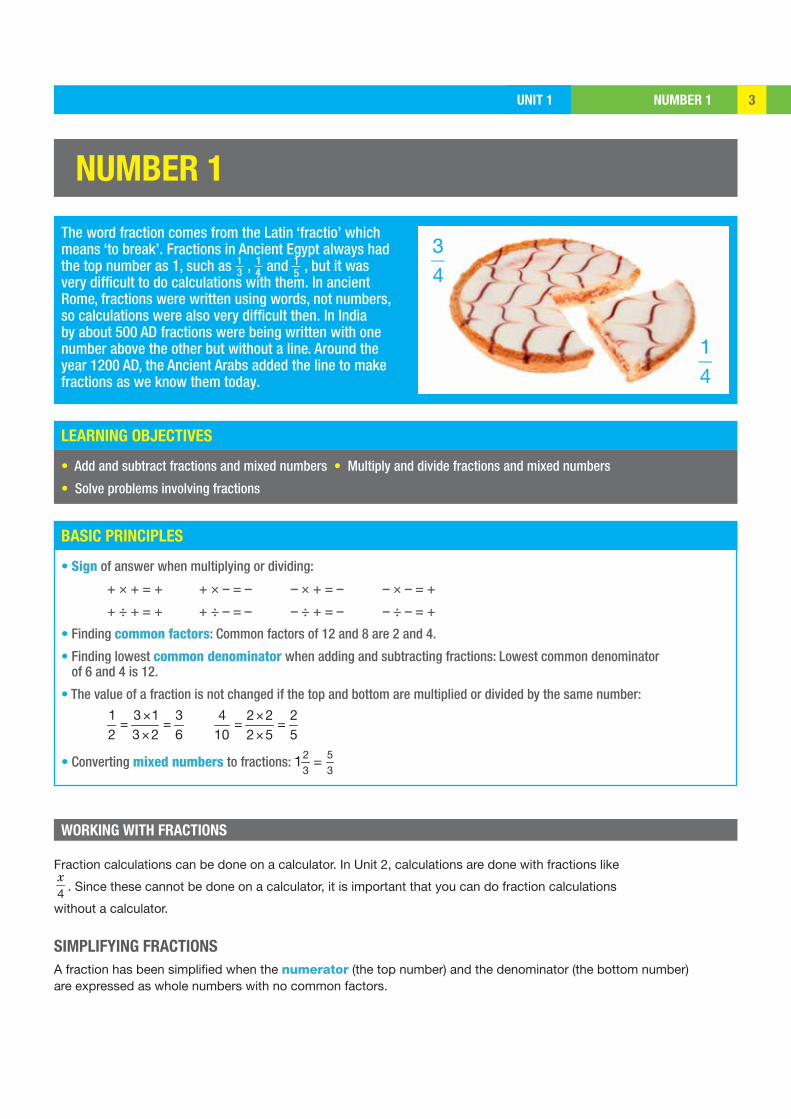
The word fraction comes from the Latin ‘fractio’ which means ‘to break’. Fractions in Ancient Egypt always had the top number as 1, such as , and , but it was very difficult to do calculations with them. In ancient Rome, fractions were written using words, not numbers, so calculations were also very difficult then. In India by about 500 AD fractions were being written with one number above the other but without a line. Around the year 1200 AD, the Ancient Arabs added the line to make fractions as we know them today.
• Add and subtract fractions and mixed numbers • Multiply and divide fractions and mixed numbers
• Solve problems involving fractions
WORKING WITH FRACTIONS
Fraction calculations can be done on a calculator. In Unit 2, calculations are done with fractions likex4 . Since these cannot be done on a calculator, it is important that you can do fraction calculations
without a calculator.
SIMPLIFYING FRACTIONS
A fraction has been simplified when the numerator (the top number) and the denominator (the bottom number) are expressed as whole numbers with no common factors.
• Sign of answer when multiplying or dividing:
+ × + = + + × – = – – × + = – – × – = +
+ ÷ + = + + ÷ – = – – ÷ + = – – ÷ – = +
• Finding common factors: Common factors of 12 and 8 are 2 and 4.
• Finding lowest common denominator when adding and subtracting fractions: Lowest common denominator of 6 and 4 is 12.
• The value of a fraction is not changed if the top and bottom are multiplied or divided by the same number:
×= =
×1 3 1 32 3 2 6
×= =
×4 2 2 2
10 2 5 5
• Converting mixed numbers to fractions: =2 53 3
1
NUMBER 1 UNIT 14
EXAMPLE 1
EXAMPLE 2
EXAMPLE 3
KEY POINTS
EXERCISE 1
3
SKILL: ANALYSIS
Simplify
a 2842
b 0.81.6
a 2842
=2 142 21
=2 73 7
=23
×× ×
× b
× ×= = = =
× ×0.8 0.8 10 8 8 1 11.6 1.6 10 16 8 2 2
Example 2 shows how to write decimals as fractions.
SKILL: ANALYSIS
Change a 0.4 b 0.025 to fractions.
a 0.4 =4
10=
25
b 0.025 =25
1000=
5 55 5 40
=1
40× ××
To write a fraction as a decimal, divide the top number by the bottom number.
SKILL: ANALYSIS
Change a 25 b
58 to decimals
a 2 ÷ 5 = 0.4 (using a calculator or long division)
b 5 ÷ 8 = 0.625 (using a calculator or long division)
• Always simplify fractions.
• When working with mixed numbers, convert to improper fractions first.
Simplify these.
1 ▶ 8
12
2 ▶ 1624
3 ▶ 1545
4 ▶ 5684
5 ▶ 0.61.2
6 ▶ 0.92.7
Copy and complete this table, giving fractions in their lowest terms.
FRACTION DECIMAL
45
38
0.75
0.2
7 ▶
8 ▶
9 ▶10 ▶
Change each of these to a mixed number.
11 ▶ 83 12 ▶ 13
4 13 ▶
175 14 ▶ 19
7
NUMBER 1UNIT 1 5
EXERCISE 1*
4
4
3
1 ▶ 621
2 ▶ 1421
3 ▶ 1590
4 ▶ 105165
5 ▶ 0.71.4
6 ▶ 1.23.2
Change each of these to an improper fraction.
15 ▶ 13
2 16 ▶ 35
3 17 ▶ 56
1 18 ▶ 67
5
19 ▶ Write 18 minutes as a fraction of an hour in its simplest form.
20 ▶ Craig buys a ring for $500. He sells it for $750. Write the selling price as a fraction of the cost price in its simplest form.
Simplify and write each of these as a single fraction.
Copy and complete this table, giving fractions in their lowest terms.
FRACTION DECIMAL
516
340
0.35
0.375
7 ▶
8 ▶
9 ▶10 ▶
Change each of these to a mixed number.
11 ▶ 133 12 ▶
115 13 ▶
237 14 ▶
194
Change each of these to an improper fraction.
15 ▶ 23
4 16 ▶ 37
6 17 ▶ 25
8 18 ▶ 89
20
19 ▶ Elliot scores 65 out of 80 in a Maths test. Write this as a fraction in its simplest form.
20 ▶ Rendell cycles 42 km at an average speed of 18 km/hr. Find the time taken, giving your answer as a fraction of an hour in its simplest form.
NUMBER 1 UNIT 16
EXAMPLE 4
EXAMPLE 5
ACTIVITY 1
MULTIPLYING FRACTIONS
If you do not know why one-half of one-third is the same as one-half multiplied by one-third, read the next example.
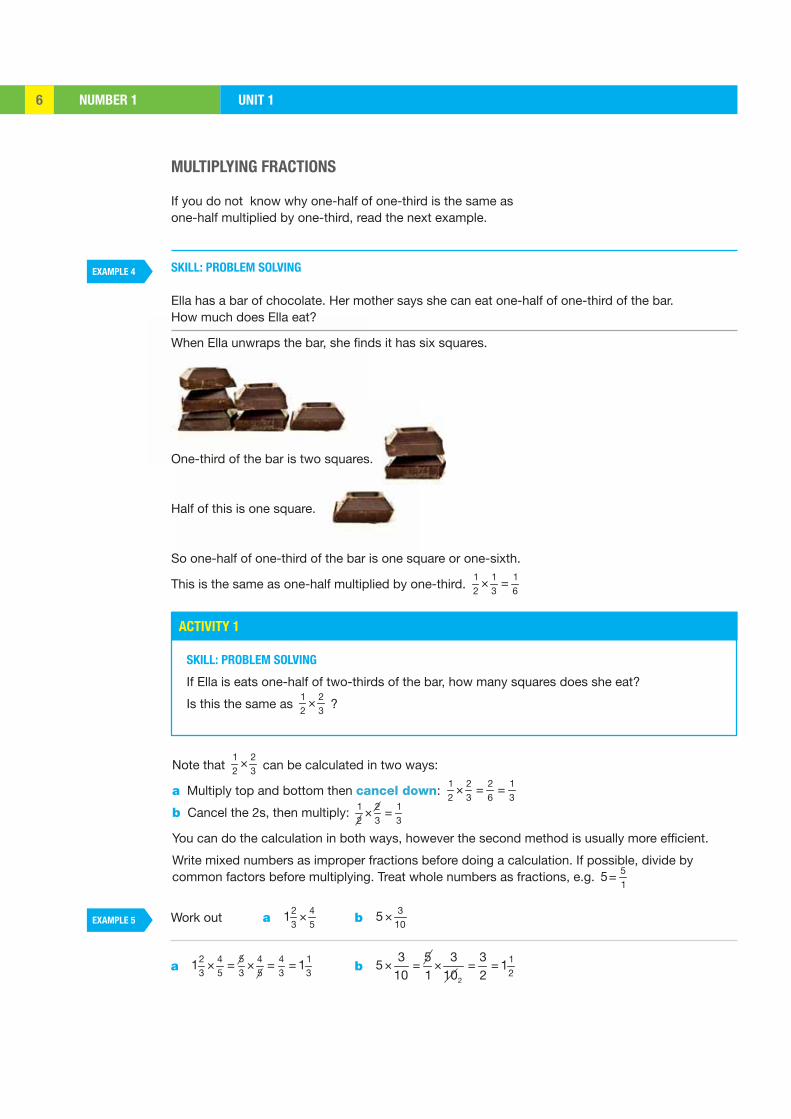
SKILL: PROBLEM SOLVING
Ella has a bar of chocolate. Her mother says she can eat one-half of one-third of the bar. How much does Ella eat?
When Ella unwraps the bar, she finds it has six squares.
One-third of the bar is two squares.
Half of this is one square.
So one-half of one-third of the bar is one square or one-sixth.
This is the same as one-half multiplied by one-third. × =1 12 3
16
SKILL: PROBLEM SOLVING
If Ella is eats one-half of two-thirds of the bar, how many squares does she eat?
Is this the same as ×1 22 3
?
Note that ×1 22 3 can be calculated in two ways:
a Multiply top and bottom then cancel down: × = =1 2 2 12 3 6 3
b Cancel the 2s, then multiply: × =1 2 12 3 3
You can do the calculation in both ways, however the second method is usually more efficient.
Write mixed numbers as improper fractions before doing a calculation. If possible, divide by common factors before multiplying. Treat whole numbers as fractions, e.g. = 5
15
Work out a ×2 43 5
1 b × 310
5
a × = × = =2 4 5 4 4 13 5 3 5 3 3
1 1 b × = × = =2
12
3 5 3 35 1
10 1 10 2
NUMBER 1UNIT 1 7
KEY POINTS
EXERCISE 2
EXERCISE 2*
6
6
7
7
8
• The word ‘of’ means ‘multiplied by’.
• Convert mixed numbers into improper fractions before multiplying.
• If possible, divide by common factors before multiplying.
• Treat whole numbers as fractions, e.g. = 51
5 .
Giving your answers as fractions in their lowest terms, work out
1 ▶ ×518
3 3 ▶ ×3 44 7
1 5 ▶ × 516
0.8 7 ▶ × ×2 3 55 7 6
2 ▶ ×4 35 8 4 ▶ ×1 1
3 21 1 6 ▶ ×8
90.75 8 ▶ × × ×3 5 5 3
7 6 9 151 1
9 ▶ Three-sevenths of the songs in Riley’s music library are rock songs. Of the rock songs, seven-ninths feature a guitar solo. What fraction of the songs in Riley’s music library are rock songs featuring a guitar solo?
10 ▶ Imogen was doing her music practice for one-quarter of an hour. For two-thirds of that time she was practising her scales. For what fraction of an hour did she practise her scales?
Giving your answers as fractions in their lowest terms or as mixed numbers where appropriate, work out
1 ▶ ×4 155 16 3 ▶ ×3 1
8 93 1 5 ▶ × × ×3 8 21 1
4 7 27 4 7 ▶ a2
bba
×
2 ▶ ×14 5
11 4 ▶ ×11441
8 4 6 ▶ × ×2 7 23 13 7
8 1 8 ▶ ba2
ba
a3
b2× ×
9 ▶ Lucas divides his pizza into three equal pieces for himself and his two friends. His friend Teddy eats 58
of his piece for lunch and a further 25
of what remains for dinner. What fraction of the original pizza did Teddy eat for dinner?
10 ▶ In a factory, two-thirds of the floor area is taken up by the production line. Out of the remaining floor area, three-fifths is taken up by office space. The rest is warehouse space. The warehouse space occupies 2000 m2. Work out the floor area of the production line.
NUMBER 1 UNIT 18
EXAMPLE 6
EXAMPLE 7
EXAMPLE 8
DIVIDING FRACTIONS
To divide by a fraction, turn the fraction upside down and multiply. The next two examples explain this rule. The word ‘reciprocal’ is used for turning a fraction upside down.
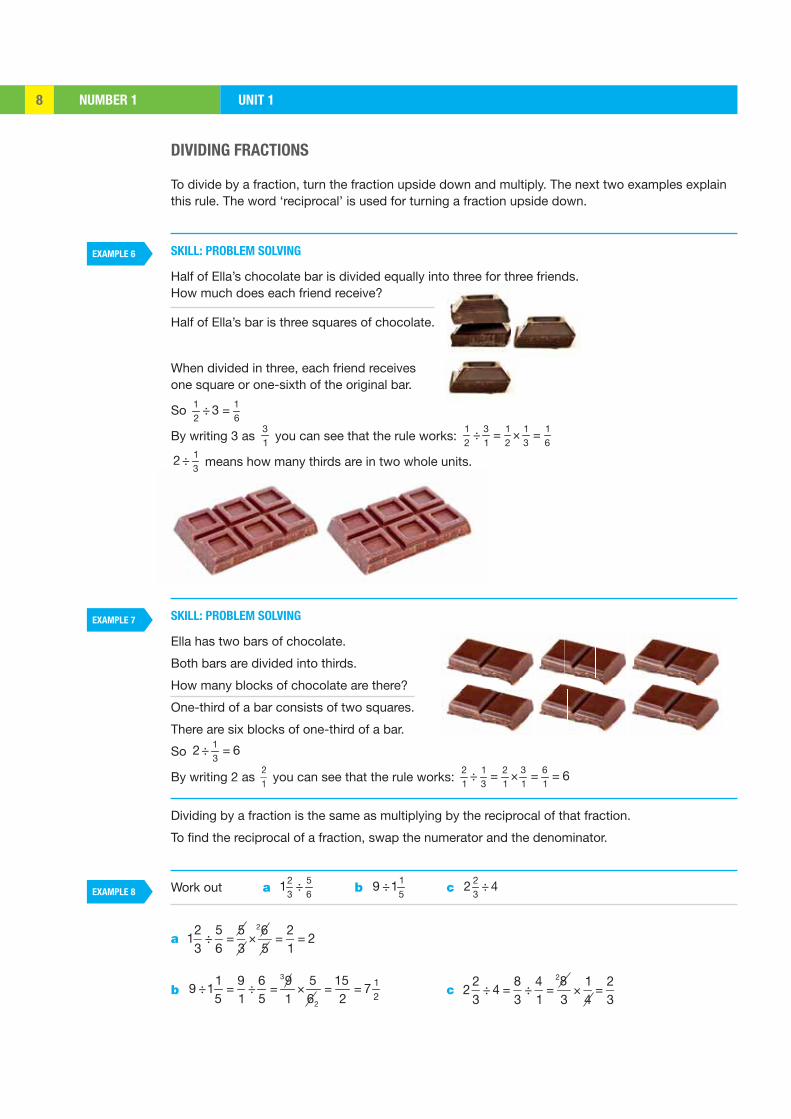
SKILL: PROBLEM SOLVING
Half of Ella’s chocolate bar is divided equally into three for three friends. How much does each friend receive?
Half of Ella’s bar is three squares of chocolate.
When divided in three, each friend receives one square or one-sixth of the original bar.
So ÷ =12 6
13
By writing 3 as 31
you can see that the rule works: ÷ = × =1 3 1 1 12 1 2 3 6
÷312 means how many thirds are in two whole units.
SKILL: PROBLEM SOLVING
Ella has two bars of chocolate.
Both bars are divided into thirds.
How many blocks of chocolate are there?
One-third of a bar consists of two squares.
There are six blocks of one-third of a bar.
So ÷ =13
2 6
By writing 2 as 21
you can see that the rule works: ÷ = × = =2 1 2 3 61 1 1 13
6
Dividing by a fraction is the same as multiplying by the reciprocal of that fraction.
To find the reciprocal of a fraction, swap the numerator and the denominator.
Work out a ÷2 53 6
1 b ÷ 15
9 1 c ÷23
2 4
a 123
÷56
=53
62
5=
21
= 2×
b ÷ = ÷ = × = =3
2
12
1 9 6 9 5 159 1 7
5 1 5 1 6 2 c 2
23
÷ 4 =83
÷41
=82
314
=23
×
NUMBER 1UNIT 1 9
EXAMPLE 9
KEY POINT
EXERCISE 3
EXERCISE 3*
7
8
7
8
• To divide by a fraction, turn the fraction upside down and multiply.
Giving your answers as fractions in their lowest terms or as mixed numbers where appropriate, work out
1 ▶ ÷3 74 8 3 ▶ ÷12
254 5 ▶ ÷ 1
36 1 7 ▶ ÷1 2
3 51 2
2 ▶ ÷3 410 5 4 ▶ ÷ 3
49 6 ▶ ÷4
51 6 8 ▶ ÷1 1
2 42 2
9 ▶ Mia cuts up a piece of wood 12
4 m long into pieces measuring
34
m long. How many pieces are there?
10 ▶ A bottle contains 412 litres of water.
How many glasses of volume 316
litre can it fill?
Giving your answers as fractions in their lowest terms or as mixed numbers where appropriate, work out
1 ▶ ÷2 2043 21 3 ▶ ÷ 2
716 5 ▶ ÷1 4
3 52 2 7 ▶ ÷
41 12
13 2
2 ▶ ÷8 615 5
4 ▶ ÷19
3 14 6 ▶ ÷3 17 7
3 2 8 ▶ 1 ÷3 67 35
9 ▶ A roll of ribbon is 12
32 cm long. How many pieces 411 cm long can be cut from the roll?
10 ▶ Dylan’s cow produces 13
21 litres of milk per day. The milk is put into bottles with a volume of
312
litres. How many bottles does Dylan need each week to bottle all the milk?
ADDING AND SUBTRACTING FRACTIONS
This can only be done if the denominators are the same.
SKILL: PROBLEM SOLVING
Ella eats one-half of her bar of chocolate and then eats a further third. What fraction of the bar has she eaten?
Half the bar is 3 squares.
One-third of the bar is 2 squares.
One-half plus one-third equals five-sixths or + = + =1 1 3 2 52 6 63 6
NUMBER 1 UNIT 110
EXAMPLE 10
EXAMPLE 11
EXAMPLE 12
KEY POINTS
EXERCISE 4
EXERCISE 4*
7
7
6
6
Work out +3 14 6
++ = + = =3 1 9 2 9 2 114 12 12 126 12
Work out −3 24 5
−− = − = =3 2 15 8 15 8 74 5 20 20 20 20
Work out −1 33 4
3 1
−− = − = − = = =1 3 10 7 40 21 40 21 19 74 3 4 12 12 13 2 12 12
3 1 1
• To add or subtract fractions, put them over a common denominator.
• Less work is needed if the common denominator is the lowest one.
1 ▶ +2 47 7
2 ▶ −4 19 9
3 ▶ −5 16 3
4 ▶ −11 320 10
5 ▶ +3 78 12
6 ▶ −5 36 4
7 ▶ +1 14 6
3 1
8 ▶ −3 15 2
4 2
9 ▶ +5 36 4
2 1
10 ▶ +7 18 4
3 4
11 ▶ −3 1110 20
5 2
12 ▶ −3 78 12
36 32
1 ▶ +1 53 12
2 ▶ +1 94 20
3 ▶ −5 76 30
4 ▶ −11 315 20
5 ▶ + +1 3 95 10 20
6 ▶ + −1 3 14 20 40
7 ▶ +1 12 6
4 3
8 ▶ +2 15 3
6 7
9 ▶ −2 13 6
7 1
10 ▶ −7 19 3
4 3
11 ▶ −2 83 9
7
12 ▶ −1 712 10
6 4
Giving your answers as fractions in their lowest terms or as mixed numbers where appropriate, work out
Giving your answers as fractions in their lowest terms or as mixed numbers where appropriate, work out
13 ▶ Li does one-quarter of her homework before dinner and a further one-third after dinner. What fraction of her homework remains undone?
14 ▶ A chemical consists of four compounds, A, B, C and D. 1
6 is A, 2
5 is B,
110
is C and the rest is D. What fraction of the chemical is D?
NUMBER 1UNIT 1 11
EXAMPLE 13
KEY POINT
ORDER OF OPERATIONS
13 ▶ Tonia and Trinny are twins. Their friends give them identical cakes for their birthday. Tonia eats 1
8 of her cake and Trinny eats
16
of her cake. How much cake is left?
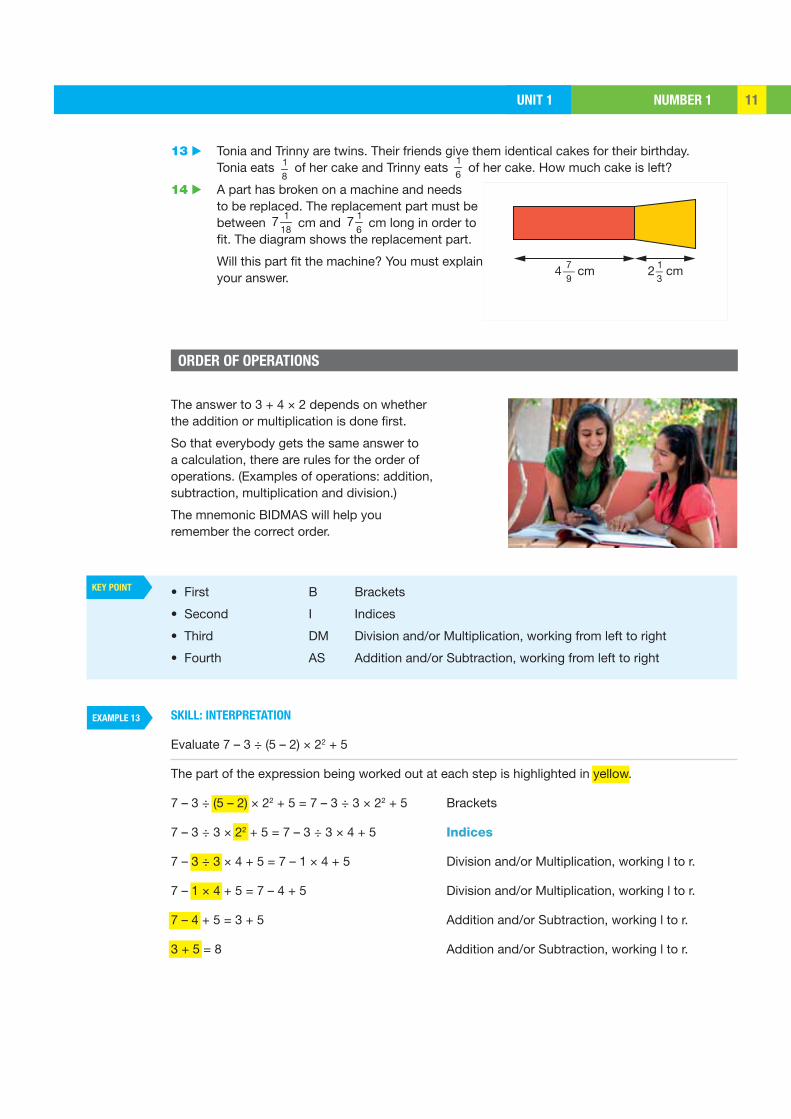
14 ▶ A part has broken on a machine and needs to be replaced. The replacement part must be between
81
17 cm and
617 cm long in order to
fit. The diagram shows the replacement part.
Will this part fit the machine? You must explain your answer.
The answer to 3 + 4 × 2 depends on whether the addition or multiplication is done first.
So that everybody gets the same answer to a calculation, there are rules for the order of operations. (Examples of operations: addition, subtraction, multiplication and division.)
The mnemonic BIDMAS will help you remember the correct order.
• First B Brackets
• Second I Indices
• Third DM Division and/or Multiplication, working from left to right
• Fourth AS Addition and/or Subtraction, working from left to right
SKILL: INTERPRETATION
Evaluate 7 – 3 ÷ (5 – 2) × 22 + 5
The part of the expression being worked out at each step is highlighted in yellow.
7 – 3 ÷ (5 – 2) × 22 + 5 = 7 – 3 ÷ 3 × 22 + 5 Brackets
7 – 3 ÷ 3 × 22 + 5 = 7 – 3 ÷ 3 × 4 + 5 Indices
7 – 3 ÷ 3 × 4 + 5 = 7 – 1 × 4 + 5 Division and/or Multiplication, working l to r.
7 – 1 × 4 + 5 = 7 – 4 + 5 Division and/or Multiplication, working l to r.
7 – 4 + 5 = 3 + 5 Addition and/or Subtraction, working l to r.
3 + 5 = 8 Addition and/or Subtraction, working l to r.
NUMBER 1 UNIT 112
ACTIVITY 2
EXAMPLE 14
EXERCISE 5
EXERCISE 5*
3
4
4
6
SKILL: INTERPRETATION
Without using your calculator, work out 2 + 3 × 4 and 3 × 4 + 2.
Check that your calculator gives the correct answer of 14 to 2 + 3 × 4 and to 3 × 4 + 2.
Use your calculator to check that 7 – 3 ÷ (5 – 2) × 22 + 5 = 8 (as in Example 13).
The line in a fraction acts like brackets. 1+ 2
3 means
1+ 2( )3
SKILL: INTERPRETATION
Work out 16 4 36 ÷ 3 2
××
The part of the expression being worked out at each step is highlighted in yellow.
16 4 36 ÷ 3 2
××
means 16 4 3( )6 ÷ 3 2( )
=16 12( )2 2( )
=44
= 1×× ×
Work out the following.
1 ▶ 12 + 4 × 2
2 ▶ (12 + 4) × 2
3 ▶ 11 – 32
Evaluate the following.
1 ▶ 4 + 6 × (22 + 5) ÷ 3 – 10
2 ▶ 2 – 5 ÷ (8 – 3) × 2 + 8
3 ▶ 125 ÷ (7 × 4 – 23)2 ÷ 5
4 ▶ ÷ × ÷3 9 4 24 10 5 3
5 ▶ 1 + 10 ÷ 5 × 11 – 32 ÷ 3
6 ▶ (3 × 4 ÷ 22 + 3) × (6 ÷ 3 × 5 – 5 × 2 +1) – 5
7 ▶ 1+ 4 26 1 2
÷12 ÷ 22
8 ÷ 2 2×× ×
4 ▶ 12 – 22 × 3
5 ▶ (8 – 3 × 2)2
6 ▶ 5 + (5 × 2)2 ÷ 5
7 ▶ 3 + 2 ÷ (7 – 9) × (5 × 2 – 6)
8 ▶ 4 + 42
6 ÷ 3 2×
9 ▶ Insert brackets in this expression to make it correct: 4 × 5 – 3 + 2 = 10
10 ▶ Insert brackets and symbols into this expression to make it correct: 7 5 3 = 6
8 ▶
23
14
+34
÷9
10
1+535
67
÷37
×
×
9 ▶ Insert brackets in this expression to make it correct: 8 – 2 + 1 × 5 – 3 = 2
10 ▶ Insert brackets and symbols in this expression to make it correct: 8 6 2 4 = 5
NUMBER 1UNIT 1 13
EXAMPLE 15
EXAMPLE 16
EXAMPLE 17
SIGNIFICANT FIGURES AND DECIMAL PLACES
If a piece of wood is to be cut 35.784 mm long then this measurement is too accurate to mark out and cut, so 35.784 would be rounded to a suitable degree of accuracy. Numbers can be rounded to a certain number of significant figures or decimal places.
SIGNIFICANT FIGURES (s.f.)
The first s.f. is the first non-zero digit in the number, counting from the left.
SKILL: INTERPRETATION
Highlight the first s.f. of the following numbers.
a 27 400 b 0.123 c 0.000 583
The first s.f. is highlighted in yellow.
a 27 400 b 0.123 c 0.000 583
For example, when rounding to 2 s.f., look at the third s.f. If this is greater than or equal to 5 then round the second figure up. If rounding to 3 s.f., look at the fourth s.f. and so on.
SKILL: INTERPRETATION
Write a 1361 b 1350 c 1349 correct to 2 s.f.
a 3rd s.f. is 6. 6 ≥ 5 so 3 rounds up to 4 ⇒ 1361 = 1400 (2 s.f.) (1361 is closer to 1400 than 1300)
b 3rd s.f. is 5. 5 ≥ 5 so 3 rounds up to 4 ⇒ 1350 = 1400 (2 s.f.) (1350 is midway between 1400 and 1300 but we round up in this case)
c 3rd s.f. is 4. 4 < 5 so 3 is not rounded up ⇒ 1349 = 1300 (2 s.f.) (1349 is closer to 1300 than 1400)
SKILL: INTERPRETATION
Write a 0.001 361 b 0.001 35 c 0.001 349 correct to 2 s.f.
a 3rd s.f. is 6. 6 ≥ 5 so 3 rounds up to 4 ⇒ 0.001 361 = 0.0014 (2 s.f.) (0.001 361 is closer to 0.0014 than 0.0013)
b 3rd s.f. is 5. 5 ≥ 5 so 3 rounds up to 4 ⇒ 0.001 35 = 0.0014 (2 s.f.) (0.001 35 is midway between 0.0014 and 0.0013 but we round up in this case)
c 3rd s.f. is 4. 4 < 5 so 3 is not rounded up ⇒ 0.001 349 = 0.0013 (2 s.f.) (0.001 349 is closer to 0.0013 than 0.0014)
DECIMAL PLACES (d.p.)
Count after the decimal point (going from left to right). Rounding up or down follows the same rules as for s.f.
NUMBER 1 UNIT 114
EXAMPLE 18
ACTIVITY 3
KEY POINTS
EXERCISE 6
3
4
SKILL: INTERPRETATION
Write a 7.1361 b 0.135 c 0.0349 correct to 2 d.p.
a 3rd d.p. is 6. 6 ≥ 5 so 3 rounds up to 4 ⇒ 7.1361 = 7.14 (2 d.p.) (7.1361 is closer to 7.14 than 7.13)
b 3rd d.p. is 5. 5 ≥ 5 so 3 rounds up to 4 ⇒ 0.135 = 0.14 (2 d.p.) (0.135 is midway between 0.14 and 0.13 but we round up in this case)
c 3rd d.p. is 4. 4 < 5 so 3 is not rounded up ⇒ 0.0349 = 0.03 (2 d.p.) (0.0349 is closer to 0.03 than 0.04)
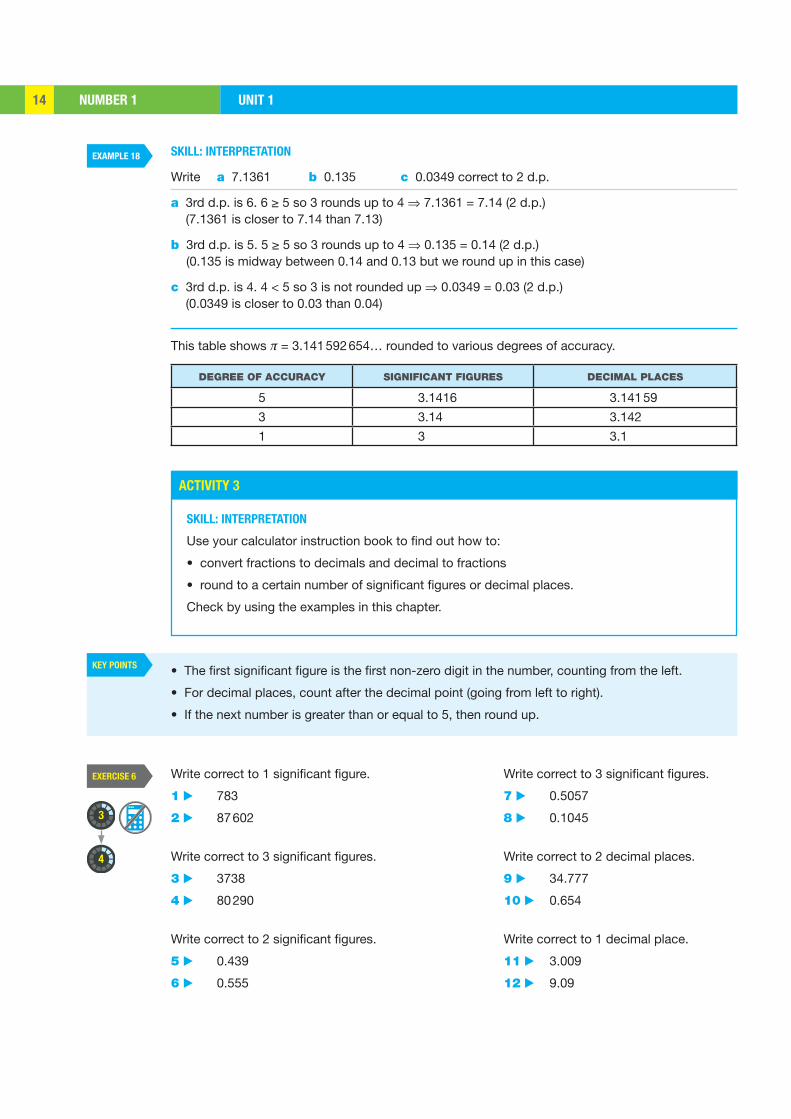
This table shows π = 3.141 592 654… rounded to various degrees of accuracy.
DEGREE OF ACCURACY SIGNIFICANT FIGURES DECIMAL PLACES
5 3.1416 3.141 59
3 3.14 3.142
1 3 3.1
SKILL: INTERPRETATION
Use your calculator instruction book to find out how to:
• convert fractions to decimals and decimal to fractions
• round to a certain number of significant figures or decimal places.
Check by using the examples in this chapter.
• The first significant figure is the first non-zero digit in the number, counting from the left.
• For decimal places, count after the decimal point (going from left to right).
• If the next number is greater than or equal to 5, then round up.
Write correct to 1 significant figure.
1 ▶ 783
2 ▶ 87 602
Write correct to 3 significant figures.
3 ▶ 3738
4 ▶ 80 290
Write correct to 2 significant figures.
5 ▶ 0.439
6 ▶ 0.555
Write correct to 3 significant figures.
7 ▶ 0.5057
8 ▶ 0.1045
Write correct to 2 decimal places.
9 ▶ 34.777
10 ▶ 0.654
Write correct to 1 decimal place.
11 ▶ 3.009
12 ▶ 9.09
NUMBER 1UNIT 1 15
EXERCISE 6*
EXERCISE 7
3
4
3
8
13 ▶ The speed of light is 299 792 458 m/s. Write this speed correct to a 3 s.f. b 6 s.f.
14 ▶ The diameter of a human hair is given as 0.0185 mm. Write this diameter correct to a 2 d.p. b 2 s.f.
15 ▶ Pablo Picasso’s ‘Women of Algiers’ sold at auction in New York for $179 365 000. Write this price correct to 4 s.f.
16 ▶ The distance round the equator is 40 075 km. Write this distance correct to 1 s.f.
Write correct to 1 significant figure.
1 ▶ 10.49
2 ▶ 5049
Write correct to 3 significant figures.
3 ▶ 45.703
4 ▶ 89 508
Write correct to 2 significant figures.
5 ▶ 0.0688
6 ▶ 0.006 78
Write correct to 3 significant figures.
7 ▶ 0.049 549
8 ▶ 0.000 567 9
Write correct to 2 decimal places.
9 ▶ 8.997
10 ▶ 2.0765
Write correct to 1 decimal place.
11 ▶ 6.96
12 ▶ 78.1818
13 ▶ Write 0.000 497 5 correct to a 3 d.p. b 3 s.f.
14 ▶ Write 2 correct to a 6 d.p. b 6 s.f.
15 ▶ Only 10 bottles of a very exclusive and expensive perfume are made. They are sold for the price of $12 721.89 per ounce. Write this price correct to a 1 s.f b 1 d.p.
16 ▶ The Bohr radius is a physical constant of value 0.000 000 052 917 721 092 mm. Write the Bohr radius correct to a 7 d.p. b 7 s.f.
REVISION
Give all answers, where appropriate, as fractions in their lowest terms.
1 ▶ Simplify a 1218
b 1.218
2 ▶ Calculate a ×1 36 26
2 b ÷1 35 5
3 1
3 ▶ Calculate a +2 15 4
2 b − +3 9 14 10 5
2 1 1
4 ▶ Calculate a 10 – 3 × 2 b 6 – 3 ÷ 3 × 4 c 8 ÷ (3 – 1)2 × 2
5 ▶ Insert brackets in this expression to make it correct: 12 ÷ 4 + 2 + 3 = 5
6 ▶ Insert brackets and symbols in this expression to make it correct: 3 5 2 = 4

NUMBER 1 UNIT 116
EXERCISE 7*
3
8
7 ▶ Write 12.000 497 5 correct to a 5 d.p. b 5 s.f
8 ▶ The age of the Earth is 4.543 billion years. Write 4.543 correct to a 1 d.p. b 1 s.f.
9 ▶ Geela has 20 litres of yoghurt that she wants to put into pots containing 14
1 litres each. How many pots can she fill?
10 ▶ Gill wears a device that counts the number of steps she takes every day. One day she did one-fifteenth of her steps before breakfast, a further half walking into town and another one-tenth walking round the supermarket.
a What fraction of her steps were not taken yet?
b That day the device recorded 12 000 steps. How many steps were not taken yet?
REVISION
Give all answers, where appropriate, as fractions in their lowest terms.
1 ▶ Simplify a 2163
b 0.2163
2 ▶ Calculate a ÷14 215 5
1 b ÷1 123 13
5 4
3 ▶ Calculate a − 134 5
2 1 b 118
11112
156
4 ▶ Calculate a 25 ÷ (1 + 22)2 × 2
b 5 + 12 ÷ 6 × 2 – 18 ÷ 32 c 2 + 2 2
16 3 4÷
27 ÷ 32
8 ÷ 2 2×× ×
5 ▶ Insert brackets in this expression to make it correct: 2 × 3 + 3 ÷ 3 = 3
6 ▶ Insert brackets and symbols in this expression to make it correct: 7 2 2 3 = 6
7 ▶ Write 8.999 49 correct to a 3 d.p. b 3 s.f.
8 ▶ An important number in mathematics is Euler’s number, e = 2.718 281 828 459 0… Write Euler’s number correct to a 8 s.f b 8 d.p.
9 ▶ Holly drinks 45
2 litres of water each day. The water comes in
25
1 litre bottles. How many bottles does Holly drink in a week?
10 ▶ Jake’s computer has two hard drives that can store the same amount of data. One drive is 3
8 full while the other is 2
5 full.
a What fraction of the total amount of storage space is empty?
b Each hard drive can store 750 gigabytes of data. Jake wants to download 150 gigabytes of data. Does he have enough space? Explain your answer.
EXAM PRACTICEUNIT 1 1717
1
2
3
4
5
6
7
EXAM PRACTICE: NUMBER 1
Give all answers where appropriate as fractions or mixed numbers in their lowest terms.
Simplify a 1442
b 14042 c
1.442
[3]
Calculate a ×512 5
11
1 b ÷1 74 8
5 [4]
Calculate + −4 19 4
312
1 1 [3]
Calculate a 3 + 2 × (1 + 4)2 b + ÷1
212
56 [4]
A recent survey has found that the Great Wall of China is more than twice as long as was previously thought. Its length is now given as 21 196.18 km.
Write this lengtha correct to 1 d.p. b correct to 1 s.f. [2]
The planning rules for a housing development
state that 13 of the houses should have three
bedrooms, 38
should have four bedrooms, 1
24
should be executive homes and the rest should
have two bedrooms.
a What fraction of the houses have two bedrooms?
b If 24 houses have two bedrooms, how many houses are on the development? [5]
Olivia’s fish tank contains 23
42 litres of water. She is emptying it out using a scoop which holds
311 litres of water. How many full scoops will it
take to empty the tank? [4]
[Total 25 marks]
CHAPTER SUMMARY UNIT 118
CHAPTER SUMMARY: NUMBER 1
WORKING WITH FRACTIONS
Always simplify fractions to their lowest terms: ××
= =4 2 2 26 2 3 3
·
The word ‘of’ means the same as ‘multiplied by’: 12
of 13 = × =1
213
16
Convert mixed numbers into improper fractions: =14 4
92
Treat whole numbers as fractions, e.g. = 51
5
To divide by a fraction, turn the fraction upside down and multiply: ÷ = × =1 1 1 2 23 13 2 3
To add or subtract fractions, put them over a common denominator: −− = =1 1 3 2
4 1261
12
• First B Brackets
• Second I Indices
• Third DM Division and/or Multiplication, working from left to right
• Fourth AS Addition and/or Subtraction, working from left to right
The part of the expression being worked out at each step is highlighted in yellow. 5 + (2 + 1)2 × 4 = 5 + 32 × 4 Brackets
5 + 32 × 4 = 5 + 9 × 4 Indices
5 + 9 × 4 = 5 + 36 Division and/or Multiplication
5 + 36 = 41 Addition and/or Subtraction
Note that calculators use the correct order of operations.
ORDER OF OPERATIONS (BIDMAS)
SIGNIFICANT FIGURES AND DECIMAL PLACES
The first significant figure is the first non-zero digit in the number, counting from the left.
The first s.f. is highlighted in yellow.
a 3400 b 0.367 c 0.008 45 For decimal places, count after the decimal point (going from left to right).
The third d.p. is highlighted in yellow.
a 12.3456 b 0.000 73
For example, when rounding to 2 s.f., look at the third s.f. If this is greater than or equal to 5 then round the second figure up. If rounding to 3 s.f., look at the fourth s.f. and so on.
2499 = 2000 (1 s.f.), 2499 = 2500 (2 s.f.), 0.2499 = 0.2 (1 d.p.), 0.2499 = 0.25 (2 d.p.)
ALGEBRA 1UNIT 1 19
LEARNING OBJECTIVES
BASIC PRINCIPLES
ACTIVITY 1
ALGEBRA 1
Algebra may have begun in Egypt. The ancient Egyptians used the word ‘aha’, meaning ‘heap’, to stand for an unknown number. In the same way, we use a letter, such as x, today. The Ahmes Papyrus from Ancient Egypt around 1650BC contains problems that need a form of algebra to solve. They are believed to have been set as exercises for young mathematicians. These mathematical skills were probably essential for building the pyramids.
• Simplify algebraic expressions • Expand brackets • Solve equations in which the unknown appears on both sides
• Algebra uses letters, often x, to stand for numbers.
• Algebraic expressions can be treated in the same way as number expressions.
• x + 3 means add three to the unknown number.
• 3x means 3 times the unknown number.
• x2 means square the unknown number.
SKILL: PROBLEM SOLVING
Think of a number. Add 7 and then double the answer. Subtract 10, halve the result, and then subtract the original number.
Algebra can show you why the answer is always 2.
Think of a number: xAdd 7: x + 7Double the result: 2x + 14Subtract 10: 2x + 4Halve the result: x + 2Subtract the original number: 2
Make two magic number tricks of your own, one like the example above and another that is longer. Check that they work using algebra. Then test them on a friend.
• Think of a number. Double it, add 12, halve the result, and then subtract the original number. Use algebra to find the answer. If you add a number other than 12, the answer will change. Work out the connection between
the number you add and the answer.
ALGEBRA 1 UNIT 120
ACTIVITY 2
EXAMPLE 1
EXAMPLE 2
KEY POINTS
EXERCISE 1
EXERCISE 1*
5
6
5
6
SIMPLIFYING ALGEBRAIC EXPRESSIONS
SKILL: REASONING
Investigate the result when you substitute various values (positive or negative) for x in both of these expressions:
x +1 and x2 + 6x +5
x +5
What is your conclusion? Which expression would you rather use?
Simplify a + 3ab – 4ba
a + 3ab – 4ba = a – ab
Note: ab = ba so 3ab and –4ba are like terms and can be simplified.
Simplify 3p3 + 2p2 – 2p3 + 5p2
3p3 + 2p2 – 2p3 + 5p2 = 3p3 – 2p3 + 5p2 + 2p2 = p3 + 7p2
• You can only add or subtract like terms.
• 3ab + 2ab = 5ab but the terms in 3ab +b cannot be added together.
• 3a2 + 2a2 = 5a2 but the terms in 3a2 + 2a cannot be added together.
• You can check your simplifications by substituting numbers.
Simplify these as much as possible.
1 ▶ 9ab − 5ab
2 ▶ 5xy + 2yx
3 ▶ 4pq – 7qp
4 ▶ 2xy + y − 3xy
5 ▶ x − 3x + 2 − 4x
6 ▶ 7cd − 8dc + 3cd
7 ▶ 6xy − 12xy + 2xy
8 ▶ 4ab + 10bc − 2ab − 5cb
9 ▶ 3ba − ab + 3ab − 5ab
10 ▶ 4gh − 5jk – 2gh + 7
11 ▶ 2p2 − 5p2 + 2p − 4p
12 ▶ 2x2y − xy2 + 3yx2 − 2y2x
1 ▶ 7xy + 5xy – 13xy
2 ▶ 7ab – b – 3ab
3 ▶ 2ab – 3ba + 7ab
4 ▶ 12ab – 6ba + ba – 7ab
5 ▶ 4ab + 10bc – ba – 7cb
6 ▶ q2 + q3 + 2q2 – q3
Simplify these as much as possible.
7 ▶ x2 – 5x + 4 – x2 + 6x – 3
8 ▶ 5a2 + a3 – 3a2 + a
9 ▶ h3 + 5h – 3 – 4h2 – 2h + 7 + 5h2
10 ▶ 3a2b – 2ab + 4ba2 – ba
11 ▶ 0.7a2b3c – 0.4b2a3c + 0.3cb3a2 – 0.2a3cb2 + 0.3
12 ▶ 2pq2r5 – pq2r4 – (r4pq2 – 2q2r5p)
ALGEBRA 1UNIT 1 21
EXAMPLE 5
EXAMPLE 3
EXAMPLE 4
EXERCISE 2
EXERCISE 2*
KEY POINTS
5
6
7
9
A2
3 x
B
SIMPLIFYING ALGEBRAIC EXPRESSIONS WITH BRACKETS
1 ▶ 3 × 2a
2 ▶ 2x × x
3 ▶ 3x × x2
4 ▶ 5a3 × 3a2
5 ▶ 2t × 3s
6 ▶ 4r × s2
7 ▶ 2a2 × b2
8 ▶ 2y × 2y × y
9 ▶ 2x2 × 3 × 2x
10 ▶ (2a)2 × 5a
1 ▶ 8a × a2
2 ▶ 5x3 × 3y2 × x
3 ▶ a2 × 2a4 × 3a
4 ▶ (3y)2 × 2y
5 ▶ 6xy2 × 2x3 × 3xy
6 ▶ 5abc × 2ab2c3 × 3ac
7 ▶ 7x × 2y2 × (2y)2
8 ▶ 2xy2 × 3x2y + 4x3y3
9 ▶ x2y3 × 3xy – 2x3y2
10 ▶ (2ab)2 × 5a2b4 – 2a2b5 × 3a2b
Simplify these.
Simplify these.
Simplify 4r × 5t
4r × 5t = 20rt
Simplify (3b)2 × 3b
(3b)2 × 3b = 3b × 3b × 3b = 27b3
• The multiplication sign is often not included between letters, e.g. 3ab means 3 a b× × .
• When multiplying, add like powers 3a2b 2a5b4 a = 6a8b5× × (think of a as a1 ).
EXPANDING BRACKETS
To simplify an expression with brackets, first multiply each term inside the bracket by the term outside the bracket, then simplify. This is called expanding the brackets.
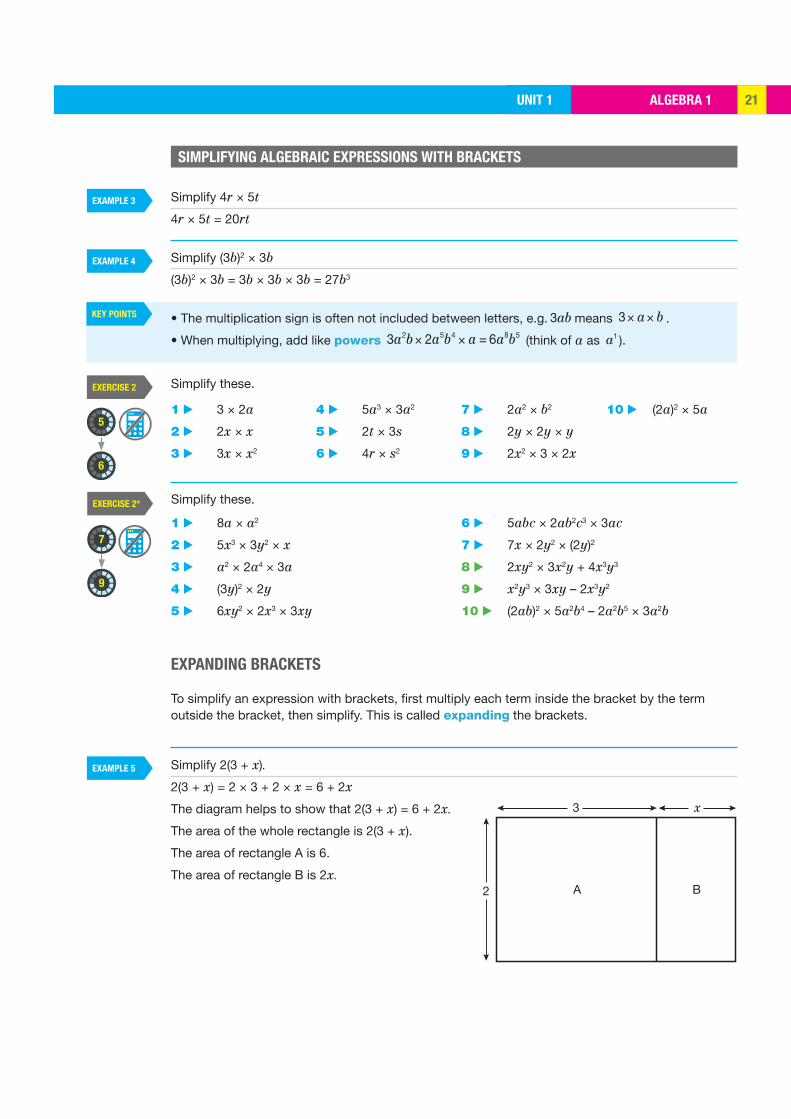
Simplify 2(3 + x).
2(3 + x) = 2 × 3 + 2 × x = 6 + 2x
The diagram helps to show that 2(3 + x) = 6 + 2x.
The area of the whole rectangle is 2(3 + x).
The area of rectangle A is 6.
The area of rectangle B is 2x.
ALGEBRA 1 UNIT 122
KEY POINTS
EXERCISE 3
EXERCISE 3*
EXAMPLE 6
EXAMPLE 7
6
7
6
7
• Multiply each term inside the bracket by the term outside the bracket.
• The multiplication sign is usually left out: 3(x + y) means 3 × (x + y) = 3 × x + 3 × y = 3x + 3y
• Be very careful with negative signs outside a bracket: –2(a – 3) means –2 × (a – 3) = (–2) × (a) + (–2) × ( –3) = –2a + 6
• When multiplying, the number 1 is usually left out: –(2x + 3) means –1 × (2x + 3) = (–1) × (2x) + (–1) × (3) = –2x – 3
1 ▶ 5(2 + 3a)
2 ▶ 2(b – 4c)
3 ▶ –3(2a + 8)
4 ▶ –4(3 – x)
5 ▶ –(a – 2b)
6 ▶ 3a + 2(a + 2b)
7 ▶ 3(t – 4) – 6
8 ▶ 7x – (x – y)
9 ▶ 0.4(x – 3y) + 0.5(2x + 3y)
10 ▶ 1.1(a + 3) – 5(3 – 0.2a)
1 ▶ 4(3m – 2)
2 ▶ 2(x – y + z)
3 ▶ 5(3a + b – 4c)
4 ▶ − +12
(4 6 8)x y
5 ▶ 5x – 3(2x – y)
Remove the brackets and simplify these if possible.
Remove the brackets and simplify these if possible.
6 ▶ 0.4(2 – x) – (x + 3)
7 ▶ − − −3 34 5
(4 8 ) (15 5 )x y x y
8 ▶ 5x – 7y – 0.4(x – 2y + z)
9 ▶ 0.3(2a – 6b + 1) – 0.4(3a + 6b – 1)
10 ▶ 0.3x(0.2x – y) – 4y(x + 0.3y) + 0.5x(y – x)
SOLVING EQUATIONS
If is often easier to solve mathematical problems using algebra. Let the unknown quantity be x and then write down the facts in the form of an equation. There are six basic types of equation:
x + 3 = 12 x 3 = 12 3 x = 12
3x = 12
x3
= 12
3x
= 12
Solving an equation means having only x on one side of the equation.
Solve x + 3 = 12 for x.
x + 3 = 12 (Subtract 3 from both sides)
x = 9 (Check: 9 + 3 = 12)
Solve x – 3 = 12 for x.
x – 3 = 12 (Add 3 to both sides)
x = 15 (Check: 15 – 3 = 12)
ALGEBRA 1UNIT 1 23
EXAMPLE 8
EXAMPLE 9
EXAMPLE 10
EXAMPLE 11
EXAMPLE 12
KEY POINTS
EXERCISE 4
EXERCISE 4*
3
3
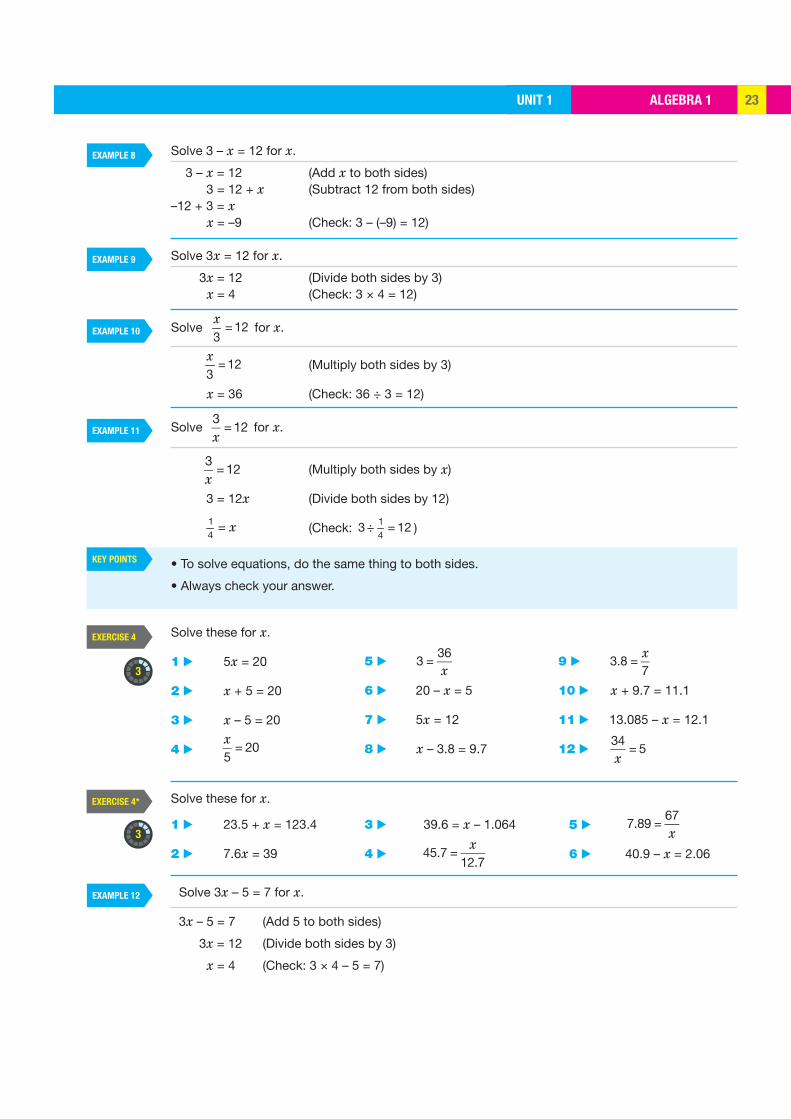
Solve 3 – x = 12 for x.
3 – x = 12 (Add x to both sides) 3 = 12 + x (Subtract 12 from both sides)–12 + 3 = x x = –9 (Check: 3 – (–9) = 12)
Solve 3x = 12 for x.
3x = 12 (Divide both sides by 3) x = 4 (Check: 3 × 4 = 12)
Solve = 123x
for x.
= 12
3x
(Multiply both sides by 3)
x = 36 (Check: 36 ÷ 3 = 12)
Solve 3x
= 12 for x.
3x
= 12 (Multiply both sides by x)
3 = 12x (Divide both sides by 12)
=14
x (Check: ÷ =14
3 12 )
• To solve equations, do the same thing to both sides.
• Always check your answer.
Solve these for x.
1 ▶ 5x = 20
2 ▶ x + 5 = 20
3 ▶ x – 5 = 20
4 ▶ x5
= 20
5 ▶ 3 =
36x
6 ▶ 20 – x = 5
7 ▶ 5x = 12
8 ▶ x – 3.8 = 9.7
9 ▶ 3.8 =x7
10 ▶ x + 9.7 = 11.1
11 ▶ 13.085 – x = 12.1
12 ▶
34x
= 5
Solve these for x.
1 ▶ 23.5 + x = 123.4
2 ▶ 7.6x = 39
3 ▶ 39.6 = x – 1.064
4 ▶ 45.7 =x
12.7
5 ▶ 7.89 =67x
6 ▶ 40.9 – x = 2.06
Solve 3x – 5 = 7 for x.
3x – 5 = 7 (Add 5 to both sides)
3x = 12 (Divide both sides by 3)
x = 4 (Check: 3 × 4 – 5 = 7)
ALGEBRA 1 UNIT 124
EXAMPLE 14
EXERCISE 5
EXERCISE 5*
5
5
6
6
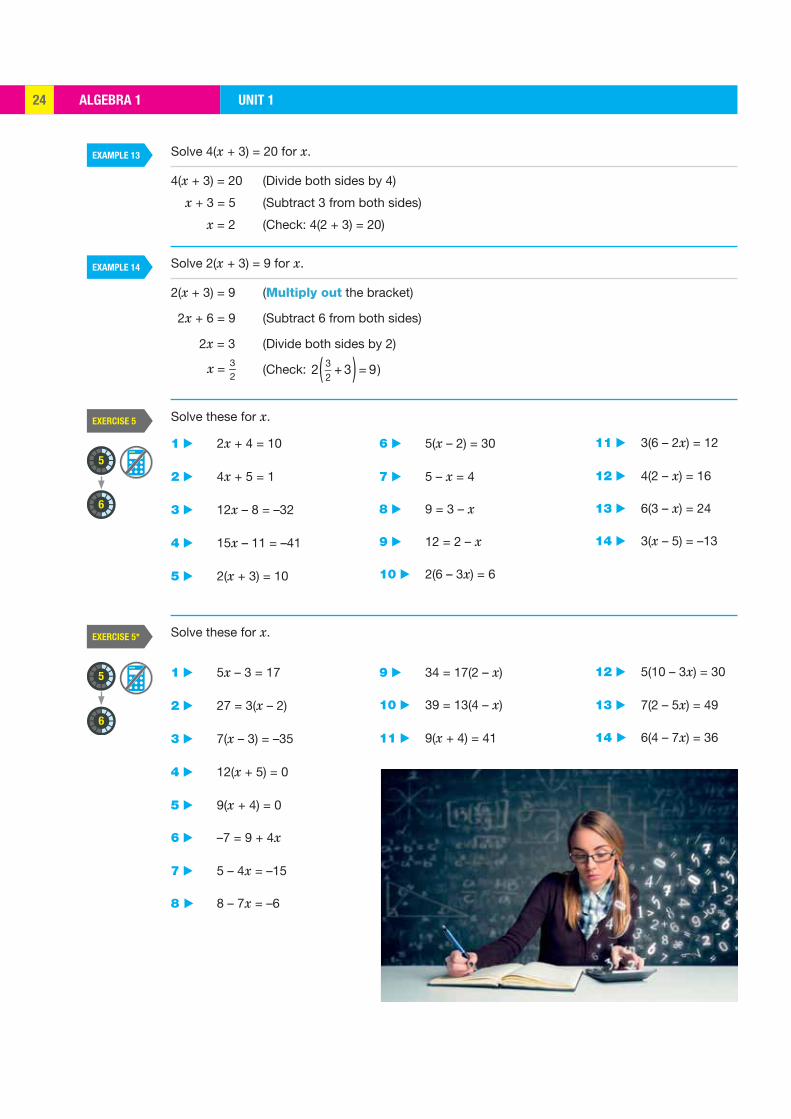
EXAMPLE 13 Solve 4(x + 3) = 20 for x.
4(x + 3) = 20 (Divide both sides by 4)
x + 3 = 5 (Subtract 3 from both sides)
x = 2 (Check: 4(2 + 3) = 20)
Solve 2(x + 3) = 9 for x.
2(x + 3) = 9 (Multiply out the bracket)
2x + 6 = 9 (Subtract 6 from both sides)
2x = 3 (Divide both sides by 2)
= 32
x (Check: 2 32
+ 3( ) = 9)
1 ▶ 2x + 4 = 10
2 ▶ 4x + 5 = 1
3 ▶ 12x – 8 = –32
4 ▶ 15x – 11 = –41
5 ▶ 2(x + 3) = 10
1 ▶ 5x – 3 = 17
2 ▶ 27 = 3(x – 2)
3 ▶ 7(x – 3) = –35
4 ▶ 12(x + 5) = 0
5 ▶ 9(x + 4) = 0
6 ▶ –7 = 9 + 4x
7 ▶ 5 – 4x = –15
8 ▶ 8 – 7x = –6
Solve these for x.
Solve these for x.
6 ▶ 5(x – 2) = 30
7 ▶ 5 – x = 4
8 ▶ 9 = 3 – x
9 ▶ 12 = 2 – x
10 ▶ 2(6 – 3x) = 6
11 ▶ 3(6 – 2x) = 12
12 ▶ 4(2 – x) = 16
13 ▶ 6(3 – x) = 24
14 ▶ 3(x – 5) = –13
9 ▶ 34 = 17(2 – x)
10 ▶ 39 = 13(4 – x)
11 ▶ 9(x + 4) = 41
12 ▶ 5(10 – 3x) = 30
13 ▶ 7(2 – 5x) = 49
14 ▶ 6(4 – 7x) = 36
ALGEBRA 1UNIT 1 25
EXAMPLE 15
EXAMPLE 16
EXAMPLE 17
EXERCISE 6
EXERCISE 6*
6
7
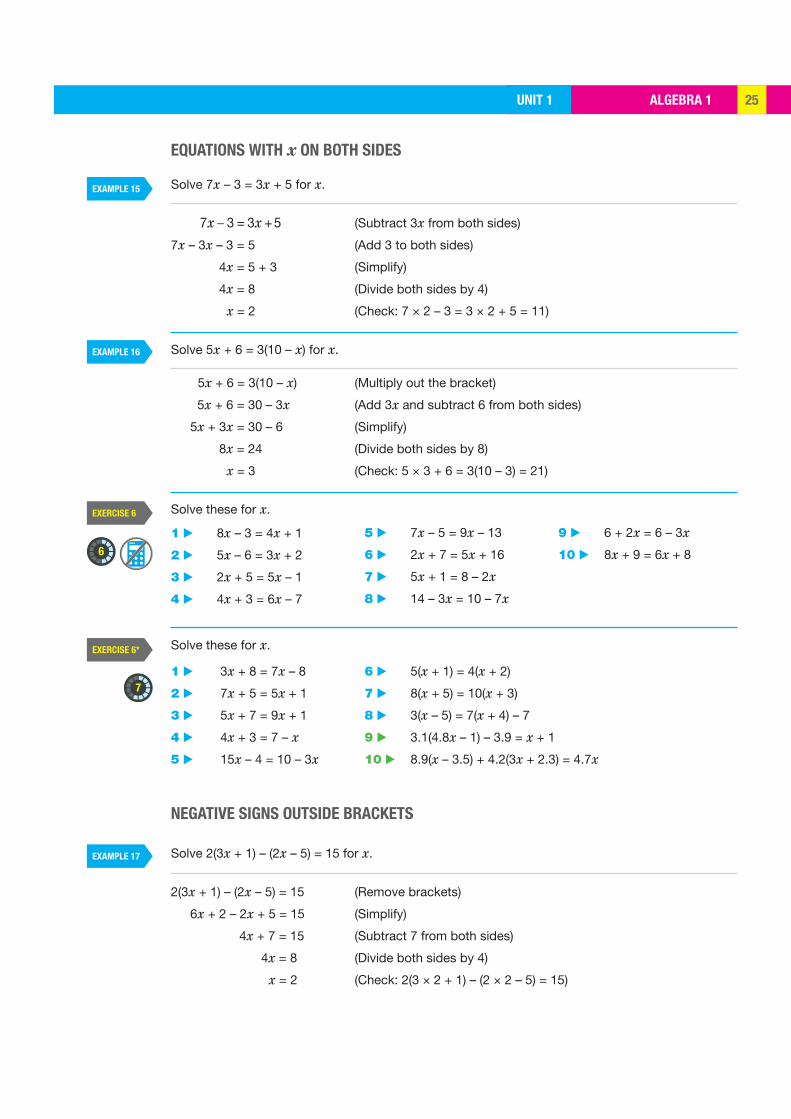
EQUATIONS WITH x ON BOTH SIDES
Solve 7x – 3 = 3x + 5 for x.
7x 3 = 3x +5 (Subtract 3x from both sides)
7x – 3x – 3 = 5 (Add 3 to both sides)
4x = 5 + 3 (Simplify)
4x = 8 (Divide both sides by 4)
x = 2 (Check: 7 × 2 – 3 = 3 × 2 + 5 = 11)
Solve 5x + 6 = 3(10 – x) for x.
5x + 6 = 3(10 – x) (Multiply out the bracket)
5x + 6 = 30 – 3x (Add 3x and subtract 6 from both sides)
5x + 3x = 30 – 6 (Simplify)
8x = 24 (Divide both sides by 8)
x = 3 (Check: 5 × 3 + 6 = 3(10 – 3) = 21)
Solve these for x.
1 ▶ 8x – 3 = 4x + 1
2 ▶ 5x – 6 = 3x + 2
3 ▶ 2x + 5 = 5x – 1
4 ▶ 4x + 3 = 6x – 7
5 ▶ 7x – 5 = 9x – 13
6 ▶ 2x + 7 = 5x + 16
7 ▶ 5x + 1 = 8 – 2x
8 ▶ 14 – 3x = 10 – 7x
9 ▶ 6 + 2x = 6 – 3x
10 ▶ 8x + 9 = 6x + 8
1 ▶ 3x + 8 = 7x – 8
2 ▶ 7x + 5 = 5x + 1
3 ▶ 5x + 7 = 9x + 1
4 ▶ 4x + 3 = 7 – x
5 ▶ 15x – 4 = 10 – 3x
6 ▶ 5(x + 1) = 4(x + 2)
7 ▶ 8(x + 5) = 10(x + 3)
8 ▶ 3(x – 5) = 7(x + 4) – 7
9 ▶ 3.1(4.8x – 1) – 3.9 = x + 1
10 ▶ 8.9(x – 3.5) + 4.2(3x + 2.3) = 4.7x
NEGATIVE SIGNS OUTSIDE BRACKETS
Solve 2(3x + 1) – (2x – 5) = 15 for x.
2(3x + 1) – (2x – 5) = 15 (Remove brackets)
6x + 2 – 2x + 5 = 15 (Simplify)
4x + 7 = 15 (Subtract 7 from both sides)
4x = 8 (Divide both sides by 4)
x = 2 (Check: 2(3 × 2 + 1) – (2 × 2 – 5) = 15)
Solve these for x.

ALGEBRA 1 UNIT 126
EXERCISE 7
EXERCISE 7*
EXAMPLE 18
EXAMPLE 19
8
8
KEY POINT
4x + 2 7x – 4
3x
Solve these for x.
1 ▶ 3(x – 2) – 2(x + 1) = 5
2 ▶ 4(x – 1) – 3(x + 2) = 26
3 ▶ 3(2x + 1) – 2(2x – 1) = 11
4 ▶ 9(x – 2) – 3(2x – 3) = 12
5 ▶ 2(5x – 7) – 6(2x – 3) = 0
6 ▶ 3(3x + 2) – 4(3x – 3) = 0
7 ▶ 4(3x – 1) – (x – 2) = 42
8 ▶ 2(2x – 1) – (x + 5) = 5
9 ▶ 4(3 – 5x) – 7(5 – 4x) + 3 = 0
10 ▶ 5(3x – 2) – 9(2 + 4x) – 7 = 0
Solve these for x.
1 ▶ 5(x – 3) – 4(x + 1) = –11
2 ▶ 9(x – 2) – 7(x + 1) = –15
3 ▶ 4(3x + 5) – 5(2x + 6) = 0
4 ▶ 3(5x – 4) – 3(2x – 1) = 0
5 ▶ 3(3x + 1) – 8(2x – 3) + 1 = 0
6 ▶ 5(6x + 2) – 7(3x – 5) – 72 = 0
7 ▶ –2(x + 3) – 6(2x – 4) + 108 = 0
8 ▶ –3(x – 2) – 5(3x – 2) + 74 = 0
9 ▶ 7(5x – 3) – 10 = 2(3x – 5) – 3(5 – 7x)
10 ▶ 4(7 + 3x) – 5(6 – 7x) + 1 = 8(1 + 4x)
PROBLEMS LEADING TO EQUATIONS
Let the unknown quantity be x. Write down the facts in the form of an equation and then solve it.
The sum of three consecutive numbers is 219. What are the numbers?
Let the first number be x. Then the next two numbers are (x + 1) and (x + 2).
x + (x + 1) + (x + 2) = 219
3x + 3 = 219
3x = 216
x = 72
So the three numbers are 72, 73 and 74. (Check: 72 + 73 + 74 = 219)
SKILL: REASONING
Find the value of x and the perimeter of this isosceles triangle.
As the triangle is isosceles
4x + 2 = 7x – 4
2 + 4 = 7x – 4x
6 = 3x
x = 2
Check: 4 × 2 + 2 = 7 × 2 – 4 = 10
The sides are 10, 10 and 6 so the perimeter is 26.
• (2x 5) means 1 (2x 5) = ( 1) (2x) + ( 1) ( 5) = 2x + 5× × ×
ALGEBRA 1UNIT 1 27
EXERCISE 8
EXERCISE 8*
7
8
7
8
6x + 20
80 – 2x4x
4x – 2
4x + 5
x + 4
Tea Coffee HotChocolate
Cost: (x – 10) c (x + 20) cx c
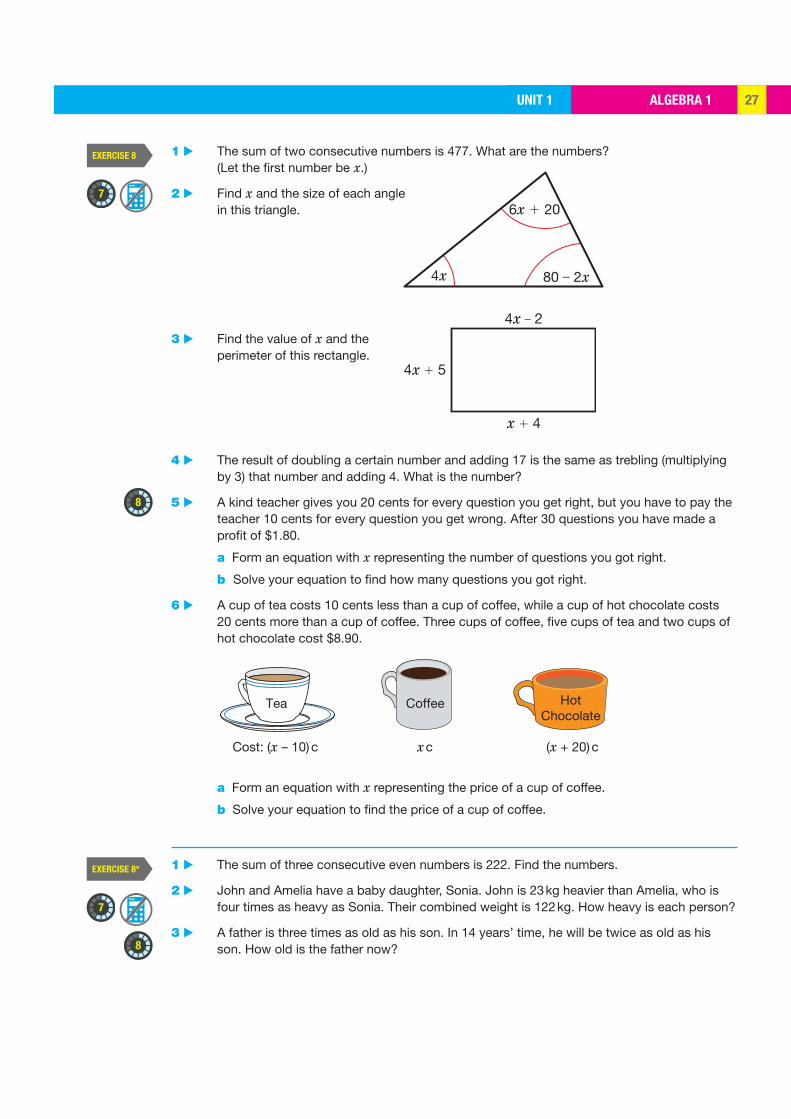
1 ▶ The sum of two consecutive numbers is 477. What are the numbers? (Let the first number be x.)
2 ▶ Find x and the size of each angle in this triangle.
3 ▶ Find the value of x and the perimeter of this rectangle.
4 ▶ The result of doubling a certain number and adding 17 is the same as trebling (multiplying by 3) that number and adding 4. What is the number?
5 ▶ A kind teacher gives you 20 cents for every question you get right, but you have to pay the teacher 10 cents for every question you get wrong. After 30 questions you have made a profit of $1.80.
a Form an equation with x representing the number of questions you got right.
b Solve your equation to find how many questions you got right.
6 ▶ A cup of tea costs 10 cents less than a cup of coffee, while a cup of hot chocolate costs 20 cents more than a cup of coffee. Three cups of coffee, five cups of tea and two cups of hot chocolate cost $8.90. a Form an equation with x representing the price of a cup of coffee.
b Solve your equation to find the price of a cup of coffee.
1 ▶ The sum of three consecutive even numbers is 222. Find the numbers.
2 ▶ John and Amelia have a baby daughter, Sonia. John is 23 kg heavier than Amelia, who is four times as heavy as Sonia. Their combined weight is 122 kg. How heavy is each person?
3 ▶ A father is three times as old as his son. In 14 years’ time, he will be twice as old as his son. How old is the father now?
ALGEBRA 1 UNIT 128
EXERCISE 9
8
5
7
x + 6
x
4 ▶ Lakshmi is trying to throw basketballs through hoops at a fair. If a ball goes through a hoop, she receives 50p, but if it does not she has to pay 20p for the shot. After 15 shots, Lakshmi finds she has made a profit of £1.20. How many times did Lakshmi successfully throw a ball through a hoop?
5 ▶ Aidan is doing a multiple-choice test with 20 questions. He scores 3 marks for a correct answer and loses 1 mark if the answer is incorrect. Aidan answers all the questions and scores 40 marks. How many questions has he answered correctly?
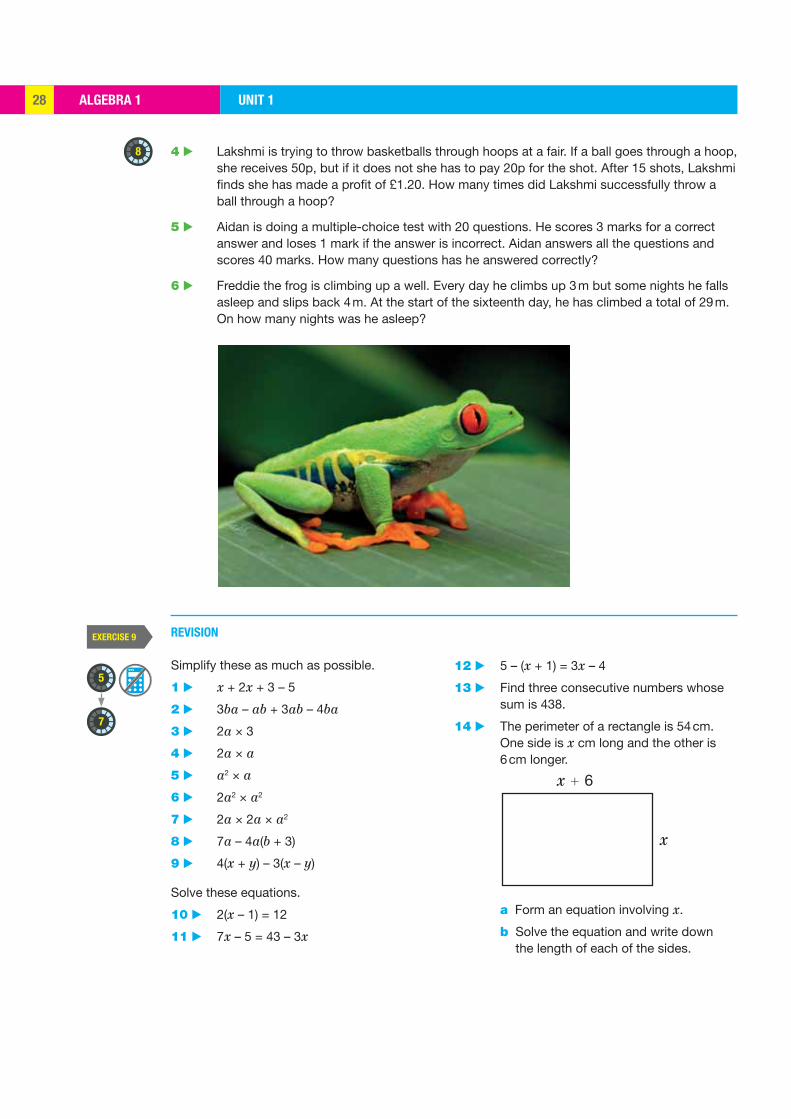
6 ▶ Freddie the frog is climbing up a well. Every day he climbs up 3 m but some nights he falls asleep and slips back 4 m. At the start of the sixteenth day, he has climbed a total of 29 m. On how many nights was he asleep?
Simplify these as much as possible.
1 ▶ x + 2x + 3 – 5
2 ▶ 3ba – ab + 3ab – 4ba
3 ▶ 2a × 3
4 ▶ 2a × a
5 ▶ a2 × a
6 ▶ 2a2 × a2
7 ▶ 2a × 2a × a2
8 ▶ 7a – 4a(b + 3)
9 ▶ 4(x + y) – 3(x – y)
Solve these equations.
10 ▶ 2(x – 1) = 12
11 ▶ 7x – 5 = 43 – 3x
12 ▶ 5 – (x + 1) = 3x – 4
13 ▶ Find three consecutive numbers whose sum is 438.
14 ▶ The perimeter of a rectangle is 54 cm. One side is x cm long and the other is 6 cm longer.
a Form an equation involving x.
b Solve the equation and write down the length of each of the sides.
REVISION
ALGEBRA 1UNIT 1 29
EXERCISE 9*
4
9
REVISION
Simplify these as much as possible.
1 ▶ 6xy2 – 3x2y – 2y2x 3 ▶ p – (p – (p – (p – 1)))
2 ▶ 2xy2 × x2y 4 ▶ xy(x2 + xy + y2) – x2(y2 – xy – x2)
Solve these equations.
5 ▶ 4 =x5
7 ▶ 43 – 2x = 7 – 8x
6 ▶ 4 =5x
8 ▶ 1.3 – 0.3x = 0.2x + 0.3
9 ▶ 0.6(x + 1) + 0.2(6 – x) = x – 0.6
10 ▶ The length of a conference room is one and a half times its width. There is a carpet in the centre of the room. The length of the carpet is twice its width. This leaves a 3 m wide border around the edges of the carpet. Find the area of the carpet.
11 ▶ Two years ago, my age was four times the age of my son. Eight years ago, my age was ten times the age of my son. Find the age of my son now.
12 ▶ A river flows at 2 m/s. Juan’s boat can travel twice as fast down the river as it can go up the river. How fast can the boat go in still water?
13 ▶ Matt wants to buy a television. If he pays cash, he gets a discount of 7%. If he pays with a loan he has to pay an extra 10% in interest. The difference between the two methods is $49.98. Find the cost of the television.
EXAM PRACTICE UNIT 130
1
2
3
4
5
6
7
8
9
10
11
12
13
2x5x – 50
A B80 – x
4x – 3
3x
9 – 2x
EXAM PRACTICE: ALGEBRA 1
In questions 1–5, simplify as much as possible.
3yx – 6xy [1]
5ab3 – 4ab2 + 2b2a – 2b3a [1]
4b2 × 2b4 [1]
4p × (2p)3 [1]
9x – (2y – x) [2]
In questions 6–10, solve for x.
=336x
[2]
=36
3x
[2]
8(5 – 2x) = 24 [2]
3x + 5 = 29 – 9x [2]
2(x – 2) – (x – 3) = 3 [2]
The sum of three consecutive numbers is 219. What are the numbers? [3]
Q11 HINT Let the first number be x.
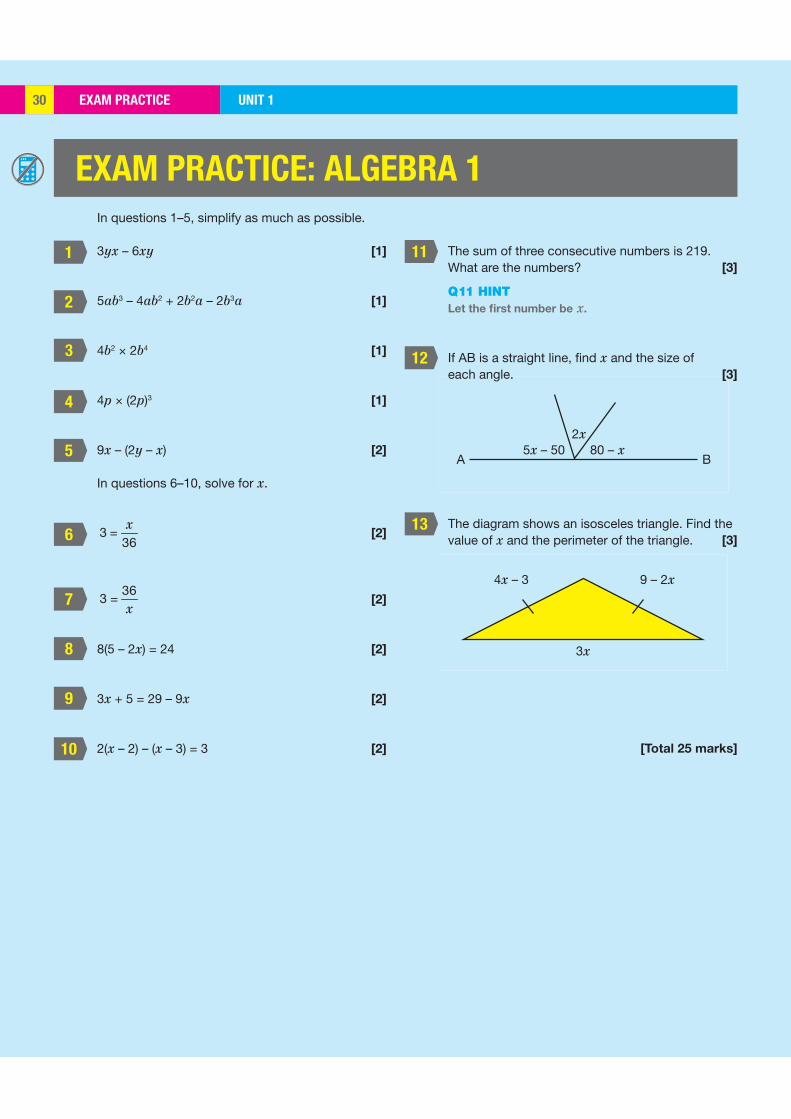
If AB is a straight line, find x and the size of each angle. [3]
The diagram shows an isosceles triangle. Find the value of x and the perimeter of the triangle. [3]
[Total 25 marks]
CHAPTER SUMMARYUNIT 1 31
CHAPTER SUMMARY: ALGEBRA 1
SIMPLIFYING ALGEBRAIC EXPRESSIONS
You can only add or subtract like terms:
2xy + 5xy = 7xy but the terms in 2xy + y cannot be added together;
2x2 + 4x2 = 6x2 but the terms in 2x2 + 3x cannot be added together.
The multiplication sign is often not included between letters, e.g. 2xy means 2 × x × y.
When multiplying, add like powers. 2xy2 × 3x × x2y3 = 6x4y5 (think of x as x1).
You can check your simplifications by substituting numbers.
SIMPLIFYING ALGEBRAIC EXPRESSIONS WITH BRACKETS
To solve equations, always do the same to both sides.
Always check your answer.
The six basic types:
• x + 2 = 10 (Subtract 2 from both sides) x = 8 (Check: 8 + 2 = 10)
• x – 2 = 10 (Add 2 to both sides) x = 12 (Check: 12 – 2 = 10)
• 2 – x = 10 (Add x to both sides) 2 = 10 + x (Subtract 10 from both sides) 2 – 10 = x x = –8 (Check: 2 – (–8) = 10)
• 2x = 10 (Divide both sides by 2) x = 5 (Check: 2 × 5 = 10)
• = 102x
(Multiply both sides by 2) x = 20 (Check: =20
210 )
• =
210
x (Multiply both sides by x)
2 = 10x (Divide both sides by 10) =1
5x (Check: 2 ÷ = 2 × 5 = 10)
Let the unknown quantity be x. Write down the facts in the form of an equation and then solve it.
SOLVING EQUATIONS
PROBLEMS LEADING TO EQUATIONS
Multiply each term inside the bracket by the term outside the bracket.
The multiplication sign is usually not included: 2(a + b) means 2 × (a + b) = 2 × a + 2 × b = 2a + 2b
Be very careful with negative signs outside a bracket: –3(x – 2) means –3 × (x – 2) = (–3) × (x) + (–3) × (–2) = –3x + 6
When multiplying, the number 1 is usually not included: –(3x – 4) means –1 × (3x – 4) = (–1) × (3x) + (–1) × (–4) = –3x + 4
GRAPHS 1 UNIT 132
LEARNING OBJECTIVES
BASIC PRINCIPLES
C cents100
90
80
70
60
50
40
30
20
10
m minutes0 1 2 3 4 5
–1
y5
4
3
2
1
1 2 3 4x
–1
0 5–2
–2
(2, 3)
GRAPHS 1
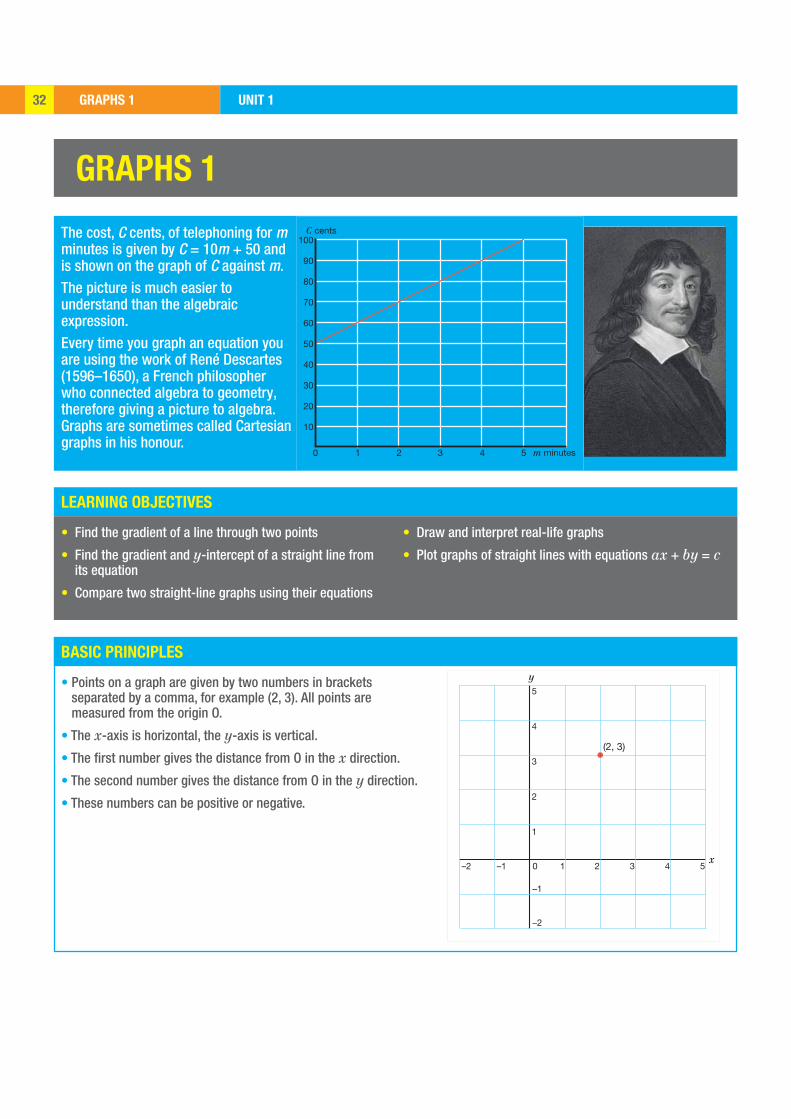
The cost, C cents, of telephoning for m minutes is given by C = 10m + 50 and is shown on the graph of C against m.The picture is much easier to understand than the algebraic expression.Every time you graph an equation you are using the work of René Descartes (1596–1650), a French philosopher who connected algebra to geometry, therefore giving a picture to algebra. Graphs are sometimes called Cartesian graphs in his honour.
• Find the gradient of a line through two points
• Find the gradient and y-intercept of a straight line from its equation
• Compare two straight-line graphs using their equations
• Draw and interpret real-life graphs
• Plot graphs of straight lines with equations ax + by = c
• Points on a graph are given by two numbers in brackets separated by a comma, for example (2, 3). All points are measured from the origin O.
• The x-axis is horizontal, the y-axis is vertical.
• The first number gives the distance from O in the x direction.
• The second number gives the distance from O in the y direction.
• These numbers can be positive or negative.
GRAPHS 1UNIT 1 33
EXAMPLE 1
EXAMPLE 2
1
2
3
4
5x
y
5
6
4 3 2 10 8 7 6
4
–2
4
2
B(3, 6)
A(1, 2)
x
y
0
(x1, y1)
(x2, y2)
rise
run
GRADIENT OF A STRAIGHT LINE
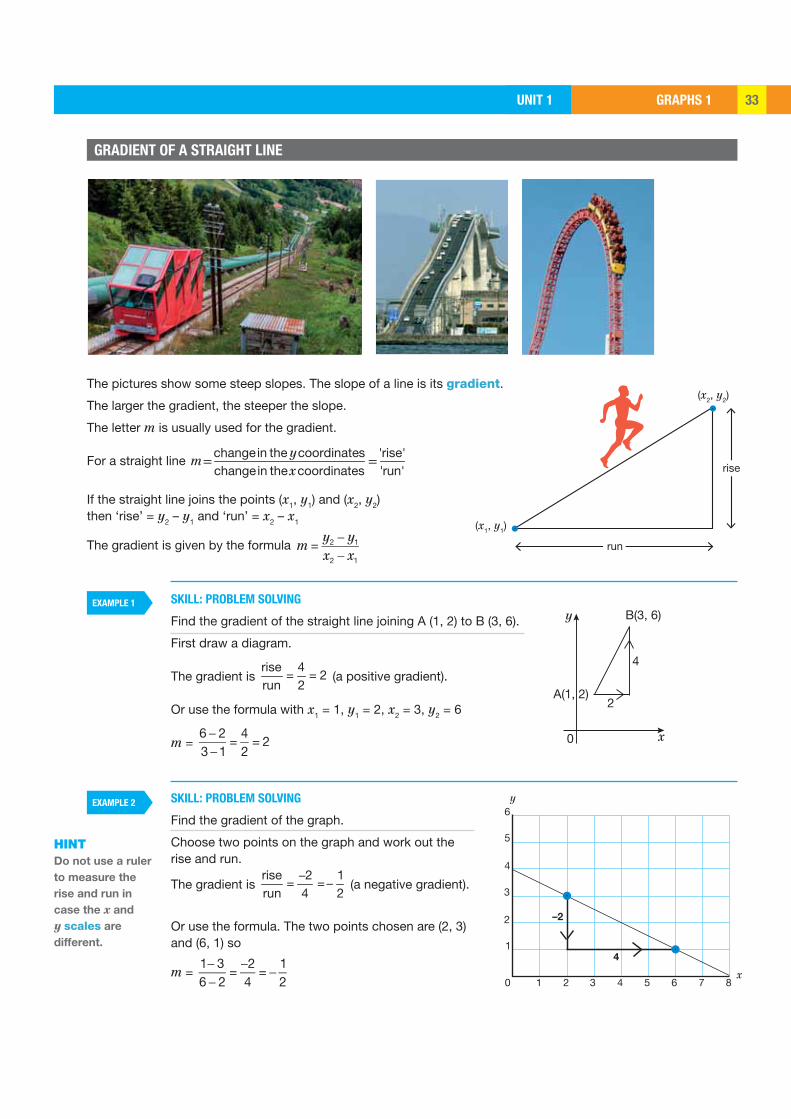
SKILL: PROBLEM SOLVING
Find the gradient of the straight line joining A (1, 2) to B (3, 6).
First draw a diagram.
The gradient is = =rise 4
2run 2
(a positive gradient).
Or use the formula with x1 = 1, y1 = 2, x2 = 3, y2 = 6
m = 6 23 1
=42
= 2
SKILL: PROBLEM SOLVING
Find the gradient of the graph.
Choose two points on the graph and work out the rise and run.
The gradient is −
= =−rise 2 1run 4 2
(a negative gradient).
Or use the formula. The two points chosen are (2, 3) and (6, 1) so
m = 1 36 2
=2
4=
12
HINTDo not use a ruler
to measure the
rise and run in
case the x and
y scales are
different.
The pictures show some steep slopes. The slope of a line is its gradient.
The larger the gradient, the steeper the slope.
The letter m is usually used for the gradient.
For a straight line changein the coordinates 'rise'changein the coordinates 'run'
ym
x= =
If the straight line joins the points (x1, y1) and (x2, y2) then ‘rise’ = y2 – y1 and ‘run’ = x2 – x1
The gradient is given by the formula m =y2 y1
x2 x1
GRAPHS 1 UNIT 134
KEY POINTS
EXERCISE 1
6
7
A
B
3
3
-2 2
-2
-1
1
0
2
3
4
x
y
20
-1
2
1
3
4
x
y
A
B
2
4
height
1.5 m
1.8 m
• Gradient m = 'rise''run'
• Lines like this have a positive gradient.
• Lines like this have a negative gradient.
• Parallel lines have the same gradient.
• Always draw a diagram.
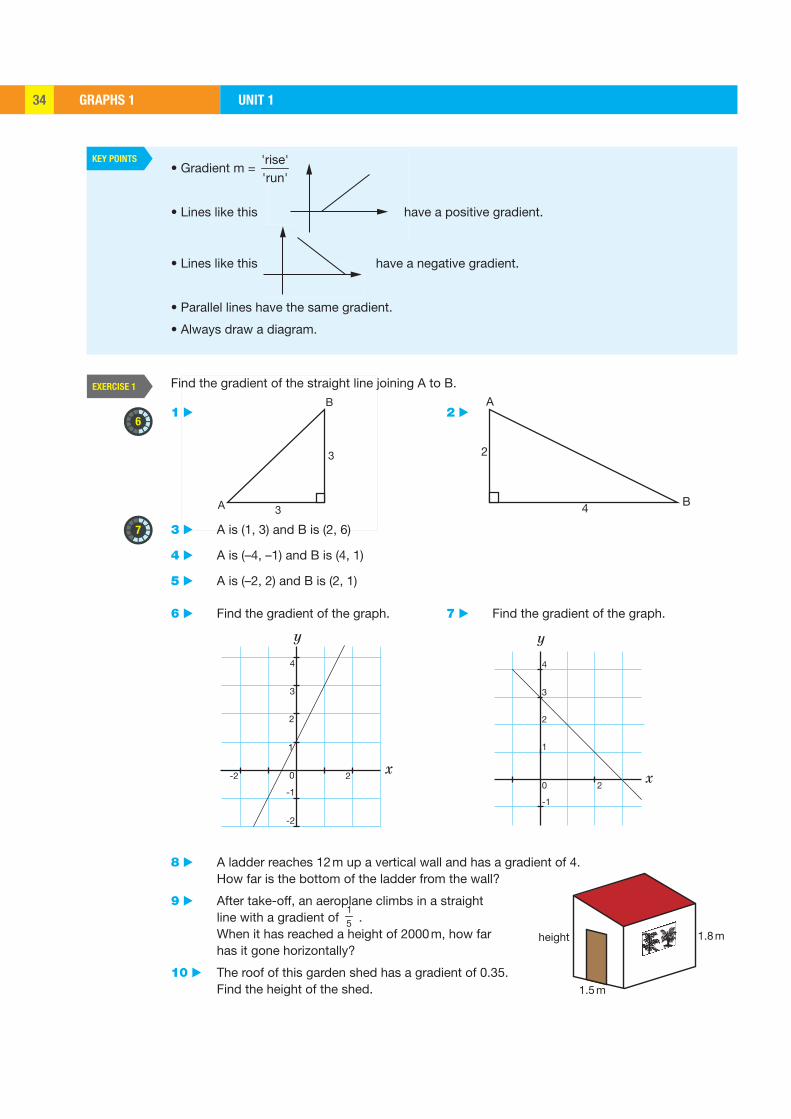
Find the gradient of the straight line joining A to B.
1 ▶ 2 ▶
3 ▶ A is (1, 3) and B is (2, 6)
4 ▶ A is (–4, –1) and B is (4, 1)
5 ▶ A is (–2, 2) and B is (2, 1)
6 ▶ Find the gradient of the graph. 7 ▶ Find the gradient of the graph.
8 ▶ A ladder reaches 12 m up a vertical wall and has a gradient of 4. How far is the bottom of the ladder from the wall?
9 ▶ After take-off, an aeroplane climbs in a straight line with a gradient of
15 .
When it has reached a height of 2000 m, how far has it gone horizontally?
10 ▶ The roof of this garden shed has a gradient of 0.35. Find the height of the shed.
GRAPHS 1UNIT 1 35
EXERCISE 1*
7
8
-2
-2 20
-1
-2
-1
4x
y
-2
-2 20
-1
2
1
3
x
y
12 m
20 m
h
200 m130 m90 m
A
B C D
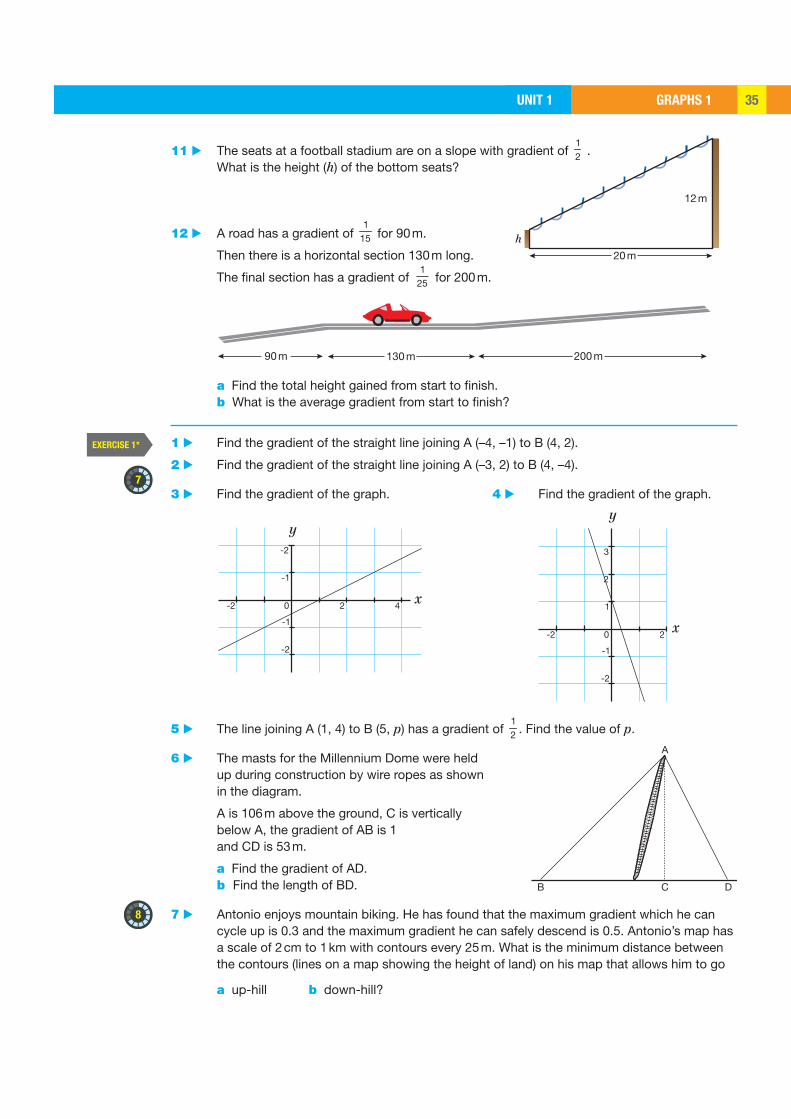
11 ▶ The seats at a football stadium are on a slope with gradient of 12 .
What is the height (h) of the bottom seats?
12 ▶ A road has a gradient of 1
15 for 90 m.
Then there is a horizontal section 130 m long.
The final section has a gradient of for 200 m.
a Find the total height gained from start to finish. b What is the average gradient from start to finish?
1 ▶ Find the gradient of the straight line joining A (–4, –1) to B (4, 2).
2 ▶ Find the gradient of the straight line joining A (–3, 2) to B (4, –4).
3 ▶ Find the gradient of the graph. 4 ▶ Find the gradient of the graph.
5 ▶ The line joining A (1, 4) to B (5, p) has a gradient of 12 . Find the value of p.
6 ▶ The masts for the Millennium Dome were held up during construction by wire ropes as shown in the diagram.
A is 106 m above the ground, C is vertically below A, the gradient of AB is 1 and CD is 53 m.
a Find the gradient of AD. b Find the length of BD.
7 ▶ Antonio enjoys mountain biking. He has found that the maximum gradient which he can cycle up is 0.3 and the maximum gradient he can safely descend is 0.5. Antonio’s map has a scale of 2 cm to 1 km with contours every 25 m. What is the minimum distance between the contours (lines on a map showing the height of land) on his map that allows him to go
a up-hill b down-hill?

GRAPHS 1 UNIT 136
ACTIVITY 1
8
10
B
A
C D
gradient = 3
gradient =
65 m
65 m12
A
A(1, 1) C(11, 1)
B(11, 2)
8 ▶ A crane is lifting a boat suspended by wire ropes AB and AD. The point C is vertically below A, and BC measures 5 m.
a The gradient of AB is 0.8. How high is A above C?
b The gradient of AD is –1.25. What is the length of the boat?
9 ▶ Do the points (1, 2), (51, 27) and (91, 48) lie on a straight line? Give reasons for your answer.
10 ▶ Find an algebraic expression for the gradient of the straight line joining A (p, q) to B (r, s).
11 ▶ The line joining (3, p) to (7, –4p) is parallel to the line joining (–1, –3) to (3, 7). Find p.
12 ▶ The gradient of the line joining (4, q) to (6, 5) is twice the gradient of the line joining (0, 0) to (4, q). Find q.
13 ▶ One of the world’s tallest roller coasters is in Blackpool, England. The maximum drop is 65 m over a horizontal distance of 65 m in two sections. The first section has a gradient of 3 and the second section has a gradient of
12
.
How high is the point A above the ground?
SKILL: REASONING
Find the gradient of the line AB.
Find the gradient of AB as the point B moves closer and closer to the point C.
Put your results in a table. What is the gradient of the horizontal line AC?
Find the gradient of AB as the point A moves closer and closer to the point C.
Put your results in a table. What is the gradient of the vertical line BC?
GRAPHS 1UNIT 1 37
ACTIVITY 2
-1
-2
-3
-4
-5
-6
-7
-8
2 4 6-6 -4 -2
1
2
4
3
5
6
10 3 5 7-3-5-7 -1x
y
a
b
c
-5
2 4 6-6 -4 -2
1
5
10 3 5 7-3-5-7 -1x
y
d
f
e
SKILL: REASONING
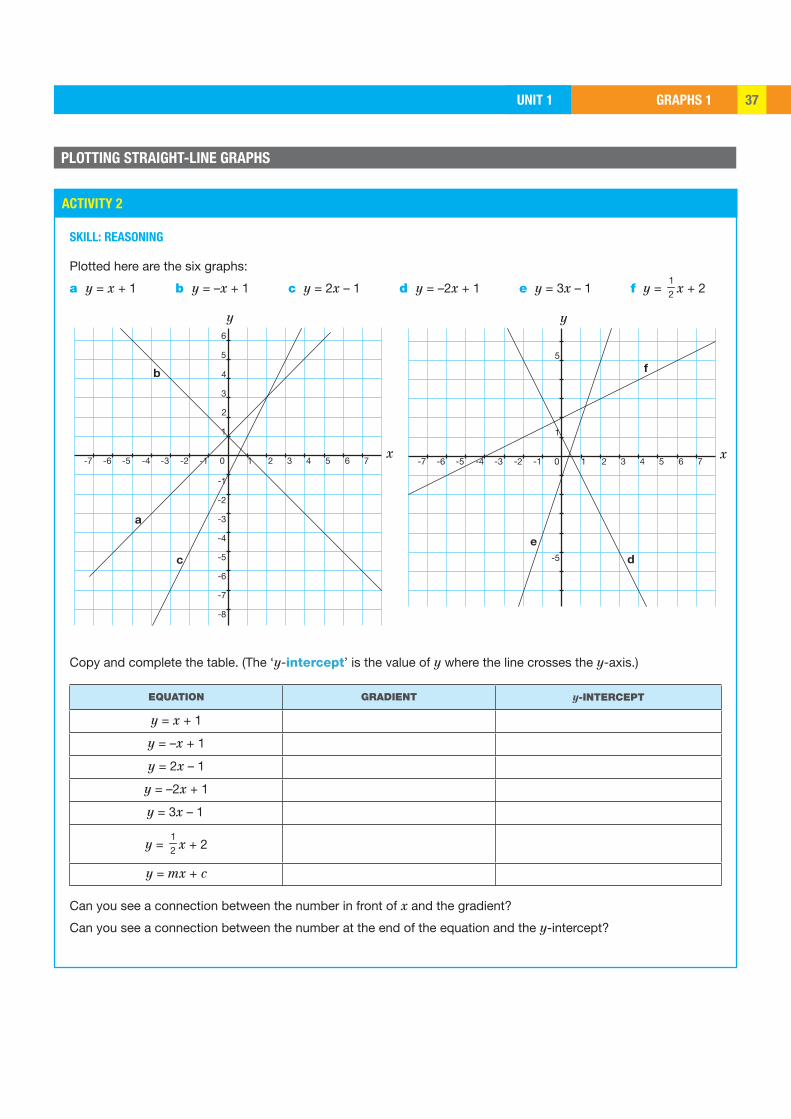
Plotted here are the six graphs:
a y = x + 1 b y = –x + 1 c y = 2x – 1 d y = –2x + 1 e y = 3x – 1 f y = 12 x + 2
Copy and complete the table. (The ‘y-intercept’ is the value of y where the line crosses the y-axis.)
EQUATION GRADIENT y-INTERCEPT
y = x + 1
y = –x + 1
y = 2x – 1
y = –2x + 1
y = 3x – 1
y = 12 x + 2
y = mx + c
Can you see a connection between the number in front of x and the gradient?
Can you see a connection between the number at the end of the equation and the y-intercept?
PLOTTING STRAIGHT-LINE GRAPHS
GRAPHS 1 UNIT 138
EXAMPLE 3
KEY POINTS
EXERCISE 2
6
m
C
700
600
500
400
300
200
100
20 40 60100 30 50 70
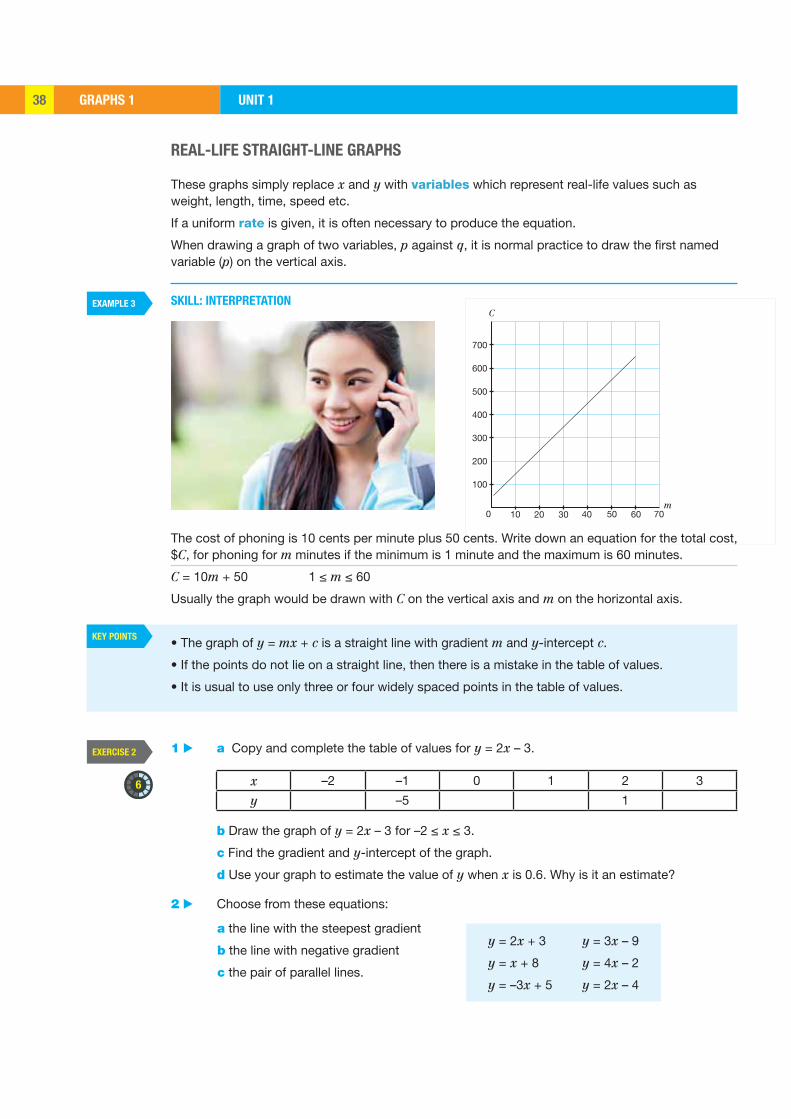
REAL-LIFE STRAIGHT-LINE GRAPHS
These graphs simply replace x and y with variables which represent real-life values such as weight, length, time, speed etc.
If a uniform rate is given, it is often necessary to produce the equation.
When drawing a graph of two variables, p against q, it is normal practice to draw the first named variable (p) on the vertical axis.
SKILL: INTERPRETATION
The cost of phoning is 10 cents per minute plus 50 cents. Write down an equation for the total cost, $C, for phoning for m minutes if the minimum is 1 minute and the maximum is 60 minutes.
C = 10m + 50 1 ≤ m ≤ 60
Usually the graph would be drawn with C on the vertical axis and m on the horizontal axis.
• The graph of y = mx + c is a straight line with gradient m and y-intercept c.
• If the points do not lie on a straight line, then there is a mistake in the table of values.
• It is usual to use only three or four widely spaced points in the table of values.
1 ▶ a Copy and complete the table of values for y = 2x – 3.
x –2 –1 0 1 2 3
y –5 1
b Draw the graph of y = 2x – 3 for –2 ≤ x ≤ 3.
c Find the gradient and y-intercept of the graph.
d Use your graph to estimate the value of y when x is 0.6. Why is it an estimate?
2 ▶ Choose from these equations:
y = 2x + 3
y = x + 8
y = –3x + 5
y = 3x – 9
y = 4x – 2
y = 2x – 4
a the line with the steepest gradient
b the line with negative gradient
c the pair of parallel lines.
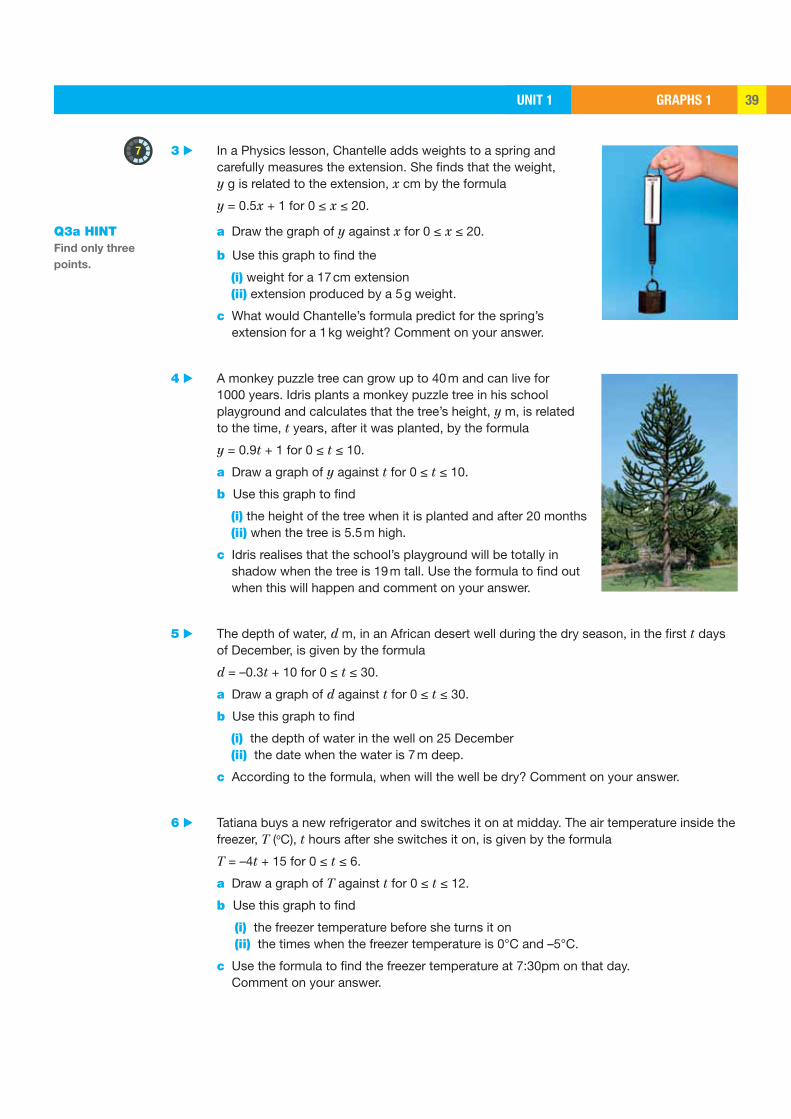
GRAPHS 1UNIT 1 39
7 3 ▶ In a Physics lesson, Chantelle adds weights to a spring and carefully measures the extension. She finds that the weight, y g is related to the extension, x cm by the formula
y = 0.5x + 1 for 0 ≤ x ≤ 20.
a Draw the graph of y against x for 0 ≤ x ≤ 20.
b Use this graph to find the
(i) weight for a 17 cm extension (ii) extension produced by a 5 g weight.
c What would Chantelle’s formula predict for the spring’s extension for a 1 kg weight? Comment on your answer.
4 ▶ A monkey puzzle tree can grow up to 40 m and can live for 1000 years. Idris plants a monkey puzzle tree in his school playground and calculates that the tree’s height, y m, is related to the time, t years, after it was planted, by the formula
y = 0.9t + 1 for 0 ≤ t ≤ 10.
a Draw a graph of y against t for 0 ≤ t ≤ 10.
b Use this graph to find
(i) the height of the tree when it is planted and after 20 months (ii) when the tree is 5.5 m high.
c Idris realises that the school’s playground will be totally in shadow when the tree is 19 m tall. Use the formula to find out when this will happen and comment on your answer.
5 ▶ The depth of water, d m, in an African desert well during the dry season, in the first t days of December, is given by the formula
d = –0.3t + 10 for 0 ≤ t ≤ 30.
a Draw a graph of d against t for 0 ≤ t ≤ 30.
b Use this graph to find
(i) the depth of water in the well on 25 December (ii) the date when the water is 7 m deep.
c According to the formula, when will the well be dry? Comment on your answer.
6 ▶ Tatiana buys a new refrigerator and switches it on at midday. The air temperature inside the freezer, T (oC), t hours after she switches it on, is given by the formula
T = –4t + 15 for 0 ≤ t ≤ 6.
a Draw a graph of T against t for 0 ≤ t ≤ 12.
b Use this graph to find
(i) the freezer temperature before she turns it on (ii) the times when the freezer temperature is 0°C and –5°C.
c Use the formula to find the freezer temperature at 7:30pm on that day. Comment on your answer.
Q3a HINT Find only three
points.
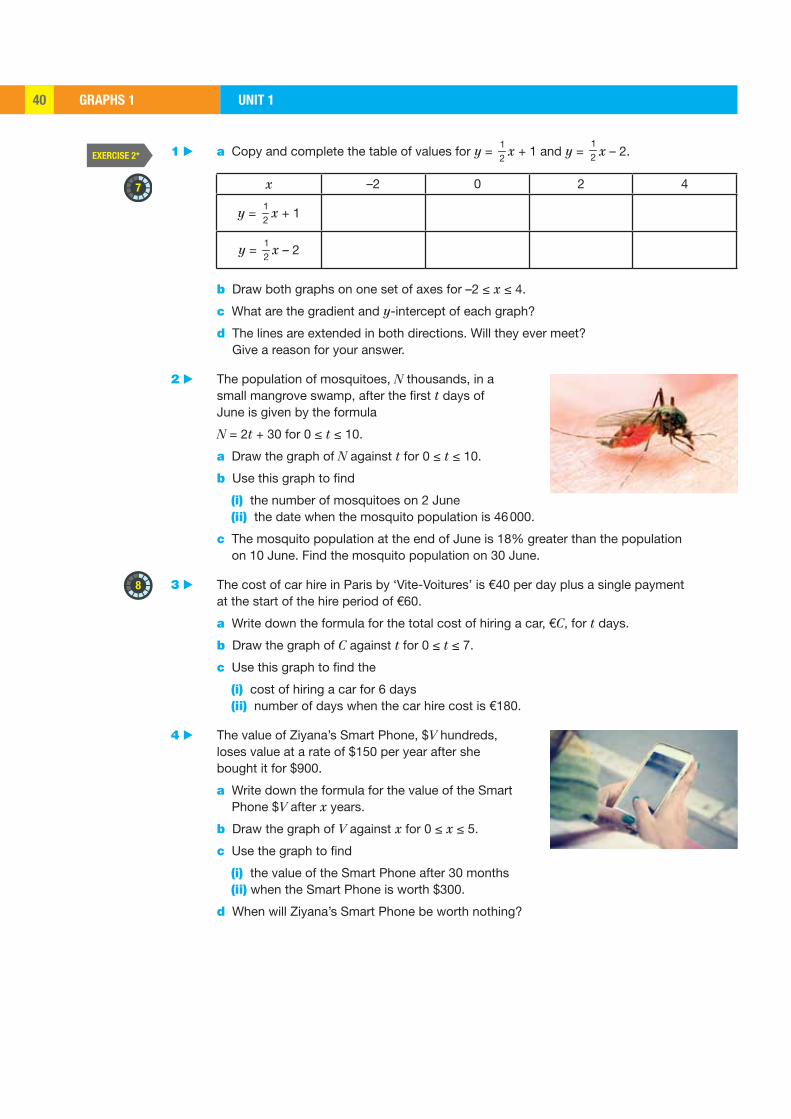
GRAPHS 1 UNIT 140
EXERCISE 2*
7
8
1 ▶ a Copy and complete the table of values for y = 12
x + 1 and y = 12 x – 2.
x –2 0 2 4
y = 12
x + 1
y = 12
x – 2
b Draw both graphs on one set of axes for –2 ≤ x ≤ 4.
c What are the gradient and y-intercept of each graph?
d The lines are extended in both directions. Will they ever meet? Give a reason for your answer.
2 ▶ The population of mosquitoes, N thousands, in a small mangrove swamp, after the first t days of June is given by the formula
N = 2t + 30 for 0 ≤ t ≤ 10.
a Draw the graph of N against t for 0 ≤ t ≤ 10.
b Use this graph to find
(i) the number of mosquitoes on 2 June (ii) the date when the mosquito population is 46 000.
c The mosquito population at the end of June is 18% greater than the population on 10 June. Find the mosquito population on 30 June.
3 ▶ The cost of car hire in Paris by ‘Vite-Voitures’ is €40 per day plus a single payment at the start of the hire period of €60.
a Write down the formula for the total cost of hiring a car, €C, for t days.
b Draw the graph of C against t for 0 ≤ t ≤ 7.
c Use this graph to find the
(i) cost of hiring a car for 6 days (ii) number of days when the car hire cost is €180.
4 ▶ The value of Ziyana’s Smart Phone, $V hundreds, loses value at a rate of $150 per year after she bought it for $900.
a Write down the formula for the value of the Smart Phone $V after x years.
b Draw the graph of V against x for 0 ≤ x ≤ 5.
c Use the graph to find
(i) the value of the Smart Phone after 30 months (ii) when the Smart Phone is worth $300.
d When will Ziyana’s Smart Phone be worth nothing?

GRAPHS 1UNIT 1 41
EXAMPLE 4
KEY POINTS
EXERCISE 3
8
0
4
8
y
x
5 ▶ Seth owns two electric cars, a Zenith and a Bubble.
Zenith: Bought for £25 000 and loses a value (depreciates) of £5000 per year.
Bubble: Bought for £10 000 and depreciates at £2000 per year.
a Write down the formula for the value, £V thousands, for each car after x years.
b Draw the graphs of V against x for both cars on the same axes for 0 ≤ x ≤ 5.
c Use the graphs to find the time when Seth’s cars
(i) are worth the same value (ii) have a difference in value of £9000.
GRAPHS OF ax + by = c
The graph of 3x + 4y = 12 is a straight line. The equation can be rearranged as = − +34
3y x showing it is a straight line with gradient − 3
4 and y-intercept (0, 3). The easiest way to plot the graph is to find where the graph crosses the axes.
SKILL: INTERPRETATION
Draw the graph x + 2y = 8.
Find where the line crosses the axes.
Substituting y = 0 gives x = 8 ⇒ (8, 0) lies on the line.
Substituting x = 0 gives y = 4 ⇒ (0, 4) lies on the line.
Join the points with a straight line.
• ax + by = c is a straight line.
• To draw the graph, find where it crosses the axes.
Find where each graph crosses the axes and draw the graph.
1 ▶ 2x + y = 6 2 ▶ 3x + 2y = 12 3 ▶ x – 2y = 4 4 ▶ 4y – 3x = 24
5 ▶ A firm selling plants has found that the number sold (N thousand) is related to the price (£P) by the formula 6P + N = 90.
a Draw the graph of N against P for 0 ≤ N ≤ 90. (Put N on the vertical axis and P on the horizontal axis.)
b Use your graph to find the price when 30 000 plants were sold.
c Use your graph to find the number sold if the price is set at £8.
d Use your graph to find the price if 90 000 plants were sold. Is this a sensible value?
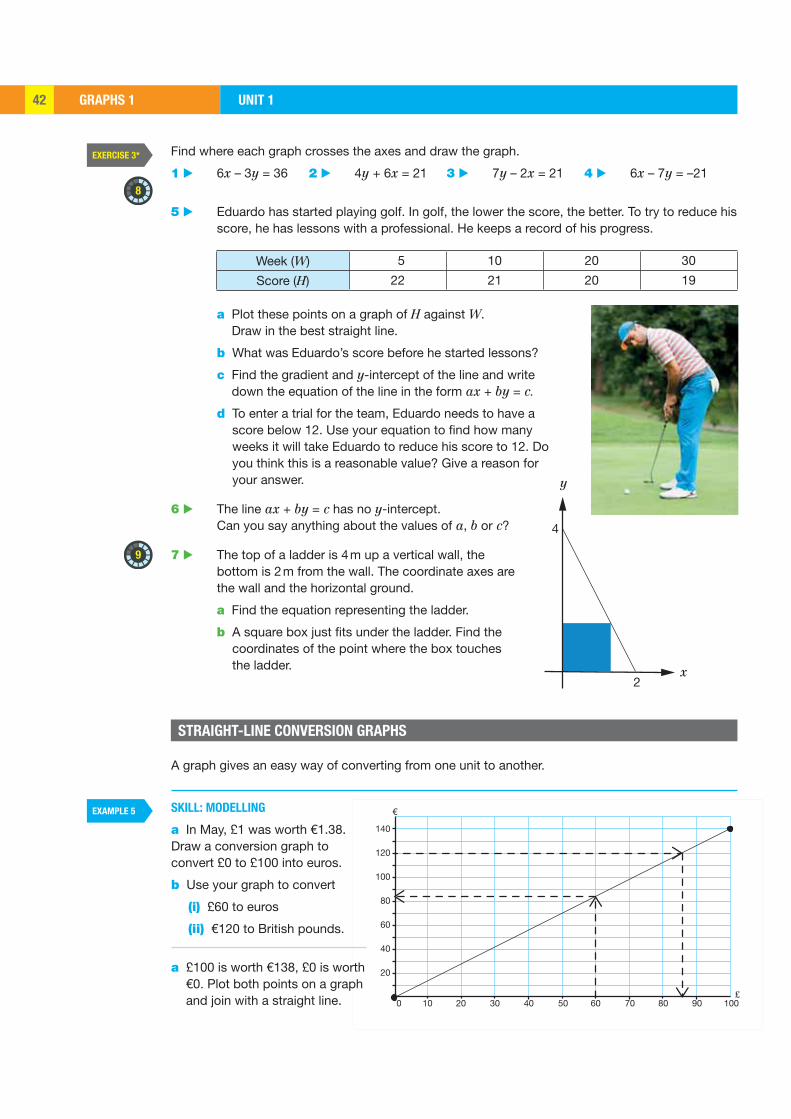
GRAPHS 1 UNIT 142
EXERCISE 3*
EXAMPLE 5
8
9
x
y
4
2
140
120
100
80
60
40
20
£
€
403020100 60 8070 90
50 100
Find where each graph crosses the axes and draw the graph.
1 ▶ 6x – 3y = 36 2 ▶ 4y + 6x = 21 3 ▶ 7y – 2x = 21 4 ▶ 6x – 7y = –21
5 ▶ Eduardo has started playing golf. In golf, the lower the score, the better. To try to reduce his score, he has lessons with a professional. He keeps a record of his progress.
Week (W) 5 10 20 30
Score (H) 22 21 20 19
a Plot these points on a graph of H against W. Draw in the best straight line.
b What was Eduardo’s score before he started lessons?
c Find the gradient and y-intercept of the line and write down the equation of the line in the form ax + by = c.
d To enter a trial for the team, Eduardo needs to have a score below 12. Use your equation to find how many weeks it will take Eduardo to reduce his score to 12. Do you think this is a reasonable value? Give a reason for your answer.
6 ▶ The line ax + by = c has no y-intercept. Can you say anything about the values of a, b or c?
7 ▶ The top of a ladder is 4 m up a vertical wall, the bottom is 2 m from the wall. The coordinate axes are the wall and the horizontal ground.
a Find the equation representing the ladder.
b A square box just fits under the ladder. Find the coordinates of the point where the box touches the ladder.
STRAIGHT-LINE CONVERSION GRAPHS
A graph gives an easy way of converting from one unit to another.
SKILL: MODELLING
a In May, £1 was worth €1.38. Draw a conversion graph to convert £0 to £100 into euros.
b Use your graph to convert
(i) £60 to euros
(ii) €120 to British pounds.
a £100 is worth €138, £0 is worth €0. Plot both points on a graph and join with a straight line.
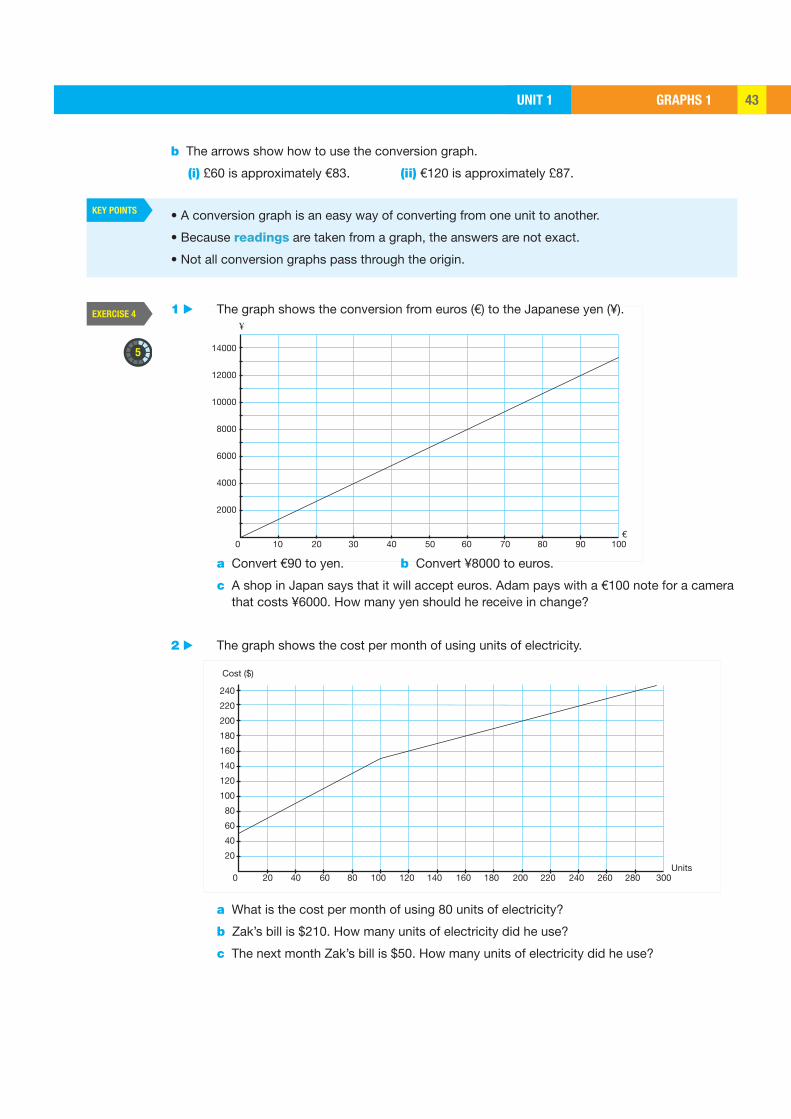
GRAPHS 1UNIT 1 43
EXERCISE 4
KEY POINTS
5 14000
12000
10000
8000
6000
4000
2000
€
¥
403020100 60 8070 9050 100
Units
Cost ($)
240
220
200
180
160
140
120
100
80
60
40
20
40 80 120200 60 100 140 180 220 260160 200 240 280 300
b The arrows show how to use the conversion graph.
(i) £60 is approximately €83. (ii) €120 is approximately £87.
• A conversion graph is an easy way of converting from one unit to another.
• Because readings are taken from a graph, the answers are not exact.
• Not all conversion graphs pass through the origin.
1 ▶ The graph shows the conversion from euros (€) to the Japanese yen (¥).
a Convert €90 to yen. b Convert ¥8000 to euros.
c A shop in Japan says that it will accept euros. Adam pays with a €100 note for a camera that costs ¥6000. How many yen should he receive in change?
2 ▶ The graph shows the cost per month of using units of electricity.
a What is the cost per month of using 80 units of electricity?
b Zak’s bill is $210. How many units of electricity did he use?
c The next month Zak’s bill is $50. How many units of electricity did he use?

GRAPHS 1 UNIT 144
EXERCISE 4*
6
6
220
200
180
160
140
120
100
80
60
40
20
200mph
14040 60 80 100 120
km/h
Time (mins)300
280
260
240
220
200
180
160
140
120
100
80
60
40
20
10 2Weight (kg)
53 4
3 ▶ The graph shows the cooking time needed to roast some lamb.
a How long (in hours and mins) will it take to roast a 4 kg piece of lamb? b Mary has 1 hour 40 mins to cook a meal. What is the largest piece of lamb that she can
cook in this time? c Does the graph give sensible answers for very small pieces of lamb? Suggest how the
graph could be improved for very small pieces of lamb.
4 ▶ 1 foot (plural ‘feet’) is equivalent to 0.305 metres.
a Draw a conversion graph to convert up to 100 feet to metres, plotting feet on the horizontal axis.
b Mala estimates the height of a tree as 26 m. What height is this in feet?
c Convert 20 feet to metres.
d Convert 2 feet to metres.
1 ▶ The graph shows the conversion from miles per hour (mph) to kilometres per hour (km/h).
a The speed limit on rural roads in France is 90 km/h. What is this speed in mph?
b Cheetahs can run up to 75 mph. What is this speed in km/h?
c The world land speed record is 763 mph. What is this speed approximately in km/h?
Q4d HINT Use your answer
to part c.
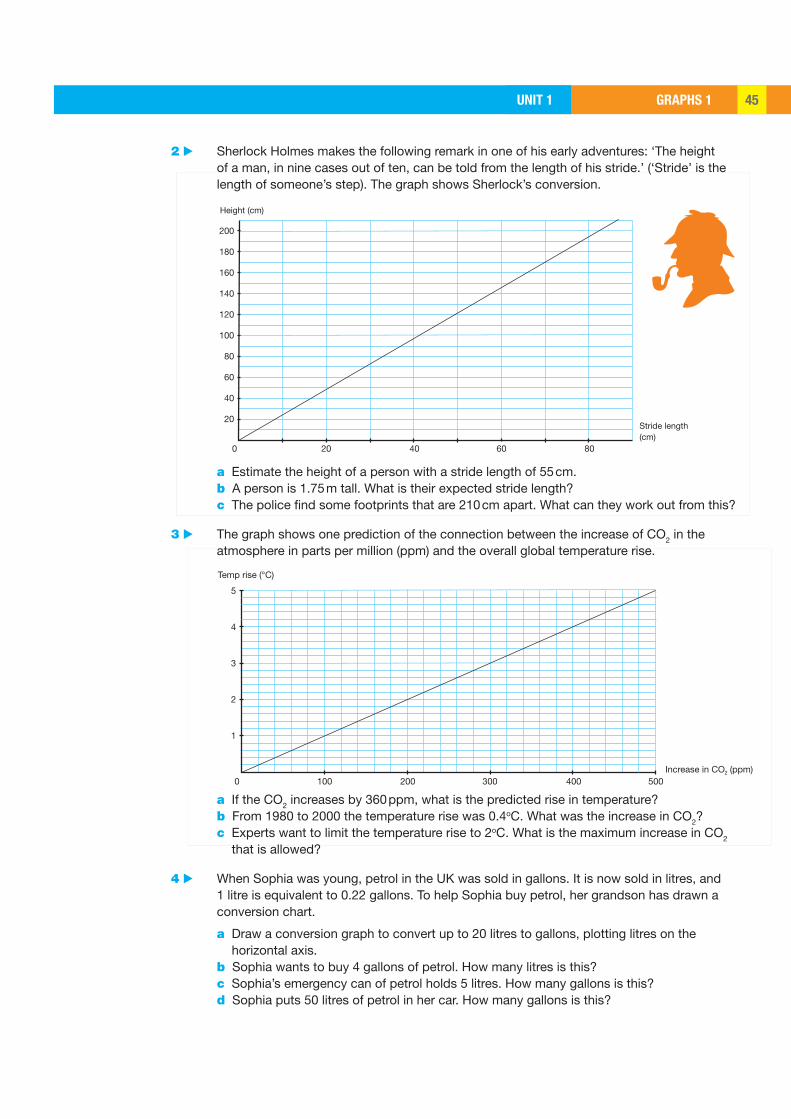
GRAPHS 1UNIT 1 45
5
4
3
2
1
Increase in CO (ppm)
Temp rise (°C)
2001000 300 400 5002
200
180
160
140
120
100
80
60
40
20Stride length (cm)
Height (cm)
40200 60 80
2 ▶ Sherlock Holmes makes the following remark in one of his early adventures: ‘The height of a man, in nine cases out of ten, can be told from the length of his stride.’ (‘Stride’ is the length of someone’s step). The graph shows Sherlock’s conversion.
a Estimate the height of a person with a stride length of 55 cm. b A person is 1.75 m tall. What is their expected stride length? c The police find some footprints that are 210 cm apart. What can they work out from this?
3 ▶ The graph shows one prediction of the connection between the increase of CO2 in the atmosphere in parts per million (ppm) and the overall global temperature rise.
a If the CO2 increases by 360 ppm, what is the predicted rise in temperature? b From 1980 to 2000 the temperature rise was 0.4oC. What was the increase in CO2? c Experts want to limit the temperature rise to 2oC. What is the maximum increase in CO2
that is allowed?
4 ▶ When Sophia was young, petrol in the UK was sold in gallons. It is now sold in litres, and 1 litre is equivalent to 0.22 gallons. To help Sophia buy petrol, her grandson has drawn a conversion chart.
a Draw a conversion graph to convert up to 20 litres to gallons, plotting litres on the horizontal axis.
b Sophia wants to buy 4 gallons of petrol. How many litres is this? c Sophia’s emergency can of petrol holds 5 litres. How many gallons is this? d Sophia puts 50 litres of petrol in her car. How many gallons is this?
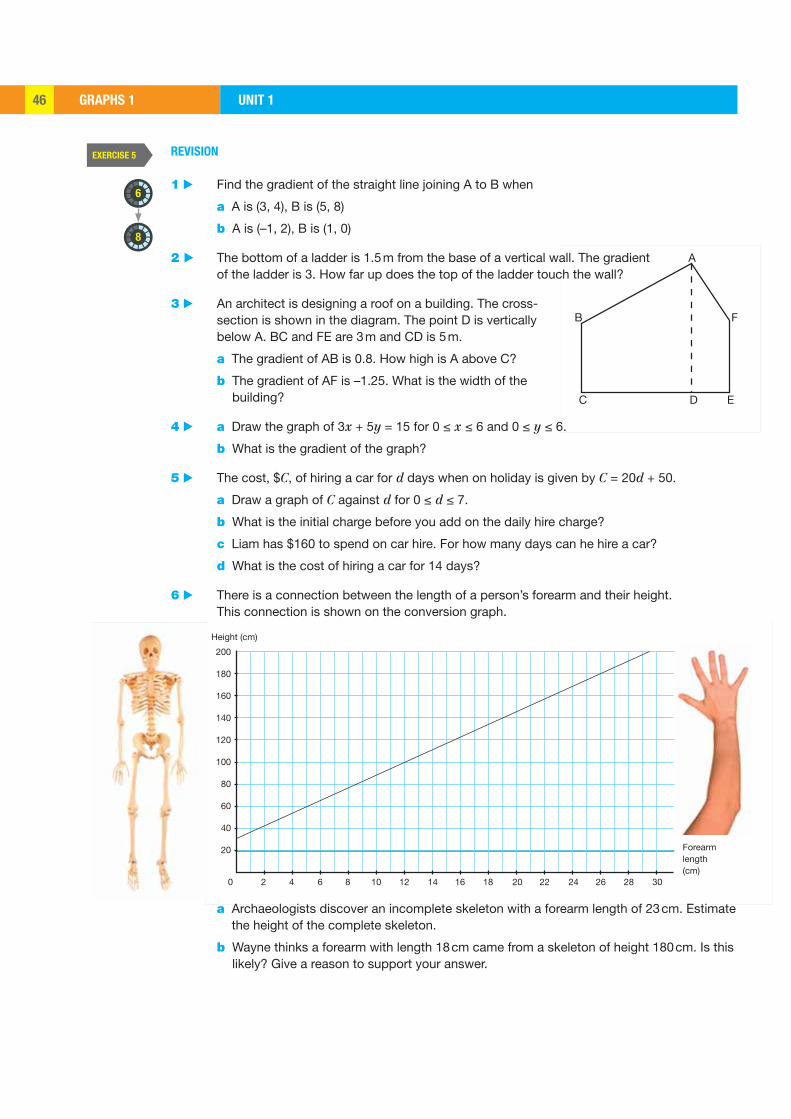
GRAPHS 1 UNIT 146
EXERCISE 5
6
8
C
B
D E
F
A
20
Forearm length (cm)
Height (cm)
200
180
160
140
120
100
80
60
40
20
4 6 8 10 12 14 16 18 20 22 24 26 28 30
REVISION
1 ▶ Find the gradient of the straight line joining A to B when
a A is (3, 4), B is (5, 8)
b A is (–1, 2), B is (1, 0)
2 ▶ The bottom of a ladder is 1.5 m from the base of a vertical wall. The gradient of the ladder is 3. How far up does the top of the ladder touch the wall?
3 ▶ An architect is designing a roof on a building. The cross-section is shown in the diagram. The point D is vertically below A. BC and FE are 3 m and CD is 5 m.
a The gradient of AB is 0.8. How high is A above C?
b The gradient of AF is –1.25. What is the width of the building?
4 ▶ a Draw the graph of 3x + 5y = 15 for 0 ≤ x ≤ 6 and 0 ≤ y ≤ 6.
b What is the gradient of the graph?
5 ▶ The cost, $C, of hiring a car for d days when on holiday is given by C = 20d + 50.
a Draw a graph of C against d for 0 ≤ d ≤ 7.
b What is the initial charge before you add on the daily hire charge?
c Liam has $160 to spend on car hire. For how many days can he hire a car?
d What is the cost of hiring a car for 14 days?
6 ▶ There is a connection between the length of a person’s forearm and their height. This connection is shown on the conversion graph.
a Archaeologists discover an incomplete skeleton with a forearm length of 23 cm. Estimate the height of the complete skeleton.
b Wayne thinks a forearm with length 18 cm came from a skeleton of height 180 cm. Is this likely? Give a reason to support your answer.
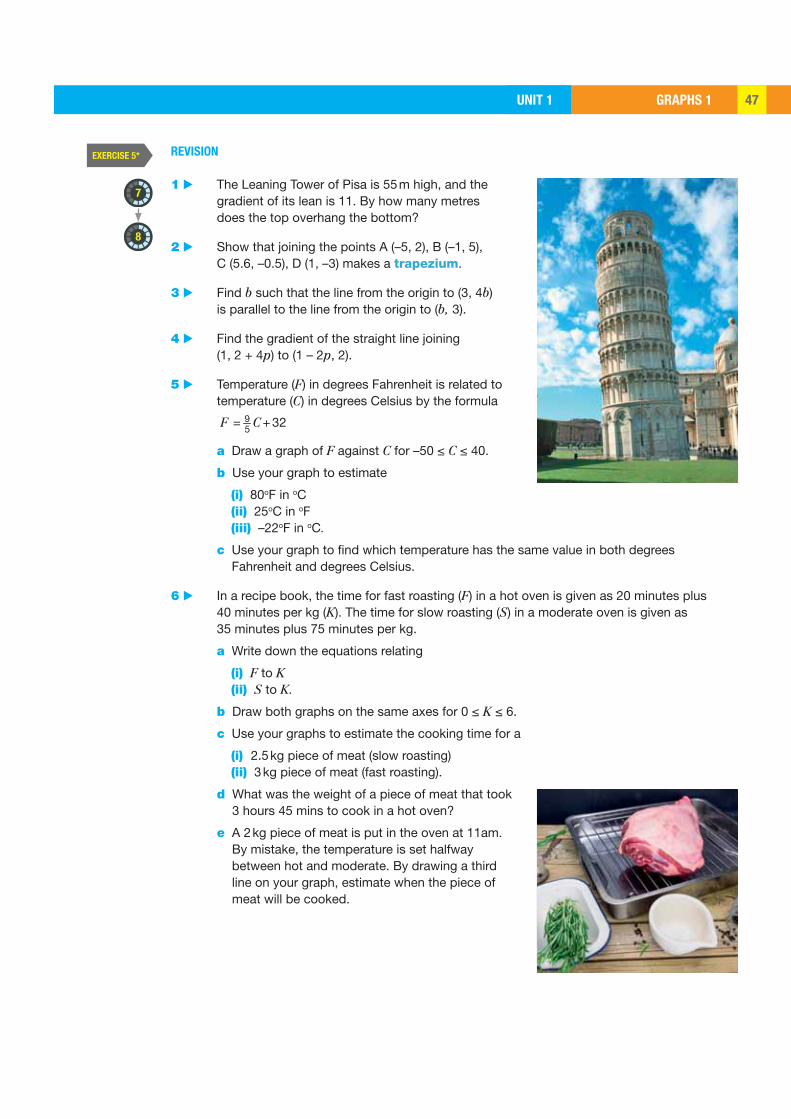
GRAPHS 1UNIT 1 47
EXERCISE 5*
8
7
REVISION
1 ▶ The Leaning Tower of Pisa is 55 m high, and the gradient of its lean is 11. By how many metres does the top overhang the bottom?
2 ▶ Show that joining the points A (–5, 2), B (–1, 5), C (5.6, –0.5), D (1, –3) makes a trapezium.
3 ▶ Find b such that the line from the origin to (3, 4b) is parallel to the line from the origin to (b, 3).
4 ▶ Find the gradient of the straight line joining (1, 2 + 4p) to (1 – 2p, 2).
5 ▶ Temperature (F) in degrees Fahrenheit is related to temperature (C) in degrees Celsius by the formula
= +95
32F C
a Draw a graph of F against C for –50 ≤ C ≤ 40.
b Use your graph to estimate
(i) 80oF in oC (ii) 25oC in oF (iii) –22oF in oC.
c Use your graph to find which temperature has the same value in both degrees Fahrenheit and degrees Celsius.
6 ▶ In a recipe book, the time for fast roasting (F) in a hot oven is given as 20 minutes plus 40 minutes per kg (K). The time for slow roasting (S) in a moderate oven is given as 35 minutes plus 75 minutes per kg.
a Write down the equations relating
(i) F to K (ii) S to K.
b Draw both graphs on the same axes for 0 ≤ K ≤ 6.
c Use your graphs to estimate the cooking time for a
(i) 2.5 kg piece of meat (slow roasting) (ii) 3 kg piece of meat (fast roasting).
d What was the weight of a piece of meat that took 3 hours 45 mins to cook in a hot oven?
e A 2 kg piece of meat is put in the oven at 11am. By mistake, the temperature is set halfway between hot and moderate. By drawing a third line on your graph, estimate when the piece of meat will be cooked.
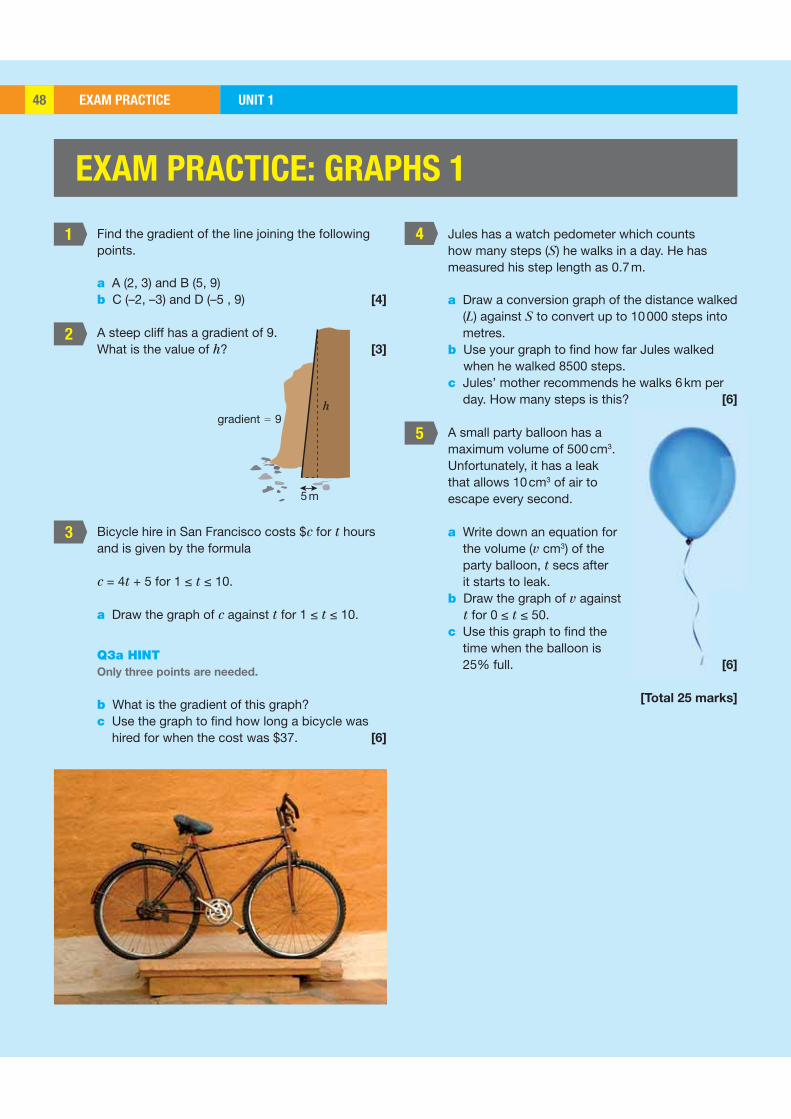
EXAM PRACTICE UNIT 148
1
2
3
4
5gradient = 9
h
5 m
EXAM PRACTICE: GRAPHS 1
Find the gradient of the line joining the following points.
a A (2, 3) and B (5, 9) b C (–2, –3) and D (–5 , 9) [4]
A steep cliff has a gradient of 9. What is the value of h? [3]
Bicycle hire in San Francisco costs $c for t hours and is given by the formula
c = 4t + 5 for 1 ≤ t ≤ 10.
a Draw the graph of c against t for 1 ≤ t ≤ 10.
Q3a HINT Only three points are needed.
b What is the gradient of this graph?c Use the graph to fi nd how long a bicycle was
hired for when the cost was $37. [6]
Jules has a watch pedometer which counts how many steps (S) he walks in a day. He has measured his step length as 0.7 m.
a Draw a conversion graph of the distance walked (L) against S to convert up to 10 000 steps into metres.
b Use your graph to fi nd how far Jules walked when he walked 8500 steps.
c Jules’ mother recommends he walks 6 km per day. How many steps is this? [6]
A small party balloon has a maximum volume of 500 cm3. Unfortunately, it has a leak that allows 10 cm3 of air to escape every second.
a Write down an equation for the volume (v cm3) of the party balloon, t secs after it starts to leak.
b Draw the graph of v against t for 0 ≤ t ≤ 50.
c Use this graph to fi nd the time when the balloon is 25% full. [6]
[Total 25 marks]
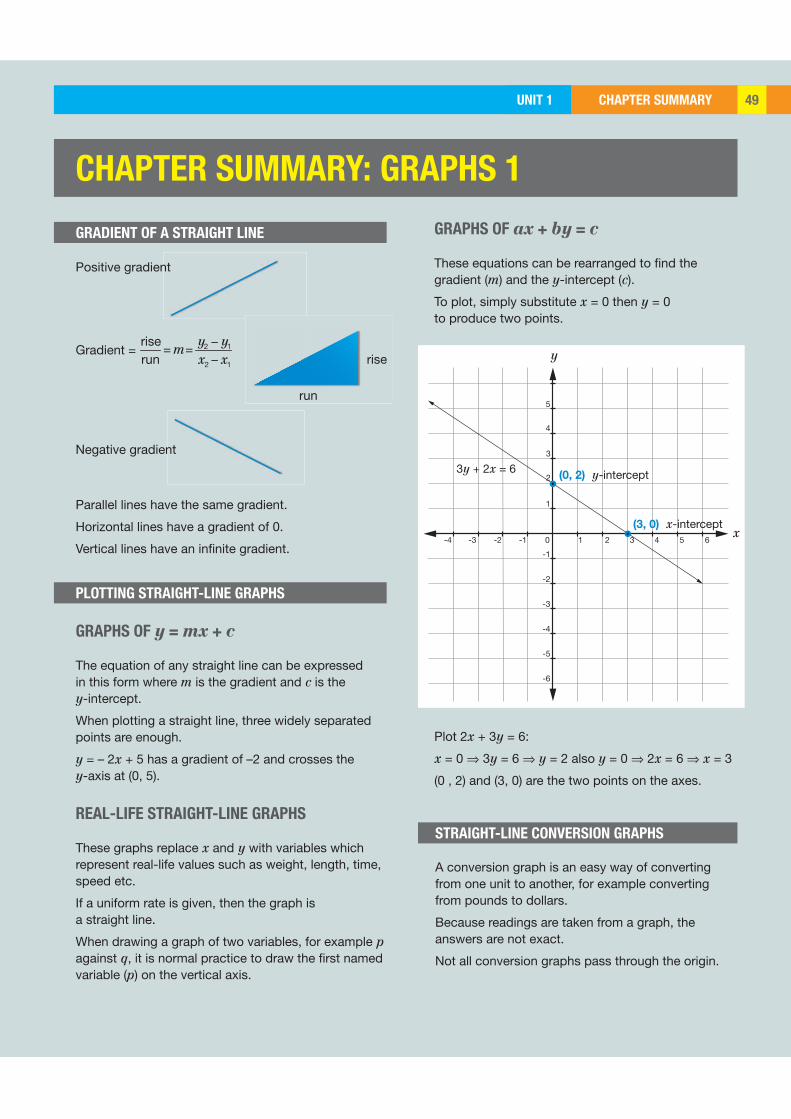
CHAPTER SUMMARYUNIT 1 49
run
rise
-1
-2
-3
-4
-5
-6
2 4 6-4 -2
1
5
1 3 5-3 -1 0
3
4
23y + 2x = 6
x
y
(3, 0) x-intercept
(0, 2) y-intercept
CHAPTER SUMMARY: GRAPHS 1
GRADIENT OF A STRAIGHT LINE
Positive gradient
Gradient = 2 1
2 1
riserun
y ym
x x−
= =−
Negative gradient
Parallel lines have the same gradient.
Horizontal lines have a gradient of 0.
Vertical lines have an infinite gradient.
STRAIGHT-LINE CONVERSION GRAPHS
A conversion graph is an easy way of converting from one unit to another, for example converting from pounds to dollars.
Because readings are taken from a graph, the answers are not exact.
Not all conversion graphs pass through the origin.
GRAPHS OF ax + by = c
These equations can be rearranged to find the gradient (m) and the y-intercept (c).
To plot, simply substitute x = 0 then y = 0 to produce two points.
Plot 2x + 3y = 6:
x = 0 ⇒ 3y = 6 ⇒ y = 2 also y = 0 ⇒ 2x = 6 ⇒ x = 3
(0 , 2) and (3, 0) are the two points on the axes.
PLOTTING STRAIGHT-LINE GRAPHS
GRAPHS OF y = mx + c
The equation of any straight line can be expressed in this form where m is the gradient and c is the y-intercept.
When plotting a straight line, three widely separated points are enough.
y = – 2x + 5 has a gradient of –2 and crosses the y-axis at (0, 5).
REAL-LIFE STRAIGHT-LINE GRAPHS
These graphs replace x and y with variables which represent real-life values such as weight, length, time, speed etc.
If a uniform rate is given, then the graph is a straight line.
When drawing a graph of two variables, for example p against q, it is normal practice to draw the first named variable (p) on the vertical axis.
SHAPE AND SPACE 1 UNIT 150
LEARNING OBJECTIVES
BASIC PRINCIPLES
ba a + b = 180˚
ca a = c, b = db
d
a
ac
c
Line of symmetry
SHAPE AND SPACE 1
The architects who designed The Izadi Tower in Tehran used an incredible range of geometrical shapes and patterns in its complex construction. We will study many of these shapes in this section on geometry.
• Obtain and use the sum of angles in a triangle
• Obtain and use the property that the exterior angle of a triangle is equal to the sum of the two opposite interior angles
• Use the properties of special triangles to solve geometrical problems
• Obtain and use the sum of angles in a quadrilateral
• Use the properties of quadrilaterals to solve geometrical problems
• Calculate the sum of the interior angles of a polygon
• Know and use the sum of the exterior angles of a polygon
• Use the angles of polygons to solve geometrical problems
• Use and interpret maps and scale drawings
• Solve problems involving bearings
• Construct triangles using a ruler and compasses
• Construct the perpendicular bisector of a line
• Construct the bisector of an angle
• Construct angles using a ruler and compasses
• Recognise similar shapes
• Use the ratio of corresponding sides to work out scale factors
• Find missing lengths on similar shapes
• Angles on a straight line.
• Vertically opposite angles.
• Parallel lines.
Alternate angles a are equal
Corresponding angles c are equal
• Lines of symmetry. If a shape is folded along a line of symmetry, both halves will match exactly.
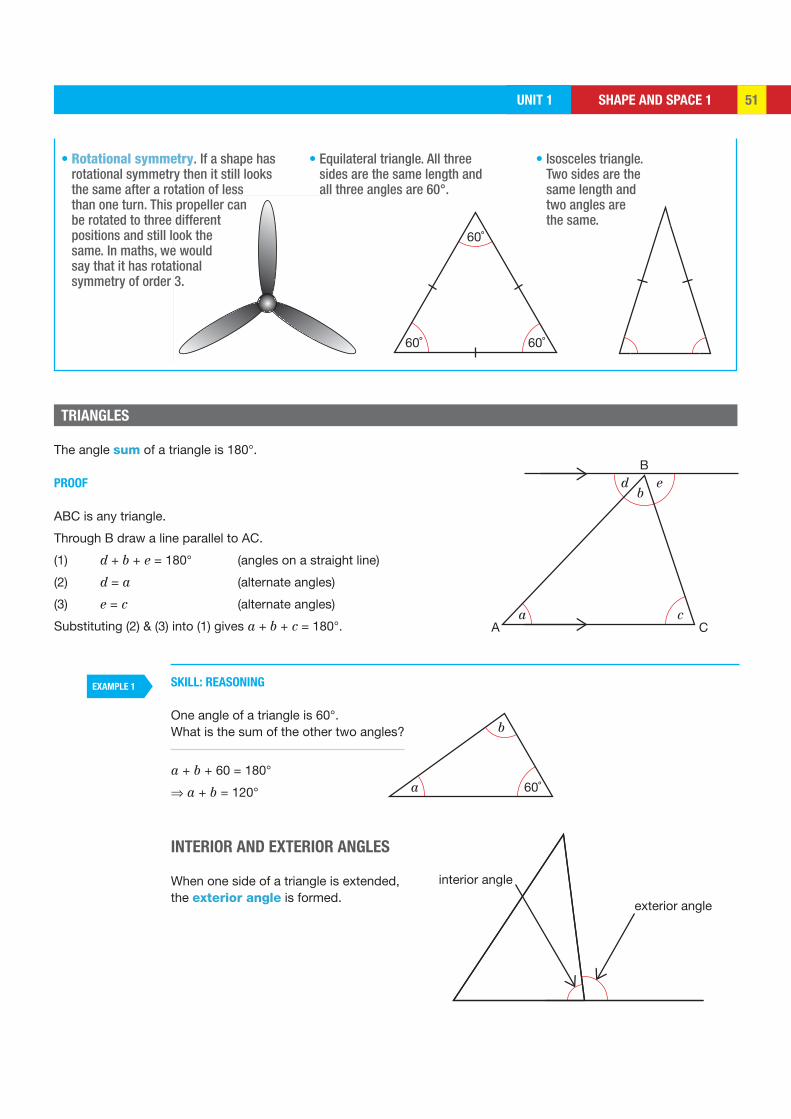
SHAPE AND SPACE 1UNIT 1 51
EXAMPLE 1
60˚
60˚ 60˚
B
A C
bd e
a c
60˚a
b
interior angle
exterior angle
• Rotational symmetry. If a shape has rotational symmetry then it still looks the same after a rotation of less than one turn. This propeller can be rotated to three different positions and still look the same. In maths, we would say that it has rotational symmetry of order 3.
• Equilateral triangle. All three sides are the same length and all three angles are 60°.
• Isosceles triangle. Two sides are the same length and two angles are the same.
TRIANGLES
SKILL: REASONING
One angle of a triangle is 60°. What is the sum of the other two angles?
a + b + 60 = 180°
⇒ a + b = 120°
INTERIOR AND EXTERIOR ANGLES
When one side of a triangle is extended, the exterior angle is formed.
The angle sum of a triangle is 180°.
PROOF
ABC is any triangle.
Through B draw a line parallel to AC.
(1) d + b + e = 180° (angles on a straight line)
(2) d = a (alternate angles)
(3) e = c (alternate angles)
Substituting (2) & (3) into (1) gives a + b + c = 180°.
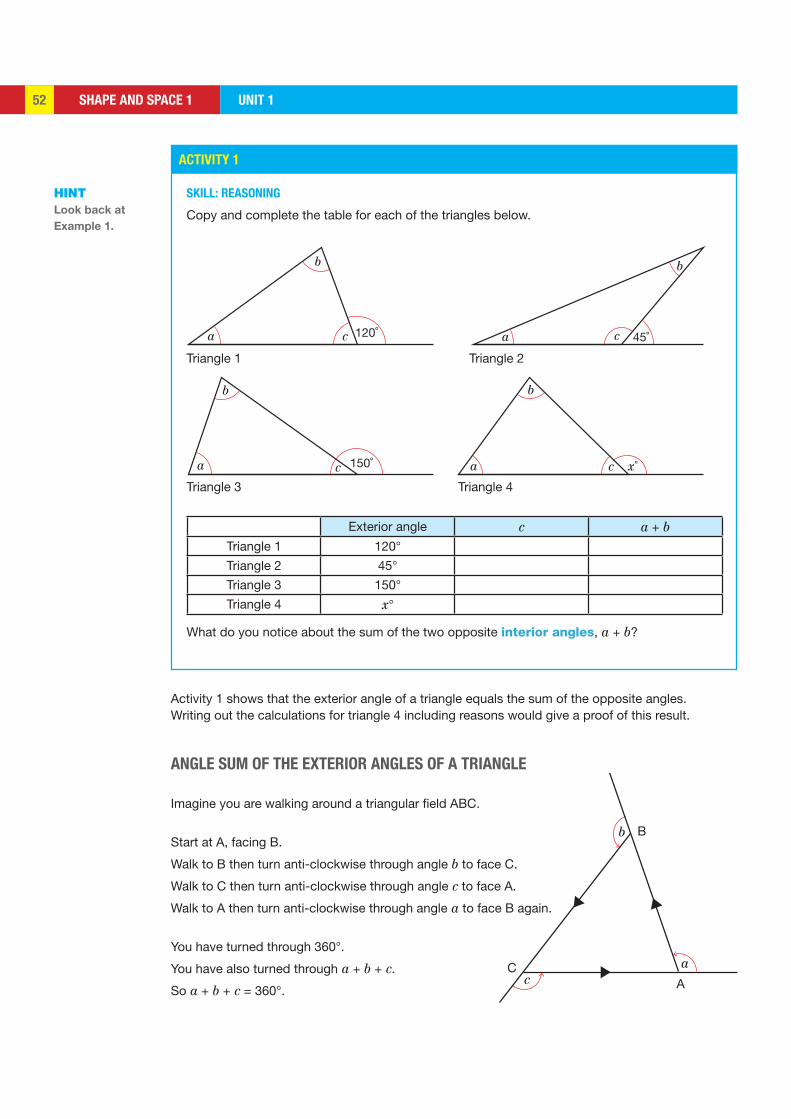
SHAPE AND SPACE 1 UNIT 152
ACTIVITY 1
b
a a
a a c
b
bb
c
cc 120˚ 45˚
150˚ x
B
AC
b
ac
SKILL: REASONING
Copy and complete the table for each of the triangles below.
Exterior angle c a + bTriangle 1 120°
Triangle 2 45°
Triangle 3 150°
Triangle 4 x°
What do you notice about the sum of the two opposite interior angles, a + b?
HINT Look back at
Example 1.
Triangle 1 Triangle 2
Triangle 3 Triangle 4
Activity 1 shows that the exterior angle of a triangle equals the sum of the opposite angles. Writing out the calculations for triangle 4 including reasons would give a proof of this result.
ANGLE SUM OF THE EXTERIOR ANGLES OF A TRIANGLE
Imagine you are walking around a triangular field ABC.
Start at A, facing B.
Walk to B then turn anti-clockwise through angle b to face C.
Walk to C then turn anti-clockwise through angle c to face A.
Walk to A then turn anti-clockwise through angle a to face B again.
You have turned through 360°.
You have also turned through a + b + c.
So a + b + c = 360°.
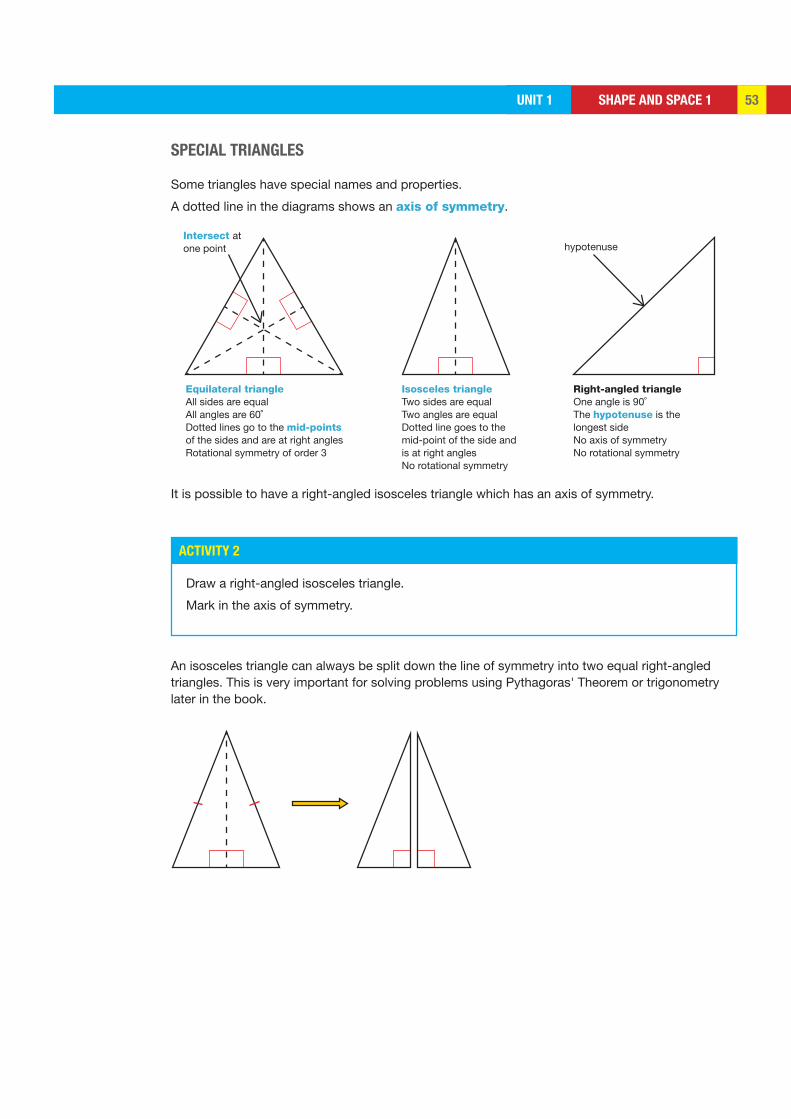
SHAPE AND SPACE 1UNIT 1 53
ACTIVITY 2
Equilateral triangleAll sides are equalAll angles are 60˚Dotted lines go to the mid-points of the sides and are at right anglesRotational symmetry of order 3
Isosceles triangleTwo sides are equalTwo angles are equalDotted line goes to the mid-point of the side and is at right anglesNo rotational symmetry
Right-angled triangleOne angle is 90˚ The hypotenuse is the longest sideNo axis of symmetryNo rotational symmetry
hypotenuseIntersect at one point
Draw a right-angled isosceles triangle.
Mark in the axis of symmetry.
SPECIAL TRIANGLES Some triangles have special names and properties.
A dotted line in the diagrams shows an axis of symmetry.
It is possible to have a right-angled isosceles triangle which has an axis of symmetry.
An isosceles triangle can always be split down the line of symmetry into two equal right-angled triangles. This is very important for solving problems using Pythagoras' Theorem or trigonometry later in the book.

SHAPE AND SPACE 1 UNIT 154
EXAMPLE 2
EXAMPLE 3
KEY POINTS
BA
D
E
C
x140˚
B
A
D
E
C 2x
F
xx–10
a + b + c = 180˚
a
b
c
e = a + b
a
b
e
SKILL: REASONING
ABC and BCD are isosceles triangles.
AB is parallel to CD.
∠ACE is 140°.
Find the angle marked x.
∠ACE is an exterior angle of ΔABC
⇒ ∠CAB + ∠ABC = 140°
∠CAB = ∠ABC (ΔABC is isosceles)
⇒ ∠ABC = 70°
∠ABC = ∠BCD (alternate angles)
∠BCD = ∠CBD = 70° (ΔBCD is isosceles)
⇒ angle x = 40° (angle sum of triangle)
SKILL: REASONING
Work out the size of angle ABC.
∠FCD = x (vertically opposite angles)
∠FCD + ∠CDE = 180° (interior angles of parallel lines)
⇒ 3x = 180 ⇒ x = 60°
⇒ ∠BAC = 50° (∠BAC = x – 10)
⇒ ∠ABC = 70° (angle sum of a triangle)
• The angle sum of a triangle is 180°.
• The exterior angle of a triangle equals the sum of the opposite interior angles.
• The sum of the exterior angles of a triangle is 360°.
• An equilateral triangle is also an isosceles triangle.
• An isosceles triangle can be split into two equal right-angled triangles.
• When doing problems, mark any angles you work out on a neat sketch of the diagram.
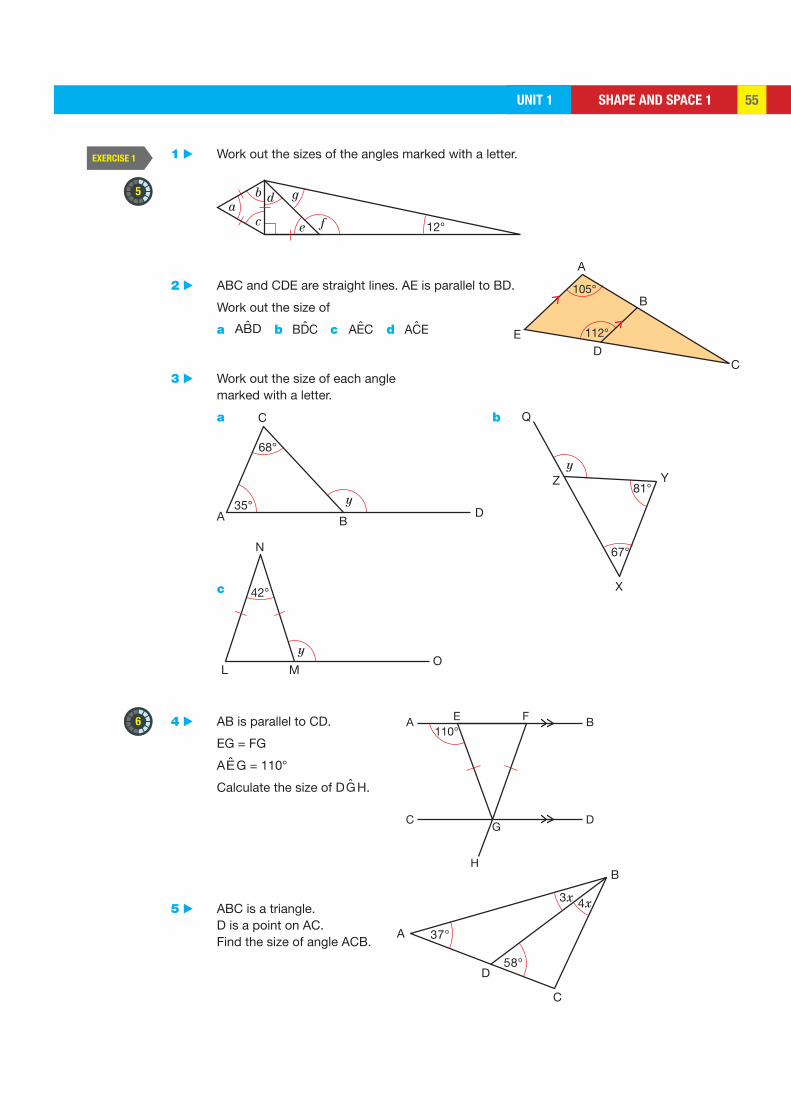
SHAPE AND SPACE 1UNIT 1 55
EXERCISE 1
5
6
105°
ED
B
A
C
112°
ab
c
d
e f
g
12°
110°A B
C
H
GD
E F
3x 4x
37°
58°
A
B
D
C
yA
C
68°
35°B
D
y
Q
Z81°
67°
X
Y
42°
yO
M
N
L
1 ▶ Work out the sizes of the angles marked with a letter.
2 ▶ ABC and CDE are straight lines. AE is parallel to BD.
Work out the size of
a ABD b BDC c AEC d ACE
3 ▶ Work out the size of each angle marked with a letter.
a b
c
4 ▶ AB is parallel to CD.
EG = FG
AEG = 110°
Calculate the size of DGH.
5 ▶ ABC is a triangle. D is a point on AC. Find the size of angle ACB.
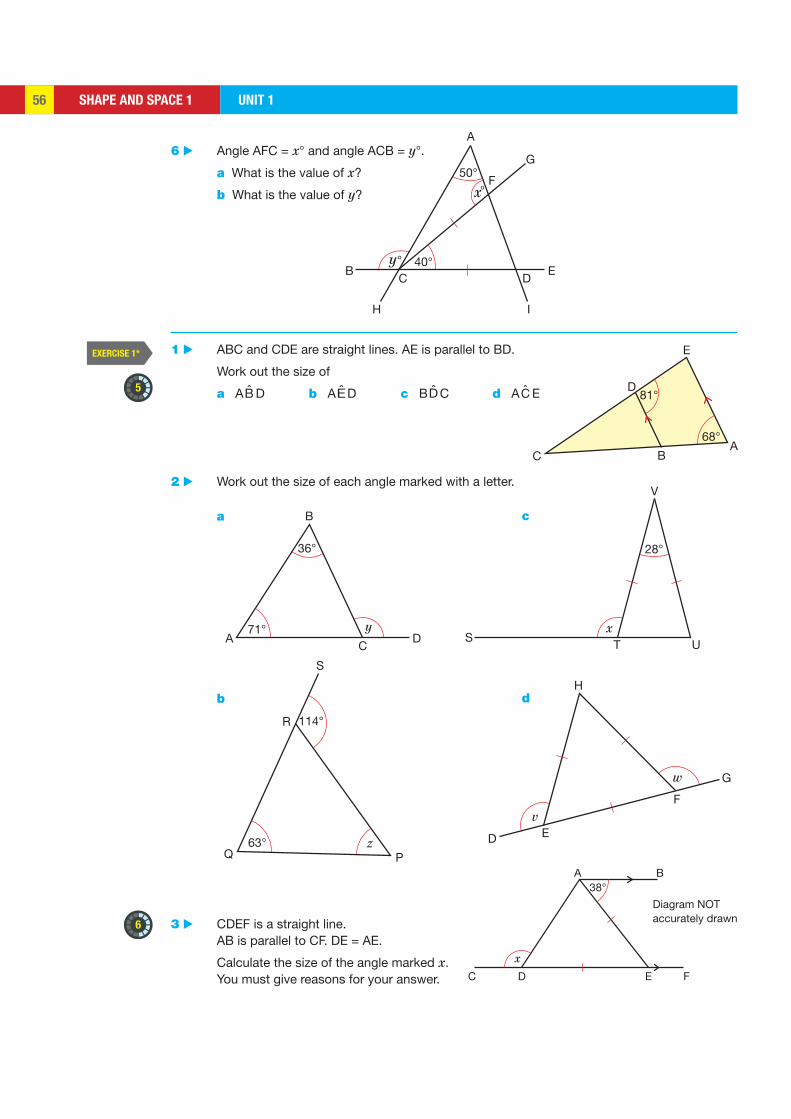
SHAPE AND SPACE 1 UNIT 156
EXERCISE 1*
5
6
81°
C B
D
E
A68°
y
B
A DC
71°
36°
zQ
63°
R
S
114°
P
x
V
UTS
28°
v
w
H
ED
F
G
B38°
A
C D E F
Diagram NOTaccurately drawn
x
x
y°
A
B E
F50°
40°
G
C
H I
D
°
6 ▶ Angle AFC = x° and angle ACB = y°.
a What is the value of x?
b What is the value of y?
1 ▶ ABC and CDE are straight lines. AE is parallel to BD.
Work out the size of
a AB D b AED c BD C d AC E
2 ▶ Work out the size of each angle marked with a letter.
a c
b d
3 ▶ CDEF is a straight line. AB is parallel to CF. DE = AE.
Calculate the size of the angle marked x. You must give reasons for your answer.
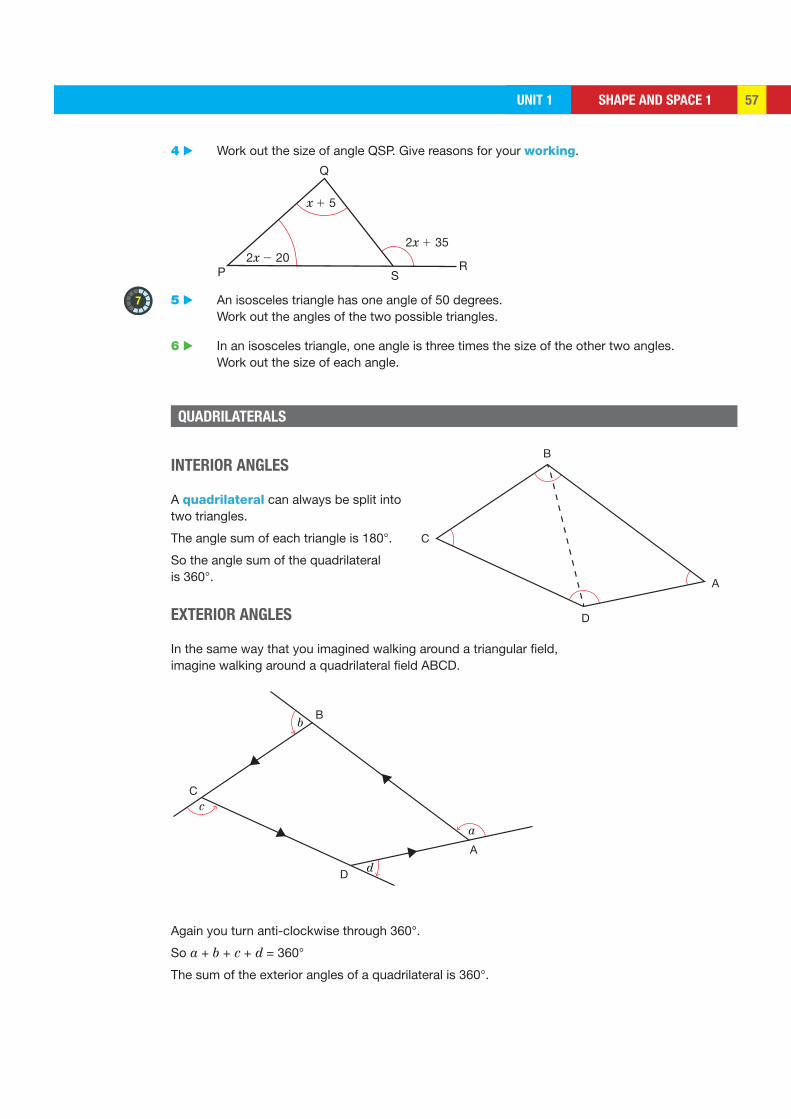
SHAPE AND SPACE 1UNIT 1 57
7
x 1 5
2x 1 352x 2 20
SRP
Q
B
A
D
C
B
A
D
C
b
c
d
a
4 ▶ Work out the size of angle QSP. Give reasons for your working.
5 ▶ An isosceles triangle has one angle of 50 degrees. Work out the angles of the two possible triangles.
6 ▶ In an isosceles triangle, one angle is three times the size of the other two angles. Work out the size of each angle.
QUADRILATERALS
INTERIOR ANGLES
A quadrilateral can always be split into two triangles.
The angle sum of each triangle is 180°.
So the angle sum of the quadrilateral is 360°.
EXTERIOR ANGLES
In the same way that you imagined walking around a triangular field, imagine walking around a quadrilateral field ABCD.
Again you turn anti-clockwise through 360°.
So a + b + c + d = 360°
The sum of the exterior angles of a quadrilateral is 360°.
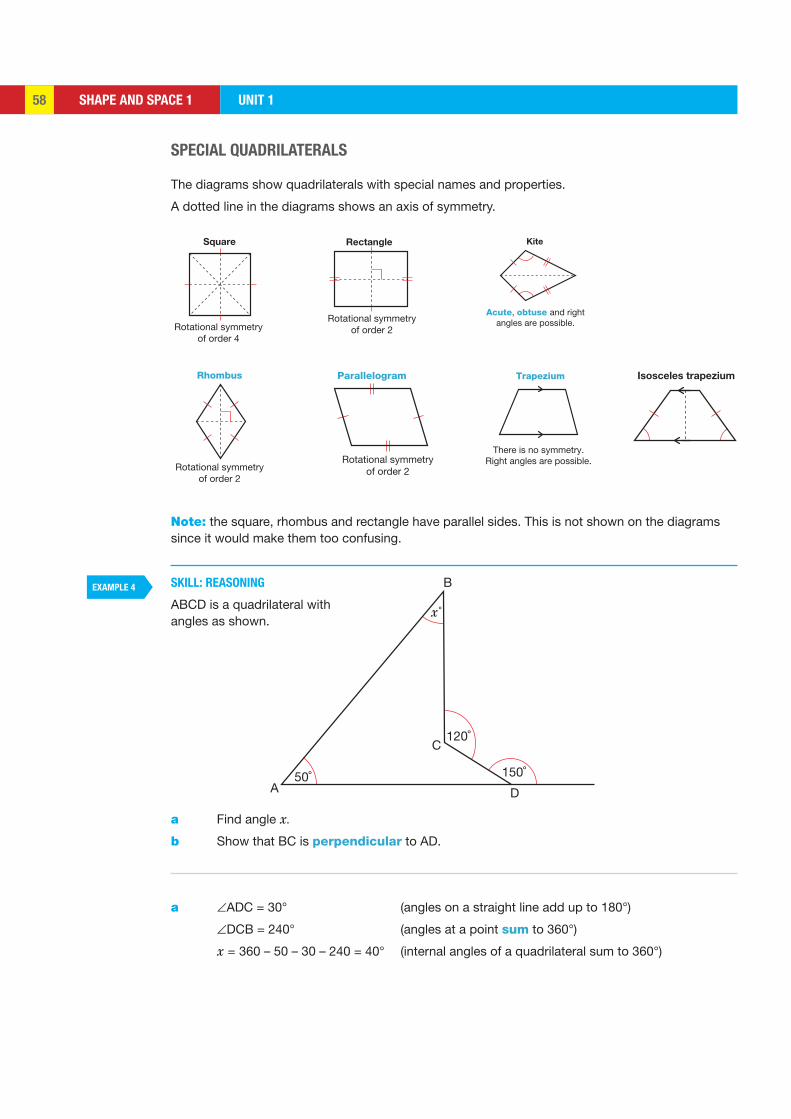
SHAPE AND SPACE 1 UNIT 158
EXAMPLE 4
x˚
50˚
120˚
B
C
DA150˚
Square
Rotational symmetryof order 4
Rhombus
Rotational symmetryof order 2
Rectangle
Rotational symmetryof order 2
Parallelogram
Rotational symmetryof order 2
Kite
Acute, obtuse and rightangles are possible.
Trapezium
There is no symmetry.Right angles are possible.
Isosceles trapezium
SPECIAL QUADRILATERALS
The diagrams show quadrilaterals with special names and properties.
A dotted line in the diagrams shows an axis of symmetry.
Note: the square, rhombus and rectangle have parallel sides. This is not shown on the diagrams since it would make them too confusing.
SKILL: REASONING
ABCD is a quadrilateral with angles as shown.
a Find angle x.
b Show that BC is perpendicular to AD.
a ∠ADC = 30° (angles on a straight line add up to 180°)
∠DCB = 240° (angles at a point sum to 360°)
x = 360 – 50 – 30 – 240 = 40° (internal angles of a quadrilateral sum to 360°)
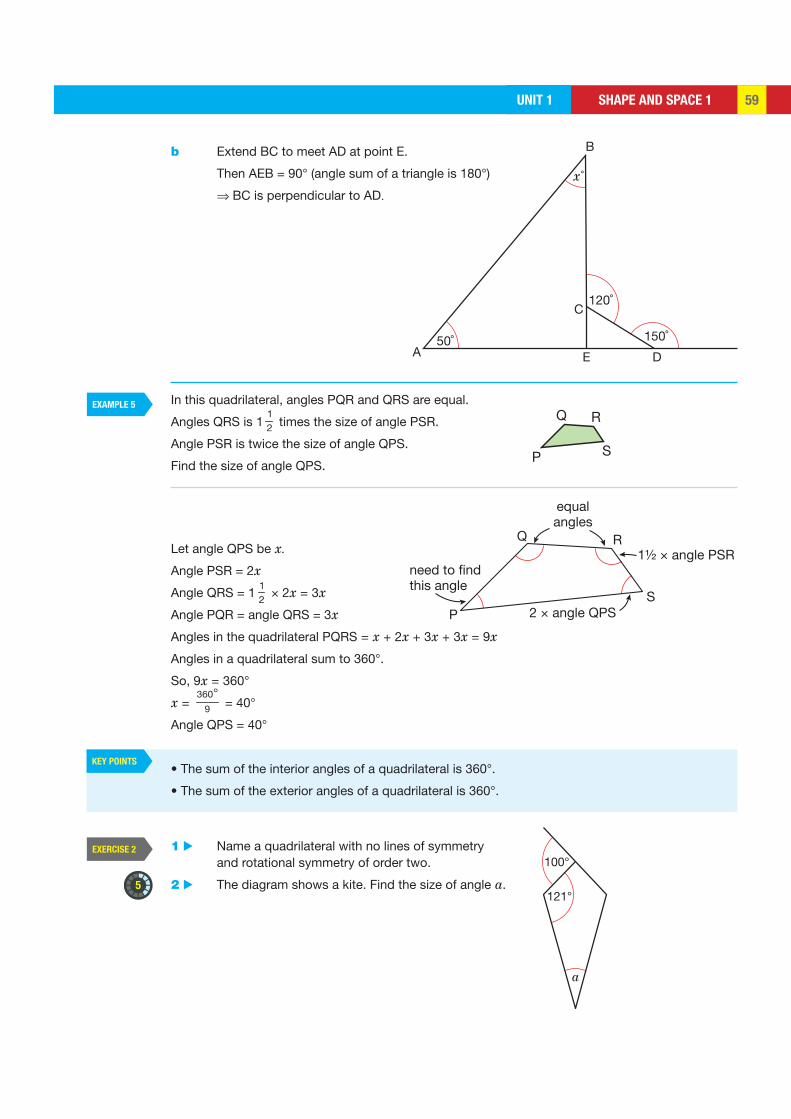
SHAPE AND SPACE 1UNIT 1 59
EXAMPLE 5
KEY POINTS
EXERCISE 2
5
x˚
50˚
120˚
B
C
DEA150˚
RQ
P S
equalangles
Q
PS
R1½ × angle PSR
2 × angle QPS
need to findthis angle
a
100°
121°
b Extend BC to meet AD at point E.
Then AEB = 90° (angle sum of a triangle is 180°)
⇒ BC is perpendicular to AD.
In this quadrilateral, angles PQR and QRS are equal.
Angles QRS is 112 times the size of angle PSR.
Angle PSR is twice the size of angle QPS.
Find the size of angle QPS.
Let angle QPS be x.
Angle PSR = 2x
Angle QRS = 112
× 2x = 3x
Angle PQR = angle QRS = 3x
Angles in the quadrilateral PQRS = x + 2x + 3x + 3x = 9x
Angles in a quadrilateral sum to 360°.
So, 9x = 360°
x = °360
9 = 40°
Angle QPS = 40°
• The sum of the interior angles of a quadrilateral is 360°.
• The sum of the exterior angles of a quadrilateral is 360°.
1 ▶ Name a quadrilateral with no lines of symmetry and rotational symmetry of order two.
2 ▶ The diagram shows a kite. Find the size of angle a.

SHAPE AND SPACE 1 UNIT 160
EXERCISE 2*
6
5
6
45°
100°
103°
65°
B
A
C
A Y
L
K
M
N
Z
X
122°
125°
D
B
C
D
A
3x
x 1 5
x 1 7
x
64°A D E F
CB
x
72°
156°
A B
CEF
D
D C E F132°
BA
3 ▶ Work out the size of
a angle DAB
b ∠AZY
c MNK
4 ▶ Work out the size of angle ABC. Give reasons for your working.
6 ▶ Work out the size of angle ABD. Give reasons for your working.
5 ▶ ABCD is a parallelogram. CDE is an isosceles triangle.
ADEF is a straight line. Angle BAD = 64°. Work out the size of angle CEF.
Give reasons for your working.
1 ▶ Name a quadrilateral with one line of symmetry and no rotational symmetry.
2 ▶ The four angles of a quadrilateral are 90°, 3x + 15°, x + 25° and x + 55°. Find x.
3 ▶ ABCD is an isosceles trapezium. BCE is an isosceles triangle. DCEF is a straight line. Angle BEF = 132°. Work out the size of angle DAB. Give reasons for your working.
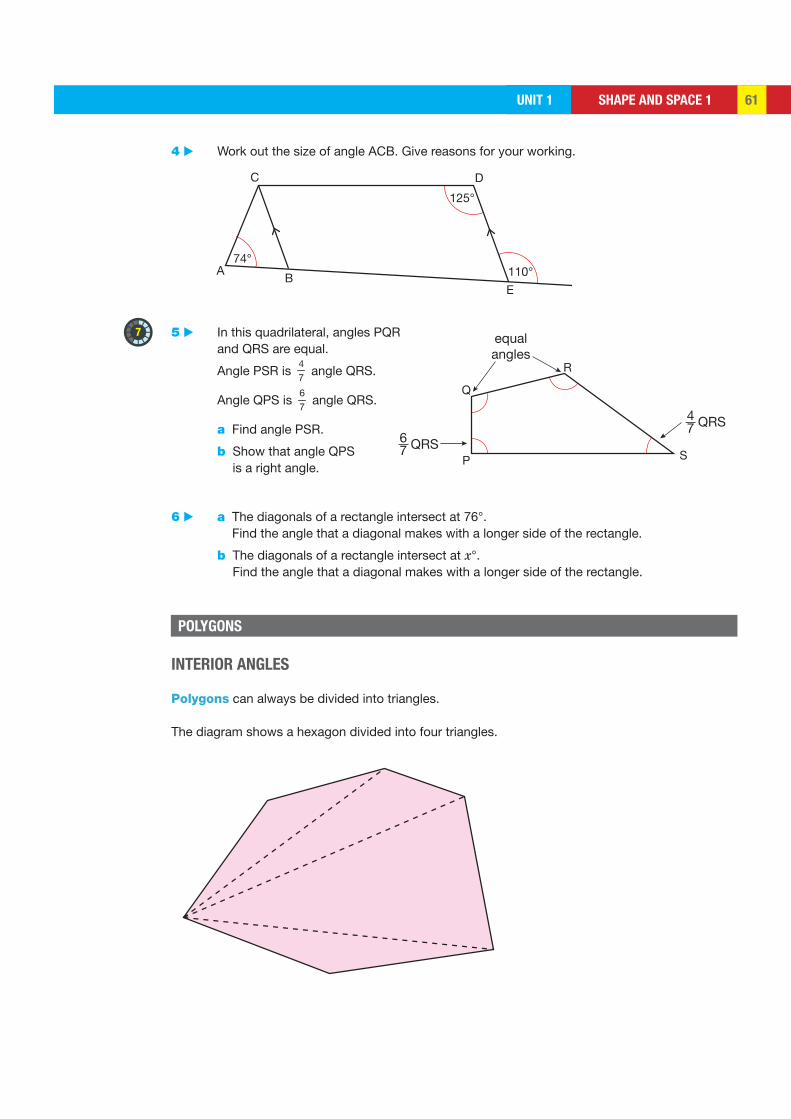
SHAPE AND SPACE 1UNIT 1 61
7
C
A
EB
D
110°
125°
74°
P
Q
R
S
equalangles
QRS67
QRS47
4 ▶ Work out the size of angle ACB. Give reasons for your working.
5 ▶ In this quadrilateral, angles PQR and QRS are equal.
Angle PSR is 47
angle QRS.
Angle QPS is 67
angle QRS.
a Find angle PSR.
b Show that angle QPS is a right angle.
6 ▶ a The diagonals of a rectangle intersect at 76°. Find the angle that a diagonal makes with a longer side of the rectangle.
b The diagonals of a rectangle intersect at x°. Find the angle that a diagonal makes with a longer side of the rectangle.
INTERIOR ANGLES
Polygons can always be divided into triangles.
The diagram shows a hexagon divided into four triangles.
POLYGONS
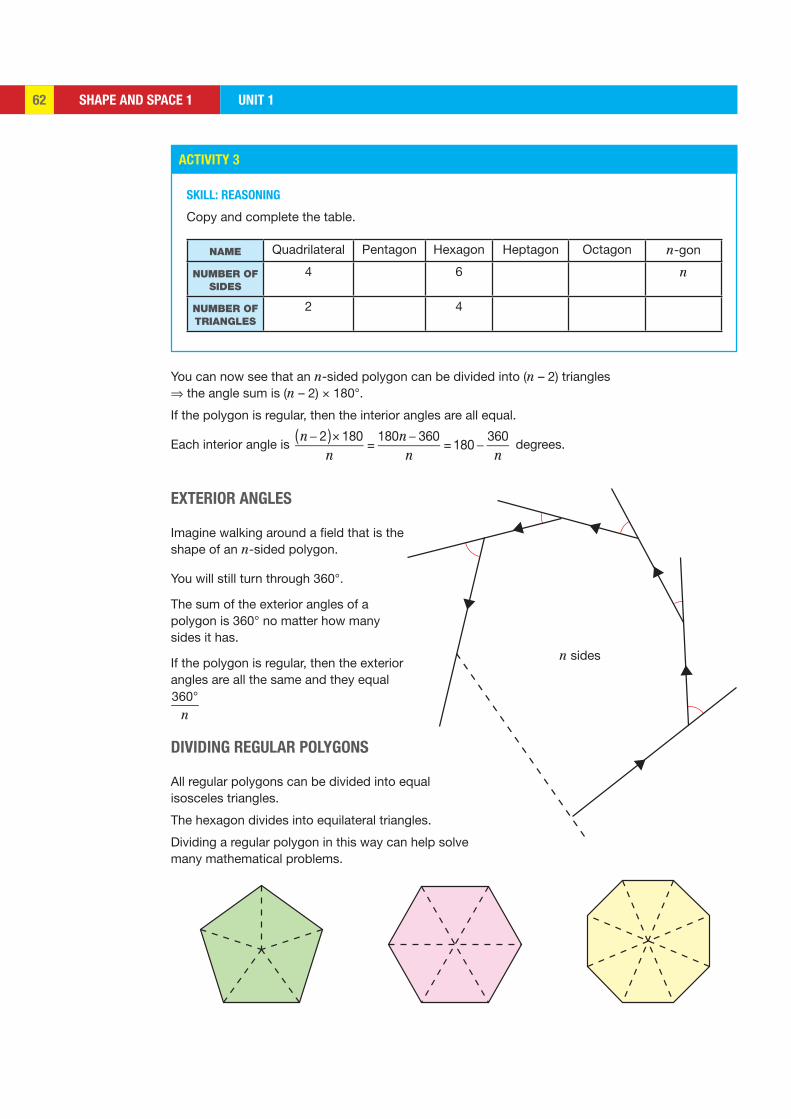
SHAPE AND SPACE 1 UNIT 162
ACTIVITY 3
n sides
SKILL: REASONING
Copy and complete the table.
NAME Quadrilateral Pentagon Hexagon Heptagon Octagon n-gon
NUMBER OF SIDES
4 6 n
NUMBER OF TRIANGLES
2 4
EXTERIOR ANGLES
Imagine walking around a field that is the shape of an n-sided polygon.
You will still turn through 360°.
The sum of the exterior angles of a polygon is 360° no matter how many sides it has.
If the polygon is regular, then the exterior angles are all the same and they equal
°360n
DIVIDING REGULAR POLYGONS
All regular polygons can be divided into equal isosceles triangles.
The hexagon divides into equilateral triangles.
Dividing a regular polygon in this way can help solve many mathematical problems.
You can now see that an n-sided polygon can be divided into (n – 2) triangles ⇒ the angle sum is (n – 2) × 180°.
If the polygon is regular, then the interior angles are all equal.
Each interior angle is n 2( ) 180
n=
180n 360n
= 180360n
× degrees.
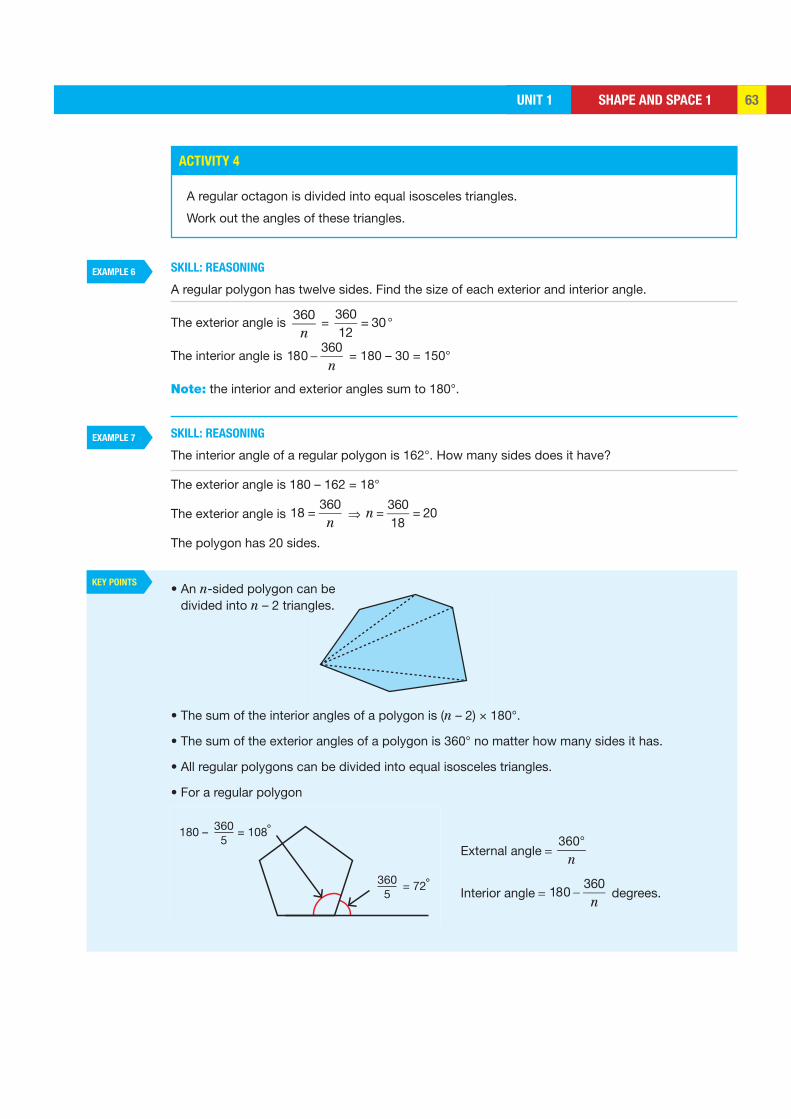
SHAPE AND SPACE 1UNIT 1 63
ACTIVITY 4
EXAMPLE 6
EXAMPLE 7
KEY POINTS
180 – = 108˚3605
= 72˚3605
A regular octagon is divided into equal isosceles triangles.
Work out the angles of these triangles.
SKILL: REASONING
A regular polygon has twelve sides. Find the size of each exterior and interior angle.
The exterior angle is 360n
= 36012
= 30°
The interior angle is 180360n
= 180 – 30 = 150°
Note: the interior and exterior angles sum to 180°.
SKILL: REASONING
The interior angle of a regular polygon is 162°. How many sides does it have?
The exterior angle is 180 – 162 = 18°
The exterior angle is 18 =360n
⇒ n =36018
= 20
The polygon has 20 sides.
• An n-sided polygon can be divided into n – 2 triangles.
• The sum of the interior angles of a polygon is (n – 2) × 180°.
• The sum of the exterior angles of a polygon is 360° no matter how many sides it has.
• All regular polygons can be divided into equal isosceles triangles.
• For a regular polygon
External angle = °360
n
Interior angle = 180360n
degrees.
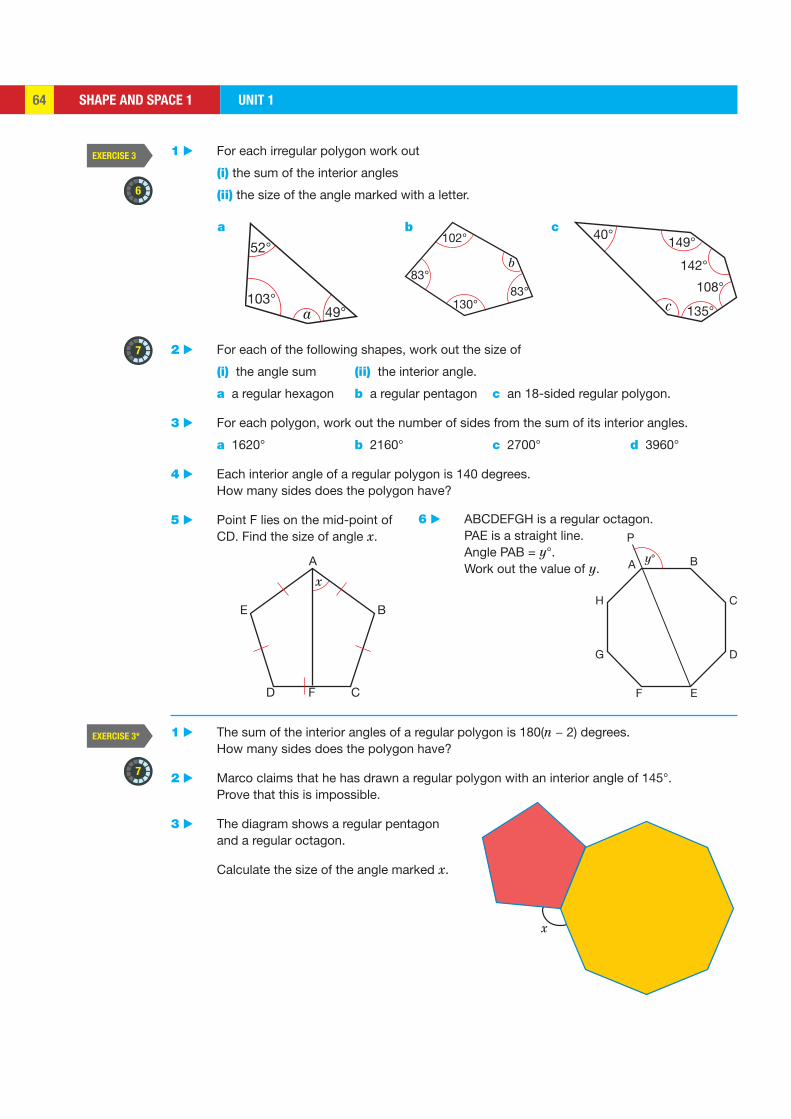
SHAPE AND SPACE 1 UNIT 164
EXERCISE 3
EXERCISE 3*
6
7
7
a
52°
103°49°
b
102°
83°
130°83°
c
40°149°
142°
108°
135°
A
BE
CFD
xA
P
B
EF
C
D
H
G
y°
x
a b c
1 ▶ For each irregular polygon work out
(i) the sum of the interior angles
(ii) the size of the angle marked with a letter.
2 ▶ For each of the following shapes, work out the size of
(i) the angle sum (ii) the interior angle.
a a regular hexagon b a regular pentagon c an 18-sided regular polygon.
3 ▶ For each polygon, work out the number of sides from the sum of its interior angles.
a 1620° b 2160° c 2700° d 3960°
4 ▶ Each interior angle of a regular polygon is 140 degrees. How many sides does the polygon have?
5 ▶ Point F lies on the mid-point of CD. Find the size of angle x.
6 ▶ ABCDEFGH is a regular octagon. PAE is a straight line. Angle PAB = y°.
Work out the value of y.
1 ▶ The sum of the interior angles of a regular polygon is 180(n − 2) degrees. How many sides does the polygon have?
2 ▶ Marco claims that he has drawn a regular polygon with an interior angle of 145°. Prove that this is impossible.
3 ▶ The diagram shows a regular pentagon and a regular octagon.
Calculate the size of the angle marked x.
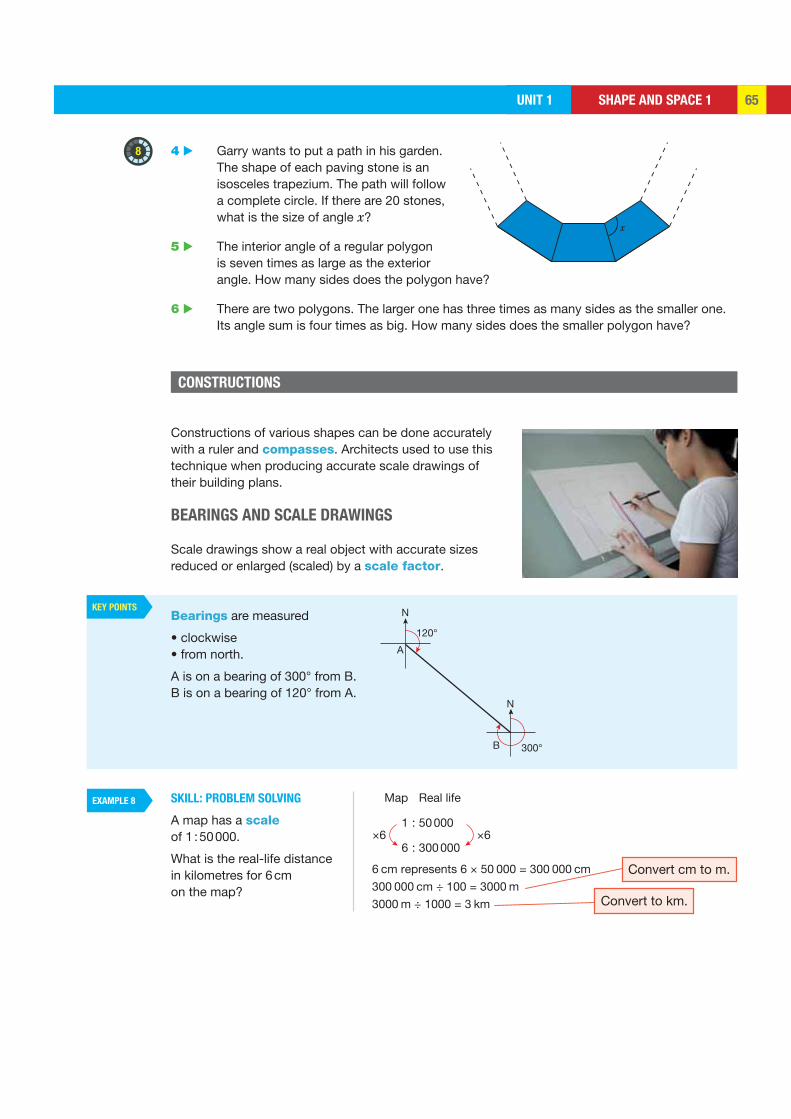
SHAPE AND SPACE 1UNIT 1 65
KEY POINTS
EXAMPLE 8
8
x
120°
300°
A
B
N
N
Map
1
6
:
:×6
Real life
50 000
300 000
6 cm represents 6 × 50 000 = 300 000 cm300 000 cm ÷ 100 = 3000 m3000 m ÷ 1000 = 3 km
×6
Convert cm to m.
Convert to km.
4 ▶ Garry wants to put a path in his garden. The shape of each paving stone is an isosceles trapezium. The path will follow a complete circle. If there are 20 stones, what is the size of angle x?
5 ▶ The interior angle of a regular polygon is seven times as large as the exterior angle. How many sides does the polygon have?
6 ▶ There are two polygons. The larger one has three times as many sides as the smaller one. Its angle sum is four times as big. How many sides does the smaller polygon have?
CONSTRUCTIONS
Constructions of various shapes can be done accurately with a ruler and compasses. Architects used to use this technique when producing accurate scale drawings of their building plans.
BEARINGS AND SCALE DRAWINGS
Scale drawings show a real object with accurate sizes reduced or enlarged (scaled) by a scale factor.
Bearings are measured
• clockwise• from north.
A is on a bearing of 300° from B.B is on a bearing of 120° from A.
SKILL: PROBLEM SOLVING
A map has a scale of 1 : 50 000.
What is the real-life distance in kilometres for 6 cm on the map?
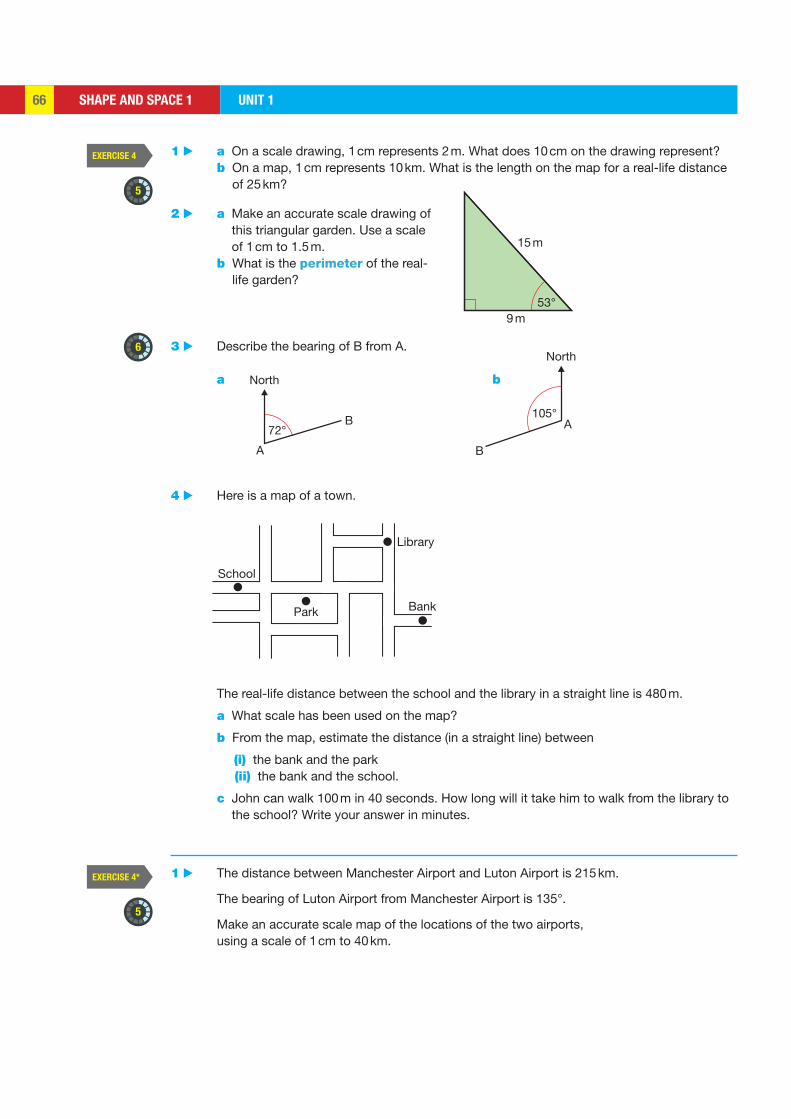
SHAPE AND SPACE 1 UNIT 166
EXERCISE 4
EXERCISE 4*
5
6
5
9 m
15 m
53°
72°
A
B
North
105°A
B
North
Library
BankPark
School
1 ▶ a On a scale drawing, 1 cm represents 2 m. What does 10 cm on the drawing represent? b On a map, 1 cm represents 10 km. What is the length on the map for a real-life distance
of 25 km?
2 ▶ a Make an accurate scale drawing of this triangular garden. Use a scale of 1 cm to 1.5 m.
b What is the perimeter of the real-life garden?
3 ▶ Describe the bearing of B from A.
a b
4 ▶ Here is a map of a town.
The real-life distance between the school and the library in a straight line is 480 m.
a What scale has been used on the map?
b From the map, estimate the distance (in a straight line) between
(i) the bank and the park (ii) the bank and the school.
c John can walk 100 m in 40 seconds. How long will it take him to walk from the library to the school? Write your answer in minutes.
1 ▶ The distance between Manchester Airport and Luton Airport is 215 km.
The bearing of Luton Airport from Manchester Airport is 135°.
Make an accurate scale map of the locations of the two airports, using a scale of 1 cm to 40 km.
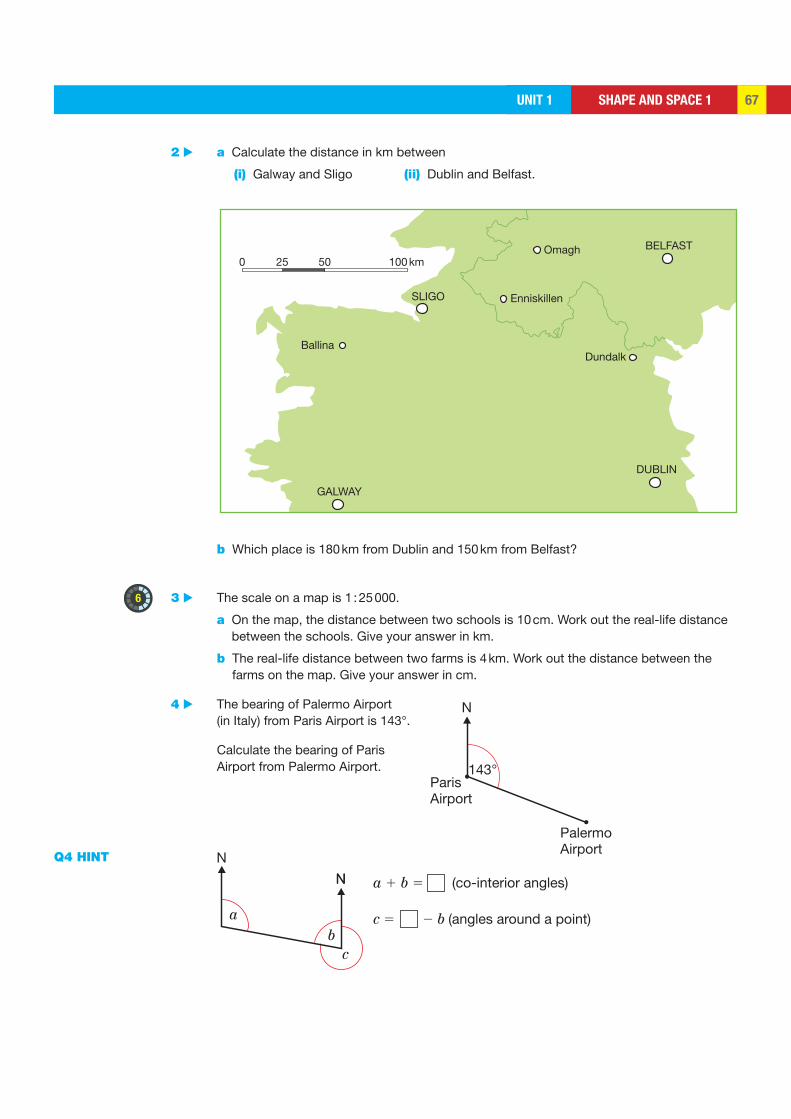
SHAPE AND SPACE 1UNIT 1 67
6
0 25 50 100 km
DUBLIN
Enniskillen
Omagh
DundalkBallina
BELFAST
GALWAY
SLIGO
143°
N
ParisAirport
PalermoAirport
a 1 b 5 (co-interior angles)
ab
c
NN
N
c 5 2 b (angles around a point)
2 ▶ a Calculate the distance in km between
(i) Galway and Sligo (ii) Dublin and Belfast.
b Which place is 180 km from Dublin and 150 km from Belfast?
3 ▶ The scale on a map is 1 : 25 000.
a On the map, the distance between two schools is 10 cm. Work out the real-life distance between the schools. Give your answer in km.
b The real-life distance between two farms is 4 km. Work out the distance between the farms on the map. Give your answer in cm.
4 ▶ The bearing of Palermo Airport (in Italy) from Paris Airport is 143°.
Calculate the bearing of Paris Airport from Palermo Airport.
Q4 HINT
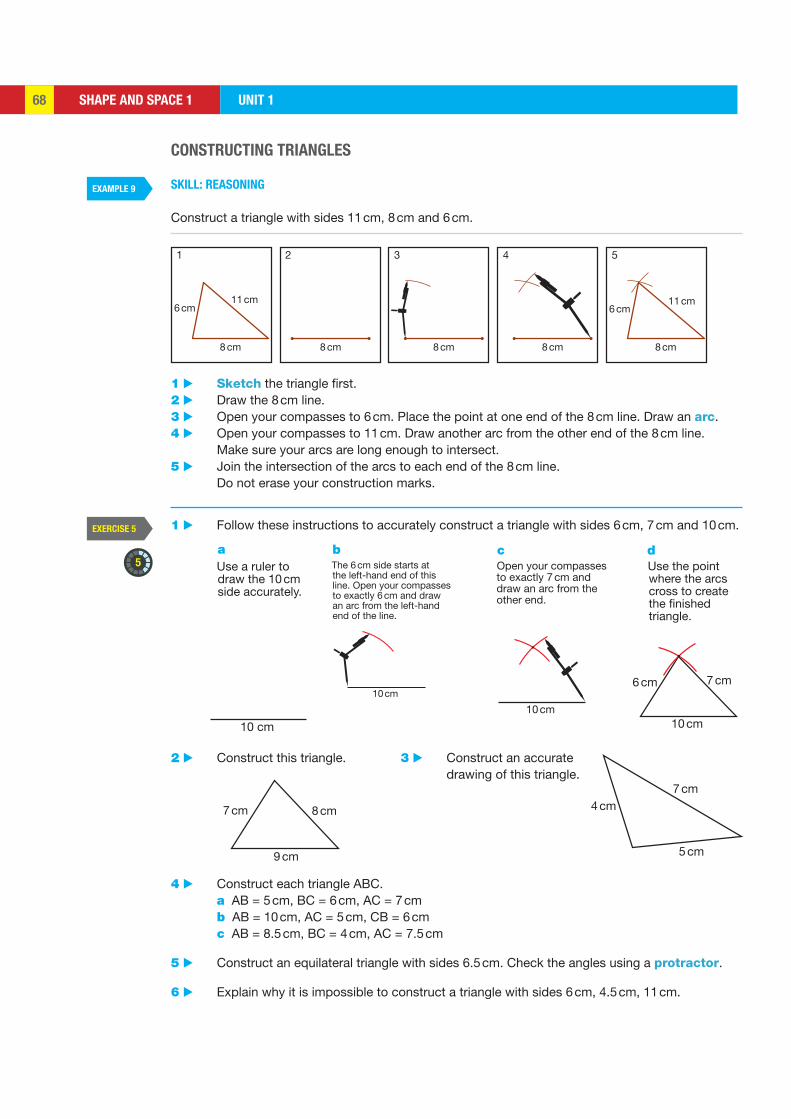
SHAPE AND SPACE 1 UNIT 168
EXAMPLE 9
EXERCISE 5
5
8 cm
2 3 4 5
8 cm 8 cm 8 cm
11 cm6 cm
1
8 cm
11 cm6 cm
10 cm
Use a ruler todraw the 10 cm
side accurately.
10 cm
The 6 cm side starts atthe left-hand end of this
line. Open your compasses to exactly 6 cm and draw an arc from the left-hand end of the line.
10 cm
Open your compassesto exactly 7 cm and
draw an arc from the other end.
10 cm
7 cm6 cm
Use the point where the arcs cross to create the finished triangle.
9 cm
8 cm7 cm
7 cm4 cm
5 cm
CONSTRUCTING TRIANGLES
SKILL: REASONING
Construct a triangle with sides 11 cm, 8 cm and 6 cm.
1 ▶ Sketch the triangle first.2 ▶ Draw the 8 cm line.3 ▶ Open your compasses to 6 cm. Place the point at one end of the 8 cm line. Draw an arc.4 ▶ Open your compasses to 11 cm. Draw another arc from the other end of the 8 cm line.
Make sure your arcs are long enough to intersect.5 ▶ Join the intersection of the arcs to each end of the 8 cm line.
Do not erase your construction marks.
1 ▶ Follow these instructions to accurately construct a triangle with sides 6 cm, 7 cm and 10 cm.
a b c d
2 ▶ Construct this triangle. 3 ▶ Construct an accurate drawing of this triangle.
4 ▶ Construct each triangle ABC. a AB = 5 cm, BC = 6 cm, AC = 7 cm b AB = 10 cm, AC = 5 cm, CB = 6 cm c AB = 8.5 cm, BC = 4 cm, AC = 7.5 cm
5 ▶ Construct an equilateral triangle with sides 6.5 cm. Check the angles using a protractor.
6 ▶ Explain why it is impossible to construct a triangle with sides 6 cm, 4.5 cm, 11 cm.
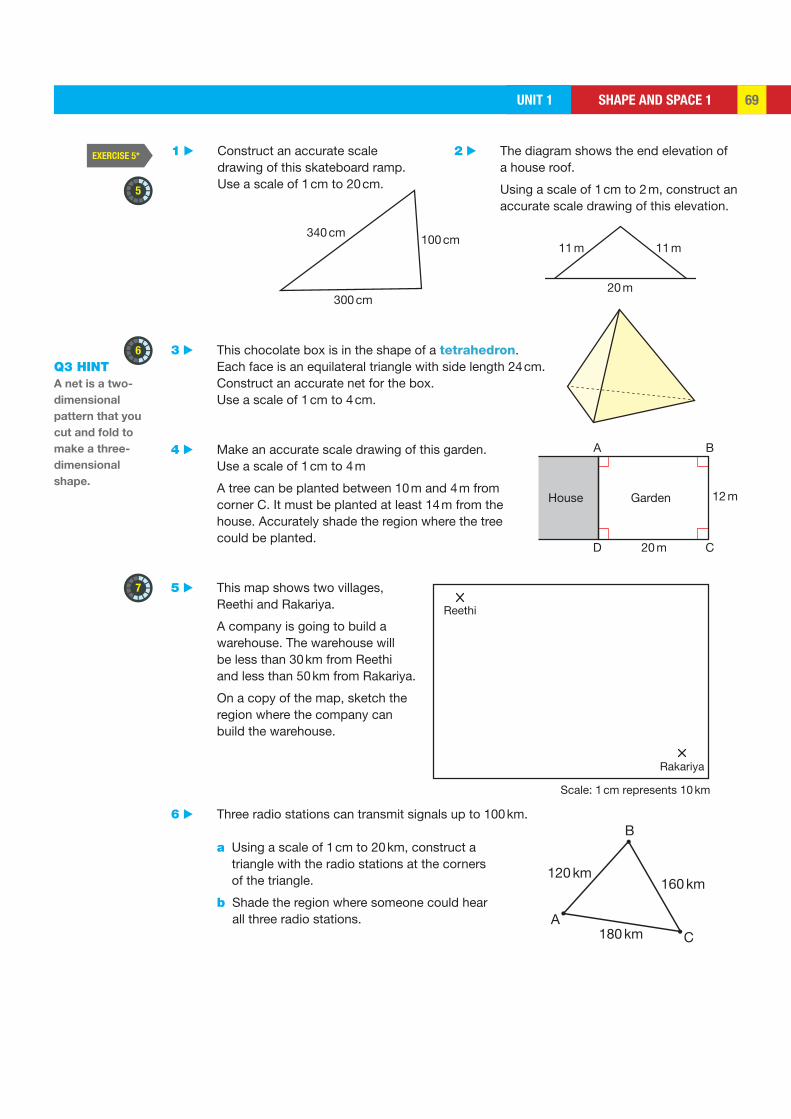
SHAPE AND SPACE 1UNIT 1 69
EXERCISE 5*
5
6
340 cm100 cm
300 cm
11 m 11 m
20 m
House Garden
A B
D C20 m
12 m
Reethi
Scale: 1 cm represents 10 km
Rakariya
180 kmA
C
B
120 km160 km
7
1 ▶ Construct an accurate scale drawing of this skateboard ramp. Use a scale of 1 cm to 20 cm.
2 ▶ The diagram shows the end elevation of a house roof.
Using a scale of 1 cm to 2 m, construct an accurate scale drawing of this elevation.
3 ▶ This chocolate box is in the shape of a tetrahedron. Each face is an equilateral triangle with side length 24 cm. Construct an accurate net for the box.
Use a scale of 1 cm to 4 cm.
4 ▶ Make an accurate scale drawing of this garden. Use a scale of 1 cm to 4 m
A tree can be planted between 10 m and 4 m from corner C. It must be planted at least 14 m from the house. Accurately shade the region where the tree could be planted.
5 ▶ This map shows two villages, Reethi and Rakariya.
A company is going to build a warehouse. The warehouse will be less than 30 km from Reethi and less than 50 km from Rakariya.
On a copy of the map, sketch the region where the company can build the warehouse.
6 ▶ Three radio stations can transmit signals up to 100 km.
a Using a scale of 1 cm to 20 km, construct a triangle with the radio stations at the corners of the triangle.
b Shade the region where someone could hear all three radio stations.
Q3 HINT A net is a two-
dimensional
pattern that you
cut and fold to
make a three-
dimensional
shape.
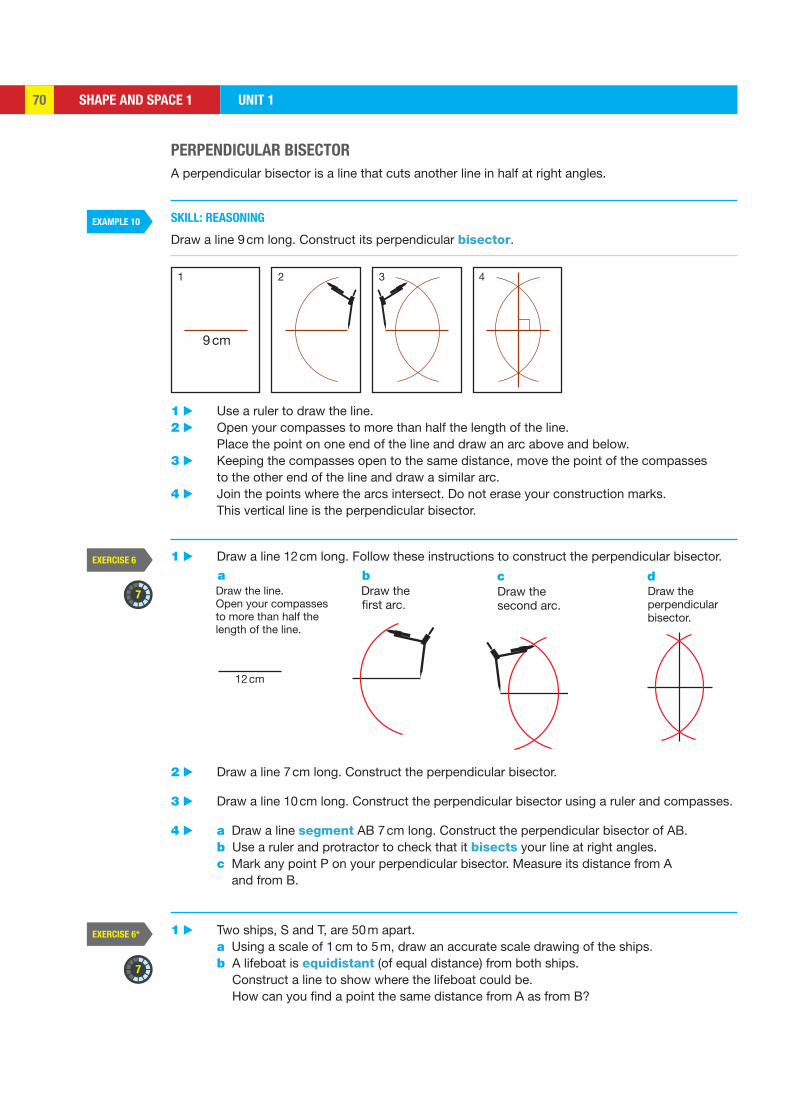
SHAPE AND SPACE 1 UNIT 170
EXAMPLE 10
EXERCISE 6
EXERCISE 6*
7
7
9 cm
1 2 3 4
Draw the line. Open your compasses to more than half the length of the line.
12 cm
Draw the first arc.
Draw the second arc.
Draw the perpendicular bisector.
PERPENDICULAR BISECTOR
A perpendicular bisector is a line that cuts another line in half at right angles.
SKILL: REASONING
Draw a line 9 cm long. Construct its perpendicular bisector.
1 ▶ Use a ruler to draw the line.2 ▶ Open your compasses to more than half the length of the line. Place the point on one end of the line and draw an arc above and below.3 ▶ Keeping the compasses open to the same distance, move the point of the compasses
to the other end of the line and draw a similar arc.4 ▶ Join the points where the arcs intersect. Do not erase your construction marks.
This vertical line is the perpendicular bisector.
1 ▶ Draw a line 12 cm long. Follow these instructions to construct the perpendicular bisector.
2 ▶ Draw a line 7 cm long. Construct the perpendicular bisector.
3 ▶ Draw a line 10 cm long. Construct the perpendicular bisector using a ruler and compasses.
4 ▶ a Draw a line segment AB 7 cm long. Construct the perpendicular bisector of AB. b Use a ruler and protractor to check that it bisects your line at right angles. c Mark any point P on your perpendicular bisector. Measure its distance from A
and from B.
1 ▶ Two ships, S and T, are 50 m apart. a Using a scale of 1 cm to 5 m, draw an accurate scale drawing of the ships. b A lifeboat is equidistant (of equal distance) from both ships.
Construct a line to show where the lifeboat could be. How can you find a point the same distance from A as from B?
a b c d
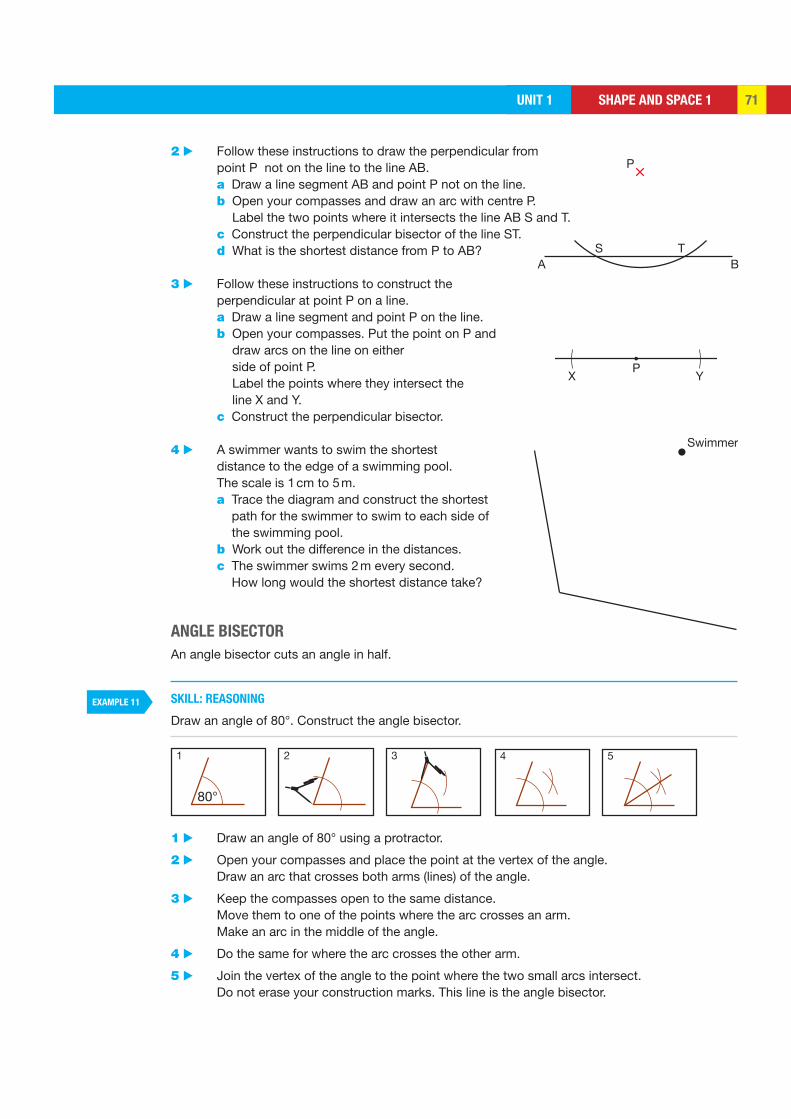
SHAPE AND SPACE 1UNIT 1 71
EXAMPLE 11
P
S TBA
XP
Y
Swimmer
80°
21 53 4
2 ▶ Follow these instructions to draw the perpendicular from point P not on the line to the line AB.
a Draw a line segment AB and point P not on the line. b Open your compasses and draw an arc with centre P.
Label the two points where it intersects the line AB S and T. c Construct the perpendicular bisector of the line ST. d What is the shortest distance from P to AB?
3 ▶ Follow these instructions to construct the perpendicular at point P on a line.
a Draw a line segment and point P on the line. b Open your compasses. Put the point on P and
draw arcs on the line on either side of point P. Label the points where they intersect the line X and Y.
c Construct the perpendicular bisector.
4 ▶ A swimmer wants to swim the shortest distance to the edge of a swimming pool. The scale is 1 cm to 5 m.
a Trace the diagram and construct the shortest path for the swimmer to swim to each side of the swimming pool.
b Work out the difference in the distances. c The swimmer swims 2 m every second.
How long would the shortest distance take?
ANGLE BISECTOR
An angle bisector cuts an angle in half.
SKILL: REASONING
Draw an angle of 80°. Construct the angle bisector.
1 ▶ Draw an angle of 80° using a protractor.
2 ▶ Open your compasses and place the point at the vertex of the angle. Draw an arc that crosses both arms (lines) of the angle.
3 ▶ Keep the compasses open to the same distance. Move them to one of the points where the arc crosses an arm. Make an arc in the middle of the angle.
4 ▶ Do the same for where the arc crosses the other arm.
5 ▶ Join the vertex of the angle to the point where the two small arcs intersect. Do not erase your construction marks. This line is the angle bisector.
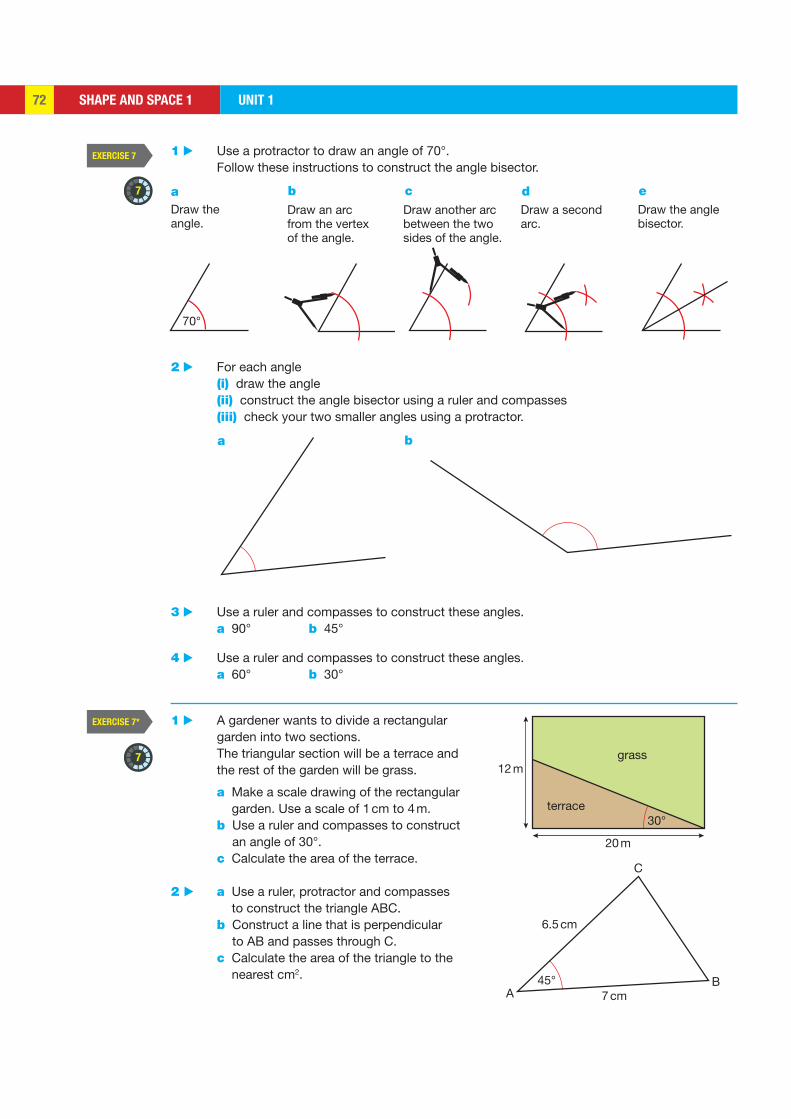
SHAPE AND SPACE 1 UNIT 172
EXERCISE 7
EXERCISE 7*
7
7
Draw the angle.
70°
Draw an arcfrom the vertexof the angle.
Draw another arcbetween the twosides of the angle.
Draw a second arc.
Draw the anglebisector.
30°terrace
20 m
12 mgrass
6.5 cm
7 cm45°
AB
C
1 ▶ Use a protractor to draw an angle of 70°. Follow these instructions to construct the angle bisector.
a
a b
b c d e
2 ▶ For each angle (i) draw the angle (ii) construct the angle bisector using a ruler and compasses (iii) check your two smaller angles using a protractor.
3 ▶ Use a ruler and compasses to construct these angles. a 90° b 45°
4 ▶ Use a ruler and compasses to construct these angles. a 60° b 30°
1 ▶ A gardener wants to divide a rectangular garden into two sections. The triangular section will be a terrace and the rest of the garden will be grass.
a Make a scale drawing of the rectangular garden. Use a scale of 1 cm to 4 m.
b Use a ruler and compasses to construct an angle of 30°.
c Calculate the area of the terrace.
2 ▶ a Use a ruler, protractor and compasses to construct the triangle ABC.
b Construct a line that is perpendicular to AB and passes through C.
c Calculate the area of the triangle to the nearest cm2.
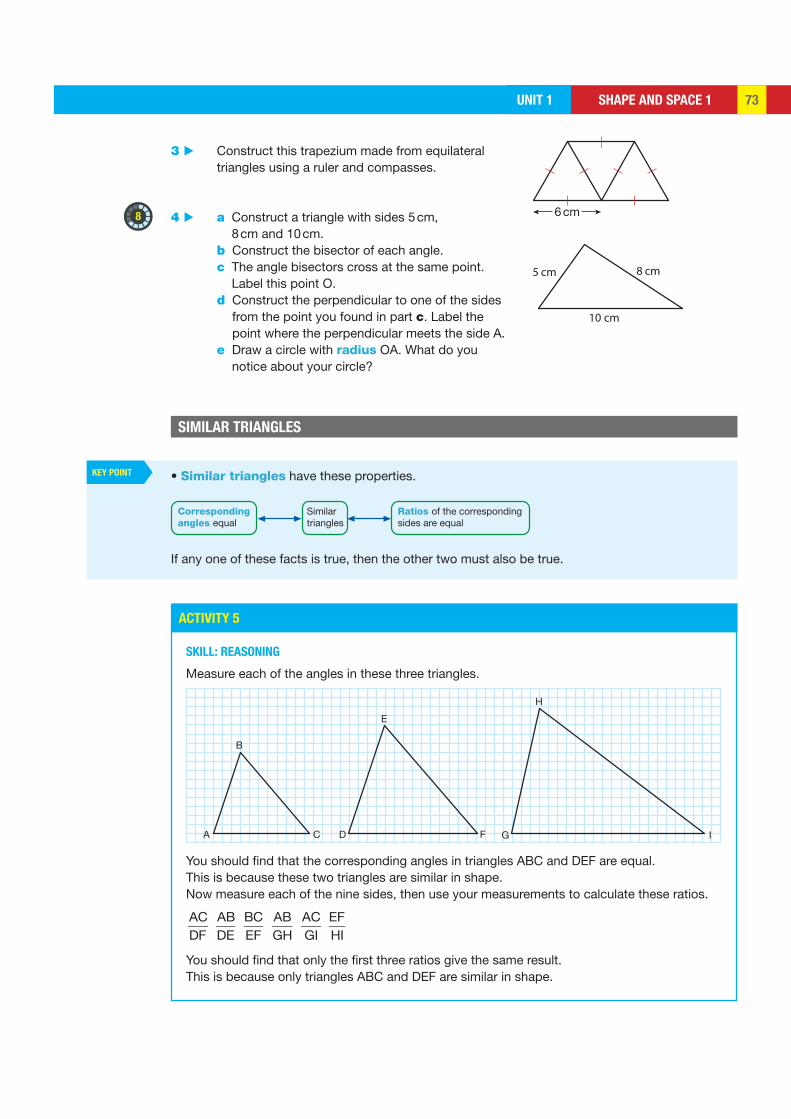
SHAPE AND SPACE 1UNIT 1 73
KEY POINT
ACTIVITY 5
8 6 cm
8 cm5 cm
10 cm
Correspondingangles equal
Similartriangles
Ratios of the correspondingsides are equal
B
A C D F
E
H
G I
• Similar triangles have these properties.
If any one of these facts is true, then the other two must also be true.
3 ▶ Construct this trapezium made from equilateral triangles using a ruler and compasses.
4 ▶ a Construct a triangle with sides 5 cm, 8 cm and 10 cm.
b Construct the bisector of each angle. c The angle bisectors cross at the same point.
Label this point O. d Construct the perpendicular to one of the sides
from the point you found in part c. Label the point where the perpendicular meets the side A.
e Draw a circle with radius OA. What do you notice about your circle?
SIMILAR TRIANGLES
SKILL: REASONING
Measure each of the angles in these three triangles.
You should find that the corresponding angles in triangles ABC and DEF are equal.This is because these two triangles are similar in shape.Now measure each of the nine sides, then use your measurements to calculate these ratios.
ACDF
ABDE
BCEF
ABGH
ACGI
EFHI
You should find that only the first three ratios give the same result. This is because only triangles ABC and DEF are similar in shape.
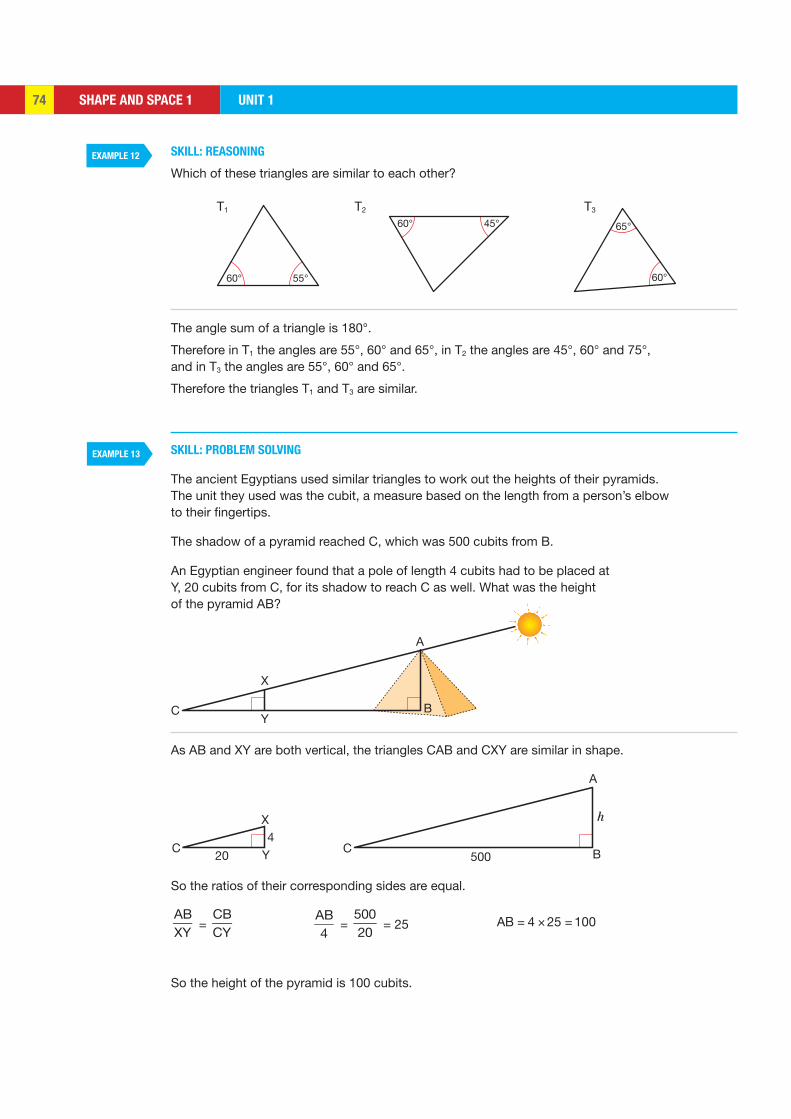
SHAPE AND SPACE 1 UNIT 174
EXAMPLE 12
EXAMPLE 13
55°60°
Y
X
C B
A
X4
YC20
C500
h
B
A
45°60° 65°
60°
SKILL: REASONING
Which of these triangles are similar to each other?
T1 T2 T3
The angle sum of a triangle is 180°.
Therefore in T1 the angles are 55°, 60° and 65°, in T2 the angles are 45°, 60° and 75°, and in T3 the angles are 55°, 60° and 65°.
Therefore the triangles T1 and T3 are similar.
SKILL: PROBLEM SOLVING
The ancient Egyptians used similar triangles to work out the heights of their pyramids. The unit they used was the cubit, a measure based on the length from a person’s elbow to their fingertips.
The shadow of a pyramid reached C, which was 500 cubits from B.
An Egyptian engineer found that a pole of length 4 cubits had to be placed at Y, 20 cubits from C, for its shadow to reach C as well. What was the height of the pyramid AB?
As AB and XY are both vertical, the triangles CAB and CXY are similar in shape.
So the ratios of their corresponding sides are equal.
ABXY
= CBCY
AB4
= 50020
= 25 = × =AB 4 25 100
So the height of the pyramid is 100 cubits.

SHAPE AND SPACE 1UNIT 1 75
EXAMPLE 14
ACTIVITY 6
R Y
X
Mirror
B
A
x
y
6 412
8
C
E
D
F
B
A
SKILL: ADAPTIVE LEARNING
To find the height of a wall AB, place a mirror on the ground at any point R.
An observer stands in line with the wall at point Y so that the top of the wall can be seen in the mirror.
Explain why the triangles ABR and YXR are similar in shape.
Show that the ratio of the corresponding sides is given by
ABXY
=ARRY
Use this method to find out the height of your classroom or some other tall object.
Repeat the experiment by placing the mirror in various positions. Describe your method, and comment on the accuracy of your results.
Use the method of Example 13 to check some of your measurements. Compare the two methods.
SKILL: REASONING
Find x and y.
 = Ê, B = F, Ĉ = D Therefore △ ABC is similar to △ DEF.
⇒ AB AC BC
= = EF DE DF
⇒ 68
= 4y
= x
12 Corresponding sides are in the same ratio.
⇒ 68
= x
12 ⇒ 6 12 = 8 x× × ⇒ x = 9
⇒ 68
= 4y
⇒ 6 × y = 8 4× ⇒ y = 513
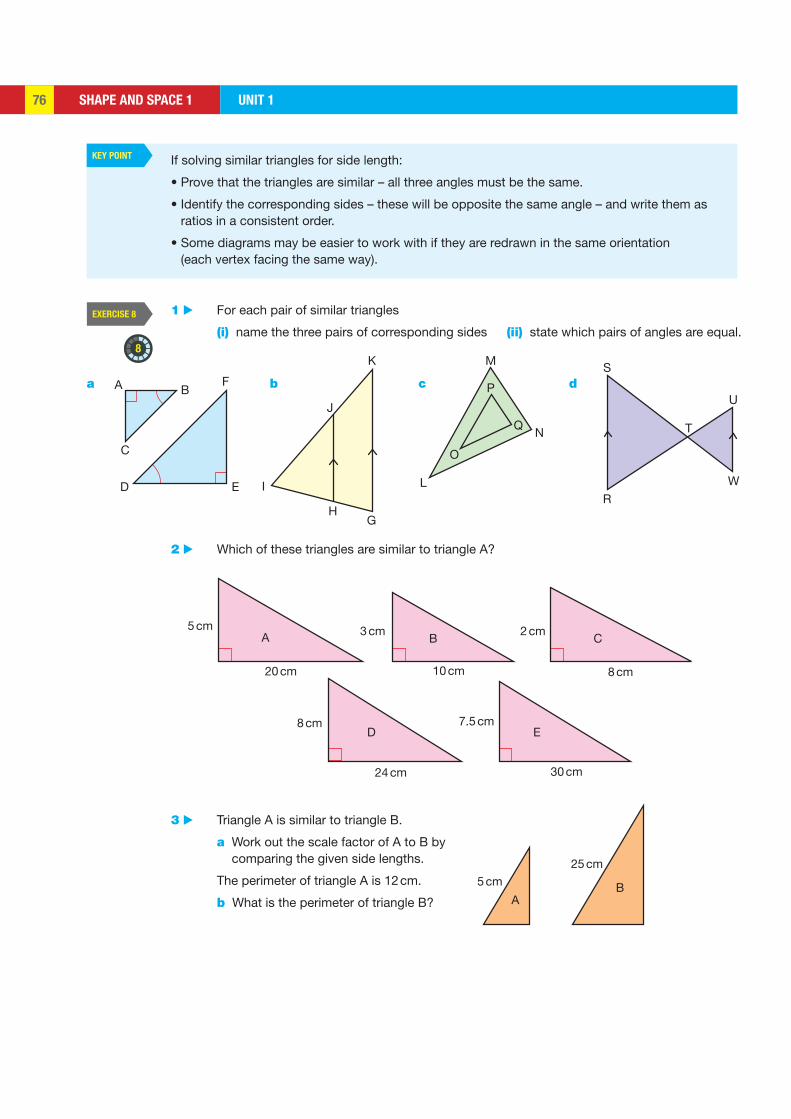
SHAPE AND SPACE 1 UNIT 176
KEY POINT
EXERCISE 8
8
F
E
C
A B
D
K
J
I
HG
N
L
O
Q
P
M
U
T
S
RW
20 cm
5 cmA
10 cm
3 cmB
8 cm
2 cmC
24 cm
8 cmD
30 cm
7.5 cmE
5 cm
A
25 cm
B
If solving similar triangles for side length:
• Prove that the triangles are similar – all three angles must be the same.
• Identify the corresponding sides – these will be opposite the same angle – and write them as ratios in a consistent order.
• Some diagrams may be easier to work with if they are redrawn in the same orientation (each vertex facing the same way).
a b c d
1 ▶ For each pair of similar triangles
(i) name the three pairs of corresponding sides (ii) state which pairs of angles are equal.
2 ▶ Which of these triangles are similar to triangle A?
3 ▶ Triangle A is similar to triangle B.
a Work out the scale factor of A to B by comparing the given side lengths.
The perimeter of triangle A is 12 cm.
b What is the perimeter of triangle B?
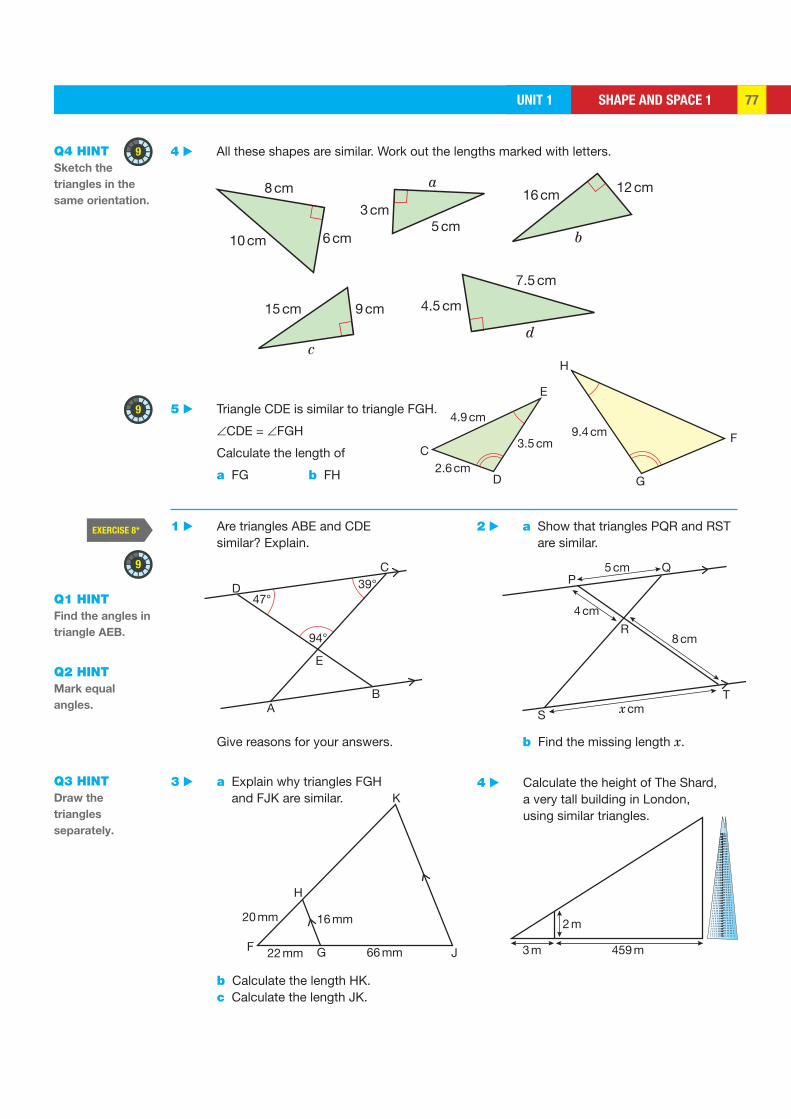
SHAPE AND SPACE 1UNIT 1 77
EXERCISE 8*
9
9
9
8 cm
6 cm
3 cm5 cm
9 cm15 cm 4.5 cm
7.5 cm
16 cm 12 cm
10 cm
a
b
cd
2.6 cm
3.5 cm
E
4.9 cm
C
D
47°
94°
39°
AB
E
D
C
S
T
R
PQ
8 cm
x cm
4 cm
5 cm
H
F G
K
16 mm
66 mm22 mm
20 mm
J
2 m
3 m 459 m
9.4 cm
G
F
H
5 ▶ Triangle CDE is similar to triangle FGH.
∠CDE = ∠FGH
Calculate the length of
a FG b FH
1 ▶ Are triangles ABE and CDE similar? Explain.
Give reasons for your answers.
2 ▶ a Show that triangles PQR and RST are similar.
b Find the missing length x.
3 ▶ a Explain why triangles FGH and FJK are similar.
b Calculate the length HK. c Calculate the length JK.
4 ▶ Calculate the height of The Shard, a very tall building in London, using similar triangles.
Q4 HINT Sketch the
triangles in the
same orientation.
Q1 HINT Find the angles in
triangle AEB.
Q2 HINT Mark equal
angles.
Q3 HINT Draw the
triangles
separately.
4 ▶ All these shapes are similar. Work out the lengths marked with letters.
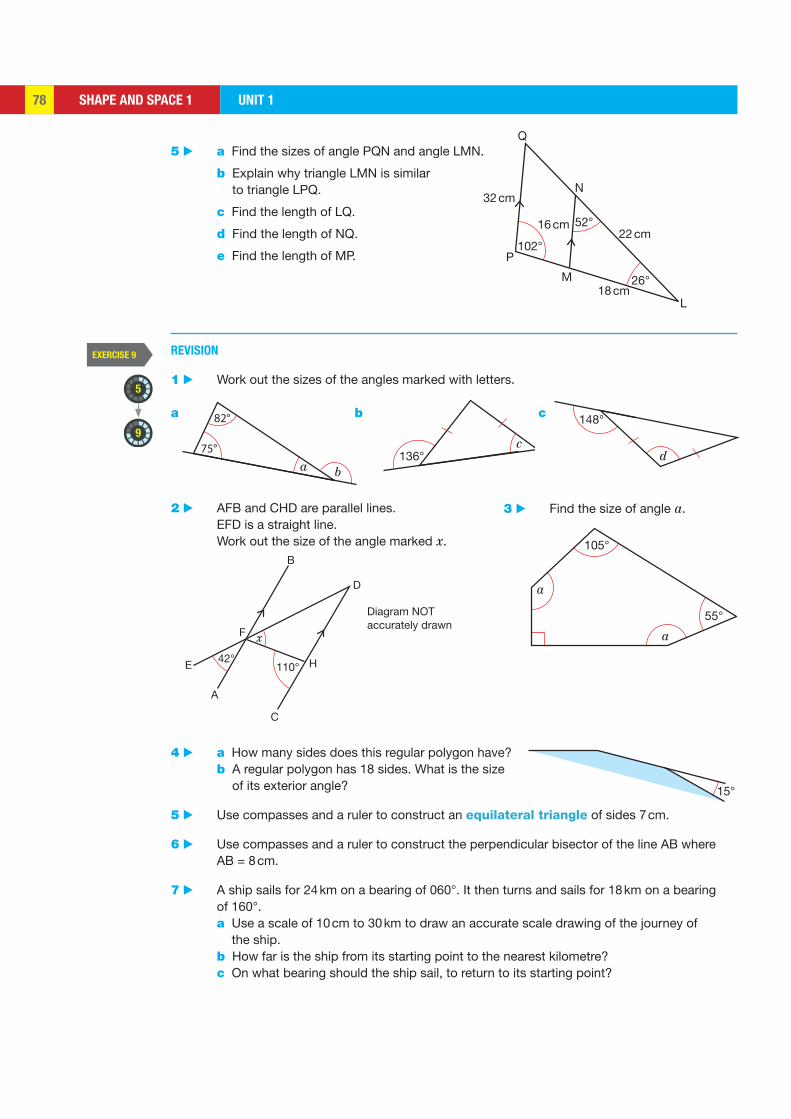
SHAPE AND SPACE 1 UNIT 178
EXERCISE 9
5
9
52°
102°
26°
L
M
P
N
Q
16 cm22 cm
18 cm
32 cm
a b
75°
82°
c136° d
148°
x
42°110°
A
B
C
D
HE
F
Diagram NOTaccurately drawn
105°
55°
a
a
15°
5 ▶ a Find the sizes of angle PQN and angle LMN.
b Explain why triangle LMN is similar to triangle LPQ.
c Find the length of LQ.
d Find the length of NQ.
e Find the length of MP.
REVISION
1 ▶ Work out the sizes of the angles marked with letters.
a b c
2 ▶ AFB and CHD are parallel lines. EFD is a straight line. Work out the size of the angle marked x.
3 ▶ Find the size of angle a.
4 ▶ a How many sides does this regular polygon have? b A regular polygon has 18 sides. What is the size
of its exterior angle?
5 ▶ Use compasses and a ruler to construct an equilateral triangle of sides 7 cm.
6 ▶ Use compasses and a ruler to construct the perpendicular bisector of the line AB where AB = 8 cm.
7 ▶ A ship sails for 24 km on a bearing of 060°. It then turns and sails for 18 km on a bearing of 160°.
a Use a scale of 10 cm to 30 km to draw an accurate scale drawing of the journey of the ship.
b How far is the ship from its starting point to the nearest kilometre? c On what bearing should the ship sail, to return to its starting point?

SHAPE AND SPACE 1UNIT 1 79
EXERCISE 9*
6
9
E
A B
D
12 cm
35 cm
30 cm
21 cm C
(x + 30)°
2(x – 30)°
x°
x°
AB
C DE
A D
EB C
110°2x
2x 2 50
x 1 40
x
A
G
105°F
E
DC
BH
I
8 ▶ a Prove that triangle ABE is similar to triangle ACD.
b Work out length CD.
REVISION
1 ▶ Triangle BDC is an isosceles triangle. Triangle ACE is a right-angled triangle.
Show that triangle ABC is an equilateral triangle.
2 ▶ AB, BC and CD are three sides of a regular octagon.
Find the size of angle BAC. Give reasons for your answer.
3 ▶ Work out the size of each unknown exterior angle in this polygon.
4 ▶ One side of a regular hexagon ABCDEF forms the side of a regular polygon with n sides.
Angle GAF = 105°. Work out the value of n.
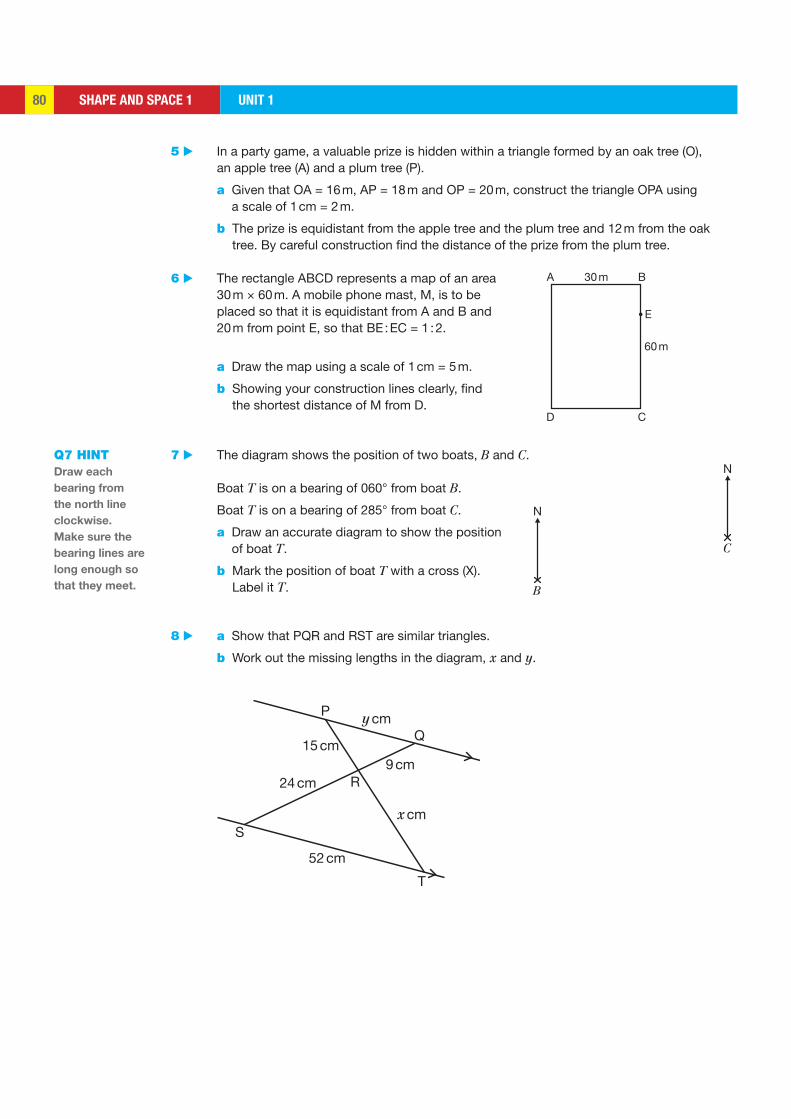
SHAPE AND SPACE 1 UNIT 180
A 30 m
60 m
B
E
D C
B
N
C
N
S
T
R24 cm
15 cm9 cm
x cm
y cm
52 cm
P
Q
5 ▶ In a party game, a valuable prize is hidden within a triangle formed by an oak tree (O), an apple tree (A) and a plum tree (P).
a Given that OA = 16 m, AP = 18 m and OP = 20 m, construct the triangle OPA using a scale of 1 cm = 2 m.
b The prize is equidistant from the apple tree and the plum tree and 12 m from the oak tree. By careful construction find the distance of the prize from the plum tree.
6 ▶ The rectangle ABCD represents a map of an area 30 m × 60 m. A mobile phone mast, M, is to be placed so that it is equidistant from A and B and 20 m from point E, so that BE : EC = 1 : 2.
a Draw the map using a scale of 1 cm = 5 m.
b Showing your construction lines clearly, find the shortest distance of M from D.
7 ▶ The diagram shows the position of two boats, B and C.
Boat T is on a bearing of 060° from boat B.
Boat T is on a bearing of 285° from boat C.
a Draw an accurate diagram to show the position of boat T.
b Mark the position of boat T with a cross (X). Label it T.
8 ▶ a Show that PQR and RST are similar triangles.
b Work out the missing lengths in the diagram, x and y.
Q7 HINT Draw each
bearing from
the north line
clockwise.
Make sure the
bearing lines are
long enough so
that they meet.

EXAM PRACTICEUNIT 3 81UNIT 1 81
1
2
3
4
5
6
7
8
99°
C B
D
E
A68°
AB
C
FE
D 111°
x
x
x 1 10°
2x 2 20°
B
A
D
E
C
x
St Peter Port
St Annes
St HelierSt Aubin
Guernsey
Alderney
FRANCE
Jersey
Carteret
Cherbourg
JerseyZoo
Captive IslandRozel
ValeHerm
Sark
114 m
31 m
57 m
14 cm65°
72°
13.3 cm
15 cm
10 cm
PM
L
N
Q
EXAM PRACTICE: SHAPE AND SPACE 1
ABC and CDE are straight lines. AE is parallel to BD.
Work out the size of a AB D b AED c AC E [3]
ABC and DEF are straight lines. AC is parallel to DF. BE = BF.
Calculate the size of the angle marked x. You must give reasons for your answer. [3]
Work out the size of angle ADE. Give reasons for your working. [3]
The diagram shows a regular pentagon and a square.
Calculate the size of the angle marked x. You must show all your working. [3]
a The scale of the map is 1 : 1 000 000. Calculate the distance in km between
(i) St Peter Port and St Helier (ii) St Helier and Carteret.b Which town is 57 km from Cherbourg? [4]
Using compasses and a ruler, construct a an angle of 45° b the perpendicular bisector of an 8 cm line. [2]
Calculate the height of the Statue of Liberty using similar triangles. [2]
a Find the sizes of angles PQN and LMN.
b Explain why triangle LMN is similar to triangle LPQ.
c Find the length of LQ.d Find the length of NQ.e Find the length of MP. [5]
[Total 25 marks]
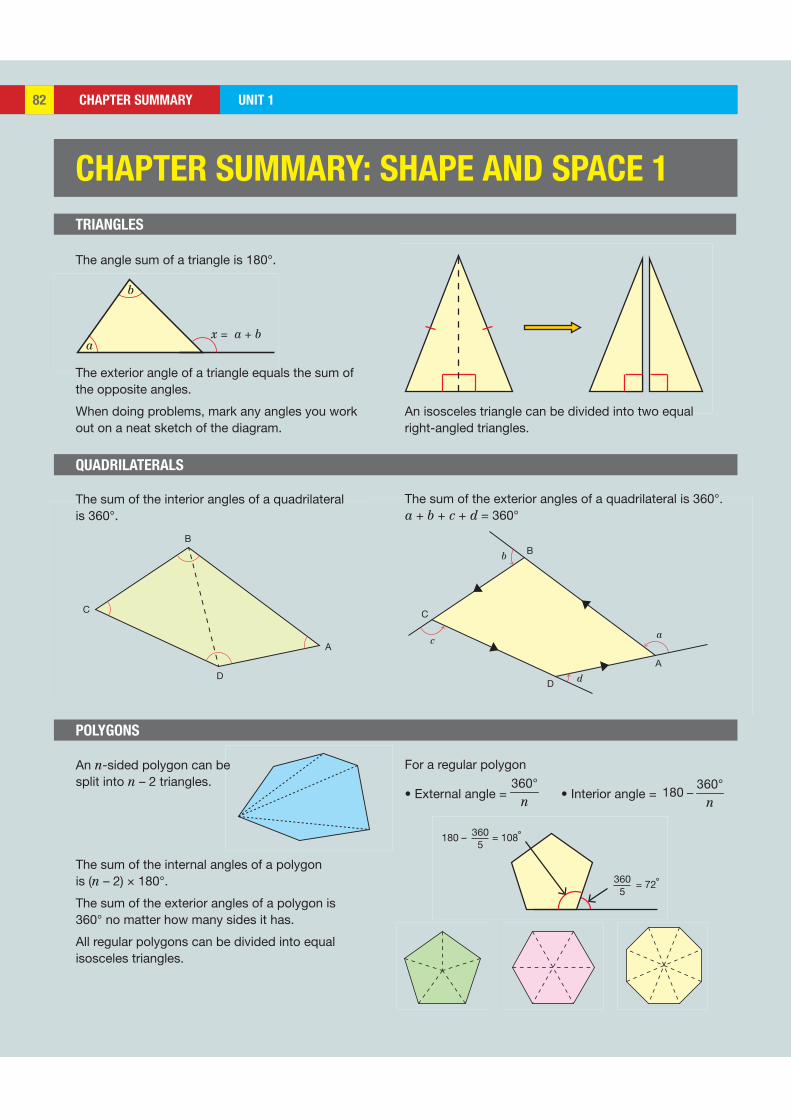
CHAPTER SUMMARY UNIT 382 CHAPTER SUMMARY UNIT 182
x = a + ba
b
B
A
D
C
B
A
D
C
b
c
d
a
180 – = 108˚3605
= 72˚3605
CHAPTER SUMMARY: SHAPE AND SPACE 1
TRIANGLES
The angle sum of a triangle is 180°.
An isosceles triangle can be divided into two equal right-angled triangles.
The sum of the interior angles of a quadrilateral is 360°.
An n-sided polygon can be split into n – 2 triangles.
The sum of the internal angles of a polygon is (n – 2) × 180°.
The sum of the exterior angles of a polygon is 360° no matter how many sides it has.
All regular polygons can be divided into equal isosceles triangles.
POLYGONS
QUADRILATERALS
The exterior angle of a triangle equals the sum of the opposite angles.
When doing problems, mark any angles you work out on a neat sketch of the diagram.
The sum of the exterior angles of a quadrilateral is 360°.a + b + c + d = 360°
For a regular polygon
• External angle = °360
n • Interior angle = °
−360
180n
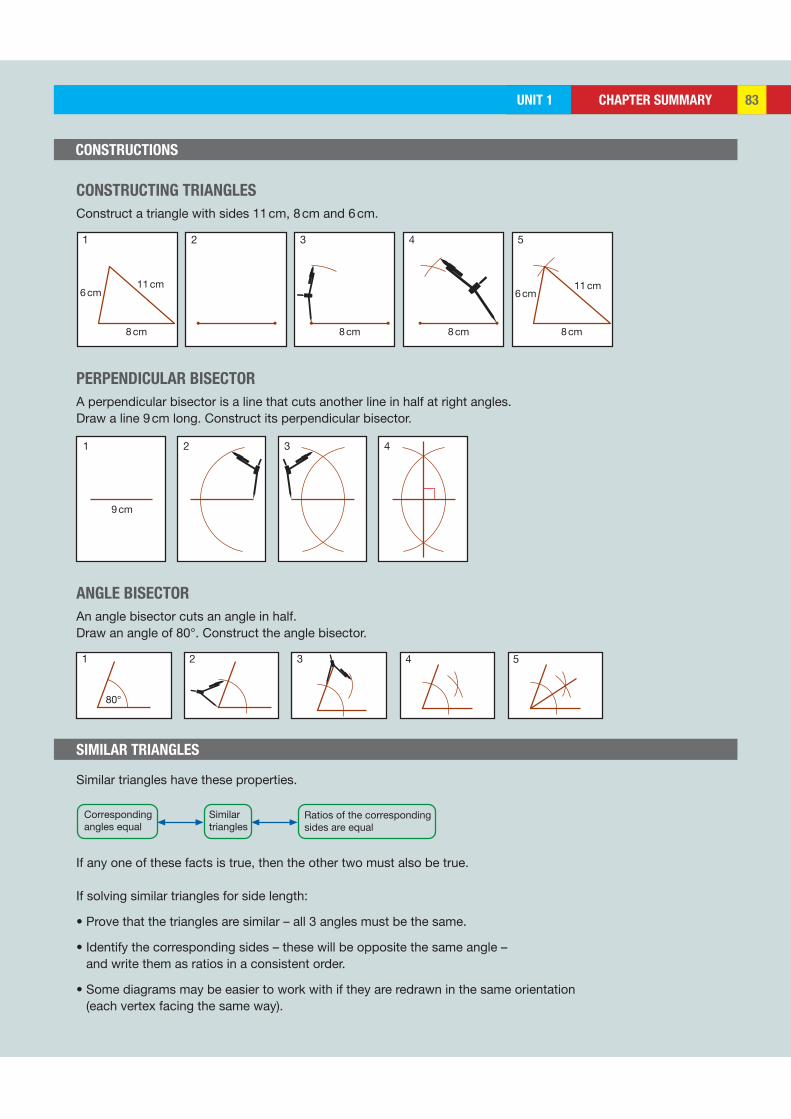
CHAPTER SUMMARYUNIT 3 83CHAPTER SUMMARYUNIT 1 83
8 cm
2 3 4 5
8 cm 8 cm 8 cm
11 cm6 cm
1
8 cm
11 cm6 cm
Correspondingangles equal
Similartriangles
Ratios of the correspondingsides are equal
1 2 3 4
9 cm
80°
21 53 4
CONSTRUCTIONS
CONSTRUCTING TRIANGLES
Construct a triangle with sides 11 cm, 8 cm and 6 cm.
PERPENDICULAR BISECTOR
A perpendicular bisector is a line that cuts another line in half at right angles.Draw a line 9 cm long. Construct its perpendicular bisector.
ANGLE BISECTOR
An angle bisector cuts an angle in half.Draw an angle of 80°. Construct the angle bisector.
SIMILAR TRIANGLES
Similar triangles have these properties.
If any one of these facts is true, then the other two must also be true.
If solving similar triangles for side length:
• Prove that the triangles are similar – all 3 angles must be the same.
• Identify the corresponding sides – these will be opposite the same angle – and write them as ratios in a consistent order.
• Some diagrams may be easier to work with if they are redrawn in the same orientation (each vertex facing the same way).

SETS 1 UNIT 184
LEARNING OBJECTIVES
BASIC PRINCIPLES
EXAMPLE 1
SETS 1
The idea of a set is simple but powerful. The theory of sets is mainly due to the work of the German mathematician, Georg Cantor (1845–1918). His work resulted in arguments and disagreements since it was so counter-intuitive (against common sense). Cantor faced many fierce personal attacks by the mathematical establishment. In later years he suffered from chronic depression, possibly due to these attacks, and he died in poverty. By the 1920s his ideas were generally accepted and led to great advances in mathematics.
• Use set notation • Use Venn diagrams to represent sets
SET NOTATION
• Recognise different types of numbers (odd, even, prime, square, …).
• Know the properties of triangles and quadrilaterals.
• Understand multiples and factors of numbers.
A set described by the list
{Anne, Nikos, Bob}
is the set consisting of the three people called Anne, Nikos and Bob.
A set is a collection of objects which are called the elements or members of the set. The objects can be numbers, animals, ideas, colours, in fact anything you can imagine. A set can be described by listing all the members of the set, or by giving a rule to describe the members. The list or rule is enclosed by braces (curly brackets) {}.
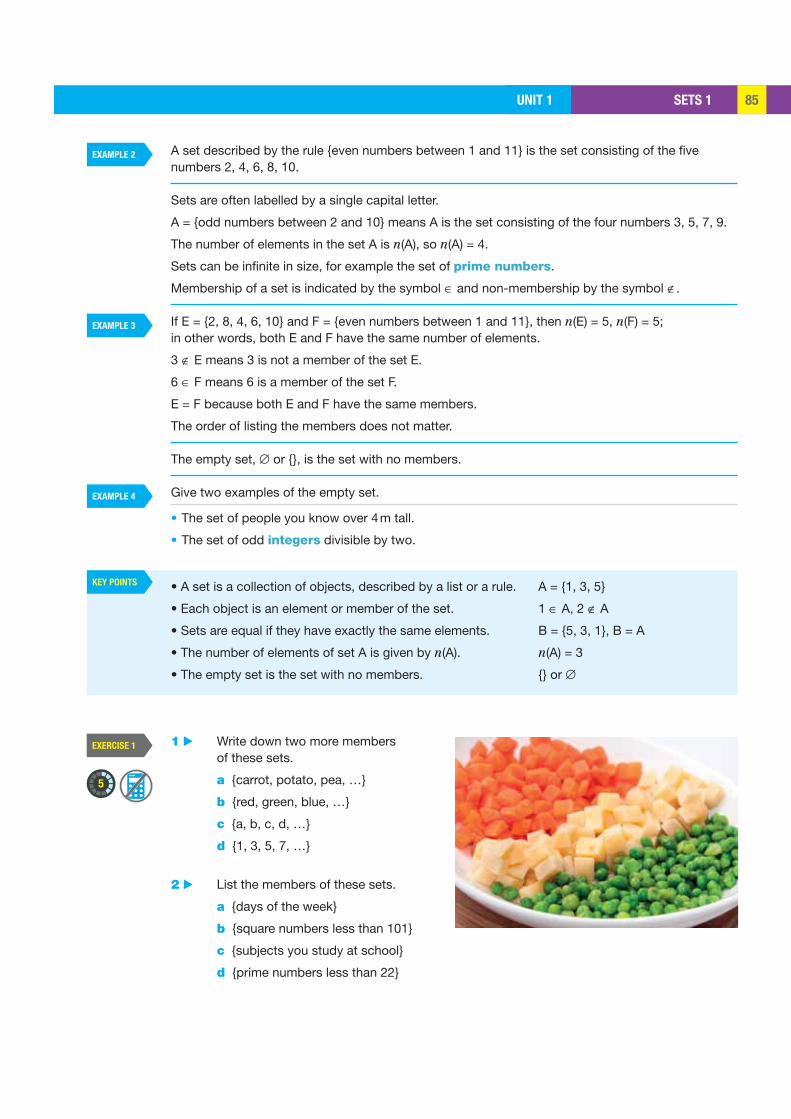
SETS 1UNIT 1 85
EXAMPLE 3
EXAMPLE 2
EXAMPLE 4
KEY POINTS
EXERCISE 1
5
A set described by the rule {even numbers between 1 and 11} is the set consisting of the five numbers 2, 4, 6, 8, 10.
Sets are often labelled by a single capital letter.
A = {odd numbers between 2 and 10} means A is the set consisting of the four numbers 3, 5, 7, 9.
The number of elements in the set A is n(A), so n(A) = 4.
Sets can be infinite in size, for example the set of prime numbers.
Membership of a set is indicated by the symbol ∈ and non-membership by the symbol ∉.
If E = {2, 8, 4, 6, 10} and F = {even numbers between 1 and 11}, then n(E) = 5, n(F) = 5; in other words, both E and F have the same number of elements.
3 ∉ E means 3 is not a member of the set E.
6 ∈ F means 6 is a member of the set F.
E = F because both E and F have the same members.
The order of listing the members does not matter.
The empty set, ∅ or {}, is the set with no members.
Give two examples of the empty set.
• The set of people you know over 4 m tall.
• The set of odd integers divisible by two.
• A set is a collection of objects, described by a list or a rule. A = {1, 3, 5}
• Each object is an element or member of the set. 1 ∈ A, 2 ∉ A
• Sets are equal if they have exactly the same elements. B = {5, 3, 1}, B = A
• The number of elements of set A is given by n(A). n(A) = 3
• The empty set is the set with no members. {} or ∅
1 ▶ Write down two more members of these sets.
a {carrot, potato, pea, …}
b {red, green, blue, …}
c {a, b, c, d, …}
d {1, 3, 5, 7, …}
2 ▶ List the members of these sets.
a {days of the week}
b {square numbers less than 101}
c {subjects you study at school}
d {prime numbers less than 22}
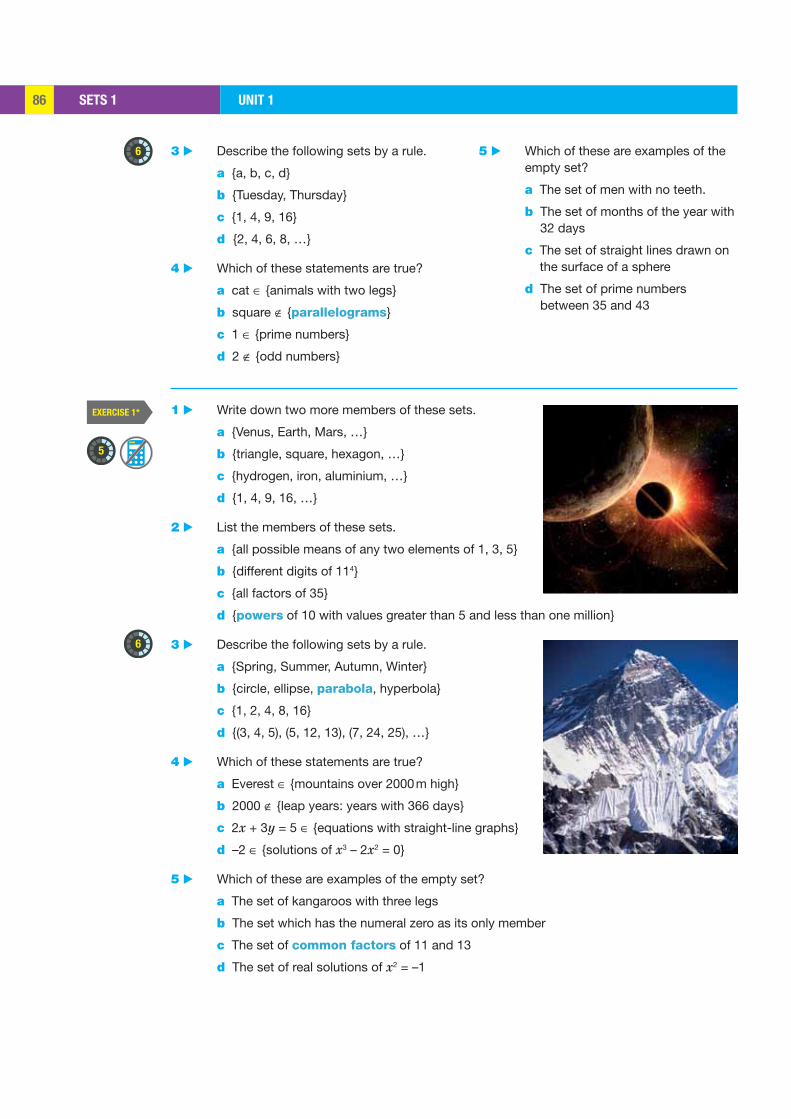
SETS 1 UNIT 186
EXERCISE 1*
6
5
6
3 ▶ Describe the following sets by a rule.
a {a, b, c, d}
b {Tuesday, Thursday}
c {1, 4, 9, 16}
d {2, 4, 6, 8, …}
4 ▶ Which of these statements are true?
a cat ∈ {animals with two legs}
b square ∉ {parallelograms}
c 1 ∈ {prime numbers}
d 2 ∉ {odd numbers}
5 ▶ Which of these are examples of the empty set?
a The set of men with no teeth.
b The set of months of the year with 32 days
c The set of straight lines drawn on the surface of a sphere
d The set of prime numbers between 35 and 43
1 ▶ Write down two more members of these sets.
a {Venus, Earth, Mars, …}
b {triangle, square, hexagon, …}
c {hydrogen, iron, aluminium, …}
d {1, 4, 9, 16, …}
2 ▶ List the members of these sets.
a {all possible means of any two elements of 1, 3, 5}
b {different digits of 114}
c {all factors of 35}
d {powers of 10 with values greater than 5 and less than one million}
3 ▶ Describe the following sets by a rule.
a {Spring, Summer, Autumn, Winter}
b {circle, ellipse, parabola, hyperbola}
c {1, 2, 4, 8, 16}
d {(3, 4, 5), (5, 12, 13), (7, 24, 25), …}
4 ▶ Which of these statements are true?
a Everest ∈ {mountains over 2000 m high}
b 2000 ∉ {leap years: years with 366 days}
c 2x + 3y = 5 ∈ {equations with straight-line graphs}
d –2 ∈ {solutions of x3 – 2x2 = 0}
5 ▶ Which of these are examples of the empty set?
a The set of kangaroos with three legs
b The set which has the numeral zero as its only member
c The set of common factors of 11 and 13
d The set of real solutions of x2 = –1
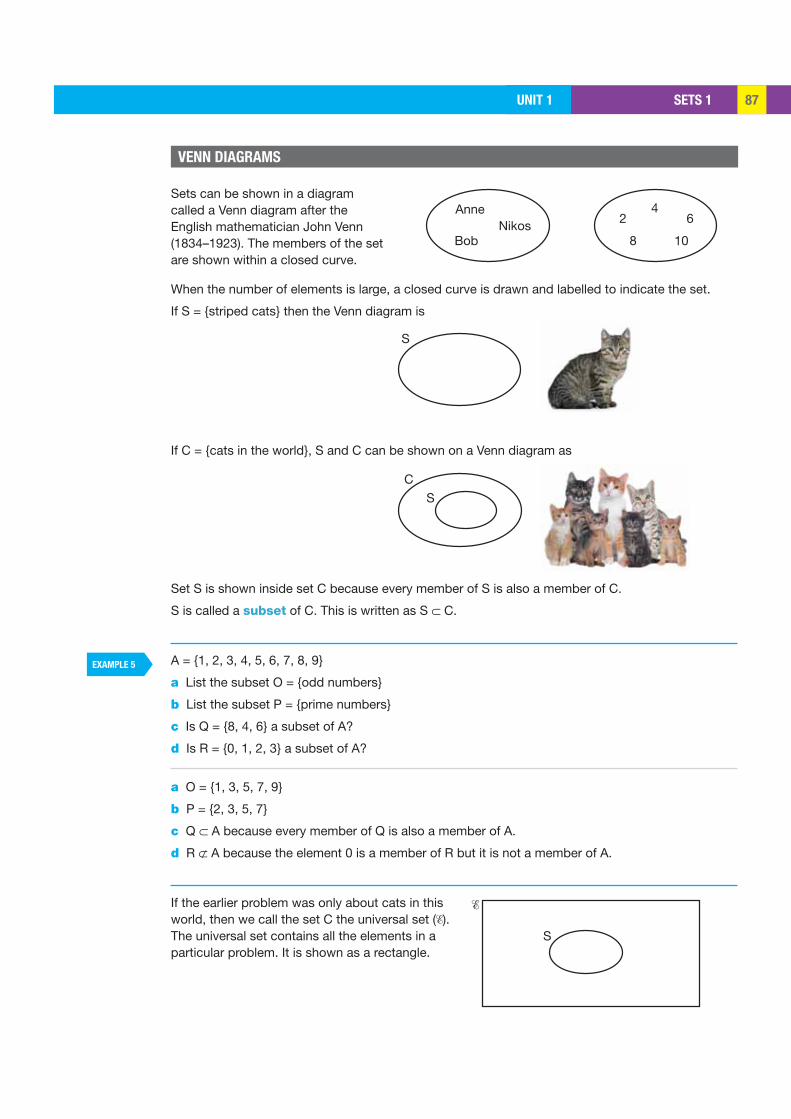
SETS 1UNIT 1 87
EXAMPLE 5
S
CS
S
%
AnneNikos
Bob
24
10
6
8
VENN DIAGRAMS
Sets can be shown in a diagram called a Venn diagram after the English mathematician John Venn (1834–1923). The members of the set are shown within a closed curve.
When the number of elements is large, a closed curve is drawn and labelled to indicate the set.
If S = {striped cats} then the Venn diagram is
If C = {cats in the world}, S and C can be shown on a Venn diagram as
Set S is shown inside set C because every member of S is also a member of C.
S is called a subset of C. This is written as S ⊂ C.
A = {1, 2, 3, 4, 5, 6, 7, 8, 9}
a List the subset O = {odd numbers}
b List the subset P = {prime numbers}
c Is Q = {8, 4, 6} a subset of A?
d Is R = {0, 1, 2, 3} a subset of A?
a O = {1, 3, 5, 7, 9}
b P = {2, 3, 5, 7}
c Q ⊂ A because every member of Q is also a member of A.
d R ⊄ A because the element 0 is a member of R but it is not a member of A.
If the earlier problem was only about cats in this world, then we call the set C the universal set ( ). The universal set contains all the elements in a particular problem. It is shown as a rectangle.

SETS 1 UNIT 188
EXAMPLE 6
S1000
9000%
S
S shown shaded
S
S′ shown shaded
S M
Cats that are both striped and male
Cats that are striped Cats that are not stripedbut are male
%
O P
468
9
12
35
7
%
If the problem was only about cats in Rome, then = {cats in Rome}; the Venn diagram does not change. If there are 10 000 cats in Rome, and 1000 are striped cats, these numbers can be entered on the Venn diagram. The diagram shows that there are 9000 non-striped cats outside S. This set is denoted by S′ and is called the complement of S.
INTERSECTION OF SETS
Sets can overlap. Let M = {male cats}. S and M overlap because some cats are both striped and male. S and M are shown on the Venn diagram.
The set of cats that are both striped and male is where the sets S and M overlap. It is called the intersection of the two sets S and M and is written S ∩ M.
SKILL: REASONING
= {all positive integers less than 10}, P = {prime numbers less than 10} and O = {odd numbers less than 10}.
a Show this information on a Venn diagram.b Find the set P ∩ O and n(P ∩ O).c List P′.
a
b The set P ∩ O is shown shaded on the Venn diagram.
From the Venn diagram P ∩ O = {3, 5, 7} and n(P ∩ O) = 3.
c P′ is every element not in P so P′ = {1, 4, 6, 8, 9}.
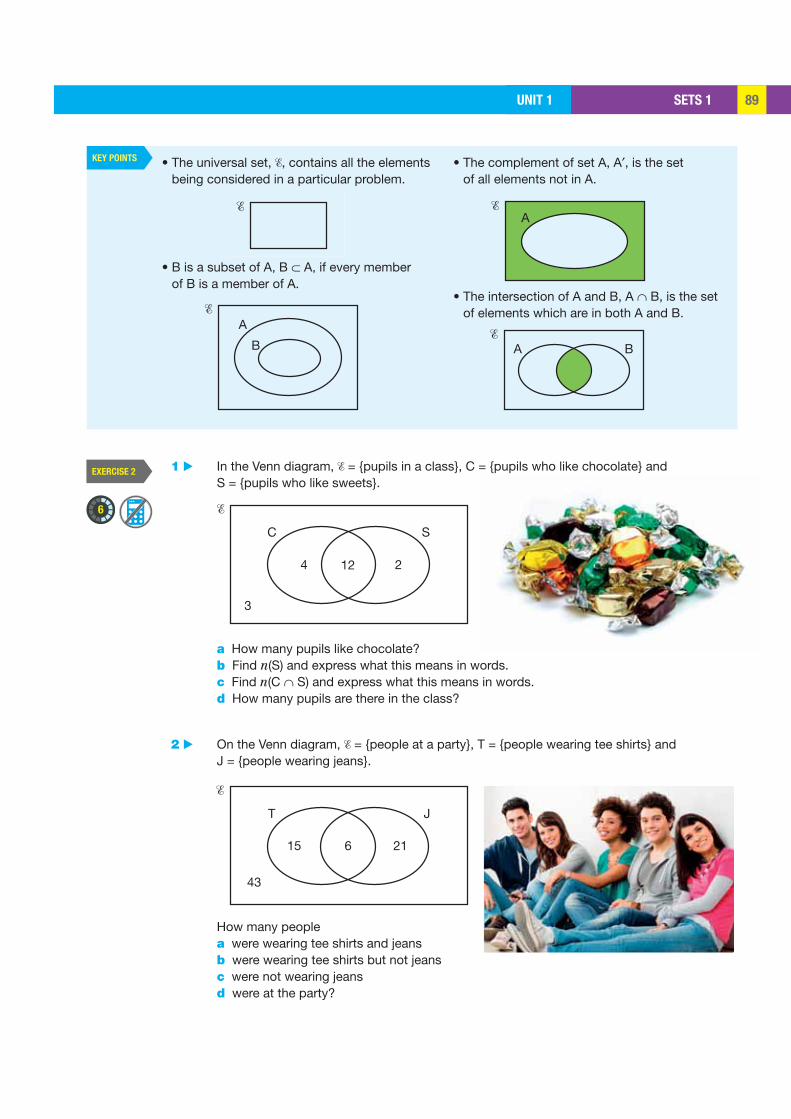
SETS 1UNIT 1 89
KEY POINTS
EXERCISE 2
6
%
A
B
%
A%
A B%
C S
4 212
3
%
T J
43
15 216
%
• The universal set, , contains all the elements being considered in a particular problem.
• B is a subset of A, B ⊂ A, if every member of B is a member of A.
• The complement of set A, A′, is the set of all elements not in A.
• The intersection of A and B, A ∩ B, is the set of elements which are in both A and B.
1 ▶ In the Venn diagram, = {pupils in a class}, C = {pupils who like chocolate} and S = {pupils who like sweets}.
a How many pupils like chocolate? b Find n(S) and express what this means in words. c Find n(C ∩ S) and express what this means in words. d How many pupils are there in the class?
2 ▶ On the Venn diagram, = {people at a party}, T = {people wearing tee shirts} and J = {people wearing jeans}.
How many people a were wearing tee shirts and jeans b were wearing tee shirts but not jeans c were not wearing jeans d were at the party?

SETS 1 UNIT 190
EXERCISE 2*
7
7
C N
67
21
%
1 ▶ = {all positive integers less than 12}, A = {2, 4, 6, 8, 10}, B = {4, 5, 6, 7, 8}.
a Show this information on a Venn diagram. b List A ∩ B and find n(A ∩ B). c Does A ∩ B = B ∩ A? d List (A ∩ B)′. e Is A ∩ B a subset of A?
2 ▶ = {all positive integers less than 12}, E = {1, 2, 3, 4}, F = {5, 6, 7, 8}. a Show this information on a Venn diagram. b List E ∩ F. c If E ∩ F = ∅ what can you say about the sets E and F?
3 ▶ R is the set of roses in a flower shop and W is the set of white flowers in the same shop.
a Show this information on a Venn diagram. b Describe the set R ∩ W in words. c If R ∩ W = ∅, what can you say?
4 ▶ On the Venn diagram, = {ice creams in Marco’s restaurant}, C = {ice creams containing chocolate} and N = {ice creams containing nuts}. n(C) = 53 and n(N) = 36.
a Copy and complete the Venn diagram. b How many ice creams contain chocolate
but no nuts? c How many ice creams contain chocolate
or nuts but not both? d How many ice creams are there in the
restaurant?
3 ▶ = {a, b, c, d, e, f, g, h, i, j}, A = {a, c, e, g, i}, B = {c, d, e, f}. a Show this information on a Venn diagram. b List A ∩ B and find n(A ∩ B). c Does A ∩ B = B ∩ A? d Is B ⊂ A? Give a reason for your answer.
4 ▶ = {all cars in the world}, P = {pink cars}, R = {Rolls-Royce cars}. a Describe the set P ∩ R in words. b Describe the set R′ in words. c If P ∩ R = ∅, describe what this means.
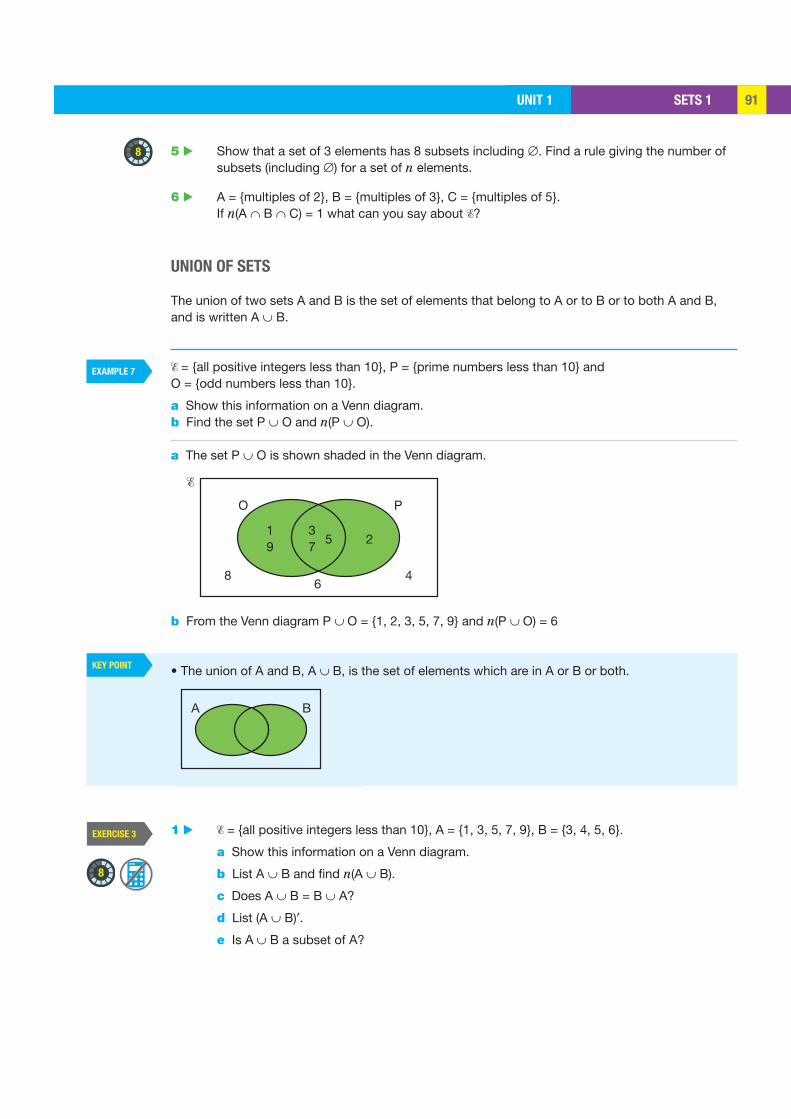
SETS 1UNIT 1 91
EXERCISE 3
EXAMPLE 7
KEY POINT
8
8
O P
19
37
2
8 46
5
%
A B
5 ▶ Show that a set of 3 elements has 8 subsets including ∅. Find a rule giving the number of subsets (including ∅) for a set of n elements.
6 ▶ A = {multiples of 2}, B = {multiples of 3}, C = {multiples of 5}. If n(A ∩ B ∩ C) = 1 what can you say about ?
UNION OF SETS
The union of two sets A and B is the set of elements that belong to A or to B or to both A and B, and is written A ∪ B.
= {all positive integers less than 10}, P = {prime numbers less than 10} and O = {odd numbers less than 10}.
a Show this information on a Venn diagram.b Find the set P ∪ O and n(P ∪ O).
a The set P ∪ O is shown shaded in the Venn diagram.
b From the Venn diagram P ∪ O = {1, 2, 3, 5, 7, 9} and n(P ∪ O) = 6
• The union of A and B, A ∪ B, is the set of elements which are in A or B or both.
1 ▶ = {all positive integers less than 10}, A = {1, 3, 5, 7, 9}, B = {3, 4, 5, 6}.
a Show this information on a Venn diagram.
b List A ∪ B and find n(A ∪ B).
c Does A ∪ B = B ∪ A?
d List (A ∪ B)′.
e Is A ∪ B a subset of A?
SETS 1 UNIT 192
EXERCISE 3*
EXERCISE 4
8
8
9
5
2 ▶ = {letters of the alphabet}, V = {vowels}, A = {a, b, c, d, e}.
a Show this information on a Venn diagram. b List V ∩ A. c Describe V′. d List V ∪ A.
3 ▶ = {all triangles}, I = {isosceles triangles}, R = {right-angled triangles}.
a Show this information on a Venn diagram. b Sketch a member of I ∩ R. c Describe I ∩ R in words. d Describe I ∩ R′ in words.
4 ▶ For sets A and B, n(A) = 15, n(B) = 10, n(A ∩ B) = 4. Find n(A ∪ B).
1 ▶ = {all positive integers less than 10}, E = {2, 4, 6, 8}, O = {1, 3, 5, 7, 9}. a Show this information on a Venn diagram. b List E ∪ O. c If n(E) + n(O) = n(E ∪ O) what does this tell you about the sets E and O? d If (E ∪ O)′ = ∅ what does this tell you about E and O?
2 ▶ In Joe’s Pizza Parlour, O is the set of pizzas containing olives and C is the set of pizzas containing cheese.
a Describe O ∪ C in words. b Describe O ∩ C in words. c If (O ∪ C)′ = ∅, what can you say?
3 ▶ For sets A and B, n(A) = 10, n(B) = 16, n(A ∪ B) = 20. Find n(A ∩ B).
4 ▶ If n(A) = n(A ∪ B) what can you say about the sets A and B?
5 ▶ Does n(A) + n(B) = n(A ∪ B) + n(A ∩ B) for all possible sets A and B?
REVISION
1 ▶ List these sets. a {square numbers between 2 and 30} b {all factors of 24} c {set of vowels in the word ‘mathematics’} d {set of months of the year containing 30 days}
2 ▶ Describe these sets by a rule. a {2, 3, 5, 7} b {32, 34, 36, 38} c {Saturday, Sunday} d {a, e, i, o, u}

SETS 1UNIT 1 93
EXERCISE 4*
5
8
3 ▶ = {all positive integers}, P = {prime numbers}, E = {even numbers}, O = {odd numbers}. Say which of these are true or false. a 51 ∈ P b P is a subset of O c E ∩ O = ∅ d E ∪ O =
4 ▶ = {positive integers less than 11}, A = {multiples of 2}, B = {multiples of 4}. a Show this information on a Venn diagram. b List the set A′ and describe it in words. c Find n(B′). d Is B ⊂ A? Explain your answer.
5 ▶ = {members of an expedition to the South Pole}, A = {people born in Africa}, F = {females}.
a Show this information on a Venn diagram. b Describe A ∪ F c The leader ∈ A ∩ F. What can you say about
the leader?
6 ▶ For two sets A and B, n(A ∩ B) = 3, n(B) = 8, n(A ∪ B) = 12. Find n(A).
REVISION
1 ▶ List these sets. a {multiples of 4 less than 20} b {colours of the rainbow} c {arrangements of the letters CAT} d {all pairs of products o f 1, 2, 3}
2 ▶ Describe the following sets by a rule. a {1, 2, 3, 4, 6, 12} b {1, 1, 2, 3, 5} c {Hearts, Clubs, Diamonds, Spades} d {tetrahedron, cube, octahedron, dodecahedron, icosahedron}
3 ▶ A and B are two sets. A contains 12 members, B contains 17 members and A ∪ B contains 26 members. How many members of A are not in A ∩ B?
4 ▶ = {all polygons}, F = {polygons with four sides} and R = {regular polygons}.
a Show this information on a Venn diagram. b Describe F ∩ R. c Describe F ∩ R′. d Draw an ‘x’ in your Venn diagram indicating
where a square would be.
5 ▶ For two sets A and B, n(A ∩ B) = 4, n(B) = 9, n(A ∪ B)′ = 6 and n(B′) = 13. Find n(A).
6 ▶ = {positive integers less than 30}, P = {multiples of 4}, Q = {multiples of 5}, R = {multiples of 6}.
a List P ∩ Q. b x ∈ P ∩ R. List the possible values of x. c Is it true that Q ∩ R = ∅? Explain your answer.

EXAM PRACTICE UNIT 394 UNIT 194
1
2
3
4
5
B S
15 252
8
%
EXAM PRACTICE: SETS 1
Which of these statements are true?
a Jupiter ∉ {Solar System}
b triangle ∈ {polygons}
c y = x + 1 ∈ {equations with straight-line graphs}
d 3 ∉ {odd numbers} [4]
= {all the clothes in a shop}, J = {jeans} and Y = {yellow clothes}.
a Describe the set Y′ in words.
b Describe the set J ∩ Y in words.
c If J ∩ Y = ∅, describe what this means. [5]
In the Venn diagram, = {animals in a field}, B = {black animals} and S = {sheep}.
a How many animals are there in the field?
b How many non-black sheep are there?
c Find n(B ∪ S) and express what this means in words.
d How many black animals are there? [6]
= {positive integers less than 13}, E = {even integers}, F = {multiples of 4} and T = {multiples of 3}.
a List the sets E′, E ∩ T and F ∩ T.b Give descriptions of the sets E′, E ∩ T
and F ∩ T. [6]
For two sets A and B, n(A ∩ B) = 3, n(A) = 6, n(B′) = 10 and n( ) = 18. Find n(B). [4]
[Total 25 marks]
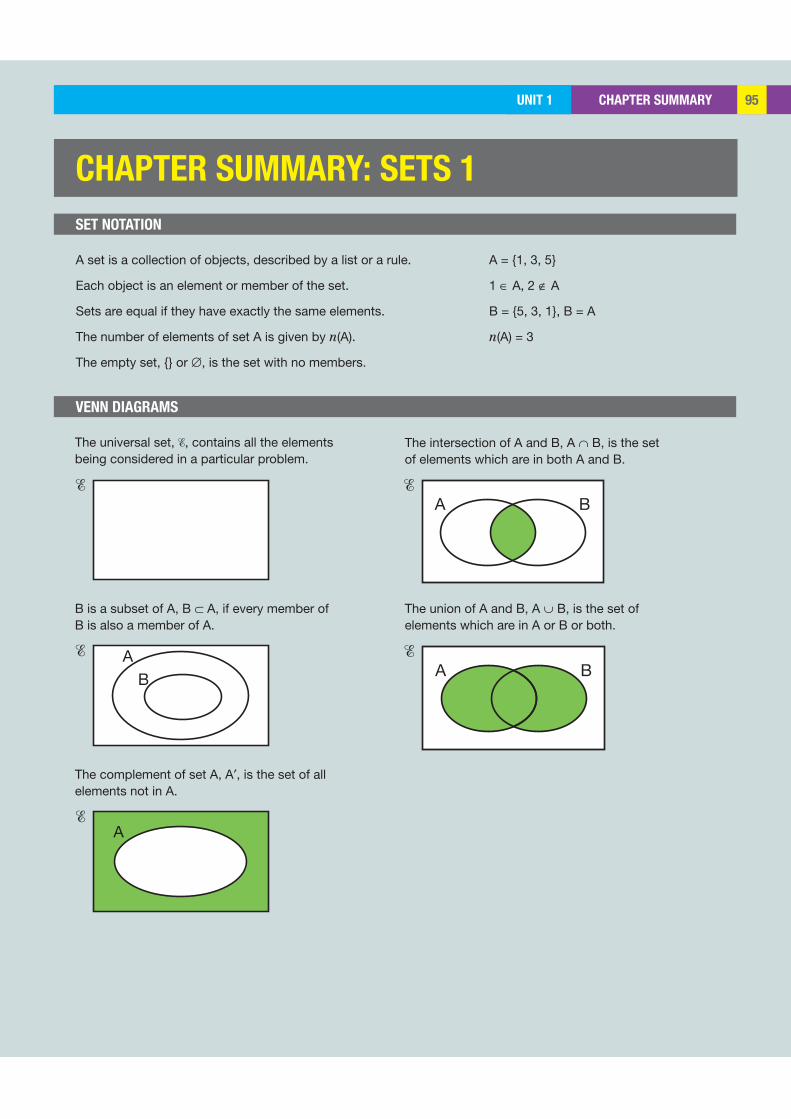
CHAPTER SUMMARYUNIT 3 95UNIT 1 95
%A B
%
AB
%
A B%
A%
CHAPTER SUMMARY: SETS 1
A set is a collection of objects, described by a list or a rule. A = {1, 3, 5}
Each object is an element or member of the set. 1 ∈ A, 2 ∉ A
Sets are equal if they have exactly the same elements. B = {5, 3, 1}, B = A
The number of elements of set A is given by n(A). n(A) = 3
The empty set, {} or ∅, is the set with no members.
The universal set, , contains all the elements being considered in a particular problem.
The intersection of A and B, A ∩ B, is the set of elements which are in both A and B.
B is a subset of A, B ⊂ A, if every member of B is also a member of A.
The union of A and B, A ∪ B, is the set of elements which are in A or B or both.
The complement of set A, A′, is the set of all elements not in A.
SET NOTATION
VENN DIAGRAMS
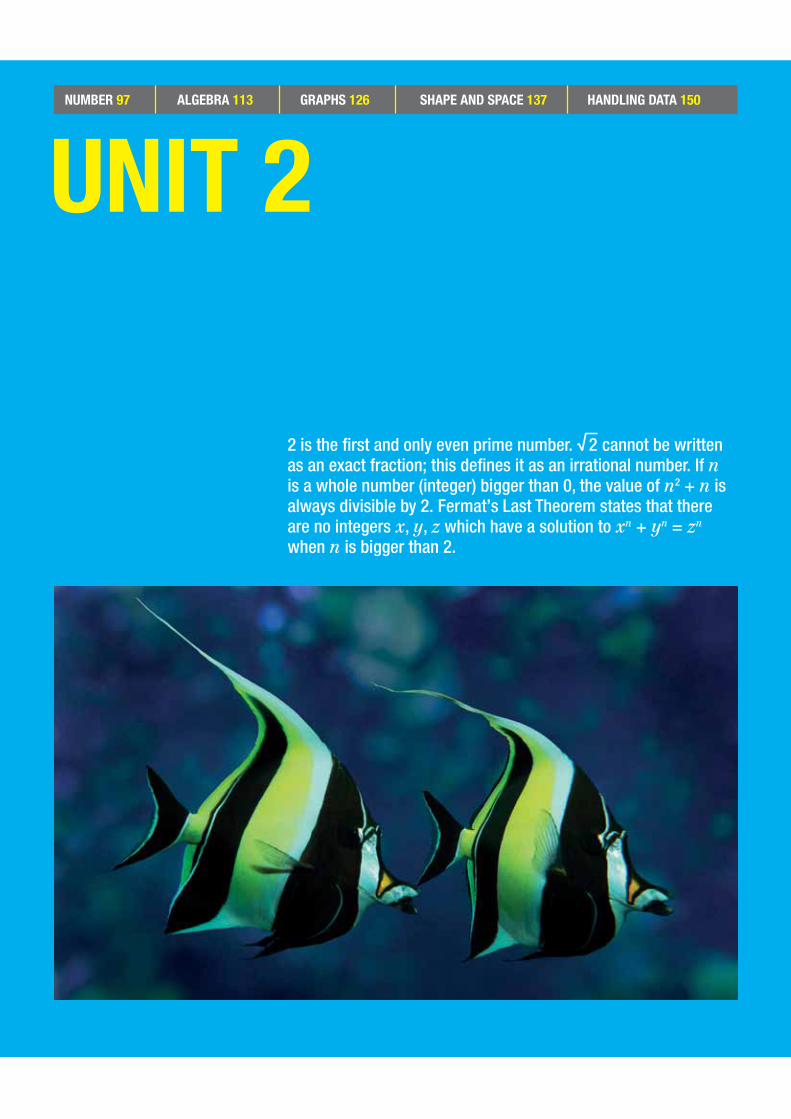
UNIT 2 NUMBER 97 ALGEBRA 113 GRAPHS 126 SHAPE AND SPACE 137 HANDLING DATA 150
2 is the first and only even prime number. cannot be written as an exact fraction; this defines it as an irrational number. If n is a whole number (integer) bigger than 0, the value of n2 + n is always divisible by 2. Fermat’s Last Theorem states that there are no integers x, y, z which have a solution to xn + yn = zn when n is bigger than 2.
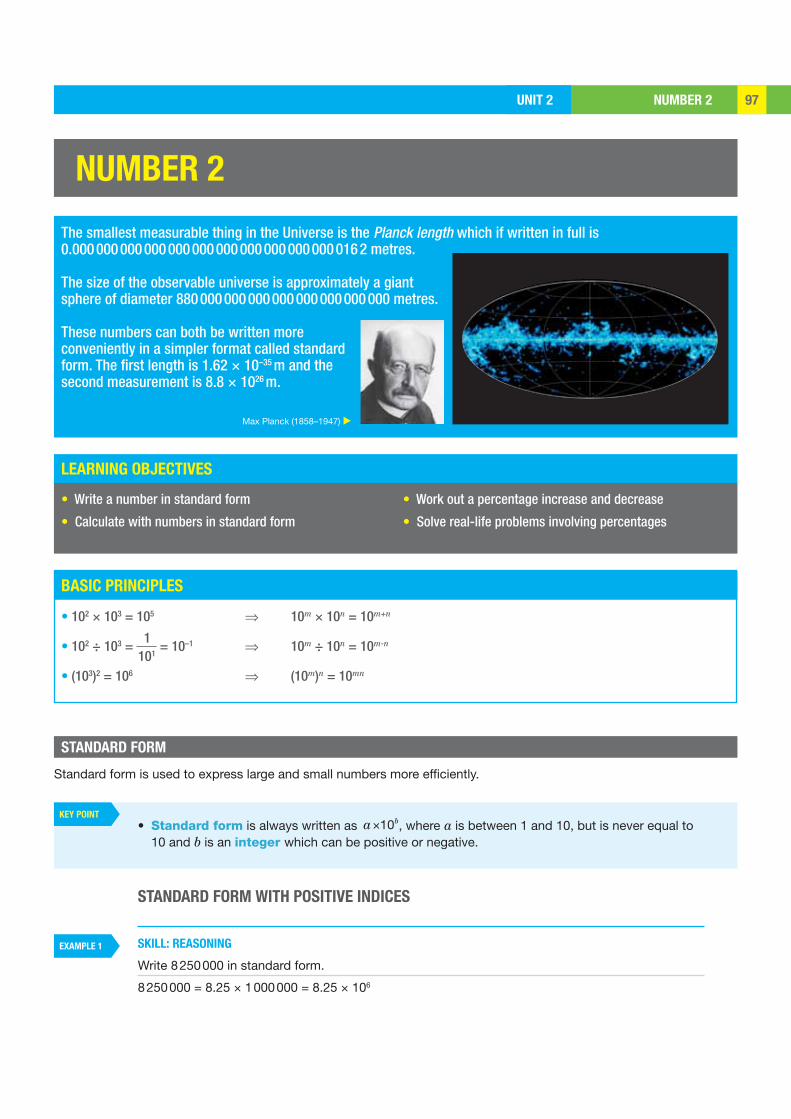
NUMBER 2UNIT 2 97
LEARNING OBJECTIVES
BASIC PRINCIPLES
KEY POINT
EXAMPLE 1
NUMBER 2
The smallest measurable thing in the Universe is the Planck length which if written in full is 0.000 000 000 000 000 000 000 000 000 000 000 016 2 metres.
The size of the observable universe is approximately a giant sphere of diameter 880 000 000 000 000 000 000 000 000 metres.
These numbers can both be written more conveniently in a simpler format called standard form. The first length is 1.62 × 10⁻³⁵ m and the second measurement is 8.8 × 1026 m.
Max Planck (1858–1947) ▶
• Write a number in standard form
• Calculate with numbers in standard form
• Work out a percentage increase and decrease
• Solve real-life problems involving percentages
• 102 × 103 = 105 ⇒ 10m × 10n = 10m+n
• 102 ÷ 103 = = 10–1 ⇒ 10m ÷ 10n = 10m-n
• (103)2 = 106 ⇒ (10m)n = 10mn
STANDARD FORM
• Standard form is always written as × 10ba , where a is between 1 and 10, but is never equal to 10 and b is an integer which can be positive or negative.
STANDARD FORM WITH POSITIVE INDICES
SKILL: REASONING
Write 8 250 000 in standard form.
8 250 000 = 8.25 × 1 000 000 = 8.25 × 10⁶
Standard form is used to express large and small numbers more efficiently.
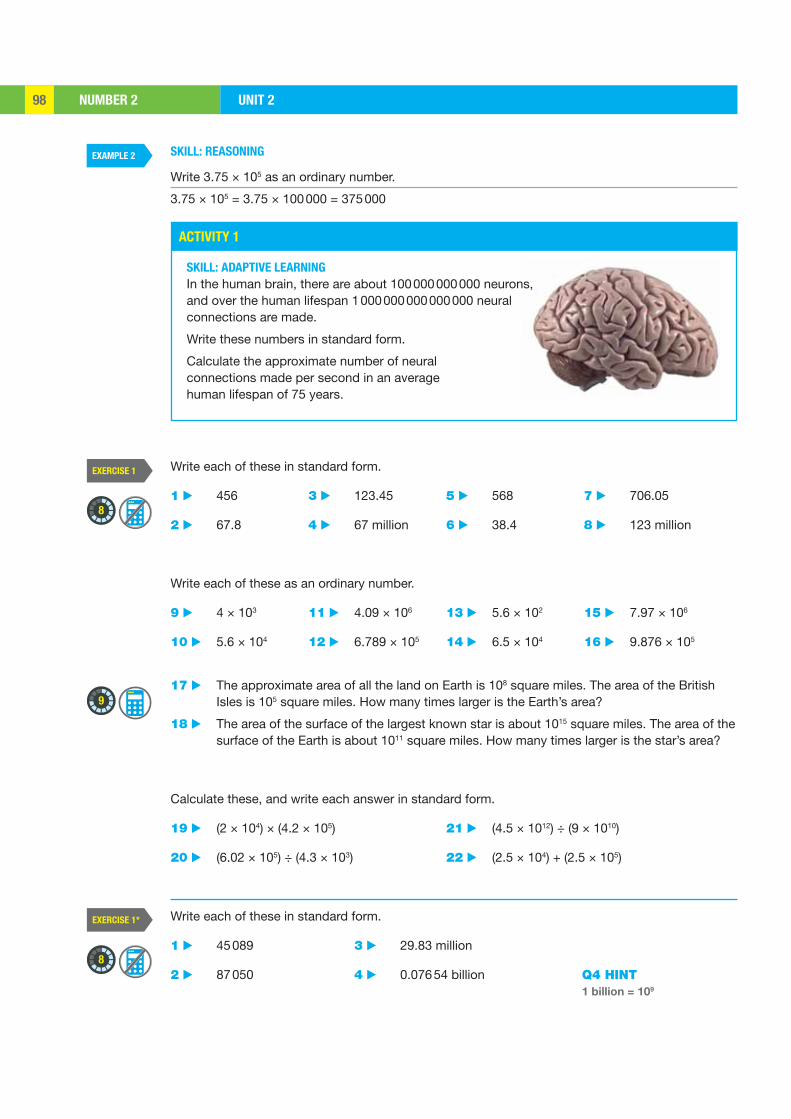
NUMBER 2 UNIT 298
EXAMPLE 2
ACTIVITY 1
EXERCISE 1
EXERCISE 1*
8
8
9
SKILL: REASONING
Write 3.75 × 10⁵ as an ordinary number.
3.75 × 105 = 3.75 × 100 000 = 375 000
Write each of these in standard form.
1 ▶ 456 3 ▶ 123.45 5 ▶ 568 7 ▶ 706.05
2 ▶ 67.8 4 ▶ 67 million 6 ▶ 38.4 8 ▶ 123 million
Write each of these as an ordinary number.
9 ▶ 4 × 10³ 11 ▶ 4.09 × 10⁶ 13 ▶ 5.6 × 10² 15 ▶ 7.97 × 10⁶
10 ▶ 5.6 × 10⁴ 12 ▶ 6.789 × 10⁵ 14 ▶ 6.5 × 10⁴ 16 ▶ 9.876 × 10⁵
17 ▶ The approximate area of all the land on Earth is 108 square miles. The area of the British Isles is 105 square miles. How many times larger is the Earth’s area?
18 ▶ The area of the surface of the largest known star is about 1015 square miles. The area of the surface of the Earth is about 1011 square miles. How many times larger is the star’s area?
Calculate these, and write each answer in standard form.
19 ▶ (2 × 104) × (4.2 × 105) 21 ▶ (4.5 × 10¹²) ÷ (9 × 10¹⁰)
20 ▶ (6.02 × 10⁵) ÷ (4.3 × 10³) 22 ▶ (2.5 × 10⁴) + (2.5 × 10⁵)
Write each of these in standard form.
1 ▶ 45 089 3 ▶ 29.83 million
2 ▶ 87 050 4 ▶ 0.076 54 billion
SKILL: ADAPTIVE LEARNING
In the human brain, there are about 100 000 000 000 neurons, and over the human lifespan 1 000 000 000 000 000 neural connections are made.
Write these numbers in standard form.
Calculate the approximate number of neural connections made per second in an average human lifespan of 75 years.
Q4 HINT 1 billion = 109
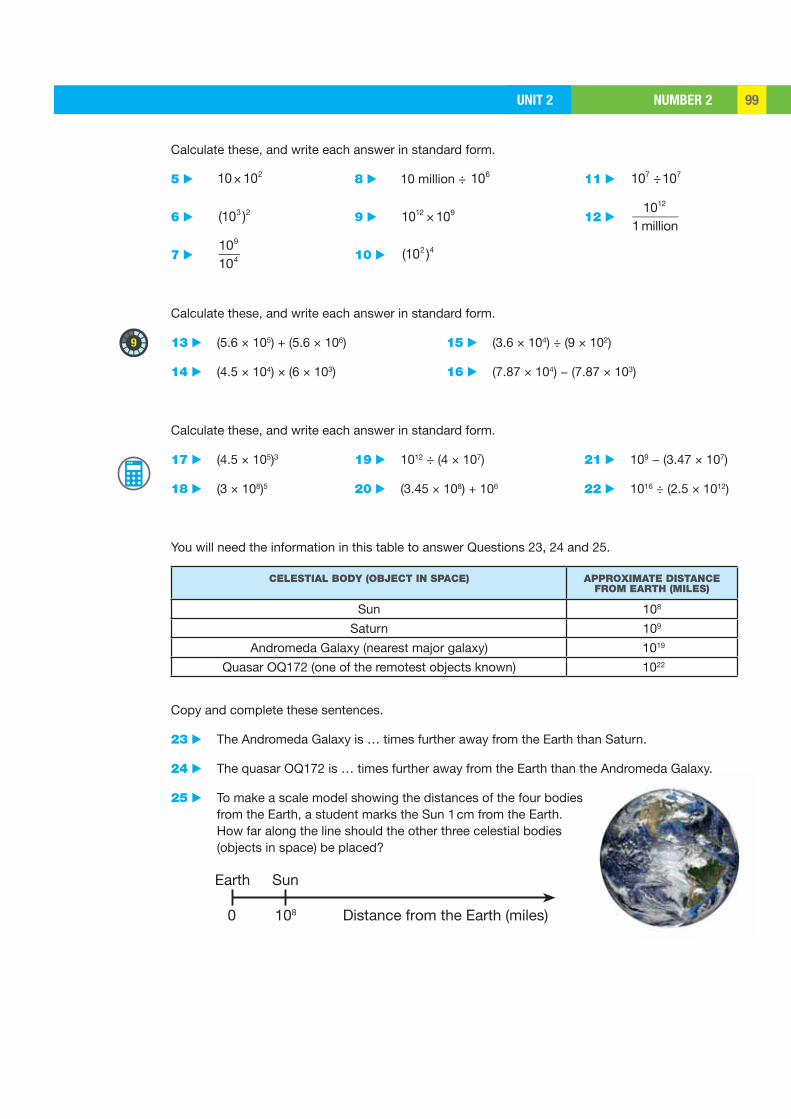
NUMBER 2UNIT 2 99
9
Distance from the Earth (miles)0 108
Earth Sun
Calculate these, and write each answer in standard form.
5 ▶ 10 102× 8 ▶ 10 million ÷ 106 11 ▶ 107 ÷107
6 ▶ (103 )2 9 ▶ 1012 109× 12 ▶ 1012
1 million
7 ▶ 109
104 10 ▶ (102 )4
Calculate these, and write each answer in standard form.
13 ▶ (5.6 × 10⁵) + (5.6 × 10⁶) 15 ▶ (3.6 × 10⁴) ÷ (9 × 10²)
14 ▶ (4.5 × 104) × (6 × 103) 16 ▶ (7.87 × 10⁴) − (7.87 × 10³)
Calculate these, and write each answer in standard form.
17 ▶ (4.5 × 10⁵)3 19 ▶ 1012 ÷ (4 × 10⁷) 21 ▶ 109 − (3.47 × 10⁷)
18 ▶ (3 × 10⁸)5 20 ▶ (3.45 × 10⁸) + 106 22 ▶ 1016 ÷ (2.5 × 10¹²)
You will need the information in this table to answer Questions 23, 24 and 25.
CELESTIAL BODY (OBJECT IN SPACE) APPROXIMATE DISTANCE FROM EARTH (MILES)
Sun 108
Saturn 109
Andromeda Galaxy (nearest major galaxy) 1019
Quasar OQ172 (one of the remotest objects known) 1022
Copy and complete these sentences.
23 ▶ The Andromeda Galaxy is … times further away from the Earth than Saturn.
24 ▶ The quasar OQ172 is … times further away from the Earth than the Andromeda Galaxy.
25 ▶ To make a scale model showing the distances of the four bodies from the Earth, a student marks the Sun 1 cm from the Earth. How far along the line should the other three celestial bodies (objects in space) be placed?
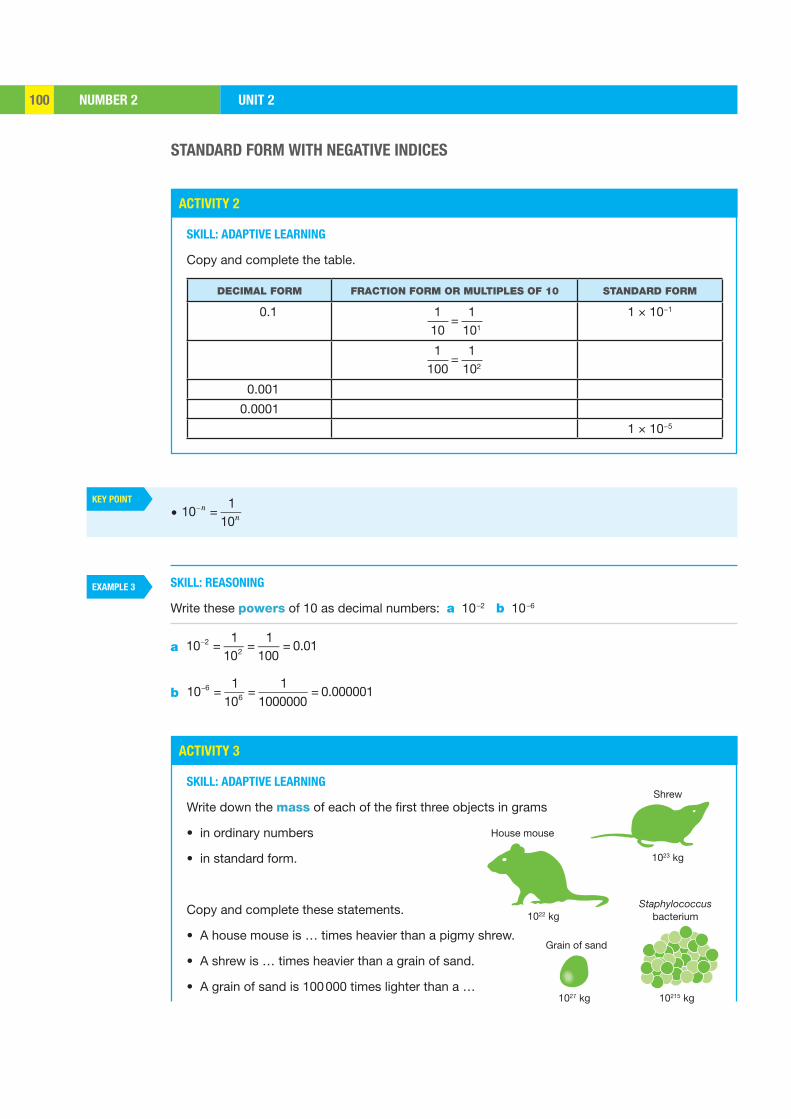
NUMBER 2 UNIT 2100
ACTIVITY 2
ACTIVITY 3
KEY POINT
EXAMPLE 3
STANDARD FORM WITH NEGATIVE INDICES
• 10 n =
110n
SKILL: ADAPTIVE LEARNING
Copy and complete the table.
DECIMAL FORM FRACTION FORM OR MULTIPLES OF 10 STANDARD FORM
0.1 110
1101
=1 × 10⁻¹
1100
1102
=
0.001
0.0001
1 × 10⁻⁵
SKILL: ADAPTIVE LEARNING
Write down the mass of each of the first three objects in grams
• in ordinary numbers
• in standard form.
Copy and complete these statements.
• A house mouse is … times heavier than a pigmy shrew.
• A shrew is … times heavier than a grain of sand.
• A grain of sand is 100 000 times lighter than a …
SKILL: REASONING
Write these powers of 10 as decimal numbers: a 10–2 b 10–6
a 10 2 =1
102 =1
100= 0.01
b 10 6 =1
106 =1
1000000= 0.000001
Grain of sand
1027 kg 10215 kg
Staphylococcusbacterium
House mouse
1022 kg
Shrew
1023 kg
NUMBER 2UNIT 2 101
EXAMPLE 4
EXAMPLE 5
EXERCISE 2
8
9
• A shrew is 10 000 times heavier than a …
• A … is 100 million times heavier than a …
• A house mouse is … 10 000 billion times heavier than a …
SKILL: REASONING
Write 0.987 in standard form.
Write the number between 1 and 10 first.
0.987 = −× = × 1110
9.87 9.87 10
To display this on your calculator, press 9 8 7 x
SKILL: REASONING
Write 3.75 × 10⁻³ as an ordinary number.
Write the number between 1 and 10 first.
3.75 × 10–3 = 3.75 × 1
103 = 0.003 75
Write each number in standard form.
1 ▶ 0.1 3 ▶ 0.001 5 ▶ 1
1000 7 ▶ 10
2 ▶ 0.01 4 ▶ 0.0001 6 ▶ 1
100 8 ▶ 1
Write each number as an ordinary number.
9 ▶ 10 3 11 ▶ 1.2 10 3× 13 ▶ 10 6 15 ▶ 4.67 10 2×
10 ▶ 10 5 12 ▶ 8.7 10 1× 14 ▶ 10 4 16 ▶ 3.4 10 4×
Write each number in standard form.
17 ▶ 0.543 19 ▶ 0.007 21 ▶ 0.67 23 ▶ 100
18 ▶ 0.0708 20 ▶ 0.0009 22 ▶ 0.000 707 24 ▶ 1000
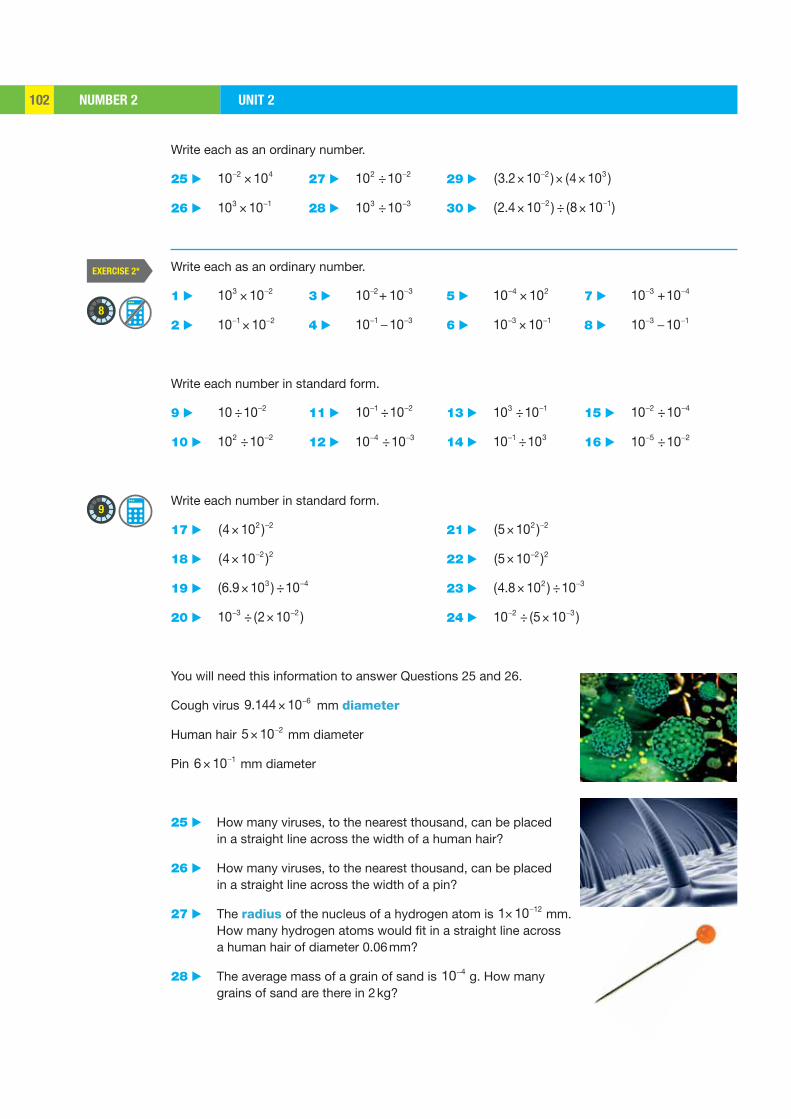
NUMBER 2 UNIT 2102
EXERCISE 2*
8
9
Write each as an ordinary number.
25 ▶ 10 2 104× 27 ▶ 102 ÷10 2 29 ▶ (3.2 10 2 ) (4 103 )× × ×
26 ▶ 103 10 1× 28 ▶ 103 ÷10 3 30 ▶ (2.4 10 2 ) ÷ (8 10 1)××
Write each as an ordinary number.
1 ▶ 103 10 2× 3 ▶ 10 2+ 10 3 5 ▶ 10 4 102× 7 ▶ 10 3 +10 4
2 ▶ 10 1 10 2× 4 ▶ 10 1 10 3 6 ▶ 10 3 10 1× 8 ▶ 10 3 10 1
Write each number in standard form.
9 ▶ 10 ÷10 2 11 ▶ 10 1 ÷10 2 13 ▶ 103 ÷10 1 15 ▶ 10 2 ÷10 4
10 ▶ 102 ÷10 2 12 ▶ 10 4 ÷10 3 14 ▶ 10 1 ÷103 16 ▶ 10 5 ÷10 2
Write each number in standard form.
17 ▶ (4 102 ) 2× 21 ▶ (5 102 ) 2×
18 ▶ (4 10 2 )2× 22 ▶ (5 10 2 )2×
19 ▶ (6.9 103 ) ÷10 4× 23 ▶ (4.8 102 ) ÷10 3×
20 ▶ 10 3 ÷ (2 10 2 )× 24 ▶ 10 2 ÷ (5 10 3 )×
You will need this information to answer Questions 25 and 26.
Cough virus 9.144 10 6× mm diameter
Human hair 5 10 2× mm diameter
Pin 6 10 1× mm diameter
25 ▶ How many viruses, to the nearest thousand, can be placed in a straight line across the width of a human hair?
26 ▶ How many viruses, to the nearest thousand, can be placed in a straight line across the width of a pin?
27 ▶ The radius of the nucleus of a hydrogen atom is 1 10 12× mm. How many hydrogen atoms would fit in a straight line across a human hair of diameter 0.06 mm?
28 ▶ The average mass of a grain of sand is 10 4 g. How many grains of sand are there in 2 kg?
NUMBER 2UNIT 2 103
EXAMPLE 6
EXAMPLE 7
KEY POINT
10
29 ▶ Find a sensible method to work out (3.4 1023 ) + (3.4 1022 )× × without a calculator.
30 ▶ A molecule of water is a very small thing, so small that its volume is 10 27 m3.
a How many molecules are there in 1 m3 of water? If you wrote your answer in full, how many zero digits would there be?
b If you assume that a water molecule is in the form of a cube, show that its side length is 10 9 m.
c If a number of water molecules were placed touching each other in a straight line, how many would there be in a line 1 cm long?
d The volume of a cup is 200 cm3. How many molecules of water would the cup hold?
e If all the molecules in the cup were placed end to end in a straight line, how long would the line be?
f Take the circumference of the Earth to be 40 000 km. How many times would the line of molecules go around the Earth?
PERCENTAGES
Percentages are numbers without a dimension that help us make fast judgements. Values are scaled to be out of 100. Percentages appear frequently in everyday life. They can be used to compare quantities and work out a percentage change such as profit or loss.
x AS A PERCENTAGE OF y
SKILL: REASONING
Calculate $5 as a percentage of $80.
Express the ratio as a fraction and multiply by 100.
$5 as a percentage of $80 = × =580
1 00 6.25%
x PERCENT OF y
SKILL: REASONING
Calculate 5% of 80 kg.
1% of 80 kg = 80
100 so 5% = 5 ×
80100
= 80 × = ×5100
80 0.05 = 4 kg
• To calculate x as a percentage of y: xy
100×
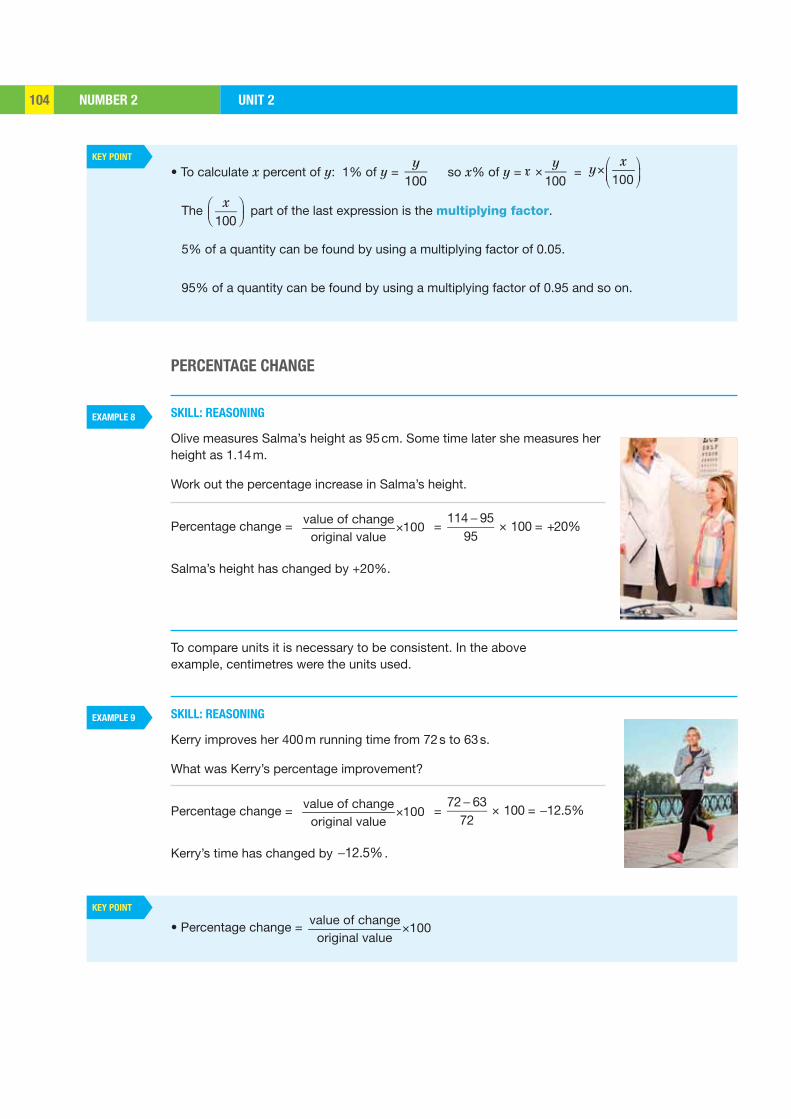
NUMBER 2 UNIT 2104
KEY POINT
KEY POINT
EXAMPLE 8
EXAMPLE 9
• To calculate x percent of y: 1% of y = y
100 so x% of y = x
y100
× = ⎛ ⎞×⎜ ⎟⎝ ⎠
100
xy
The x
100 part of the last expression is the multiplying factor.
5% of a quantity can be found by using a multiplying factor of 0.05.
95% of a quantity can be found by using a multiplying factor of 0.95 and so on.
• Percentage change = ×value of change
100original value
PERCENTAGE CHANGE
SKILL: REASONING
Olive measures Salma’s height as 95 cm. Some time later she measures her height as 1.14 m.
Work out the percentage increase in Salma’s height.
Percentage change = ×value of change
100original value
= 114 95
95 100 = +20%×
Salma’s height has changed by +20%.
To compare units it is necessary to be consistent. In the above example, centimetres were the units used.
SKILL: REASONING
Kerry improves her 400 m running time from 72 s to 63 s.
What was Kerry’s percentage improvement?
Percentage change = ×value of change
100original value
= 72 63
72 100 = 12.5%×
Kerry’s time has changed by 12.5%.
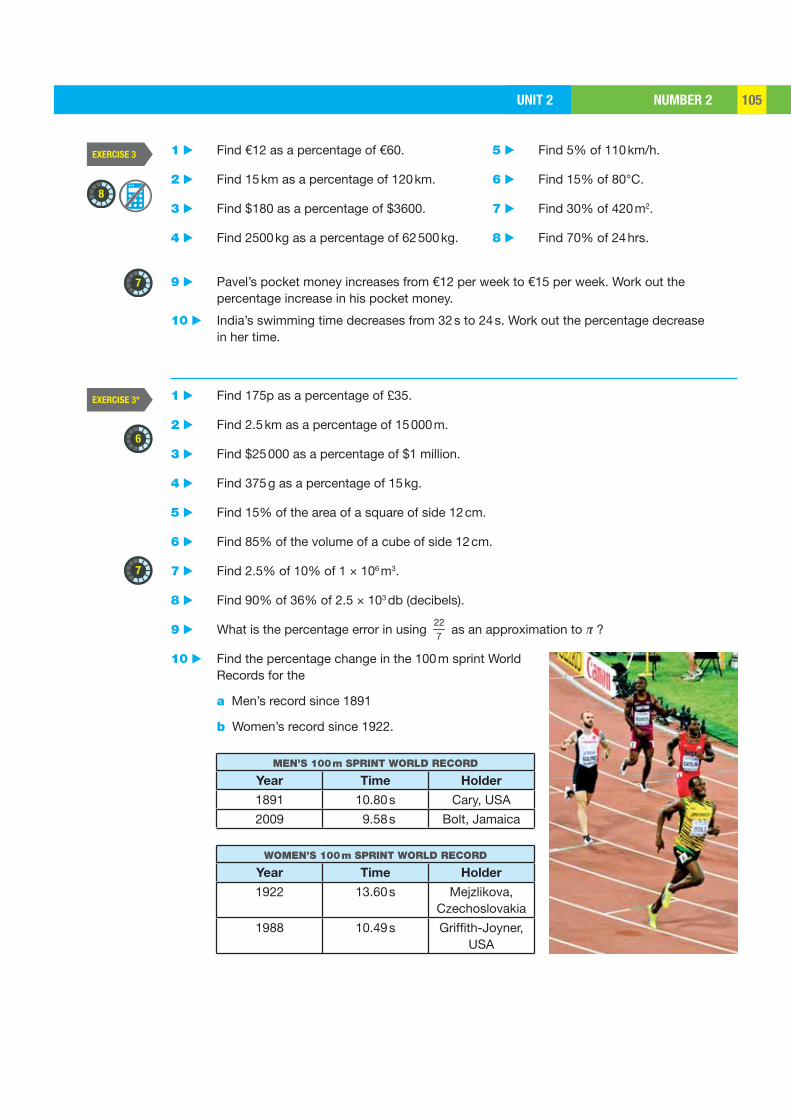
NUMBER 2UNIT 2 105
EXERCISE 3
EXERCISE 3*
8
7
6
7
1 ▶ Find €12 as a percentage of €60. 5 ▶ Find 5% of 110 km/h.
2 ▶ Find 15 km as a percentage of 120 km. 6 ▶ Find 15% of 80°C.
3 ▶ Find $180 as a percentage of $3600. 7 ▶ Find 30% of 420 m2.
4 ▶ Find 2500 kg as a percentage of 62 500 kg. 8 ▶ Find 70% of 24 hrs.
9 ▶ Pavel’s pocket money increases from €12 per week to €15 per week. Work out the percentage increase in his pocket money.
10 ▶ India’s swimming time decreases from 32 s to 24 s. Work out the percentage decrease in her time.
1 ▶ Find 175p as a percentage of £35.
2 ▶ Find 2.5 km as a percentage of 15 000 m.
3 ▶ Find $25 000 as a percentage of $1 million.
4 ▶ Find 375 g as a percentage of 15 kg.
5 ▶ Find 15% of the area of a square of side 12 cm.
6 ▶ Find 85% of the volume of a cube of side 12 cm.
7 ▶ Find 2.5% of 10% of 1 × 10⁶ m3.
8 ▶ Find 90% of 36% of 2.5 × 10³ db (decibels).
9 ▶ What is the percentage error in using 227
as an approximation to π ?
10 ▶ Find the percentage change in the 100 m sprint World Records for the
a Men’s record since 1891
b Women’s record since 1922.
MEN’S 100 m SPRINT WORLD RECORD
Year Time Holder
1891 10.80 s Cary, USA
2009 9.58 s Bolt, Jamaica
WOMEN’S 100 m SPRINT WORLD RECORD
Year Time Holder
1922 13.60 s Mejzlikova, Czechoslovakia
1988 10.49 s Griffith-Joyner, USA
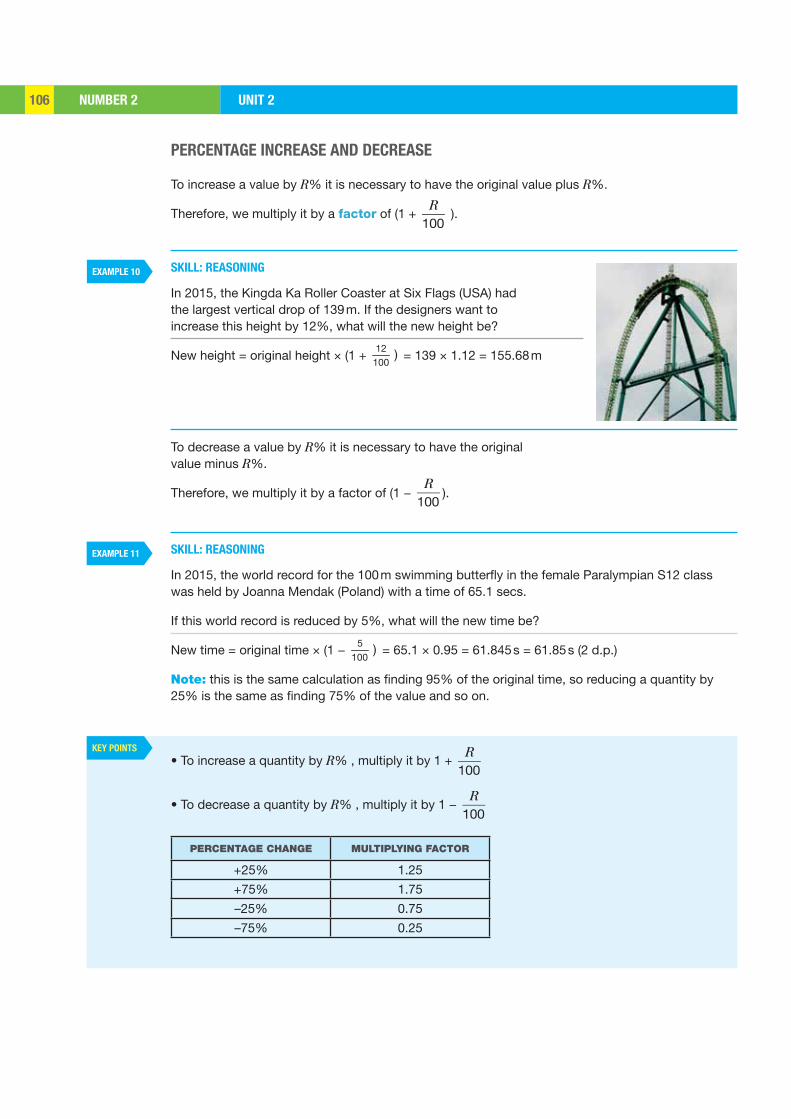
NUMBER 2 UNIT 2106
EXAMPLE 11
KEY POINTS
EXAMPLE 10
PERCENTAGE INCREASE AND DECREASE
To increase a value by R% it is necessary to have the original value plus R%.
Therefore, we multiply it by a factor of (1 + R
100 ).
SKILL: REASONING
In 2015, the Kingda Ka Roller Coaster at Six Flags (USA) had the largest vertical drop of 139 m. If the designers want to increase this height by 12%, what will the new height be?
New height = original height × (1 + 12
100 ) = 139 × 1.12 = 155.68 m
To decrease a value by R% it is necessary to have the original value minus R%.
Therefore, we multiply it by a factor of (1 − R
100).
SKILL: REASONING
In 2015, the world record for the 100 m swimming butterfly in the female Paralympian S12 class was held by Joanna Mendak (Poland) with a time of 65.1 secs.
If this world record is reduced by 5%, what will the new time be?
New time = original time × (1 − 5
100 ) = 65.1 × 0.95 = 61.845 s = 61.85 s (2 d.p.)
Note: this is the same calculation as finding 95% of the original time, so reducing a quantity by 25% is the same as finding 75% of the value and so on.
• To increase a quantity by R% , multiply it by 1 + R
100
• To decrease a quantity by R% , multiply it by 1 − R
100
PERCENTAGE CHANGE MULTIPLYING FACTOR
+25% 1.25
+75% 1.75
–25% 0.75
–75% 0.25
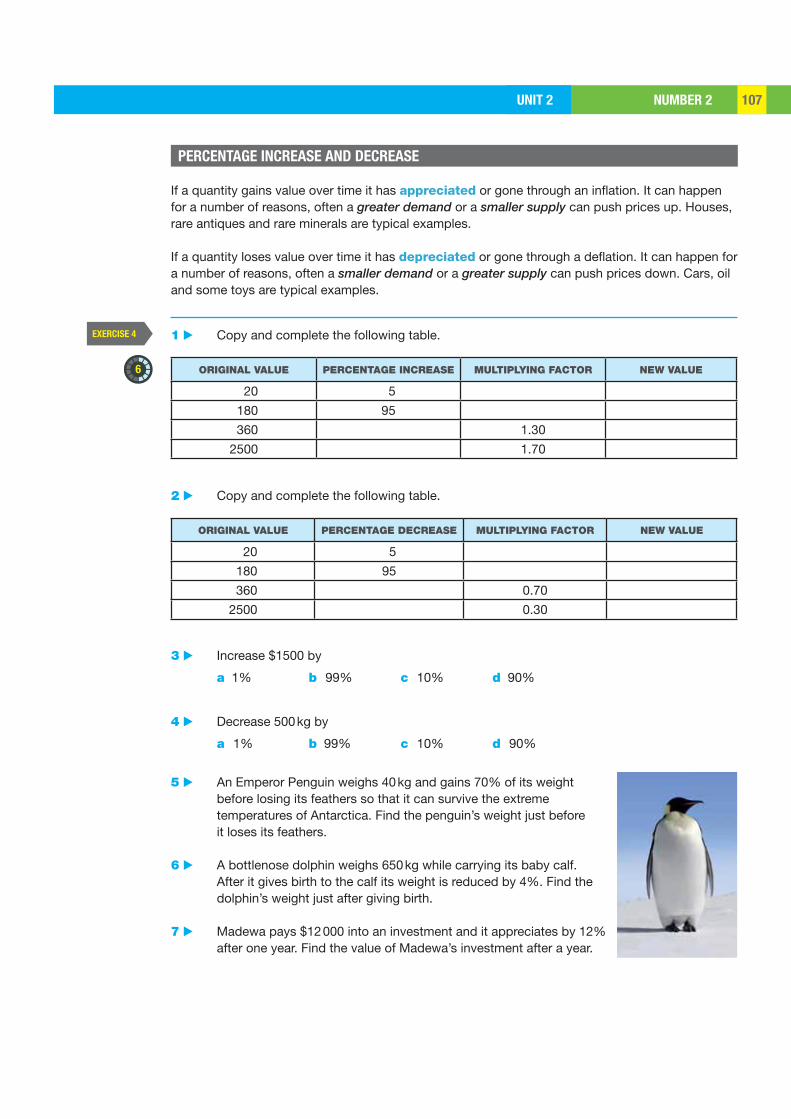
NUMBER 2UNIT 2 107
EXERCISE 4
6
If a quantity gains value over time it has appreciated or gone through an inflation. It can happen for a number of reasons, often a greater demand or a smaller supply can push prices up. Houses, rare antiques and rare minerals are typical examples.
If a quantity loses value over time it has depreciated or gone through a deflation. It can happen for a number of reasons, often a smaller demand or a greater supply can push prices down. Cars, oil and some toys are typical examples.
1 ▶ Copy and complete the following table.
ORIGINAL VALUE PERCENTAGE INCREASE MULTIPLYING FACTOR NEW VALUE
20 5
180 95
360 1.30
2500 1.70
2 ▶ Copy and complete the following table.
ORIGINAL VALUE PERCENTAGE DECREASE MULTIPLYING FACTOR NEW VALUE
20 5
180 95
360 0.70
2500 0.30
3 ▶ Increase $1500 by
a 1% b 99% c 10% d 90%
4 ▶ Decrease 500 kg by
a 1% b 99% c 10% d 90%
5 ▶ An Emperor Penguin weighs 40 kg and gains 70% of its weight before losing its feathers so that it can survive the extreme temperatures of Antarctica. Find the penguin’s weight just before it loses its feathers.
6 ▶ A bottlenose dolphin weighs 650 kg while carrying its baby calf. After it gives birth to the calf its weight is reduced by 4%. Find the dolphin’s weight just after giving birth.
7 ▶ Madewa pays $12 000 into an investment and it appreciates by 12% after one year. Find the value of Madewa’s investment after a year.
PERCENTAGE INCREASE AND DECREASE
NUMBER 2 UNIT 2108
EXERCISE 4*
6
7
8 ▶ Iris buys a new car for $45 000 and it depreciates by 12% after one year. Find the value of Iris’ car after a year.
9 ▶ A rare sculpture is worth €120 000 and appreciates by 8% p.a. Find the value of the sculpture after one year.
10 ▶ A rare stamp is worth €2500 and depreciates by 8% p.a. Find the value of the stamp after one year.
1 ▶ Copy and complete the following table.
ORIGINAL VALUE PERCENTAGE INCREASE MULTIPLYING FACTOR NEW VALUE
60 secs 75 secs
50 kg 80 kg
1.25 125 km/h
20 1500 m
2 ▶ Copy and complete the following table.
ORIGINAL VALUE PERCENTAGE DECREASE MULTIPLYING FACTOR NEW VALUE
75 secs 60 secs
80 kg 50 kg
120 km/h 0.60
1500 m 20
3 ▶ A $24 box of luxury chocolates is sold in Canada where the inflation rate is 2% p.a. Find the new price of these chocolates in Canada after a year.
4 ▶ The cost of oil is $45 per barrel (a standard unit) and the price goes through a deflation rate of 12% p.a. Find the new price of a barrel after one year.
5 ▶ A Persian rug is worth £5750. It goes through an increase of 5% followed by a second increase of 12%. Find the price of the rug after the second increase.
6 ▶ A super-size hi-definition TV costs £7500. It goes through a decrease of 10% followed by a second decrease of 12% in the sales. Find the price of the TV after the second decrease.
7 ▶ The temperature in Doha, Qatar on 1 June is 40°C. Over the next two days this temperature increases by 10% followed by a decrease of 10%. Find the temperature in Doha on 3 June.
NUMBER 2UNIT 2 109
EXERCISE 5
6
8
8 ▶ A loud clap of thunder is measured at a noise level of 120 decibels (the unit for measuring sound). The next two thunderclaps register a decrease of 20% followed by a 25% increase in noise level. How loud, in decibels, is the third thunderclap?
9 ▶ A circular drop of oil has a radius of 10 cm. If this radius increases by 5% then by 10% and finally by 15%, find the new area of the circle. (Area of circle A = r 2)
10 ▶ A circular drop of oil has a diameter of 10 cm. If this diameter decreases by 5% then by 10% and finally by 15%, find the new circumference of the circle. (Circumference of circle = 2 r )
REVISION
1 ▶ Write 275 000 in standard form.
2 ▶ Write 0.0275 in standard form.
3 ▶ Write 3.5 × 10³ as an ordinary number.
4 ▶ Write 3.5 × 10⁻³ as an ordinary number.
5 ▶ Find 18% of $360 000.
6 ▶ Write 240 m as a percentage of 12 000 m.
7 ▶ Luke’s salary changes from €75 000 p.a. to €100 000 p.a. Find the percentage increase in Luke’s salary.
8 ▶ Mari’s watch gains 3 minutes every hour. Find the percentage error in Mari’s watch at
the end of one hour.
9 ▶ Increase $350 by 17.5%.
10 ▶ Decrease $350 by 17.5%.
NUMBER 2 UNIT 2110
EXERCISE 5*
9
6
REVISION
1 ▶ Write (4.5 × 103) × (5 × 103) as an ordinary number.
2 ▶ Write 0.1 + 0.02 + 0.003 in standard form.
3 ▶ Write 5.3 × 10⁴ + 5.3 × 10³ as an ordinary number.
4 ▶ Write 2.5 103 6 102
3 10 6
× × ××
in standard form.
5 ▶ Find 15% of the perimeter of a square of area 1024 m2.
6 ▶ Write a time of 1 second as a percentage of 1 day. Express your answer in standard form to 3 s.f.
7 ▶ When Fredrick buys a cup of coffee he is given change of €1.65 when he should have received €1.50. Find the percentage error.
8 ▶ Find the percentage error in x when it is estimated to be y and y > x.
9 ▶ Erika’s toy ski chalet is valued at €450. Its value increases by 10% then decreases by 10% the year after. What is the value of Erika’s toy after these two changes?
10 ▶ Akintade makes the following purchases and sales:
a He buys a jewel for $180, then sells it for $216. Find his percentage profit.
b He buys a toy car for $150, then sells it for $120. Find his percentage loss.

EXAM PRACTICEUNIT 2 111
1
6
2
7
3
4
5Write the following numbers in standard form.
a 4500b 3 millionc 0.0075d a quarter [4]
Write the following as ordinary numbers.
a 1.2 × 10³ b 5.8 × 10⁶ c 4.5 × 10⁻¹ d 9.3 × 10⁻³ [4]
Write the following in standard form to 3 s.f.
a (2.5 × 102) × (1.7 × 105)
b ××
6
3
7.3 1 02.1 1 0
c (7.3 × 10⁵) + (7.3 × 10⁴) [6]
The human body contains about 60% water. How many kg of water are contained in a 75 kg man? [2]
Between 2010 and 2015 the human population of India grew from 1.21 × 10⁹ to 1.29 × 10⁹. The world population in 2015 was 7.39 billion.
Find the percentage
a of the world population that lived in India in 2015
b change in the Indian population from 2010 to 2015. [4]
A square has its side length increased by 10%. Find the percentage increase in the area of the square. [2]
The Womens’ World Record Marathon time has improved by 34.82% from Dale Grieg’s (UK) time of 3 hrs 27 mins 45 s in 1964 to Paula Radcliffe’s (UK) time in 2003. Find Paula Radcliffe’s World Record time. [3]
[Total 25 marks]
EXAM PRACTICE: NUMBER 2
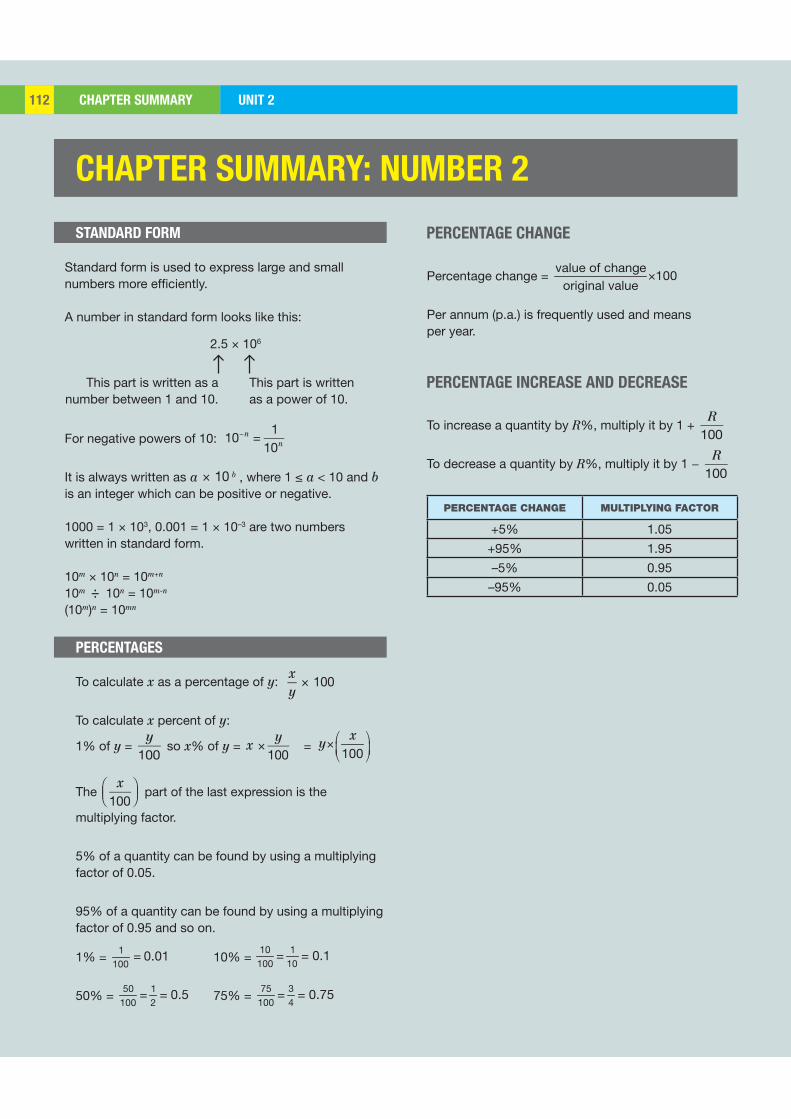
CHAPTER SUMMARY UNIT 2112
CHAPTER SUMMARY: NUMBER 2
STANDARD FORM PERCENTAGE CHANGE
PERCENTAGE INCREASE AND DECREASE
PERCENTAGES
Standard form is used to express large and small numbers more efficiently.
A number in standard form looks like this:
For negative powers of 10: 10 n =1
10n
It is always written as a 10× b , where 1 ≤ a < 10 and b is an integer which can be positive or negative.
1000 = 1 × 10³, 0.001 = 1 × 10⁻³ are two numbers written in standard form.
10m × 10n = 10m+n
10m ÷ 10n = 10m-n
(10m)n = 10mn
Percentage change = ×value of change
100original value
Per annum (p.a.) is frequently used and means per year.
To increase a quantity by R%, multiply it by 1 + R
100
To decrease a quantity by R%, multiply it by 1 − R
100
PERCENTAGE CHANGE MULTIPLYING FACTOR
+5% 1.05
+95% 1.95
–5% 0.95
–95% 0.05
To calculate x as a percentage of y: xy
100×
To calculate x percent of y:
1% of y = y
100 so x% of y = x
y100
× = ⎛ ⎞×⎜ ⎟⎝ ⎠
100
xy
The x
100 part of the last expression is the
multiplying factor.
5% of a quantity can be found by using a multiplying factor of 0.05.
95% of a quantity can be found by using a multiplying factor of 0.95 and so on.
1% = =1100
0.01 10% = = =110
10100
0.1
50% = = =50100
12 0.5 75% = = =75 3
100 4 0.75
This part is written as a number between 1 and 10.
This part is written as a power of 10.
2.5 × 10⁶
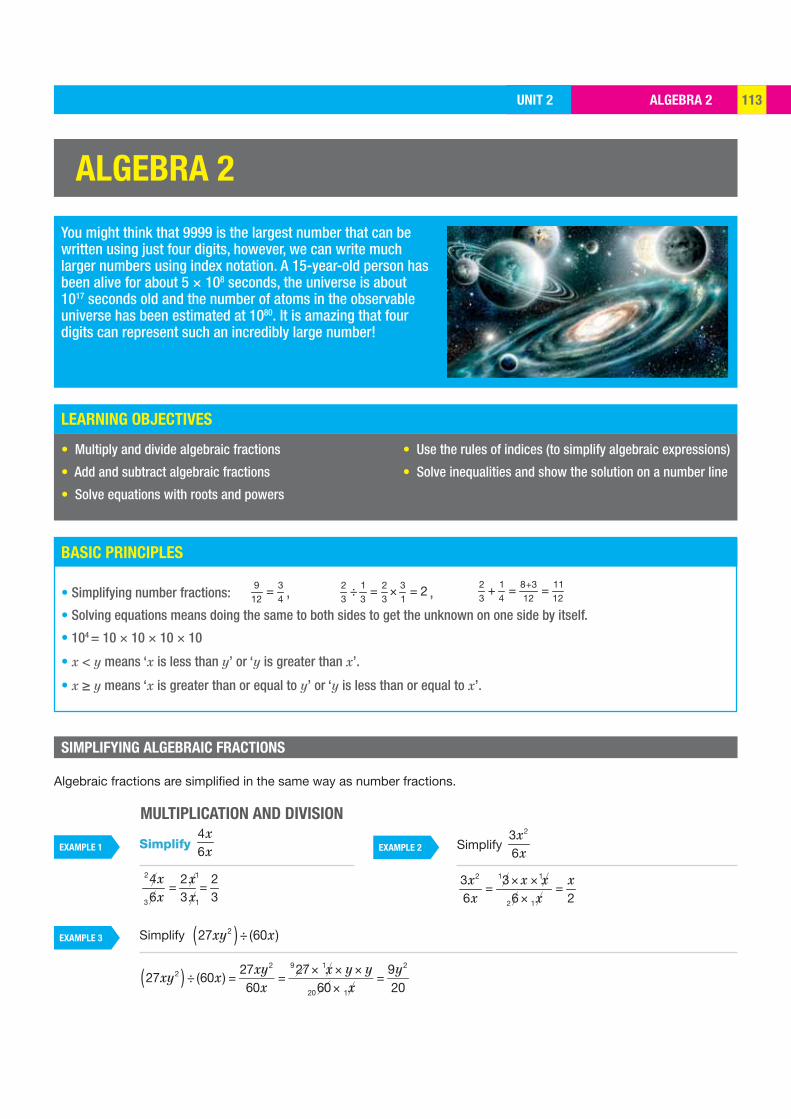
ALGEBRA 2UNIT 2 113
LEARNING OBJECTIVES
BASIC PRINCIPLES
EXAMPLE 1
EXAMPLE 3
ALGEBRA 2
You might think that 9999 is the largest number that can be written using just four digits, however, we can write much larger numbers using index notation. A 15-year-old person has been alive for about 5 × 10⁸ seconds, the universe is about 1017 seconds old and the number of atoms in the observable universe has been estimated at 1080. It is amazing that four digits can represent such an incredibly large number!
• Multiply and divide algebraic fractions
• Add and subtract algebraic fractions
• Solve equations with roots and powers
• Use the rules of indices (to simplify algebraic expressions)
• Solve inequalities and show the solution on a number line
SIMPLIFYING ALGEBRAIC FRACTIONS
• Simplifying number fractions: =9 312 4 , ÷ = × =2 1 2 3
3 3 3 1 2 ,
++ = =2 1 8 3 113 4 12 12
• Solving equations means doing the same to both sides to get the unknown on one side by itself.
• 104 = 10 × 10 × 10 × 10
• x < y means ‘x is less than y’ or ‘y is greater than x’.
• x ≥ y means ‘x is greater than or equal to y’ or ‘y is less than or equal to x’.
Simplify 46
xx
= =2
3
4 2 26 3 3
x xx x
Simplify 27xy2( ) ÷ (60x)
27xy2( ) ÷ (60x) =27xy2
60x=
927 1x y y
2060 1x=
9y2
20× × ×
×
EXAMPLE 2 Simplify 23
6xx
= =×2 1
3 36 6 2x x x xx x
× ×2 1 11
1
Algebraic fractions are simplified in the same way as number fractions.
MULTIPLICATION AND DIVISION
ALGEBRA 2 UNIT 2114
EXERCISE 1
EXERCISE 1*
EXAMPLE 4
EXAMPLE 5
KEY POINT
7
8
7
8
Simplify these.
1 ▶ 4xx
2 ▶ 6y2
3 ▶ (6x) ÷ (3x)
4 ▶ 12a4b
5 ▶ 3ab6a
6 ▶ 9a( ) ÷ 3b( )
7 ▶ 12c2
3c
8 ▶ 4a2
8a
9 ▶ 12x3x2
10 ▶ 8ab2
4ab
11 ▶ 3a
15ab2
12 ▶ 3a2b2( ) ÷ 12ab2( )
Simplify these.
1 ▶ 5y
10y
2 ▶ 12a6ab
3 ▶ 3xy( ) ÷ 12y( )
4 ▶ 3a2
6a
5 ▶ 10b5b2
6 ▶ 18a( ) ÷ 3ab2( )
7 ▶ 3a2b2
6ab3
8 ▶ 15abc
5a2b2c2
9 ▶ 3a2( ) ÷ 12ab2( )
10 ▶ abc3
abc( )3
11 ▶ 150a3b2
400a2b3
12 ▶ 45x3y4z5
150x5y4z3
Simplify ×2 33x y
y x
× × × ×× = × =
2 3 1 12
1 1
3 33
x y x x y y yxy
y x y x
Simplify ÷2
3
2 25
x xy y
× × × × ×
÷ = × =×
2 1 1 12
31 1 1
2 2 2 55
25x x x x y y y
xyy y xy
• To divide by a fraction, turn the fraction upside down and multiply.
a c a db d b c
÷ = × adbc
=
ALGEBRA 2UNIT 2 115
EXERCISE 2
EXERCISE 2*
EXAMPLE 6 EXAMPLE 7
EXAMPLE 9 EXAMPLE 8
8
8
9
Simplify these.
1 ▶ 3x4
5x3
×
2 ▶ x2yz
xz2
y2×
3 ▶ x2
yzx2
yz
××
4 ▶ 4c 7c2
7 5c××
5 ▶ 3x4
÷x8
6 ▶ 4 ÷8ab
7 ▶ 2b3
÷ 4
8 ▶ 2x3
÷2x3
9 ▶ 2xy2 ÷
xy
10 ▶ 5abc2 ÷
10ac
Simplify these.
1 ▶ 4a3
5a2
3a5
× ×
2 ▶ 3x2yz3
z2
xy×
3 ▶ 4550
p2
qq3
p× ×
4 ▶ 3xy
÷6x2
y
5 ▶ 15x2y
z÷
3xzy2
6 ▶ 2xy
3y4x
2y3
××
7 ▶ x
2y
32x3
÷2
9y2×
8 ▶ a3b2
6a3
3a5b
a3b2( )2÷
ab
a3b2×
Simplify +4 5a b
++ =
5 44 5 20a b a b
Simplify +2 13 2b b
++ = =
2 1 4 3 73 2 6 6b b b b
ADDITION AND SUBTRACTION
Simplify −35 3x x
−− = =
3 9 5 45 3 15 15x x x x x
Simplify
+ − + − − + − + −− = = =
3 2 3(3 ) 7( 2) 9 3 7 14 23 47 3 21 21 21
x x x x x x x
+ −−
3 27 3
x x
Remember to use brackets here. Note sign change.
ALGEBRA 2 UNIT 2116
EXERCISE 3
EXERCISE 3*
EXAMPLE 10
EXAMPLE 11
8
8
9
Simplify these.
1 ▶ x3
+x4
2 ▶ a3
a4
7 ▶ 2a3
a2
8 ▶ a4
+2b3
3 ▶ a3
+b4
4 ▶ 2x3
x4
5 ▶ 2a7
+3a14
6 ▶ a4
+b3
Simplify these.
1 ▶ x6
+2x9
2 ▶ 2a3
3a7
3 ▶ 2x5
+4y7
4 ▶ 3a4
+a3
5a6
5 ▶ 32b
+43b
6 ▶ 2d
+3d2
7 ▶ 2 x
5+
3 x10
8 ▶ y + 3
5y + 4
6
9 ▶ x 3
3+
x +54
2x 16
10 ▶ a
a 1a 1
a
SOLVING EQUATIONS WITH ROOTS AND POWERS
Solve 3x2 + 4 = 52.
3x2 + 4 = 52 (Subtract 4 from both sides)
3x2 = 48 (Divide both sides by 3)
x2 = 16 (Square root both sides)
x = ±4
Check: 3 × 16 + 4 = 52
Note: –4 is also an answer because (−4) × (−4) = 16.
Solve 5 x = 50.
5 x = 50 (Divide both sides by 5)
x = 10 (Square both sides)
x = 100
Check: 5 100 = 50×
ALGEBRA 2UNIT 2 117
EXERCISE 4*
EXERCISE 4
EXAMPLE 12
KEY POINT
9
9
10
Solve these equations.
Solve these equations.
1 ▶ 4x2 + 26 = 126
2 ▶ x2
73 = 4
3 ▶ x2 11
7= 10
4 ▶
1 ▶ 4x2 = 36
2 ▶ x2
3= 12
3 ▶ x2 +5 = 21
4 ▶ x2
2+5 = 37
5 ▶ x 3
4+5 = 6
6 ▶ 40 2x2
2= 4
7 ▶ 22 = 322x2
5
8 ▶ 3 + x( )2 = 169
5 ▶ 2x2 +5 = 23
6 ▶ 5x2 7 = 2
7 ▶ x +12
5= 5
8 ▶ x2 + 45
= 4
9 ▶ 3x2 +52
+ 4 = 8
10 ▶ 3 +
4 + x + 3( )26
= 3
9 ▶ x + 27 = 31
10 ▶ 4 x + 4 = 40
Solve x +53
= 1.
x +53
= 1 (Multiply both sides by 3)
(Square both sides)
x + 5 = 9 (Subtract 5 from both sides)
x = 4
Check: 4 +53
= 1
• To solve equations, do the same operations to both sides.
x +5 = 3
1x 42

ALGEBRA 2 UNIT 2118
KEY POINTS
EXAMPLE 13
EXAMPLE 14
EXAMPLE 15
EXERCISE 5
6
POSITIVE INTEGER INDICES
10 × 10 × 10 × 10 is written in a shorter form as 104. In the same way, a × a × a × a is written as a4.
To help you to understand how the rules of indices work, look carefully at these examples.
OPERATION EXAMPLE RULES
Multiplying a4 a2 = (a a a a) (a a) = a6 = a4+2× × × × × × Add the indices(am × an = am+n)
Dividing a4 ÷a2 =
a a a aa a
= a2 = a4 2× × ××
Subtract the indices
(am ÷ an = am-n)
Raising to a
power(a4 )2 = (a a a a) (a a a a) = a8 = a4 2× × × × × × ×
Multiply the indices
(am)n = amn
Use the rules of indices to simplify 63 × 64. Then use your calculator to check the answer.
63 × 64 = 67 = 279 936 (Add the indices)
Simplify 95 ÷ 92.
95 ÷ 92 = 93 = 729 (Subtract the indices)
Simplify (42)5 = 410.
(42)5 = 410 = 1 048 576 (Multiply the indices)
Some answers become very large after only a few multiplications.
7x
x
x
1 ▶ 24 × 26
2 ▶ 43 × 44
3 ▶ 210 ÷ 24
4 ▶ 713
710
5 ▶ 23( )4
6 ▶ 62( )4
Use the rules of indices to simplify these. Then use your calculator to calculate the answer.
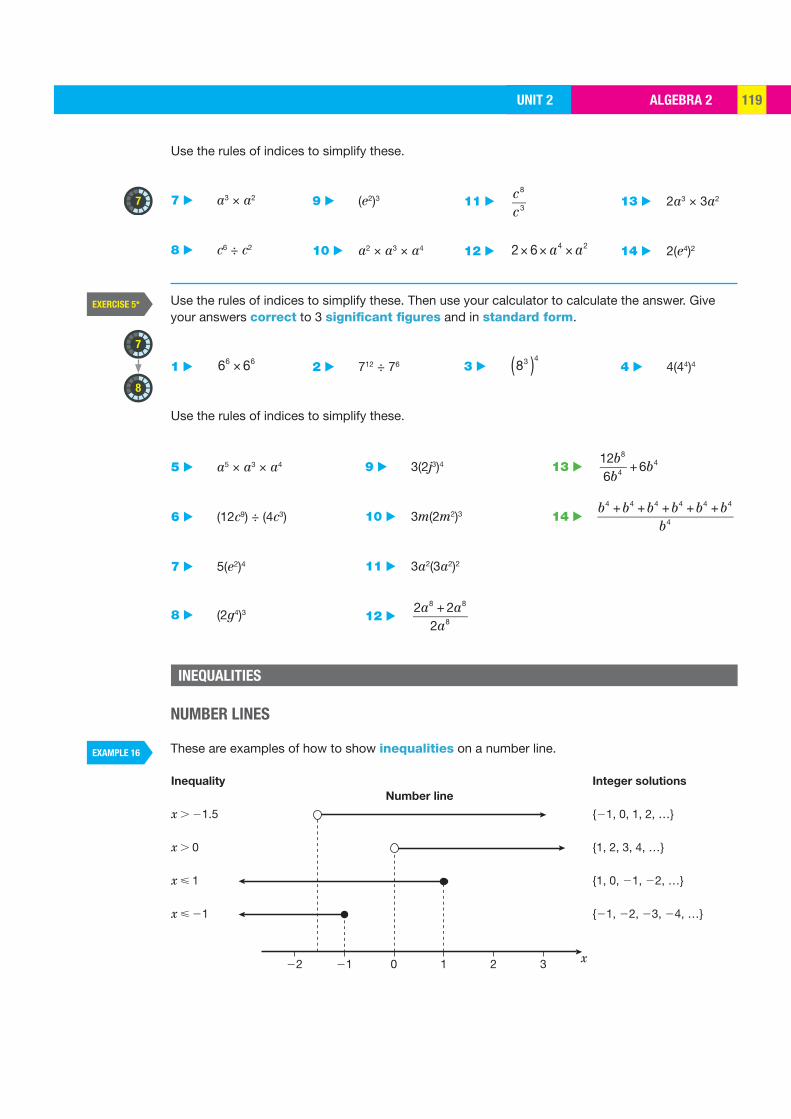
ALGEBRA 2UNIT 2 119
EXAMPLE 16
EXERCISE 5*
7
7
8
x22 21 0
Number line
Integer solutions
{21, 0, 1, 2, …}
{1, 2, 3, 4, …}
{1, 0, 21, 22, …}
{21, 22, 23, 24, …}
Inequality
x . 21.5
x . 0
x ø 1
x ø 21
1 2 3
INEQUALITIES
7 ▶ a3 × a2
8 ▶ c6 ÷ c2
1 ▶ 66 66×
13 ▶ 2a3 × 3a2
14 ▶ 2(e4)2
4 ▶ 4(44)4
9 ▶ (e2)3
10 ▶ a2 × a3 × a4
2 ▶ 712 ÷ 76
11 ▶ c8
c3
12 ▶ 2 6 a4 a2×××
3 ▶ 83( )4
Use the rules of indices to simplify these.
Use the rules of indices to simplify these. Then use your calculator to calculate the answer. Give your answers correct to 3 significant figures and in standard form.
Use the rules of indices to simplify these.
5 ▶ a5 × a3 × a4
6 ▶ (12c9) ÷ (4c3)
7 ▶ 5(e2)4
8 ▶ (2g4)3
9 ▶ 3(2j3)4
10 ▶ 3m(2m2)3
11 ▶ 3a2(3a2)2
12 ▶ 2a8 + 2a8
2a8
13 ▶ 12b8
6b4 +6b4
14 ▶
NUMBER LINES
These are examples of how to show inequalities on a number line.
b4 +b4 +b4 +b4 +b4 +b4
b4
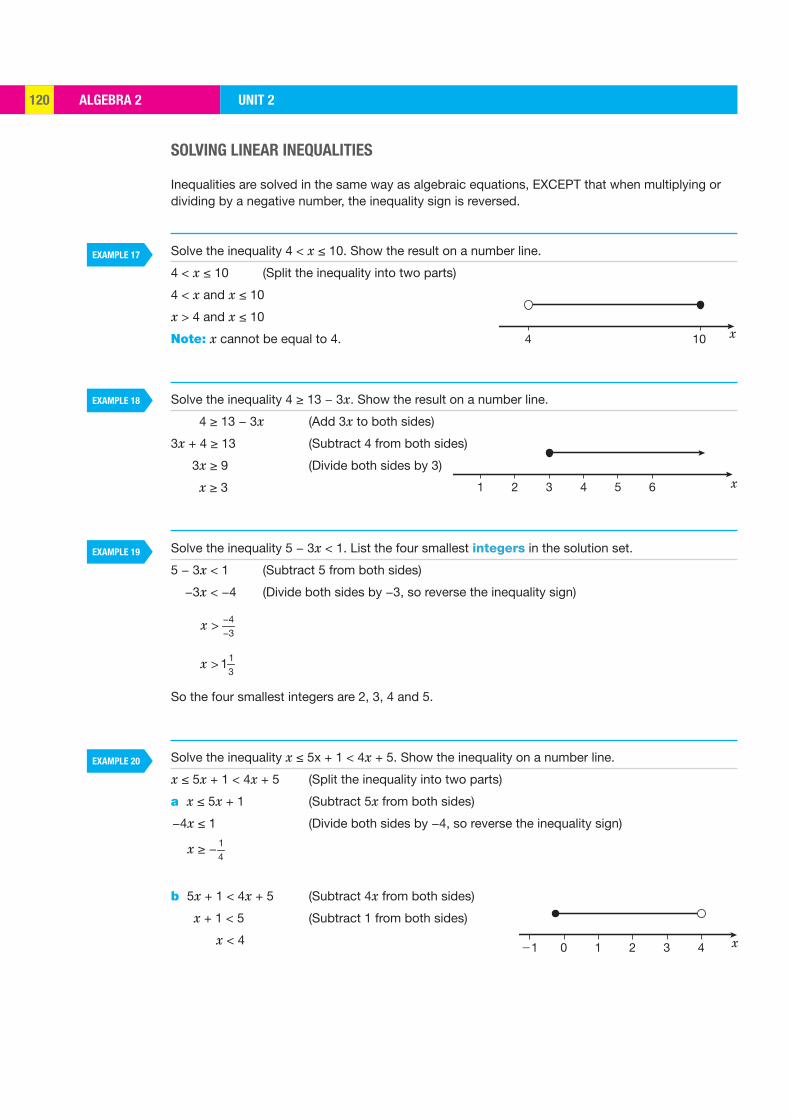
ALGEBRA 2 UNIT 2120
EXAMPLE 17
EXAMPLE 18
EXAMPLE 19
EXAMPLE 20
4 10 x
1 2 3 4 5 6 x
21 0 1 2 3 4 x
SOLVING LINEAR INEQUALITIES
Inequalities are solved in the same way as algebraic equations, EXCEPT that when multiplying or dividing by a negative number, the inequality sign is reversed.
Solve the inequality 4 < x ≤ 10. Show the result on a number line.
4 < x ≤ 10 (Split the inequality into two parts)
4 < x and x ≤ 10
x > 4 and x ≤ 10
Note: x cannot be equal to 4.
Solve the inequality 4 ≥ 13 − 3x. Show the result on a number line.
4 ≥ 13 − 3x (Add 3x to both sides)
3x + 4 ≥ 13 (Subtract 4 from both sides)
3x ≥ 9 (Divide both sides by 3)
x ≥ 3
Solve the inequality 5 − 3x < 1. List the four smallest integers in the solution set.
5 − 3x < 1 (Subtract 5 from both sides)
−3x < −4 (Divide both sides by −3, so reverse the inequality sign)
−−
> 43
x
> 1
31x
So the four smallest integers are 2, 3, 4 and 5.
Solve the inequality x ≤ 5x + 1 < 4x + 5. Show the inequality on a number line.
x ≤ 5x + 1 < 4x + 5 (Split the inequality into two parts)
a x ≤ 5x + 1 (Subtract 5x from both sides)
−4x ≤ 1 (Divide both sides by −4, so reverse the inequality sign)
b 5x + 1 < 4x + 5 (Subtract 4x from both sides)
x + 1 < 5 (Subtract 1 from both sides)
x < 4
≥ −41x
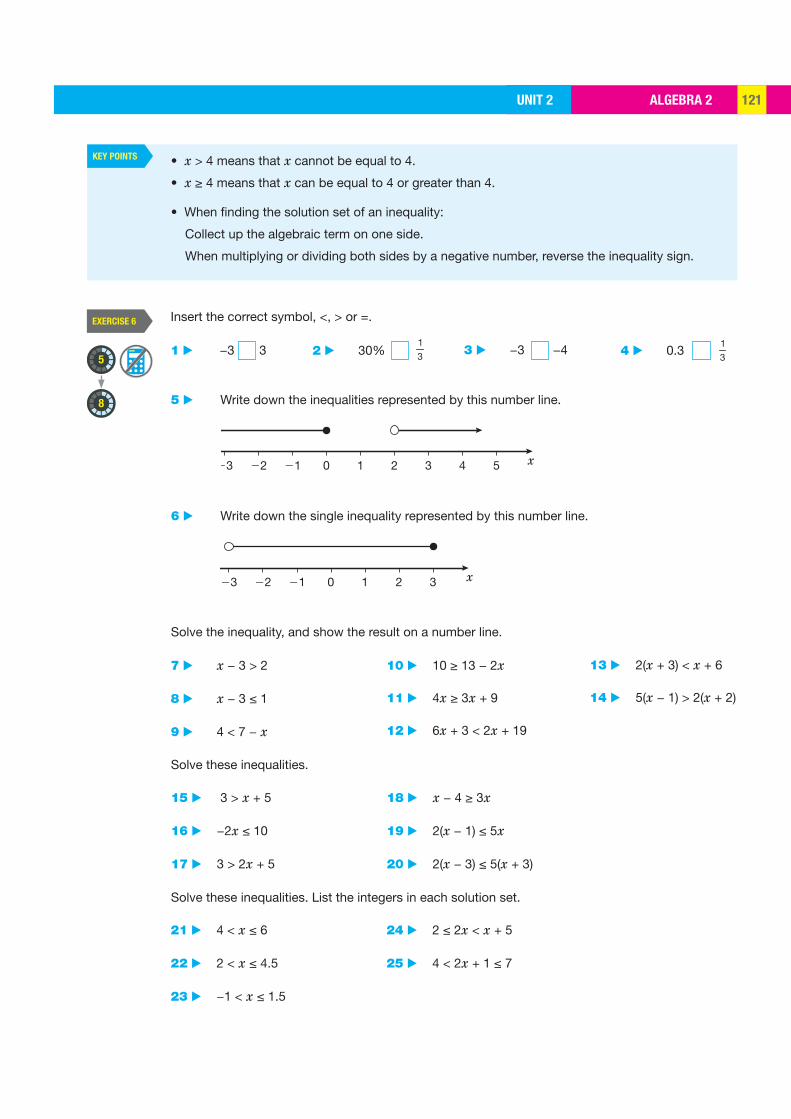
ALGEBRA 2UNIT 2 121
KEY POINTS
EXERCISE 6
5
8
22 21 0 1 2 323 x
21 0 1 2 3 422 523 x
• x > 4 means that x cannot be equal to 4.
• x ≥ 4 means that x can be equal to 4 or greater than 4.
• When finding the solution set of an inequality:
Collect up the algebraic term on one side.
When multiplying or dividing both sides by a negative number, reverse the inequality sign.
1 ▶ −3 3 4 ▶ 0.3 13
2 ▶ 30% 13
3 ▶ −3 −4
Insert the correct symbol, <, > or =.
5 ▶ Write down the inequalities represented by this number line.
6 ▶ Write down the single inequality represented by this number line.
Solve the inequality, and show the result on a number line.
7 ▶ x − 3 > 2
8 ▶ x − 3 ≤ 1
9 ▶ 4 < 7 − x
15 ▶ 3 > x + 5
16 ▶ −2x ≤ 10
17 ▶ 3 > 2x + 5
21 ▶ 4 < x ≤ 6
22 ▶ 2 < x ≤ 4.5
23 ▶ −1 < x ≤ 1.5
10 ▶ 10 ≥ 13 − 2x
11 ▶ 4x ≥ 3x + 9
12 ▶ 6x + 3 < 2x + 19
18 ▶ x − 4 ≥ 3x
19 ▶ 2(x − 1) ≤ 5x
20 ▶ 2(x − 3) ≤ 5(x + 3)
24 ▶ 2 ≤ 2x < x + 5
25 ▶ 4 < 2x + 1 ≤ 7
13 ▶ 2(x + 3) < x + 6
14 ▶ 5(x − 1) > 2(x + 2)
Solve these inequalities.
Solve these inequalities. List the integers in each solution set.

ALGEBRA 2 UNIT 2122
EXERCISE 6*
EXERCISE 7
6
8
9
9
5
21 0 1 2 3 422 5 x
1 ▶ Write down the inequalities represented by this number line.
Explain why your two answers cannot be combined into a single inequality.
Solve the inequality and show the result on a number line.
2 ▶ 3x ≤ x + 5
3 ▶ 5x + 3 < 2x + 19
4 ▶ 3(x + 3) < x + 12
1 ▶ 3yy
2 ▶ 4x4
3 ▶ 9x2
3x
5 ▶ 2(x − 1) > 7(x + 2)
6 ▶ x2
3 3x 8≥
7 ▶ −7 < 3x − 2 ≤ 11
4 ▶
2a3
6a
×
5 ▶ 6b4
÷3b2a
6 ▶ 10x2
39
5x×
8 ▶ x < 2x + 1 ≤ 7
7 ▶
y4
+y5
8 ▶ x3
x5
9 ▶ 2a5
+b
10
9 ▶ Find the largest prime number y that satisfies 4y ≤ 103.
10 ▶ List the integers that satisfy both the inequalities.
−3 ≤ x < 4 and x > 0
11 ▶ Solve the inequality, then list the four largest integers in the solution set.
x +14
x 13
≥
REVISION
Simplify these.
10 ▶ x2
2+ 2 = 10
13 ▶ a4 × a6
11 ▶ x2 + 2
2= 19
14 ▶ b7 ÷ b5
12 ▶ 4 + x
6= 2
15 ▶ (c4)3
Solve these.
Use the rules of indices to simplify these.
16 ▶ −2 −3 19 ▶ 0.1 10%17 ▶ 18
17 18 ▶ 0.0009 0.01
Rewrite each expression and insert the correct symbol <, > or = in the box.
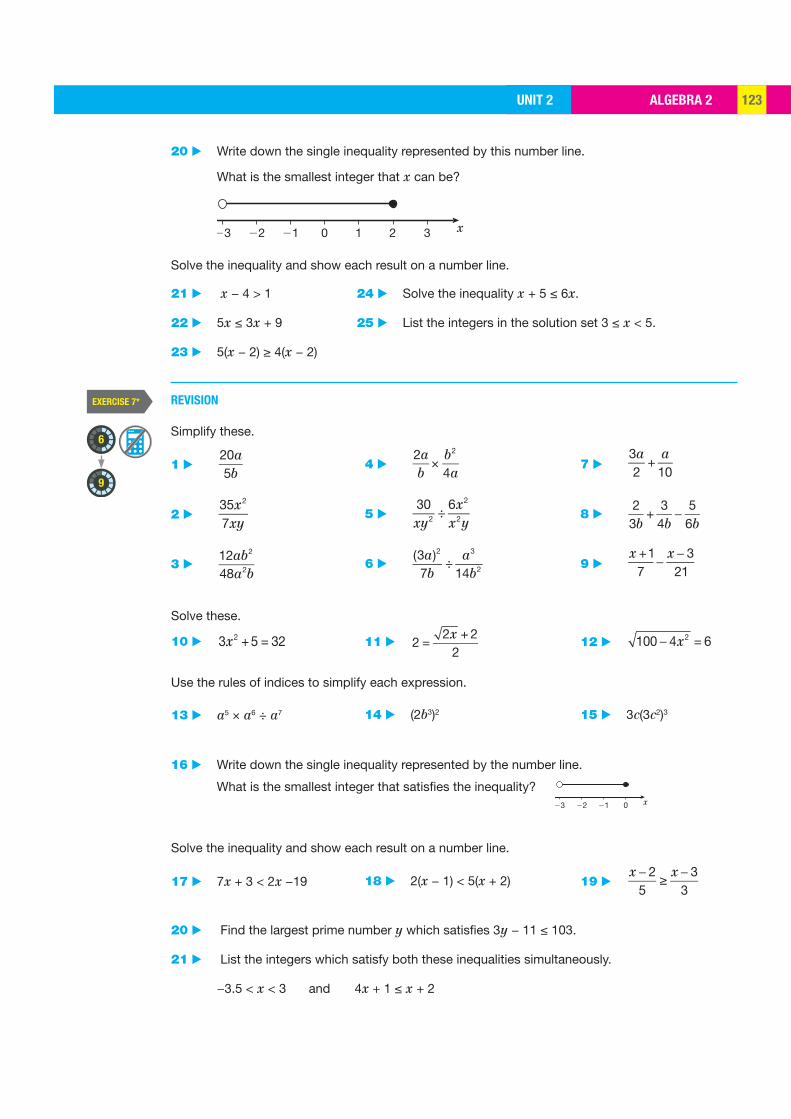
ALGEBRA 2UNIT 2 123
EXERCISE 7*
9
6
22 21 0 1 2 323 x
22 21 023 x
REVISION
10 ▶ 3x2 +5 = 32
13 ▶ a5 × a6 ÷ a7
17 ▶ 7x + 3 < 2x −19
11 ▶ 2 =2x + 2
2
14 ▶ (2b3)2
18 ▶ 2(x − 1) < 5(x + 2)
12 ▶ 100 4x2 = 6
15 ▶ 3c(3c2)3
19 ▶
x 25
x 33
≥
Solve these.
Use the rules of indices to simplify each expression.
Solve the inequality and show each result on a number line.
20 ▶ Write down the single inequality represented by this number line.
What is the smallest integer that x can be?
Solve the inequality and show each result on a number line.
Simplify these.
1 ▶ 20a5b
2 ▶ 35x2
7xy
3 ▶ 12ab2
48a2b
4 ▶ 2ab
b2
4a×
5 ▶ 30xy2 ÷
6x2
x2y
6 ▶ (3a)2
7b÷
a3
14b2
7 ▶ 3a2
+a10
8 ▶ 23b
+3
4b5
6b
9 ▶ x +1
7x 3
21
16 ▶ Write down the single inequality represented by the number line.
What is the smallest integer that satisfies the inequality?
21 ▶ x − 4 > 1
22 ▶ 5x ≤ 3x + 9
23 ▶ 5(x − 2) ≥ 4(x − 2)
24 ▶ Solve the inequality x + 5 ≤ 6x.
25 ▶ List the integers in the solution set 3 ≤ x < 5.
20 ▶ Find the largest prime number y which satisfies 3y − 11 ≤ 103.
21 ▶ List the integers which satisfy both these inequalities simultaneously.
−3.5 < x < 3 and 4x + 1 ≤ x + 2
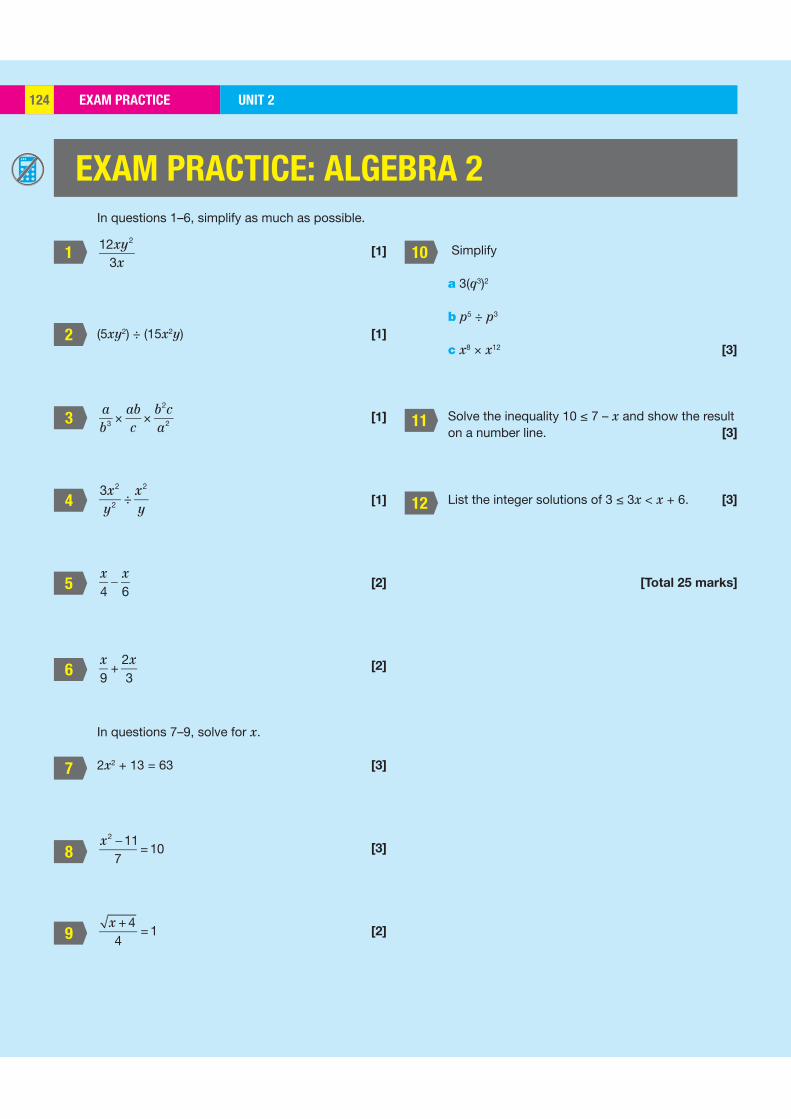
1
2
3
4
5
6
7
8
9
10
11
12
EXAM PRACTICE UNIT 2124
In questions 1–6, simplify as much as possible.
12xy2
3x [1]
(5xy2) ÷ (15x2y) [1]
ab3
abc
b2ca2× × [1]
3x2
y2 ÷x2
y [1]
x4
x6
[2]
x9
+2x3
[2]
In questions 7–9, solve for x.
2x2 + 13 = 63 [3]
x2 117
= 10 [3]
x + 44
= 1 [2]
Simplify
a 3(q3)2
b p5 ÷ p3
c x8 × x12 [3]
Solve the inequality 10 ≤ 7 – x and show the result on a number line. [3]
List the integer solutions of 3 ≤ 3x < x + 6. [3]
[Total 25 marks]
EXAM PRACTICE: ALGEBRA 2
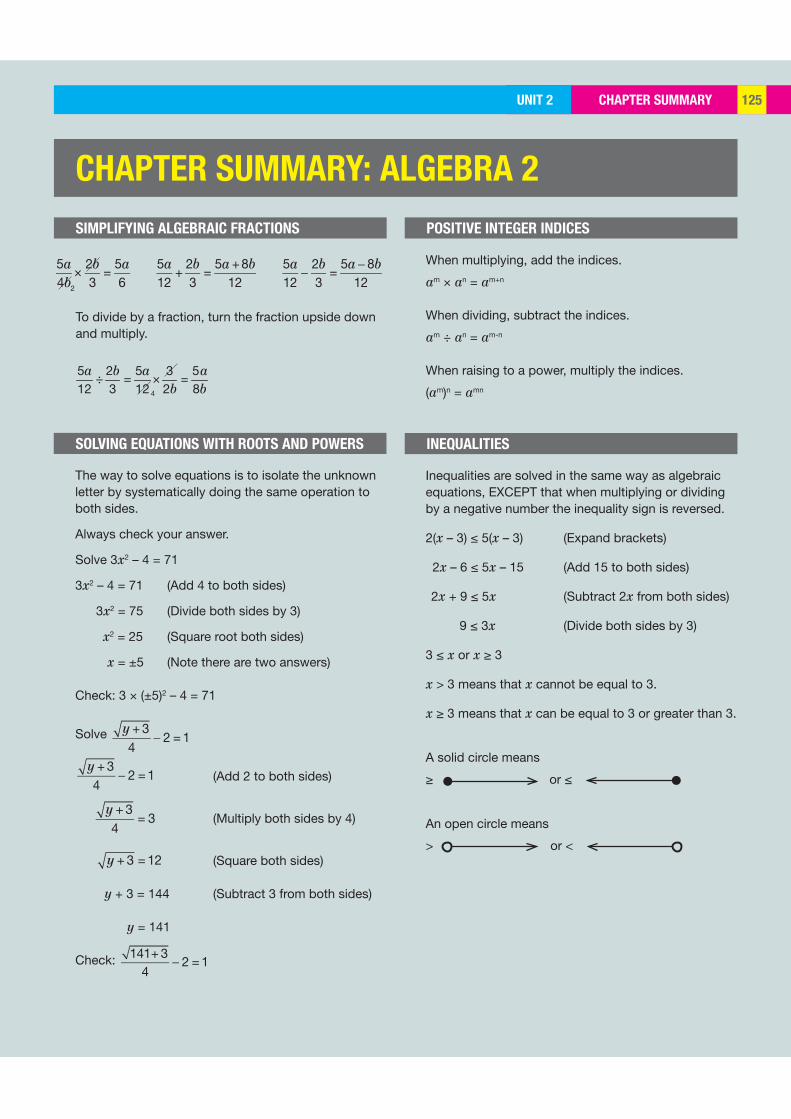
CHAPTER SUMMARYUNIT 2 125
CHAPTER SUMMARY: ALGEBRA 2
SIMPLIFYING ALGEBRAIC FRACTIONS
SOLVING EQUATIONS WITH ROOTS AND POWERS
5a4b
2b3
=5a6
×
5a12
+2b3
=5a +8b
12
5a12
2b3
=5a 8b
12
When multiplying, add the indices.
am × an = am+n
When dividing, subtract the indices.
am ÷ an = am-n
When raising to a power, multiply the indices.
(am)n = amn
POSITIVE INTEGER INDICES
INEQUALITIES
The way to solve equations is to isolate the unknown letter by systematically doing the same operation to both sides.
Always check your answer.
Solve 3x2 – 4 = 71
3x2 – 4 = 71 (Add 4 to both sides)
3x2 = 75 (Divide both sides by 3)
x2 = 25 (Square root both sides)
x = ±5 (Note there are two answers)
Check: 3 × (±5)2 – 4 = 71
Solve y + 34
2 = 1
y + 34
2 = 1 (Add 2 to both sides)
y + 34
= 3 (Multiply both sides by 4)
y + 3 = 12 (Square both sides)
y + 3 = 144 (Subtract 3 from both sides)
y = 141
Check: 141+ 34
2 = 1
To divide by a fraction, turn the fraction upside down and multiply.
÷ = × =5 2 5 3 512 3 12 2 8a b a a
b b
Inequalities are solved in the same way as algebraic equations, EXCEPT that when multiplying or dividing by a negative number the inequality sign is reversed.
2(x – 3) ≤ 5(x – 3) (Expand brackets)
2x – 6 ≤ 5x – 15 (Add 15 to both sides)
2x + 9 ≤ 5x (Subtract 2x from both sides)
9 ≤ 3x (Divide both sides by 3)
3 ≤ x or x ≥ 3
x > 3 means that x cannot be equal to 3.
x ≥ 3 means that x can be equal to 3 or greater than 3.
A solid circle means
≥ or ≤
An open circle means
> or <
2
4
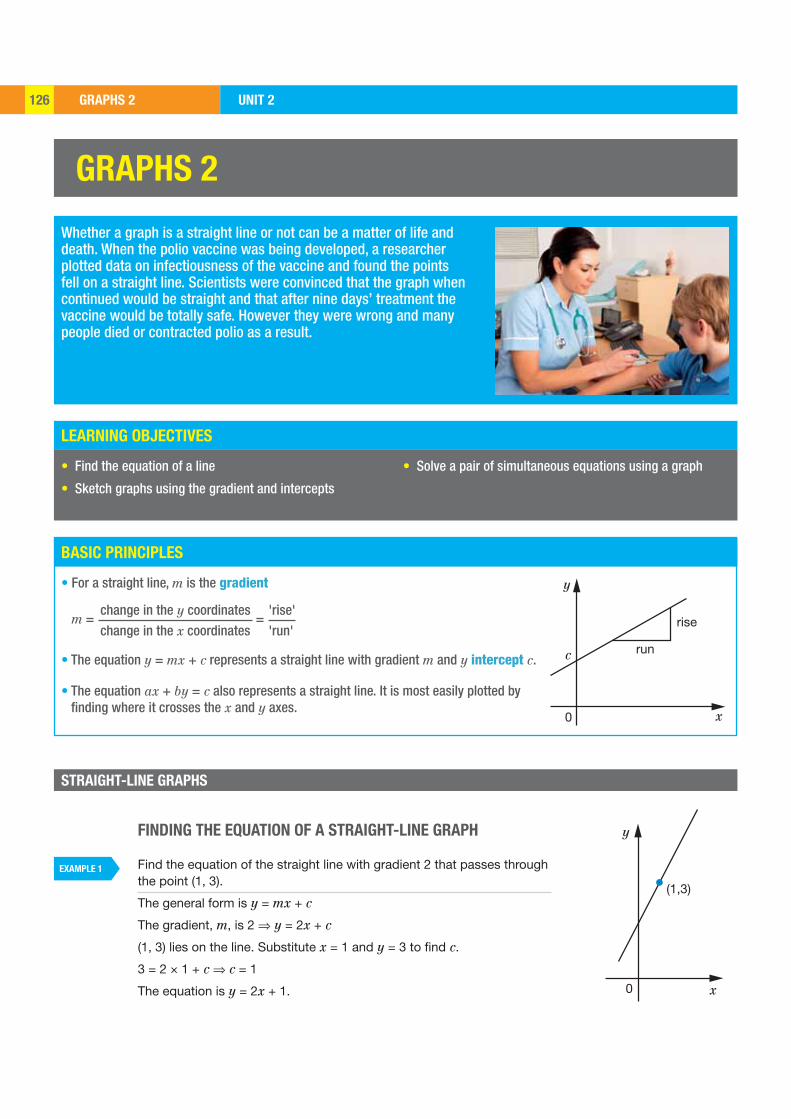
GRAPHS 2 UNIT 2126
LEARNING OBJECTIVES
BASIC PRINCIPLES
run
x
y
c
0
rise
x
y
0
(1,3)
GRAPHS 2
Whether a graph is a straight line or not can be a matter of life and death. When the polio vaccine was being developed, a researcher plotted data on infectiousness of the vaccine and found the points fell on a straight line. Scientists were convinced that the graph when continued would be straight and that after nine days’ treatment the vaccine would be totally safe. However they were wrong and many people died or contracted polio as a result.
• Find the equation of a line
• Sketch graphs using the gradient and intercepts
• Solve a pair of simultaneous equations using a graph
• For a straight line, m is the gradient
• The equation y = mx + c represents a straight line with gradient m and y intercept c.
• The equation ax + by = c also represents a straight line. It is most easily plotted by finding where it crosses the x and y axes.
STRAIGHT-LINE GRAPHS
FINDING THE EQUATION OF A STRAIGHT-LINE GRAPH
Find the equation of the straight line with gradient 2 that passes through the point (1, 3).
The general form is y = mx + c
The gradient, m, is 2 ⇒ y = 2x + c
(1, 3) lies on the line. Substitute x = 1 and y = 3 to find c.
3 = 2 × 1 + c ⇒ c = 1
The equation is y = 2x + 1.
m = =change in the y coordinates
change in the x coordinates
'rise'
'run'
EXAMPLE 1
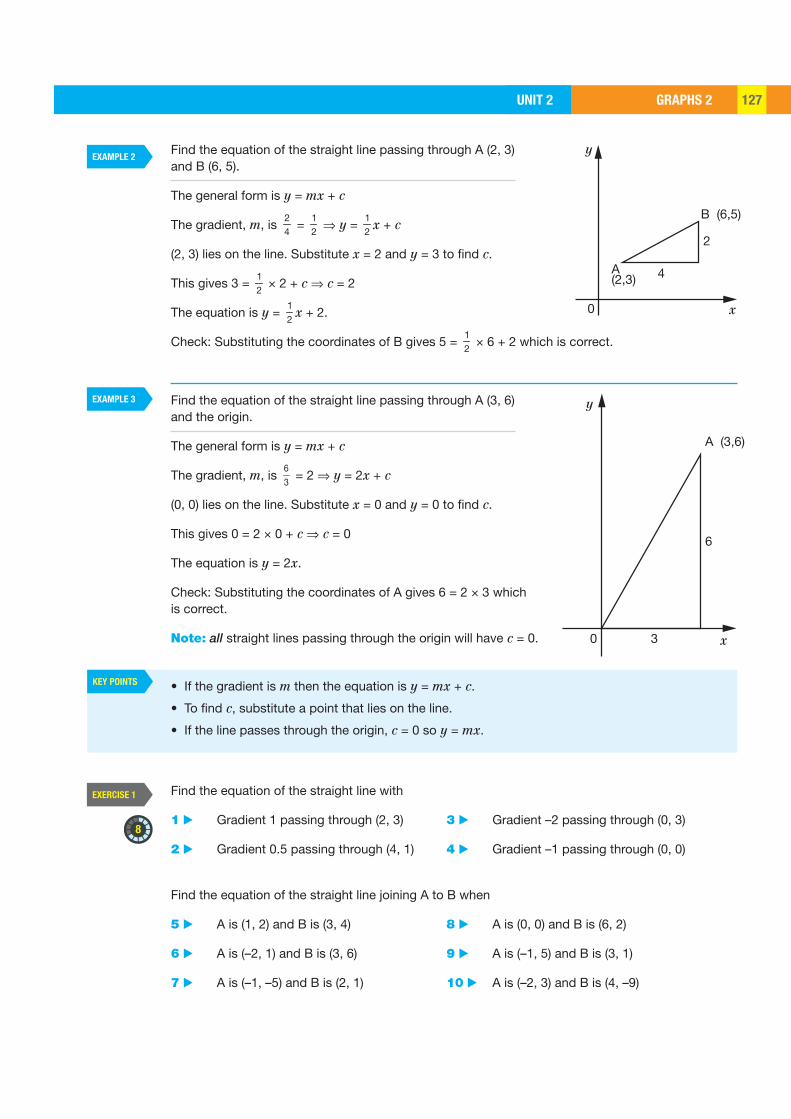
GRAPHS 2UNIT 2 127
KEY POINTS
8
x
y
0
B (6,5)
A(2,3)
2
4
x
y
0
A (3,6)
6
3
Find the equation of the straight line passing through A (2, 3) and B (6, 5).
The general form is y = mx + c
The gradient, m, is 24
= 12
⇒ y = 12
x + c
(2, 3) lies on the line. Substitute x = 2 and y = 3 to find c.
This gives 3 = 12
× 2 + c ⇒ c = 2
The equation is y = 12
x + 2.
Check: Substituting the coordinates of B gives 5 = 12
× 6 + 2 which is correct.
Find the equation of the straight line passing through A (3, 6) and the origin.
The general form is y = mx + c
The gradient, m, is 63
= 2 ⇒ y = 2x + c
(0, 0) lies on the line. Substitute x = 0 and y = 0 to find c.
This gives 0 = 2 × 0 + c ⇒ c = 0
The equation is y = 2x.
Check: Substituting the coordinates of A gives 6 = 2 × 3 which is correct.
Note: all straight lines passing through the origin will have c = 0.
• If the gradient is m then the equation is y = mx + c.
• To find c, substitute a point that lies on the line.
• If the line passes through the origin, c = 0 so y = mx.
Find the equation of the straight line with
1 ▶ Gradient 1 passing through (2, 3) 3 ▶ Gradient –2 passing through (0, 3)
2 ▶ Gradient 0.5 passing through (4, 1) 4 ▶ Gradient –1 passing through (0, 0)
Find the equation of the straight line joining A to B when
5 ▶ A is (1, 2) and B is (3, 4) 8 ▶ A is (0, 0) and B is (6, 2)
6 ▶ A is (–2, 1) and B is (3, 6) 9 ▶ A is (–1, 5) and B is (3, 1)
7 ▶ A is (–1, –5) and B is (2, 1) 10 ▶ A is (–2, 3) and B is (4, –9)
EXERCISE 1
EXAMPLE 2
EXAMPLE 3
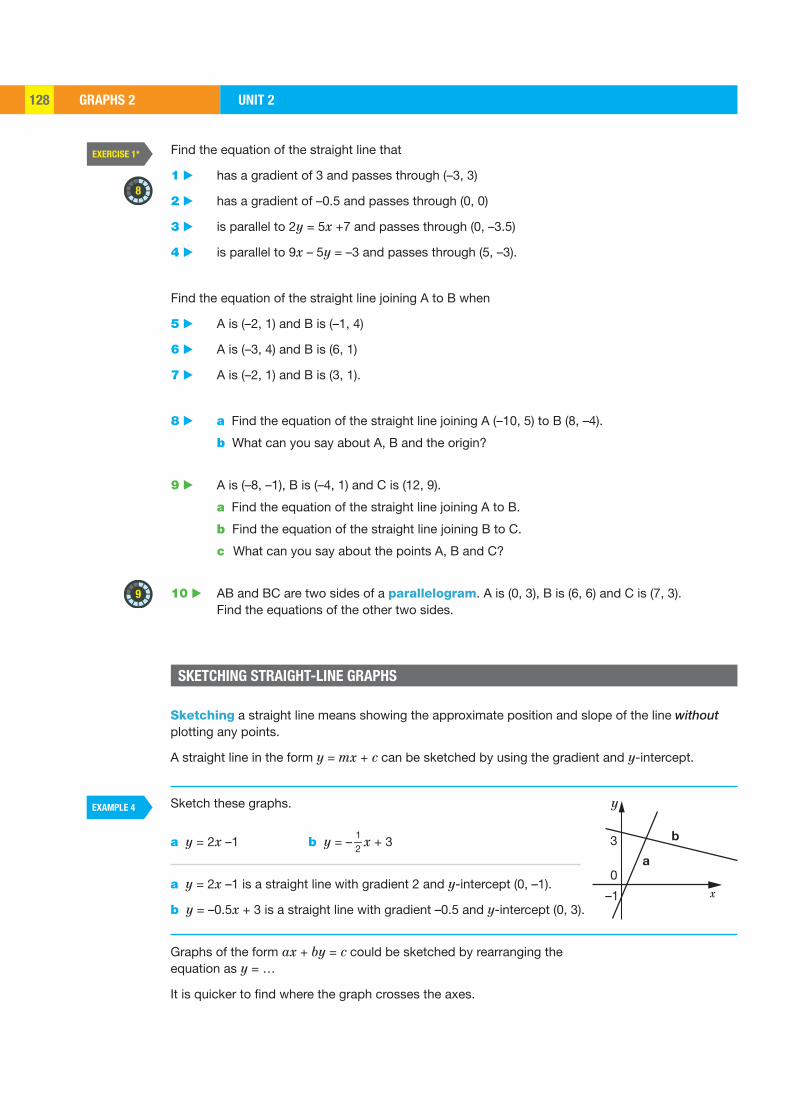
GRAPHS 2 UNIT 2128
8
9
x
y
0a
3
–1
b
Sketching a straight line means showing the approximate position and slope of the line without plotting any points.
A straight line in the form y = mx + c can be sketched by using the gradient and y-intercept.
Sketch these graphs.
a y = 2x –1 b y = –12
x + 3
a y = 2x –1 is a straight line with gradient 2 and y-intercept (0, –1).
b y = –0.5x + 3 is a straight line with gradient –0.5 and y-intercept (0, 3).
Graphs of the form ax + by = c could be sketched by rearranging the equation as y = …
It is quicker to find where the graph crosses the axes.
Find the equation of the straight line that
1 ▶ has a gradient of 3 and passes through (–3, 3)
2 ▶ has a gradient of –0.5 and passes through (0, 0)
3 ▶ is parallel to 2y = 5x +7 and passes through (0, –3.5)
4 ▶ is parallel to 9x – 5y = –3 and passes through (5, –3).
Find the equation of the straight line joining A to B when
5 ▶ A is (–2, 1) and B is (–1, 4)
6 ▶ A is (–3, 4) and B is (6, 1)
7 ▶ A is (–2, 1) and B is (3, 1).
8 ▶ a Find the equation of the straight line joining A (–10, 5) to B (8, –4).
b What can you say about A, B and the origin?
9 ▶ A is (–8, –1), B is (–4, 1) and C is (12, 9).
a Find the equation of the straight line joining A to B.
b Find the equation of the straight line joining B to C.
c What can you say about the points A, B and C?
10 ▶ AB and BC are two sides of a parallelogram. A is (0, 3), B is (6, 6) and C is (7, 3). Find the equations of the other two sides.
EXERCISE 1*
EXAMPLE 4
SKETCHING STRAIGHT-LINE GRAPHS
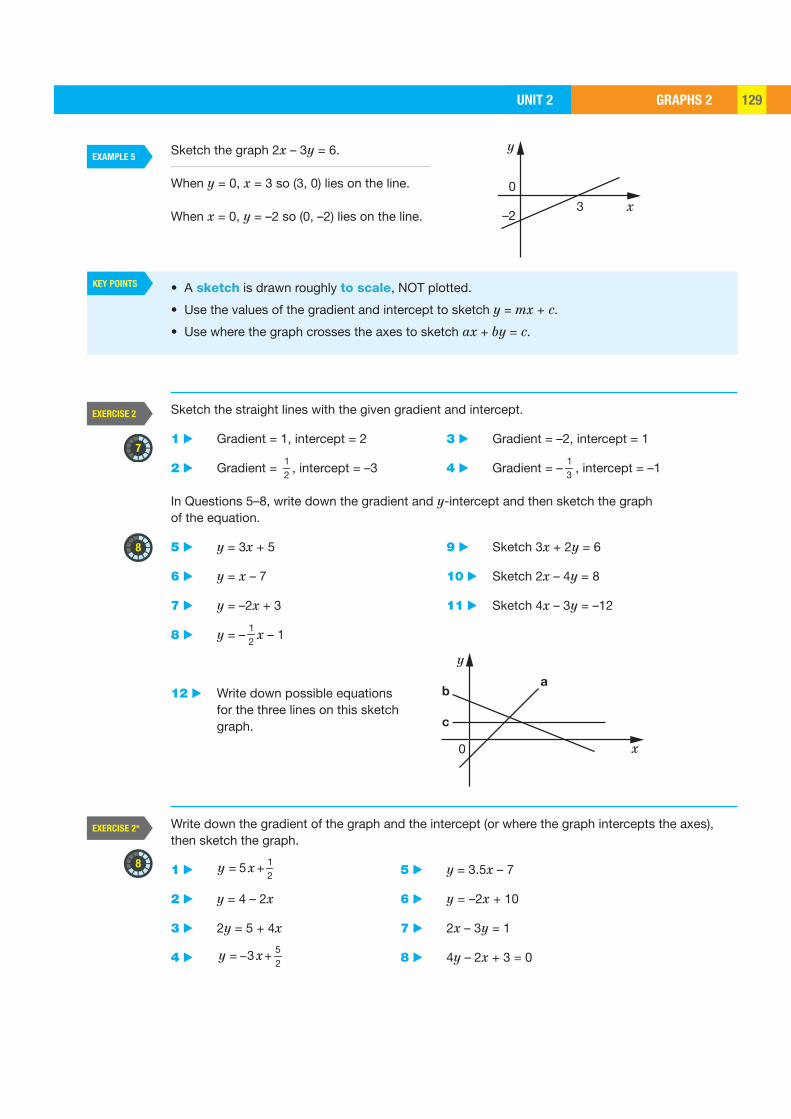
GRAPHS 2UNIT 2 129
KEY POINTS
7
8
8
x
y
0
3–2
x
y
0
ab
c
Sketch the graph 2x – 3y = 6.
When y = 0, x = 3 so (3, 0) lies on the line.
When x = 0, y = –2 so (0, –2) lies on the line.
Sketch the straight lines with the given gradient and intercept.
1 ▶ Gradient = 1, intercept = 2 3 ▶ Gradient = –2, intercept = 1
2 ▶ Gradient = 12
, intercept = –3 4 ▶ Gradient = –13
, intercept = –1
In Questions 5–8, write down the gradient and y-intercept and then sketch the graph of the equation.
5 ▶ y = 3x + 5 9 ▶ Sketch 3x + 2y = 6
6 ▶ y = x – 7 10 ▶ Sketch 2x – 4y = 8
7 ▶ y = –2x + 3 11 ▶ Sketch 4x – 3y = –12
8 ▶ y = –12
x – 1
12 ▶ Write down possible equations for the three lines on this sketch graph.
Write down the gradient of the graph and the intercept (or where the graph intercepts the axes), then sketch the graph.
1 ▶ = + 12
5y x 5 ▶ y = 3.5x – 7
2 ▶ y = 4 – 2x 6 ▶ y = –2x + 10
3 ▶ 2y = 5 + 4x 7 ▶ 2x – 3y = 1
4 ▶ = − + 52
3y x 8 ▶ 4y – 2x + 3 = 0
EXERCISE 2
EXERCISE 2*
EXAMPLE 5
• A sketch is drawn roughly to scale, NOT plotted.
• Use the values of the gradient and intercept to sketch y = mx + c.
• Use where the graph crosses the axes to sketch ax + by = c.
GRAPHS 2 UNIT 2130
ACTIVITY 1
8
x
y
0
ab c
9 ▶ Write down possible equations for the three lines on this sketch graph.
10 ▶ Sketch ax + by = c for the following cases.
a a > 0, b > 0 and c > 0 b a > 0, b > 0 and c < 0 c a > 0, b < 0 and c > 0
When there are two unknowns, two equations are needed to solve them. These are called simultaneous equations.
In Activity 1, the simultaneous equations were C = 999 + 1.1t and C = 495 + 1.8t. The coordinates of the point of intersection of the graphs give the solution.
SIMULTANEOUS EQUATIONS
SKILL: INTERPRETATION
Viv is trying to decide between two internet service providers, Pineapple and Banana. Pineapple charges $9.99/month plus 1.1 cents/minute online, while Banana charges $4.95/month plus 1.8 cents/minute online.
If C is the cost in cents and t is the time (in minutes) online per month then the cost of using Pineapple is C = 999 + 1.1t, and the cost of using Banana is C = 495 + 1.8t.
Copy and complete this table to give the charges for Pineapple.
Time online t (minutes) 0 500 1000
Cost C (cents)
Draw a graph of this data with t on the horizontal axis and C on the vertical axis.
Make a similar table for the Banana charges. Add the graph of this data to your previous graph.
How many minutes online per month will result in both companies charging the same amount?
GRAPHS 2UNIT 2 131
0
2.7
1.3
Solution point
x
y
y 5 x 1 2 1 2
y 5 4 2 x
–1 0
y5
4
3
2
1
1 2 3 4x
Solve the simultaneous equations = +12
2y x and y = 4 − x graphically.
First, make a table of values for each equation.
Next, draw accurate graphs for both equations on one set of axes.
The solution point is approximately x = 1.3, y = 2.7.
SKILL: PROBLEM SOLVING
At a craft fair stall Sarah buys two rings and three bracelets and pays $11. At the same stall Amy buys one ring and four bracelets and pays $13. How much does each item cost?
Let x be the cost of a ring and y be the cost of a bracelet.
For Sarah: 2x + 3y = 11
For Amy: x + 4y = 13
The graph shows both these lines plotted.
The intersection is at x = 1 and y = 3.
Each ring costs $1 and each bracelet costs $3.
Check for Sarah: 2 × 1 + 3 × 3 = 11
Check for Amy: 1 × 1 + 4 × 3 = 13
EXAMPLE 6
EXAMPLE 7
x 0 2 4
y = 4 − x 4 2 0
x 0 2 4
2 3 4= +12
2y x

GRAPHS 2 UNIT 2132
KEY POINTS
5
7
6
To solve simultaneous equations graphically:
• Draw the graphs for both equations on one set of axes.
• Only plot three points for a straight-line graph.
• The solution is where the graphs intersect.
• If the graphs do not intersect, there is no solution.
• If the graphs are the same, there is an infinite number of solutions.
EXERCISE 3 1 ▶ Copy and complete these tables, then draw both graphs on one set of axes.
Solve the simultaneous equations y = x + 1, y = 2x − 2 using your graph.
2 ▶ On one set of axes, draw the graphs of y = 3x – 1 and y = 2x + 1 for 0 ≤ x ≤ 6. Then, solve the simultaneous equations y = 3x – 1 and y = 2x + 1 using your graph.
In Questions 3 and 4, solve the simultaneous equations graphically, using 0 ≤ x ≤ 6.
3 ▶ y = 2x + 2 4 ▶ y =12
x + 1
y = 3x – 1 y = 4 – x
5 ▶ Logan and Max go to the fair. Logan has three rides on the Big Wheel and two rides on the Pirate Ship and spends $12. Max has five rides on the Big Wheel and one ride on the Pirate Ship and spends $13. Let x be the cost of a Big Wheel ride and y the cost of a Pirate Ship ride.
a Write down two equations showing what Logan and Max spent.
b Plot these equations on one graph.
c What does each ride cost?
6 ▶ Freya is collecting 50p and £1 coins. When she has 18 coins the value of them is £13. Let x be the number of 50p coins and y the number of £1 coins.
Write a pair of simultaneous equations and solve them graphically to find how many 50p coins Freya has.
x 0 2 4
y = x + 1
x 0 2 4
y = 2x – 2
GRAPHS 2UNIT 2 133
7
6
9
EXERCISE 3* 1 ▶ On one set of axes, draw the graphs of y = 2x + 1 and y = 3x − 5 for 0 x 6. Then, solve the simultaneous equations y = 2x + 1 and y = 3x − 5 using your graphs.
2 ▶ Solve these simultaneous equations graphically, using 0 ≤ x ≤ 6.
6x − 5 = 2y
3x − 7 = 6y
3 ▶ Solve y = 4 – 2x and 6x + 3y = 18 graphically. How many solutions are there?
4 ▶ Solve y = 12
x + 3 and 2y – x = 6 graphically. How many solutions are there?
5 ▶ McMountain Construction is digging a tunnel in the Alps.
The mountain can be represented by 3y = 4x + 6000 for 0 ≤ x ≤ 3000 and 7y + 6x = 60 000 for 3000 ≤ x ≤ 10 000.
The tunnel can be represented by the line 10y + x = 30 000.
All the units are metres. Find the coordinates of the ends of the tunnel.
6 ▶ At the local pet shop Esme bought four cans of cat food and two bags of treats for her kitten, spending £7. Her friend Lacey bought three cans of cat food and three bags of treats, spending £6. By drawing graphs, find the cost of each item.
7 ▶ At a music festival, tickets cost either £60 or £100. 1200 tickets were sold at a total cost of £88 000. By drawing graphs, find how many £60 tickets were sold.
8 ▶ a Copy and complete this table to show the angle that the minute hand of a clock makes with the number 12 for various times after 12 noon.
b Use the table to draw a graph of angle against time. Show the time from 0 hours to 6 hours on the x-axis, and the angle from 0° to 360° on the y-axis.
c Draw another line on your graph to show the angle that the hour hand makes with the number 12 for various times after 12 noon.
d Use your graph to find the times between 12 noon and 6pm when the hour hand and the minute hand of the clock are in line.
Time after 12 noon (hours)
014
12
34 1
14
1 12
1 34
1 214
2 12
2
Angle (degrees) 0 180 90
Q6 HINT Let £x be the cost
of a can of cat
food and £y be
the cost of a toy.
GRAPHS 2 UNIT 2134
6
8
7
9
REVISION
1 ▶ Find the equation of the lines with
a gradient 2, passing through the origin b gradient –3, passing through (2, 0)
2 ▶ Find the equation of the straight line joining A to B when
a A is (3, 4) and B is (5, 8) b A is (–1, 2) and B is (1, 0)
3 ▶ Sketch the following graphs.
a y = 3x – 3 b y = 4 – x c 2x + 5y = 10
4 ▶ Solve y = 2x – 3 and y = 3 – x graphically using 0 ≤ x ≤ 4.
5 ▶ Solve y = x + 4 and y = 1 – 2x graphically using –3 ≤ x ≤ 1.
6 ▶ Music downloads from Banana cost $x each, while downloads from Musedown cost $y each. Rahul downloads three songs from Banana and two from Musedown and spends $6. Mia downloads one song from Banana and four from Musedown and spends $7.
a Write down two equations showing what Rahul and Mia spent.
b Plot these equations on one graph.
c What does each download cost?
REVISION
1 ▶ Find the equation of the straight line passing through (6, 4) that is parallel to 3y = x + 21.
2 ▶ Find the equation of the straight line joining A to B when
a A is (–4, –1), B is (–1, –2) b A is (–2, –8), B is (1, –2)
3 ▶ Sketch the following graphs.
a y = 3x – 2 b 2y = 5 – x c 5x + 3y = 10
4 ▶ Solve 2y + x + 3 = 0 and 3y – x + 1 = 0 graphically using –4 ≤ x ≤ 2.
5 ▶ Lewis is doing a multiple choice test of 20 questions. He gets four marks for every correct answer, but loses one mark for every answer that is wrong. Lewis answers every question and scores 50 marks. Use a graphical method to find the number of questions Lewis got wrong.
6 ▶ Find the equation of the straight line joining (–2, 3 – 6p) to (–2 + 2p, 3).
EXERCISE 4
EXERCISE 4*
Q6 HINTp will appear in
the answer.
EXAM PRACTICEUNIT 2 135
1 5
2
3
4
Find the equation of the straight line passing through A (–1, –8) and B (1, 2). [3]
A straight line passes through the origin O and the point A (4, –2).
a Find the equation of the line OA. [2]
b Find the equation of the line parallel to OA that passes through (–3, 1). [2]
Sketch the following graphs.
a y = 2x – 3
b 3x + 4y = 24
c y = –x + 1 [6]
Solve the simultaneous equations x + y = 8 and y = 2x – 1 graphically. [6]
Q4 HINT Draw both x and y axes from –2 to 8.
At the market Theo buys six apples and four avocados and spends $14. Erin buys four apples and six avocados and spends $16. Let x be the cost of an apple and y be the cost of an avocado.
Write a pair of simultaneous equations and solve them graphically to fi nd the cost of
a one apple
b one avocado. [6]
[Total 25 marks]
EXAM PRACTICE: GRAPHS 2
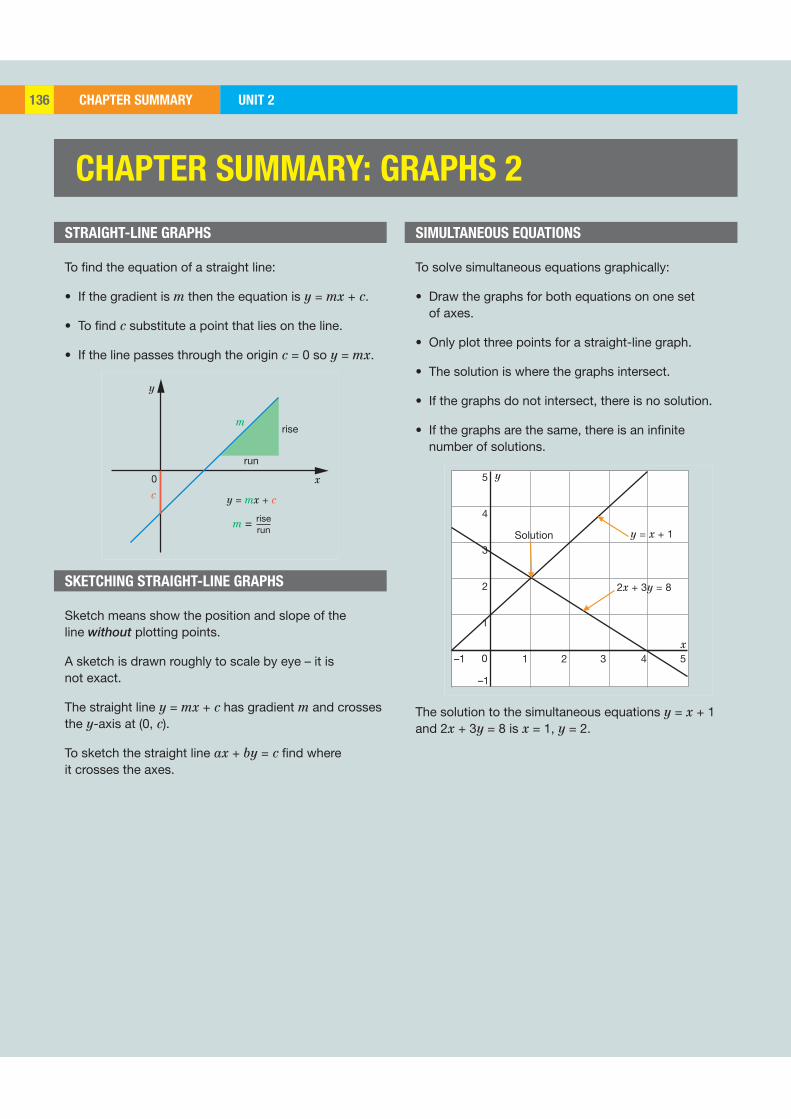
CHAPTER SUMMARY UNIT 2136
–1
–1
0
y5
4
3
2
1
1
Solution
2 3 4 5x
y = x + 1
2x + 3y = 8
x
y
0
m
c y = mx + c
m = riserun
run
rise
CHAPTER SUMMARY: GRAPHS 2
STRAIGHT-LINE GRAPHS SIMULTANEOUS EQUATIONS
SKETCHING STRAIGHT-LINE GRAPHS
To find the equation of a straight line:
• If the gradient is m then the equation is y = mx + c.
• To find c substitute a point that lies on the line.
• If the line passes through the origin c = 0 so y = mx.
To solve simultaneous equations graphically:
• Draw the graphs for both equations on one set of axes.
• Only plot three points for a straight-line graph.
• The solution is where the graphs intersect.
• If the graphs do not intersect, there is no solution.
• If the graphs are the same, there is an infinite number of solutions.
The solution to the simultaneous equations y = x + 1 and 2x + 3y = 8 is x = 1, y = 2.
Sketch means show the position and slope of the line without plotting points.
A sketch is drawn roughly to scale by eye – it is not exact.
The straight line y = mx + c has gradient m and crosses the y-axis at (0, c).
To sketch the straight line ax + by = c find where it crosses the axes.
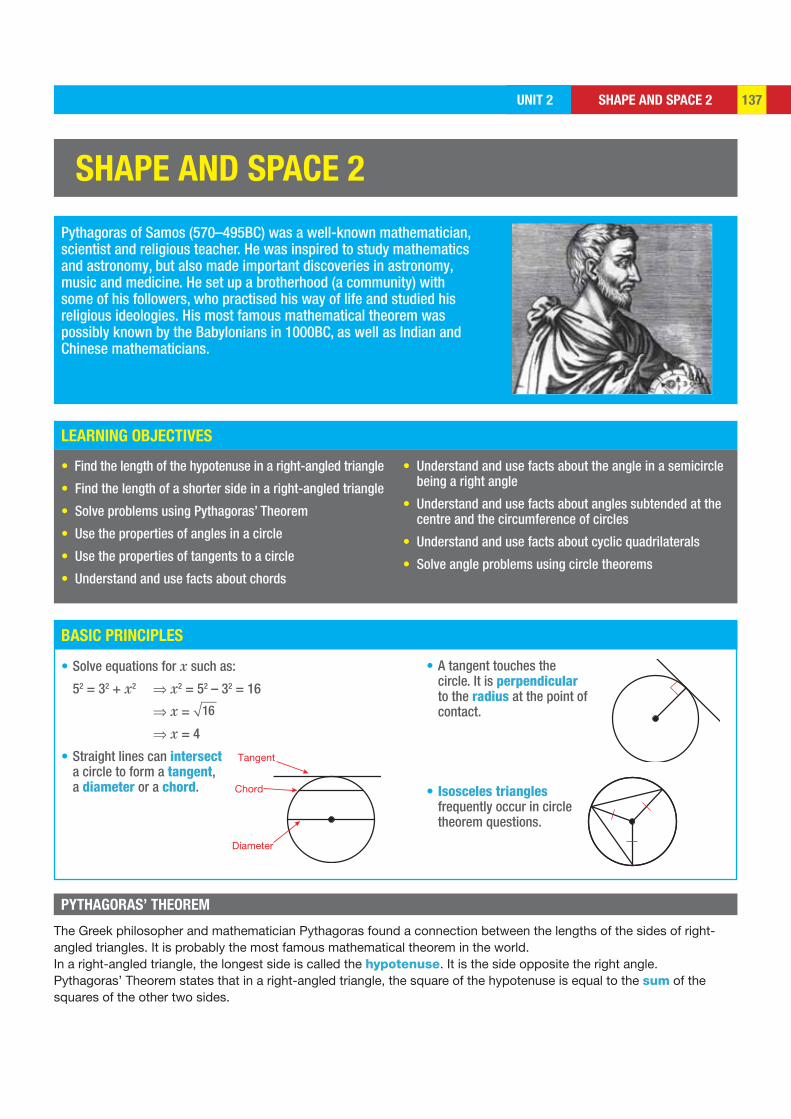
SHAPE AND SPACE 2UNIT 2 137
LEARNING OBJECTIVES
BASIC PRINCIPLES
Diameter
Chord
Tangent
SHAPE AND SPACE 2
Pythagoras of Samos (570–495BC) was a well-known mathematician, scientist and religious teacher. He was inspired to study mathematics and astronomy, but also made important discoveries in astronomy, music and medicine. He set up a brotherhood (a community) with some of his followers, who practised his way of life and studied his religious ideologies. His most famous mathematical theorem was possibly known by the Babylonians in 1000BC, as well as Indian and Chinese mathematicians.
• Find the length of the hypotenuse in a right-angled triangle
• Find the length of a shorter side in a right-angled triangle
• Solve problems using Pythagoras’ Theorem
• Use the properties of angles in a circle
• Use the properties of tangents to a circle
• Understand and use facts about chords
• Understand and use facts about the angle in a semicircle being a right angle
• Understand and use facts about angles subtended at the centre and the circumference of circles
• Understand and use facts about cyclic quadrilaterals
• Solve angle problems using circle theorems
PYTHAGORAS’ THEOREM
The Greek philosopher and mathematician Pythagoras found a connection between the lengths of the sides of right-angled triangles. It is probably the most famous mathematical theorem in the world.In a right-angled triangle, the longest side is called the hypotenuse. It is the side opposite the right angle.Pythagoras’ Theorem states that in a right-angled triangle, the square of the hypotenuse is equal to the sum of the squares of the other two sides.
• Solve equations for x such as:
52 = 32 + x2 ⇒ x2 = 52 – 32 = 16
⇒ x = 16
⇒ x = 4
• Straight lines can intersect a circle to form a tangent, a diameter or a chord.
• A tangent touches the circle. It is perpendicular to the radius at the point of contact.
• Isosceles triangles frequently occur in circle theorem questions.
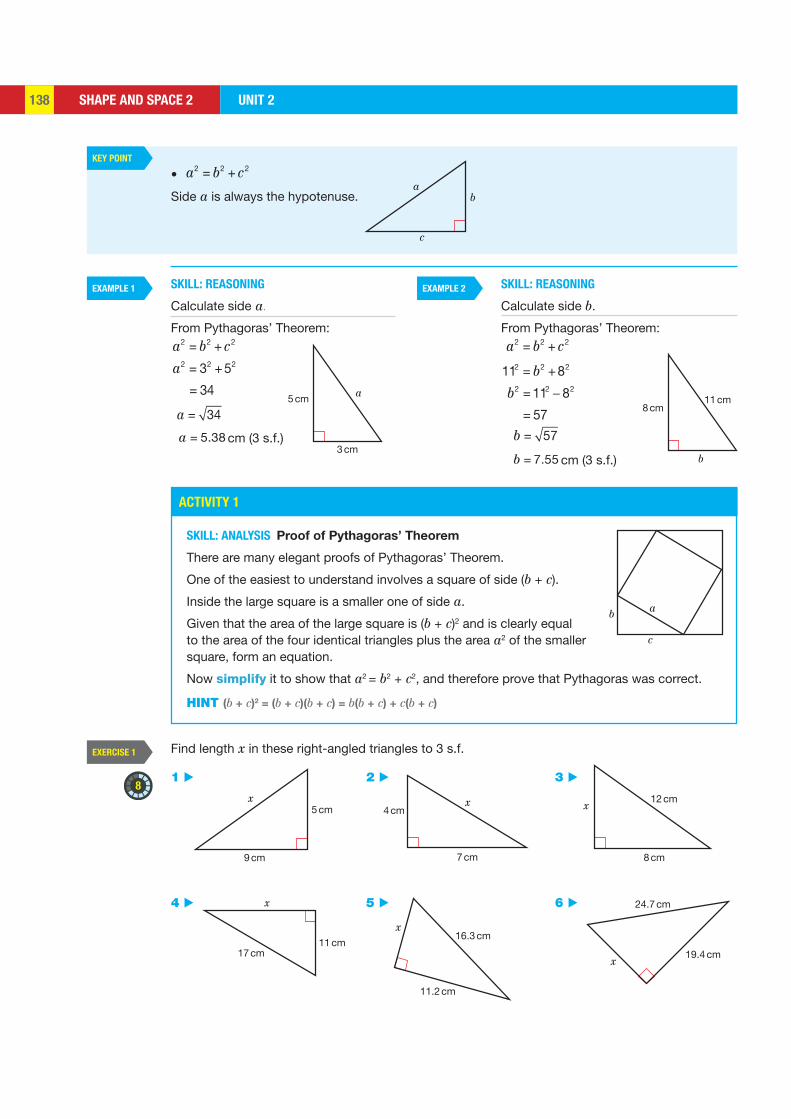
SHAPE AND SPACE 2 UNIT 2138
EXAMPLE 1 EXAMPLE 2
KEY POINT
EXERCISE 1
8
ba
c
3 cm
a5 cm 11 cm
b
8 cm
a
c
b
11.2 cm
16.3 cmx
24.7 cm
19.4 cmx
9 cm
5 cmx
7 cm
4 cmx
8 cm
12 cmx
11 cm17 cm
x
• a2 = b2 +c2
Side a is always the hypotenuse.
Find length x in these right-angled triangles to 3 s.f.
1 ▶ 2 ▶ 3 ▶
4 ▶ 5 ▶ 6 ▶
SKILL: REASONING
Calculate side a.
From Pythagoras’ Theorem:a2 = b2 +c2
a2 = 32 +52
= 34
= 34a
= 5.38a cm (3 s.f.)
SKILL: REASONING
Calculate side b.
From Pythagoras’ Theorem:
a2 = b2 +c2
112 = b2 +82
b2 = 112 82
= 57
= 57b
= 7.55b cm (3 s.f.)
ACTIVITY 1
SKILL: ANALYSIS Proof of Pythagoras’ Theorem
There are many elegant proofs of Pythagoras’ Theorem.
One of the easiest to understand involves a square of side (b + c).
Inside the large square is a smaller one of side a.
Given that the area of the large square is (b + c)2 and is clearly equal to the area of the four identical triangles plus the area a2 of the smaller square, form an equation.
Now simplify it to show that a2 = b2 + c2, and therefore prove that Pythagoras was correct.
HINT (b + c)2 = (b + c)(b + c) = b(b + c) + c(b + c)

SHAPE AND SPACE 2UNIT 2 139
EXERCISE 1*
9a
5 cm
9 cm
7 cma
2 cm
1 cm4 cm
a
5 m 12 m
14 m
a
8 m15 m
25 m
A
B
O
R
O Q
P
7 ▶ Find the diagonal length of a square field of side 50 m.
8 ▶ A fishing boat sails from Bastia in Corsica. It travels 15 km due east, then 25 km due south. It then returns directly to its starting point. What is the total distance the boat travels?
9 ▶ A 3.5 m ladder rests against a vertical wall. Its base is 1.5 m away from the wall.
How far up the wall is the top of the ladder?
10 ▶ A large rectangular Persian rug has a diagonal length of 12 m and a width of 6 m.
Find the length of the rug.
Find length a in these right-angled triangles to 3 s.f.
1 ▶ 2 ▶
3 ▶ 4 ▶
5 ▶ Calculate the distance between the points (7, 4) and (–5, –3).
6 ▶ Calculate the area of a square whose diagonals are 20 cm long.
7 ▶ Thuso sails his boat from Mogadishu directly north-east for 50 km, then directly south-east for 100 km. He then sails directly back to Mogadishu at 13:00 hrs at a speed of 25 km/h.
What time does he arrive?
8 ▶ OA = 100 m. OB = 150 m. The 100 m start of a ski jump at A has a vertical height of 50 m.
a Find the vertical height of the 150 m starting point at B.
b Find the horizontal distance between the two starting points A and B.
9 ▶ Let OQ = y and the circle radius = r.
a Find PQ in terms of r and y.
b State why PQ = RQ.
Q8a HINT Use similar triangles.
Q9a HINT Use Pythagoras’
Theorem.
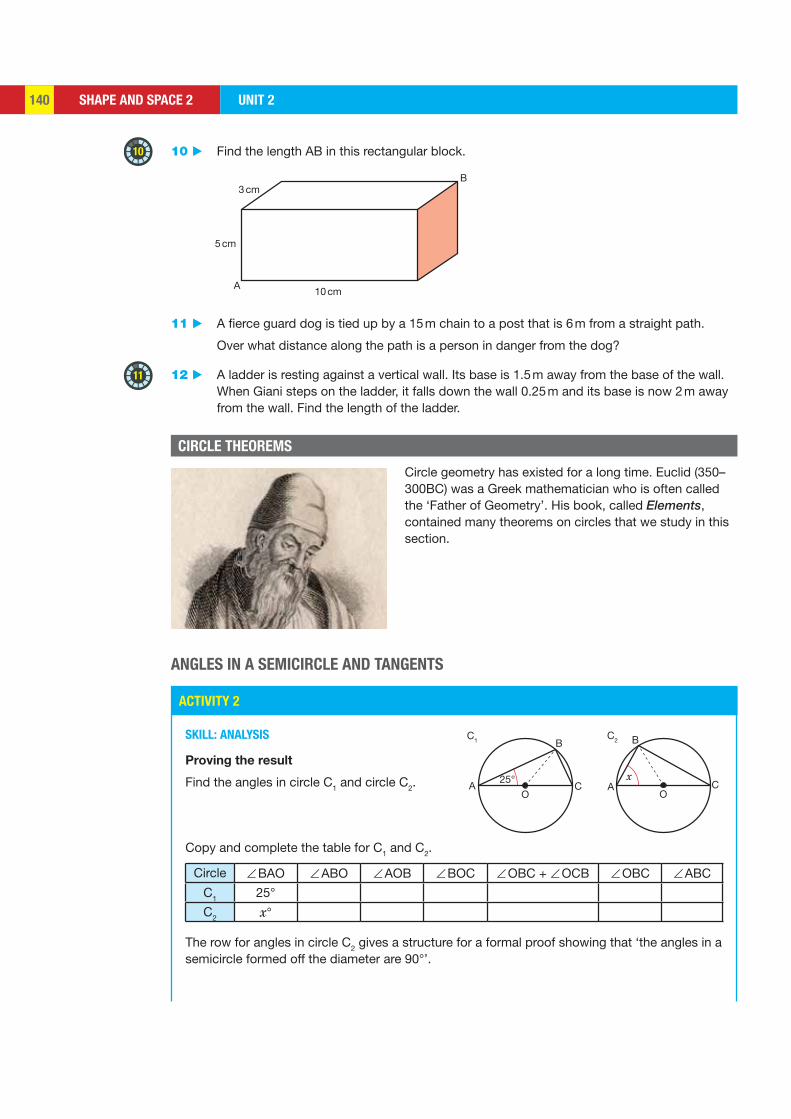
SHAPE AND SPACE 2 UNIT 2140
11
10
B
CO
Ax
C2C1
25°O
C
B
A
10 cmA
B
5 cm
3 cm
ANGLES IN A SEMICIRCLE AND TANGENTS
CIRCLE THEOREMS
Circle geometry has existed for a long time. Euclid (350–300BC) was a Greek mathematician who is often called the ‘Father of Geometry’. His book, called Elements, contained many theorems on circles that we study in this section.
ACTIVITY 2
SKILL: ANALYSIS
Proving the result
Find the angles in circle C1 and circle C2.
Copy and complete the table for C1 and C2.
Circle ∠ BAO ∠ ABO ∠ AOB ∠ BOC ∠ OBC + ∠ OCB ∠ OBC ∠ ABC
C1 25°
C2 x°
The row for angles in circle C2 gives a structure for a formal proof showing that ‘the angles in a semicircle formed off the diameter are 90°’.
10 ▶ Find the length AB in this rectangular block.
11 ▶ A fierce guard dog is tied up by a 15 m chain to a post that is 6 m from a straight path.
Over what distance along the path is a person in danger from the dog?
12 ▶ A ladder is resting against a vertical wall. Its base is 1.5 m away from the base of the wall. When Giani steps on the ladder, it falls down the wall 0.25 m and its base is now 2 m away from the wall. Find the length of the ladder.
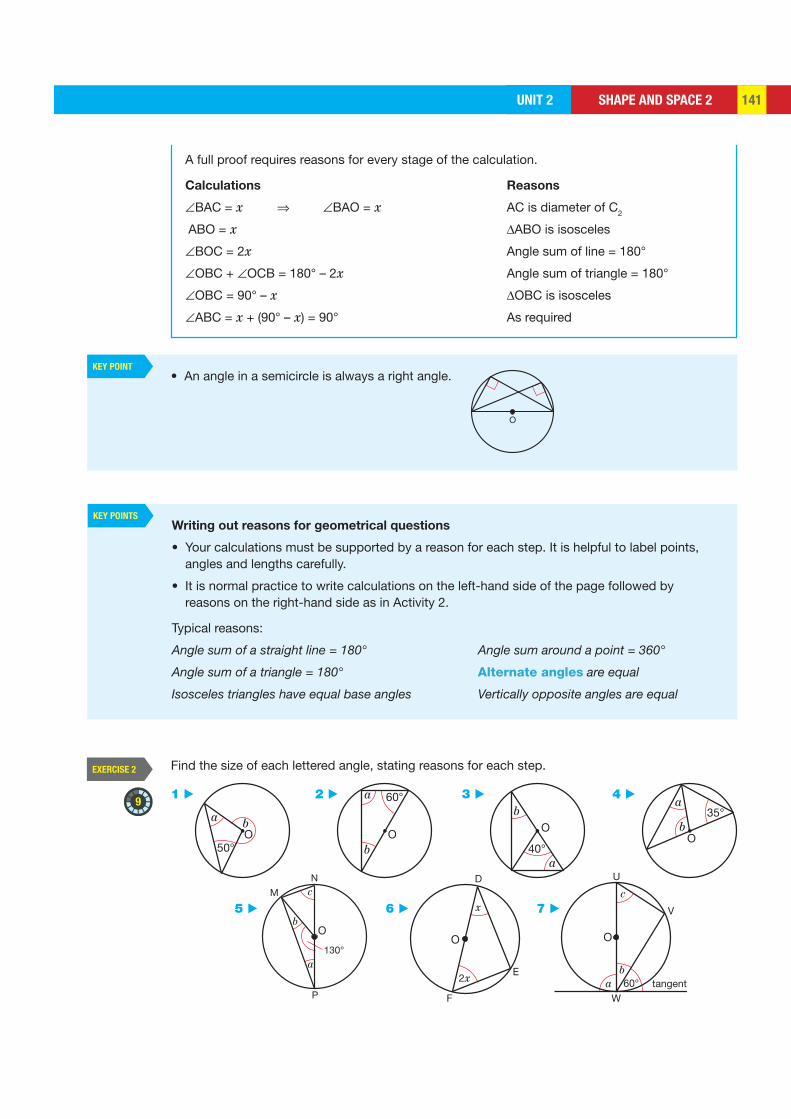
SHAPE AND SPACE 2UNIT 2 141
KEY POINT
KEY POINTS
EXERCISE 2
9
O
Ob
50°
aO
b
60°a
Ob
40°a
b35°
a
O
O
N
P
130°
M c
b
a
W60° tangent
U
V
c
ba
OO
F
E
D
x
2x
A full proof requires reasons for every stage of the calculation.
Calculations Reasons
∠BAC = x ⇒ ∠BAO = x AC is diameter of C2
ABO = x ΔABO is isosceles
∠BOC = 2x Angle sum of line = 180°
∠OBC + ∠OCB = 180° – 2x Angle sum of triangle = 180°
∠OBC = 90° – x ΔOBC is isosceles
∠ABC = x + (90° – x) = 90° As required
• An angle in a semicircle is always a right angle.
Writing out reasons for geometrical questions
• Your calculations must be supported by a reason for each step. It is helpful to label points, angles and lengths carefully.
• It is normal practice to write calculations on the left-hand side of the page followed by reasons on the right-hand side as in Activity 2.
Typical reasons:
Angle sum of a straight line = 180° Angle sum around a point = 360°
Angle sum of a triangle = 180° Alternate angles are equal
Isosceles triangles have equal base angles Vertically opposite angles are equal
Find the size of each lettered angle, stating reasons for each step.
1 ▶ 2 ▶ 3 ▶ 4 ▶
5 ▶ 6 ▶ 7 ▶
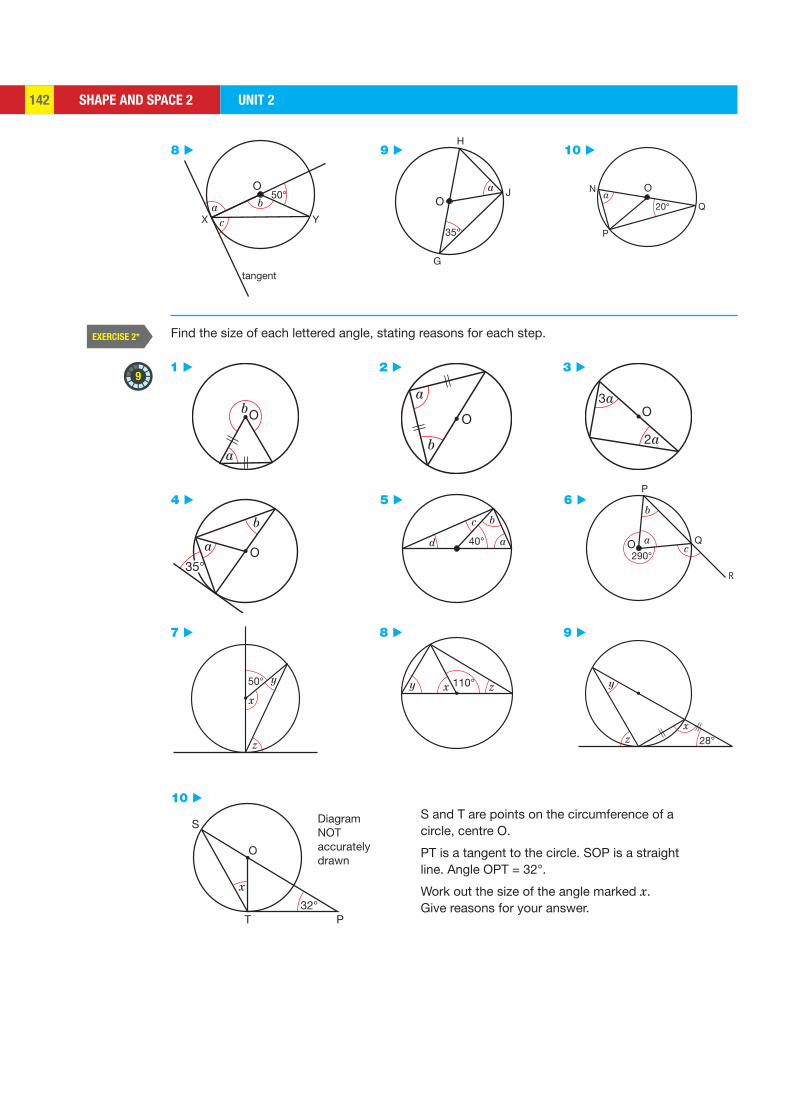
SHAPE AND SPACE 2 UNIT 2142
EXERCISE 2*
9
Ob
a
O
b
aO
3a
2a
35°
a
b
O c
b
a Q
290°
P
R
O
50°
x
y
z
z110°y x
28°zx
y
x
T P32°
S
O
DiagramNOTaccuratelydrawn
40°d
c b
a
50°O
tangent
X Ya
c
b O
35°
G
J
H
a ON
P
Q20°a
8 ▶ 9 ▶ 10 ▶
Find the size of each lettered angle, stating reasons for each step.
1 ▶ 2 ▶ 3 ▶
4 ▶ 5 ▶ 6 ▶
7 ▶ 8 ▶ 9 ▶
10 ▶ S and T are points on the circumference of a circle, centre O.
PT is a tangent to the circle. SOP is a straight line. Angle OPT = 32°.
Work out the size of the angle marked x. Give reasons for your answer.
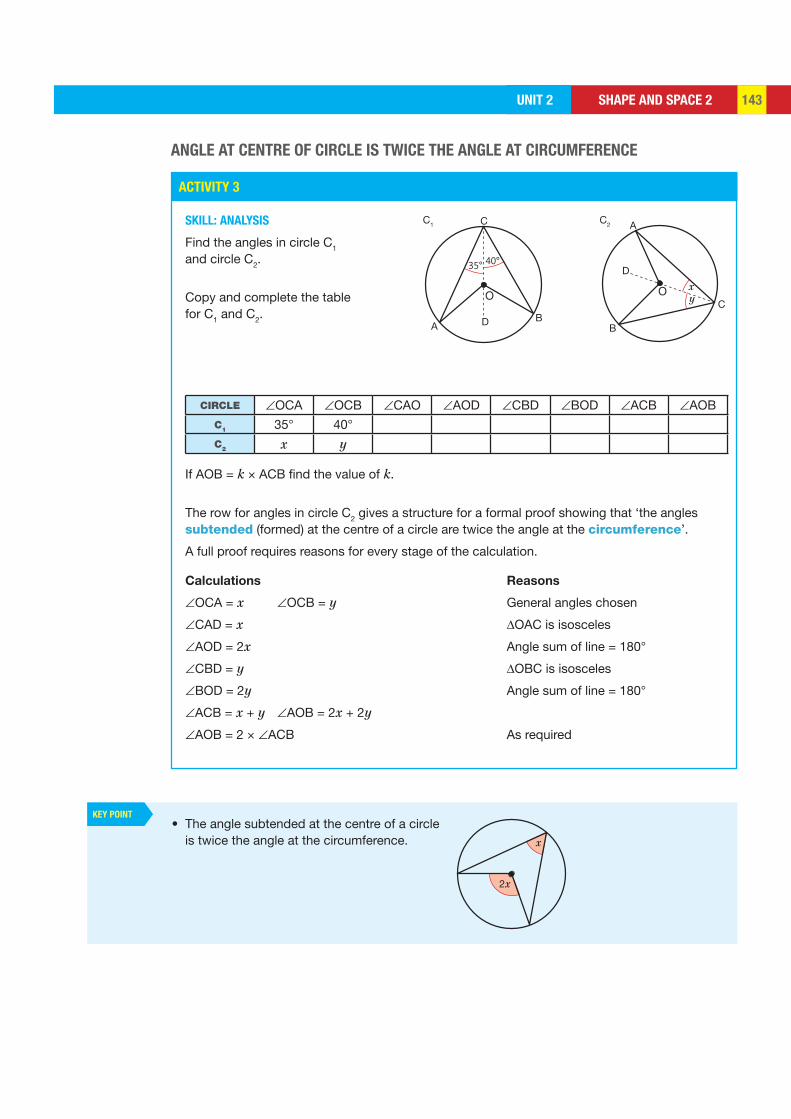
SHAPE AND SPACE 2UNIT 2 143
ANGLE AT CENTRE OF CIRCLE IS TWICE THE ANGLE AT CIRCUMFERENCE
KEY POINT
2x
x
40°35°
DAB
C
O
D
x
A
B
CyO
C1 C2
ACTIVITY 3
SKILL: ANALYSIS
Find the angles in circle C1 and circle C2.
Copy and complete the table for C1 and C2.
CIRCLE ∠OCA ∠OCB ∠CAO ∠AOD ∠CBD ∠BOD ∠ACB ∠AOBC1 35° 40°C2 x y
If AOB = k × ACB find the value of k.
The row for angles in circle C2 gives a structure for a formal proof showing that ‘the angles subtended (formed) at the centre of a circle are twice the angle at the circumference’.
A full proof requires reasons for every stage of the calculation.
Calculations Reasons
∠OCA = x ∠OCB = y General angles chosen
∠CAD = x ΔOAC is isosceles
∠AOD = 2x Angle sum of line = 180°
∠CBD = y ΔOBC is isosceles
∠BOD = 2y Angle sum of line = 180°
∠ACB = x + y ∠AOB = 2x + 2y
∠AOB = 2 × ∠ACB As required
• The angle subtended at the centre of a circle is twice the angle at the circumference.
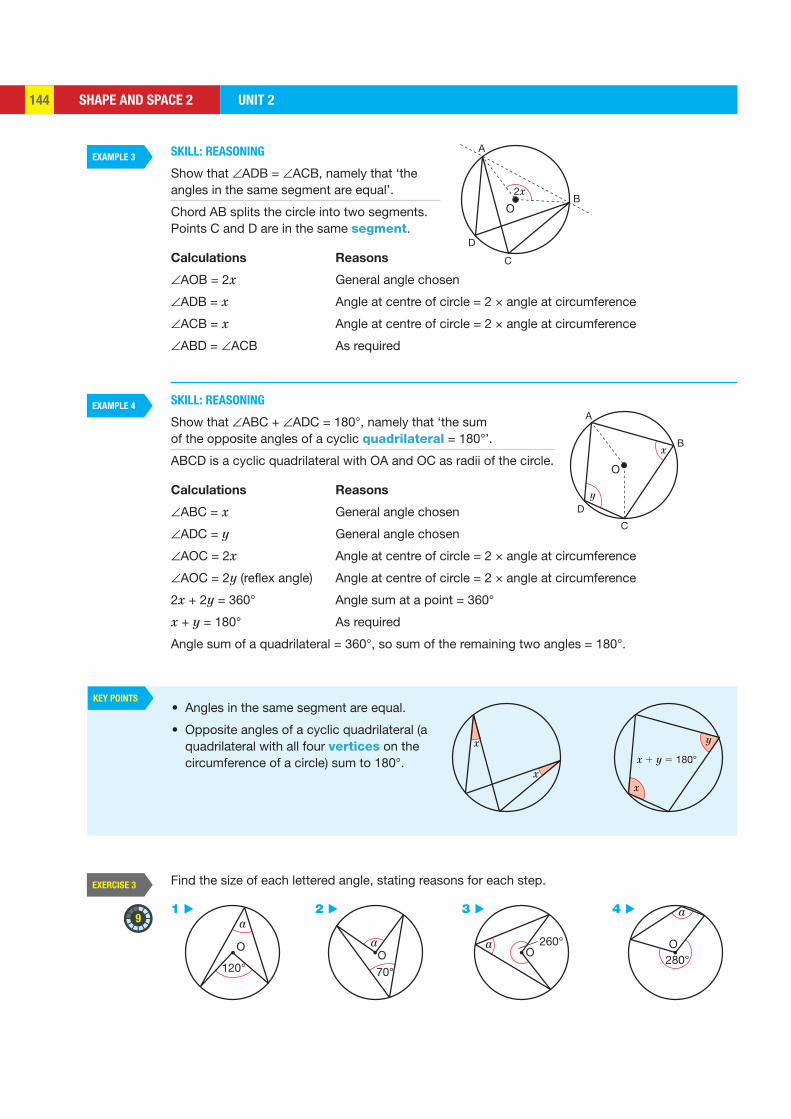
SHAPE AND SPACE 2 UNIT 2144
EXAMPLE 3
EXAMPLE 4
KEY POINTS
EXERCISE 3
9
2x
D
A
B
C
O
x
D
A
B
C
y
O
O
a
120°O70°
aO
260°a O280°
a
x
xx
x 1 y 5 180°
y
SKILL: REASONING
Show that ∠ADB = ∠ACB, namely that ‘the angles in the same segment are equal’.
Chord AB splits the circle into two segments. Points C and D are in the same segment.
Calculations Reasons
∠AOB = 2x General angle chosen
∠ADB = x Angle at centre of circle = 2 × angle at circumference
∠ACB = x Angle at centre of circle = 2 × angle at circumference
∠ABD = ∠ACB As required
SKILL: REASONING
Show that ∠ABC + ∠ADC = 180°, namely that ‘the sum of the opposite angles of a cyclic quadrilateral = 180°’.
ABCD is a cyclic quadrilateral with OA and OC as radii of the circle.
Calculations Reasons
∠ABC = x General angle chosen
∠ADC = y General angle chosen
∠AOC = 2x Angle at centre of circle = 2 × angle at circumference
∠AOC = 2y (reflex angle) Angle at centre of circle = 2 × angle at circumference
2x + 2y = 360° Angle sum at a point = 360°
x + y = 180° As required
Angle sum of a quadrilateral = 360°, so sum of the remaining two angles = 180°.
• Angles in the same segment are equal.
• Opposite angles of a cyclic quadrilateral (a quadrilateral with all four vertices on the circumference of a circle) sum to 180°.
Find the size of each lettered angle, stating reasons for each step.
1 ▶ 2 ▶ 3 ▶ 4 ▶
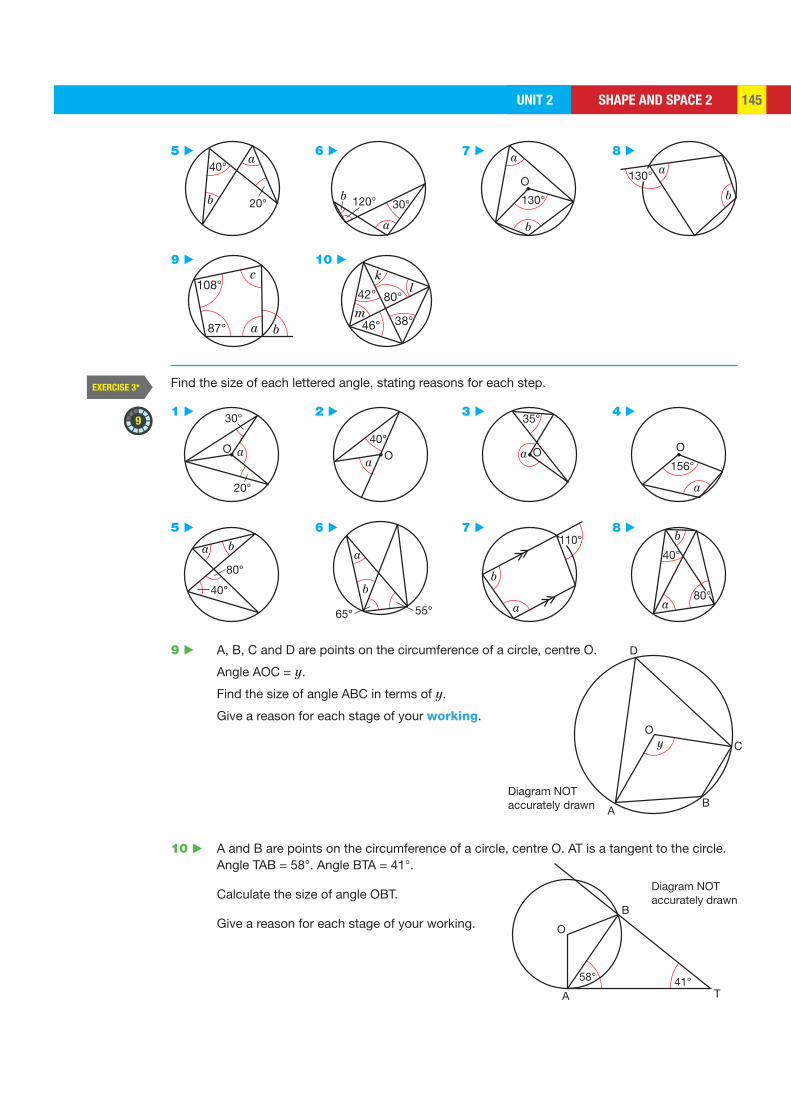
SHAPE AND SPACE 2UNIT 2 145
EXERCISE 3*
9
40°
20°
a
b 120° 30°b
a
O
130°
a
b
130° a
b
a
c
b
108°
87°
42°
m
kl
46° 38°
80°
30°
20°
aO40°
a O
35°
a O156°
a
O
80°
40°
ba
55°65°
b
a110°
b
a
40°
80°
b
a
C
BA
O
D
Diagram NOTaccurately drawn
y
B
A T41°58°
O
Diagram NOTaccurately drawn
Find the size of each lettered angle, stating reasons for each step.
1 ▶ 2 ▶ 3 ▶ 4 ▶
9 ▶ A, B, C and D are points on the circumference of a circle, centre O.
Angle AOC = y.
Find the size of angle ABC in terms of y.
Give a reason for each stage of your working.
10 ▶ A and B are points on the circumference of a circle, centre O. AT is a tangent to the circle. Angle TAB = 58°. Angle BTA = 41°.
Calculate the size of angle OBT.
Give a reason for each stage of your working.
5 ▶ 6 ▶ 7 ▶ 8 ▶
5 ▶ 6 ▶ 7 ▶ 8 ▶
9 ▶ 10 ▶
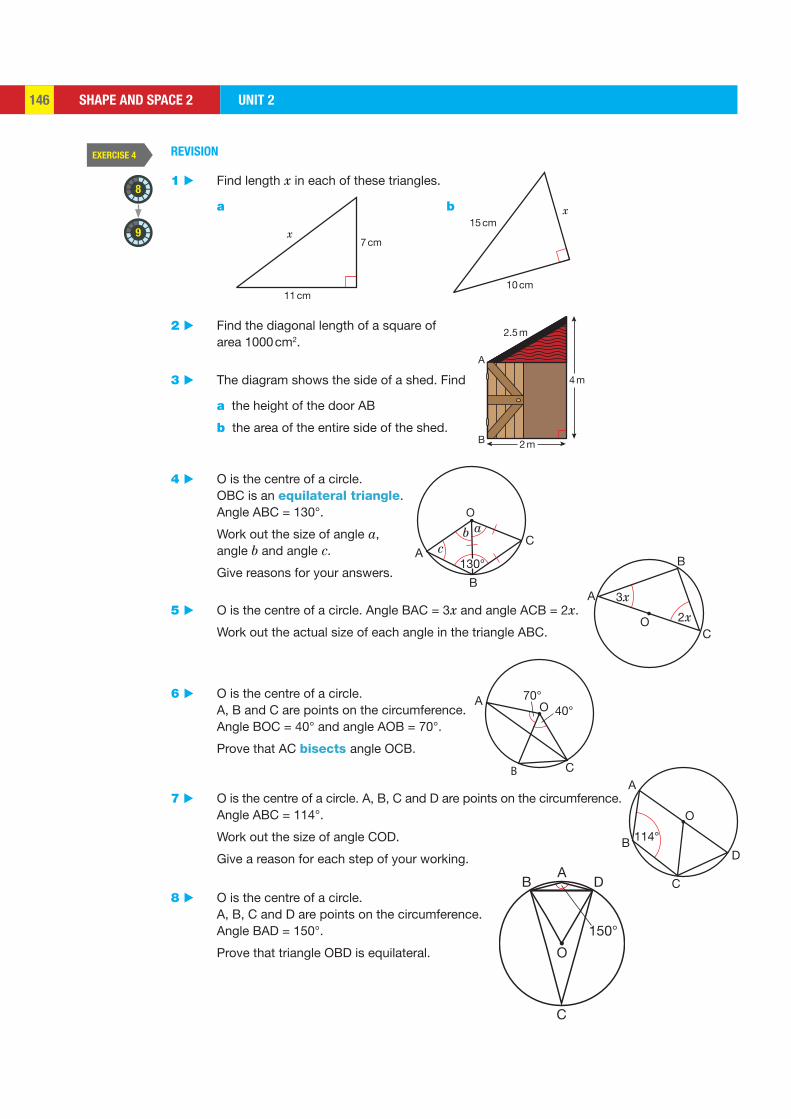
SHAPE AND SPACE 2 UNIT 2146
EXERCISE 4
8
97 cm
11 cm
x
10 cm
15 cmx
2 m
2.5 m
A
B
4 m
ab
A
B
C
O
130°c
O
3x
2xC
B
A
40°O70°A
B C
114°
A
B
C
D
O
150°
B
C
AD
O
REVISION
1 ▶ Find length x in each of these triangles.
a b
2 ▶ Find the diagonal length of a square of area 1000 cm2.
3 ▶ The diagram shows the side of a shed. Find
a the height of the door AB
b the area of the entire side of the shed.
4 ▶ O is the centre of a circle. OBC is an equilateral triangle. Angle ABC = 130°.
Work out the size of angle a, angle b and angle c.
Give reasons for your answers.
5 ▶ O is the centre of a circle. Angle BAC = 3x and angle ACB = 2x.
Work out the actual size of each angle in the triangle ABC.
6 ▶ O is the centre of a circle. A, B and C are points on the circumference. Angle BOC = 40° and angle AOB = 70°.
Prove that AC bisects angle OCB.
7 ▶ O is the centre of a circle. A, B, C and D are points on the circumference. Angle ABC = 114°.
Work out the size of angle COD.
Give a reason for each step of your working.
8 ▶ O is the centre of a circle. A, B, C and D are points on the circumference. Angle BAD = 150°.
Prove that triangle OBD is equilateral.
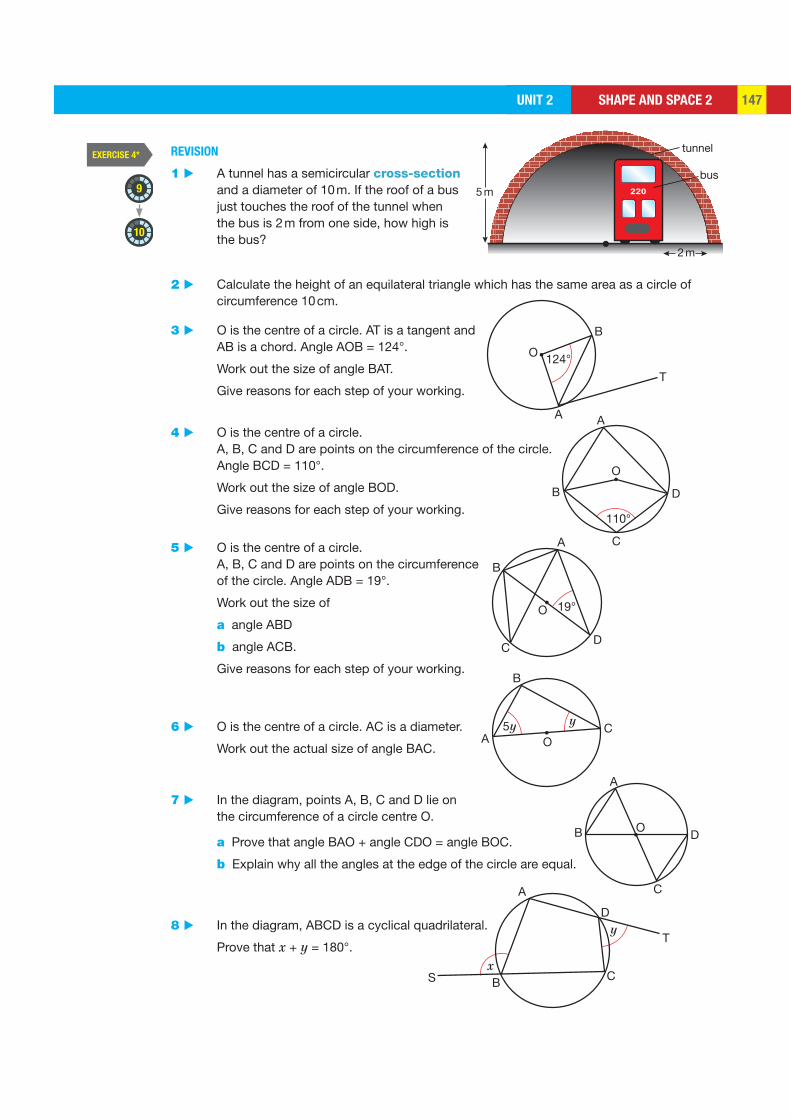
SHAPE AND SPACE 2UNIT 2 147
EXERCISE 4*
9
10
tunnel
bus
5 m
2 m
O
B
T
A
124°
O
B D
C
A
110°
O
B
A
CD
19°
OA
B
C5y y
O
A
B
C
D
A
D
T
CBSx
y
REVISION
1 ▶ A tunnel has a semicircular cross-section and a diameter of 10 m. If the roof of a bus just touches the roof of the tunnel when the bus is 2 m from one side, how high is the bus?
2 ▶ Calculate the height of an equilateral triangle which has the same area as a circle of circumference 10 cm.
3 ▶ O is the centre of a circle. AT is a tangent and AB is a chord. Angle AOB = 124°.
Work out the size of angle BAT.
Give reasons for each step of your working.
4 ▶ O is the centre of a circle. A, B, C and D are points on the circumference of the circle. Angle BCD = 110°.
Work out the size of angle BOD.
Give reasons for each step of your working.
5 ▶ O is the centre of a circle. A, B, C and D are points on the circumference of the circle. Angle ADB = 19°.
Work out the size of
a angle ABD
b angle ACB.
Give reasons for each step of your working.
6 ▶ O is the centre of a circle. AC is a diameter.
Work out the actual size of angle BAC.
7 ▶ In the diagram, points A, B, C and D lie on the circumference of a circle centre O.
a Prove that angle BAO + angle CDO = angle BOC.
b Explain why all the angles at the edge of the circle are equal.
8 ▶ In the diagram, ABCD is a cyclical quadrilateral.
Prove that x + y = 180°.
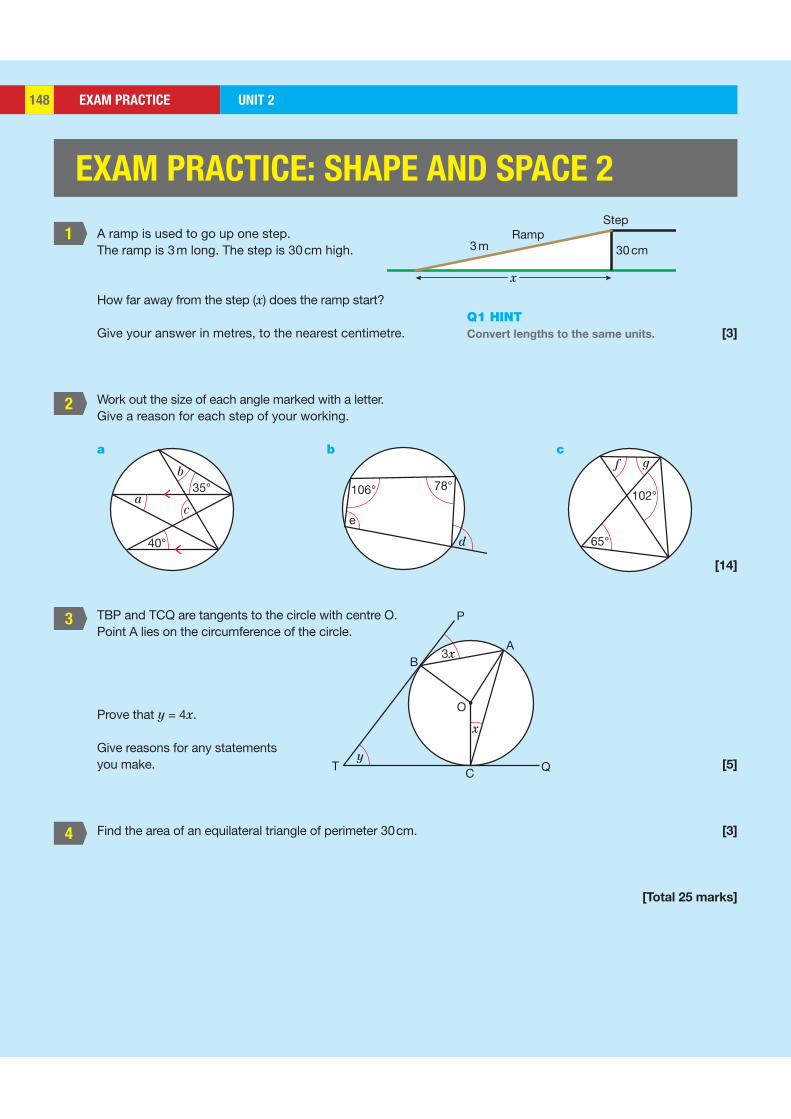
EXAM PRACTICE UNIT 2148
1
2
3
4
3 m 30 cm
StepRamp
x
40°
35°a
c
b106° 78°
d
e
65°
f g
102°
A
P
B
TC Q
O
3x
x
y
EXAM PRACTICE: SHAPE AND SPACE 2
A ramp is used to go up one step. The ramp is 3 m long. The step is 30 cm high.
How far away from the step (x) does the ramp start?
Give your answer in metres, to the nearest centimetre. [3]
Work out the size of each angle marked with a letter.Give a reason for each step of your working.
a b c
[14]
TBP and TCQ are tangents to the circle with centre O. Point A lies on the circumference of the circle.
Prove that y = 4x.
Give reasons for any statements you make. [5]
Find the area of an equilateral triangle of perimeter 30 cm. [3]
[Total 25 marks]
Q1 HINT Convert lengths to the same units.
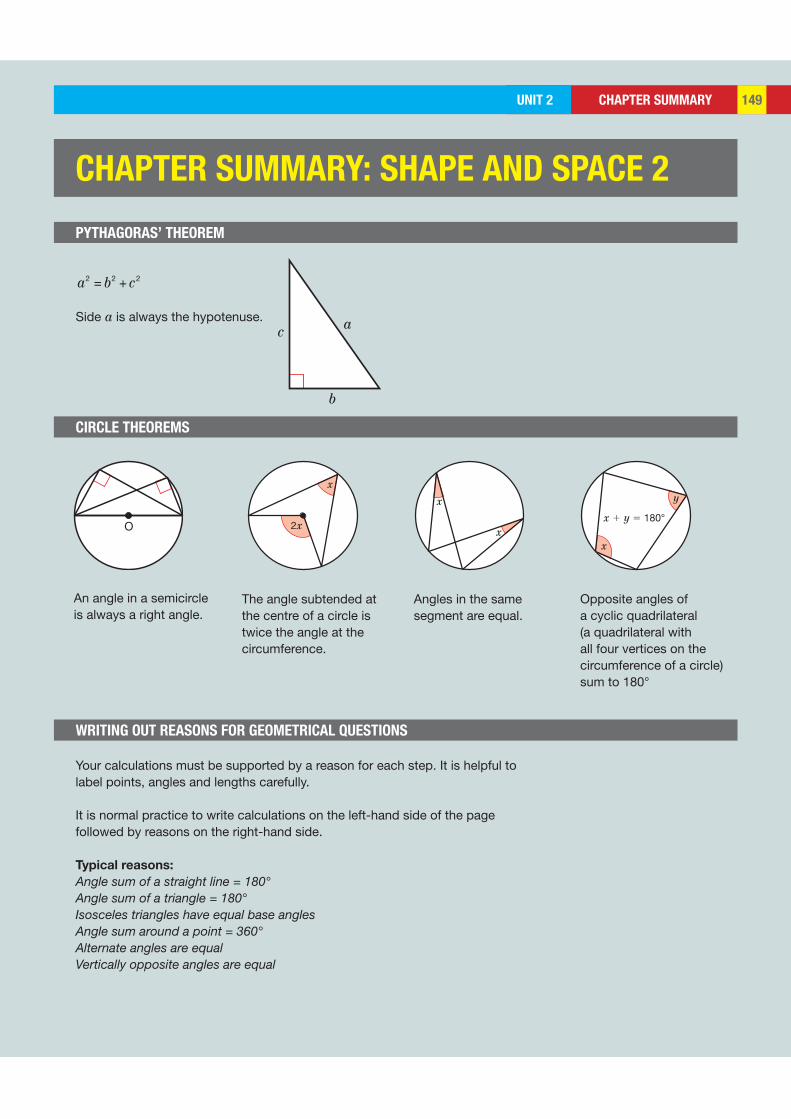
CHAPTER SUMMARYUNIT 2 149
b
ac
O 2x
x
x
xx
x 1 y 5 180°
y
CHAPTER SUMMARY: SHAPE AND SPACE 2
PYTHAGORAS’ THEOREM
WRITING OUT REASONS FOR GEOMETRICAL QUESTIONS
CIRCLE THEOREMS
a2 = b2 +c2
Side a is always the hypotenuse.
Your calculations must be supported by a reason for each step. It is helpful to label points, angles and lengths carefully.
It is normal practice to write calculations on the left-hand side of the page followed by reasons on the right-hand side.
Typical reasons:
Angle sum of a straight line = 180°Angle sum of a triangle = 180°Isosceles triangles have equal base anglesAngle sum around a point = 360°Alternate angles are equalVertically opposite angles are equal
An angle in a semicircle is always a right angle.
The angle subtended at the centre of a circle is twice the angle at the circumference.
Angles in the same segment are equal.
Opposite angles of a cyclic quadrilateral (a quadrilateral with all four vertices on the circumference of a circle) sum to 180°
HANDLING DATA 1 UNIT 2150
LEARNING OBJECTIVES
BASIC PRINCIPLES
Specify problem and plan
Process and represent data
Interpret, discuss and
predict Collect data
HANDLING DATA 1
‘There are three kinds of lies: lies, dreadful lies, and statistics’ is a statement sometimes made when talking about the persuasive power of statistics. If you wish to avoid being misled by advertising claims, politicians and spin doctors, then a knowledge of statistics and its misuse is an essential skill in the modern world.
• Use pie charts and frequency polygons
• Construct and use two-way tables
• Identify misleading graphs
• Decide which average is best for a set of data
• Data can be in the form of numbers or categories (e.g. colour).
• Data is often collected by using a tally chart.
• Data is displayed by using diagrams such as pie charts, bar charts, and pictograms.
• The mean, median and mode are all different averages.
• The mean of a set of values = total of the set of valuestotal number of values
.
• The median is the middle value when the data is written in ascending (increasing) order.
• The mode is the most frequent value.
STATISTICAL INVESTIGATION AND COLLECTING DATA
Statistics involves making sense of data, recognising patterns or trends and then possibly making predictions. Frequently a lot of data is obtained from samples. Statisticians are people who prepare and analyse statistics. They try to present this data in a way that the human mind can understand. This is done by finding averages to represent all the data, or by drawing diagrams that make it easy to understand what the data means. The conclusions are compared with the real world; more samples may be taken to improve any predictions.
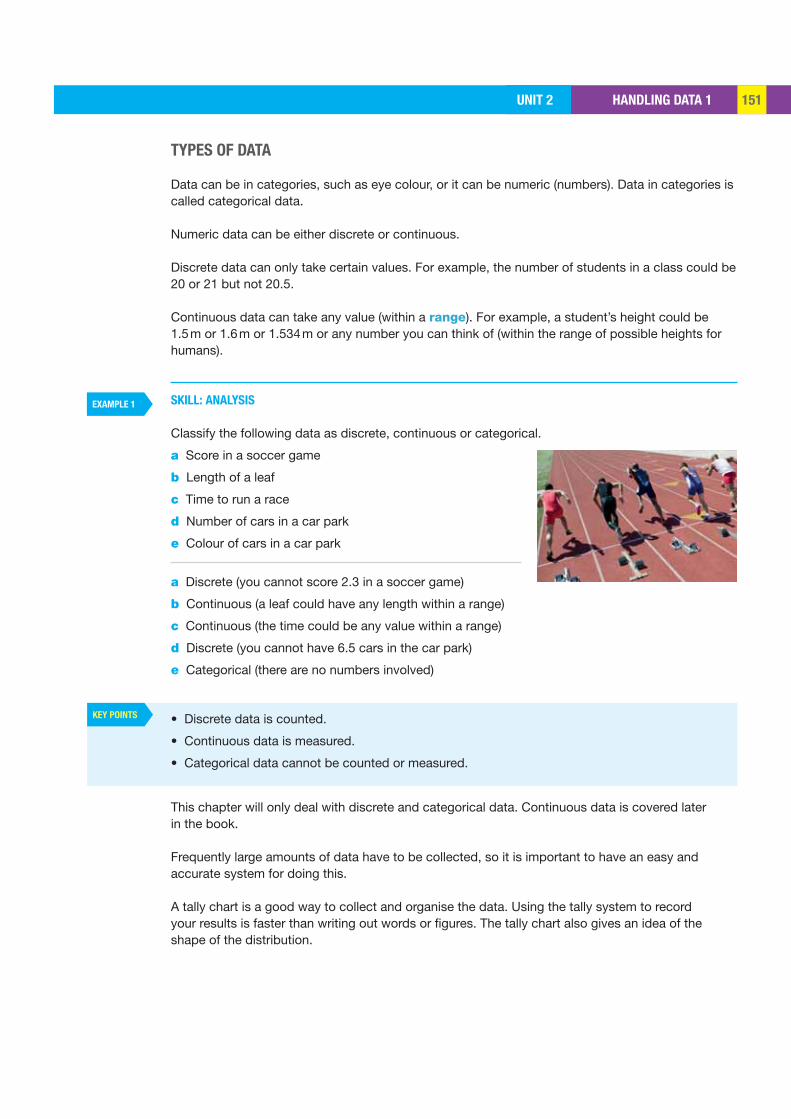
HANDLING DATA 1UNIT 2 151
EXAMPLE 1
KEY POINTS
TYPES OF DATA
Data can be in categories, such as eye colour, or it can be numeric (numbers). Data in categories is called categorical data.
Numeric data can be either discrete or continuous.
Discrete data can only take certain values. For example, the number of students in a class could be 20 or 21 but not 20.5.
Continuous data can take any value (within a range). For example, a student’s height could be 1.5 m or 1.6 m or 1.534 m or any number you can think of (within the range of possible heights for humans).
SKILL: ANALYSIS
Classify the following data as discrete, continuous or categorical.
a Score in a soccer game
b Length of a leaf
c Time to run a race
d Number of cars in a car park
e Colour of cars in a car park
a Discrete (you cannot score 2.3 in a soccer game)
b Continuous (a leaf could have any length within a range)
c Continuous (the time could be any value within a range)
d Discrete (you cannot have 6.5 cars in the car park)
e Categorical (there are no numbers involved)
• Discrete data is counted.
• Continuous data is measured.
• Categorical data cannot be counted or measured.
This chapter will only deal with discrete and categorical data. Continuous data is covered later in the book.
Frequently large amounts of data have to be collected, so it is important to have an easy and accurate system for doing this.
A tally chart is a good way to collect and organise the data. Using the tally system to record your results is faster than writing out words or figures. The tally chart also gives an idea of the shape of the distribution.
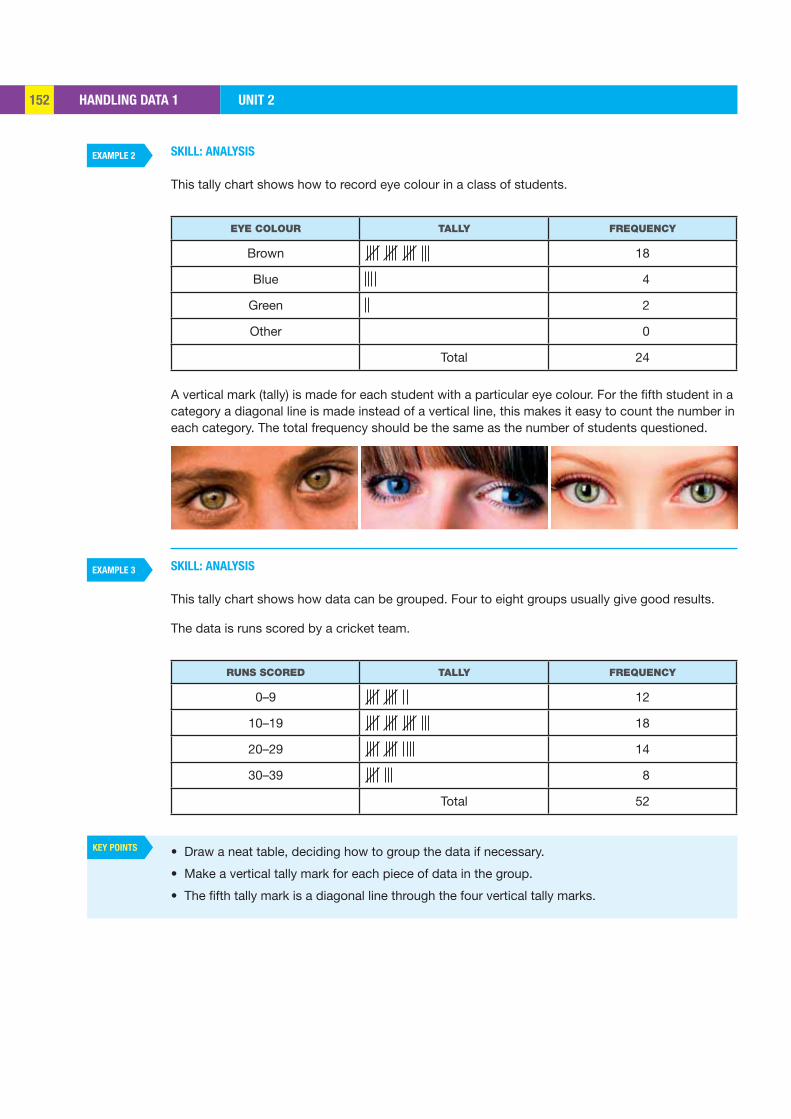
HANDLING DATA 1 UNIT 2152
EXAMPLE 2
EXAMPLE 3
KEY POINTS
SKILL: ANALYSIS
This tally chart shows how to record eye colour in a class of students.
EYE COLOUR TALLY FREQUENCY
Brown 18
Blue 4
Green 2
Other 0
Total 24
A vertical mark (tally) is made for each student with a particular eye colour. For the fifth student in a category a diagonal line is made instead of a vertical line, this makes it easy to count the number in each category. The total frequency should be the same as the number of students questioned.
SKILL: ANALYSIS
This tally chart shows how data can be grouped. Four to eight groups usually give good results.
The data is runs scored by a cricket team.
RUNS SCORED TALLY FREQUENCY
0–9 12
10–19 18
20–29 14
30–39 8
Total 52
• Draw a neat table, deciding how to group the data if necessary.
• Make a vertical tally mark for each piece of data in the group.
• The fifth tally mark is a diagonal line through the four vertical tally marks.

HANDLING DATA 1UNIT 2 153
5
5
1 ▶ Classify the following data as discrete, continuous or categorical.
a Brand of car d Life of batteries in hours
b Number of TV programs watched e Pet preference
c Number of children in a family f Distance travelled to school
2 ▶ The day after a school event a group of pupils was asked to give it a grade from A to E, A being excellent and E being terrible. The following results were collected.
D, B, E, E, C, A, E, B, A, B, E, A, B, D, A, D, D, A, D, B, A, D, E, C, E, A, E, E, A, A
a Construct a tally chart for the data.
b How many pupils were in the survey?
c Can you draw any conclusions about the event?
3 ▶ a Make a tally chart for the eye colour of students in your class.
b Can you draw any conclusions from your data?
4 ▶ a Ask all the students in your class to name their lucky number between 1 and 10.
b Record your results on a tally chart.
c Can you draw any conclusions from your data?
1 ▶ Classify the following data as discrete, continuous or categorical.
a Weight of potatoes d Length of phone call
b Types of pizza e Hair colour
c Shoe size f Number of times a student is late for school
2 ▶ Tara suspects that a die lands on certain numbers more often than others. She throws it 50 times with the following results.
6 1 4 4 2 5 4 1 2 3 4 3 2 4 1 2 6 3 2 6 6 6 6 1 4 5 6 4 6 4 2 6 3 1 2 2 6 5 4 3 1 6 6 2 5 5 2 1 4 5
a Construct a tally chart for the data.
b Comment on Tara’s suspicions.
EXERCISE 1
EXERCISE 1*
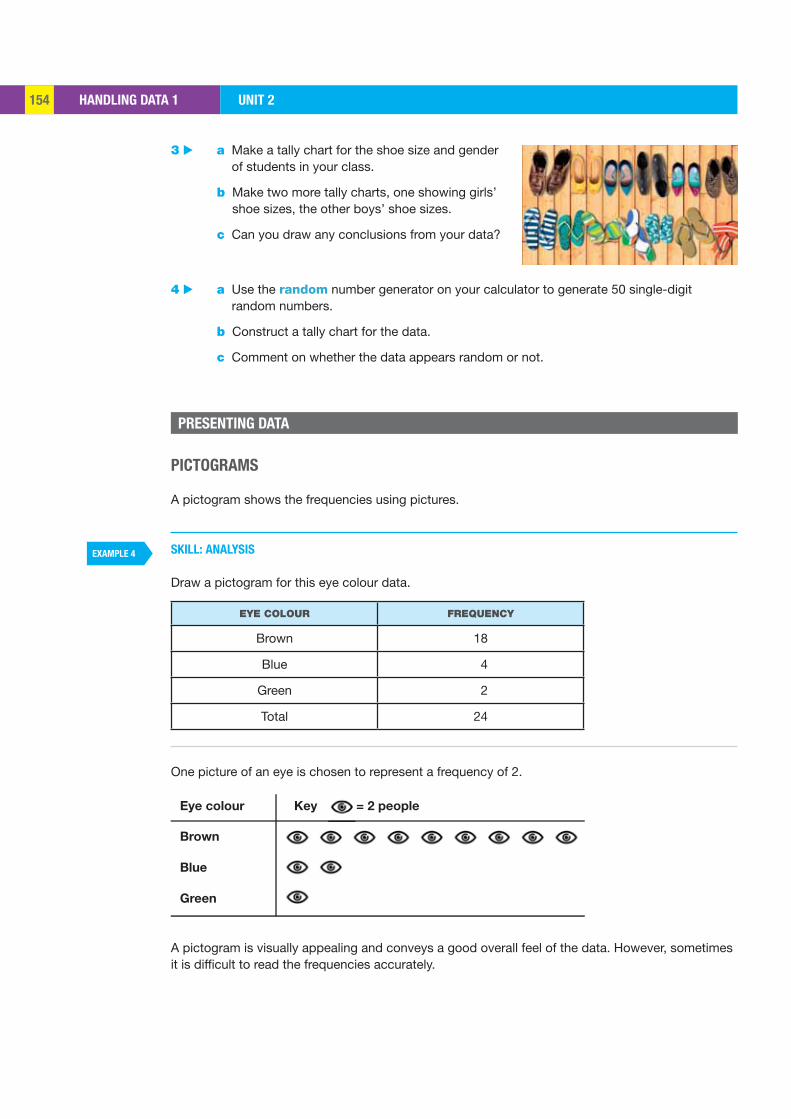
HANDLING DATA 1 UNIT 2154
EXAMPLE 4
Eye colour Key = 2 people
Brown
Blue
Green
3 ▶ a Make a tally chart for the shoe size and gender of students in your class.
b Make two more tally charts, one showing girls’ shoe sizes, the other boys’ shoe sizes.
c Can you draw any conclusions from your data?
4 ▶ a Use the random number generator on your calculator to generate 50 single-digit random numbers.
b Construct a tally chart for the data.
c Comment on whether the data appears random or not.
PRESENTING DATA
PICTOGRAMS
A pictogram shows the frequencies using pictures.
SKILL: ANALYSIS
Draw a pictogram for this eye colour data.
EYE COLOUR FREQUENCY
Brown 18
Blue 4
Green 2
Total 24
One picture of an eye is chosen to represent a frequency of 2.
A pictogram is visually appealing and conveys a good overall feel of the data. However, sometimes it is difficult to read the frequencies accurately.
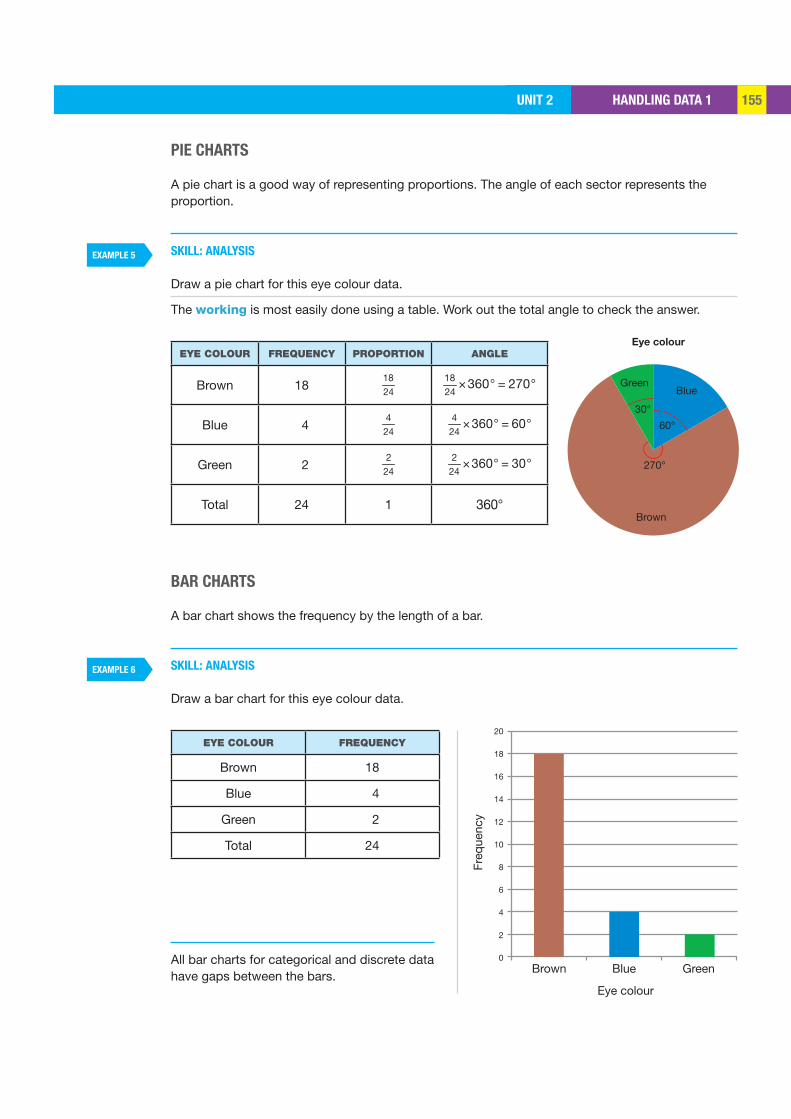
HANDLING DATA 1UNIT 2 155
EXAMPLE 5
EXAMPLE 6
GreenBlueBrown
Eye colour
Freq
uenc
y
20
18
16
14
12
10
8
6
4
2
0
GreenBlue
Brown
Eye colour
60°
30°
270°
PIE CHARTS
A pie chart is a good way of representing proportions. The angle of each sector represents the proportion.
SKILL: ANALYSIS
Draw a pie chart for this eye colour data.
The working is most easily done using a table. Work out the total angle to check the answer.
EYE COLOUR FREQUENCY PROPORTION ANGLE
Brown 181824
× ° = °1824
360 270
Blue 44
24× ° = °4
24360 60
Green 22
24× ° = °2
24360 30
Total 24 1 360°
BAR CHARTS
A bar chart shows the frequency by the length of a bar.
SKILL: ANALYSIS
Draw a bar chart for this eye colour data.
EYE COLOUR FREQUENCY
Brown 18
Blue 4
Green 2
Total 24
All bar charts for categorical and discrete data have gaps between the bars.
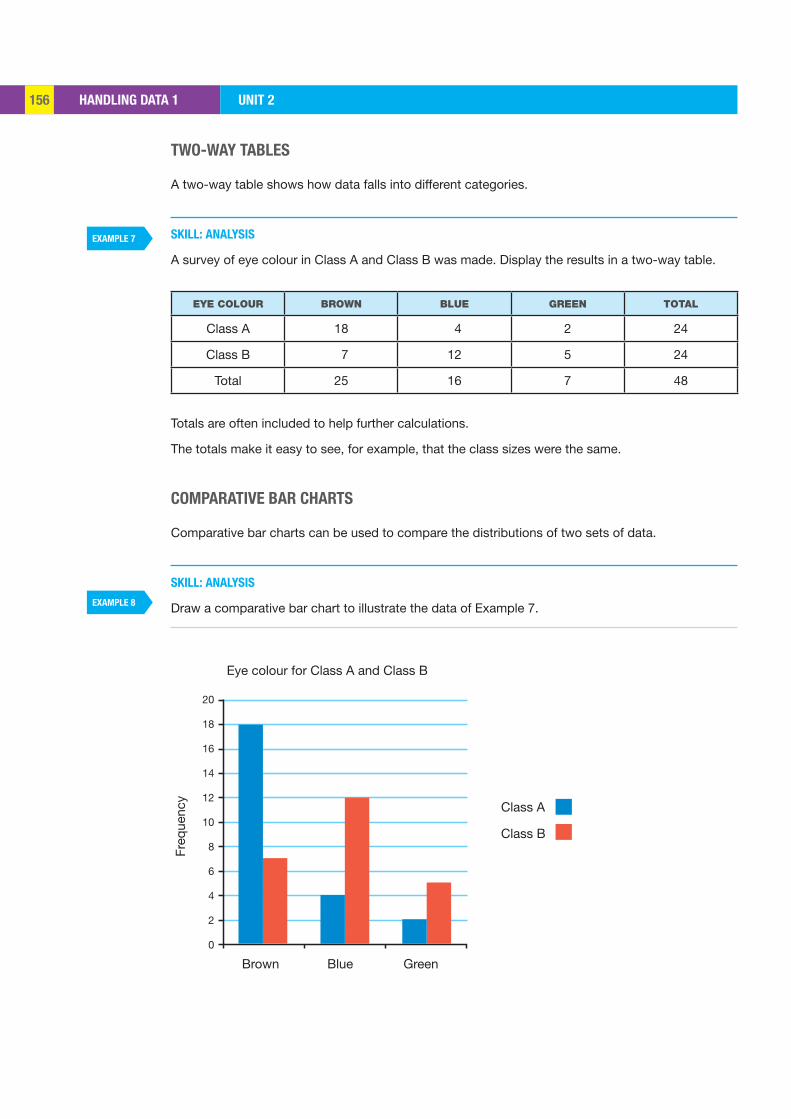
HANDLING DATA 1 UNIT 2156
EXAMPLE 7
EXAMPLE 8
GreenBlueBrown
Freq
uenc
y
20
18
16
14
12
10
8
6
4
2
0
Eye colour for Class A and Class B
Class A
Class B
TWO-WAY TABLES
A two-way table shows how data falls into different categories.
SKILL: ANALYSIS
A survey of eye colour in Class A and Class B was made. Display the results in a two-way table.
EYE COLOUR BROWN BLUE GREEN TOTAL
Class A 18 4 2 24
Class B 7 12 5 24
Total 25 16 7 48
Totals are often included to help further calculations.
The totals make it easy to see, for example, that the class sizes were the same.
COMPARATIVE BAR CHARTS
Comparative bar charts can be used to compare the distributions of two sets of data.
SKILL: ANALYSIS
Draw a comparative bar chart to illustrate the data of Example 7.
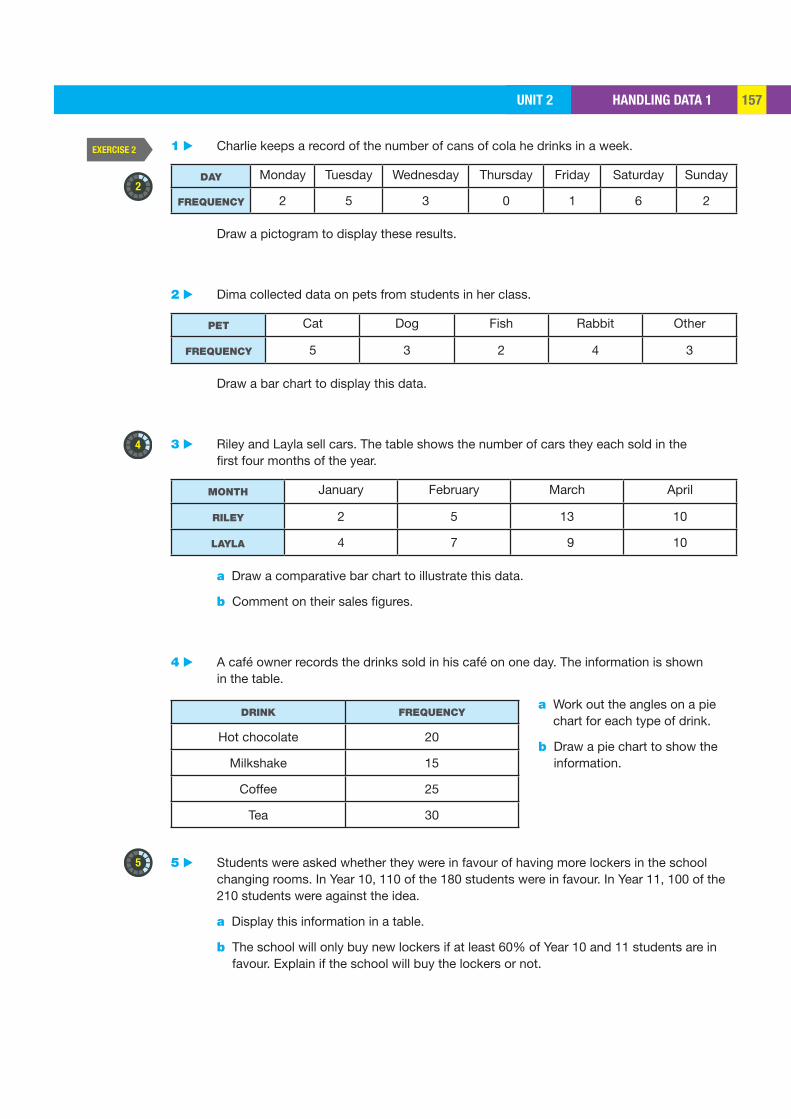
HANDLING DATA 1UNIT 2 157
2
4
5
1 ▶ Charlie keeps a record of the number of cans of cola he drinks in a week.
DAY Monday Tuesday Wednesday Thursday Friday Saturday Sunday
FREQUENCY 2 5 3 0 1 6 2
Draw a pictogram to display these results.
2 ▶ Dima collected data on pets from students in her class.
PET Cat Dog Fish Rabbit Other
FREQUENCY 5 3 2 4 3
Draw a bar chart to display this data.
3 ▶ Riley and Layla sell cars. The table shows the number of cars they each sold in the first four months of the year.
MONTH January February March April
RILEY 2 5 13 10
LAYLA 4 7 9 10
a Draw a comparative bar chart to illustrate this data.
b Comment on their sales figures.
4 ▶ A café owner records the drinks sold in his café on one day. The information is shown in the table.
a Work out the angles on a pie chart for each type of drink.
b Draw a pie chart to show the information.
5 ▶ Students were asked whether they were in favour of having more lockers in the school changing rooms. In Year 10, 110 of the 180 students were in favour. In Year 11, 100 of the 210 students were against the idea.
a Display this information in a table.
b The school will only buy new lockers if at least 60% of Year 10 and 11 students are in favour. Explain if the school will buy the lockers or not.
EXERCISE 2
DRINK FREQUENCY
Hot chocolate 20
Milkshake 15
Coffee 25
Tea 30
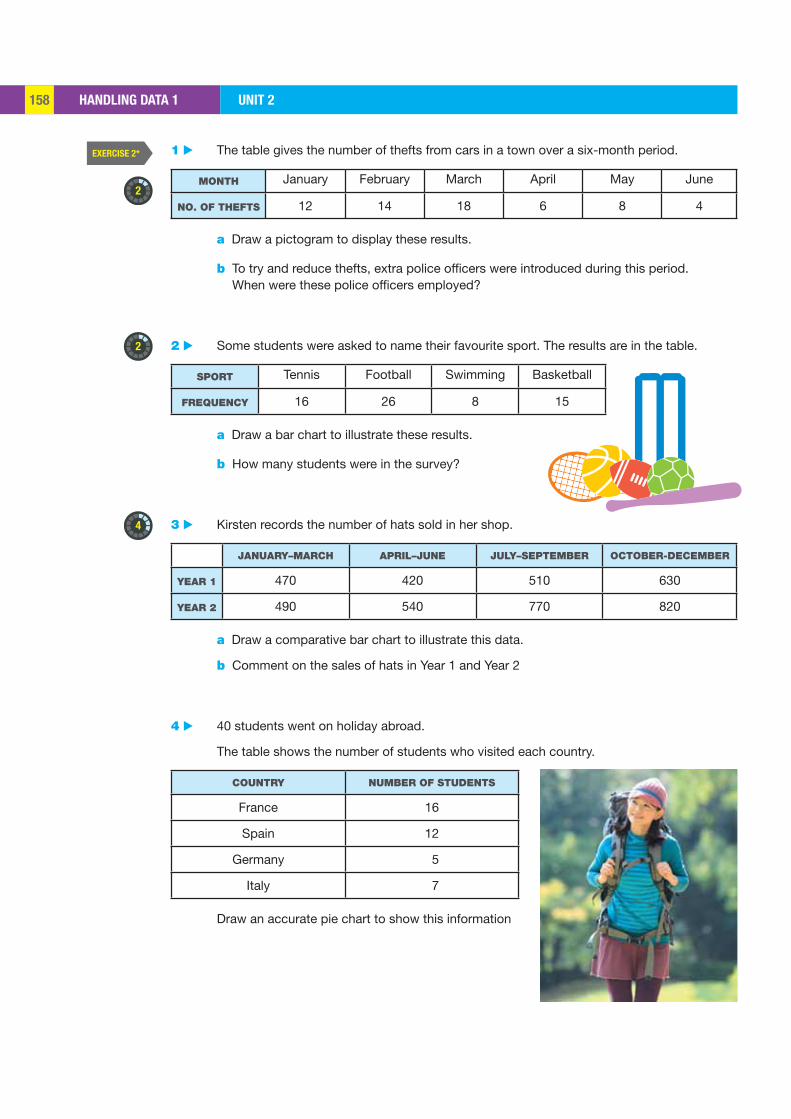
HANDLING DATA 1 UNIT 2158
2
2
4
1 ▶ The table gives the number of thefts from cars in a town over a six-month period.
MONTH January February March April May June
NO. OF THEFTS 12 14 18 6 8 4
a Draw a pictogram to display these results.
b To try and reduce thefts, extra police officers were introduced during this period. When were these police officers employed?
2 ▶ Some students were asked to name their favourite sport. The results are in the table.
SPORT Tennis Football Swimming Basketball
FREQUENCY 16 26 8 15
a Draw a bar chart to illustrate these results.
b How many students were in the survey?
3 ▶ Kirsten records the number of hats sold in her shop.
JANUARY–MARCH APRIL–JUNE JULY–SEPTEMBER OCTOBER-DECEMBER
YEAR 1 470 420 510 630
YEAR 2 490 540 770 820
a Draw a comparative bar chart to illustrate this data.
b Comment on the sales of hats in Year 1 and Year 2
4 ▶ 40 students went on holiday abroad.
The table shows the number of students who visited each country.
COUNTRY NUMBER OF STUDENTS
France 16
Spain 12
Germany 5
Italy 7
Draw an accurate pie chart to show this information
EXERCISE 2*
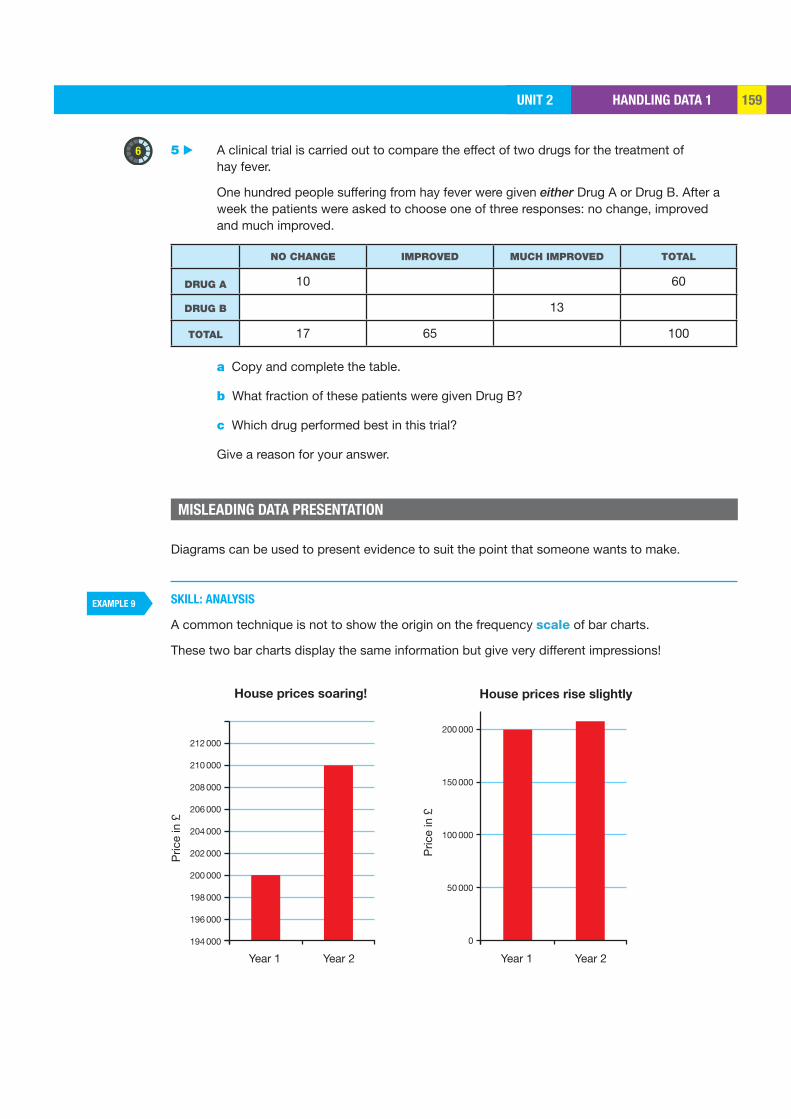
HANDLING DATA 1UNIT 2 159
EXAMPLE 9
6
Year 2Year 1
Pric
e in
£
212 000
210 000
208 000
206 000
204 000
202 000
200 000
198 000
196 000
194 000
House prices soaring!
Year 2Year 1
Pric
e in
£
200 000
150 000
100 000
50 000
0
House prices rise slightly
5 ▶ A clinical trial is carried out to compare the effect of two drugs for the treatment of hay fever.
One hundred people suffering from hay fever were given either Drug A or Drug B. After a week the patients were asked to choose one of three responses: no change, improved and much improved.
NO CHANGE IMPROVED MUCH IMPROVED TOTAL
DRUG A 10 60
DRUG B 13
TOTAL 17 65 100
a Copy and complete the table.
b What fraction of these patients were given Drug B?
c Which drug performed best in this trial?
Give a reason for your answer.
Diagrams can be used to present evidence to suit the point that someone wants to make.
SKILL: ANALYSIS
A common technique is not to show the origin on the frequency scale of bar charts.
These two bar charts display the same information but give very different impressions!
MISLEADING DATA PRESENTATION
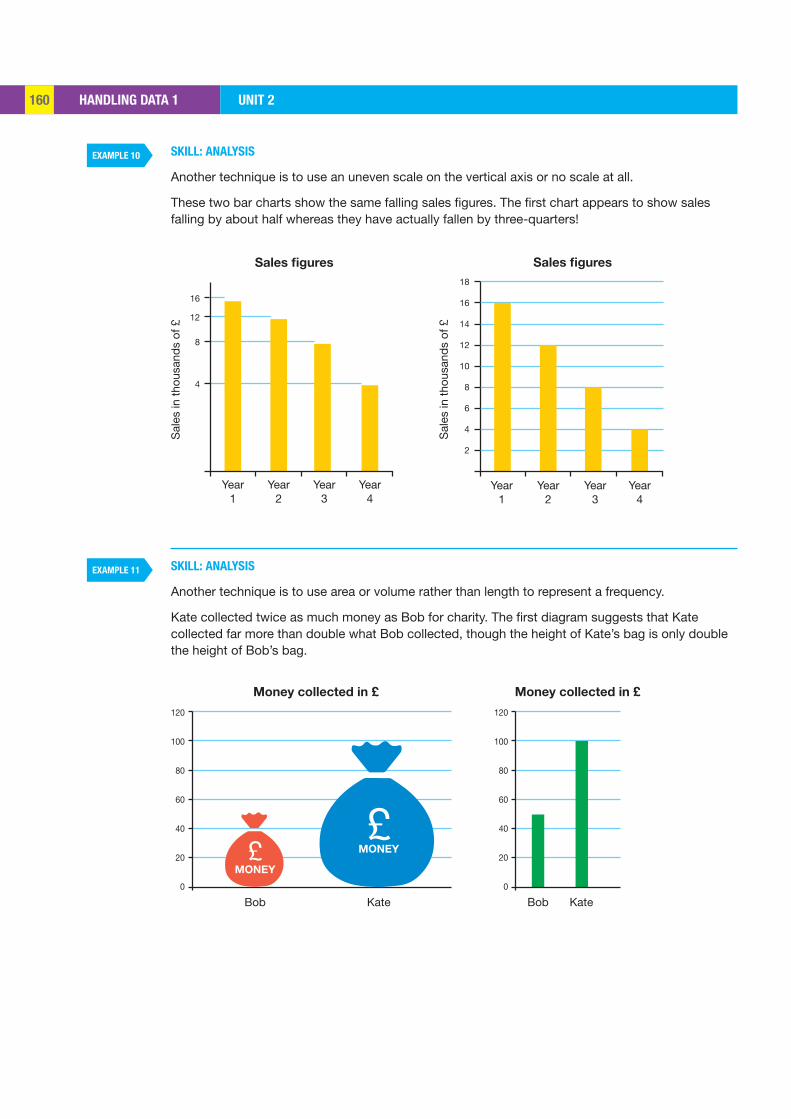
HANDLING DATA 1 UNIT 2160
EXAMPLE 10
EXAMPLE 11
Year1
Sal
es in
thou
sand
s of
£
16
12
8
4
Sales figures
Year2
Year3
Year4
Year1
Sal
es in
thou
sand
s of
£
18
16
14
12
10
8
6
4
2
Sales figures
Year2
Year3
Year4
Bob
120
100
80
60
40
20
0
Money collected in £
Kate
£MONEY
£MONEY
Bob
120
100
80
60
40
20
0
Money collected in £
Kate
SKILL: ANALYSIS
Another technique is to use an uneven scale on the vertical axis or no scale at all.
These two bar charts show the same falling sales figures. The first chart appears to show sales falling by about half whereas they have actually fallen by three-quarters!
SKILL: ANALYSIS
Another technique is to use area or volume rather than length to represent a frequency.
Kate collected twice as much money as Bob for charity. The first diagram suggests that Kate collected far more than double what Bob collected, though the height of Kate’s bag is only double the height of Bob’s bag.
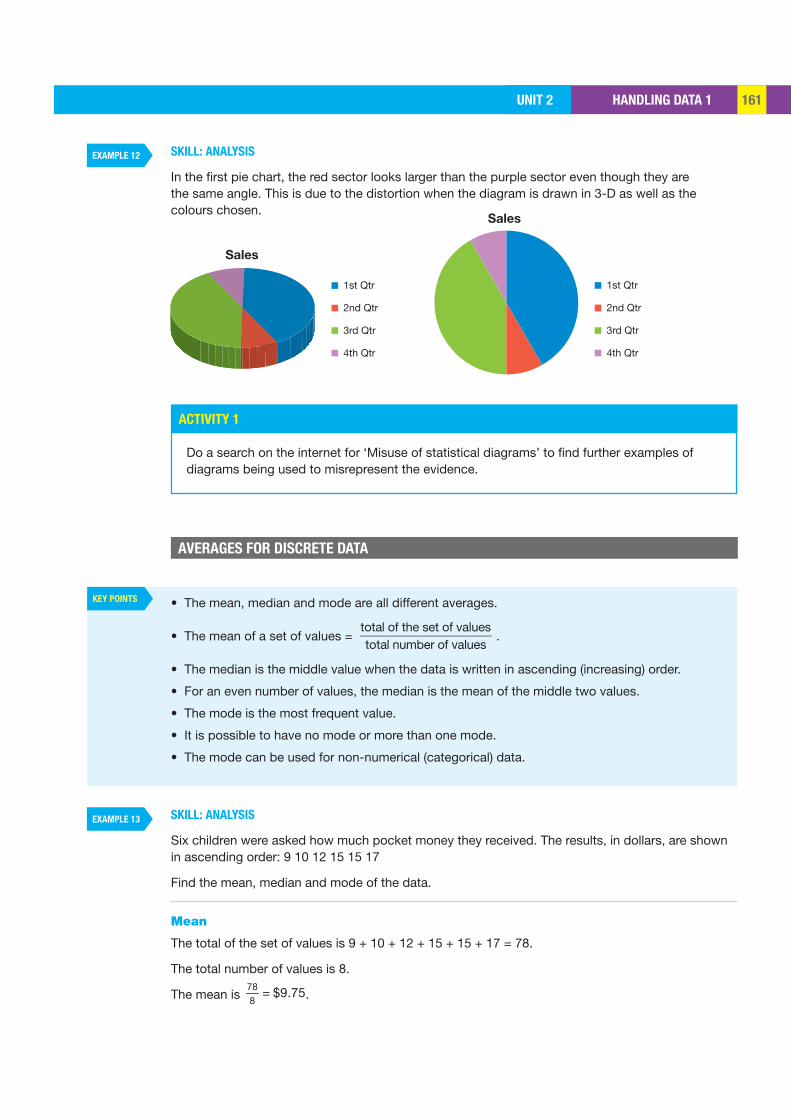
HANDLING DATA 1UNIT 2 161
EXAMPLE 12
EXAMPLE 13
ACTIVITY 1
KEY POINTS
1st Qtr
2nd Qtr
3rd Qtr
4th Qtr
Sales
1st Qtr
2nd Qtr
3rd Qtr
4th Qtr
Sales
SKILL: ANALYSIS
In the first pie chart, the red sector looks larger than the purple sector even though they are the same angle. This is due to the distortion when the diagram is drawn in 3-D as well as the colours chosen.
Do a search on the internet for ‘Misuse of statistical diagrams’ to find further examples of diagrams being used to misrepresent the evidence.
AVERAGES FOR DISCRETE DATA
SKILL: ANALYSIS
Six children were asked how much pocket money they received. The results, in dollars, are shown in ascending order: 9 10 12 15 15 17
Find the mean, median and mode of the data.
Mean
The total of the set of values is 9 + 10 + 12 + 15 + 15 + 17 = 78.
The total number of values is 8.
The mean is =788
$9.75.
• The mean, median and mode are all different averages.
• The mean of a set of values =
total of the set of valuestotal number of values
.
• The median is the middle value when the data is written in ascending (increasing) order.
• For an even number of values, the median is the mean of the middle two values.
• The mode is the most frequent value.
• It is possible to have no mode or more than one mode.
• The mode can be used for non-numerical (categorical) data.
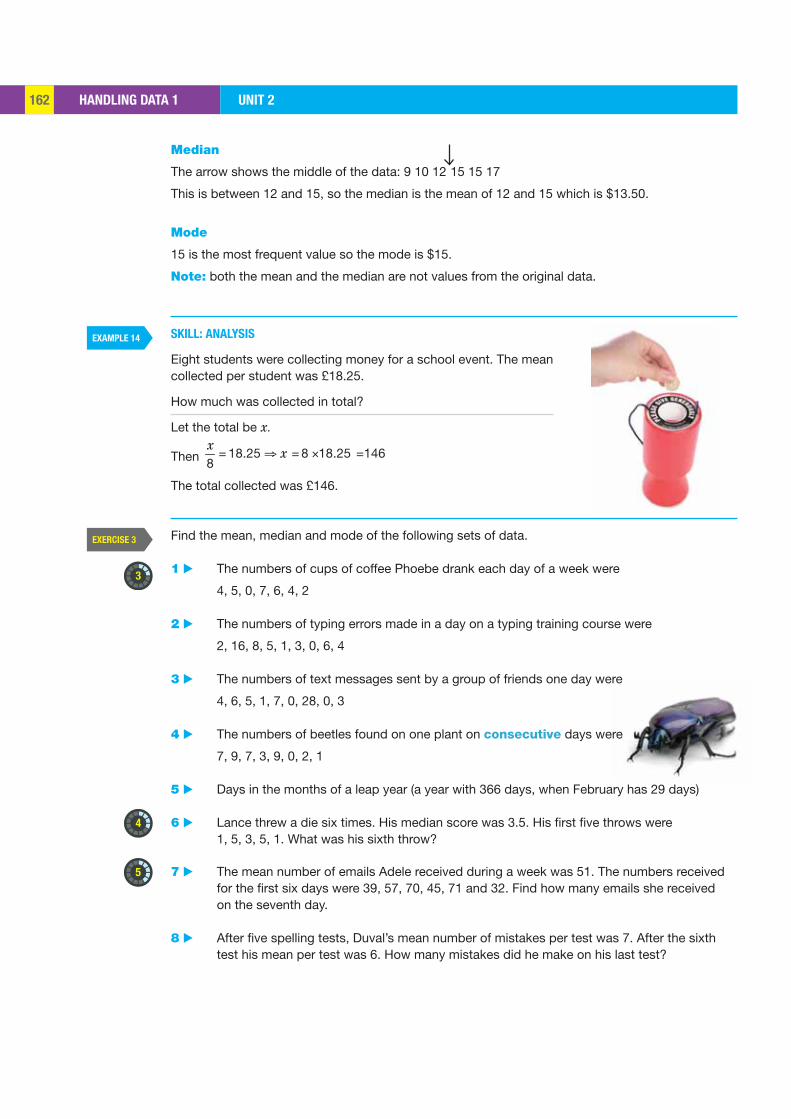
HANDLING DATA 1 UNIT 2162
EXAMPLE 14
3
5
4
Median
The arrow shows the middle of the data: 9 10 12 15 15 17
This is between 12 and 15, so the median is the mean of 12 and 15 which is $13.50.
Mode
15 is the most frequent value so the mode is $15.
Note: both the mean and the median are not values from the original data.
SKILL: ANALYSIS
Eight students were collecting money for a school event. The mean collected per student was £18.25.
How much was collected in total?
Let the total be x.
Then = ⇒ = × =18.25 8 18.25 1468x
x
The total collected was £146.
Find the mean, median and mode of the following sets of data.
1 ▶ The numbers of cups of coffee Phoebe drank each day of a week were
4, 5, 0, 7, 6, 4, 2
2 ▶ The numbers of typing errors made in a day on a typing training course were
2, 16, 8, 5, 1, 3, 0, 6, 4
3 ▶ The numbers of text messages sent by a group of friends one day were
4, 6, 5, 1, 7, 0, 28, 0, 3
4 ▶ The numbers of beetles found on one plant on consecutive days were
7, 9, 7, 3, 9, 0, 2, 1
5 ▶ Days in the months of a leap year (a year with 366 days, when February has 29 days)
6 ▶ Lance threw a die six times. His median score was 3.5. His first five throws were 1, 5, 3, 5, 1. What was his sixth throw?
7 ▶ The mean number of emails Adele received during a week was 51. The numbers received for the first six days were 39, 57, 70, 45, 71 and 32. Find how many emails she received on the seventh day.
8 ▶ After five spelling tests, Duval’s mean number of mistakes per test was 7. After the sixth test his mean per test was 6. How many mistakes did he make on his last test?
EXERCISE 3
HANDLING DATA 1UNIT 2 163
3
4
5
A ‘bell shaped or normal’ distribution
Find the mean, median and mode of the following sets of data.
1 ▶ The numbers of TV programs watched by a group of friends over the weekend were
5, 0, 4, 9, 0, 1, 6, 0, 2
2 ▶ The lives of some batteries in hours to the nearest hour were
69, 55, 72, 44, 46, 72, 84, 86
3 ▶ The numbers of telephone calls received by a hotel on consecutive days were
45, 78, 23, 14, 89, 64, 245, 101
4 ▶ The reaction times in seconds to the nearest 0.01 s of some students were
0.22, 0.57, 0.58, 0.46, 0.90, 0.46, 0.78, 0.99
5 ▶ The first 10 prime numbers
6 ▶ The mean number of ice creams sold per day by a shop during the 31 days of January was 91. During the 28 days of February the mean was 95 per day. Find the mean number sold per day for the two-month period.
7 ▶ David recorded the number of worms found in a square metre of earth over a period of six days. He had put his data in order when a large raindrop made the middle two values on his paper impossible to read. The values were 8, 10, *, *, 17, 23. The mean of the data was 14, and the median was 13. Find the two missing values.
8 ▶ The data 1, x, 3, y, 8, z is in ascending order. The mean of the data is 5, the median is 4.5 and the mode is 3. Find x, y and z.
COMPARING THE MEAN, MEDIAN AND MODE
The mean, median and mode are all different averages of a set of data. An average is a single value that should give you some idea about all the data. For example, if you know that one batsman has a mean score of 12 and another has a mean score of 78 then you immediately have some idea about the batsmen’s ability without knowing all their individual scores.
When the data is plotted as a bar chart, if the result is roughly ‘bell shaped’ or ‘normal’ then the mean, median and mode all give approximately the same answers.
If there are a few very high or very low values (both are called ‘outliers’) then these can distort the averages, and you need to choose which average is the best to use.
EXERCISE 3*
Q5 HINT1 is not
a prime
number.
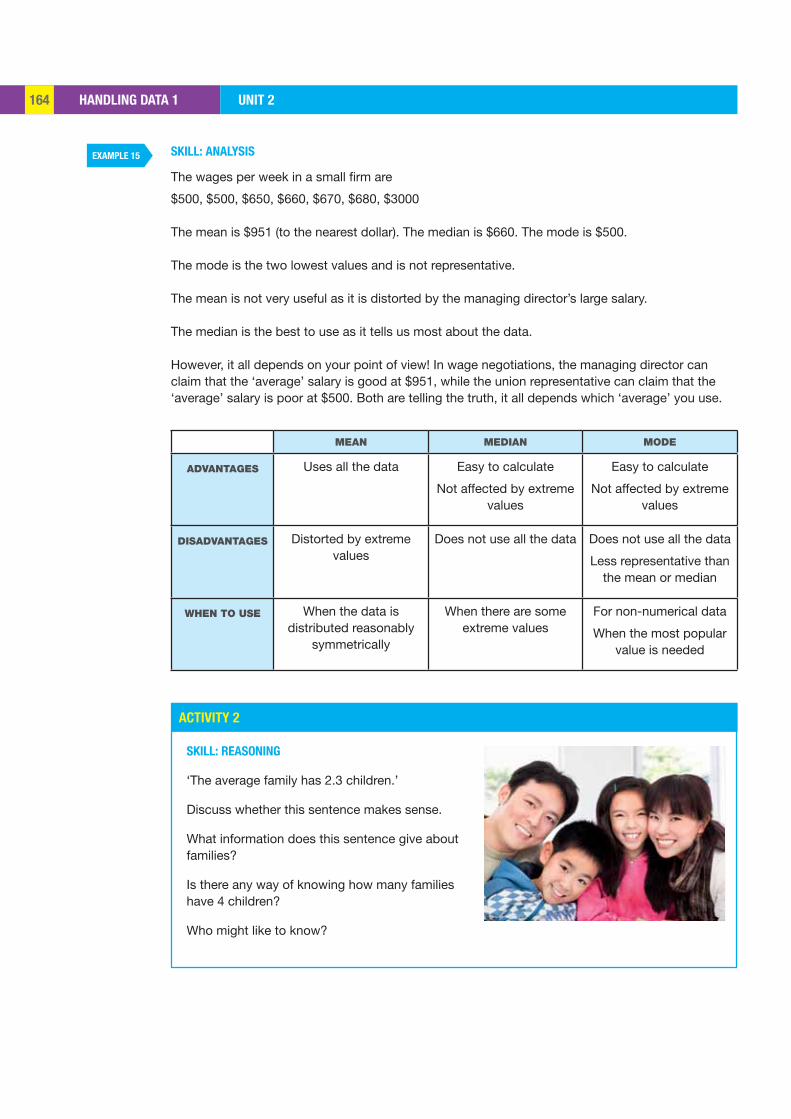
HANDLING DATA 1 UNIT 2164
EXAMPLE 15
ACTIVITY 2
SKILL: ANALYSIS
The wages per week in a small firm are
$500, $500, $650, $660, $670, $680, $3000
The mean is $951 (to the nearest dollar). The median is $660. The mode is $500.
The mode is the two lowest values and is not representative.
The mean is not very useful as it is distorted by the managing director’s large salary.
The median is the best to use as it tells us most about the data.
However, it all depends on your point of view! In wage negotiations, the managing director can claim that the ‘average’ salary is good at $951, while the union representative can claim that the ‘average’ salary is poor at $500. Both are telling the truth, it all depends which ‘average’ you use.
MEAN MEDIAN MODE
ADVANTAGES Uses all the data Easy to calculate
Not affected by extreme values
Easy to calculate
Not affected by extreme values
DISADVANTAGES Distorted by extreme values
Does not use all the data Does not use all the data
Less representative than the mean or median
WHEN TO USE When the data is distributed reasonably
symmetrically
When there are some extreme values
For non-numerical data
When the most popular value is needed
SKILL: REASONING
‘The average family has 2.3 children.’
Discuss whether this sentence makes sense.
What information does this sentence give about families?
Is there any way of knowing how many families have 4 children?
Who might like to know?
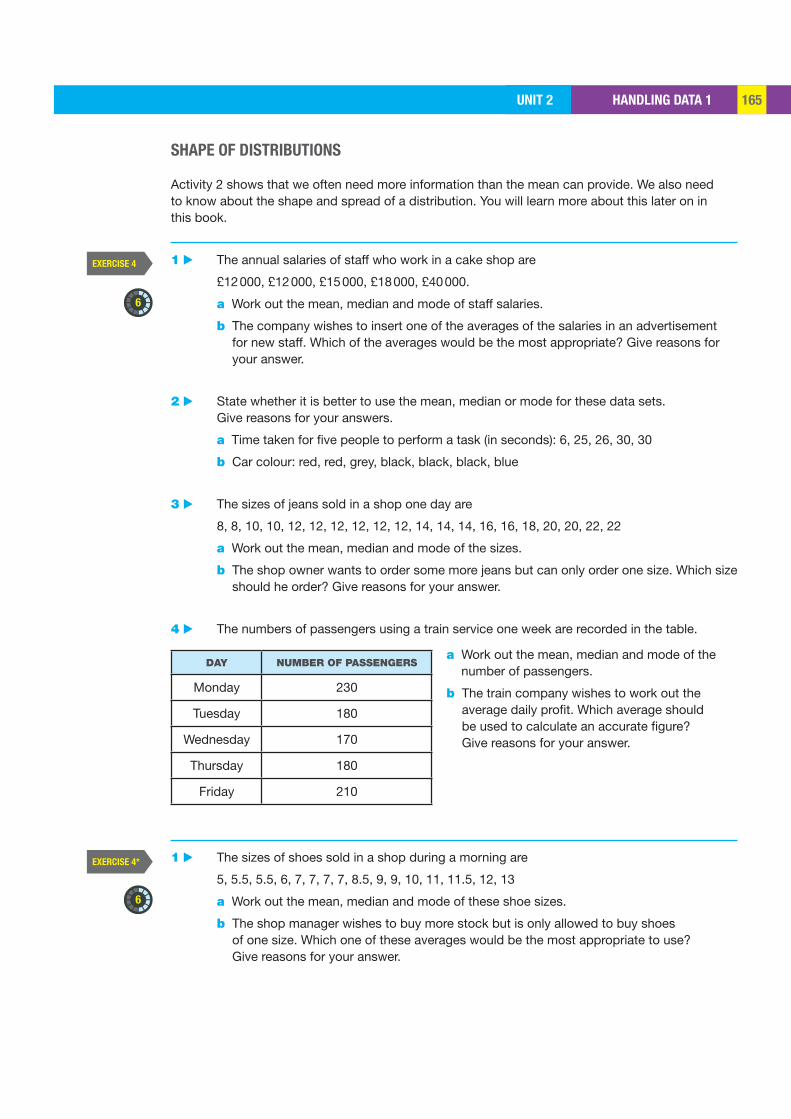
HANDLING DATA 1UNIT 2 165
6
6
SHAPE OF DISTRIBUTIONS
Activity 2 shows that we often need more information than the mean can provide. We also need to know about the shape and spread of a distribution. You will learn more about this later on in this book.
1 ▶ The annual salaries of staff who work in a cake shop are
£12 000, £12 000, £15 000, £18 000, £40 000.
a Work out the mean, median and mode of staff salaries.
b The company wishes to insert one of the averages of the salaries in an advertisement for new staff. Which of the averages would be the most appropriate? Give reasons for your answer.
2 ▶ State whether it is better to use the mean, median or mode for these data sets. Give reasons for your answers.
a Time taken for five people to perform a task (in seconds): 6, 25, 26, 30, 30
b Car colour: red, red, grey, black, black, black, blue
3 ▶ The sizes of jeans sold in a shop one day are
8, 8, 10, 10, 12, 12, 12, 12, 12, 12, 14, 14, 14, 16, 16, 18, 20, 20, 22, 22
a Work out the mean, median and mode of the sizes.
b The shop owner wants to order some more jeans but can only order one size. Which size should he order? Give reasons for your answer.
4 ▶ The numbers of passengers using a train service one week are recorded in the table.
a Work out the mean, median and mode of the number of passengers.
b The train company wishes to work out the average daily profit. Which average should be used to calculate an accurate figure? Give reasons for your answer.
1 ▶ The sizes of shoes sold in a shop during a morning are
5, 5.5, 5.5, 6, 7, 7, 7, 7, 8.5, 9, 9, 10, 11, 11.5, 12, 13
a Work out the mean, median and mode of these shoe sizes.
b The shop manager wishes to buy more stock but is only allowed to buy shoes of one size. Which one of these averages would be the most appropriate to use? Give reasons for your answer.
EXERCISE 4
EXERCISE 4*
DAY NUMBER OF PASSENGERS
Monday 230
Tuesday 180
Wednesday 170
Thursday 180
Friday 210
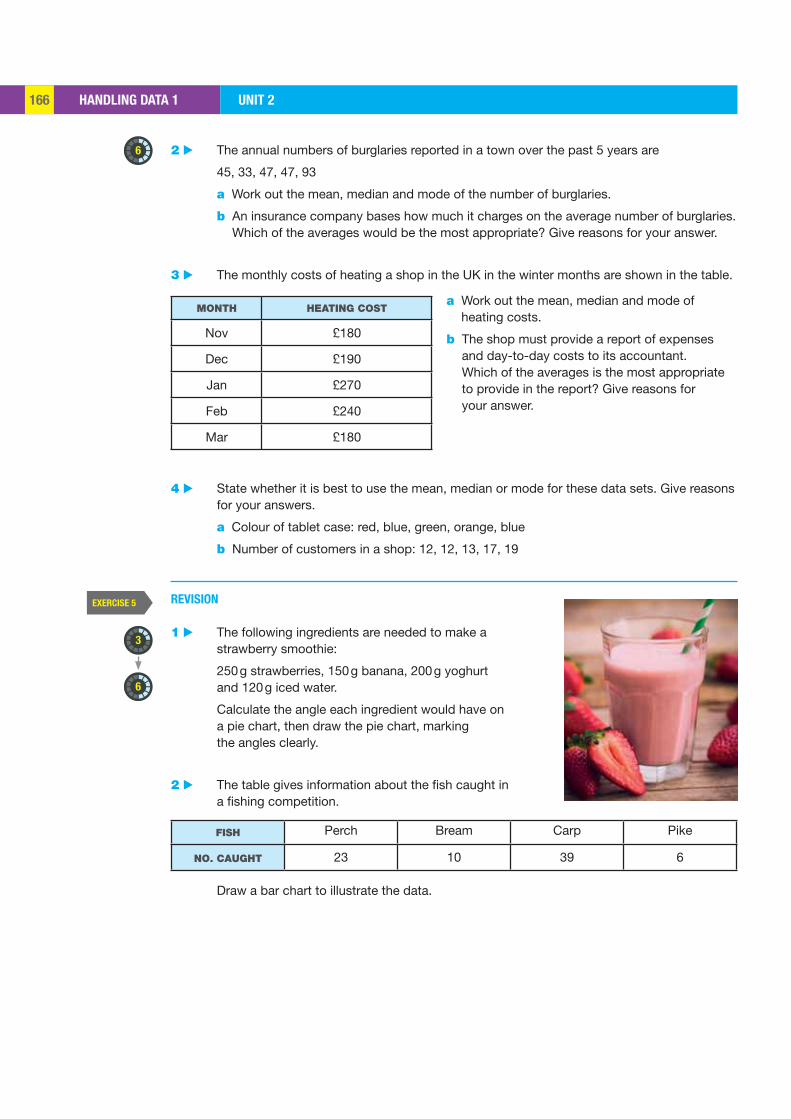
HANDLING DATA 1 UNIT 2166
6
3
6
2 ▶ The annual numbers of burglaries reported in a town over the past 5 years are
45, 33, 47, 47, 93
a Work out the mean, median and mode of the number of burglaries.
b An insurance company bases how much it charges on the average number of burglaries.Which of the averages would be the most appropriate? Give reasons for your answer.
3 ▶ The monthly costs of heating a shop in the UK in the winter months are shown in the table.
a Work out the mean, median and mode of heating costs.
b The shop must provide a report of expenses and day-to-day costs to its accountant. Which of the averages is the most appropriate to provide in the report? Give reasons for your answer.
4 ▶ State whether it is best to use the mean, median or mode for these data sets. Give reasons
for your answers.
a Colour of tablet case: red, blue, green, orange, blue
b Number of customers in a shop: 12, 12, 13, 17, 19
REVISION
1 ▶ The following ingredients are needed to make a strawberry smoothie:
250 g strawberries, 150 g banana, 200 g yoghurt and 120 g iced water.
Calculate the angle each ingredient would have on a pie chart, then draw the pie chart, marking the angles clearly.
2 ▶ The table gives information about the fish caught in a fishing competition.
FISH Perch Bream Carp Pike
NO. CAUGHT 23 10 39 6
Draw a bar chart to illustrate the data.
MONTH HEATING COST
Nov £180
Dec £190
Jan £270
Feb £240
Mar £180
EXERCISE 5
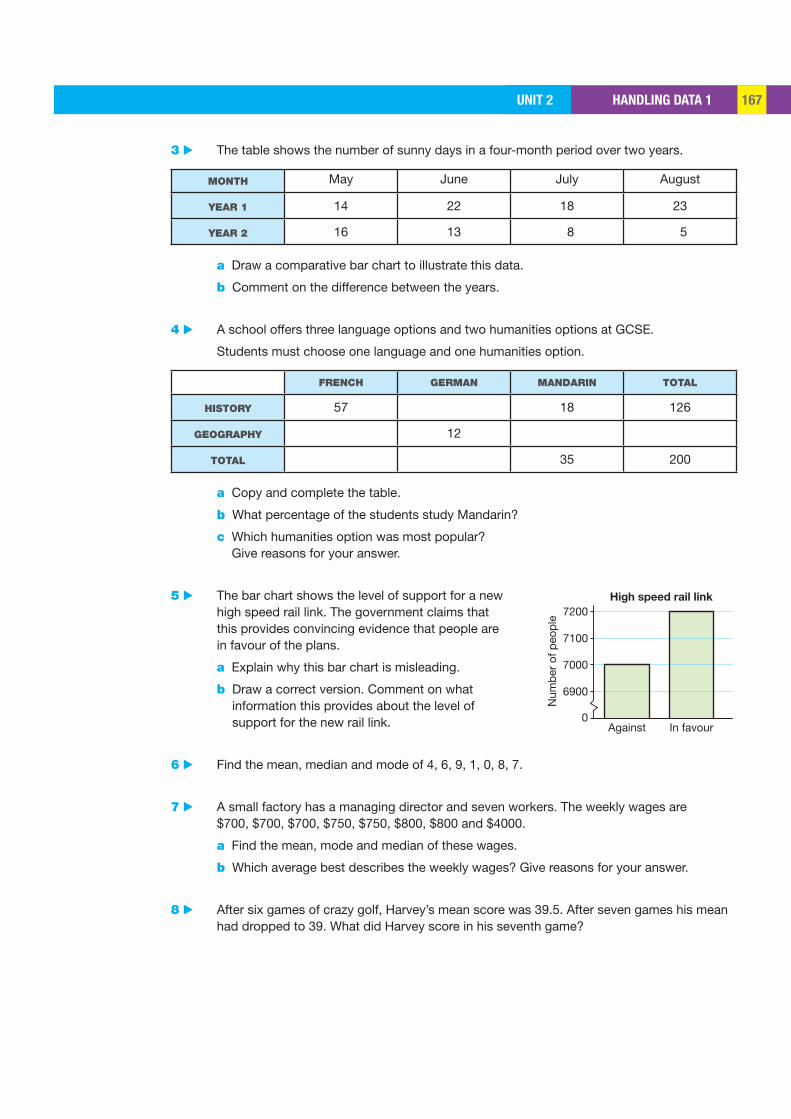
HANDLING DATA 1UNIT 2 167
6900
0
7000
7100
7200High speed rail link
Num
ber
of p
eopl
e
Against In favour
3 ▶ The table shows the number of sunny days in a four-month period over two years.
MONTH May June July August
YEAR 1 14 22 18 23
YEAR 2 16 13 8 5
a Draw a comparative bar chart to illustrate this data.
b Comment on the difference between the years.
4 ▶ A school offers three language options and two humanities options at GCSE.
Students must choose one language and one humanities option.
FRENCH GERMAN MANDARIN TOTAL
HISTORY 57 18 126
GEOGRAPHY 12
TOTAL 35 200
a Copy and complete the table.
b What percentage of the students study Mandarin?
c Which humanities option was most popular? Give reasons for your answer.
5 ▶ The bar chart shows the level of support for a new high speed rail link. The government claims that this provides convincing evidence that people are in favour of the plans.
a Explain why this bar chart is misleading.
b Draw a correct version. Comment on what information this provides about the level of support for the new rail link.
6 ▶ Find the mean, median and mode of 4, 6, 9, 1, 0, 8, 7.
7 ▶ A small factory has a managing director and seven workers. The weekly wages are $700, $700, $700, $750, $750, $800, $800 and $4000.
a Find the mean, mode and median of these wages.
b Which average best describes the weekly wages? Give reasons for your answer.
8 ▶ After six games of crazy golf, Harvey’s mean score was 39.5. After seven games his mean had dropped to 39. What did Harvey score in his seventh game?
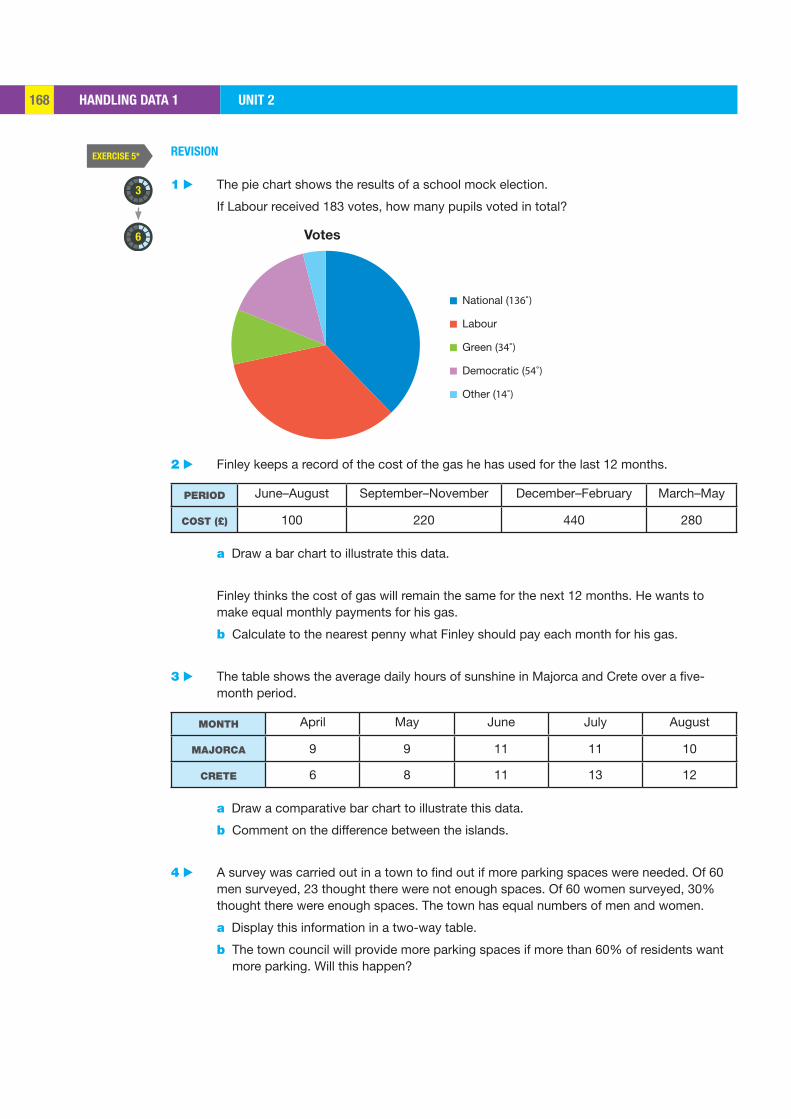
HANDLING DATA 1 UNIT 2168
3
6
National (136˚)
Labour
Green (34˚)
Democratic (54˚)
Other (14˚)
Votes
REVISION
1 ▶ The pie chart shows the results of a school mock election.
If Labour received 183 votes, how many pupils voted in total?
2 ▶ Finley keeps a record of the cost of the gas he has used for the last 12 months.
PERIOD June–August September–November December–February March–May
COST (£) 100 220 440 280
a Draw a bar chart to illustrate this data.
Finley thinks the cost of gas will remain the same for the next 12 months. He wants to make equal monthly payments for his gas.
b Calculate to the nearest penny what Finley should pay each month for his gas.
3 ▶ The table shows the average daily hours of sunshine in Majorca and Crete over a five-month period.
MONTH April May June July August
MAJORCA 9 9 11 11 10
CRETE 6 8 11 13 12
a Draw a comparative bar chart to illustrate this data.
b Comment on the difference between the islands.
4 ▶ A survey was carried out in a town to find out if more parking spaces were needed. Of 60 men surveyed, 23 thought there were not enough spaces. Of 60 women surveyed, 30% thought there were enough spaces. The town has equal numbers of men and women.
a Display this information in a two-way table.
b The town council will provide more parking spaces if more than 60% of residents want more parking. Will this happen?
EXERCISE 5*
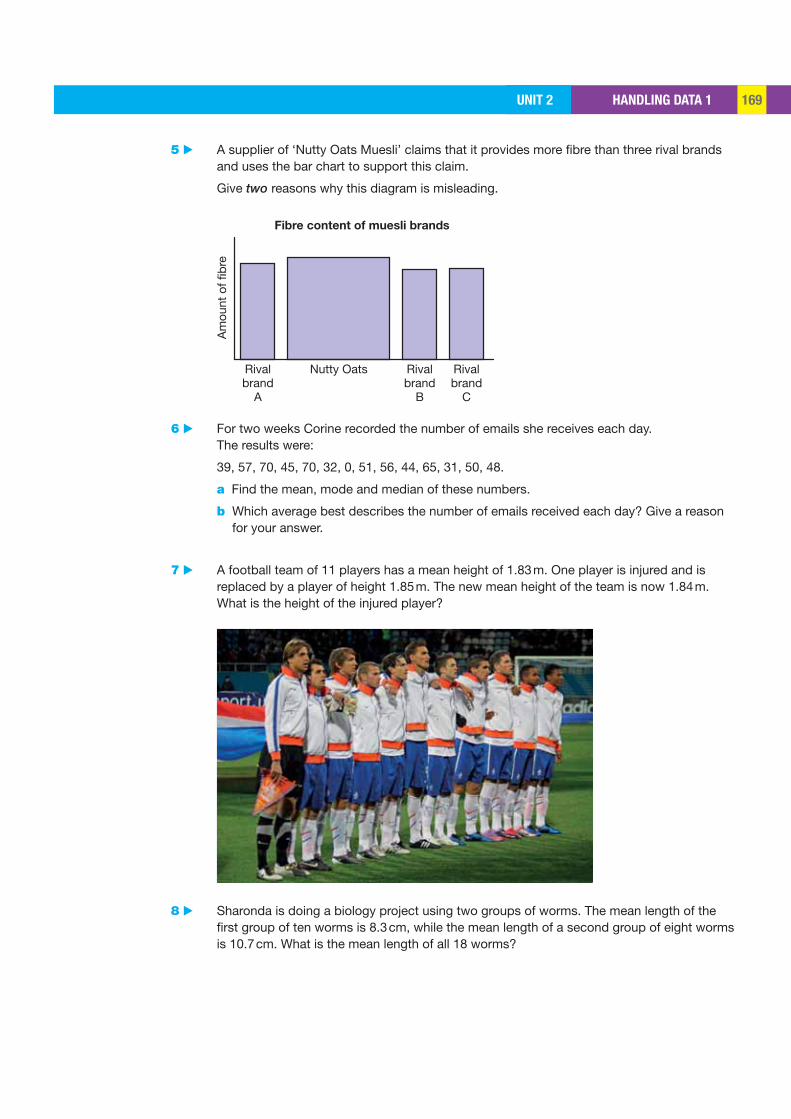
HANDLING DATA 1UNIT 2 169
Fibre content of muesli brandsA
mou
nt o
f fibr
e
Rivalbrand
A
Nutty Oats Rivalbrand
B
Rivalbrand
C
5 ▶ A supplier of ‘Nutty Oats Muesli’ claims that it provides more fibre than three rival brands and uses the bar chart to support this claim.
Give two reasons why this diagram is misleading.
6 ▶ For two weeks Corine recorded the number of emails she receives each day. The results were:
39, 57, 70, 45, 70, 32, 0, 51, 56, 44, 65, 31, 50, 48.
a Find the mean, mode and median of these numbers.
b Which average best describes the number of emails received each day? Give a reason for your answer.
7 ▶ A football team of 11 players has a mean height of 1.83 m. One player is injured and is replaced by a player of height 1.85 m. The new mean height of the team is now 1.84 m. What is the height of the injured player?
8 ▶ Sharonda is doing a biology project using two groups of worms. The mean length of the first group of ten worms is 8.3 cm, while the mean length of a second group of eight worms is 10.7 cm. What is the mean length of all 18 worms?

EXAM PRACTICE UNIT 2170
1 2
3
Banana
120˚
Singsong 4
Pokia
Hony 9
135˚ 100
137
52
0
200
Walk
Travel to school
Method of transport
Num
ber
of s
tude
nts
Cycle Walk andcycle
The table shows the numbers of gold, silver and bronze medals won by a team in two following years.
MEDAL GOLD SILVER BRONZE
YEAR 1 15 17 15
YEAR 2 29 17 19
a Draw a comparative bar chart to illustrate this data.b Comment on the difference between the two years. [5]
EXAM PRACTICE: HANDLING DATA 1
The pie chart shows the numbers of different phones in a class of students.
a How many Banana phones were there?b What should the angle of the sector
representing Singsong phones be? [3]
Students in Year 11 were asked whether they walk or cycle, or walk and cycle to school. The bar chart shows some of the results. All 203 Year 11 students took part in the survey.
How many both walk and cycle to school? [2]
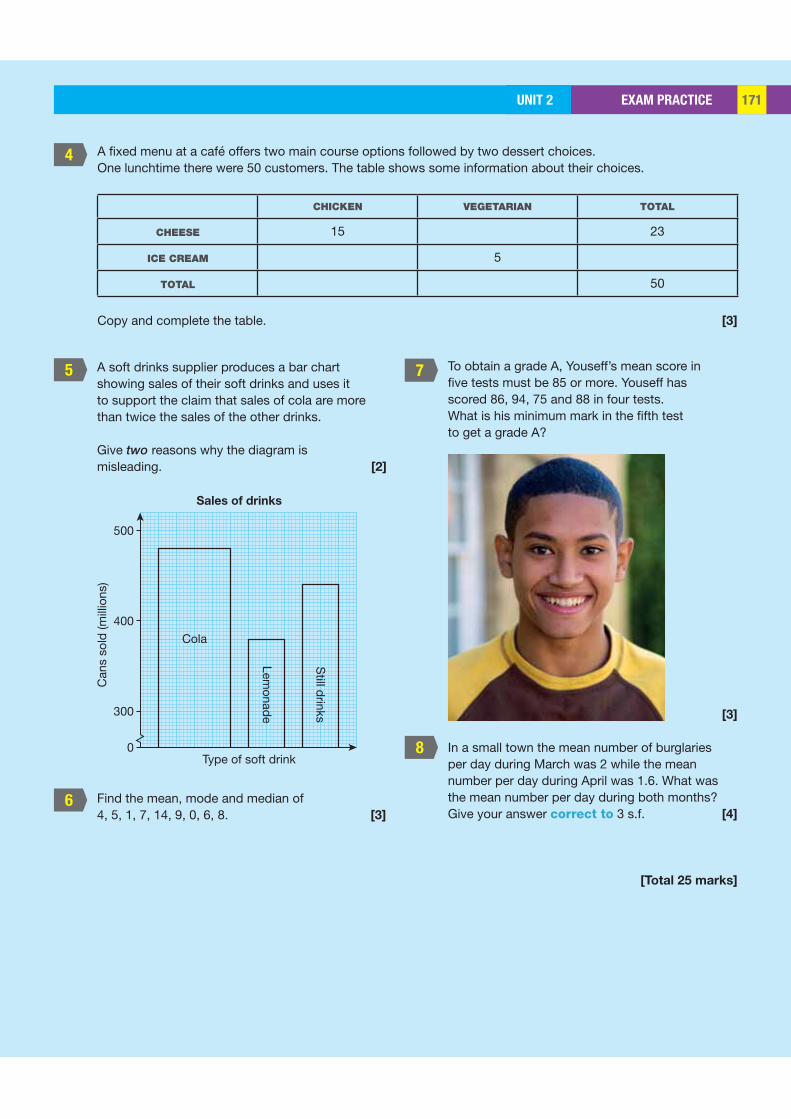
EXAM PRACTICEUNIT 2 171
5
6
7
8
4
0
500
Can
s so
ld (m
illio
ns)
300
400
Type of soft drink
Sales of drinks
Cola
Lemonade
Still drinks
A soft drinks supplier produces a bar chart showing sales of their soft drinks and uses it to support the claim that sales of cola are more than twice the sales of the other drinks.
Give two reasons why the diagram is misleading. [2]
Find the mean, mode and median of 4, 5, 1, 7, 14, 9, 0, 6, 8. [3]
To obtain a grade A, Youseff’s mean score in five tests must be 85 or more. Youseff has scored 86, 94, 75 and 88 in four tests. What is his minimum mark in the fifth test to get a grade A?
[3]
In a small town the mean number of burglaries per day during March was 2 while the mean number per day during April was 1.6. What was the mean number per day during both months? Give your answer correct to 3 s.f. [4]
[Total 25 marks]
A fixed menu at a café offers two main course options followed by two dessert choices.One lunchtime there were 50 customers. The table shows some information about their choices.
CHICKEN VEGETARIAN TOTAL
CHEESE 15 23
ICE CREAM 5
TOTAL 50
Copy and complete the table. [3]
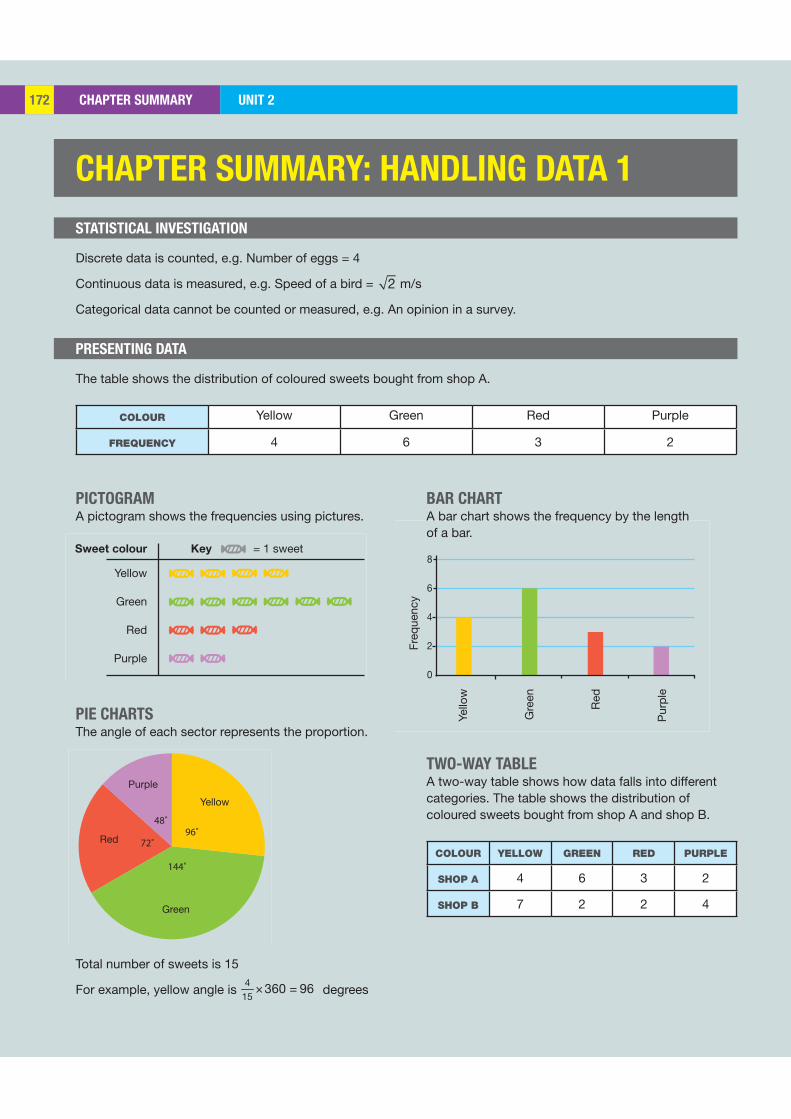
CHAPTER SUMMARY UNIT 2172
Purple
48˚
Red
Green
72˚
144˚
96˚
Yellow
Yellow
Green
Red
Purple
Sweet colour Key = 1 sweet
Yello
w
Gre
en
Red
Pur
ple
8
6
4
2
0
Freq
uenc
y
CHAPTER SUMMARY: HANDLING DATA 1
STATISTICAL INVESTIGATION
PRESENTING DATA
Discrete data is counted, e.g. Number of eggs = 4
Continuous data is measured, e.g. Speed of a bird = 2 m/s
Categorical data cannot be counted or measured, e.g. An opinion in a survey.
The table shows the distribution of coloured sweets bought from shop A.
COLOUR Yellow Green Red Purple
FREQUENCY 4 6 3 2
PICTOGRAM A pictogram shows the frequencies using pictures.
PIE CHARTSThe angle of each sector represents the proportion.
Total number of sweets is 15
For example, yellow angle is × =415
360 96 degrees
BAR CHARTA bar chart shows the frequency by the length of a bar.
TWO-WAY TABLE A two-way table shows how data falls into different categories. The table shows the distribution of coloured sweets bought from shop A and shop B.
COLOUR YELLOW GREEN RED PURPLE
SHOP A 4 6 3 2
SHOP B 7 2 2 4
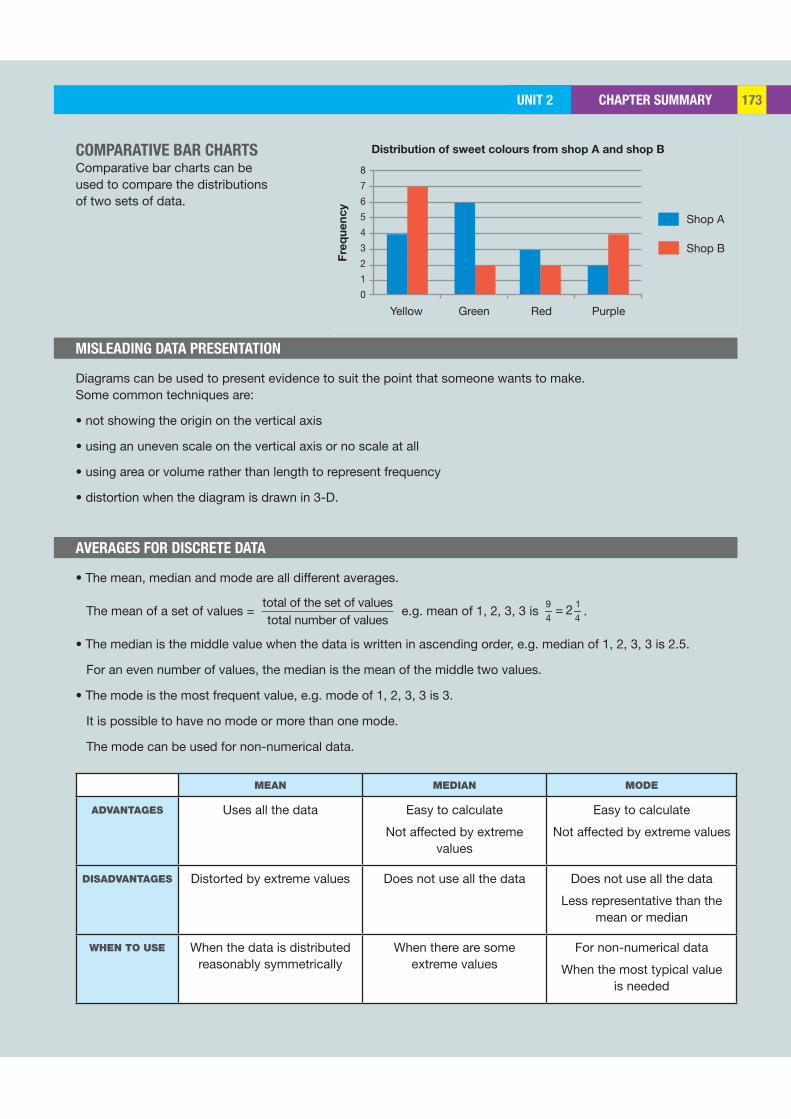
CHAPTER SUMMARYUNIT 2 173
Yellow
8
7
6
5
4
3
2
1
0
Distribution of sweet colours from shop A and shop B
Green Red Purple
Fre
qu
en
cy
Shop A
Shop B
MISLEADING DATA PRESENTATION
AVERAGES FOR DISCRETE DATA
Diagrams can be used to present evidence to suit the point that someone wants to make. Some common techniques are:
• not showing the origin on the vertical axis
• using an uneven scale on the vertical axis or no scale at all
• using area or volume rather than length to represent frequency
• distortion when the diagram is drawn in 3-D.
• The mean, median and mode are all different averages.
The mean of a set of values =
total of the set of valuestotal number of values
e.g. mean of 1, 2, 3, 3 is =9 14 4
2 .
• The median is the middle value when the data is written in ascending order, e.g. median of 1, 2, 3, 3 is 2.5.
For an even number of values, the median is the mean of the middle two values.
• The mode is the most frequent value, e.g. mode of 1, 2, 3, 3 is 3.
It is possible to have no mode or more than one mode.
The mode can be used for non-numerical data.
MEAN MEDIAN MODE
ADVANTAGES Uses all the data Easy to calculate
Not affected by extreme values
Easy to calculate
Not affected by extreme values
DISADVANTAGES Distorted by extreme values Does not use all the data Does not use all the data
Less representative than the mean or median
WHEN TO USE When the data is distributed reasonably symmetrically
When there are some extreme values
For non-numerical data
When the most typical value is needed
COMPARATIVE BAR CHARTSComparative bar charts can be used to compare the distributions of two sets of data.
UNIT 3 NUMBER 175 ALGEBRA 185 GRAPHS 201 SHAPE AND SPACE 213 HANDLING DATA 224
3 is the only prime number that is one less than a perfect square number. A number is divisible by 3 when the sum of all its digits can be divided by 3. It is the first number of one of the most famous mathematical ratios, which is 3.141…
An octopus has 3 hearts!
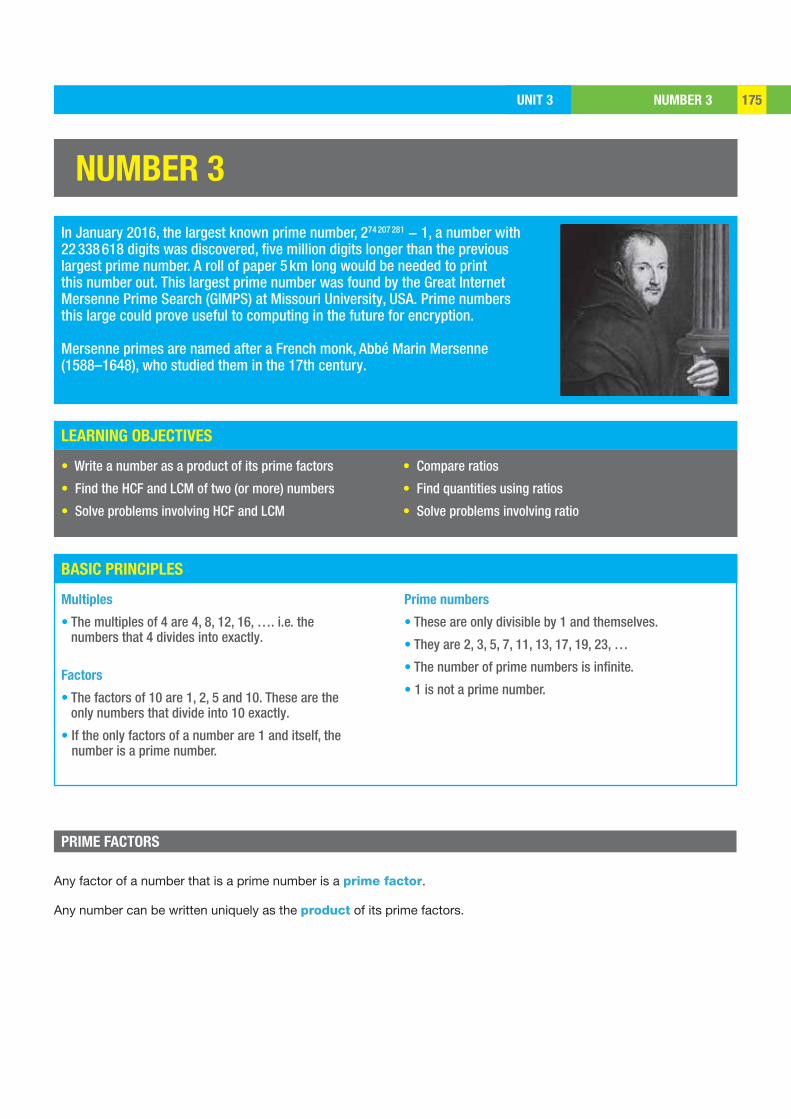
NUMBER 3UNIT 3 175
LEARNING OBJECTIVES
BASIC PRINCIPLES
NUMBER 3
In January 2016, the largest known prime number, 274 207 281 − 1, a number with 22 338 618 digits was discovered, five million digits longer than the previous largest prime number. A roll of paper 5 km long would be needed to print this number out. This largest prime number was found by the Great Internet Mersenne Prime Search (GIMPS) at Missouri University, USA. Prime numbers this large could prove useful to computing in the future for encryption.
Mersenne primes are named after a French monk, Abbé Marin Mersenne (1588–1648), who studied them in the 17th century.
• Write a number as a product of its prime factors
• Find the HCF and LCM of two (or more) numbers
• Solve problems involving HCF and LCM
• Compare ratios
• Find quantities using ratios
• Solve problems involving ratio
PRIME FACTORS
Multiples
• The multiples of 4 are 4, 8, 12, 16, …. i.e. the numbers that 4 divides into exactly.
Factors
• The factors of 10 are 1, 2, 5 and 10. These are the only numbers that divide into 10 exactly.
• If the only factors of a number are 1 and itself, the number is a prime number.
Prime numbers
• These are only divisible by 1 and themselves.
• They are 2, 3, 5, 7, 11, 13, 17, 19, 23, …
• The number of prime numbers is infinite.
• 1 is not a prime number.
Any factor of a number that is a prime number is a prime factor.
Any number can be written uniquely as the product of its prime factors.
NUMBER 3 UNIT 3176
EXAMPLE 1
KEY POINTS
EXERCISE 1
2
7
SKILL: ANALYSIS
Express 72 as a product of prime factors.
Keep dividing repeatedly by prime numbers or use your knowledge of the multiplication tables.
72 = 2 × 36
= 2 × 2 × 18
= 2 × 2 × 2 × 9
= 2 × 2 × 2 × 3 × 3
= 23 × 32
72 = 8 × 9
= 23 × 32
2 72
2 36
2 18
3 9
3 3
1
⇒ 72 = 23 × 32
• Prime factors are factors that are prime numbers.
• Divide a number repeatedly by prime numbers to find the prime factors.
• The product of the prime factors is written in index form.
• There is only one way of expressing a number as a product of prime factors.
List the first five multiples of these numbers.
1 ▶ 7 2 ▶ 6
List all the factors of these numbers.
3 ▶ 12 4 ▶ 18 5 ▶ 30
Express each number as a product of prime factors.
6 ▶ 28 7 ▶ 70 8 ▶ 60 9 ▶ 96
10 ▶ The number 48 can be written in the form 2n × 3. Find the value of n.
11 ▶ a Express 252 as a product of its prime factors. b Express 6 × 252 as a product of prime factors.
12 ▶ Hakim is making a mosaic from square tiles. The area he needs to fill measures 150 mm by 180 mm. The tiles have side lengths of 4, 6 or 8 mm and are too small to cut. Which tiles should Hakim use?
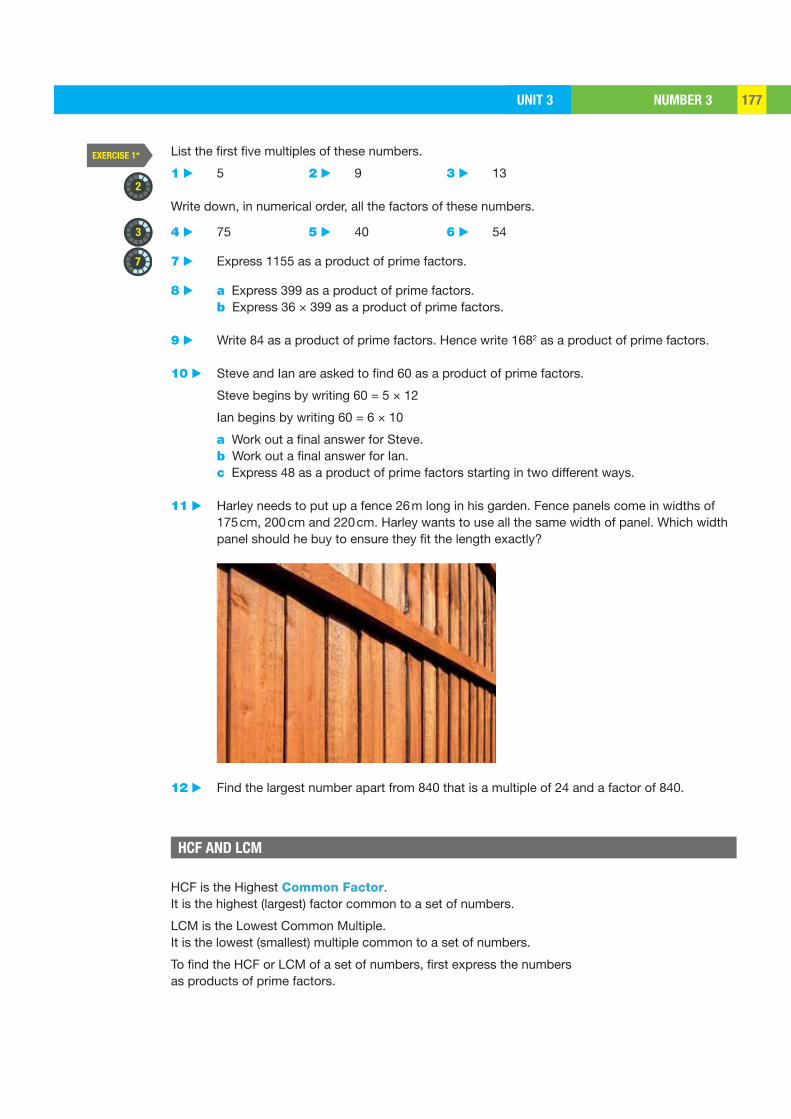
NUMBER 3UNIT 3 177
EXERCISE 1*
2
3
7
List the first five multiples of these numbers.
1 ▶ 5 2 ▶ 9 3 ▶ 13
Write down, in numerical order, all the factors of these numbers.
4 ▶ 75 5 ▶ 40 6 ▶ 54
7 ▶ Express 1155 as a product of prime factors.
8 ▶ a Express 399 as a product of prime factors. b Express 36 × 399 as a product of prime factors.
9 ▶ Write 84 as a product of prime factors. Hence write 1682 as a product of prime factors.
10 ▶ Steve and Ian are asked to find 60 as a product of prime factors.
Steve begins by writing 60 = 5 × 12
Ian begins by writing 60 = 6 × 10
a Work out a final answer for Steve. b Work out a final answer for Ian. c Express 48 as a product of prime factors starting in two different ways.
11 ▶ Harley needs to put up a fence 26 m long in his garden. Fence panels come in widths of 175 cm, 200 cm and 220 cm. Harley wants to use all the same width of panel. Which width panel should he buy to ensure they fit the length exactly?
12 ▶ Find the largest number apart from 840 that is a multiple of 24 and a factor of 840.
HCF AND LCM
HCF is the Highest Common Factor. It is the highest (largest) factor common to a set of numbers.
LCM is the Lowest Common Multiple. It is the lowest (smallest) multiple common to a set of numbers.
To find the HCF or LCM of a set of numbers, first express the numbers as products of prime factors.
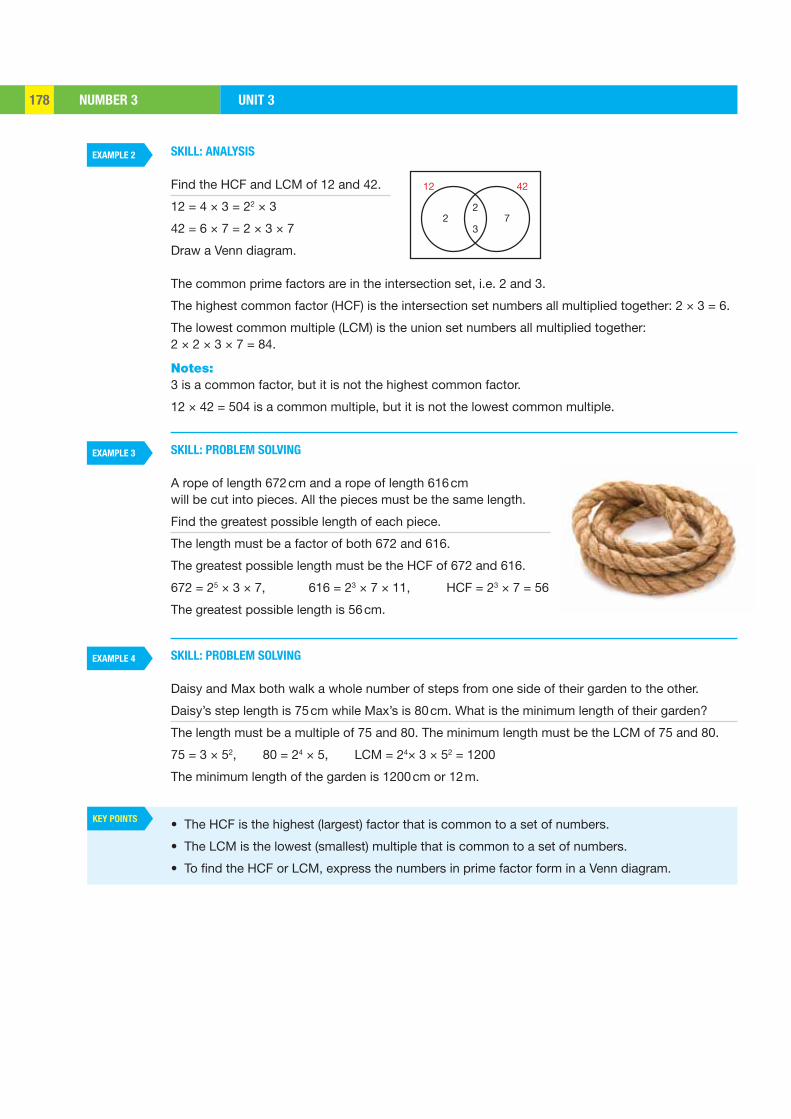
NUMBER 3 UNIT 3178
EXAMPLE 2
EXAMPLE 3
EXAMPLE 4
KEY POINTS
23
72
12 42
SKILL: ANALYSIS
Find the HCF and LCM of 12 and 42.
12 = 4 × 3 = 22 × 3
42 = 6 × 7 = 2 × 3 × 7
Draw a Venn diagram.
The common prime factors are in the intersection set, i.e. 2 and 3.
The highest common factor (HCF) is the intersection set numbers all multiplied together: 2 × 3 = 6.
The lowest common multiple (LCM) is the union set numbers all multiplied together: 2 × 2 × 3 × 7 = 84.
Notes:3 is a common factor, but it is not the highest common factor.
12 × 42 = 504 is a common multiple, but it is not the lowest common multiple.
SKILL: PROBLEM SOLVING
A rope of length 672 cm and a rope of length 616 cm will be cut into pieces. All the pieces must be the same length.
Find the greatest possible length of each piece.
The length must be a factor of both 672 and 616.
The greatest possible length must be the HCF of 672 and 616.
672 = 25 × 3 × 7, 616 = 23 × 7 × 11, HCF = 23 × 7 = 56
The greatest possible length is 56 cm.
SKILL: PROBLEM SOLVING
Daisy and Max both walk a whole number of steps from one side of their garden to the other.
Daisy’s step length is 75 cm while Max’s is 80 cm. What is the minimum length of their garden?
The length must be a multiple of 75 and 80. The minimum length must be the LCM of 75 and 80.
75 = 3 × 52, 80 = 24 × 5, LCM = 24× 3 × 52 = 1200
The minimum length of the garden is 1200 cm or 12 m.
• The HCF is the highest (largest) factor that is common to a set of numbers.
• The LCM is the lowest (smallest) multiple that is common to a set of numbers.
• To find the HCF or LCM, express the numbers in prime factor form in a Venn diagram.
NUMBER 3UNIT 3 179
EXERCISE 2
EXERCISE 2*
6
8
7
7
8
You may find it helpful to draw a Venn diagram for these questions.
Find the highest common factor of these numbers.
1 ▶ 6 and 8 2 ▶ 20 and 35 3 ▶ 22 and 44
Find the lowest common multiple of these numbers.
4 ▶ 2 and 3 5 ▶ 5 and 6 6 ▶ 6 and 15
7 ▶ Mahtab is filling bags with sweets. She has 18 chocolates and 27 mints. Each bag must contain the same mix of sweets and there must be no sweets left over. What is the greatest number of bags she can fill and what will be in each bag?
8 ▶ Tours at an ancient palace start at 9am. The palace tours leave every 45 minutes and the palace and garden tours leave every 75 minutes. When do both tours next leave at the same time?
Find the highest common factor of these.
9 ▶ 2x and 4xy 10 ▶ 12y2 and 8xy2
Find the lowest common multiple of these.
11 ▶ 2a and 3b 12 ▶ 4y and 3x
Find the HCF and LCM of these.
1 ▶ 12 and 18
2 ▶ 30 and 105
3 ▶ 3xy and 2yz
9 ▶ Two numbers have an HCF of 84 and an LCM of 4620. Both numbers are larger than the HCF. Find the two numbers.
10 ▶ A new school is deciding whether their lessons should be 30, 50 or 60 minutes long.
Each lesson duration fits exactly into the total teaching time of each school day. a How long is the total teaching time of each school day? b Could there be more than one answer? Give a reason for your answer.
11 ▶ Tom and Harry are racing go-carts. Tom takes 2 minutes 8 seconds to complete a lap while Harry takes 2 minutes to complete a lap. They both start from the start line at the same time. When will they next cross the start line together?
12 ▶ Fatima is preparing food parcels to give to charity. She has 252 tins of beans, 168 chocolate bars and 294 packets of soup. Each food parcel must contain the same, and there must be nothing left over. What is the greatest number of parcels she can prepare, and what will be in each parcel?
4 ▶ 4xy and 6xy
5 ▶ x2y and xyz
6 ▶ x3y and xy4
7 ▶ 6x2yz and 9xy2z2
8 ▶ 504, 240 and 540
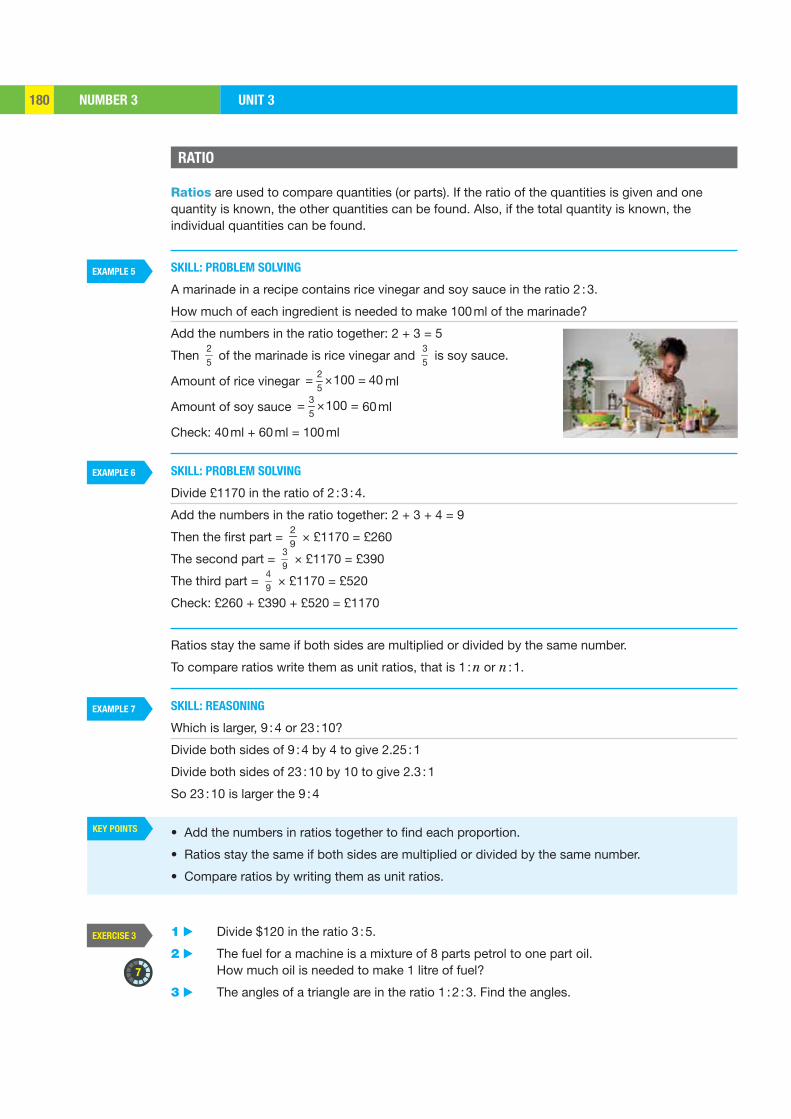
NUMBER 3 UNIT 3180
EXAMPLE 5
EXAMPLE 6
EXAMPLE 7
KEY POINTS
EXERCISE 3
7
RATIO
Ratios are used to compare quantities (or parts). If the ratio of the quantities is given and one quantity is known, the other quantities can be found. Also, if the total quantity is known, the individual quantities can be found.
SKILL: PROBLEM SOLVING
A marinade in a recipe contains rice vinegar and soy sauce in the ratio 2 : 3.
How much of each ingredient is needed to make 100 ml of the marinade?
Add the numbers in the ratio together: 2 + 3 = 5
Then 25
of the marinade is rice vinegar and 35
is soy sauce.
Amount of rice vinegar = × =25
100 40 ml
Amount of soy sauce = × =35
100 60 ml
Check: 40 ml + 60 ml = 100 ml
SKILL: PROBLEM SOLVING
Divide £1170 in the ratio of 2 : 3 : 4.
Add the numbers in the ratio together: 2 + 3 + 4 = 9
Then the first part = 29
× £1170 = £260
The second part = 39
× £1170 = £390
The third part = 49
× £1170 = £520
Check: £260 + £390 + £520 = £1170
Ratios stay the same if both sides are multiplied or divided by the same number.
To compare ratios write them as unit ratios, that is 1 : n or n : 1.
SKILL: REASONING
Which is larger, 9 : 4 or 23 : 10?
Divide both sides of 9 : 4 by 4 to give 2.25 : 1
Divide both sides of 23 : 10 by 10 to give 2.3 : 1
So 23 : 10 is larger the 9 : 4
• Add the numbers in ratios together to find each proportion.
• Ratios stay the same if both sides are multiplied or divided by the same number.
• Compare ratios by writing them as unit ratios.
1 ▶ Divide $120 in the ratio 3 : 5.
2 ▶ The fuel for a machine is a mixture of 8 parts petrol to one part oil. How much oil is needed to make 1 litre of fuel?
3 ▶ The angles of a triangle are in the ratio 1 : 2 : 3. Find the angles.
NUMBER 3UNIT 3 181
EXERCISE 3*
7
4 ▶ Mr Chan has three daughters, An, Lien and Tao, aged 7, 8 and 10 years respectively. He shares $100 between them in the ratio of their ages. How much does Lien receive?
5 ▶ In a school there are 52 teachers and 598 students.
a Write the student : teacher ratio in the form n : 1.
Another school has 85 teachers and 1020 students.
b Which school has the larger number of teachers per student?
6 ▶ Julie and Hammad each make a glass of orange drink. Julie uses 42 ml of juice and 210 ml of lemonade. Hammad uses 30 ml of juice and 170 ml of lemonade. Who has made their drink stronger in taste?
7 ▶ Archie and Bijan share some money in the ratio 7 : 11. Bijan gets £132. How much money does Archie get?
8 ▶ To make a tough adhesive, Paul mixes 5 parts of resin with 2 parts of hardener.
a Write down the ratio of resin to hardener.
b To fix a chair, Paul uses 9 g of hardener. How many grams of resin does he use?
c On another project, Paul used 12 g of resin. How much hardener did he use?
1 ▶ Divide €350 in the ratio 1 : 6.
2 ▶ A type of cat food contains chicken bones and chicken pieces in the ratio 20 : 7. What weight of chicken pieces is needed to make 2 kg of cat food?
3 ▶ Divide 576 tonnes in the ratio 4 : 3 : 2.
4 ▶ A breakfast cereal contains the vitamins thiamin, riboflavin and niacin in the ratio 2 : 3 : 25. A bowl of cereal contains 10 mg of these vitamins. Calculate the amount of riboflavin in a bowl of cereal.
5 ▶ On Saturday at 12pm, there were 45 staff members and 375 customers in a department store.
a Write the customer : staff ratio in the form n : 1.
Another department store has 70 staff members and 637 customers at the same time.
b Which store had more customers per staff member?
6 ▶ Cheryl and Jon both make hair dye by mixing hair colourant with peroxide. Cheryl uses 750 ml of colourant and 450 ml of peroxide. Jon uses 850 ml of colourant and 650 ml of peroxide.
Who has the greater concentration of peroxide in their hair dye?
7 ▶ Jackie and Alan share the profits of their business in the ratio of the amounts they invested. Jackie invested £170 and Alan invested £150. Alan gets £18 000. How much money does Jackie get?
8 ▶ To make concrete, Ali mixes 2 parts of cement with 5 parts of sand.
a Write down the ratio of sand to cement. b To lay the foundations for an extension, Ali uses 60 kg of sand.
How many kilograms of cement does she use? c On another project, Ali used 75 kg of cement. How much sand did she use?
NUMBER 3 UNIT 3182
EXERCISE 4
EXERCISE 4*
7
7
8
REVISION
1 ▶ Express 756 as a product of its prime factors.
2 ▶ Find the HCF and LCM of 18 and 24.
3 ▶ Bella wants to tile a wall measuring 1.2 m by 2.16 m. She finds square tiles she likes with side lengths of 10 cm, 12 cm or 18 cm. Which of these tiles will fit the wall exactly?
4 ▶ Meha is buying some batteries. The shop sells D-type batteries in packs of 6 and AA-type batteries in packs of 15. Meha wishes to buy the same number of D and AA batteries. What is the smallest number of each battery type that she can buy?
5 ▶ A ribbon of length 336 cm and a ribbon of length 504 cm will be cut into pieces. All the pieces must be the same length. Find the greatest possible length of each piece.
6 ▶ Jana splits £350 between her two nieces in the ratio of their ages. Carlotta is 16 and Hannah is 12.
a What fraction does Carlotta get? b What fraction does Hannah get? c How much money does each niece get?
7 ▶ In a school, the ratio of the number of students to the number of computers is 1 : 35
.
There are 210 computers in the school. How many students are there?
REVISION
1 ▶ Express 1008 as a product of its prime factors.
2 ▶ Find the HCF and LCM of 30, 36 and 48.
3 ▶ Two numbers have an LCM of 432 and an HCF of 72. Both numbers are larger than the HCF. Find the two numbers.
4 ▶ Three lighthouses flash their lights at different intervals. One flashes every 15 seconds, one every 20 seconds and one every 45 seconds. They have just all flashed their lights at the same time. How long before the next time all three lighthouses flash their lights at the same time?
5 ▶ Erin has 75 pink roses, 105 yellow roses and 45 white roses. She needs to make identical flower arrangements for a wedding and there must be no flowers left at the end. What is the greatest number of arrangements Erin can make, and what will be in each arrangement?
6 ▶ Jude wants to make lilac paint. She is going to mix red paint, blue paint and white paint in the ratios 0.8 : 1.5 : 5.7. Copy and complete the table to show how much of each colour Jude needs to make the paint quantities shown.
SIZE BLUE RED WHITE
1 litre
2.5 litres
7 ▶ A scale model (a small model representation of a larger thing) of Tower Bridge in London is 22 cm high. The real bridge is 66 m high.
a Work out the scale of the model. Write it as a ratio of real height to model height.
The bridge is 243 m long in real life.
b How long is the model?
EXAM PRACTICEUNIT 3 183UNIT 3 183
1
2
3
4
5
6
EXAM PRACTICE: NUMBER 3
Express 1050 as a product of its prime factors. [4]
Find the HCF and LCM of 36 and 126. [4]
Two classes are given regular tests by their teachers Mr Hony and Mr Turner. Mr Hony’s tests always have 30 questions, and Mr Turner’s tests always have 24 questions. Both classes answer the same number of questions in a term.
a What is the smallest number of questions set in a term to make this possible?
b What is the smallest number of tests that Mr Hony’s class can take? [4]
Kavi needs to prepare some gift bags with identical contents. She has 168 chocolates and 252 balloons. No items can be left at the end. What is the greatest number of bags she can prepare? [4]
Ben, who is 42, his son Terry, who is 16, and his daughter Anne, who is 14, agree to share £540 in the ratio of their ages. How much does each person receive? [4]
Saru is making some lemonade. He finds using 42 ml of lemon juice and 210 ml of water makes a tasty drink.
a Find the ratio of lemon juice to water in its simplest form.
b Saru uses 8 litres of water to make some lemonade of the same strength. What volume of lemonade does he make? [5]
[Total 25 marks]
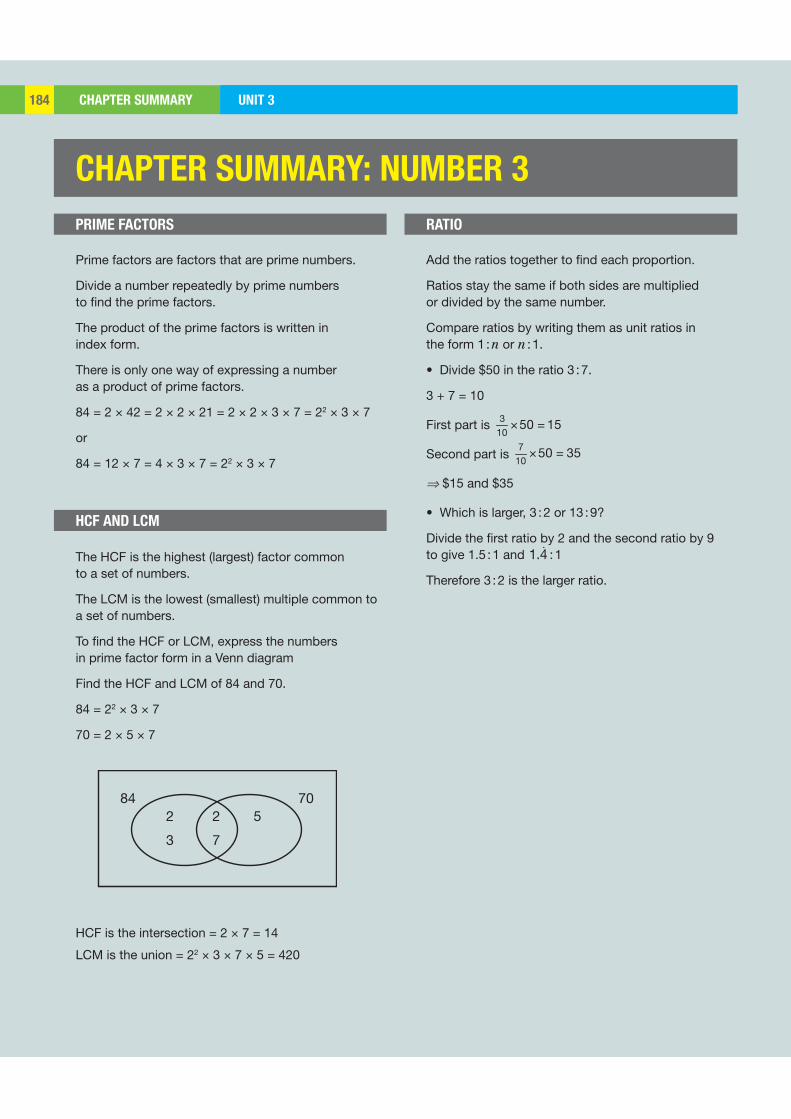
EXAM PRACTICE UNIT 3184 CHAPTER SUMMARY UNIT 3184 UNIT 3184
842 2 5
3 7
70
CHAPTER SUMMARY: NUMBER 3
PRIME FACTORS
Prime factors are factors that are prime numbers.
Divide a number repeatedly by prime numbers to find the prime factors.
The product of the prime factors is written in index form.
There is only one way of expressing a number as a product of prime factors.
84 = 2 × 42 = 2 × 2 × 21 = 2 × 2 × 3 × 7 = 22 × 3 × 7
or
84 = 12 × 7 = 4 × 3 × 7 = 22 × 3 × 7
The HCF is the highest (largest) factor common to a set of numbers.
The LCM is the lowest (smallest) multiple common to a set of numbers.
To find the HCF or LCM, express the numbers in prime factor form in a Venn diagram
Find the HCF and LCM of 84 and 70.
84 = 22 × 3 × 7
70 = 2 × 5 × 7
HCF is the intersection = 2 × 7 = 14
LCM is the union = 22 × 3 × 7 × 5 = 420
HCF AND LCM
RATIO
Add the ratios together to find each proportion.
Ratios stay the same if both sides are multiplied or divided by the same number.
Compare ratios by writing them as unit ratios in the form 1 : n or n : 1.
• Divide $50 in the ratio 3 : 7.
3 + 7 = 10
First part is × =310
50 15
Second part is × =710
50 35
⇒ $15 and $35
• Which is larger, 3 : 2 or 13 : 9?
Divide the first ratio by 2 and the second ratio by 9 to give 1.5 : 1 and 1.4 : 1
Therefore 3 : 2 is the larger ratio.
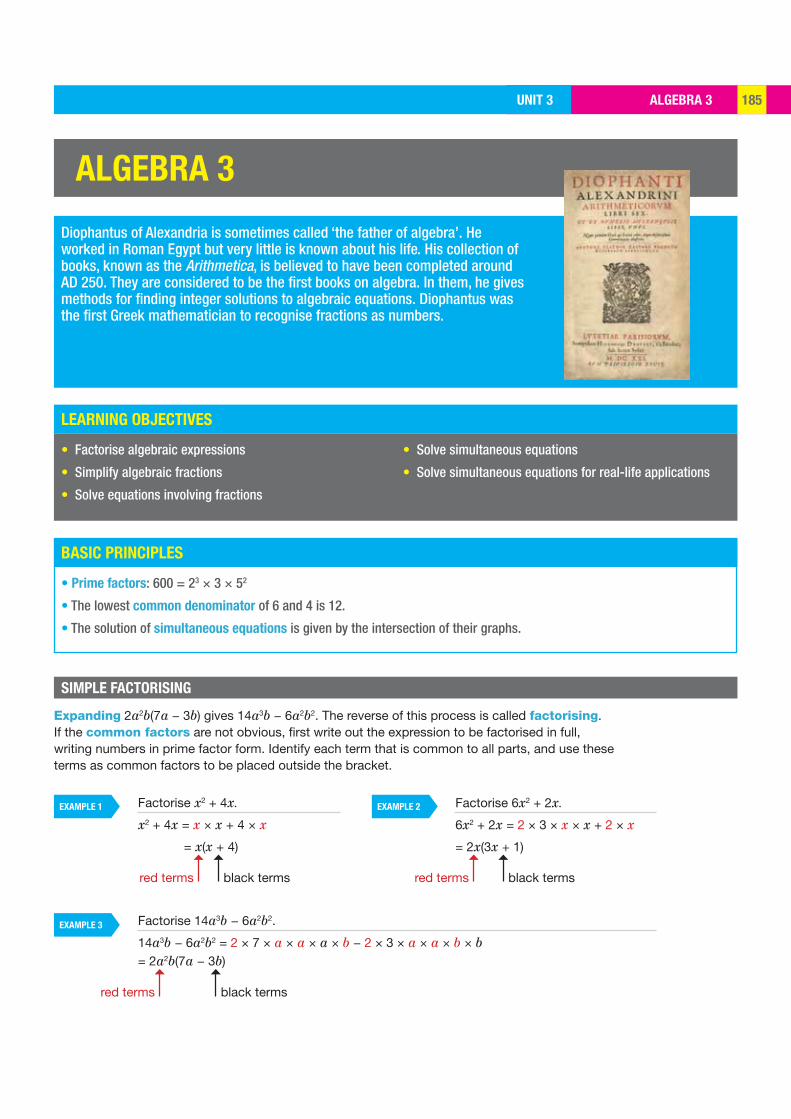
ALGEBRA 3UNIT 3 185
LEARNING OBJECTIVES
BASIC PRINCIPLES
EXAMPLE 1
EXAMPLE 3
EXAMPLE 2
ALGEBRA 3
Diophantus of Alexandria is sometimes called ‘the father of algebra’. He worked in Roman Egypt but very little is known about his life. His collection of books, known as the Arithmetica, is believed to have been completed around AD 250. They are considered to be the first books on algebra. In them, he gives methods for finding integer solutions to algebraic equations. Diophantus was the first Greek mathematician to recognise fractions as numbers.
• Factorise algebraic expressions
• Simplify algebraic fractions
• Solve equations involving fractions
• Solve simultaneous equations
• Solve simultaneous equations for real-life applications
SIMPLE FACTORISING
• Prime factors: 600 = 23 × 3 × 52
• The lowest common denominator of 6 and 4 is 12.
• The solution of simultaneous equations is given by the intersection of their graphs.
Factorise x2 + 4x.
x2 + 4x = x × x + 4 × x
= x(x + 4)
Factorise 14a3b − 6a2b2.
14a3b − 6a2b2 = 2 × 7 × a × a × a × b − 2 × 3 × a × a × b × b= 2a2b(7a − 3b)
Factorise 6x2 + 2x.
6x2 + 2x = 2 × 3 × x × x + 2 × x
= 2x(3x + 1)
red terms
red terms
red termsblack terms
black terms
black terms
Expanding 2a2b(7a − 3b) gives 14a3b − 6a2b2. The reverse of this process is called factorising.If the common factors are not obvious, first write out the expression to be factorised in full, writing numbers in prime factor form. Identify each term that is common to all parts, and use these terms as common factors to be placed outside the bracket.
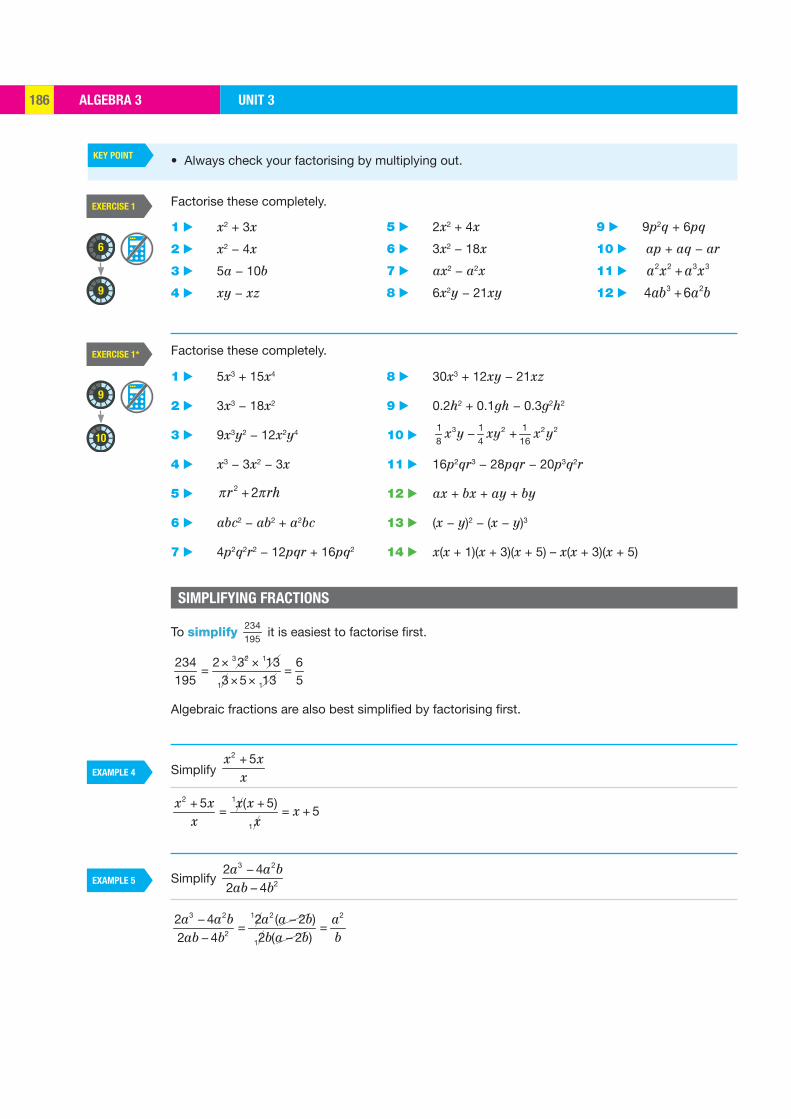
ALGEBRA 3 UNIT 3186
EXERCISE 1
EXERCISE 1*
EXAMPLE 4
EXAMPLE 5
KEY POINT
9
9
6
10
• Always check your factorising by multiplying out.
Factorise these completely.
1 ▶ x2 + 3x
2 ▶ x2 − 4x
3 ▶ 5a − 10b
4 ▶ xy − xz
5 ▶ 2x2 + 4x
6 ▶ 3x2 − 18x
7 ▶ ax2 − a2x
8 ▶ 6x2y − 21xy
9 ▶ 9p2q + 6pq
10 ▶ ap + aq − ar
11 ▶ a2x2 +a3x3
12 ▶ 4ab3 +6a2b
1 ▶ 5x3 + 15x4
2 ▶ 3x3 − 18x2
3 ▶ 9x3y2 − 12x2y4
4 ▶ x3 − 3x2 − 3x
5 ▶ r2 + 2 rh
6 ▶ abc2 − ab2 + a2bc
7 ▶ 4p2q2r2 − 12pqr + 16pq2
Factorise these completely.
8 ▶ 30x3 + 12xy − 21xz
9 ▶ 0.2h2 + 0.1gh − 0.3g2h2
10 ▶ − +3 2 2 2
8 41 1
161x y xy x y
11 ▶ 16p2qr3 − 28pqr − 20p3q2r
12 ▶ ax + bx + ay + by
13 ▶ (x − y)2 − (x − y)3
14 ▶ x(x + 1)(x + 3)(x + 5) – x(x + 3)(x + 5)
SIMPLIFYING FRACTIONS
To simplify 234195
it is easiest to factorise first.
× ×= =
× ×
3 2 1
1 1
234 2 3 13 6195 3 5 13 5
Algebraic fractions are also best simplified by factorising first.
Simplify +2 5x xx
+ += = +
2 1
1
5 ( 5)5
x x x xx
x x
Simplify −−
3 2
2
2 42 4a a bab b
− −= =
−−
3 2 1 2 2
21
2 4 2 ( 2 )2 ( 2 )2 4
a a b a a b ab a b bab b
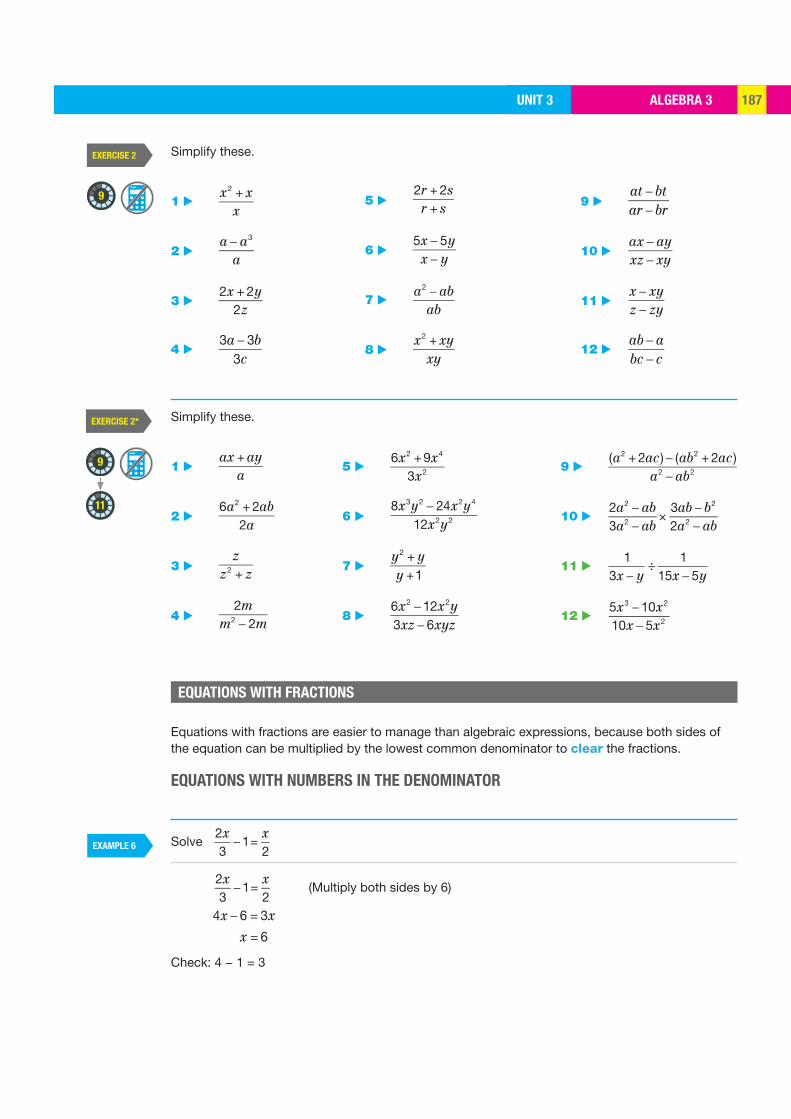
ALGEBRA 3UNIT 3 187
EXERCISE 2
EXERCISE 2*
EXAMPLE 6
9
9
11
EQUATIONS WITH FRACTIONS
Simplify these.
1 ▶ x2 + x
x
2 ▶ a a3
a
3 ▶ 2x + 2y
2z
4 ▶ 3a 3b
3c
5 ▶ 2r + 2sr + s
6 ▶ 5x 5yx y
7 ▶ a2 ab
ab
8 ▶ x2 + xy
xy
9 ▶ at btar br
10 ▶ ax ayxz xy
11 ▶ x xyz zy
12 ▶ ab abc c
Simplify these.
1 ▶ ax +ay
a
2 ▶ 6a2 + 2ab
2a
3 ▶ z
z2 + z
4 ▶ 2m
m2 2m
5 ▶ 6x2 +9x4
3x2
6 ▶ 8x3y2 24x2y4
12x2y2
7 ▶ y2 + yy +1
8 ▶ 6x2 12x2y3xz 6xyz
9 ▶ (a2 + 2ac ) (ab2 + 2ac )
a2 ab2
10 ▶ 2a2 ab3a2 ab
3ab b2
2a2 ab×
11 ▶ 1
3x y÷
115x 5y
12 ▶ 5x3 10x2
10x 5x2
Equations with fractions are easier to manage than algebraic expressions, because both sides of the equation can be multiplied by the lowest common denominator to clear the fractions.
EQUATIONS WITH NUMBERS IN THE DENOMINATOR
Solve 2x3
1=x2
2x3
1=x2
(Multiply both sides by 6)
4x 6 = 3x
Check: 4 − 1 = 3
x = 6

ALGEBRA 3 UNIT 3188
EXAMPLE 7
KEY POINT
EXERCISE 3
EXERCISE 3*
6
8
6
10
Solve − = −134 3
( 1) (2 1)x x
− = −134 3
( 1) (2 1)x x (Multiply both sides by 12)
9x 9 = 8x 4
Check: − = − =13
34
(5 1) (10 1) 3
• Clear the fractions by multiplying both sides by the lowest common denominator.
Solve these for x.
Solve these for x.
1 ▶ 3x4
= 6
2 ▶ x5
= 2
3 ▶ x4
=12
4 ▶ 3x8
= 0
1 ▶ 2x 3
5= 3
2 ▶ − =38
(5 3) 0x
3 ▶ x +1
5=
x + 36
5 ▶ 2x3
= 4
6 ▶ + =13
( 7) 4x
7 ▶ 3(x 10)
7= 6
8 ▶ x2
x3
= 1
4 ▶ x +1
73(x 2)
14= 1
5 ▶ 6 3x
35x +12
4= 1
6 ▶ 2(x +1)
53(x +1)
10= x
9 ▶ x2x7
= 10
10 ▶ + = −1 14 5
( 1) (8 )x x
11 ▶ 3 x
3=
2 + x2
12 ▶ x 7
715
5 x
7 ▶
2x 32
x 23
=76
8 ▶ 2x +1
4x =
3x +18
+1
9 ▶ 4x 2
2x
1 2x3
13 ▶ x2
+7 is three times x5
+ 2 . Find the value of x.
14 ▶ Ryan does one-third of his journey to school by car, and one-half by bus. Then he walks the final kilometre. How long is his journey to school?
10 ▶ − − + + − =1 1 132 4
(1 ) (2 ) (3 ) 1x x x
11 ▶ ⎛ ⎞+⎜ ⎟⎝ ⎠213
14x
is twice ⎛ ⎞+⎜ ⎟⎝ ⎠321
21x
. Find the value of x.
x = 5
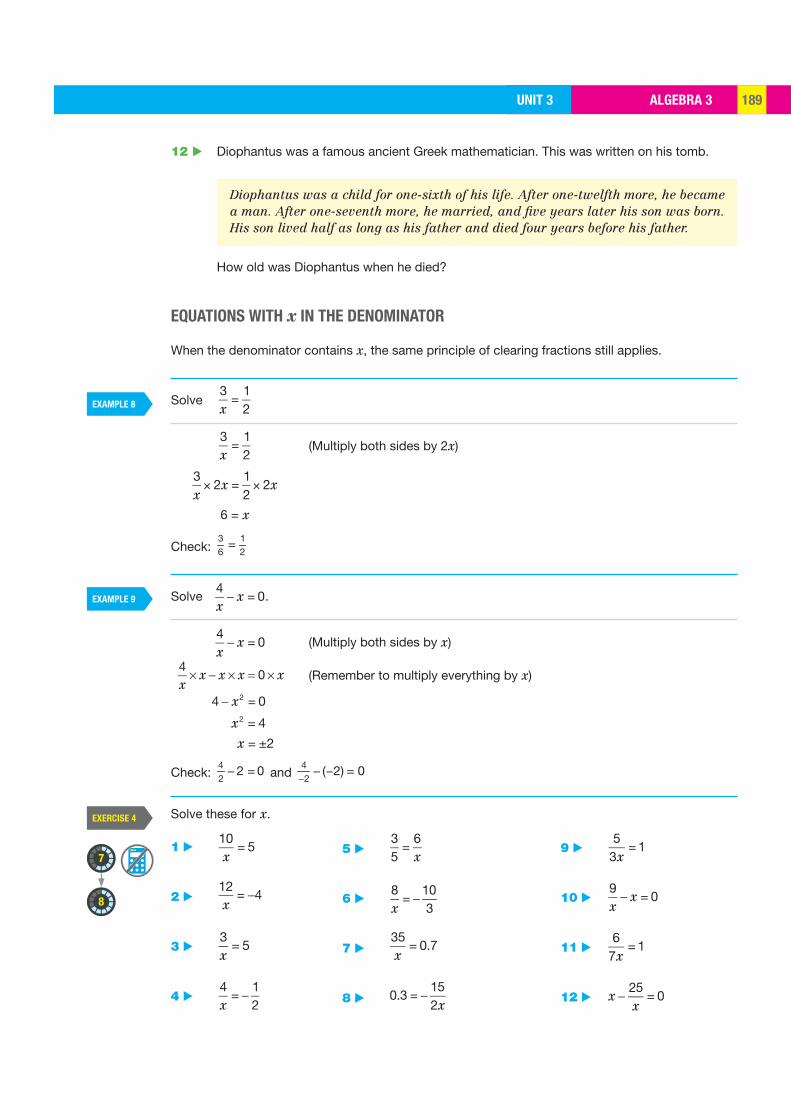
ALGEBRA 3UNIT 3 189
EXAMPLE 8
EXAMPLE 9
EXERCISE 4
8
7
Solve these for x.
1 ▶ 10x
= 5
2 ▶ 12x
= 4
3 ▶ 3x
= 5
4 ▶ 4x
=12
5 ▶ 35
=6x
6 ▶ 8x
=103
7 ▶ 35x
= 0.7
8 ▶ 0.3 =152x
9 ▶ 5
3x= 1
10 ▶ 9x
x = 0 11 ▶
67x
= 1
12 ▶ x25x
= 0
12 ▶ Diophantus was a famous ancient Greek mathematician. This was written on his tomb.
Diophantus was a child for one-sixth of his life. After one-twelfth more, he became a man. After one-seventh more, he married, and five years later his son was born. His son lived half as long as his father and died four years before his father.
How old was Diophantus when he died?
EQUATIONS WITH x IN THE DENOMINATOR
When the denominator contains x, the same principle of clearing fractions still applies.
Solve 3x
=12
3x
=12
(Multiply both sides by 2x)
3x
2x =12
2x× ×
Check: =36
12
Solve 4x
x = 0.
4x
x = 0 (Multiply both sides by x)
(Remember to multiply everything by x)
Check: − =42
2 0 and −− − =4
2( 2) 0
6 = x
x2 = 4
x = ±2
4 x2 = 0
4x
x x x 0 x
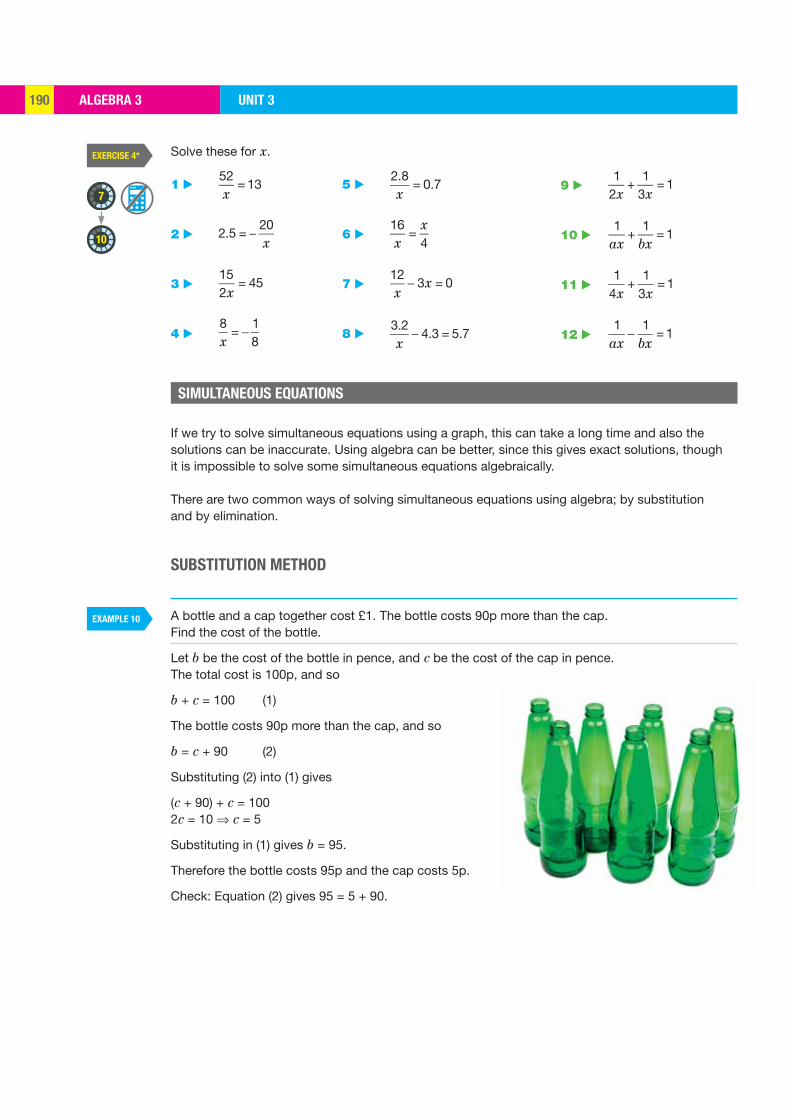
ALGEBRA 3 UNIT 3190
EXERCISE 4*
EXAMPLE 10
7
10
Solve these for x.
1 ▶ 52x
= 13
2 ▶ 2.5 =20x
3 ▶ 152x
= 45
4 ▶ 8x
=18
5 ▶ 2.8x
= 0.7
6 ▶ 16x
=x4
7 ▶ 12x
3x = 0
8 ▶ 3.2x
4.3 = 5.7
9 ▶ 1
2x+
13x
= 1
10 ▶ 1
ax+
1bx
= 1
11 ▶ 1
4x+
13x
= 1
12 ▶ 1
ax1
bx= 1
SIMULTANEOUS EQUATIONS
If we try to solve simultaneous equations using a graph, this can take a long time and also the solutions can be inaccurate. Using algebra can be better, since this gives exact solutions, though it is impossible to solve some simultaneous equations algebraically.
There are two common ways of solving simultaneous equations using algebra; by substitution and by elimination.
SUBSTITUTION METHOD
A bottle and a cap together cost £1. The bottle costs 90p more than the cap. Find the cost of the bottle.
Let b be the cost of the bottle in pence, and c be the cost of the cap in pence. The total cost is 100p, and so
b + c = 100 (1)
The bottle costs 90p more than the cap, and so
b = c + 90 (2)
Substituting (2) into (1) gives
(c + 90) + c = 1002c = 10 ⇒ c = 5
Substituting in (1) gives b = 95.
Therefore the bottle costs 95p and the cap costs 5p.
Check: Equation (2) gives 95 = 5 + 90.
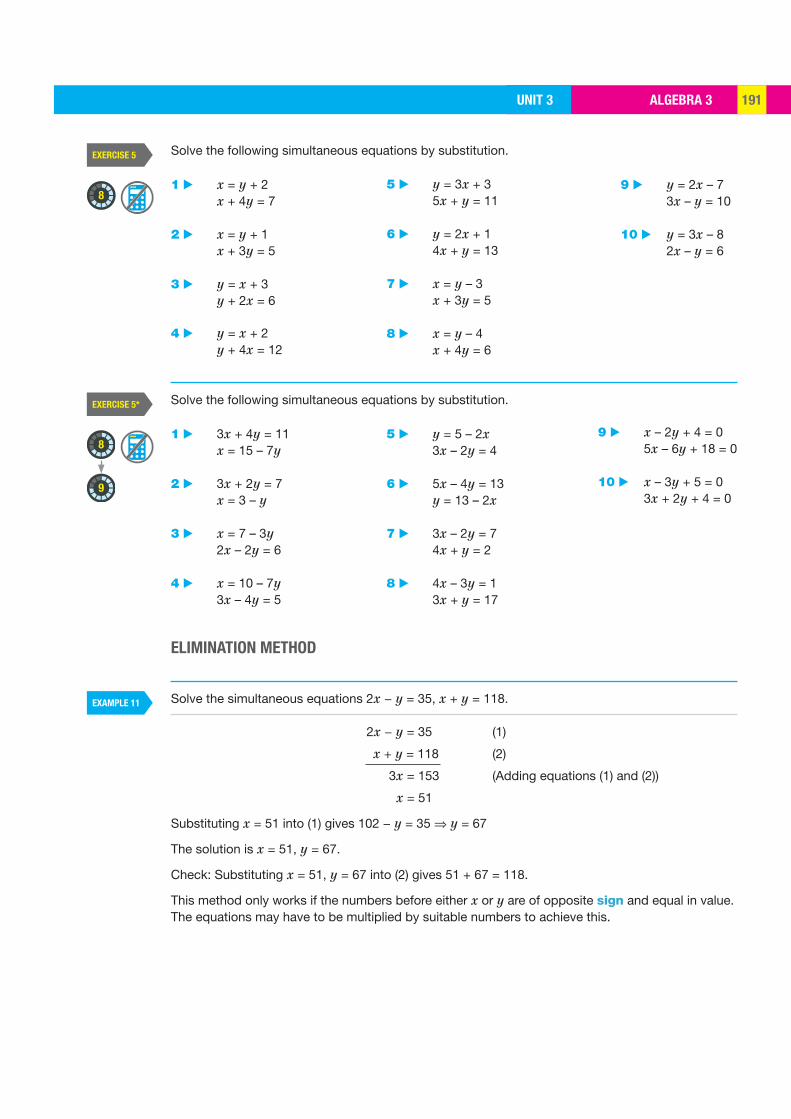
ALGEBRA 3UNIT 3 191
EXAMPLE 11
EXERCISE 5
EXERCISE 5*
8
8
9
1 ▶ x = y + 2 x + 4y = 7
2 ▶ x = y + 1 x + 3y = 5
3 ▶ y = x + 3
y + 2x = 6
4 ▶ y = x + 2 y + 4x = 12
1 ▶ 3x + 4y = 11 x = 15 – 7y
2 ▶ 3x + 2y = 7 x = 3 – y
3 ▶ x = 7 – 3y
2x – 2y = 6 4 ▶ x = 10 – 7y
3x – 4y = 5
5 ▶ y = 3x + 3 5x + y = 11
6 ▶ y = 2x + 1 4x + y = 13
7 ▶ x = y – 3 x + 3y = 5
8 ▶ x = y – 4 x + 4y = 6
5 ▶ y = 5 – 2x 3x – 2y = 4
6 ▶ 5x – 4y = 13 y = 13 – 2x
7 ▶ 3x – 2y = 7 4x + y = 2
8 ▶ 4x – 3y = 1 3x + y = 17
Solve the following simultaneous equations by substitution.
Solve the following simultaneous equations by substitution.
9 ▶ y = 2x – 7 3x – y = 10
10 ▶ y = 3x – 8 2x – y = 6
9 ▶ x – 2y + 4 = 0 5x – 6y + 18 = 0
10 ▶ x – 3y + 5 = 0 3x + 2y + 4 = 0
ELIMINATION METHOD
Solve the simultaneous equations 2x − y = 35, x + y = 118.
2x − y = 35 (1)
x + y = 118 (2)
3x = 153 (Adding equations (1) and (2))
x = 51
Substituting x = 51 into (1) gives 102 − y = 35 ⇒ y = 67
The solution is x = 51, y = 67.
Check: Substituting x = 51, y = 67 into (2) gives 51 + 67 = 118.
This method only works if the numbers before either x or y are of opposite sign and equal in value. The equations may have to be multiplied by suitable numbers to achieve this.
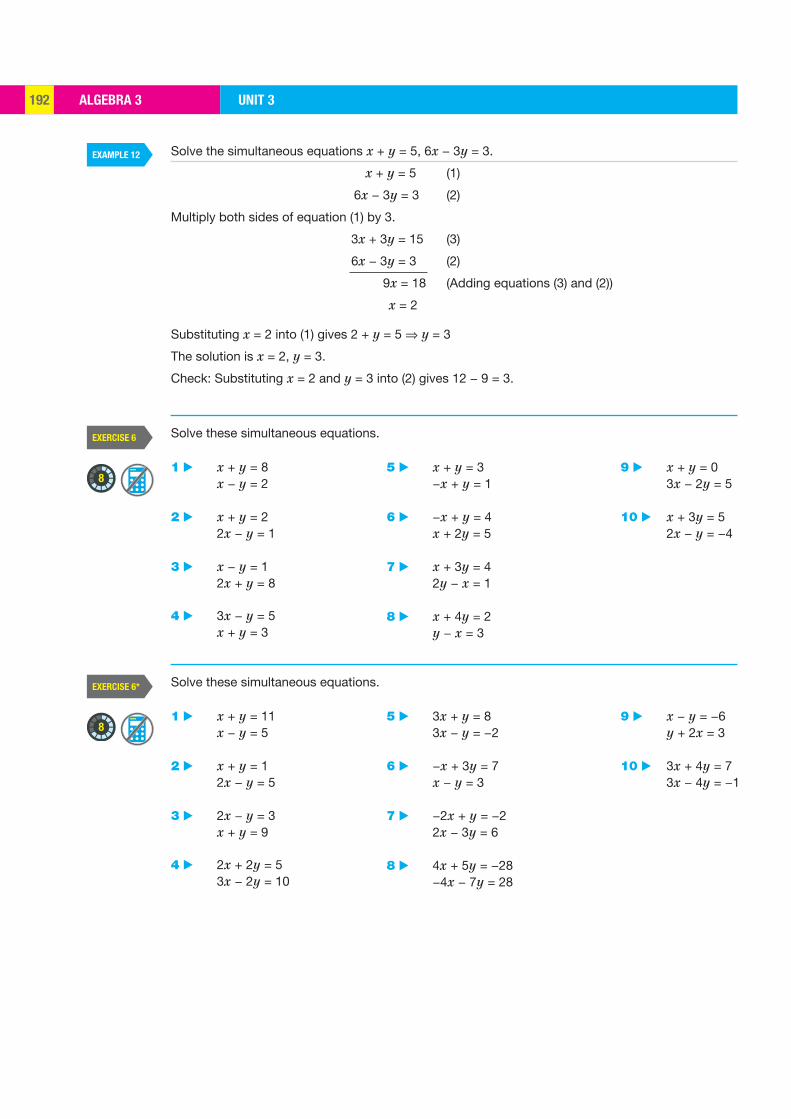
ALGEBRA 3 UNIT 3192
EXAMPLE 12
EXERCISE 6
EXERCISE 6*
8
8
Solve the simultaneous equations x + y = 5, 6x − 3y = 3.
x + y = 5 (1)
6x − 3y = 3 (2)
Multiply both sides of equation (1) by 3.
3x + 3y = 15 (3)
6x − 3y = 3 (2)
9x = 18 (Adding equations (3) and (2))
x = 2
Substituting x = 2 into (1) gives 2 + y = 5 ⇒ y = 3
The solution is x = 2, y = 3.
Check: Substituting x = 2 and y = 3 into (2) gives 12 − 9 = 3.
1 ▶ x + y = 8 x − y = 2
2 ▶ x + y = 2 2x − y = 1
3 ▶ x − y = 1
2x + y = 8
4 ▶ 3x − y = 5 x + y = 3
1 ▶ x + y = 11 x − y = 5
2 ▶ x + y = 1 2x − y = 5
3 ▶ 2x − y = 3
x + y = 9
4 ▶ 2x + 2y = 5 3x − 2y = 10
5 ▶ x + y = 3 −x + y = 1
6 ▶ −x + y = 4 x + 2y = 5
7 ▶ x + 3y = 4 2y − x = 1
8 ▶ x + 4y = 2 y − x = 3
5 ▶ 3x + y = 8 3x − y = −2
6 ▶ −x + 3y = 7 x − y = 3
7 ▶ −2x + y = −2 2x − 3y = 6
8 ▶ 4x + 5y = −28 −4x − 7y = 28
Solve these simultaneous equations.
Solve these simultaneous equations.
9 ▶ x + y = 0 3x − 2y = 5
10 ▶ x + 3y = 5 2x − y = −4
9 ▶ x − y = −6 y + 2x = 3
10 ▶ 3x + 4y = 7 3x − 4y = −1
ALGEBRA 3UNIT 3 193
EXAMPLE 13
EXAMPLE 14
KEY POINTS
Solve the simultaneous equations x + 2y = 8, 2x + y = 7.
x + 2y = 8 (1)
2x + y = 7 (2)
Multiply both sides of equation (2) by −2.
x + 2y = 8 (3)
−4x − 2y = −14 (2)
−3x = −6 (Adding equations (3) and (2))
x = 2
Substituting x = 2 into (1) gives 2 + 2y = 8 ⇒ y = 3
The solution is x = 2, y = 3.
Check: Substituting x = 2 and y = 3 into equation (2) gives 4 + 3 = 7.
Sometimes both equations have to be multiplied by suitable numbers, as in Example 14.
Solve the simultaneous equations 2x + 3y = 5, 5x − 2y = −16.
2x + 3y = 5 (1)
5x − 2y = −16 (2)
Multiply (1) by 2. 4x + 6y = 10 (3)
Multiply (2) by 3. 15x − 6y = −48 (4)
19x = −38 (Adding equations (3) and (4))
x = −2
Substituting x = −2 into (1) gives −4 + 3y = 5 ⇒ y = 3
The solution is x = −2, y = 3.
Check: Substituting x = −2 and y = 3 into equation (2) gives −10 − 6 = −16.
To solve two simultaneous equations by elimination:
• Label the equations (1) and (2).
• Choose which variable to eliminate.
• Multiply one or both equations by suitable numbers so that the numbers in front of the terms to be eliminated are the same and of different sign.
• Eliminate by adding the resulting equations. Solve the resulting equation.
• Substitute your answer into one of the original equations to find the other answer.
• Check by substituting both answers into the other original equation.
If the numbers in front of x or y are not of opposite sign, multiply by a negative number as shown in Example 13.
ALGEBRA 3 UNIT 3194
EXERCISE 7
EXERCISE 7*
8
9
8
10
1 ▶ 3x + y = 11 x + y = 7
2 ▶ 2x − y = 7 x − y = 3
3 ▶ x + 3y = 8
x − 2y = 3
4 ▶ x − 5y = 1 x + 3y = −5
1 ▶ 2x + y = 5 3x − 2y = 11
2 ▶ 3x + y = 10 2x − 3y = 14
3 ▶ 3x + 2y = 7
2x − 3y = −4
4 ▶ 4x + 7y = −5 3x − 2y = 18
5 ▶ 3x + 2y = 4 2x + 3y = 7
6 ▶ 2x + 3y = 5 3x + 4y = 7
7 ▶ 7x − 4y = 37 5x + 3y = 44
8 ▶ 5x − 7y = 27 3x − 4y = 16
9 ▶ 3x + 2y = 3 7x − 3y = 1.25
10 ▶ 4x − 3y = 2.6 10x + 5y = −1
5 ▶ 2x + y = 5 3x − 2y = −3
6 ▶ 3x + y = −5 5x − 3y = −13
7 ▶ 2x + 3y = 7 3x + 2y = 13
8 ▶ 3x + 2y = 5 6x + 5y = 8
11 ▶
+ = 42 3x y
− =
14 3 6y x
12 ▶
+ = 15 2x y
− = −3
2 8x y
13 ▶
+=
+1
21
ab
+=
+2 1 12 1 3ab
14 ▶
+=
−12
c dc d
+=
+1
21
cd
15 ▶
− =2 1
3x y
+ =
4 316
x y
16 ▶
− =2 3
1x y
+ =8 9 1
2x y
Solve these simultaneous equations.
Solve these simultaneous equations.
9 ▶ 2x + 5y = 9 3x + 4y = 10
10 ▶ 3x + 4y = 11 5x + 6y = 17
HINT For Questions
15 and 16: let
p =1x
,q =1y
ALGEBRA 3UNIT 3 195
EXERCISE 8
EXAMPLE 15
KEY POINTS
9
12x 2 3y
4y 1 3
5x 1 2 3x 1 2y
SOLVING PROBLEMS USING SIMULTANEOUS EQUATIONS
SKILL: MODELLING
Tickets at a concert cost either £10 or £15. The total takings from sales of tickets was £8750.
Sales of £10 tickets were two times the sales of £15 tickets. How many tickets were sold?
Let x be the number of £10 tickets sold, and y the number of £15 tickets sold.
The total takings was £8750, and so
10x + 15y = 8750
Divide by 5 to simplify.
2x + 3y = 1750 (1)
Sales of £10 tickets were two times the sales of £15 tickets, and so
x = 2y (2)
To check that equation (2) is correct, substitute simple numbers that obviously work, such as x = 10, y = 5.
Substituting (2) into (1) gives 4y + 3y = 1750
7y = 1750
y = 250
and so x = 500, from (2).
750 tickets were sold in total.
Check: In (1), 1000 + 750 = 1750.
• Define your variables.
• Write equations to represent each sentence from the question.
• Solve the equations by using the substitution method or the elimination method. Choose the method which seems the most suitable.
1 ▶ The sum of two numbers is 112 and their difference is 54. Find the two numbers.
2 ▶ Find two numbers with a mean of 14 and a difference of 4.
3 ▶ Two times one number added to four times another gives 34. The sum of the two numbers is 13. Find the numbers.
4 ▶ For this rectangle, find x and y and the area.
5 ▶ At McEaters, Pam bought two burgers and three colas, which cost her £3.45. Her friend Pete bought four burgers and two colas, and this cost him £4.94. Work out the cost of a burger and the cost of a cola.
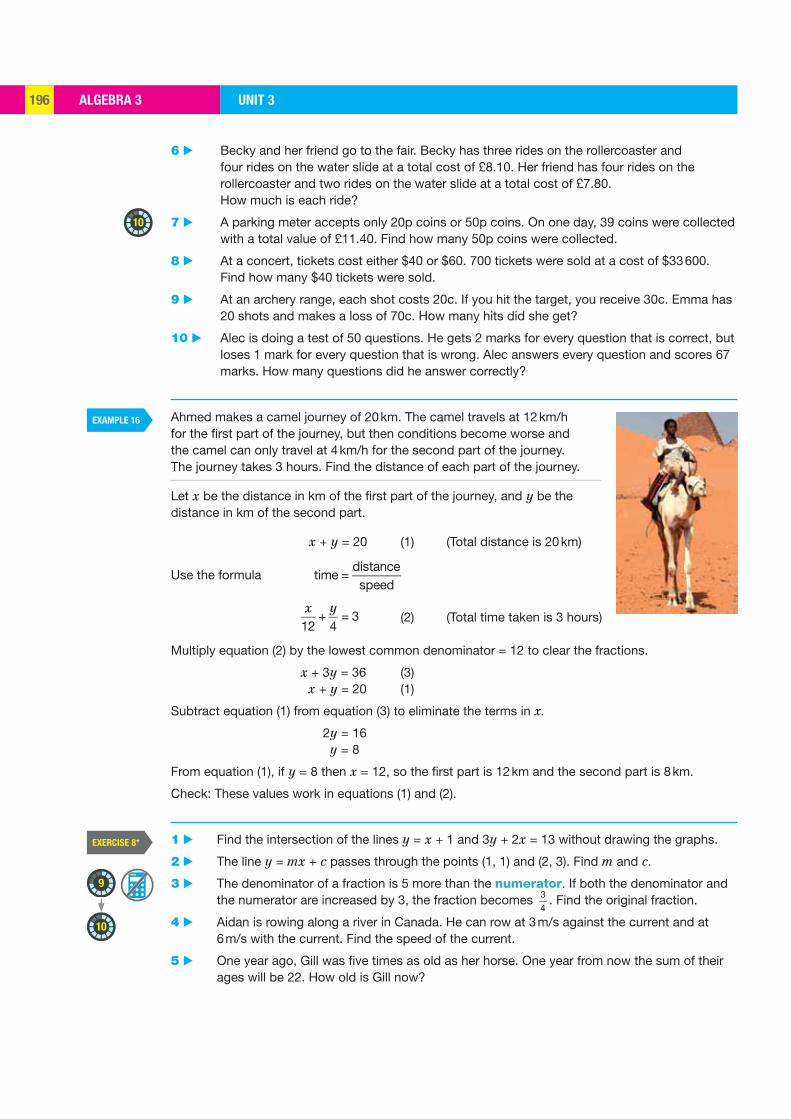
ALGEBRA 3 UNIT 3196
EXAMPLE 16
EXERCISE 8*
10
9
10
6 ▶ Becky and her friend go to the fair. Becky has three rides on the rollercoaster and four rides on the water slide at a total cost of £8.10. Her friend has four rides on the rollercoaster and two rides on the water slide at a total cost of £7.80. How much is each ride?
7 ▶ A parking meter accepts only 20p coins or 50p coins. On one day, 39 coins were collected with a total value of £11.40. Find how many 50p coins were collected.
8 ▶ At a concert, tickets cost either $40 or $60. 700 tickets were sold at a cost of $33 600. Find how many $40 tickets were sold.
9 ▶ At an archery range, each shot costs 20c. If you hit the target, you receive 30c. Emma has 20 shots and makes a loss of 70c. How many hits did she get?
10 ▶ Alec is doing a test of 50 questions. He gets 2 marks for every question that is correct, but loses 1 mark for every question that is wrong. Alec answers every question and scores 67 marks. How many questions did he answer correctly?
Ahmed makes a camel journey of 20 km. The camel travels at 12 km/h for the first part of the journey, but then conditions become worse and the camel can only travel at 4 km/h for the second part of the journey. The journey takes 3 hours. Find the distance of each part of the journey.
Let x be the distance in km of the first part of the journey, and y be the distance in km of the second part.
x + y = 20 (1) (Total distance is 20 km)
Use the formula time =distancespeed
x
12+
y4
= 3 (2) (Total time taken is 3 hours) Multiply equation (2) by the lowest common denominator = 12 to clear the fractions.
x + 3y = 36 (3) x + y = 20 (1)
Subtract equation (1) from equation (3) to eliminate the terms in x.
2y = 16 y = 8
From equation (1), if y = 8 then x = 12, so the first part is 12 km and the second part is 8 km.
Check: These values work in equations (1) and (2).
1 ▶ Find the intersection of the lines y = x + 1 and 3y + 2x = 13 without drawing the graphs.
2 ▶ The line y = mx + c passes through the points (1, 1) and (2, 3). Find m and c.
3 ▶ The denominator of a fraction is 5 more than the numerator. If both the denominator and the numerator are increased by 3, the fraction becomes 3
4. Find the original fraction.
4 ▶ Aidan is rowing along a river in Canada. He can row at 3 m/s against the current and at 6 m/s with the current. Find the speed of the current.
5 ▶ One year ago, Gill was five times as old as her horse. One year from now the sum of their ages will be 22. How old is Gill now?

ALGEBRA 3UNIT 3 197
EXERCISE 9
11
6
10
6 ▶ To cover a distance of 10 km, Jacob runs some of the way at 15 km/h, and walks the rest of the way at 5 km/h. His total journey time is 1 hour. How far did Jacob run?
7 ▶ On a journey of 240 km, Archita travels some of the way on a motorway at 100 km/h and the rest of the way on minor roads at 60 km/h. The journey takes 3 hours. How far did she travel on the motorway?
8 ▶ A 2-digit number is increased by 36 when the digits are reversed. The sum of the digits is 10. Find the original number.
9 ▶ A 2-digit number is equal to seven times the sum of its digits. If the digits are reversed, the new number formed is 36 less than the original number. What is the number?
10 ▶ When visiting his parents, Tyler drives at an average speed of 42 km/h through urban areas and at an average speed of 105 km/h on the motorway. His journey usually takes him 2.5 hours. One day when there is fog, he sets off 1 hour early and only manages to drive at an average speed of 28 km/h in the urban areas and 60 km/h on the motorway. He arrives 30 minutes late. What was the total distance that Tyler travelled?
REVISION
Factorise these.
1 ▶ x2 − 8x
7 ▶ 3x 4
4= 2
8 ▶ − = +1 14 7
( 2) ( 1)x x
5 ▶ x2 x
x
4 ▶ 12x3 + 9x2 − 15x2 ▶ 3x2 + 12x
6 ▶ x2 + xyx2 xy
3 ▶ 6xy2 − 30x2y
9 ▶ 2x +74
x +13
=34
10 ▶ 4n
1=2n
Simplify these.
Solve these equations.
11 ▶ Sarah shares some sweets with her friends. She gives one-eighth of the sweets to Ann, one-sixth to Nikita and one-third to Ruth. She then has nine sweets remaining for herself. How many sweets did she have at the beginning?
Solve these pairs of simultaneous equations.
12 ▶ y − x = 4 y + 2x = 1
13 ▶ y + x = 3 y − 2x = 3
14 ▶ 3x + 2y = 10 5x − 4y = 2
15 ▶ 5x − 2y = −1 10x − 3y = 1
16 ▶ At a sale, Andy buys two books and three USB sticks for £25.50. His friend Charlie buys four books and five USB sticks for £47.50. What is the cost of each item if all the books cost the same and all the USB sticks cost the same?
17 ▶ Rana is collecting 10p and 20p pieces. When she has 30 coins, the value of them is £4.10. How many of each coin does she have?
ALGEBRA 3 UNIT 3198
EXERCISE 9*
7
10
REVISION
Factorise these.
1 ▶ 3x4 12x3
2 ▶ p p+3 24 23 3
r r
7 ▶ − =27
(3 1) 0x
8 ▶ 3x + 2
52x +5
3= x + 3
3 ▶ 24x3y2 18x2y
4 ▶ 15a2b3c2 9a3b2c2 + 21a2b2c3
9 ▶ + = +2 2
3 31 ( 1) 5x x
10 ▶ + − = 13
1 1 12
2 3x x x
5 ▶ x2 xyxy y2 6 ▶
ax bxx2 + xy
÷2a 2b
2x2 + 2xy
Simplify these.
Solve these equations.
11 ▶ Mrs Taylor has lived in many countries. She spent the first third of her life in England, the next sixth in France, one-quarter in Spain,
12
3 years in Italy, and one-fifth in Germany, where she is now living. How old is Mrs Taylor?
Solve these pairs of simultaneous equations.
16 ▶ The straight line ax + by = 1 passes through the points (1, 4) and (3, 1). Find the values of a and b.
17 ▶ Ten years from now, Abdul will be twice as old as his son Pavel. Ten years ago, Abdul was seven times as old as Pavel. How old are Abdul and Pavel now?
12 ▶ 5x + 4y = 22 3x + 5y = 21
13 ▶ 5x + 3y = 23 x + 2y = 6
14 ▶ 3x + 8y = 24 x − 2y = 1
15 ▶ 6x + 5y = 30 3x + 4y = 18
EXAM PRACTICEUNIT 3 199
1
2
3
4
5
Factorise these completely
a 3x2 + 6xb 28ab2 – 21a2b [2]
Simplify these.
a x2 2x2x
b x xyy y2 [4]
Solve these equations.
a 3 x 7( )
4= 9 c
x3
x5
= 2
b x 1
3=
x +14
d 5x
=13
[8]
Solve these simultaneous equations.
a x = 3y – 7 x + 2y = 3
b 2x + y = 4 3x + 2y = 5 [6]
At the market, Malik buys 2 oranges and 5 mangoes at a cost of $4.50 while his friend Seb buys 4 oranges and 3 mangoes at a cost of $4.10. What is the cost of each item? (All the oranges cost the same, and all the mangoes cost the same.) [5]
[Total 25 marks]
EXAM PRACTICE: ALGEBRA 3
EXAM PRACTICE UNIT 3200 CHAPTER SUMMARY UNIT 3200
CHAPTER SUMMARY: ALGEBRA 3
SIMPLE FACTORISING
EQUATIONS WITH FRACTIONS
SIMPLIFYING FRACTIONS
SUBSTITUTION METHOD
x = y + 1 (1)
x + 2y = 4 (2) (Substitute (1) into (2) to give equation (3))
y + 1 + 2y = 4 (3)
3y = 3 ⇒ y = 1 (Substitute into equation (1) to find x)
x = 2 (Check by substituting into equation (2))
2 + 2 = 4 (Correct)
ELIMINATION METHOD
x + 2y = 5 (1)
3x – 4y = 25 (2) (Multiply equation (1) by 2 to give equation (3))
2x + 4y = 10 (3) (Add equations (2) and (3))
5x = 35 ⇒ x = 7 (Substitute into equation (1))
7 + 2y = 5 ⇒ y = –1 (Check in equation (2))
21 –(–4) = 25 (Correct)
SIMULTANEOUS EQUATIONS
Factorise first, then simplify
x2y xy2
xy=
1xy x y( )1xy
= x y
Clear the fractions by multiplying both sides by the lowest common denominator.
2 x 3( )3
=x 1
2
(Multiply both sides by
3 × 2 = 6)
4(x – 3) = 3(x – 1) (Multiply out brackets)
4x – 12 = 3x – 3 (Subtract 3x from both sides and add 12 to both sides)
x = 9
2x
=13
(Multiply both sides by 3 × x = 3x)
2x
3x =13
3x× × (Simplify)
6 = x
Take out the common factors. Check your answer by multiplying out.
2x3 + 6x5 = 2x3(1 + 3x2)
9xy3 – 12x2y2 = 3xy2(3y – 4x)
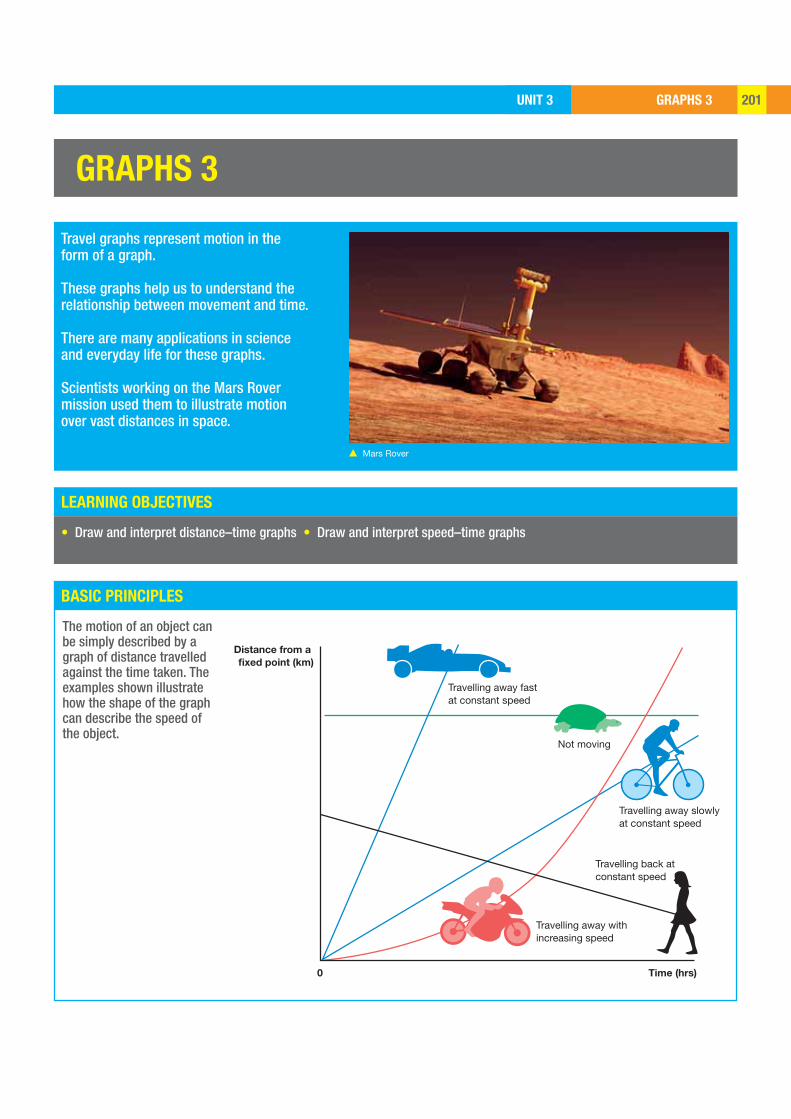
GRAPHS 3UNIT 3 201
LEARNING OBJECTIVES
BASIC PRINCIPLES
Distance from a
fixed point (km)
Time (hrs)
Travelling away fast at constant speed
Travelling away slowly at constant speed
Travelling away with increasing speed
Travelling back at constant speed
0
Not moving
GRAPHS 3
Travel graphs represent motion in the form of a graph. These graphs help us to understand the relationship between movement and time.
There are many applications in science and everyday life for these graphs.
Scientists working on the Mars Rover mission used them to illustrate motion over vast distances in space.
• Draw and interpret distance–time graphs • Draw and interpret speed–time graphs
The motion of an object can be simply described by a graph of distance travelled against the time taken. The examples shown illustrate how the shape of the graph can describe the speed of the object.
▲ Mars Rover
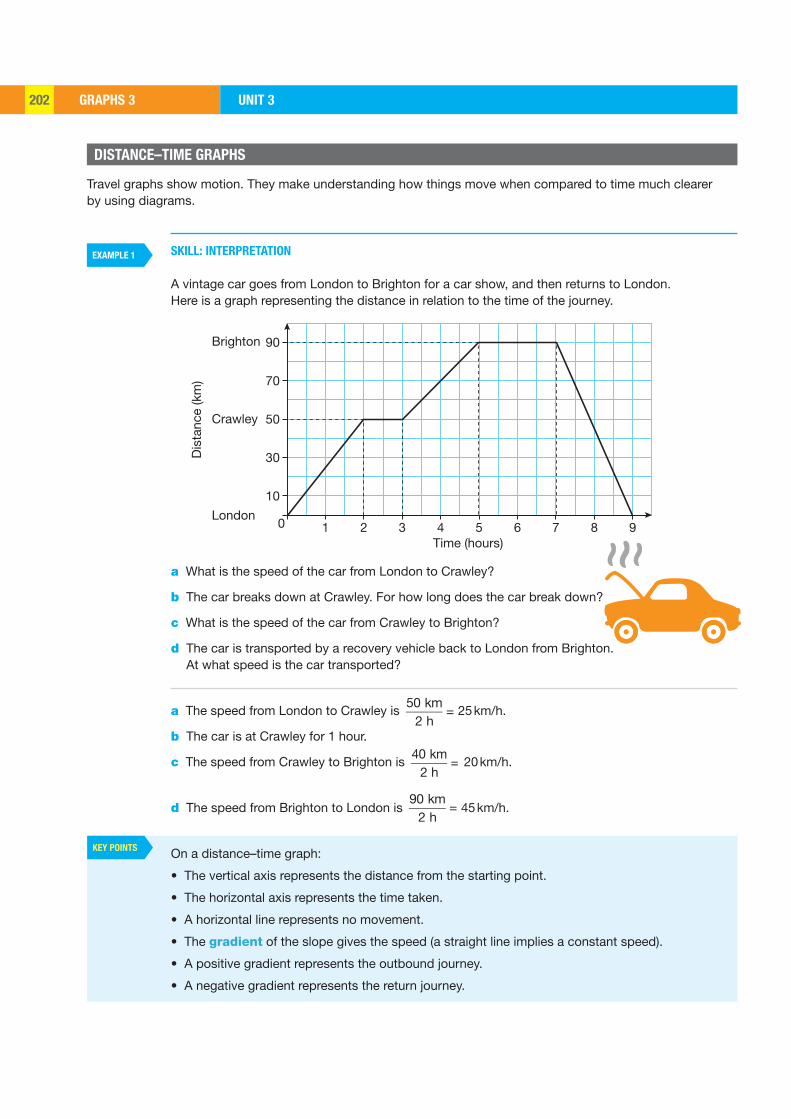
GRAPHS 3 UNIT 3202
EXAMPLE 1
KEY POINTS
10
10
London
Crawley
Brighton
30
50
Dis
tanc
e (k
m) 70
90
2 3 4 5Time (hours)
6 7 8 9
SKILL: INTERPRETATION
A vintage car goes from London to Brighton for a car show, and then returns to London. Here is a graph representing the distance in relation to the time of the journey.
a What is the speed of the car from London to Crawley?
b The car breaks down at Crawley. For how long does the car break down?
c What is the speed of the car from Crawley to Brighton?
d The car is transported by a recovery vehicle back to London from Brighton. At what speed is the car transported?
a The speed from London to Crawley is 50 km
2 h= 25 km/h.
b The car is at Crawley for 1 hour.
c The speed from Crawley to Brighton is 40 km
2 h= 20 km/h.
d The speed from Brighton to London is 90 km
2 h= 45 km/h.
On a distance–time graph:
• The vertical axis represents the distance from the starting point.
• The horizontal axis represents the time taken.
• A horizontal line represents no movement.
• The gradient of the slope gives the speed (a straight line implies a constant speed).
• A positive gradient represents the outbound journey.
• A negative gradient represents the return journey.
DISTANCE–TIME GRAPHS
Travel graphs show motion. They make understanding how things move when compared to time much clearer by using diagrams.
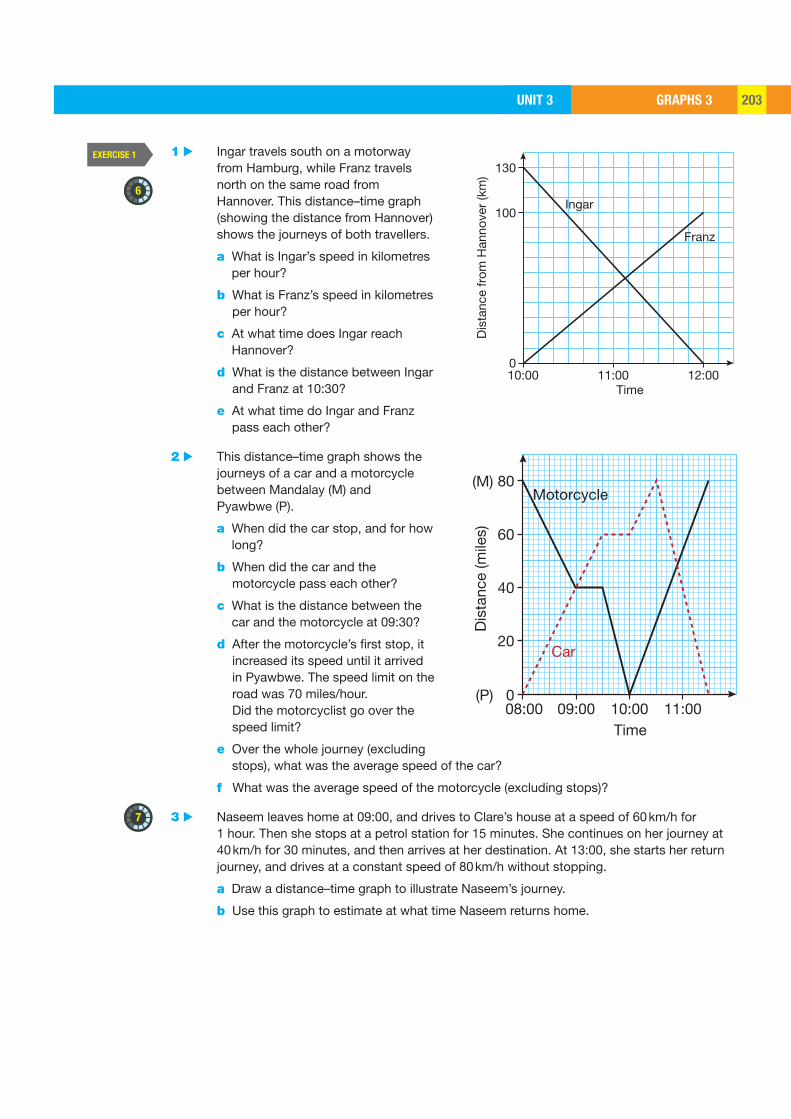
GRAPHS 3UNIT 3 203
EXERCISE 1
6
7
09:0008:00
20
0(P)
(M)
40
60
Dis
tanc
e (m
iles)
80
10:00 11:00
Motorcycle
Car
Time
10:00 11:00Time
Ingar
Franz
12:000
100
Dis
tanc
e fr
om H
anno
ver
(km
)
1301 ▶ Ingar travels south on a motorway
from Hamburg, while Franz travels north on the same road from Hannover. This distance–time graph (showing the distance from Hannover) shows the journeys of both travellers.
a What is Ingar’s speed in kilometres per hour?
b What is Franz’s speed in kilometres per hour?
c At what time does Ingar reach Hannover?
d What is the distance between Ingar and Franz at 10:30?
e At what time do Ingar and Franz pass each other?
2 ▶ This distance–time graph shows the journeys of a car and a motorcycle between Mandalay (M) and Pyawbwe (P).
a When did the car stop, and for how long?
b When did the car and the motorcycle pass each other?
c What is the distance between the car and the motorcycle at 09:30?
d After the motorcycle’s first stop, it increased its speed until it arrived in Pyawbwe. The speed limit on the road was 70 miles/hour. Did the motorcyclist go over the speed limit?
e Over the whole journey (excluding stops), what was the average speed of the car?
f What was the average speed of the motorcycle (excluding stops)?
3 ▶ Naseem leaves home at 09:00, and drives to Clare’s house at a speed of 60 km/h for 1 hour. Then she stops at a petrol station for 15 minutes. She continues on her journey at 40 km/h for 30 minutes, and then arrives at her destination. At 13:00, she starts her return journey, and drives at a constant speed of 80 km/h without stopping.
a Draw a distance–time graph to illustrate Naseem’s journey.
b Use this graph to estimate at what time Naseem returns home.
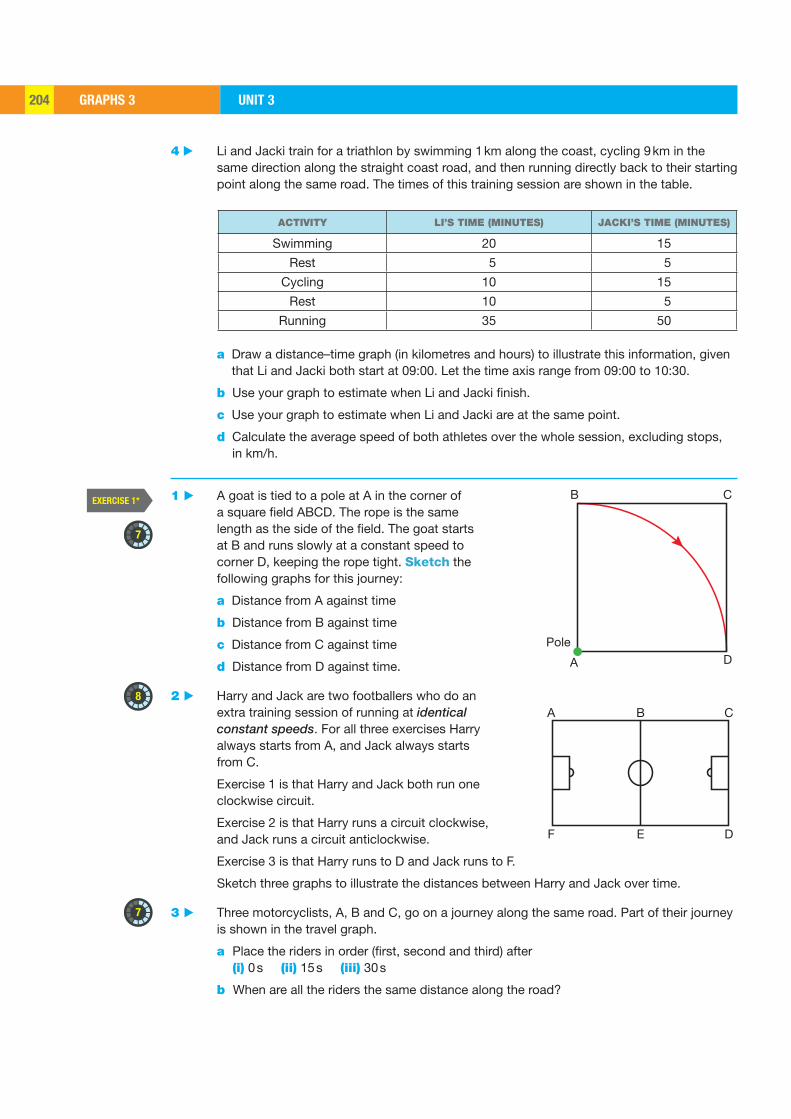
GRAPHS 3 UNIT 3204
EXERCISE 1*
7
8
7
Pole
A D
CB
A B C
F E D
4 ▶ Li and Jacki train for a triathlon by swimming 1 km along the coast, cycling 9 km in the same direction along the straight coast road, and then running directly back to their starting point along the same road. The times of this training session are shown in the table.
ACTIVITY LI’S TIME (MINUTES) JACKI’S TIME (MINUTES)
Swimming 20 15
Rest 5 5
Cycling 10 15
Rest 10 5
Running 35 50 a Draw a distance–time graph (in kilometres and hours) to illustrate this information, given
that Li and Jacki both start at 09:00. Let the time axis range from 09:00 to 10:30.
b Use your graph to estimate when Li and Jacki finish.
c Use your graph to estimate when Li and Jacki are at the same point.
d Calculate the average speed of both athletes over the whole session, excluding stops, in km/h.
1 ▶ A goat is tied to a pole at A in the corner of a square field ABCD. The rope is the same length as the side of the field. The goat starts at B and runs slowly at a constant speed to corner D, keeping the rope tight. Sketch the following graphs for this journey:
a Distance from A against time
b Distance from B against time
c Distance from C against time
d Distance from D against time.
2 ▶ Harry and Jack are two footballers who do an extra training session of running at identical constant speeds. For all three exercises Harry always starts from A, and Jack always starts from C.
Exercise 1 is that Harry and Jack both run one clockwise circuit.
Exercise 2 is that Harry runs a circuit clockwise, and Jack runs a circuit anticlockwise.
Exercise 3 is that Harry runs to D and Jack runs to F.
Sketch three graphs to illustrate the distances between Harry and Jack over time.
3 ▶ Three motorcyclists, A, B and C, go on a journey along the same road. Part of their journey is shown in the travel graph.
a Place the riders in order (first, second and third) after (i) 0 s (ii) 15 s (iii) 30 s
b When are all the riders the same distance along the road?
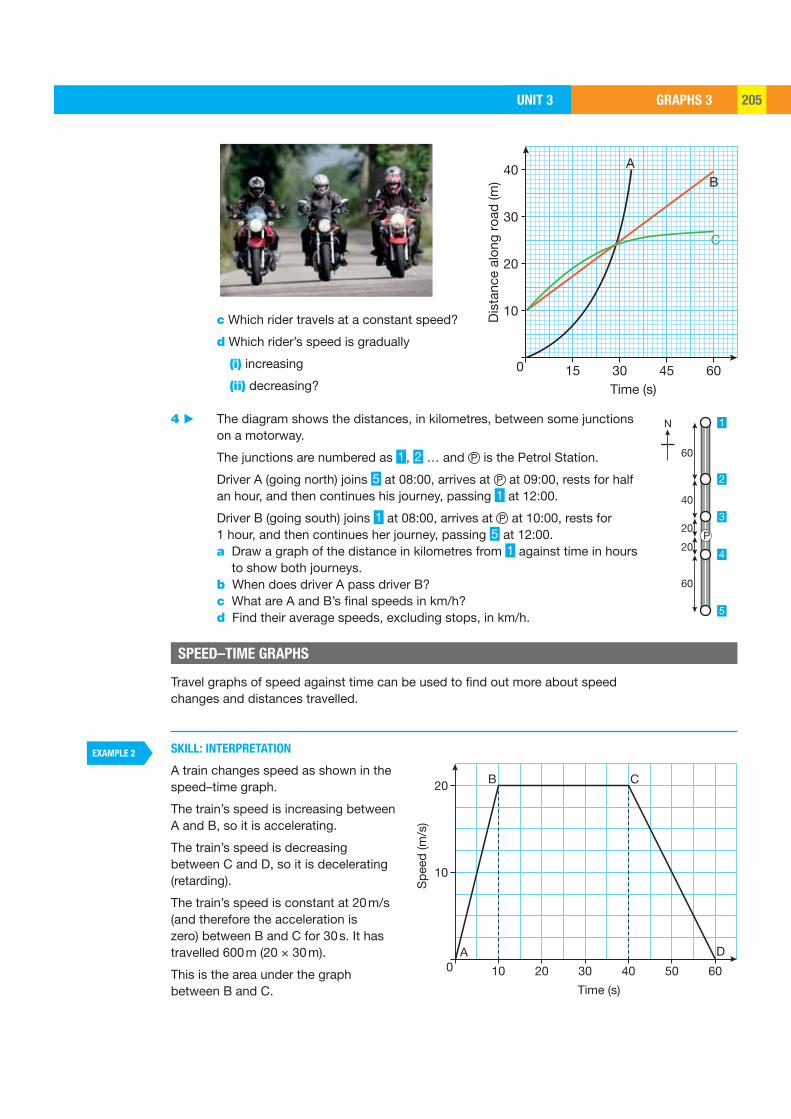
GRAPHS 3UNIT 3 205
EXAMPLE 2
15
10
0
20
30
Dis
tanc
e al
ong
road
(m)
40
30 45
AB
C
60Time (s)
P
5
4
3
2
1
60
20
20
40
60
N
10
A D
CB
0
10
Spe
ed (m
/s)
20
20 30 40 50
Time (s)
60
c Which rider travels at a constant speed?
d Which rider’s speed is gradually
(i) increasing
(ii) decreasing?
4 ▶ The diagram shows the distances, in kilometres, between some junctions on a motorway.
The junctions are numbered as 1, 2 … and P is the Petrol Station.
Driver A (going north) joins 5 at 08:00, arrives at P at 09:00, rests for half an hour, and then continues his journey, passing 1 at 12:00.
Driver B (going south) joins 1 at 08:00, arrives at P at 10:00, rests for 1 hour, and then continues her journey, passing 5 at 12:00.
a Draw a graph of the distance in kilometres from 1 against time in hours to show both journeys.
b When does driver A pass driver B? c What are A and B’s final speeds in km/h? d Find their average speeds, excluding stops, in km/h.
Travel graphs of speed against time can be used to find out more about speed changes and distances travelled.
SKILL: INTERPRETATION
A train changes speed as shown in the speed–time graph.
The train’s speed is increasing between A and B, so it is accelerating.
The train’s speed is decreasing between C and D, so it is decelerating (retarding).
The train’s speed is constant at 20 m/s (and therefore the acceleration is zero) between B and C for 30 s. It has travelled 600 m (20 × 30 m).
This is the area under the graph between B and C.
SPEED–TIME GRAPHS
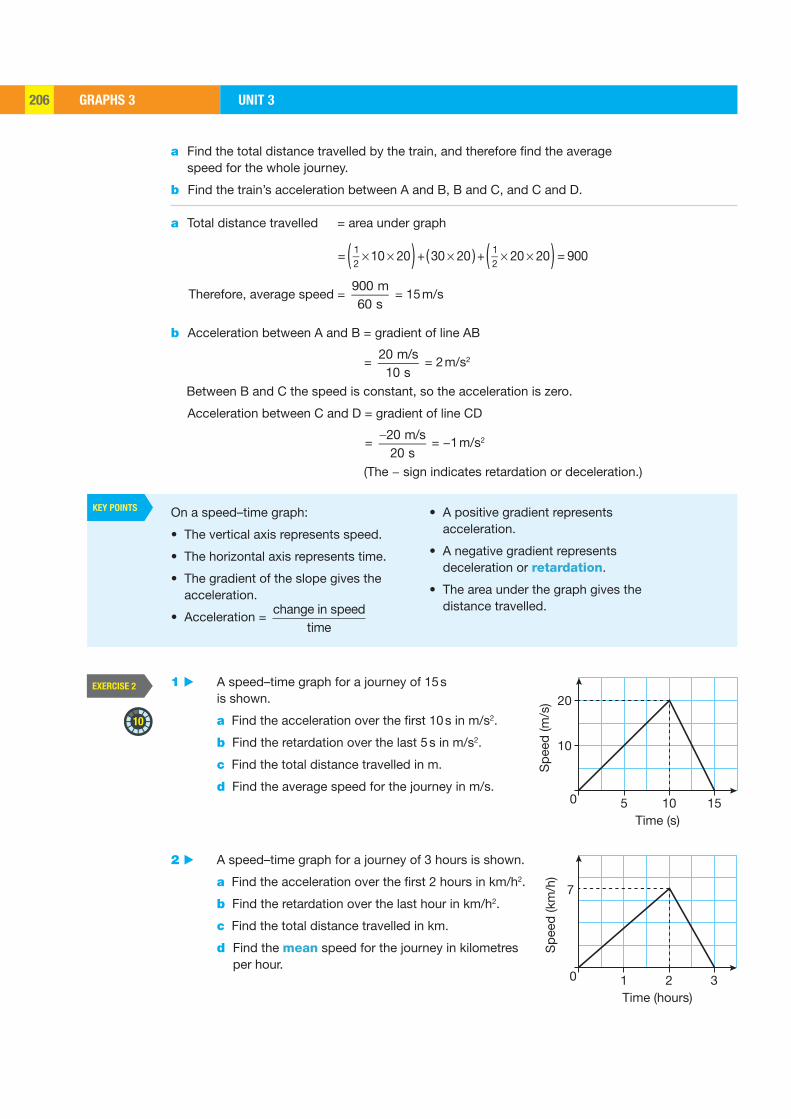
GRAPHS 3 UNIT 3206
KEY POINTS
EXERCISE 2
10
50
10
Spe
ed (m
/s) 20
10 15Time (s)
10
Spe
ed (k
m/h
)
7
2 3Time (hours)
a Find the total distance travelled by the train, and therefore find the average speed for the whole journey.
b Find the train’s acceleration between A and B, B and C, and C and D. a Total distance travelled = area under graph
= 12
10 20( ) + 30 20( )+ 12
20 20( ) = 900
Therefore, average speed = 900 m60 s
= 15 m/s
b Acceleration between A and B = gradient of line AB
= 20 m/s10 s
= 2 m/s2
Between B and C the speed is constant, so the acceleration is zero.
Acceleration between C and D = gradient of line CD
= 20 m/s20 s
= −1 m/s2
(The − sign indicates retardation or deceleration.)
1 ▶ A speed–time graph for a journey of 15 s is shown.
a Find the acceleration over the first 10 s in m/s2.
b Find the retardation over the last 5 s in m/s2.
c Find the total distance travelled in m.
d Find the average speed for the journey in m/s.
2 ▶ A speed–time graph for a journey of 3 hours is shown.
a Find the acceleration over the first 2 hours in km/h2.
b Find the retardation over the last hour in km/h2.
c Find the total distance travelled in km.
d Find the mean speed for the journey in kilometres per hour.
On a speed–time graph:
• The vertical axis represents speed.
• The horizontal axis represents time.
• The gradient of the slope gives the acceleration.
• Acceleration = change in speed
time
• A positive gradient represents acceleration.
• A negative gradient represents deceleration or retardation.
• The area under the graph gives the distance travelled.
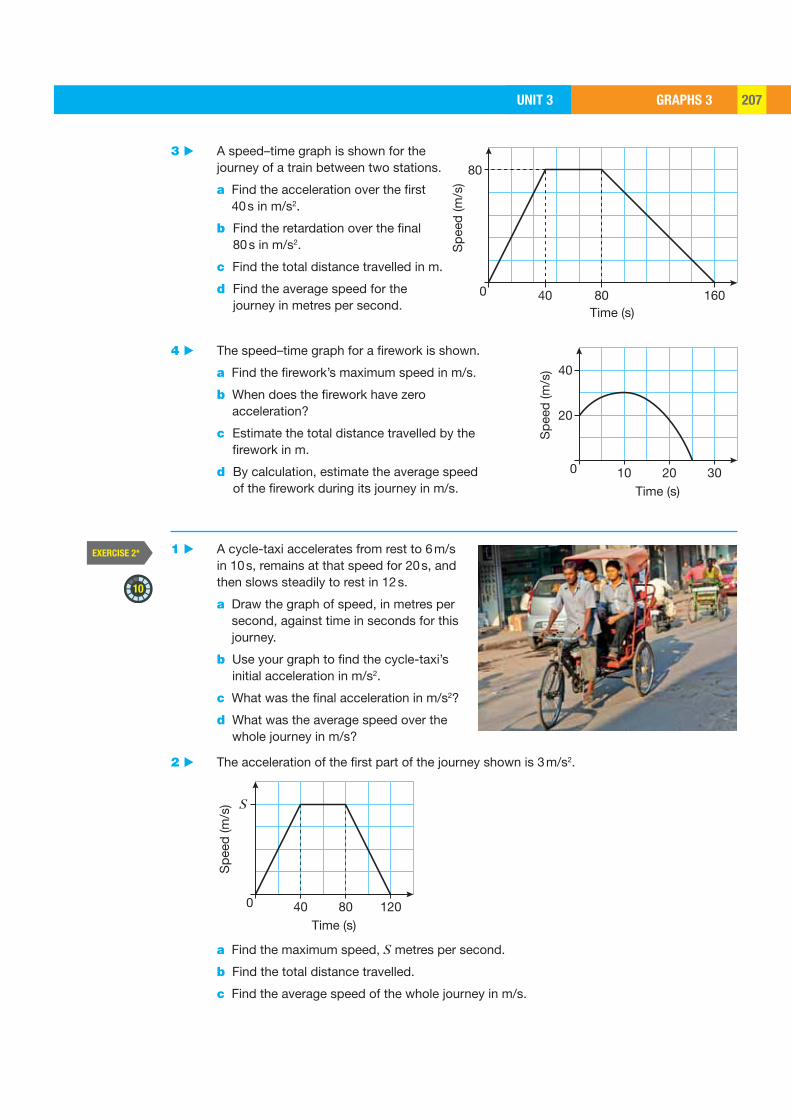
GRAPHS 3UNIT 3 207
EXERCISE 2*
10
0
80
Spe
ed (m
/s)
80 16040Time (s)
0
20
40
Spe
ed (m
/s)
10 20 30Time (s)
0
S
Spe
ed (m
/s)
40 80 120Time (s)
3 ▶ A speed–time graph is shown for the journey of a train between two stations.
a Find the acceleration over the first 40 s in m/s2.
b Find the retardation over the final 80 s in m/s2.
c Find the total distance travelled in m.
d Find the average speed for the journey in metres per second.
4 ▶ The speed–time graph for a firework is shown.
a Find the firework’s maximum speed in m/s.
b When does the firework have zero acceleration?
c Estimate the total distance travelled by the firework in m.
d By calculation, estimate the average speed of the firework during its journey in m/s.
1 ▶ A cycle-taxi accelerates from rest to 6 m/s in 10 s, remains at that speed for 20 s, and then slows steadily to rest in 12 s.
a Draw the graph of speed, in metres per second, against time in seconds for this journey.
b Use your graph to find the cycle-taxi’s initial acceleration in m/s2.
c What was the final acceleration in m/s2?
d What was the average speed over the whole journey in m/s?
2 ▶ The acceleration of the first part of the journey shown is 3 m/s2.
a Find the maximum speed, S metres per second.
b Find the total distance travelled.
c Find the average speed of the whole journey in m/s.
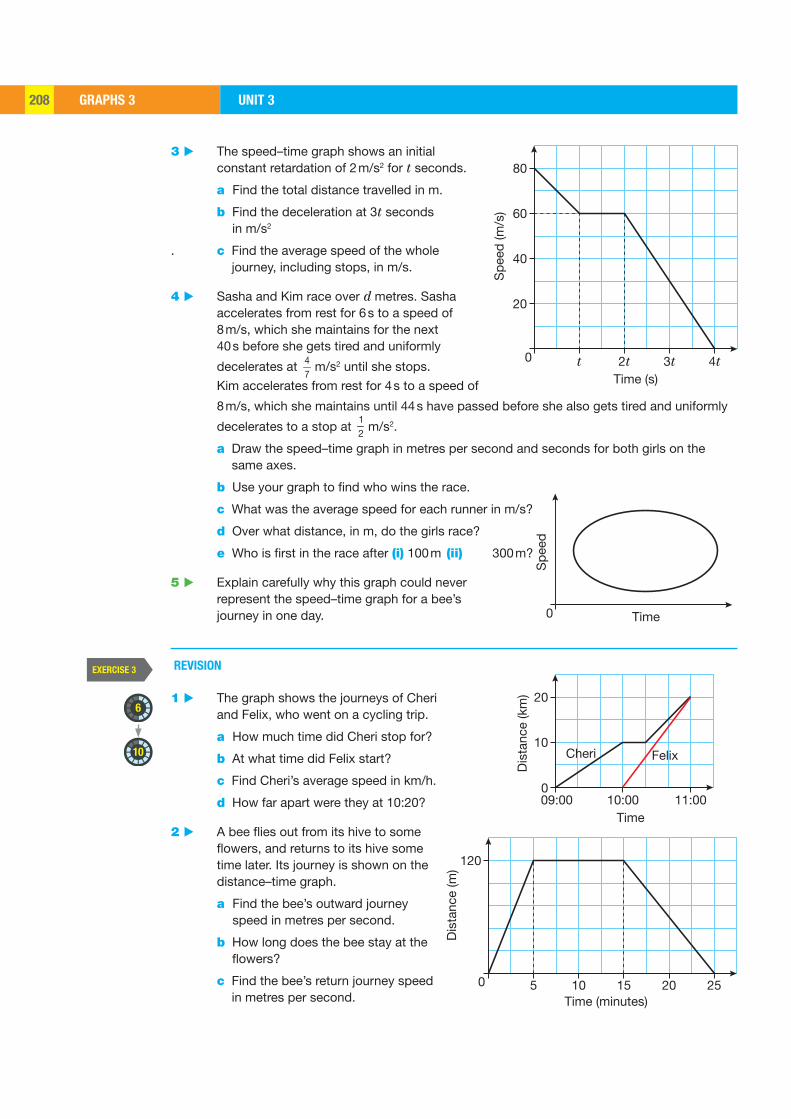
GRAPHS 3 UNIT 3208
EXERCISE 3
6
10
0
20
40
60
80
Spe
ed (m
/s)
t 2t 3t 4tTime (s)
Spe
ed
Time0
0
10
20
Dis
tanc
e (k
m)
09:00Time
10:00 11:00
FelixCheri
0
120
Dis
tanc
e (m
)
5Time (minutes)
10 15 20 25
3 ▶ The speed–time graph shows an initial constant retardation of 2 m/s2 for t seconds.
a Find the total distance travelled in m.
b Find the deceleration at 3t seconds in m/s2
. c Find the average speed of the whole journey, including stops, in m/s.
4 ▶ Sasha and Kim race over d metres. Sasha accelerates from rest for 6 s to a speed of 8 m/s, which she maintains for the next 40 s before she gets tired and uniformly
decelerates at 47
m/s2 until she stops.
Kim accelerates from rest for 4 s to a speed of
8 m/s, which she maintains until 44 s have passed before she also gets tired and uniformly
decelerates to a stop at 12
m/s2.
a Draw the speed–time graph in metres per second and seconds for both girls on the same axes.
b Use your graph to find who wins the race.
c What was the average speed for each runner in m/s?
d Over what distance, in m, do the girls race?
e Who is first in the race after (i) 100 m (ii) 300 m?
5 ▶ Explain carefully why this graph could never represent the speed–time graph for a bee’s journey in one day.
REVISION
1 ▶ The graph shows the journeys of Cheri and Felix, who went on a cycling trip.
a How much time did Cheri stop for?
b At what time did Felix start?
c Find Cheri’s average speed in km/h.
d How far apart were they at 10:20?
2 ▶ A bee flies out from its hive to some flowers, and returns to its hive some time later. Its journey is shown on the distance–time graph.
a Find the bee’s outward journey speed in metres per second.
b How long does the bee stay at the flowers?
c Find the bee’s return journey speed in metres per second.

GRAPHS 3UNIT 3 209
EXERCISE 3*
7
10
0
20
10
Spe
ed (m
/s)
20Time (s)
40 60 80 100
0
8
4
6
10
2
Dis
tanc
e fr
om A
lber
to’s
hom
e (k
m)
10:00
Daniela
Alberto
09:00Time
11:00 12:00
3 ▶ Robin sails from a resting position in his boat to a constant speed of 4 m/s in 30 s. He then remains at this speed for a further 60 s, before he slows down at a constant retardation until he stops 15 s later.
a Draw a speed–time graph showing this journey, and use it to find Robin’s
b initial acceleration in m/s2
c acceleration at 60 s in m/s2
d retardation in m/s2
e average speed for the whole journey in m/s.
4 ▶ The speed–time graph illustrates the journey of a cyclist.
a Find the distance travelled in the first 50 s in m.
b Find the total distance travelled in m.
c Find the average speed of the cyclist in m/s.
d Find the acceleration when t = 80 s in m/s2.
REVISION
1 ▶ This distance–time graph shows the journeys of Daniela and Alberto, who cycle from their houses to meet at a lake. After staying at the lake for 90 minutes, Daniela cycles back home at 8 km/hour and Alberto returns home at 12 km/hour.
a Copy the graph and represent these facts on your graph.
b When did each person arrive home?
c What is the average speed, excluding stops, in m/s for each cyclist?

GRAPHS 3 UNIT 3210
0
10
5
25Dis
tanc
e fr
om T
hom
(m)
0.2 Time (s)0.4 0.6 0.8
0
20
10
15
5Spe
ed (m
/s)
15Time (s)
0 30 45 60
0
2
4
6
8
Spe
ed (m
/s)
2tTime (s)
0 4t 6t 8t 10t
2 ▶ A squash ball is hit against a wall by Thom. He remains stationary throughout the ball’s flight, which is shown in the distance–time graph.
a What is the speed of the ball when it approaches the wall in m/s?
b When does the ball pass Thom, and at what speed?
3 ▶ This speed–time graph illustrates the speed of a truck in metres per second.
Which of these statements are true? Which are false? Show working to justify your answers.
a The initial acceleration over the first 30 s changes.
b The braking distance is 150 m.
c The average speed for the whole journey is 12.5 m/s.
d The maximum speed is 60 km/hour.
4 ▶ This speed–time graph is for a toy racing car. The initial retardation is 2 m/s2.
a Find the total distance travelled in m.
b Find the deceleration at 6t seconds in m/s2.
c Find the average speed of the whole journey in m/s.
Q4c HINTFind the value of
t first.
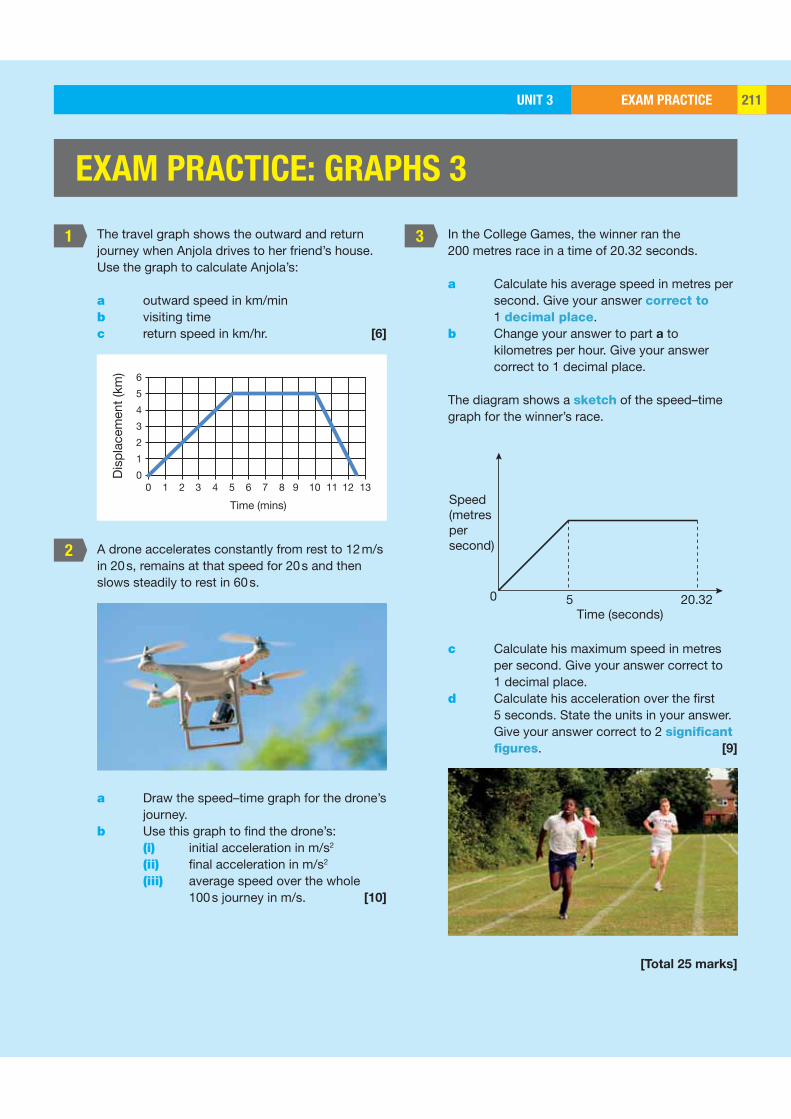
EXAM PRACTICEUNIT 3 211EXAM PRACTICEUNIT 3 211
1
2
3
50 20.32Time (seconds)
Speed(metrespersecond)
0 1 2 3 4 5 6 7 8 9 10 11 12 130
1
2
3
4
5
6
Time (mins)
Dis
plac
emen
t (km
)
The travel graph shows the outward and return journey when Anjola drives to her friend’s house.Use the graph to calculate Anjola’s:
a outward speed in km/minb visiting timec return speed in km/hr. [6]
A drone accelerates constantly from rest to 12 m/s in 20 s, remains at that speed for 20 s and then slows steadily to rest in 60 s.
a Draw the speed–time graph for the drone’s
journey.b Use this graph to find the drone’s: (i) initial acceleration in m/s2
(ii) final acceleration in m/s2
(iii) average speed over the whole 100 s journey in m/s. [10]
In the College Games, the winner ran the 200 metres race in a time of 20.32 seconds.
a Calculate his average speed in metres per second. Give your answer correct to 1 decimal place.
b Change your answer to part a to kilometres per hour. Give your answer correct to 1 decimal place.
The diagram shows a sketch of the speed–time graph for the winner’s race.
c Calculate his maximum speed in metres per second. Give your answer correct to 1 decimal place.
d Calculate his acceleration over the first 5 seconds. State the units in your answer. Give your answer correct to 2 significant figures. [9]
[Total 25 marks]
EXAM PRACTICE: GRAPHS 3
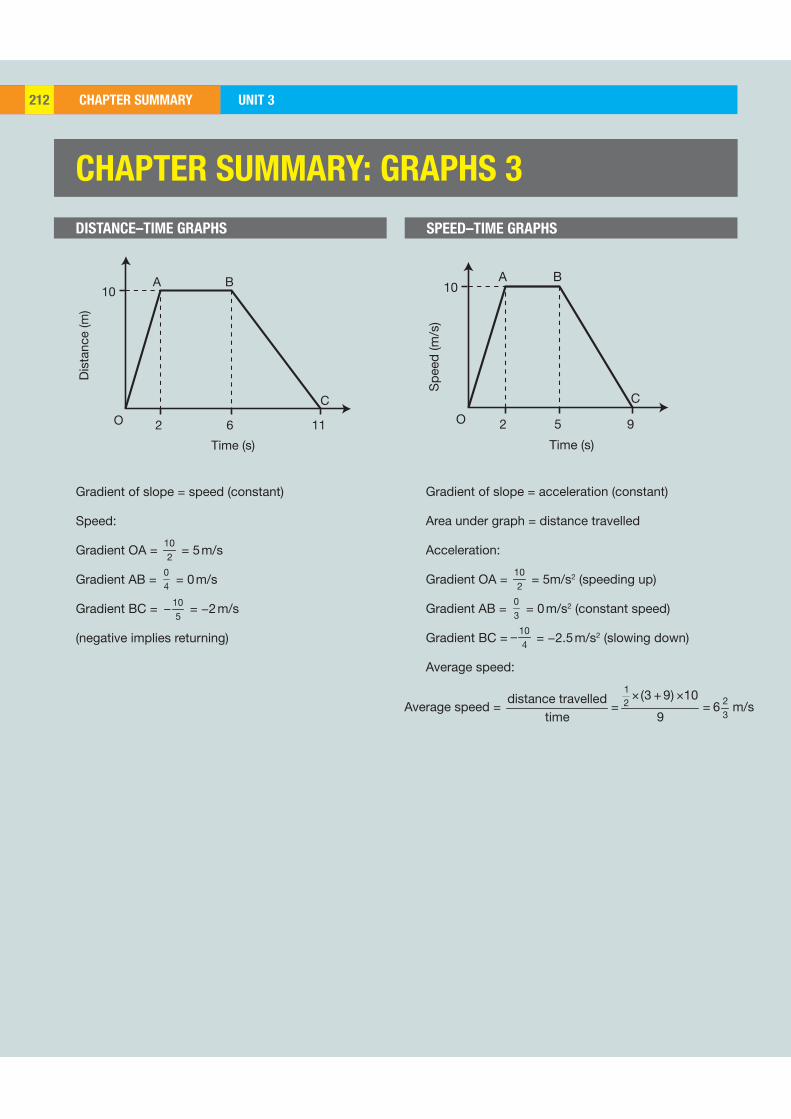
EXAM PRACTICE UNIT 3212 CHAPTER SUMMARY UNIT 3212 CHAPTER SUMMARY212
Dis
tanc
e (m
)
10
2O 6 11
A B
C
Time (s)S
peed
(m/s
)
10
2O 5 9
A B
C
Time (s)
DISTANCE–TIME GRAPHS SPEED–TIME GRAPHS
Gradient of slope = acceleration (constant)
Area under graph = distance travelled
Acceleration:
Gradient OA = 102
= 5m/s2 (speeding up)
Gradient AB = 03
= 0 m/s2 (constant speed)
Gradient BC = −104
= −2.5 m/s2 (slowing down)
Average speed:
Gradient of slope = speed (constant)
Speed:
Gradient OA = 102
= 5 m/s
Gradient AB = 04
= 0 m/s
Gradient BC = −105
= −2 m/s
(negative implies returning)
CHAPTER SUMMARY: GRAPHS 3
Average speed = × + ×
= =1
223
(3 9) 10distance travelled6
time 9 m/s
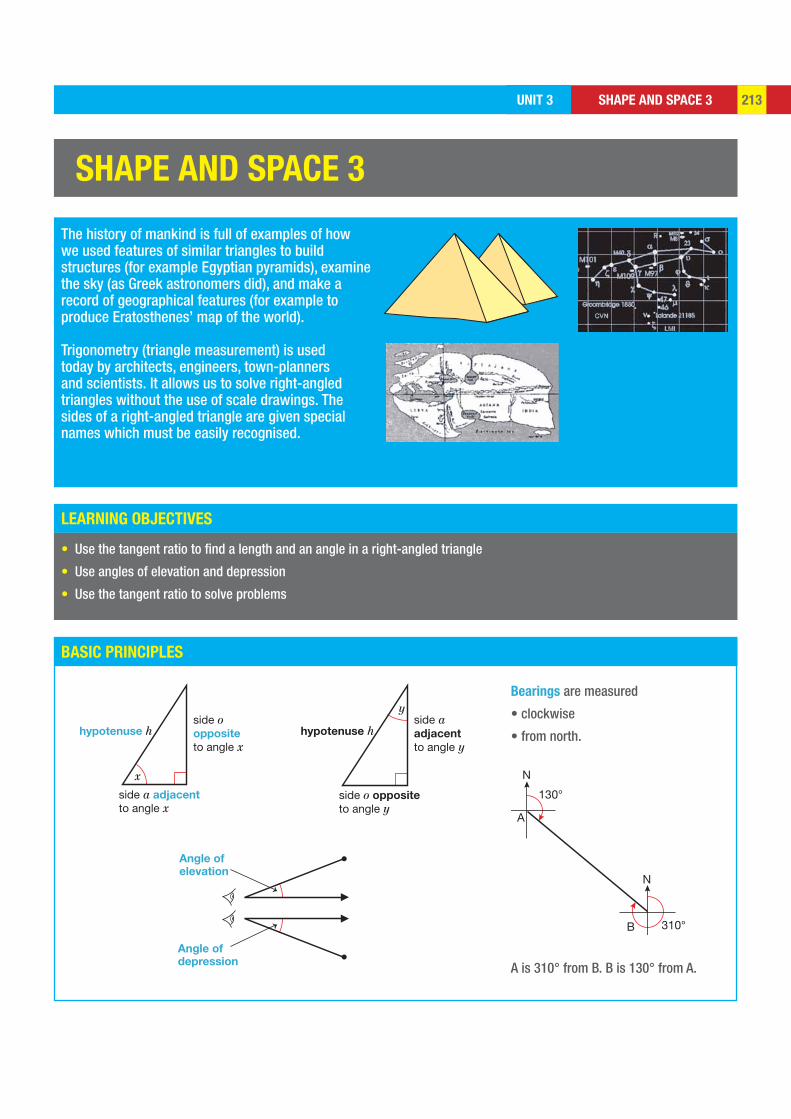
SHAPE AND SPACE 3UNIT 3 213
LEARNING OBJECTIVES
BASIC PRINCIPLES
x
side a adjacent
to angle x
side oopposite
to angle xhypotenuse h
y
side o opposite
to angle y
side aadjacent
to angle yhypotenuse h
Angle of
elevation
Angle of
depression
130°
310°
A
B
N
N
SHAPE AND SPACE 3
The history of mankind is full of examples of how we used features of similar triangles to build structures (for example Egyptian pyramids), examine the sky (as Greek astronomers did), and make a record of geographical features (for example to produce Eratosthenes’ map of the world). Trigonometry (triangle measurement) is used today by architects, engineers, town-planners and scientists. It allows us to solve right-angled triangles without the use of scale drawings. The sides of a right-angled triangle are given special names which must be easily recognised.
• Use the tangent ratio to find a length and an angle in a right-angled triangle
• Use angles of elevation and depression
• Use the tangent ratio to solve problems
Bearings are measured
• clockwise
• from north.
A is 310° from B. B is 130° from A.
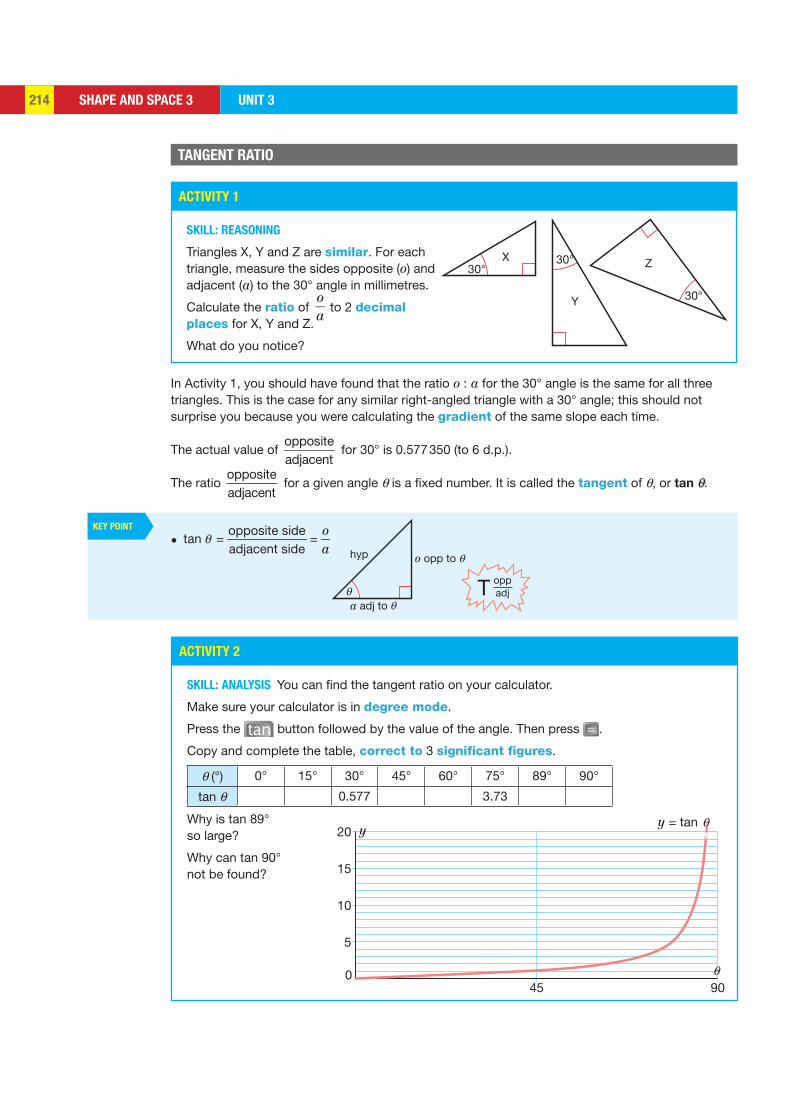
SHAPE AND SPACE 3 UNIT 3214
ACTIVITY 1
ACTIVITY 2
KEY POINT
oppadjT
30°X 30°
Y 30°
Z
hyp o opp to
a adj to θθ
θ
45
5
10
15
20y = tan
90
y
0 θ
θ
SKILL: REASONING
Triangles X, Y and Z are similar. For each triangle, measure the sides opposite (o) and adjacent (a) to the 30° angle in millimetres.
Calculate the ratio of oa
to 2 decimal places for X, Y and Z.
What do you notice?
SKILL: ANALYSIS You can find the tangent ratio on your calculator.
Make sure your calculator is in degree mode.
Press the tan button followed by the value of the angle. Then press .
Copy and complete the table, correct to 3 significant figures.
θ (°) 0° 15° 30° 45° 60° 75° 89° 90°
tan θ 0.577 3.73
Why is tan 89° so large?
Why can tan 90° not be found?
In Activity 1, you should have found that the ratio o : a for the 30° angle is the same for all three triangles. This is the case for any similar right-angled triangle with a 30° angle; this should not surprise you because you were calculating the gradient of the same slope each time.
The actual value of oppositeadjacent
for 30° is 0.577 350 (to 6 d.p.).
The ratio oppositeadjacent
for a given angle θ is a fixed number. It is called the tangent of θ, or tan θ.
•
= =opposite side
tan adjacent side
oa
θ
TANGENT RATIO
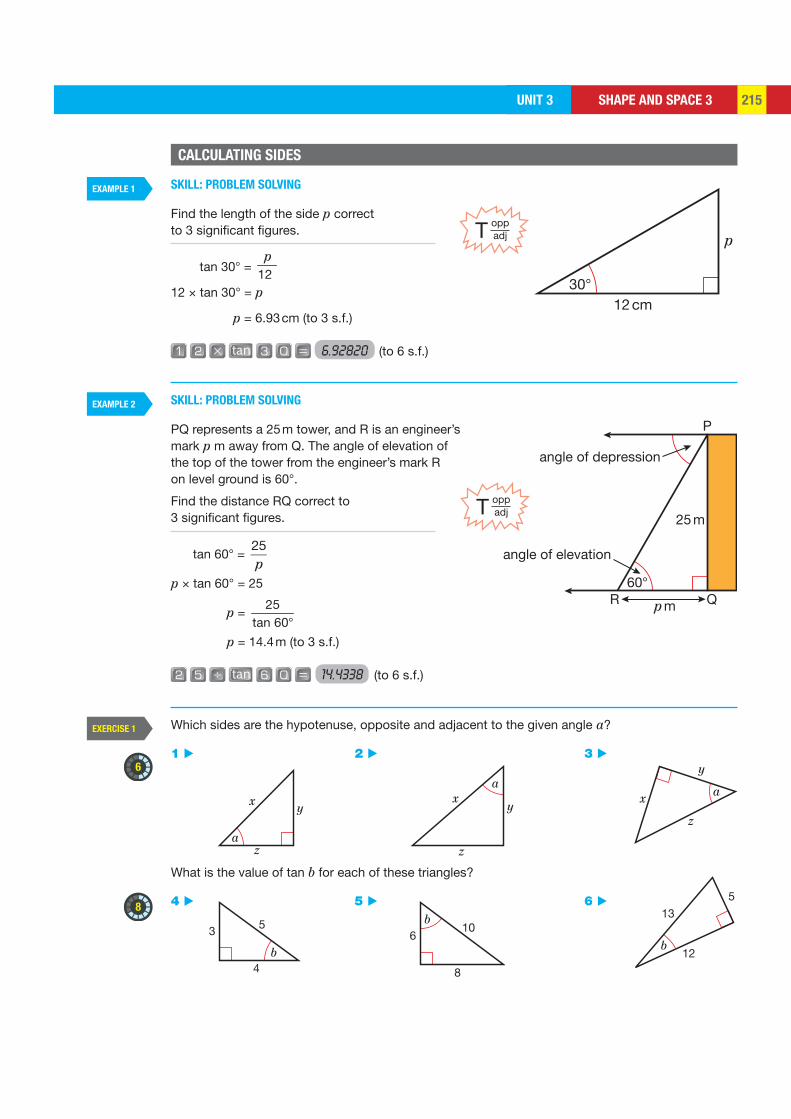
SHAPE AND SPACE 3UNIT 3 215
EXAMPLE 1
EXAMPLE 2
EXERCISE 1
6
8
30°
p
12 cm
oppadjT
60°
angle of depression
angle of elevation
R Q
P
25 m
p m
oppadjT
xy
za
a
yx
z
ax
y
z
b
3
4
5 b6
10
8
b
135
12
SKILL: PROBLEM SOLVING
Find the length of the side p correct to 3 significant figures.
tan 30° = 12 p
12 × tan 30° = p
p = 6.93 cm (to 3 s.f.)
tan 6.92820 (to 6 s.f.)
SKILL: PROBLEM SOLVING
PQ represents a 25 m tower, and R is an engineer’s mark p m away from Q. The angle of elevation of the top of the tower from the engineer’s mark R on level ground is 60°.
Find the distance RQ correct to 3 significant figures.
tan 60° = 25p
p × tan 60° = 25
p = °
25tan 60
p = 14.4 m (to 3 s.f.)
tan 14.4338 (to 6 s.f.)
Which sides are the hypotenuse, opposite and adjacent to the given angle a?
1 ▶ 2 ▶ 3 ▶
What is the value of tan b for each of these triangles?
4 ▶ 5 ▶ 6 ▶
CALCULATING SIDES
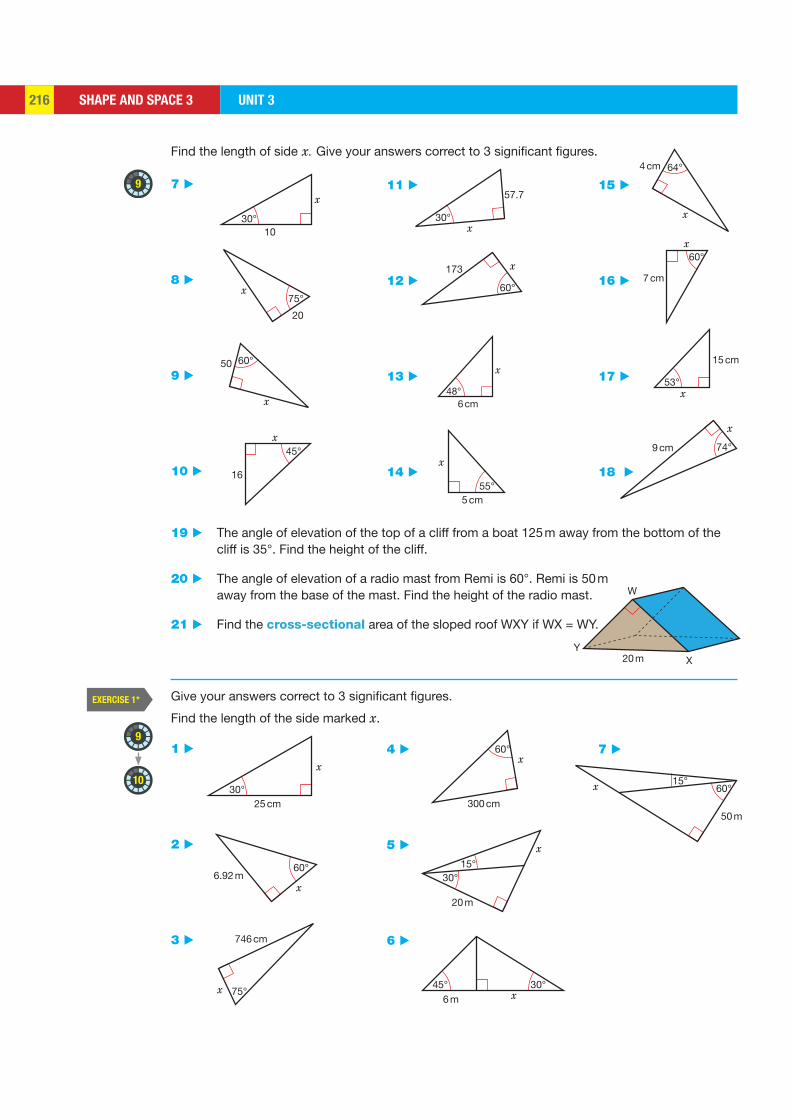
SHAPE AND SPACE 3 UNIT 3216
EXERCISE 1*
9
9
10
30°10
x
75°
20
x
60°50
x
16
45°x
57.7
30°x
60°
173 x
48°6 cm
x
55°5 cm
x
64°4 cm
x
60°
7 cm
x
53°
15 cm
x
74°9 cm
x
20 m
W
YX
30°25 cm
x
60°6.92 m
x
75°
746 cm
x
60°
300 cm
x
15°30°
20 m
x
45° 30°6 m x
50 m
60°15°x
Find the length of side x. Give your answers correct to 3 significant figures.
7 ▶
8 ▶
9 ▶
10 ▶
1 ▶
2 ▶
3 ▶
11 ▶
12 ▶
13 ▶
14 ▶
4 ▶
5 ▶
6 ▶
15 ▶
16 ▶
17 ▶
18 ▶
7 ▶
19 ▶ The angle of elevation of the top of a cliff from a boat 125 m away from the bottom of the cliff is 35°. Find the height of the cliff.
20 ▶ The angle of elevation of a radio mast from Remi is 60°. Remi is 50 m away from the base of the mast. Find the height of the radio mast.
21 ▶ Find the cross-sectional area of the sloped roof WXY if WX = WY.
Give your answers correct to 3 significant figures.
Find the length of the side marked x.
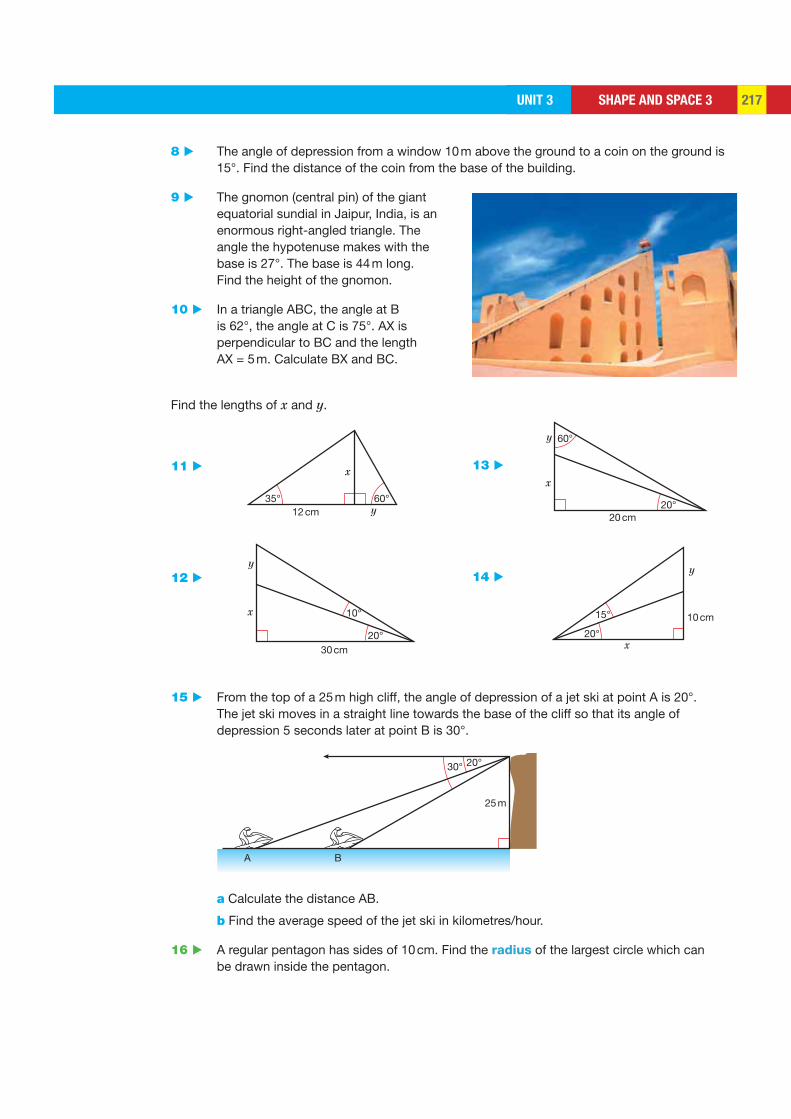
SHAPE AND SPACE 3UNIT 3 217
35°12 cm
60°
x
y
30 cm
10°
20°
x
y
20 cm20°
60°
x
y
10 cm
20°
15°
x
y
25 m
20°30°
BA
11 ▶
12 ▶
13 ▶
14 ▶
8 ▶ The angle of depression from a window 10 m above the ground to a coin on the ground is 15°. Find the distance of the coin from the base of the building.
9 ▶ The gnomon (central pin) of the giant equatorial sundial in Jaipur, India, is an enormous right-angled triangle. The angle the hypotenuse makes with the base is 27°. The base is 44 m long. Find the height of the gnomon.
10 ▶ In a triangle ABC, the angle at B is 62°, the angle at C is 75°. AX is perpendicular to BC and the length AX = 5 m. Calculate BX and BC.
Find the lengths of x and y.
15 ▶ From the top of a 25 m high cliff, the angle of depression of a jet ski at point A is 20°. The jet ski moves in a straight line towards the base of the cliff so that its angle of depression 5 seconds later at point B is 30°.
a Calculate the distance AB.
b Find the average speed of the jet ski in kilometres/hour.
16 ▶ A regular pentagon has sides of 10 cm. Find the radius of the largest circle which can be drawn inside the pentagon.
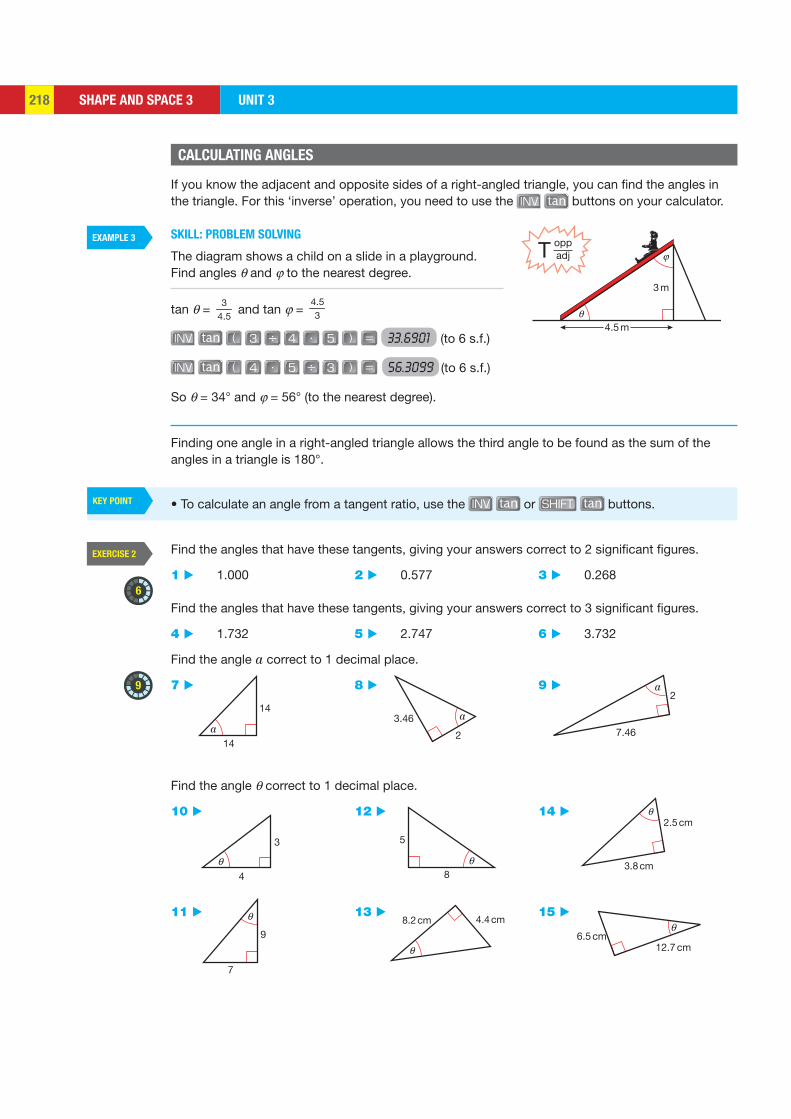
SHAPE AND SPACE 3 UNIT 3218
EXAMPLE 3
KEY POINT
EXERCISE 2
6
9
3 m
4.5 mθ
φoppadjT
14
14a
2
3.46 a
7.46
2a
3
4θ
7
9
θ
5
8θ
8.2 cm 4.4 cm
θ
3.8 cm
2.5 cmθ
6.5 cm12.7 cm
θ
If you know the adjacent and opposite sides of a right-angled triangle, you can find the angles in the triangle. For this ‘inverse’ operation, you need to use the tan buttons on your calculator.
SKILL: PROBLEM SOLVING
The diagram shows a child on a slide in a playground.Find angles θ and φ to the nearest degree.
tan θ = 3
4.5 and tan φ =
4.53
tan 33.6901 (to 6 s.f.)
tan 56.3099 (to 6 s.f.)
So θ = 34° and φ = 56° (to the nearest degree).
Finding one angle in a right-angled triangle allows the third angle to be found as the sum of the angles in a triangle is 180°.
Find the angles that have these tangents, giving your answers correct to 2 significant figures.
1 ▶ 1.000 2 ▶ 0.577 3 ▶ 0.268
Find the angles that have these tangents, giving your answers correct to 3 significant figures.
4 ▶ 1.732 5 ▶ 2.747 6 ▶ 3.732
Find the angle a correct to 1 decimal place.
7 ▶ 8 ▶ 9 ▶
Find the angle θ correct to 1 decimal place.
10 ▶ 12 ▶ 14 ▶
11 ▶ 13 ▶ 15 ▶
• To calculate an angle from a tangent ratio, use the tan or tan buttons.
CALCULATING ANGLES
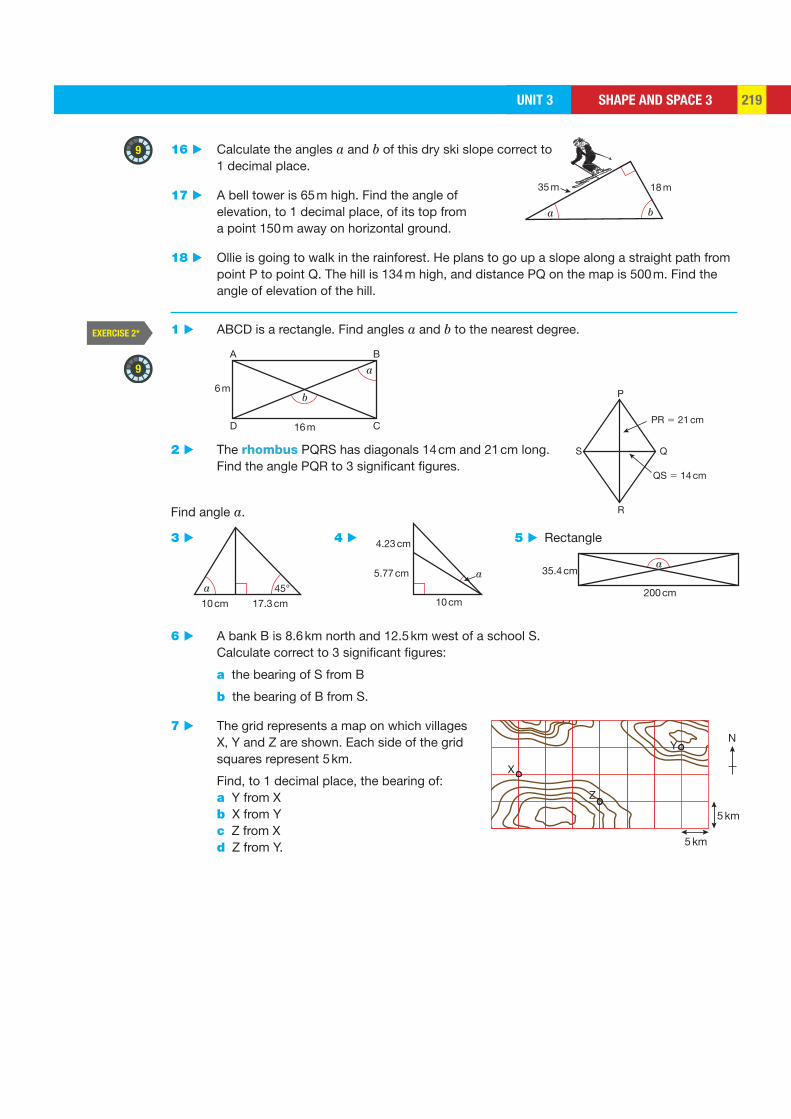
SHAPE AND SPACE 3UNIT 3 219
EXERCISE 2*
9
9
6 m
A
D C
B
16 m
b
a
PR 5 21 cm
QS 5 14 cm
P
QS
R
10 cm 17.3 cm
45°a5.77 cm
4.23 cm
10 cm
aa
35.4 cm
200 cm
Y
Z
X
5 km
5 km
N
a b
35 m 18 m
16 ▶ Calculate the angles a and b of this dry ski slope correct to 1 decimal place.
17 ▶ A bell tower is 65 m high. Find the angle of elevation, to 1 decimal place, of its top from a point 150 m away on horizontal ground.
18 ▶ Ollie is going to walk in the rainforest. He plans to go up a slope along a straight path from point P to point Q. The hill is 134 m high, and distance PQ on the map is 500 m. Find the angle of elevation of the hill.
1 ▶ ABCD is a rectangle. Find angles a and b to the nearest degree.
2 ▶ The rhombus PQRS has diagonals 14 cm and 21 cm long. Find the angle PQR to 3 significant figures.
Find angle a.
3 ▶ 4 ▶ 5 ▶ Rectangle
6 ▶ A bank B is 8.6 km north and 12.5 km west of a school S. Calculate correct to 3 significant figures:
a the bearing of S from B
b the bearing of B from S.
7 ▶ The grid represents a map on which villages X, Y and Z are shown. Each side of the grid squares represent 5 km.
Find, to 1 decimal place, the bearing of: a Y from X b X from Y c Z from X d Z from Y.
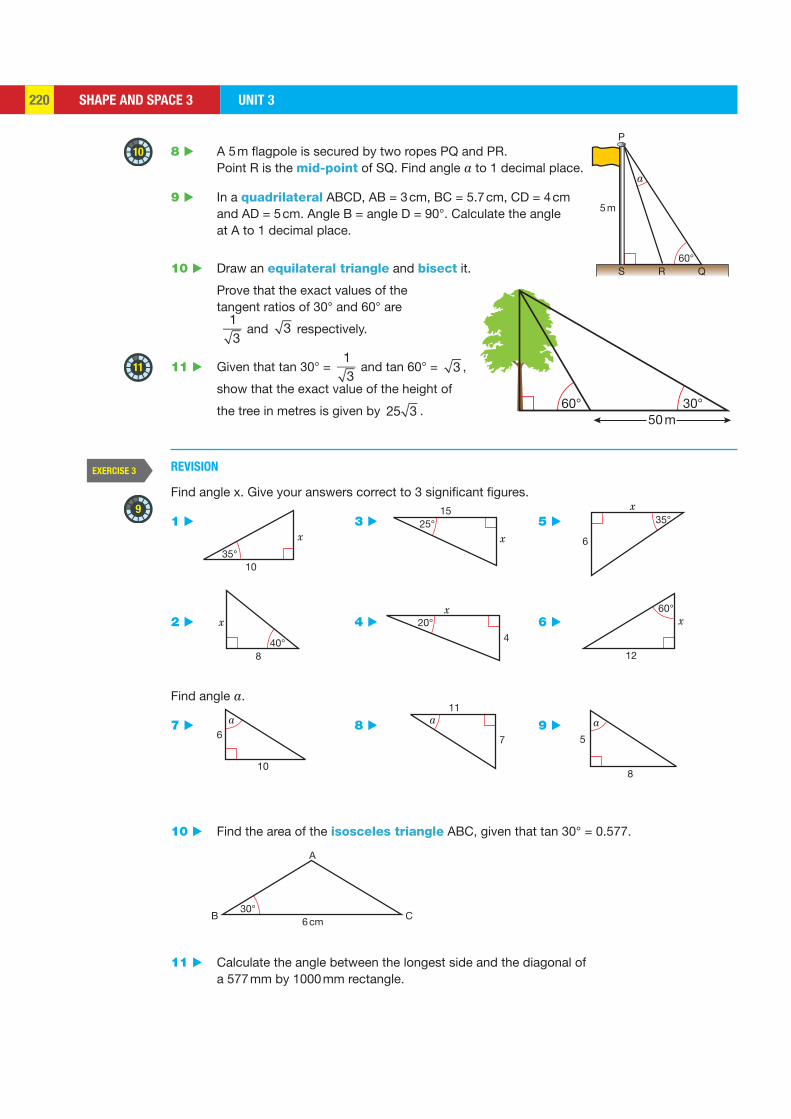
SHAPE AND SPACE 3 UNIT 3220
EXERCISE 3
10
11
9
50 m30°60°
35°10
x
40°8
x
25°15
x
20°4
x
35°
6
x
60°
12
x
6
10
a a11
7
a
5
8
B30°
6 cmC
A
P
a
5 m
60°S R Q
8 ▶ A 5 m flagpole is secured by two ropes PQ and PR. Point R is the mid-point of SQ. Find angle a to 1 decimal place.
9 ▶ In a quadrilateral ABCD, AB = 3 cm, BC = 5.7 cm, CD = 4 cm and AD = 5 cm. Angle B = angle D = 90°. Calculate the angle at A to 1 decimal place.
10 ▶ Draw an equilateral triangle and bisect it.
Prove that the exact values of the tangent ratios of 30° and 60° are
13
and 3 respectively.
11 ▶ Given that tan 30° = 13
and tan 60° = 3 ,
show that the exact value of the height of
the tree in metres is given by 25 3 .
REVISION
Find angle x. Give your answers correct to 3 significant figures.
1 ▶ 3 ▶ 5 ▶
2 ▶ 4 ▶ 6 ▶
Find angle a.
7 ▶ 8 ▶ 9 ▶
10 ▶ Find the area of the isosceles triangle ABC, given that tan 30° = 0.577.
11 ▶ Calculate the angle between the longest side and the diagonal of a 577 mm by 1000 mm rectangle.
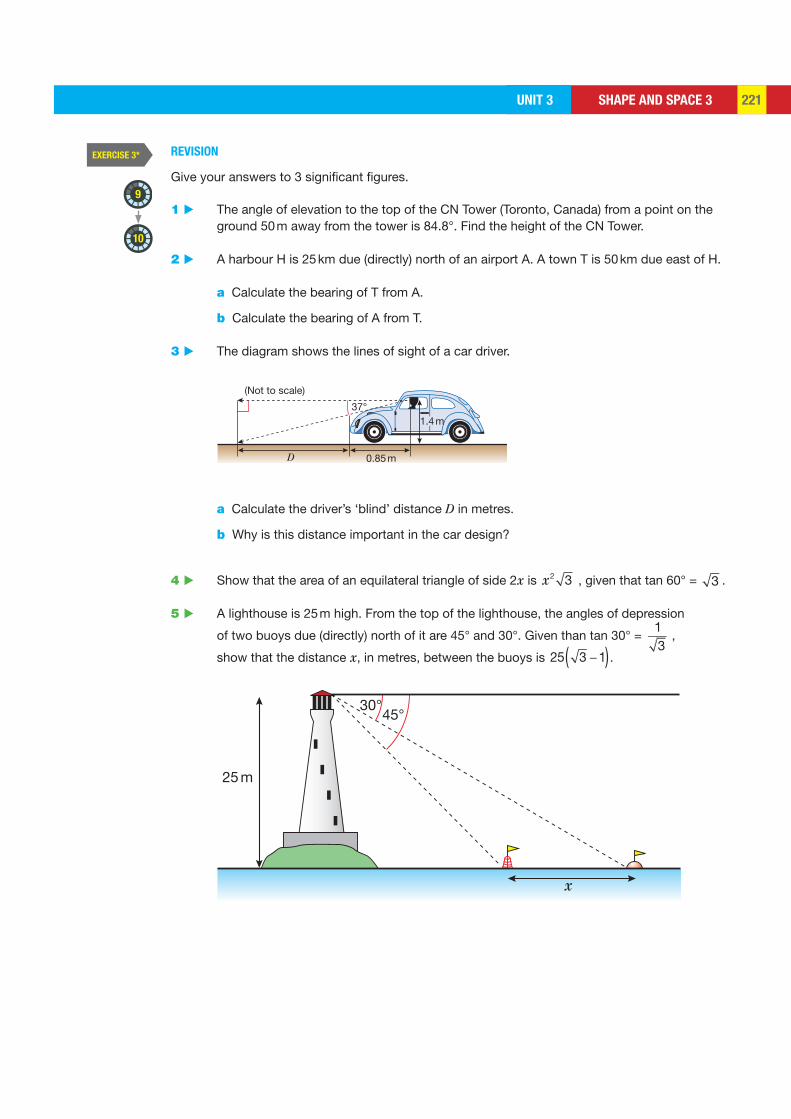
SHAPE AND SPACE 3UNIT 3 221
EXERCISE 3*
9
10
37°
(Not to scale)
0.85 mD
1.4 m
25 m
30°45°
x
REVISION
Give your answers to 3 significant figures.
1 ▶ The angle of elevation to the top of the CN Tower (Toronto, Canada) from a point on the ground 50 m away from the tower is 84.8°. Find the height of the CN Tower.
2 ▶ A harbour H is 25 km due (directly) north of an airport A. A town T is 50 km due east of H. a Calculate the bearing of T from A.
b Calculate the bearing of A from T.
3 ▶ The diagram shows the lines of sight of a car driver.
a Calculate the driver’s ‘blind’ distance D in metres.
b Why is this distance important in the car design?
4 ▶ Show that the area of an equilateral triangle of side 2x is x2 3 , given that tan 60° = 3 .
5 ▶ A lighthouse is 25 m high. From the top of the lighthouse, the angles of depression
of two buoys due (directly) north of it are 45° and 30°. Given than tan 30° = 13
,
show that the distance x, in metres, between the buoys is 25 3 1( ).
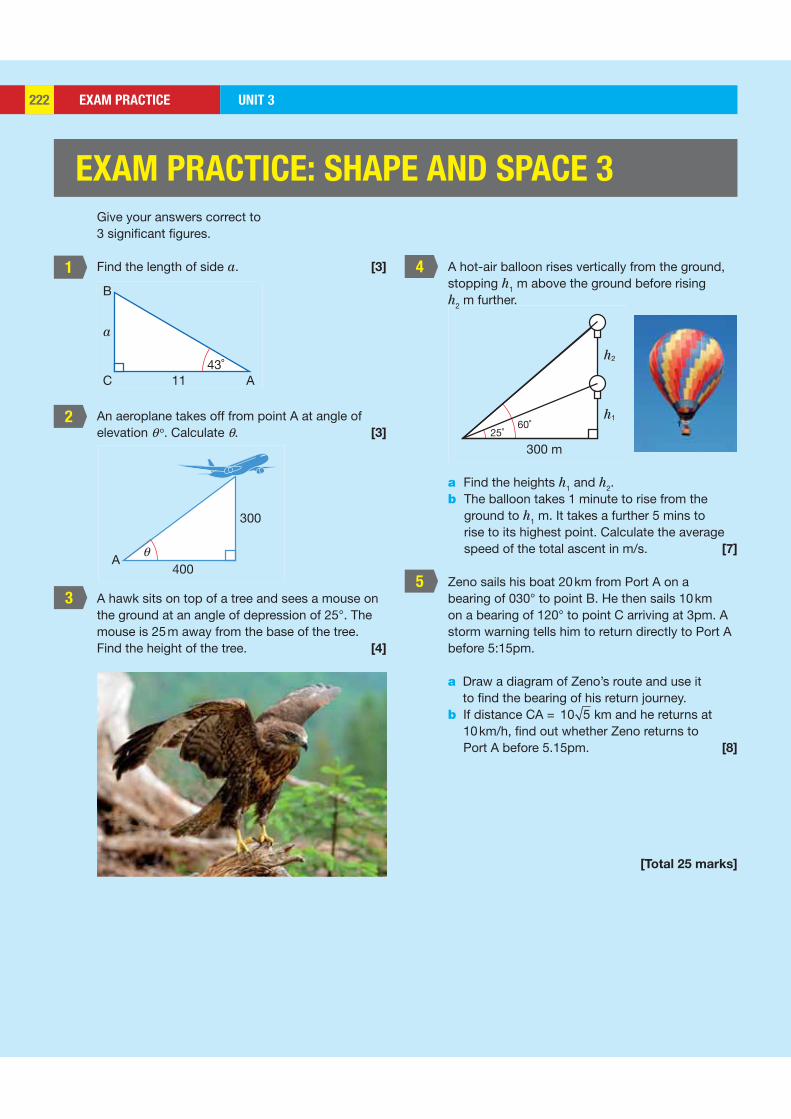
EXAM PRACTICE UNIT 3222222
1 4
5
2
3
B
a
C A1143˚
60˚25˚
300 m
h1
h2
Aθ
400
300
EXAM PRACTICE: SHAPE AND SPACE 3
Give your answers correct to 3 significant figures.
Find the length of side a. [3]
An aeroplane takes off from point A at angle of elevation θ o. Calculate θ. [3]
A hawk sits on top of a tree and sees a mouse on the ground at an angle of depression of 25°. The mouse is 25 m away from the base of the tree. Find the height of the tree. [4]
A hot-air balloon rises vertically from the ground, stopping h1 m above the ground before rising h2 m further.
a Find the heights h1 and h2.b The balloon takes 1 minute to rise from the
ground to h1 m. It takes a further 5 mins to rise to its highest point. Calculate the average speed of the total ascent in m/s. [7]
Zeno sails his boat 20 km from Port A on a bearing of 030° to point B. He then sails 10 km on a bearing of 120° to point C arriving at 3pm. A storm warning tells him to return directly to Port A before 5:15pm.
a Draw a diagram of Zeno’s route and use it to find the bearing of his return journey.
b If distance CA = 10 5 km and he returns at 10 km/h, find out whether Zeno returns to Port A before 5.15pm. [8]
[Total 25 marks]
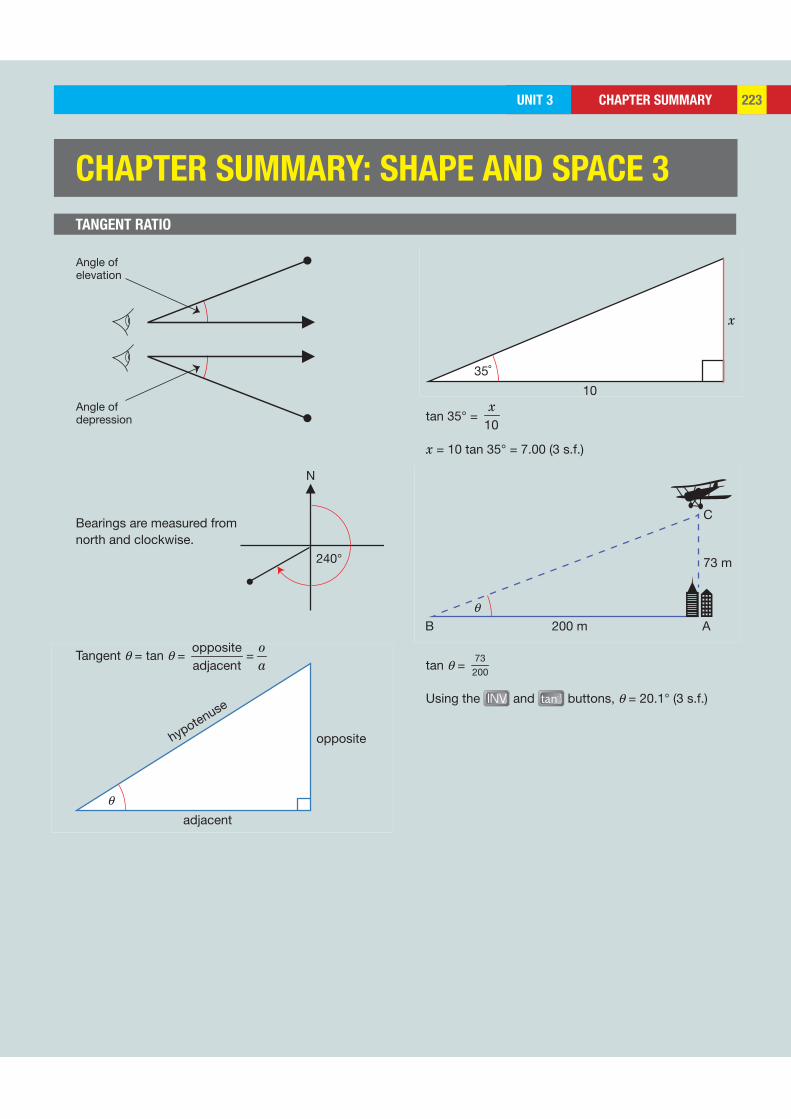
CHAPTER SUMMARYUNIT 3 223223
Angle ofelevation
Angle ofdepression
N
240°
35˚
10
x
θ
hypotenuse
opposite
adjacent
200 mB Aθ
C
73 m
CHAPTER SUMMARY: SHAPE AND SPACE 3
tan 35° = 10x
x = 10 tan 35° = 7.00 (3 s.f.)
tan θ = 73200
Using the and tan-1 buttons, θ = 20.1° (3 s.f.)
Bearings are measured from north and clockwise.
Tangent θ = tan θ = =oppositeadjacent
oa
TANGENT RATIO

HANDLING DATA 2 UNIT 3224
LEARNING OBJECTIVES
BASIC PRINCIPLES
HANDLING DATA 2
One of the largest collections of numerical data in the 1940s was gathered to decode secret radio messages. This took place under the guidance of the code-breaker Alan Turing (1912–1954) who used early computers to find patterns in data that at first appeared to be random.
Frequency tables allowed his team to see these patterns more efficiently.
▲ Alan Turing
• Estimate the mean and range from a grouped frequency table
• Find the modal class and the group containing the median
• To collect and find patterns in large amounts of data, it is necessary to group the information together and use frequency tables.
A quick way to do this is by tally tables that allow fast calculation of frequency.
Tally marks are arranged into groups of five to make counting faster, allowing frequencies to be displayed.
Note: represents 5, represents 4, represents 3 etc.
TYPE OF PET TALLY FREQUENCY
Dog 11
Cat 7
Goldfish 6
Guinea pig 3
Hamster 2
Lizard 1
Tortoise 1
Rabbit 3

HANDLING DATA 2UNIT 3 225
EXAMPLE 1
FREQUENCY TABLES
DISCRETE DATA
SKILL: ANALYSIS
A teacher records how many times 20 pupils are late to class in a school year.
1 5 3 4 2 0 0 4 5 5
3 4 4 5 1 3 3 4 5 5
a Work out the mean number of late arrivals.
b Work out the median number of late arrivals.
c Write down the mode of the data.
d Draw a bar chart for the data.
x represents the recorded number of late arrivals.
x TALLY FREQUENCY f f × x
0 2 2 × 0 = 0
1 2 2 × 1 = 2
2 1 1 × 2 = 2
3 4 4 × 3 = 12
4 5 5 × 4 = 20
5 6 6 × 5 = 30
∑f = 20 ∑fx = 66
• Mean = total of all values
total number of values
• Median = value of the middle number when data is ordered in ascending or descending order
• Mode = number that occurs most frequently
• Discrete data can only be integer values (number of people, goals, boats…).
• Continuous data can have any value in a particular range (time, speed, weight…).
• The symbol sigma ∑ is used many times in statistics as a quick way to write ‘adding up’ of a particular quantity.
The fourth column (f × x) produces a value for the 0’s and the 1’s and the 2’s etc.
Therefore the sum of the fx column, ∑fx = the total of all the values.
Data can be summarised efficiently in a frequency table.
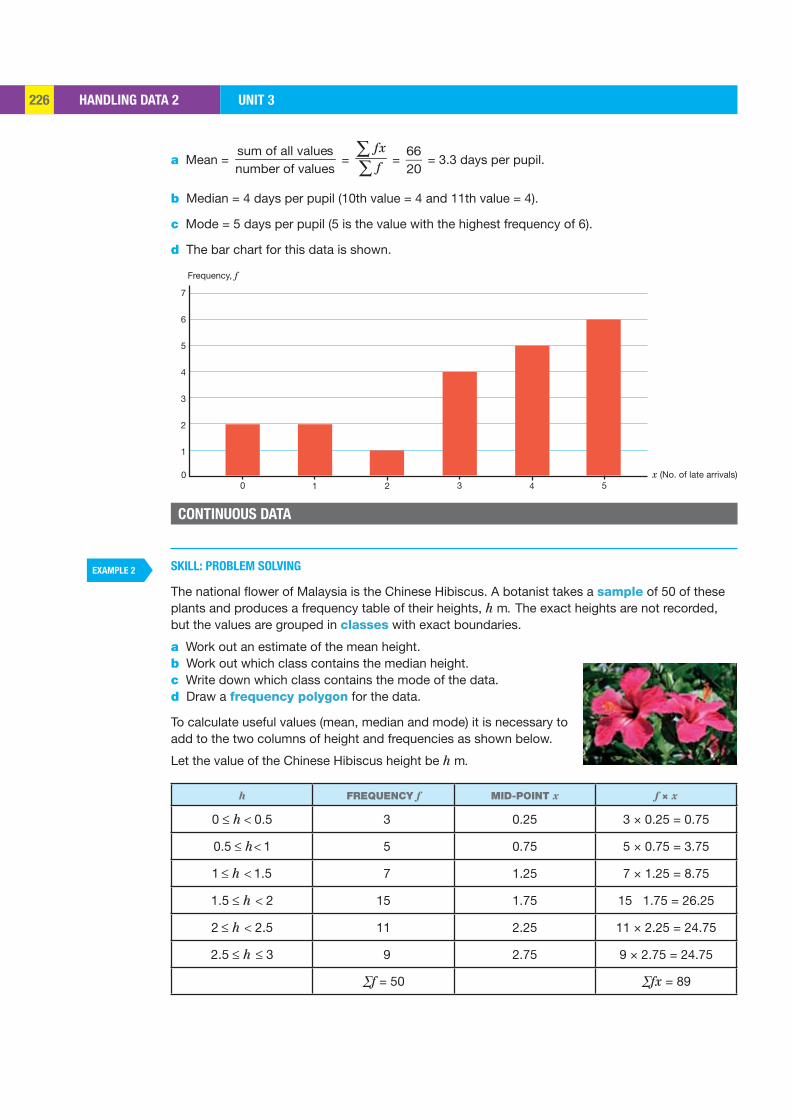
HANDLING DATA 2 UNIT 3226
EXAMPLE 2
Frequency, f
7
6
5
4
3
2
1
10
0 2 3 4x (No. of late arrivals)
5
a Mean = sum of all valuesnumber of values
= ∑∑
fx
f = 6620
= 3.3 days per pupil.
b Median = 4 days per pupil (10th value = 4 and 11th value = 4).
c Mode = 5 days per pupil (5 is the value with the highest frequency of 6).
d The bar chart for this data is shown.
CONTINUOUS DATA
SKILL: PROBLEM SOLVING
The national flower of Malaysia is the Chinese Hibiscus. A botanist takes a sample of 50 of these plants and produces a frequency table of their heights, h m. The exact heights are not recorded, but the values are grouped in classes with exact boundaries.
a Work out an estimate of the mean height.b Work out which class contains the median height.c Write down which class contains the mode of the data.d Draw a frequency polygon for the data.
To calculate useful values (mean, median and mode) it is necessary to add to the two columns of height and frequencies as shown below.
Let the value of the Chinese Hibiscus height be h m.
h FREQUENCY f MID-POINT x f × x
≤ <0 0.5h 3 0.25 3 × 0.25 = 0.75
≤ <0.5 1h 5 0.75 5 × 0.75 = 3.75
≤ < 1 1.5h 7 1.25 7 × 1.25 = 8.75
≤ <1.5 2h 15 1.75 15 1.75 = 26.25
≤ <2 2.5h 11 2.25 11 × 2.25 = 24.75
≤ ≤2.5 3h 9 2.75 9 × 2.75 = 24.75
∑f = 50 ∑fx = 89
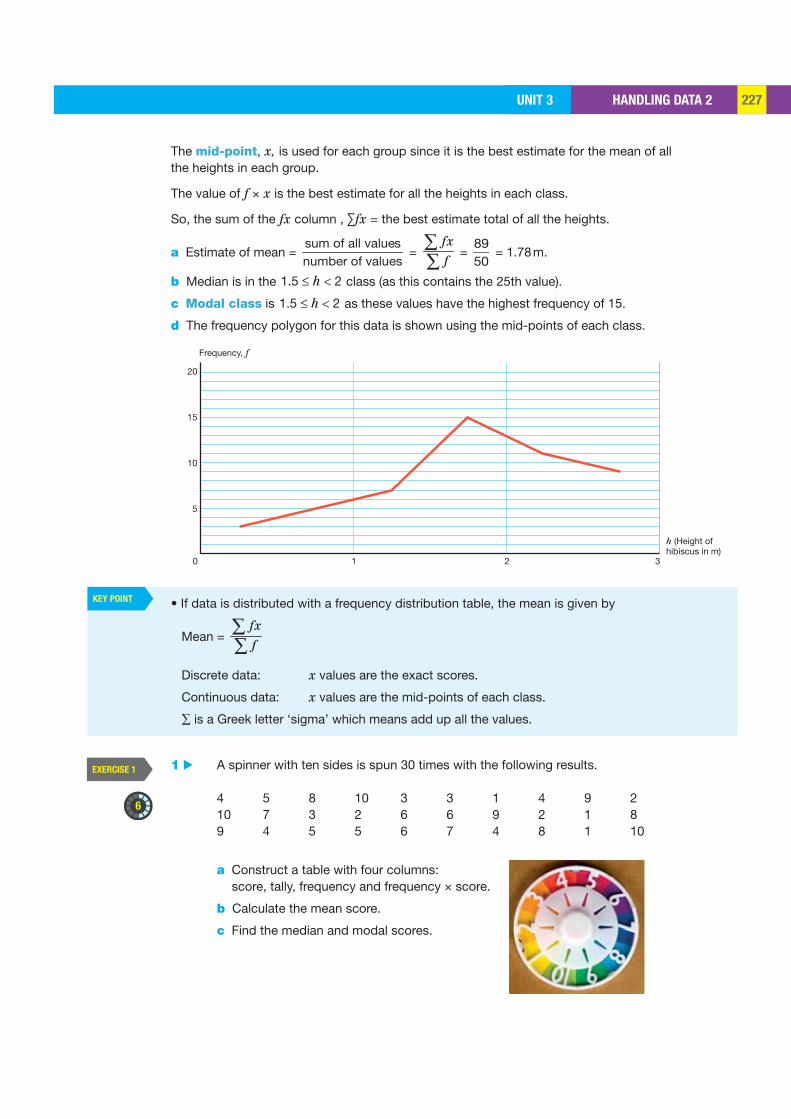
HANDLING DATA 2UNIT 3 227
KEY POINT
EXERCISE 1
6
Frequency, f
20
15
10
5
10 2
h (Height of hibiscus in m)
3
The mid-point, x, is used for each group since it is the best estimate for the mean of all the heights in each group.
The value of f × x is the best estimate for all the heights in each class.
So, the sum of the fx column , ∑fx = the best estimate total of all the heights.
a Estimate of mean = sum of all valuesnumber of values
= ∑∑
fx
f =
8950
= 1.78 m.
b Median is in the 1.5 ≤ h < 2 class (as this contains the 25th value).
c Modal class is 1.5 ≤ h < 2 as these values have the highest frequency of 15.
d The frequency polygon for this data is shown using the mid-points of each class.
• If data is distributed with a frequency distribution table, the mean is given by
Mean = ∑∑
fx
f
Discrete data: x values are the exact scores.
Continuous data: x values are the mid-points of each class.
∑ is a Greek letter ‘sigma’ which means add up all the values.
1 ▶ A spinner with ten sides is spun 30 times with the following results. 4 5 8 10 3 3 1 4 9 2 10 7 3 2 6 6 9 2 1 8 9 4 5 5 6 7 4 8 1 10
a Construct a table with four columns: score, tally, frequency and frequency × score.
b Calculate the mean score.
c Find the median and modal scores.
HANDLING DATA 2 UNIT 3228
2 ▶ The number of pupils who went to a ‘Mandarin for Beginners’ club for 20 lessons is shown.
4 5 6 10 12 8 5 7 7 4 7 8 9 12 12 8 7 9 9 11
a Construct a table with four columns: number of pupils, tally, frequency and frequency × number.
b Calculate the mean number.
c Find the median and modal numbers.
3 ▶ The table shows information about the number of presents, x, received by 50 teenagers on their 16th birthdays.
a Copy this table and use it to calculate the mean number of presents received.
b Find the median and modal number of presents.
4 ▶ The table shows Winnie’s scores in her weekly Spanish vocabulary tests.
a Copy this table and use it to calculate her mean score.
b Find the median and modal score.
NUMBER OF PRESENTS x FREQUENCY f
1 5
2 21
3 17
4 7
TEST SCORE x FREQUENCY f
5 4
6 6
7 3
8 12
9 3
10 2
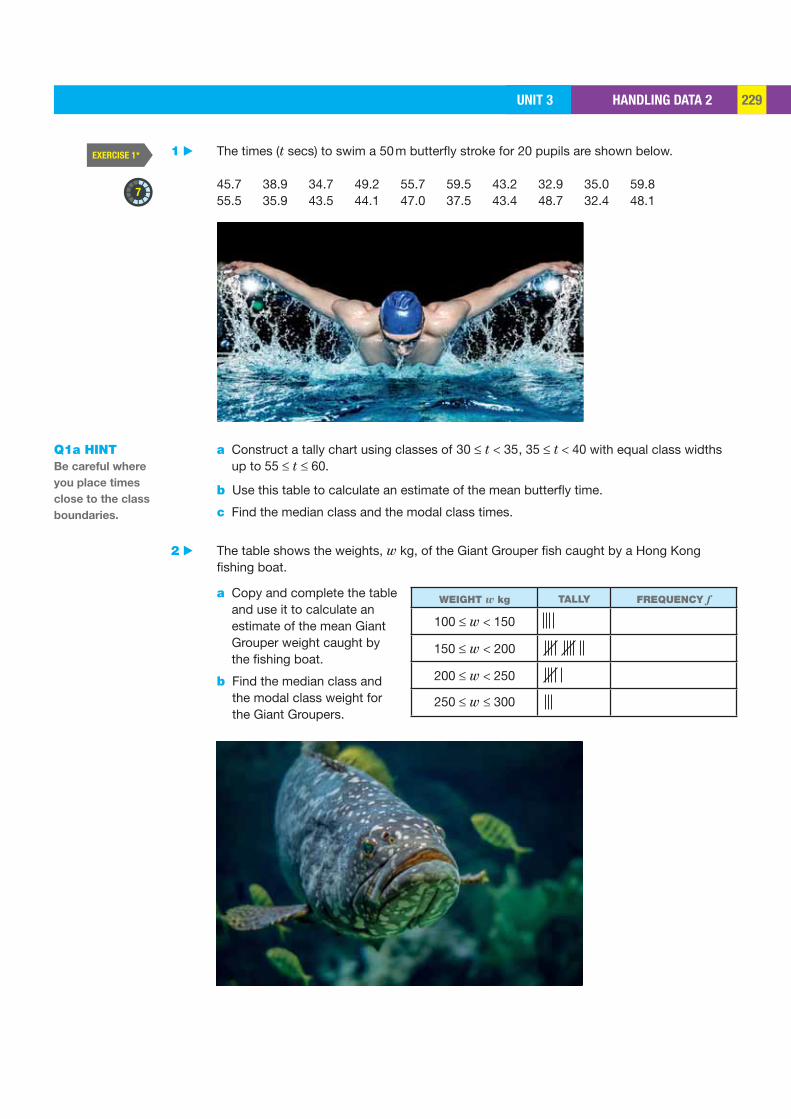
HANDLING DATA 2UNIT 3 229
EXERCISE 1*
7
1 ▶ The times (t secs) to swim a 50 m butterfly stroke for 20 pupils are shown below.
45.7 38.9 34.7 49.2 55.7 59.5 43.2 32.9 35.0 59.8 55.5 35.9 43.5 44.1 47.0 37.5 43.4 48.7 32.4 48.1
a Construct a tally chart using classes of 30 ≤ t < 35, 35 ≤ t < 40 with equal class widths up to 55 ≤ t ≤ 60.
b Use this table to calculate an estimate of the mean butterfly time.
c Find the median class and the modal class times.
2 ▶ The table shows the weights, w kg, of the Giant Grouper fish caught by a Hong Kong fishing boat.
a Copy and complete the table and use it to calculate an estimate of the mean Giant Grouper weight caught by the fishing boat.
b Find the median class and the modal class weight for the Giant Groupers.
Q1a HINT Be careful where
you place times
close to the class
boundaries.
WEIGHT w kg TALLY FREQUENCY f
100 ≤ w < 150
150 ≤ w < 200
200 ≤ w < 250
250 ≤ w ≤ 300
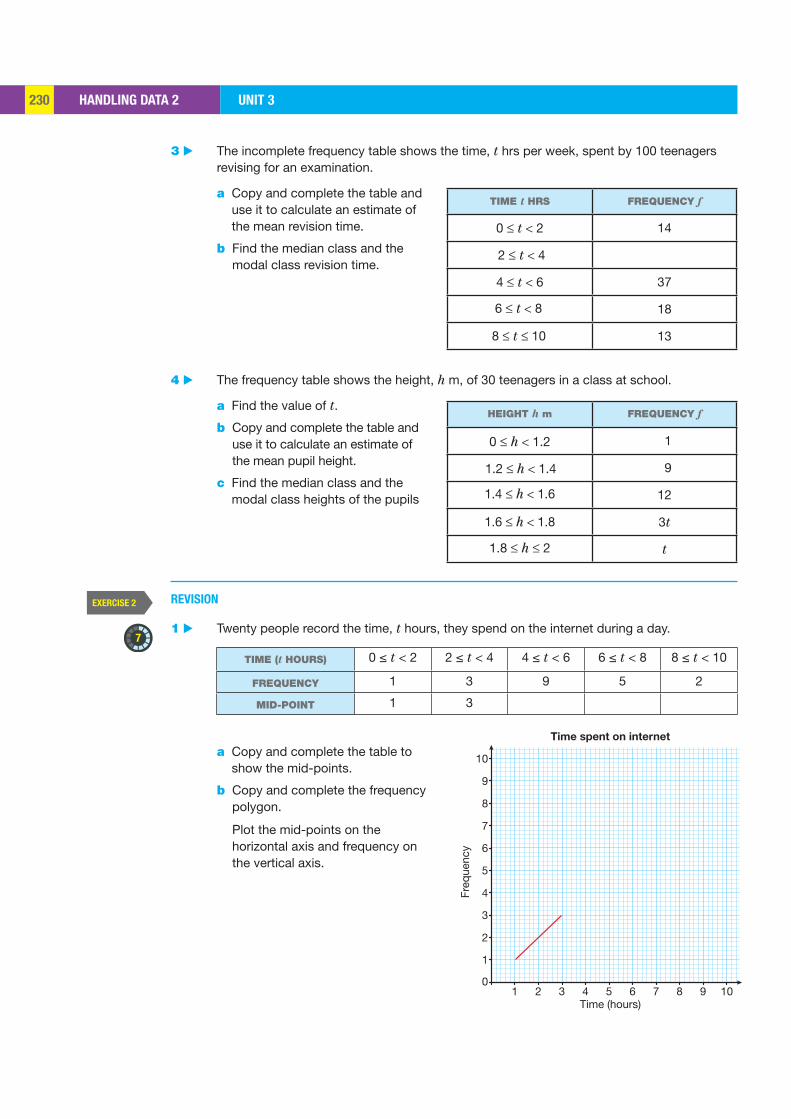
HANDLING DATA 2 UNIT 3230
EXERCISE 2
7
1
0
2
3
4
5
6
7
9
10
8
Freq
uenc
y
Time spent on internet
Time (hours)1 2 3 4 5 6 7 8 9 10
3 ▶ The incomplete frequency table shows the time, t hrs per week, spent by 100 teenagers revising for an examination.
a Copy and complete the table and use it to calculate an estimate of the mean revision time.
b Find the median class and the modal class revision time.
4 ▶ The frequency table shows the height, h m, of 30 teenagers in a class at school.
a Find the value of t.
b Copy and complete the table and use it to calculate an estimate of the mean pupil height.
c Find the median class and the modal class heights of the pupils
REVISION
1 ▶ Twenty people record the time, t hours, they spend on the internet during a day.
TIME (t HOURS) 0 ≤ t < 2 2 ≤ t < 4 4 ≤ t < 6 6 ≤ t < 8 8 ≤ t < 10
FREQUENCY 1 3 9 5 2
MID-POINT 1 3
a Copy and complete the table to show the mid-points.
b Copy and complete the frequency polygon. Plot the mid-points on the horizontal axis and frequency on the vertical axis.
TIME t HRS FREQUENCY f
0 ≤ t < 2 14
2 ≤ t < 4
4 ≤ t < 6 37
6 ≤ t < 8 18
8 ≤ t ≤ 10 13
HEIGHT h m FREQUENCY f
0 ≤ h < 1.2 1
1.2 ≤ h < 1.4 9
1.4 ≤ h < 1.6 12
1.6 ≤ h < 1.8 3t
1.8 ≤ h ≤ 2 t
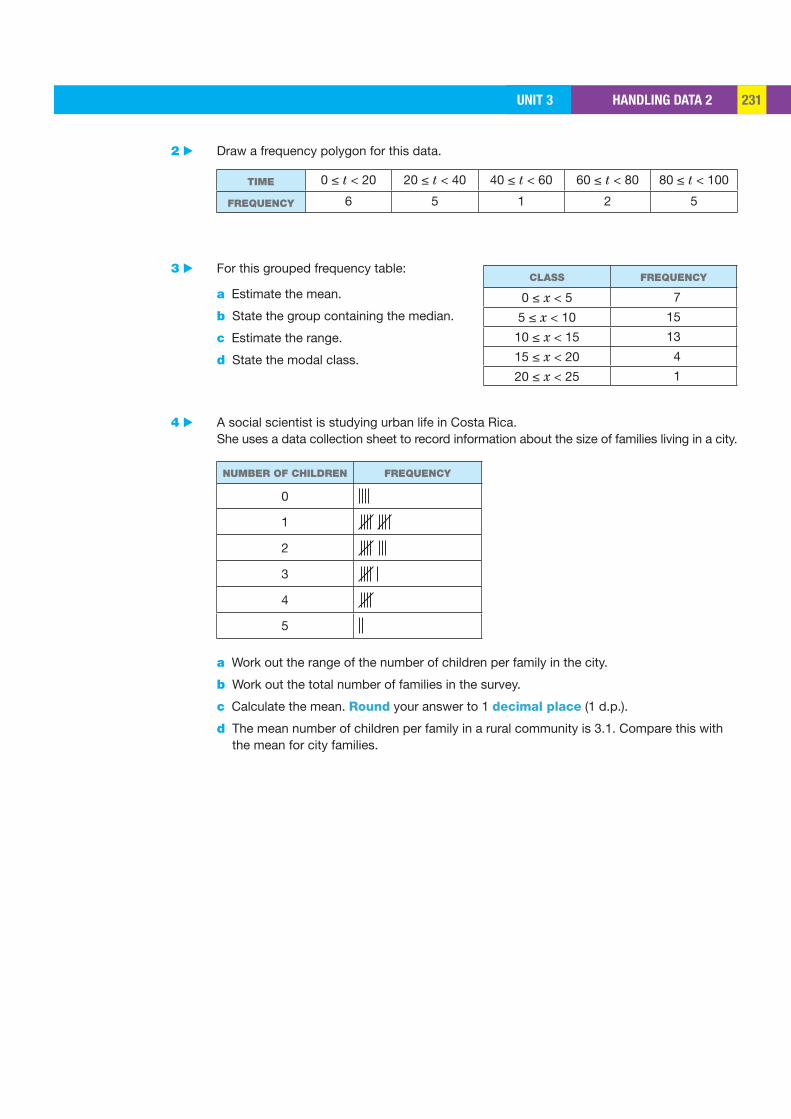
HANDLING DATA 2UNIT 3 231
2 ▶ Draw a frequency polygon for this data.
TIME 0 ≤ t < 20 20 ≤ t < 40 40 ≤ t < 60 60 ≤ t < 80 80 ≤ t < 100
FREQUENCY 6 5 1 2 5
3 ▶ For this grouped frequency table:
a Estimate the mean.
b State the group containing the median.
c Estimate the range.
d State the modal class.
4 ▶ A social scientist is studying urban life in Costa Rica. She uses a data collection sheet to record information about the size of families living in a city.
NUMBER OF CHILDREN FREQUENCY
0
1
2
3
4
5
a Work out the range of the number of children per family in the city.
b Work out the total number of families in the survey.
c Calculate the mean. Round your answer to 1 decimal place (1 d.p.).
d The mean number of children per family in a rural community is 3.1. Compare this with the mean for city families.
CLASS FREQUENCY
0 ≤ x < 5 7
5 ≤ x < 10 15
10 ≤ x < 15 13
15 ≤ x < 20 4
20 ≤ x < 25 1
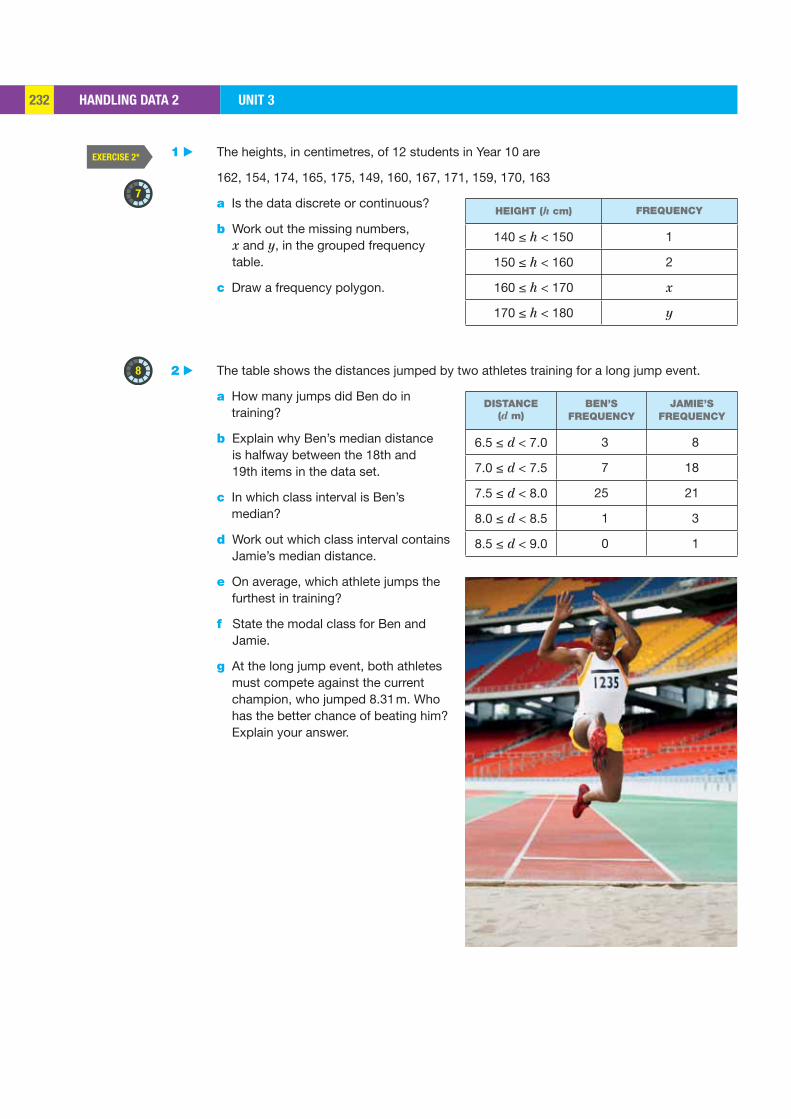
HANDLING DATA 2 UNIT 3232
EXERCISE 2*
7
8
1 ▶ The heights, in centimetres, of 12 students in Year 10 are
162, 154, 174, 165, 175, 149, 160, 167, 171, 159, 170, 163
a Is the data discrete or continuous?
b Work out the missing numbers, x and y, in the grouped frequency table.
c Draw a frequency polygon.
2 ▶ The table shows the distances jumped by two athletes training for a long jump event.
a How many jumps did Ben do in training?
b Explain why Ben’s median distance is halfway between the 18th and 19th items in the data set.
c In which class interval is Ben’s median?
d Work out which class interval contains Jamie’s median distance.
e On average, which athlete jumps the furthest in training?
f State the modal class for Ben and Jamie.
g At the long jump event, both athletes must compete against the current champion, who jumped 8.31 m. Who has the better chance of beating him? Explain your answer.
HEIGHT (h cm) FREQUENCY
140 ≤ h < 150 1
150 ≤ h < 160 2
160 ≤ h < 170 x
170 ≤ h < 180 y
DISTANCE (d m)
BEN’S FREQUENCY
JAMIE’S FREQUENCY
6.5 ≤ d < 7.0 3 8
7.0 ≤ d < 7.5 7 18
7.5 ≤ d < 8.0 25 21
8.0 ≤ d < 8.5 1 3
8.5 ≤ d < 9.0 0 1

HANDLING DATA 2UNIT 3 233UNIT 3 233
10
3 ▶ The table shows the age distribution of male and female teachers in a school.
a Draw frequency polygons for these two sets of data on the same diagram.
b By calculating the mean of each data set, compare the age distributions of male and female teachers.
c What feature of your diagram confirms that your comparison is correct?
4 ▶ A biologist measures the lengths of 40 fish and records the results in a grouped frequency table.
LENGTH (L cm) 0 ≤ L < 10 10 ≤ L < x x ≤ L < 3x
FREQUENCY 6 24 10
Find x if the mean length is 15.75 cm.
AGE (x YEARS)
MALE FEMALE
20 ≤ x < 25 1 0
25 ≤ x < 30 2 9
30 ≤ x < 35 3 10
35 ≤ x < 40 7 12
40 ≤ x < 45 10 8
45 ≤ x < 50 10 7
50 ≤ x < 55 12 4
55 ≤ x < 60 4 0
60 ≤ x < 65 1 0
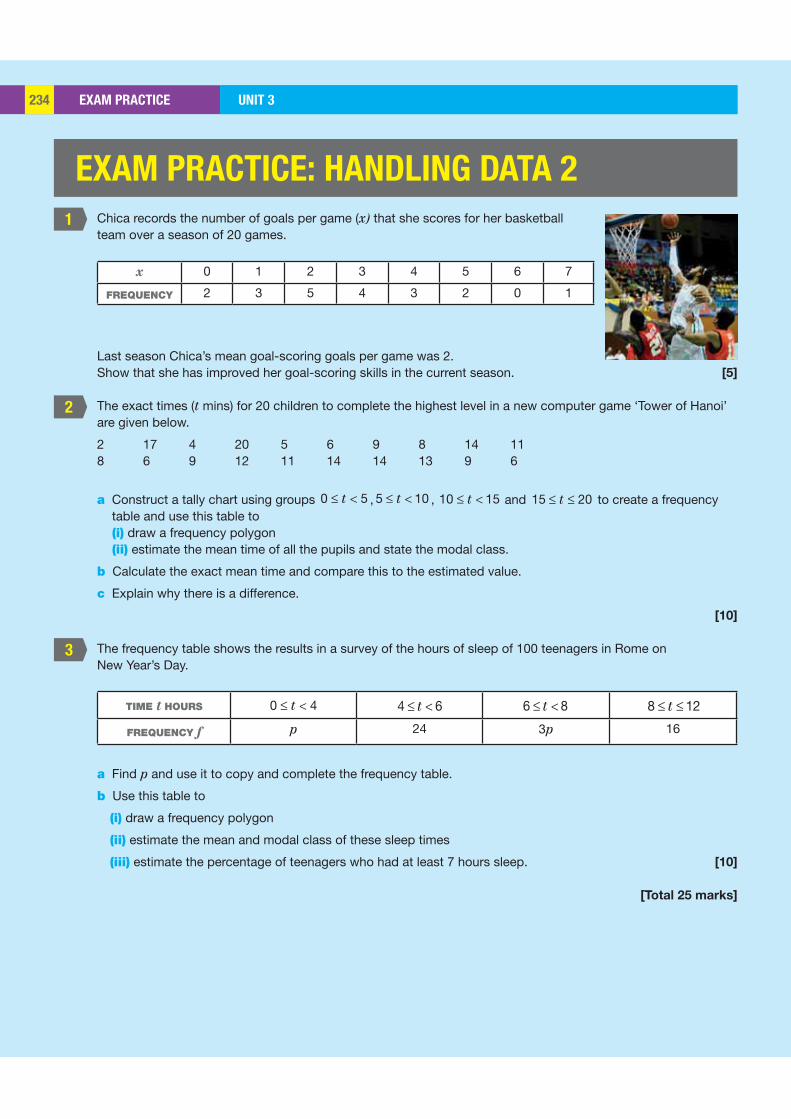
EXAM PRACTICE UNIT 3234 UNIT 3234
1
2
3
EXAM PRACTICE: HANDLING DATA 2
Chica records the number of goals per game (x) that she scores for her basketball team over a season of 20 games.
x 0 1 2 3 4 5 6 7
FREQUENCY 2 3 5 4 3 2 0 1
Last season Chica’s mean goal-scoring goals per game was 2. Show that she has improved her goal-scoring skills in the current season. [5]
The exact times (t mins) for 20 children to complete the highest level in a new computer game ‘Tower of Hanoi’ are given below.
2 17 4 20 5 6 9 8 14 118 6 9 12 11 14 14 13 9 6
a Construct a tally chart using groups ≤ <0 5t , ≤ <5 10t , ≤ < 10 15 t and ≤ ≤15 20t to create a frequency table and use this table to (i) draw a frequency polygon (ii) estimate the mean time of all the pupils and state the modal class.
b Calculate the exact mean time and compare this to the estimated value.
c Explain why there is a difference.
[10]
The frequency table shows the results in a survey of the hours of sleep of 100 teenagers in Rome on New Year’s Day.
TIME t HOURS ≤ <0 4t 4 t 6≤ < 6 t 8≤ < 8 t 12≤ ≤
FREQUENCY f p 24 3p 16
a Find p and use it to copy and complete the frequency table.
b Use this table to
(i) draw a frequency polygon
(ii) estimate the mean and modal class of these sleep times
(iii) estimate the percentage of teenagers who had at least 7 hours sleep. [10]
[Total 25 marks]
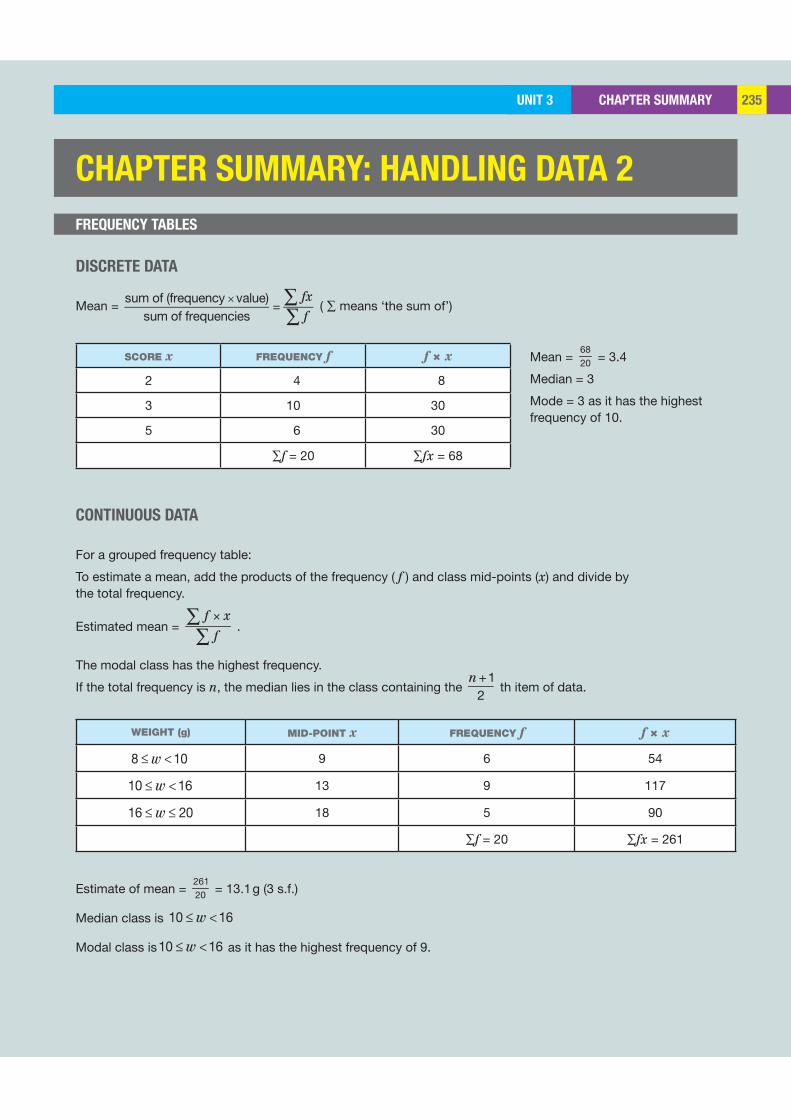
CHAPTER SUMMARYUNIT 3 235UNIT 3 235
CHAPTER SUMMARY: HANDLING DATA 2
FREQUENCY TABLES
DISCRETE DATA
Mean = sum of (frequency value)
sum of frequencies=
fxf
× ( ∑ means ‘the sum of’)
SCORE x FREQUENCY f f × x
2 4 8
3 10 30
5 6 30
∑f = 20 ∑fx = 68
CONTINUOUS DATA
For a grouped frequency table:
To estimate a mean, add the products of the frequency ( f ) and class mid-points (x) and divide by the total frequency.
Estimated mean = ×∑
∑f x
f .
The modal class has the highest frequency.
If the total frequency is n, the median lies in the class containing the n +1
2 th item of data.
WEIGHT (g) MID-POINT x FREQUENCY f f × x
8 w 10 ≤ < 9 6 54
10 w 16≤ < 13 9 117
16 w 20≤ ≤ 18 5 90
∑f = 20 ∑fx = 261
Estimate of mean = 26120 = 13.1 g (3 s.f.)
Median class is 10 w 16≤ <
Modal class is10 w 16≤ < as it has the highest frequency of 9.
Mean = 6820 = 3.4
Median = 3
Mode = 3 as it has the highest frequency of 10.
UNIT 4 NUMBER 237 ALGEBRA 247 GRAPHS 259 SHAPE AND SPACE 271 HANDLING DATA 285
4 is the lowest square of a prime number. It is the smallest number of colours needed to shade a map so that no neighbouring countries are the same colour. Also if x and y are integers, x2 – y2 is divisible by 4 only when (x – y) is an even number.
4 is the lowest honest number. These are numbers n that can be described using exactly n letters in English.
4-leaf clovers are rare and are considered to be lucky plants!
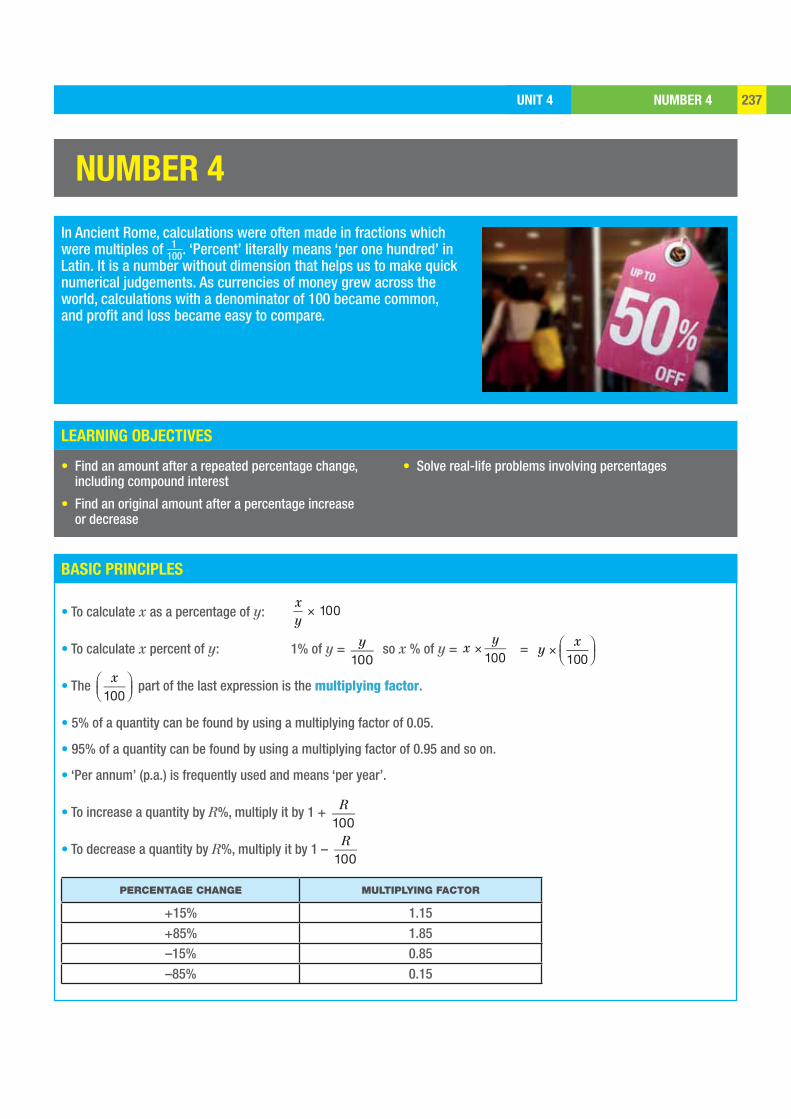
NUMBER 4UNIT 4 237
LEARNING OBJECTIVES
BASIC PRINCIPLES
NUMBER 4
In Ancient Rome, calculations were often made in fractions which were multiples of . ‘Percent’ literally means ‘per one hundred’ in Latin. It is a number without dimension that helps us to make quick numerical judgements. As currencies of money grew across the world, calculations with a denominator of 100 became common, and profit and loss became easy to compare.
• Find an amount after a repeated percentage change, including compound interest
• Find an original amount after a percentage increase or decrease
• Solve real-life problems involving percentages
• To calculate x as a percentage of y: xy
100×
• To calculate x percent of y: 1% of y = y100
so x % of y = x y
100 × = y
x100
×
• The x
100 part of the last expression is the multiplying factor.
• 5% of a quantity can be found by using a multiplying factor of 0.05.
• 95% of a quantity can be found by using a multiplying factor of 0.95 and so on.
• ‘Per annum’ (p.a.) is frequently used and means ‘per year’.
• To increase a quantity by R%, multiply it by 1 + R100
• To decrease a quantity by R%, multiply it by 1 – R
100
PERCENTAGE CHANGE MULTIPLYING FACTOR
+15% 1.15+85% 1.85–15% 0.85–85% 0.15
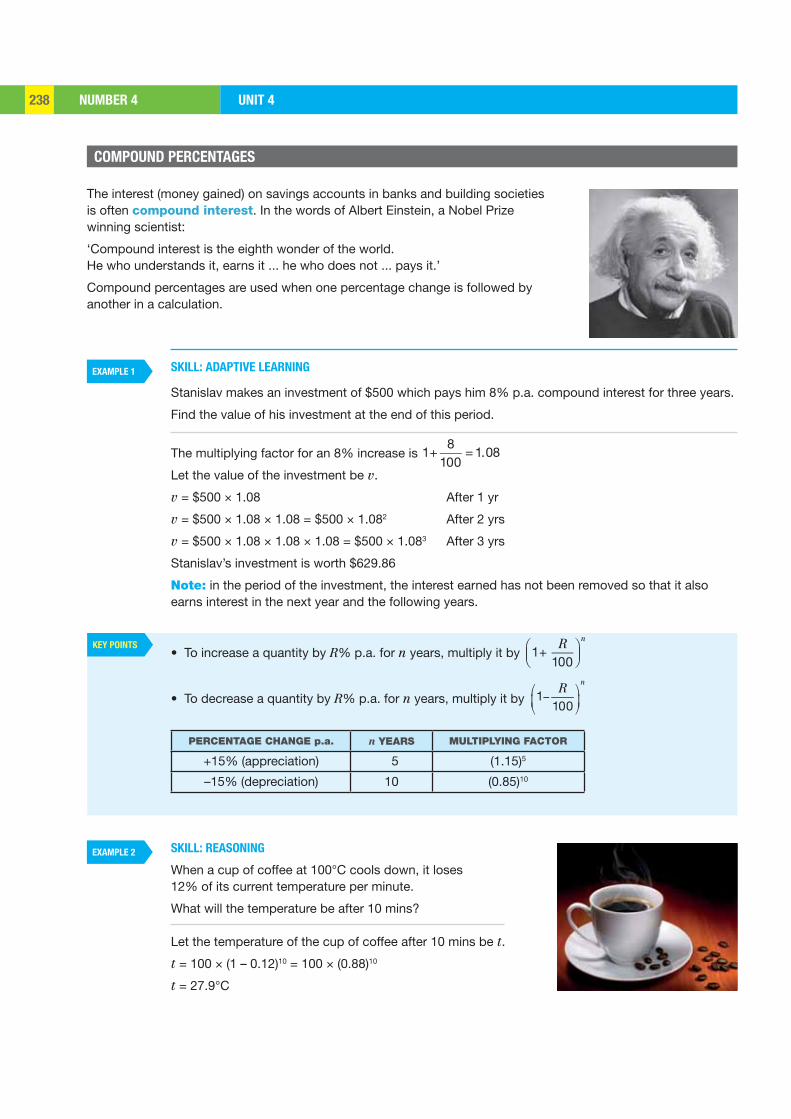
NUMBER 4 UNIT 4238
EXAMPLE 1
KEY POINTS
EXAMPLE 2
COMPOUND PERCENTAGES
SKILL: ADAPTIVE LEARNING
Stanislav makes an investment of $500 which pays him 8% p.a. compound interest for three years.
Find the value of his investment at the end of this period.
The multiplying factor for an 8% increase is 1+8
100= 1.08
Let the value of the investment be v.
v = $500 × 1.08 After 1 yr
v = $500 × 1.08 × 1.08 = $500 × 1.082 After 2 yrs
v = $500 × 1.08 × 1.08 × 1.08 = $500 × 1.083 After 3 yrs
Stanislav’s investment is worth $629.86
Note: in the period of the investment, the interest earned has not been removed so that it also earns interest in the next year and the following years.
• To increase a quantity by R% p.a. for n years, multiply it by 1+ R
100
n
• To decrease a quantity by R% p.a. for n years, multiply it by ⎛ ⎞−⎜ ⎟⎝ ⎠1
100
nR
PERCENTAGE CHANGE p.a. n YEARS MULTIPLYING FACTOR
+15% (appreciation) 5 (1.15)5
–15% (depreciation) 10 (0.85)10
SKILL: REASONING
When a cup of coffee at 100°C cools down, it loses 12% of its current temperature per minute.
What will the temperature be after 10 mins?
Let the temperature of the cup of coffee after 10 mins be t.
t = 100 × (1 – 0.12)10 = 100 × (0.88)10
t = 27.9°C
The interest (money gained) on savings accounts in banks and building societies is often compound interest. In the words of Albert Einstein, a Nobel Prize winning scientist:
‘Compound interest is the eighth wonder of the world. He who understands it, earns it ... he who does not ... pays it.’
Compound percentages are used when one percentage change is followed by another in a calculation.
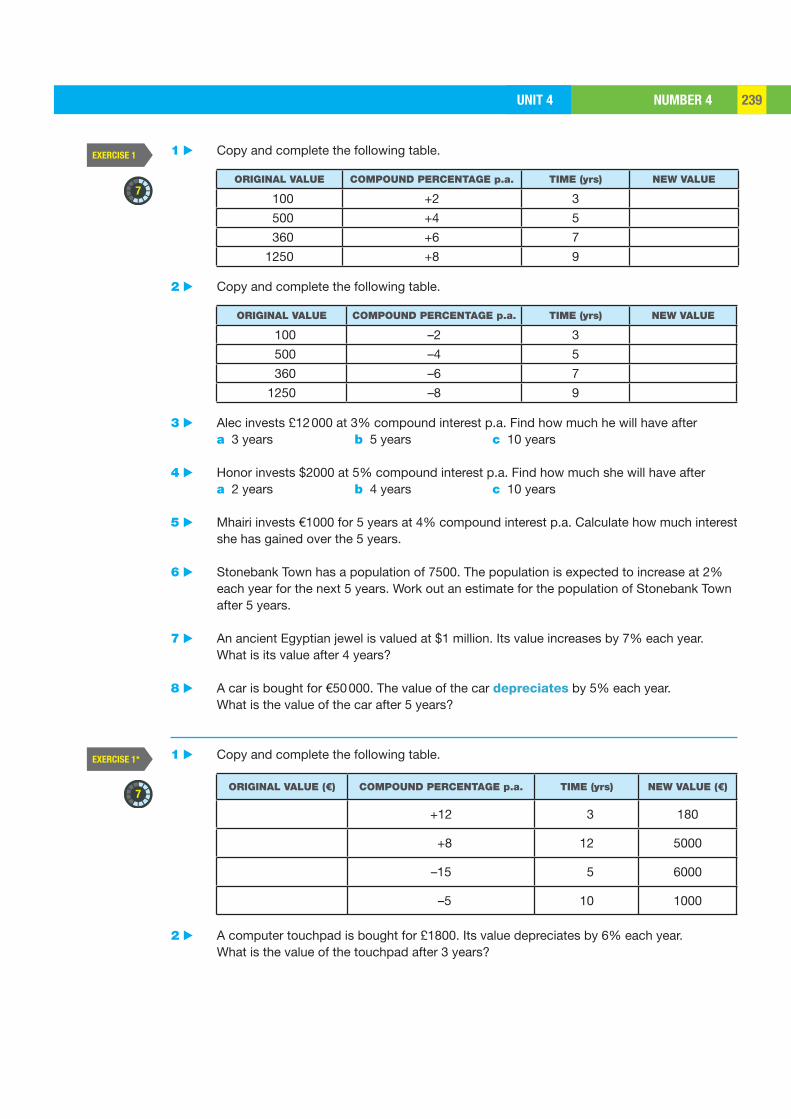
NUMBER 4UNIT 4 239
EXERCISE 1
EXERCISE 1*
7
7
1 ▶ Copy and complete the following table.
ORIGINAL VALUE COMPOUND PERCENTAGE p.a. TIME (yrs) NEW VALUE
100 +2 3
500 +4 5
360 +6 7
1250 +8 9
2 ▶ Copy and complete the following table.
ORIGINAL VALUE COMPOUND PERCENTAGE p.a. TIME (yrs) NEW VALUE
100 –2 3
500 –4 5
360 –6 7
1250 –8 9
3 ▶ Alec invests £12 000 at 3% compound interest p.a. Find how much he will have after a 3 years b 5 years c 10 years
4 ▶ Honor invests $2000 at 5% compound interest p.a. Find how much she will have after a 2 years b 4 years c 10 years
5 ▶ Mhairi invests €1000 for 5 years at 4% compound interest p.a. Calculate how much interest she has gained over the 5 years.
6 ▶ Stonebank Town has a population of 7500. The population is expected to increase at 2% each year for the next 5 years. Work out an estimate for the population of Stonebank Town after 5 years.
7 ▶ An ancient Egyptian jewel is valued at $1 million. Its value increases by 7% each year. What is its value after 4 years?
8 ▶ A car is bought for €50 000. The value of the car depreciates by 5% each year. What is the value of the car after 5 years?
1 ▶ Copy and complete the following table.
ORIGINAL VALUE (€) COMPOUND PERCENTAGE p.a. TIME (yrs) NEW VALUE (€)
+12 3 180
+8 12 5000
–15 5 6000
–5 10 1000
2 ▶ A computer touchpad is bought for £1800. Its value depreciates by 6% each year. What is the value of the touchpad after 3 years?
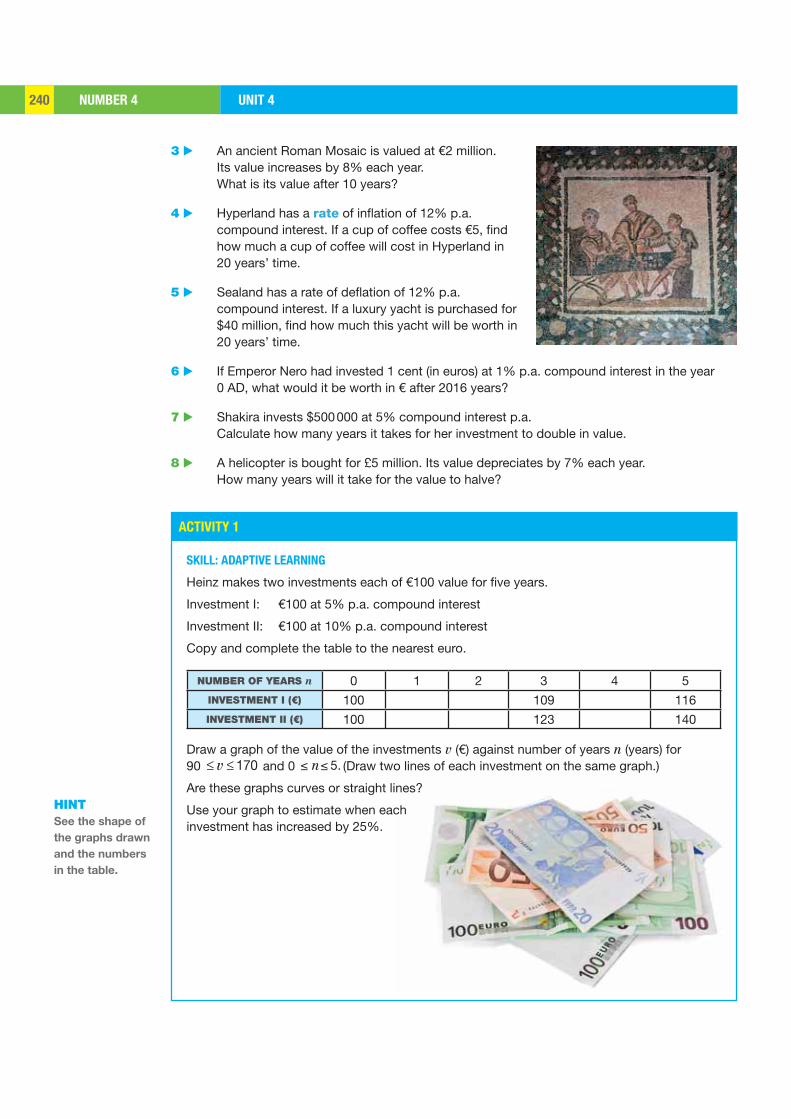
NUMBER 4 UNIT 4240
ACTIVITY 1
3 ▶ An ancient Roman Mosaic is valued at €2 million. Its value increases by 8% each year. What is its value after 10 years?
4 ▶ Hyperland has a rate of inflation of 12% p.a. compound interest. If a cup of coffee costs €5, find how much a cup of coffee will cost in Hyperland in 20 years’ time.
5 ▶ Sealand has a rate of deflation of 12% p.a. compound interest. If a luxury yacht is purchased for $40 million, find how much this yacht will be worth in 20 years’ time.
6 ▶ If Emperor Nero had invested 1 cent (in euros) at 1% p.a. compound interest in the year 0 AD, what would it be worth in € after 2016 years?
7 ▶ Shakira invests $500 000 at 5% compound interest p.a. Calculate how many years it takes for her investment to double in value.
8 ▶ A helicopter is bought for £5 million. Its value depreciates by 7% each year. How many years will it take for the value to halve?
SKILL: ADAPTIVE LEARNING
Heinz makes two investments each of €100 value for five years.
Investment I: €100 at 5% p.a. compound interest
Investment II: €100 at 10% p.a. compound interest
Copy and complete the table to the nearest euro.
NUMBER OF YEARS n 0 1 2 3 4 5INVESTMENT I (€) 100 109 116INVESTMENT II (€) 100 123 140
Draw a graph of the value of the investments v (€) against number of years n (years) for 90 v 170 and 0 ≤ ≤ 5.n (Draw two lines of each investment on the same graph.)
Are these graphs curves or straight lines?
Use your graph to estimate when each investment has increased by 25%.
HINT See the shape of
the graphs drawn
and the numbers
in the table.
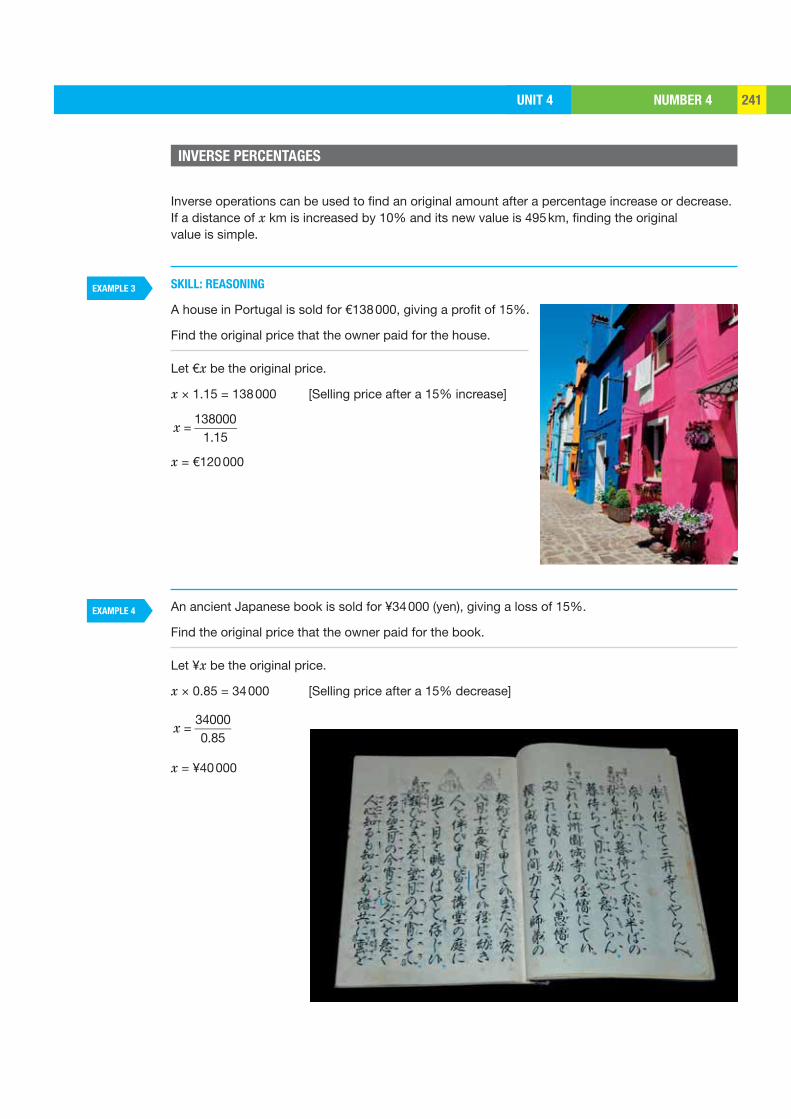
NUMBER 4UNIT 4 241
EXAMPLE 3
EXAMPLE 4
INVERSE PERCENTAGES
Inverse operations can be used to find an original amount after a percentage increase or decrease.If a distance of x km is increased by 10% and its new value is 495 km, finding the originalvalue is simple.
SKILL: REASONING
A house in Portugal is sold for €138 000, giving a profit of 15%.
Find the original price that the owner paid for the house.
Let €x be the original price.
x × 1.15 = 138 000 [Selling price after a 15% increase]
x =138000
1.15
x = €120 000
An ancient Japanese book is sold for ¥34 000 (yen), giving a loss of 15%.
Find the original price that the owner paid for the book.
Let ¥x be the original price.
x × 0.85 = 34 000 [Selling price after a 15% decrease]
x =340000.85
x = ¥40 000

NUMBER 4 UNIT 4242
EXERCISE 2
EXERCISE 2*
9
9
1 ▶ A pair of shoes is sold for $48 at a profit of 20%. Find the original price of the shoes.
2 ▶ A shirt is sold for $33 at a profit of 10%. Find the original price of the shirt.
3 ▶ Find the price of this set of drawers before the reduction.
4 ▶ A picture is sold for $32, making a loss of 20%. Find the original price of the picture.
5 ▶ The value of a bracelet increases by 6% to €78.56. Find the original value.
6 ▶ A house is sold for €234 000, which gives a profit of 12%. Find the actual profit.
7 ▶ A computer loses 32% of its value in the first year. It is worth $1650 after one year. How much was it bought for, to the nearest $?
8 ▶ A garden chair is sold for $25.30 at a profit of 10%. Find the original price of the chair.
9 ▶ The price of a house is reduced by 15% to $153 000. What was the original price of the house?
10 ▶ A vase is bought for $23.50, which includes a profit of 17.5%. Calculate the amount of profit.
1 ▶ A rare stamp is worth $81 after an increase in value of 35%. What was its value before the increase?
2 ▶ A mobile phone is valued at $220 after a decrease in value of 45%. What was its value before the decrease?
3 ▶ A seed is planted. It grows to a height of 45 cm, which is 72% of its maximum height. Find its maximum height.
SALE PRICE $54 10% OFF!
NUMBER 4UNIT 4 243
EXERCISE 3
6
9
4 ▶ A farm is sold for €457 000, which gives a profit of 19%. Find the profit.
5 ▶ A valuable watch has an original price of $x. It is sold for $5304 after its original price has been increased by 2% and then by 4%. Find x.
6 ▶ A Giant Redwood Tree is x m tall. It grows by 5% and then by 8% to reach a height of 22.68 m. Find x.
7 ▶ Zara’s Physics test mean was x%. It is now 78.2% after an increase of 15% and a decrease of 15%. Find x.
8 ▶ A room in an exclusive Dubai Hotel cost $x per night. The price then changes to $4370 per night after a decrease of 5% and an increase of 15%. Find x.
9 ▶ Baseball star Babe Ruth’s shirt sold for $4 338 500 at auction. Its value three years before the sale, $x, had appreciated by 5% p.a. compound interest. Find x.
10 ▶ The violin that was played while the Titanic sank was sold for £900 000. Its value, £y, five years before the sale depreciated by 2% p.a. compound interest for five years. Find y.
REVISION
1 ▶ Increase 2500 RM (Malaysian Ringgit) by 12%.
2 ▶ Decrease 5000 (Indian Rupee) by 12%.
3 ▶ A rare book is worth £1.5 million (Egyptian pounds) and appreciates by 12.5%. Find its new value.
4 ▶ A cost of petrol depreciates by 6% from $2 (Singapore dollar) per litre. Find its new value.
5 ▶ Ian invests £12 000 for 5 years with a compound interest of 5% p.a.. Find the value of his investment after 5 years.
6 ▶ David buys a new racing bike for £x. He then sells it for £1584 making a loss of 12%. Find x.
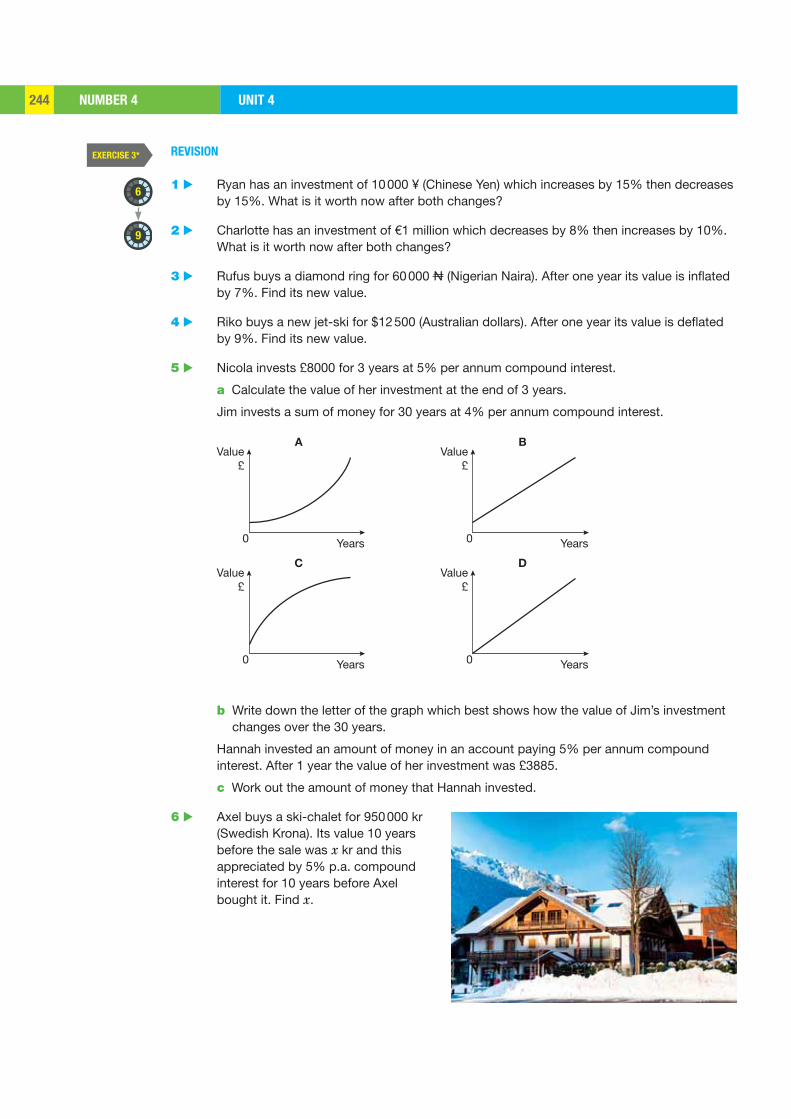
NUMBER 4 UNIT 4244
EXERCISE 3*
6
9
Value£
Years0
AValue
£
Years0
B
Value£
Years0
CValue
£
Years0
D
REVISION
1 ▶ Ryan has an investment of 10 000 ¥ (Chinese Yen) which increases by 15% then decreases by 15%. What is it worth now after both changes?
2 ▶ Charlotte has an investment of €1 million which decreases by 8% then increases by 10%. What is it worth now after both changes?
3 ▶ Rufus buys a diamond ring for 60 000 (Nigerian Naira). After one year its value is inflated by 7%. Find its new value.
4 ▶ Riko buys a new jet-ski for $12 500 (Australian dollars). After one year its value is deflated by 9%. Find its new value.
5 ▶ Nicola invests £8000 for 3 years at 5% per annum compound interest.
a Calculate the value of her investment at the end of 3 years.
Jim invests a sum of money for 30 years at 4% per annum compound interest.
b Write down the letter of the graph which best shows how the value of Jim’s investment changes over the 30 years.
Hannah invested an amount of money in an account paying 5% per annum compound interest. After 1 year the value of her investment was £3885.
c Work out the amount of money that Hannah invested.
6 ▶ Axel buys a ski-chalet for 950 000 kr (Swedish Krona). Its value 10 years before the sale was x kr and this appreciated by 5% p.a. compound interest for 10 years before Axel bought it. Find x.
EXAM PRACTICEUNIT 4 245UNIT 4 245
1
2
3
4
5
6
7
EXAM PRACTICE: NUMBER 4
a Increase $1200 by 12%.b Decrease $1200 by 12%. [4]
A valuable painting has an original price of €25 000. It gains in value by 8% and a year later by a further 5%. Find the value of the painting after both price increases. [3]
An exclusive apartment in San Francisco has an original price of $1 million. It loses value by 15% and one year later by a further 3%. Find the value of the apartment after both price decreases. [3]
A Premier League footballer is valued at £30 million and after a bad season his transfer value depreciates by 20%. His next season is a good one and his transfer value now appreciates by 20%.
Find the value of the footballer after his good season. [3]
The Graff Pink is the most expensive diamond in the world. In 2010 it was sold in Switzerland for $46 158 674. If it appreciated for the next 5 years at 7% p.a. what was the value of the diamond after 5 years? [4]
A cheetah can run at a maximum speed of 113 km/h. The cheetah loses 7% of its maximum speed each year. Find the cheetah’s maximum speed after 5 years. [4]
An ancient sculpture is valued at €x. It appreciates by 2% p.a. for 2 years, then depreciates by 3% p.a. for 3 years and is then sold for €5 million. Find x. [4]
[Total 25 marks]
CHAPTER SUMMARY UNIT 4246
CHAPTER SUMMARY: NUMBER 4
COMPOUND PERCENTAGES
‘Per annum’ (p.a.) is frequently used and means ‘per year’.
‘Appreciation’ (inflation: prices increase) means a gain in value while ‘depreciation’ (deflation: prices decrease) means a loss in value over a period of time.
To increase a quantity by R% p.a. for n years, multiply it by 1100
nR⎛ ⎞+⎜ ⎟⎝ ⎠
To decrease a quantity by R% p.a. for n years, multiply it by 1100
nR⎛ ⎞−⎜ ⎟⎝ ⎠
PERCENTAGE CHANGE p.a. n YEARS MULTIPLYING FACTOR
+5% (appreciation) 3 (1.05)3
–5% (depreciation) 7 (0.95)7
To calculate the original amount, divide by the multiplying factor.
• A sun-hat is sold at a discount of 25% for €15.
Find the original price of the sun-hat.
Let €p be the original price. p × 0.75 = 15 p = =150.75
20
Original price = €20
• A drone is sold for €1750 making a profit of 25%.
Find the original price of the drone.
Let €p be the original price. p × 1.25 = 1750 p = =17501.25
1400
Original price = €1400
INVERSE PERCENTAGES
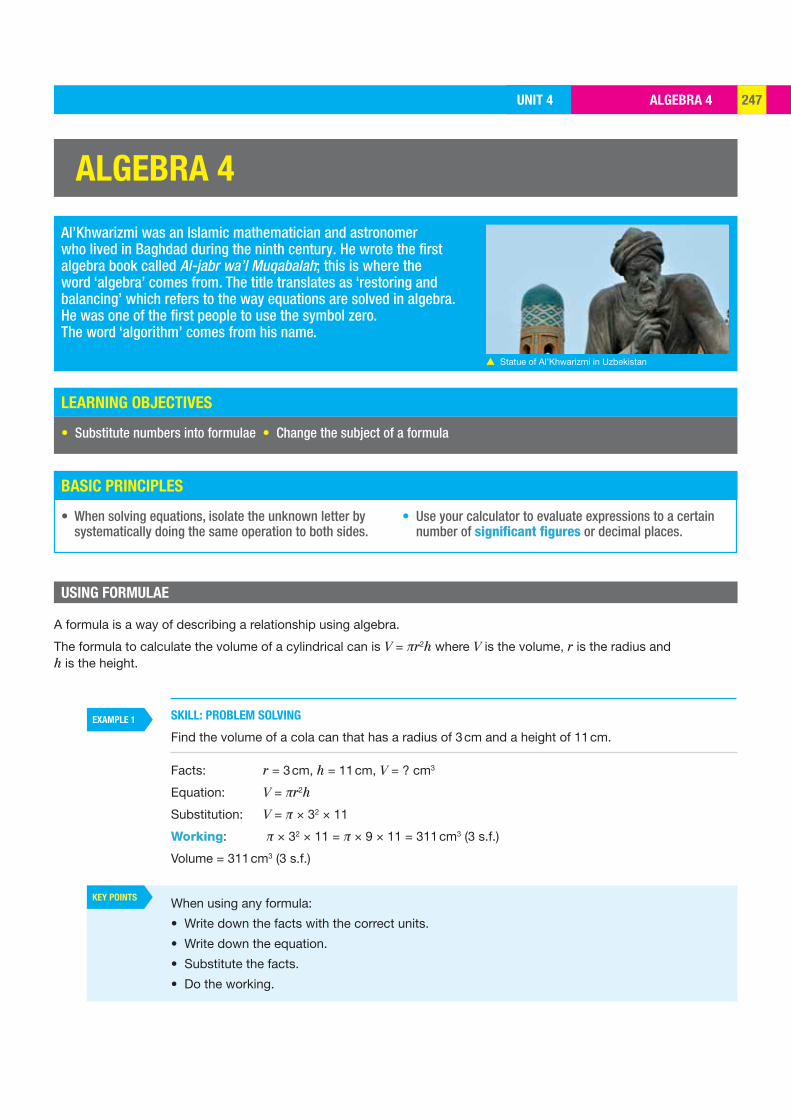
ALGEBRA 4UNIT 4 247
LEARNING OBJECTIVES
BASIC PRINCIPLES
EXAMPLE 1
KEY POINTS
ALGEBRA 4
Al’Khwarizmi was an Islamic mathematician and astronomer who lived in Baghdad during the ninth century. He wrote the first algebra book called Al-jabr wa’l Muqabalah; this is where the word ‘algebra’ comes from. The title translates as ‘restoring and balancing’ which refers to the way equations are solved in algebra. He was one of the first people to use the symbol zero. The word ‘algorithm’ comes from his name.
• Substitute numbers into formulae • Change the subject of a formula
USING FORMULAE
• When solving equations, isolate the unknown letter by systematically doing the same operation to both sides.
• Use your calculator to evaluate expressions to a certain number of significant figures or decimal places.
A formula is a way of describing a relationship using algebra.
The formula to calculate the volume of a cylindrical can is V = πr2h where V is the volume, r is the radius and h is the height.
SKILL: PROBLEM SOLVING
Find the volume of a cola can that has a radius of 3 cm and a height of 11 cm.
Facts: r = 3 cm, h = 11 cm, V = ? cm3
Equation: V = πr2h
Substitution: V = π × 32 × 11
Working: π × 32 × 11 = π × 9 × 11 = 311 cm3 (3 s.f.)
Volume = 311 cm3 (3 s.f.)
When using any formula:
• Write down the facts with the correct units.
• Write down the equation.
• Substitute the facts.
• Do the working.
▲ Statue of Al’Khwarizmi in Uzbekistan
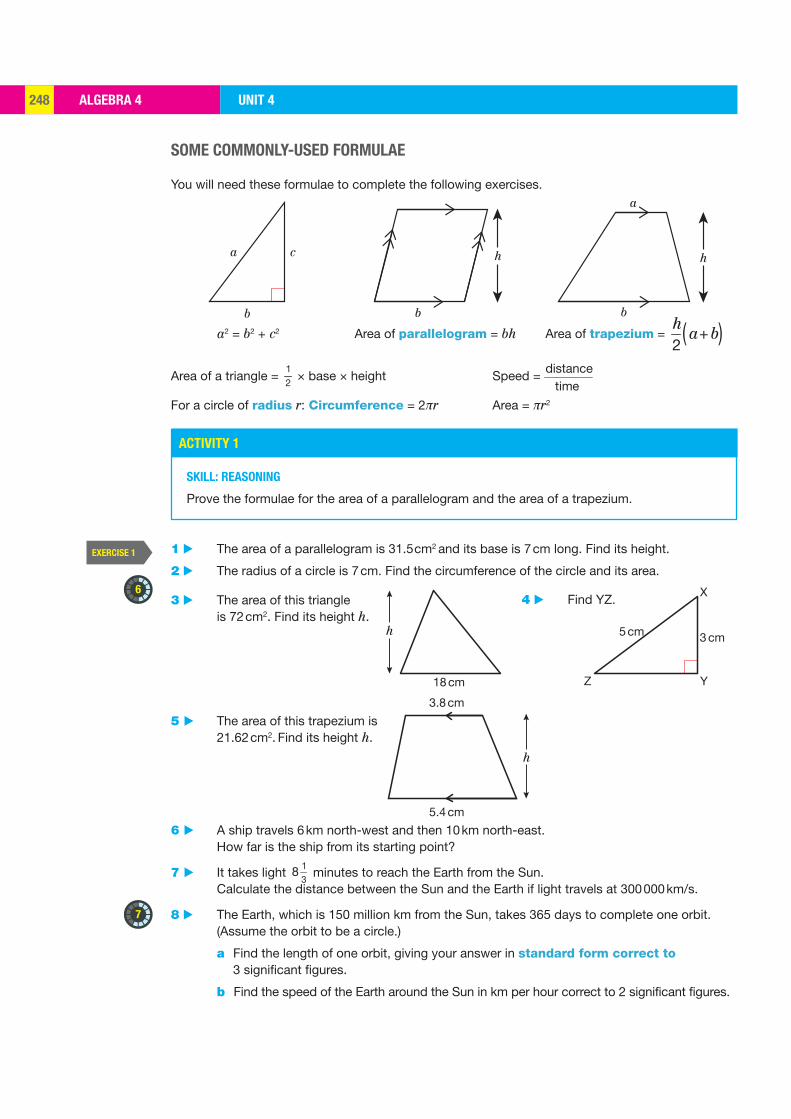
ALGEBRA 4 UNIT 4248
ACTIVITY 1
EXERCISE 1
6
7
18 cm
h
Z
5 cm 3 cm
Y
X
h
3.8 cm
5.4 cm
b
a c h
b
h
b
a
SOME COMMONLY-USED FORMULAE
You will need these formulae to complete the following exercises.
a2 = b2 + c2 Area of parallelogram = bh Area of trapezium = h2
a+b( )
Area of a triangle = 12
× base × height Speed = distancetime
For a circle of radius r: Circumference = 2πr Area = πr2
SKILL: REASONING
Prove the formulae for the area of a parallelogram and the area of a trapezium.
1 ▶ The area of a parallelogram is 31.5 cm2 and its base is 7 cm long. Find its height.
2 ▶ The radius of a circle is 7 cm. Find the circumference of the circle and its area.
3 ▶ The area of this triangle is 72 cm2. Find its height h.
5 ▶ The area of this trapezium is 21.62 cm2. Find its height h.
6 ▶ A ship travels 6 km north-west and then 10 km north-east. How far is the ship from its starting point?
7 ▶ It takes light 13
8 minutes to reach the Earth from the Sun. Calculate the distance between the Sun and the Earth if light travels at 300 000 km/s.
8 ▶ The Earth, which is 150 million km from the Sun, takes 365 days to complete one orbit. (Assume the orbit to be a circle.)
a Find the length of one orbit, giving your answer in standard form correct to 3 significant figures.
b Find the speed of the Earth around the Sun in km per hour correct to 2 significant figures.
4 ▶ Find YZ.
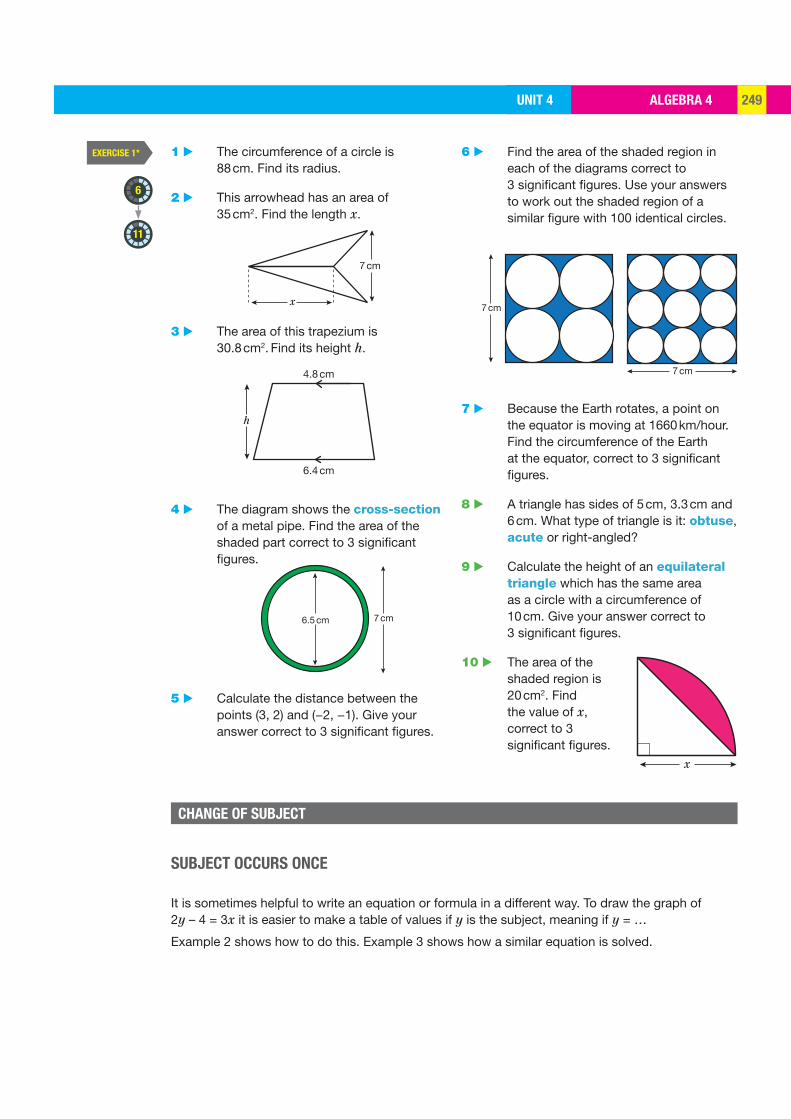
ALGEBRA 4UNIT 4 249
EXERCISE 1*
6
11
7 cm
7 cm
6.5 cm 7 cm
4.8 cm
6.4 cm
h
7 cm
x
x
1 ▶ The circumference of a circle is 88 cm. Find its radius.
2 ▶ This arrowhead has an area of 35 cm2. Find the length x.
3 ▶ The area of this trapezium is 30.8 cm2. Find its height h.
4 ▶ The diagram shows the cross-section of a metal pipe. Find the area of the shaded part correct to 3 significant figures.
5 ▶ Calculate the distance between the points (3, 2) and (−2, −1). Give your answer correct to 3 significant figures.
6 ▶ Find the area of the shaded region in each of the diagrams correct to 3 significant figures. Use your answers to work out the shaded region of a similar figure with 100 identical circles.
7 ▶ Because the Earth rotates, a point on the equator is moving at 1660 km/hour. Find the circumference of the Earth at the equator, correct to 3 significant figures.
8 ▶ A triangle has sides of 5 cm, 3.3 cm and 6 cm. What type of triangle is it: obtuse, acute or right-angled?
9 ▶ Calculate the height of an equilateral triangle which has the same area as a circle with a circumference of 10 cm. Give your answer correct to 3 significant figures.
10 ▶ The area of the shaded region is 20 cm2. Find the value of x, correct to 3 significant figures.
CHANGE OF SUBJECT
SUBJECT OCCURS ONCE
It is sometimes helpful to write an equation or formula in a different way. To draw the graph of 2y – 4 = 3x it is easier to make a table of values if y is the subject, meaning if y = …
Example 2 shows how to do this. Example 3 shows how a similar equation is solved.
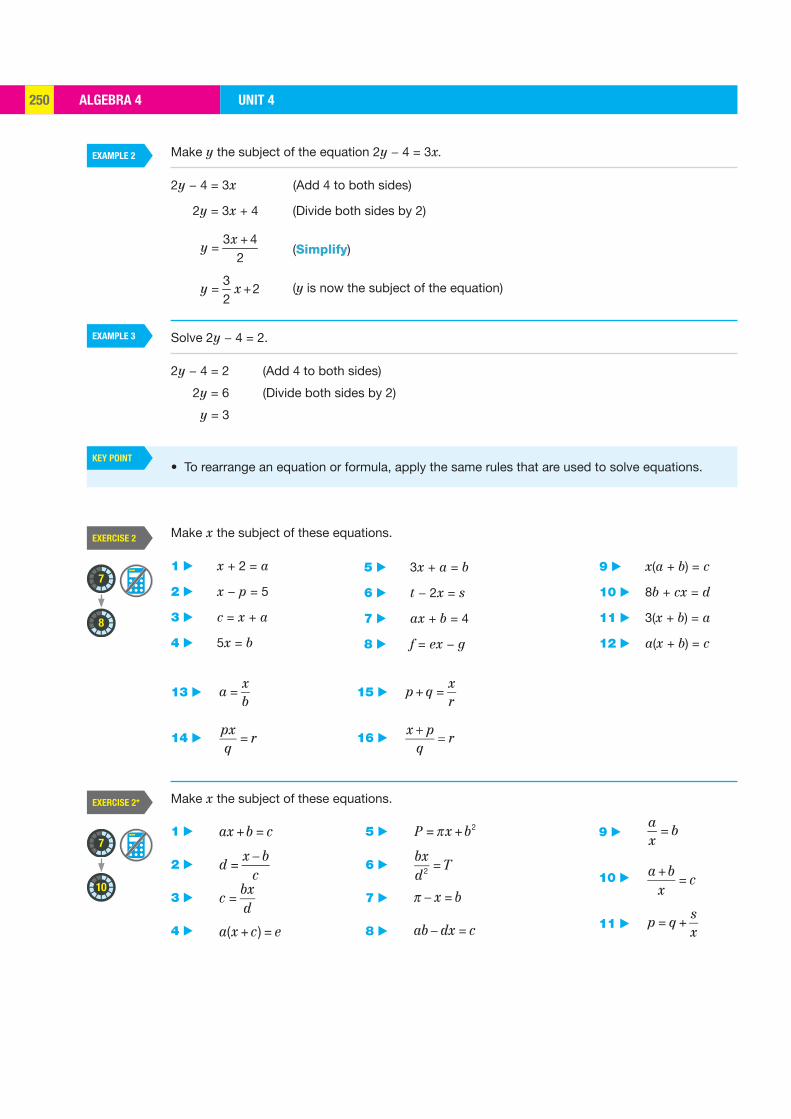
ALGEBRA 4 UNIT 4250
EXAMPLE 2
EXAMPLE 3
EXERCISE 2
EXERCISE 2*
KEY POINT
7
7
8
10
Make y the subject of the equation 2y − 4 = 3x.
2y − 4 = 3x (Add 4 to both sides)
2y = 3x + 4 (Divide both sides by 2)
+
=3 4
2x
y (Simplify)
= +3
22
y x (y is now the subject of the equation)
Solve 2y − 4 = 2.
2y − 4 = 2 (Add 4 to both sides)
2y = 6 (Divide both sides by 2)
y = 3
• To rearrange an equation or formula, apply the same rules that are used to solve equations.
Make x the subject of these equations.
1 ▶ x + 2 = a
2 ▶ x − p = 5
3 ▶ c = x + a
4 ▶ 5x = b
5 ▶ 3x + a = b
6 ▶ t − 2x = s
7 ▶ ax + b = 4
8 ▶ f = ex − g
9 ▶ x(a + b) = c
10 ▶ 8b + cx = d
11 ▶ 3(x + b) = a
12 ▶ a(x + b) = c
13 ▶ a =xb
14 ▶ pxq
= r
15 ▶ p +q =xr
16 ▶ x pq
r
Make x the subject of these equations.
1 ▶ ax +b = c
2 ▶ d =x b
c
3 ▶ c =bxd
4 ▶ a(x +c ) = e
5 ▶ P = x +b2
6 ▶ bxd2 = T
7 ▶ x = b
8 ▶ ab dx = c
9 ▶ ax
= b
10 ▶ a +bx
= c
11 ▶ p = q +sx
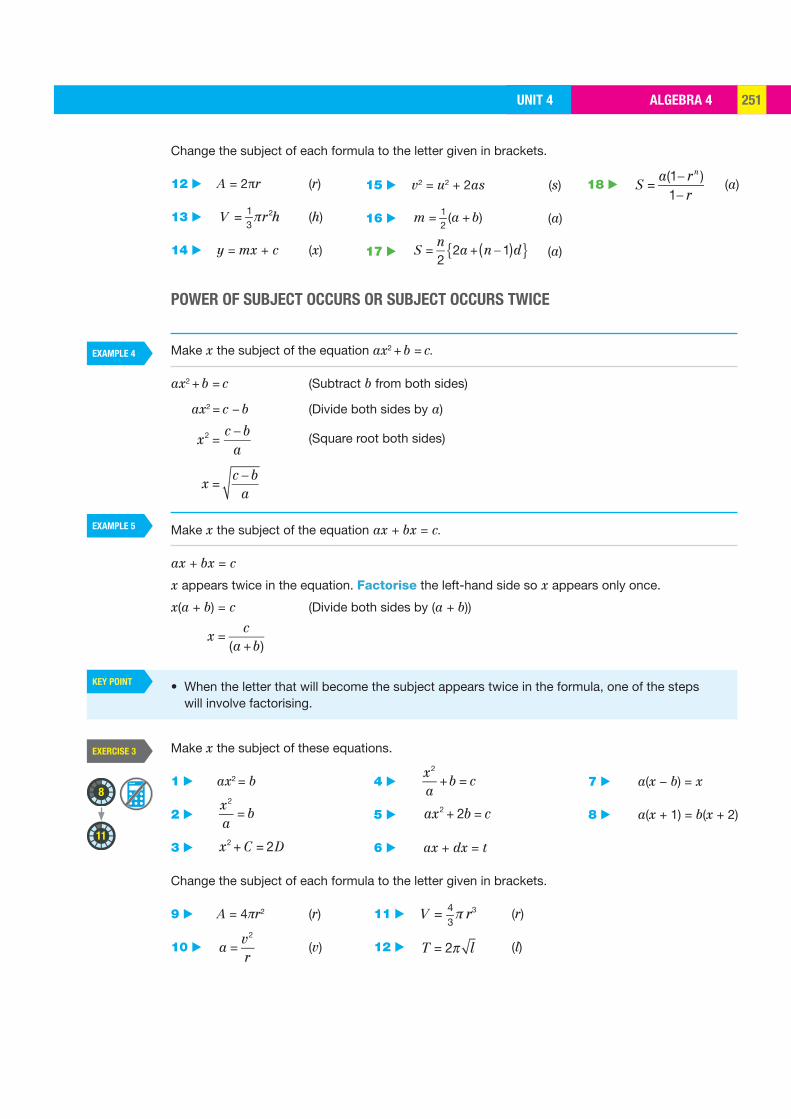
ALGEBRA 4UNIT 4 251
EXAMPLE 4
EXAMPLE 5
EXERCISE 3
KEY POINT
8
11
Change the subject of each formula to the letter given in brackets.
12 ▶ A = 2πr (r)
13 ▶ V r hπ= 213
(h)
14 ▶ y = mx + c (x)
15 ▶ v2 = u2 + 2as (s)
16 ▶ = +12
( )m a b (a)
17 ▶ S =n2
2a + n 1( )d{ } (a)
18 ▶ S =
a(1 rn )1 r
(a)
POWER OF SUBJECT OCCURS OR SUBJECT OCCURS TWICE
Make x the subject of the equation ax2 + b = c.
ax2 + b = c (Subtract b from both sides)
ax2 = c − b (Divide both sides by a)
x2 =c b
a (Square root both sides)
x =
c ba
Make x the subject of the equation ax + bx = c.
ax + bx = c
x appears twice in the equation. Factorise the left-hand side so x appears only once.
x(a + b) = c (Divide both sides by (a + b))
x =
c(a +b)
• When the letter that will become the subject appears twice in the formula, one of the steps will involve factorising.
Make x the subject of these equations.
1 ▶ ax2 = b
2 ▶ x2
a= b
3 ▶ x2 + C = 2D
4 ▶ x2
a+b = c
5 ▶ ax2 + 2b = c
6 ▶ ax + dx = t
7 ▶ a(x − b) = x
8 ▶ a(x + 1) = b(x + 2)
Change the subject of each formula to the letter given in brackets.
9 ▶ A = 4πr2 (r)
10 ▶ a =v2
r (v)
11 ▶ V rπ= 343
(r)
12 ▶ T = 2 l (l)
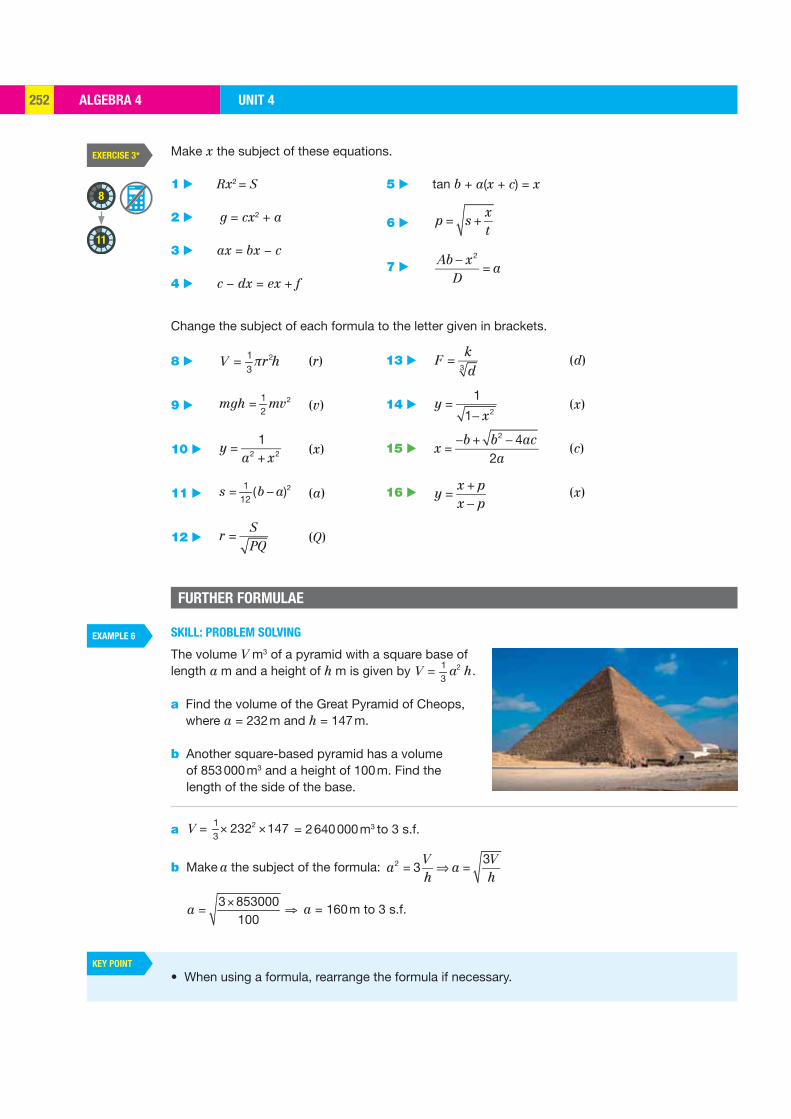
ALGEBRA 4 UNIT 4252
EXERCISE 3*
EXAMPLE 6
KEY POINT
8
11
Make x the subject of these equations.
Change the subject of each formula to the letter given in brackets.
1 ▶ Rx2 = S
2 ▶ g = cx2 + a
3 ▶ ax = bx − c
4 ▶ c − dx = ex + f
5 ▶ tan b + a(x + c) = x
6 ▶ p = s +xt
7 ▶ Ab x2
D= a
8 ▶ V r hπ= 213
(r)
9 ▶ = 212
mgh mv (v)
10 ▶ y =1
a2 + x2 (x)
11 ▶ = − 2112
( )s b a (a)
12 ▶ r =SPQ
(Q)
13 ▶ F =kd3
(d)
14 ▶ y =1
1 x2 (x)
15 ▶ x =b + b2 4ac
2a (c)
16 ▶ y =x + px p
(x)
FURTHER FORMULAE
SKILL: PROBLEM SOLVING
The volume V m3 of a pyramid with a square base of length a m and a height of h m is given by = 21
3V a h.
a Find the volume of the Great Pyramid of Cheops, where a = 232 m and h = 147 m.
b Another square-based pyramid has a volume of 853 000 m3 and a height of 100 m. Find the length of the side of the base.
a = × ×213
232 147V = 2 640 000 m3 to 3 s.f.
b Make a the subject of the formula: a2 = 3Vh
a =3Vh
×
= ⇒3 853000100
a a = 160 m to 3 s.f.
• When using a formula, rearrange the formula if necessary.
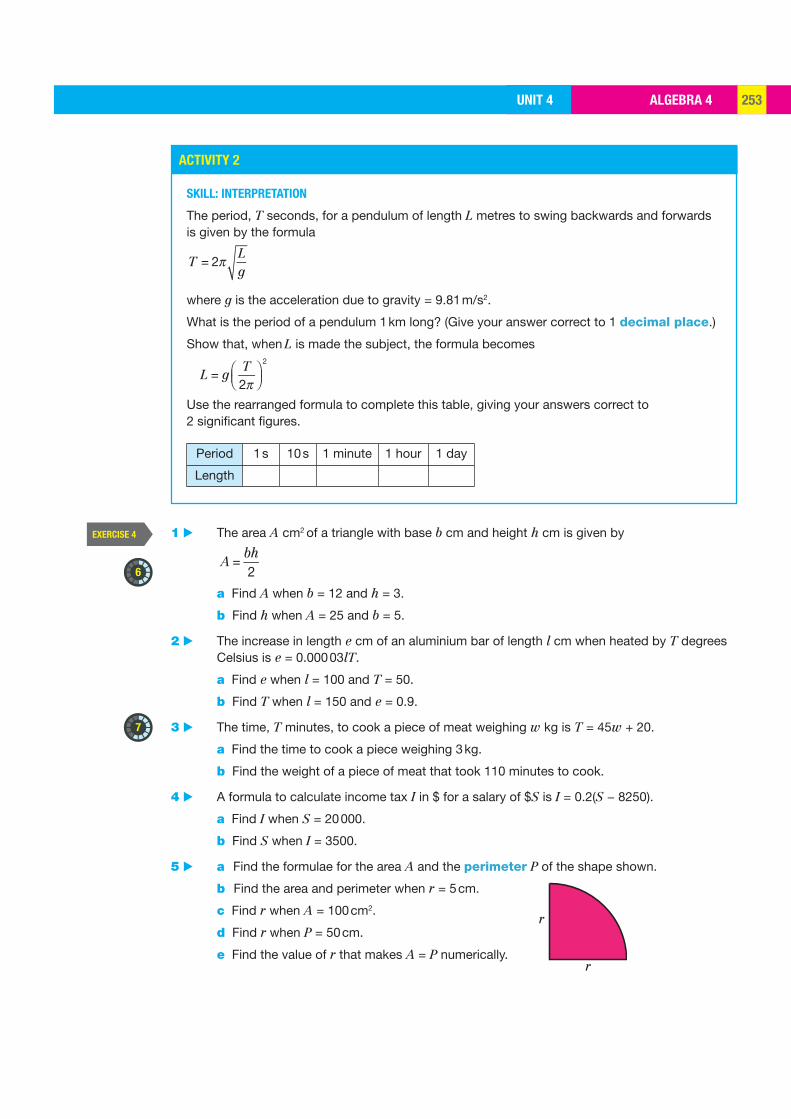
ALGEBRA 4UNIT 4 253
EXERCISE 4
ACTIVITY 2
6
7
r
r
SKILL: INTERPRETATION
The period, T seconds, for a pendulum of length L metres to swing backwards and forwards is given by the formula
T = 2Lg
where g is the acceleration due to gravity = 9.81 m/s2.
What is the period of a pendulum 1 km long? (Give your answer correct to 1 decimal place.)
Show that, when L is made the subject, the formula becomes
L = g
T2
2
Use the rearranged formula to complete this table, giving your answers correct to 2 significant figures.
Period 1 s 10 s 1 minute 1 hour 1 day
Length
1 ▶ The area A cm2 of a triangle with base b cm and height h cm is given by
A =bh2
a Find A when b = 12 and h = 3.
b Find h when A = 25 and b = 5.
2 ▶ The increase in length e cm of an aluminium bar of length l cm when heated by T degrees Celsius is e = 0.000 03lT.
a Find e when l = 100 and T = 50.
b Find T when l = 150 and e = 0.9.
3 ▶ The time, T minutes, to cook a piece of meat weighing w kg is T = 45w + 20.
a Find the time to cook a piece weighing 3 kg.
b Find the weight of a piece of meat that took 110 minutes to cook.
4 ▶ A formula to calculate income tax I in $ for a salary of $S is I = 0.2(S − 8250).
a Find I when S = 20 000.
b Find S when I = 3500.
5 ▶ a Find the formulae for the area A and the perimeter P of the shape shown.
b Find the area and perimeter when r = 5 cm.
c Find r when A = 100 cm2.
d Find r when P = 50 cm.
e Find the value of r that makes A = P numerically.
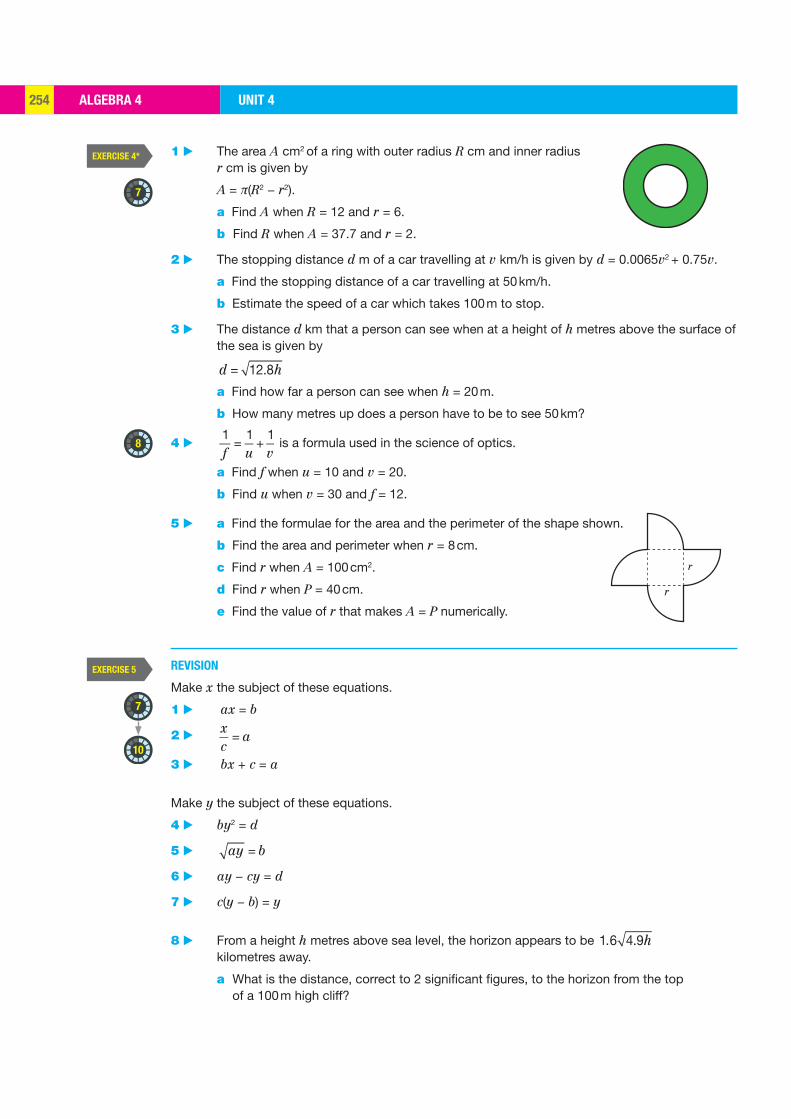
ALGEBRA 4 UNIT 4254
EXERCISE 4*
EXERCISE 5
7
7
8
10
r
r
1 ▶ The area A cm2 of a ring with outer radius R cm and inner radius r cm is given by
A = π(R2 − r2).
a Find A when R = 12 and r = 6.
b Find R when A = 37.7 and r = 2.
2 ▶ The stopping distance d m of a car travelling at v km/h is given by d = 0.0065v2 + 0.75v.
a Find the stopping distance of a car travelling at 50 km/h.
b Estimate the speed of a car which takes 100 m to stop.
3 ▶ The distance d km that a person can see when at a height of h metres above the surface of the sea is given by
d = 12.8h
a Find how far a person can see when h = 20 m.
b How many metres up does a person have to be to see 50 km?
4 ▶ 1f
=1u
+1v
is a formula used in the science of optics.
a Find f when u = 10 and v = 20.
b Find u when v = 30 and f = 12.
5 ▶ a Find the formulae for the area and the perimeter of the shape shown.
b Find the area and perimeter when r = 8 cm.
c Find r when A = 100 cm2.
d Find r when P = 40 cm.
e Find the value of r that makes A = P numerically.
REVISION
Make x the subject of these equations.
1 ▶ ax = b
2 ▶ xc
= a
3 ▶ bx + c = a
Make y the subject of these equations.
4 ▶ by2 = d
5 ▶ ay = b
6 ▶ ay − cy = d
7 ▶ c(y − b) = y
8 ▶ From a height h metres above sea level, the horizon appears to be 1.6 4.9h kilometres away.
a What is the distance, correct to 2 significant figures, to the horizon from the top of a 100 m high cliff?
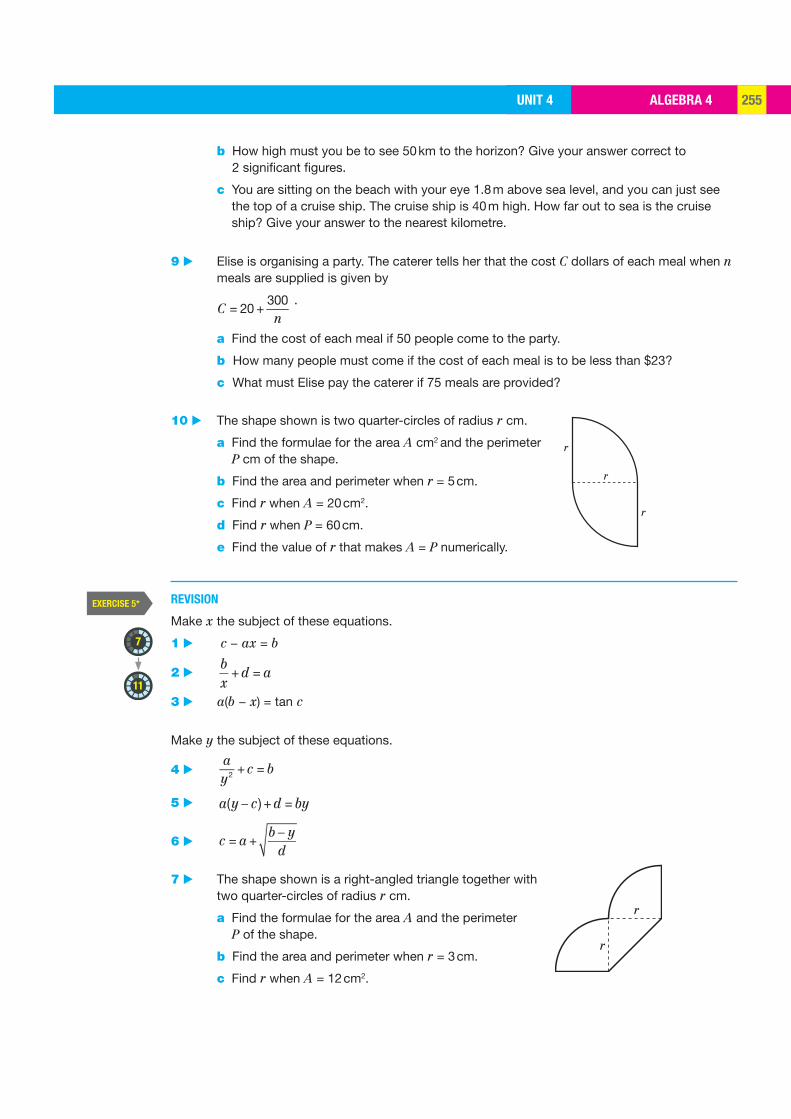
ALGEBRA 4UNIT 4 255
EXERCISE 5*
7
11
r
r
r
r
r
b How high must you be to see 50 km to the horizon? Give your answer correct to 2 significant figures.
c You are sitting on the beach with your eye 1.8 m above sea level, and you can just see the top of a cruise ship. The cruise ship is 40 m high. How far out to sea is the cruise ship? Give your answer to the nearest kilometre.
9 ▶ Elise is organising a party. The caterer tells her that the cost C dollars of each meal when n meals are supplied is given by
C = 20 +
300n
.
a Find the cost of each meal if 50 people come to the party.
b How many people must come if the cost of each meal is to be less than $23?
c What must Elise pay the caterer if 75 meals are provided?
10 ▶ The shape shown is two quarter-circles of radius r cm.
a Find the formulae for the area A cm2 and the perimeter P cm of the shape.
b Find the area and perimeter when r = 5 cm.
c Find r when A = 20 cm2.
d Find r when P = 60 cm.
e Find the value of r that makes A = P numerically.
REVISION
Make x the subject of these equations.
1 ▶ c − ax = b
2 ▶ bx
+d = a
3 ▶ a(b − x) = tan c
Make y the subject of these equations.
4 ▶ ay2 +c = b
5 ▶ a(y c ) +d = by
6 ▶ c = a +b y
d
7 ▶ The shape shown is a right-angled triangle together with two quarter-circles of radius r cm.
a Find the formulae for the area A and the perimeter P of the shape.
b Find the area and perimeter when r = 3 cm.
c Find r when A = 12 cm2.
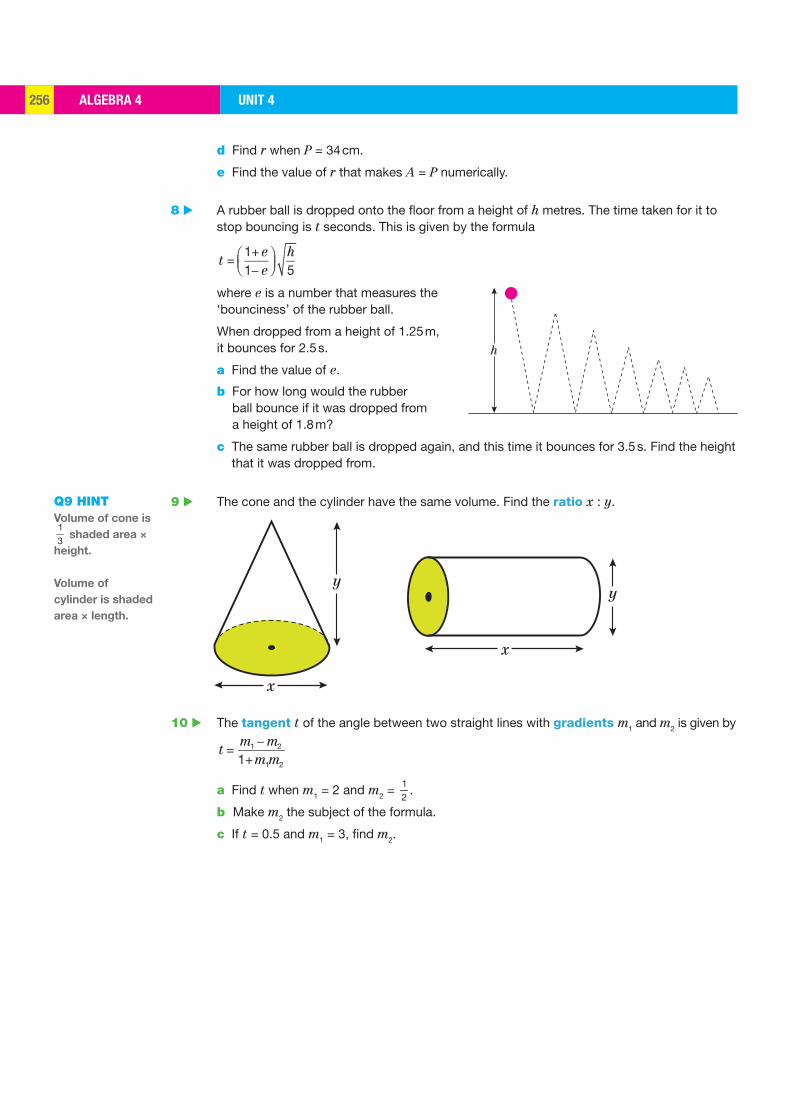
ALGEBRA 4 UNIT 4256
x
yy
x
h
d Find r when P = 34 cm.
e Find the value of r that makes A = P numerically.
8 ▶ A rubber ball is dropped onto the floor from a height of h metres. The time taken for it to stop bouncing is t seconds. This is given by the formula
t =1+e1 e
h5
where e is a number that measures the ‘bounciness’ of the rubber ball.
When dropped from a height of 1.25 m, it bounces for 2.5 s.
a Find the value of e.
b For how long would the rubber ball bounce if it was dropped from a height of 1.8 m?
c The same rubber ball is dropped again, and this time it bounces for 3.5 s. Find the height that it was dropped from.
9 ▶ The cone and the cylinder have the same volume. Find the ratio x : y.
10 ▶ The tangent t of the angle between two straight lines with gradients m1 and m2 is given by
t =m1 m2
1+m1m2
a Find t when m1 = 2 and m2 = 12
.
b Make m2 the subject of the formula.
c If t = 0.5 and m1 = 3, find m2.
Q9 HINT Volume of cone is 13
shaded area ×
height.
Volume of
cylinder is shaded
area × length.
EXAM PRACTICEUNIT 4 257
3
4
1
2
r
The formula connecting distance travelled (s), initial speed (u), time (t) and acceleration (a) is
= + 21
2s ut at
a Make a the subject of the formula.b Calculate a if s = 100 m, u = 2 m/s and
t = 5 secs. [4]
The shape shown is a semicircle of radius r.
a Find the formula for the perimeter P.b Find the formula for the area A.c Find the value of r that makes A = P
numerically. [6]
Q4 HINT For a circle of radius r, C = 2πr and A = πr2.
[Total 25 marks]
Make x the subject of the equations.
a d – 3x = f
b p = 2(q + x)
c x +a
b= c [6]
Make x the subject of the formulae.
a x2 – B = 3C
b x2
yz = a
c p(x – q) = x [9]
EXAM PRACTICE: ALGEBRA 4
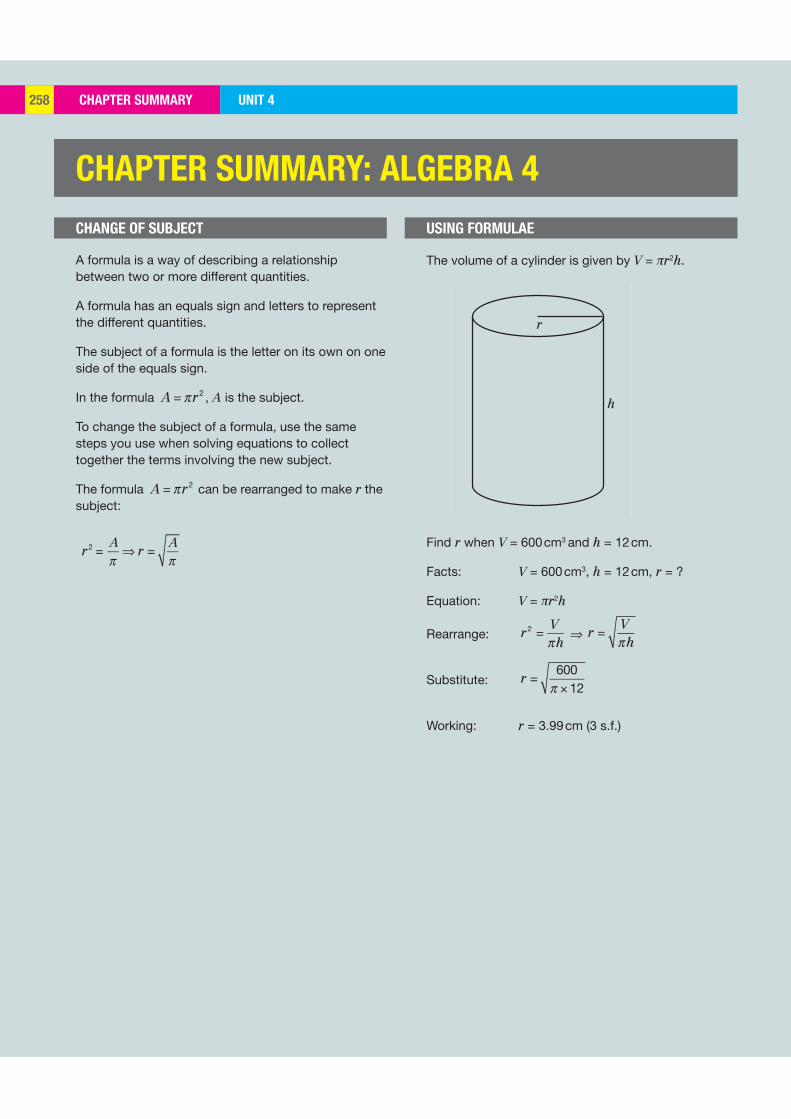
CHAPTER SUMMARY UNIT 4258
r
h
CHANGE OF SUBJECT USING FORMULAE
A formula is a way of describing a relationship between two or more different quantities.
A formula has an equals sign and letters to represent the different quantities.
The subject of a formula is the letter on its own on one side of the equals sign.
In the formula A = r2 , A is the subject.
To change the subject of a formula, use the same steps you use when solving equations to collect together the terms involving the new subject.
The formula A = r2 can be rearranged to make r the subject:
r2 =
Ar =
A
CHAPTER SUMMARY: ALGEBRA 4
The volume of a cylinder is given by V = πr2h.
Find r when V = 600 cm3 and h = 12 cm.
Facts: V = 600 cm3, h = 12 cm, r = ?
Equation: V = πr2h
Rearrange: r2 =Vh
⇒ r =Vh
Substitute: r =600
12×
Working: r = 3.99 cm (3 s.f.)
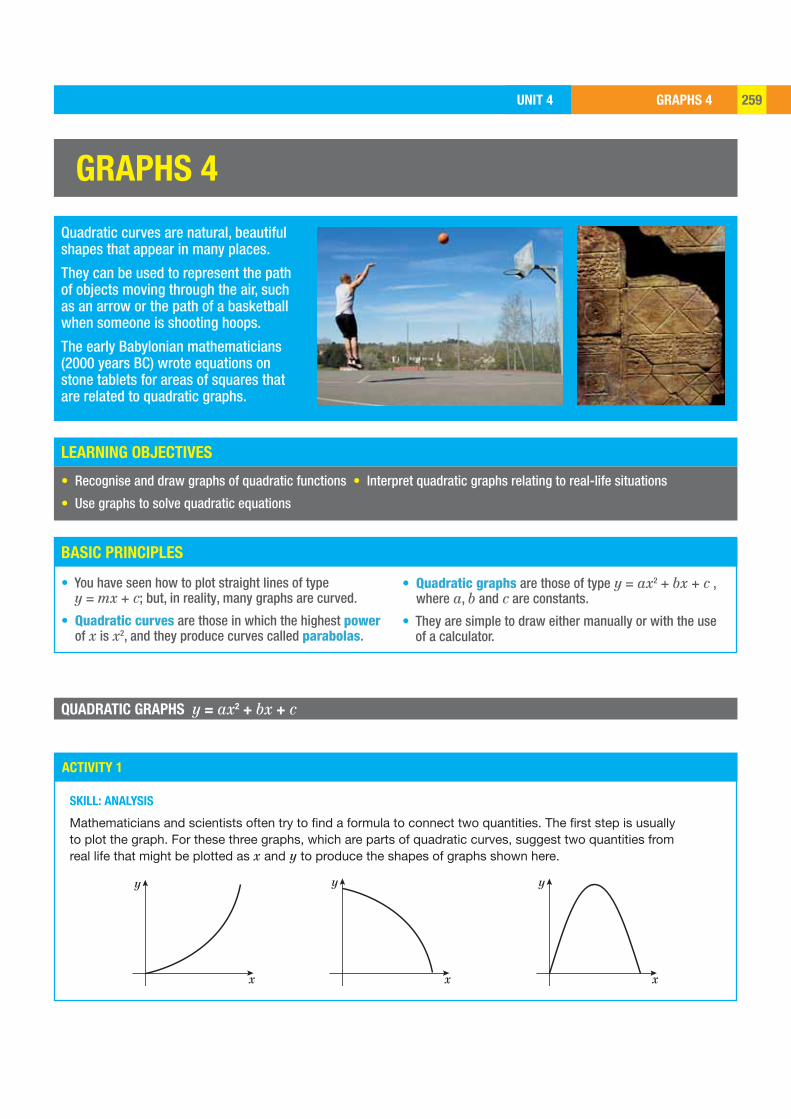
GRAPHS 4UNIT 4 259
LEARNING OBJECTIVES
BASIC PRINCIPLES
ACTIVITY 1
y
x
y
x
y
x
GRAPHS 4
Quadratic curves are natural, beautiful shapes that appear in many places.
They can be used to represent the path of objects moving through the air, such as an arrow or the path of a basketball when someone is shooting hoops.
The early Babylonian mathematicians (2000 years BC) wrote equations on stone tablets for areas of squares that are related to quadratic graphs.
• Recognise and draw graphs of quadratic functions • Interpret quadratic graphs relating to real-life situations
• Use graphs to solve quadratic equations
QUADRATIC GRAPHS y = ax2 + bx + c
• You have seen how to plot straight lines of type y = mx + c; but, in reality, many graphs are curved.
• Quadratic curves are those in which the highest power of x is x2, and they produce curves called parabolas.
• Quadratic graphs are those of type y = ax2 + bx + c , where a, b and c are constants.
• They are simple to draw either manually or with the use of a calculator.
SKILL: ANALYSIS
Mathematicians and scientists often try to find a formula to connect two quantities. The first step is usually to plot the graph. For these three graphs, which are parts of quadratic curves, suggest two quantities from real life that might be plotted as x and y to produce the shapes of graphs shown here.
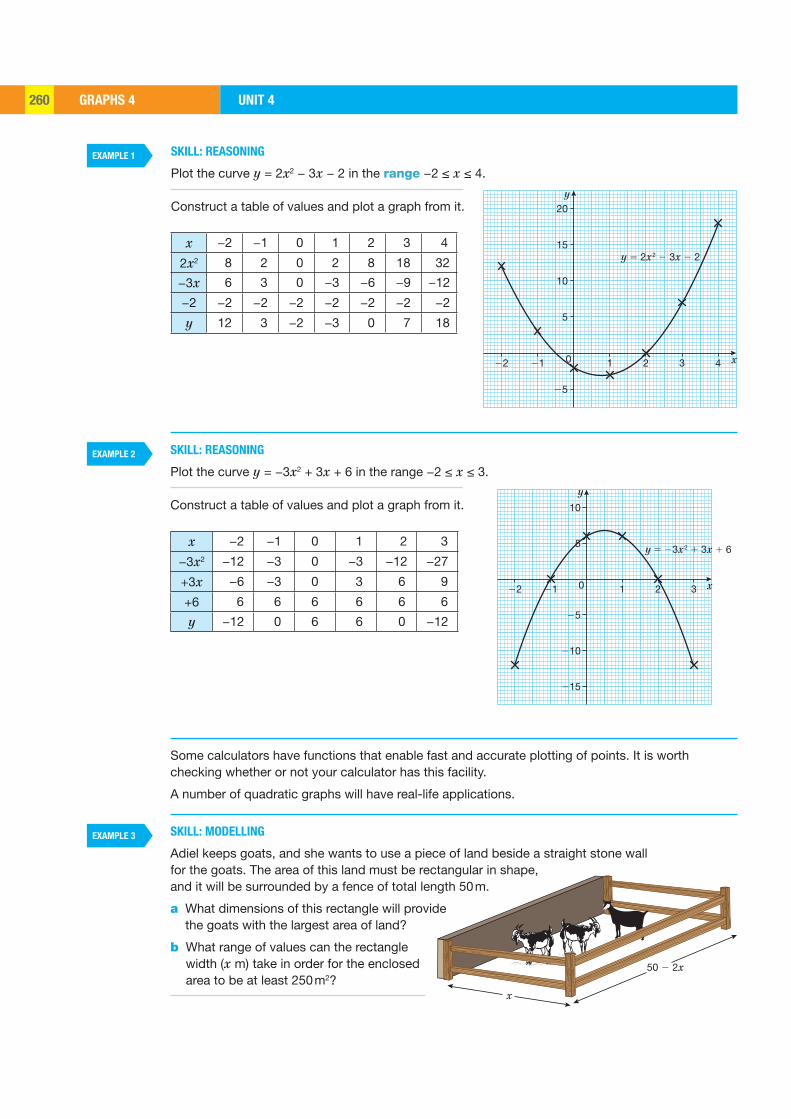
GRAPHS 4 UNIT 4260
EXAMPLE 1
EXAMPLE 2
EXAMPLE 3
y
y 5 2x 2 2 3x 2 2
x22 21 10
25
5
10
15
20
2 3 4
y
y 5 23x 2 1 3x 1 6
x22 21 10
25
210
215
5
10
2 3
50 2 2x
x
SKILL: REASONING
Plot the curve y = 2x2 − 3x − 2 in the range −2 ≤ x ≤ 4.
Construct a table of values and plot a graph from it.
x −2 −1 0 1 2 3 4
2x2 8 2 0 2 8 18 32
−3x 6 3 0 −3 −6 −9 −12
−2 −2 −2 −2 −2 −2 −2 −2
y 12 3 −2 −3 0 7 18
SKILL: REASONING
Plot the curve y = −3x2 + 3x + 6 in the range −2 ≤ x ≤ 3.
Construct a table of values and plot a graph from it.
x −2 −1 0 1 2 3
−3x2 −12 −3 0 −3 −12 −27
+3x −6 −3 0 3 6 9
+6 6 6 6 6 6 6
y −12 0 6 6 0 −12
Some calculators have functions that enable fast and accurate plotting of points. It is worth checking whether or not your calculator has this facility.
A number of quadratic graphs will have real-life applications.
SKILL: MODELLING
Adiel keeps goats, and she wants to use a piece of land beside a straight stone wall for the goats. The area of this land must be rectangular in shape, and it will be surrounded by a fence of total length 50 m.
a What dimensions of this rectangle will provide the goats with the largest area of land?
b What range of values can the rectangle width (x m) take in order for the enclosed area to be at least 250 m2?
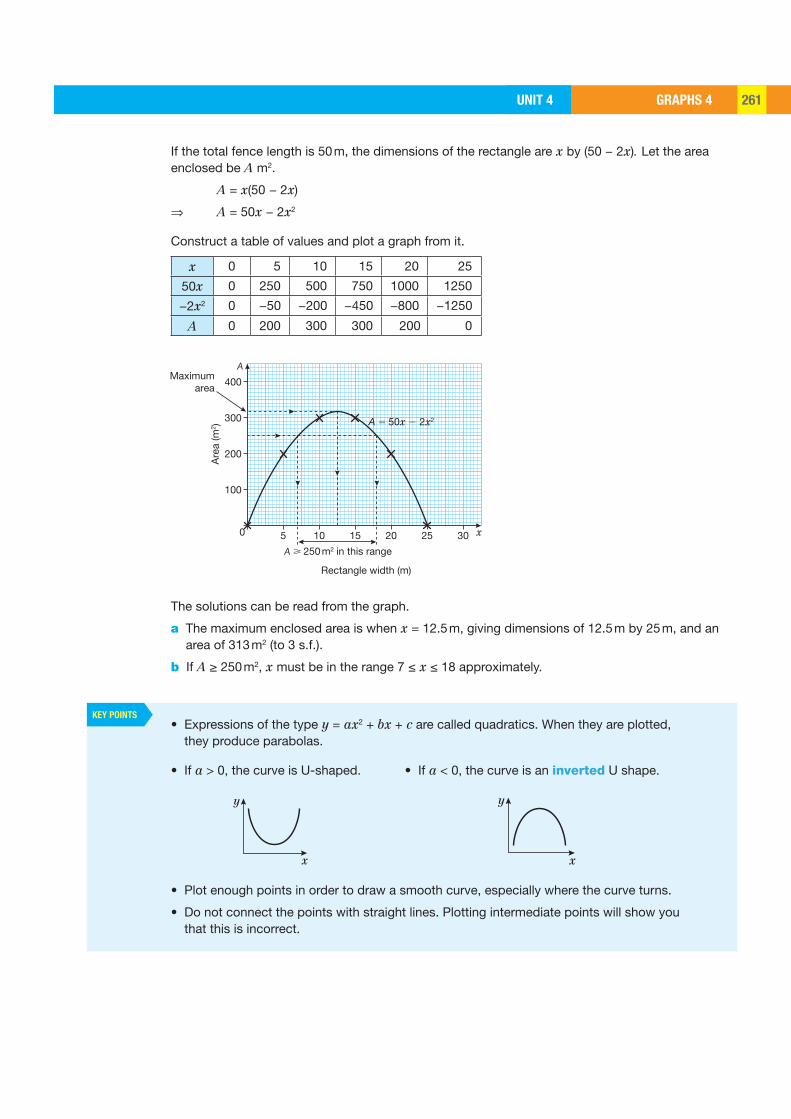
GRAPHS 4UNIT 4 261
KEY POINTS
A
A > 250 m2 in this range
A 5 50x 2 2x2
Rectangle width (m)
x50
100
200
Maximumarea
Are
a (m
2 )
300
400
10 15 20 25 30
y
x
y
x
If the total fence length is 50 m, the dimensions of the rectangle are x by (50 − 2x). Let the area enclosed be A m2.
A = x(50 − 2x)
⇒ A = 50x − 2x2
Construct a table of values and plot a graph from it.
x 0 5 10 15 20 25
50x 0 250 500 750 1000 1250
−2x2 0 −50 −200 −450 −800 −1250
A 0 200 300 300 200 0
The solutions can be read from the graph.
a The maximum enclosed area is when x = 12.5 m, giving dimensions of 12.5 m by 25 m, and an area of 313 m2 (to 3 s.f.).
b If A ≥ 250 m2, x must be in the range 7 ≤ x ≤ 18 approximately.
• Expressions of the type y = ax2 + bx + c are called quadratics. When they are plotted, they produce parabolas.
• If a > 0, the curve is U-shaped. • If a < 0, the curve is an inverted U shape.
• Plot enough points in order to draw a smooth curve, especially where the curve turns.
• Do not connect the points with straight lines. Plotting intermediate points will show you that this is incorrect.

GRAPHS 4 UNIT 4262
EXERCISE 1
7
8
Start
y
Draw a graph for each equation after completing a suitable table between the stated x values.
1 ▶ y = x2 + 2 for −3 ≤ x ≤ 3
2 ▶ y = x2 + 2x for −3 ≤ x ≤ 3
Draw a graph for each equation between the stated x values after copying and completing these tables.
3 ▶ y = x2 + x + 2 for −3 ≤ x ≤ 2
x −3 −2 −1 0 1 2
x2 9 0 4
x −3 0 2
2 2 2 2
y 8 2 8
4 ▶ y = 2x2 + 3x + 2 for −3 ≤ x ≤ 2
x −3 −2 −1 0 1 2
y 11 2 16
5 ▶ A water container has a square base of side length x metres and a height of 2 m.
a Show that the volume V, in cubic metres, of water in a full container is given by the formula V = 2x2.
b Copy and complete this table, and use it to draw the graph of V against x.
x (m) 0 0.4 0.8 1.2 1.6 2.0
V (m3) 0 8
c Use your graph to estimate the dimensions of the base that give a volume of 4 m3.
d What volume of water could be held by the container if its base area is 0.36 m2?
e A hotel needs a water container to hold at least 3 m3. For the container to fit into the storage room its side length cannot be more than 1.8 m. What range of x values enables the container to fit into the storage room?
6 ▶ On a Big-Dipper ride at a funfair, the height y metres of a carriage above the ground t seconds after the start is given by the formula y = 0.5t2 − 3t + 5 for 0 ≤ t ≤ 6.
a Copy and complete this table, and use it to draw the graph of y against t.
t (s) 0 1 2 3 4 5 6
y (m) 2.5 0.5 2.5 b Use your graph to find the height above the ground at the start of the ride. c What is the minimum height above the ground and at what time does this happen? d What is the height above the starting point after 6 s? e Between what times is the carriage at least 3 m above the ground?

GRAPHS 4UNIT 4 263
EXERCISE 1*
7
8
9
x
x
10 cm
10 cm
x
Draw a graph for each equation after completing a suitable table between the stated x values.
1 ▶ y = −x2 + 2 for −3 ≤ x ≤ 3
2 ▶ y = −x2 + 4x for −1 ≤ x ≤ 5
3 ▶ Draw the graph of y = −2x2 + 2x + 5 for −2 ≤ x ≤ 3 after completing the table.
x −2 −1 0 1 2 3
y −7 −7
4 ▶ The population P (in millions) of bacteria on a piece of cheese after t days is given by the equation P = kt2 + t + 1, where k is a constant that is valid for 2 ≤ t ≤ 12.
a Use this table to calculate the value of k, and then copy and complete the table.
t (days) 2 4 6 8 10 12
P (millions) 10 265
b Draw a graph of P against t. c Use your graph to estimate the bacteria population after 5 days. d How many days does it take for the bacteria population to be more than 108?
5 ▶ The depth of water, y m, at the entrance of a tidal harbour (where the depth of water changes) t hours after midday is given by the formula y = 4 + 3t − t2 where 0 ≤ t ≤ 4.
a Copy and complete this table, and use it to draw a graph of y against t.
t (hours after 12:00) 0 1 1.5 2 3 4
y (m) 6 4
b Use your graph to find the depth of water at the harbour entrance at midday. c At what time is the harbour entrance dry? d What is the maximum depth of water at the entrance and at what time does this occur? e A large ferry requires at least 5 m of water if it is to be able to enter a harbour.
Between what times of the day can it safely enter the harbour? Give your answers to the nearest minute.
6 ▶ An open box is made from a thin square metal sheet measuring 10 cm by 10 cm. Four squares of side x centimetres are cut away, and the remaining sides are folded upwards to make a box of depth x centimetres.
a Show that the external surface area A cm2 is given by the formula A = 100 − 4x2 where 0 ≤ x ≤ 5.
b Draw the graph of A against x by first constructing a table of values.
c Use your graph to find values of x which will produce a box with an external surface area of between 50 cm2 and 75 cm2 inclusive.
Q4a HINT t = 2, P = 10
satisfies equation
P = kt2 + t + 1.
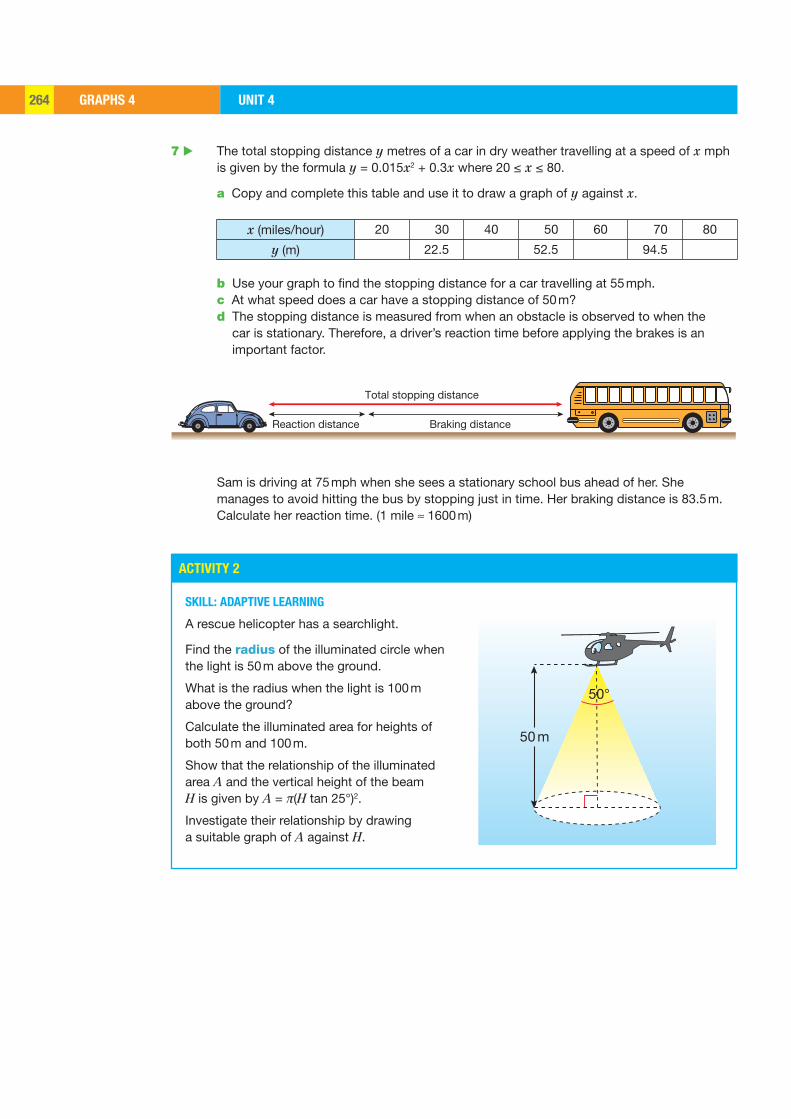
GRAPHS 4 UNIT 4264
ACTIVITY 2
Total stopping distance
Reaction distance Braking distance
50°
50 m
7 ▶ The total stopping distance y metres of a car in dry weather travelling at a speed of x mph is given by the formula y = 0.015x2 + 0.3x where 20 ≤ x ≤ 80.
a Copy and complete this table and use it to draw a graph of y against x.
x (miles/hour) 20 30 40 50 60 70 80
y (m) 22.5 52.5 94.5
b Use your graph to find the stopping distance for a car travelling at 55 mph. c At what speed does a car have a stopping distance of 50 m? d The stopping distance is measured from when an obstacle is observed to when the
car is stationary. Therefore, a driver’s reaction time before applying the brakes is an important factor.
Sam is driving at 75 mph when she sees a stationary school bus ahead of her. She manages to avoid hitting the bus by stopping just in time. Her braking distance is 83.5 m. Calculate her reaction time. (1 mile ≈ 1600 m)
SKILL: ADAPTIVE LEARNING
A rescue helicopter has a searchlight.
Find the radius of the illuminated circle when the light is 50 m above the ground.
What is the radius when the light is 100 m above the ground?
Calculate the illuminated area for heights of both 50 m and 100 m.
Show that the relationship of the illuminated area A and the vertical height of the beam H is given by A = π(H tan 25°)2.
Investigate their relationship by drawing a suitable graph of A against H.
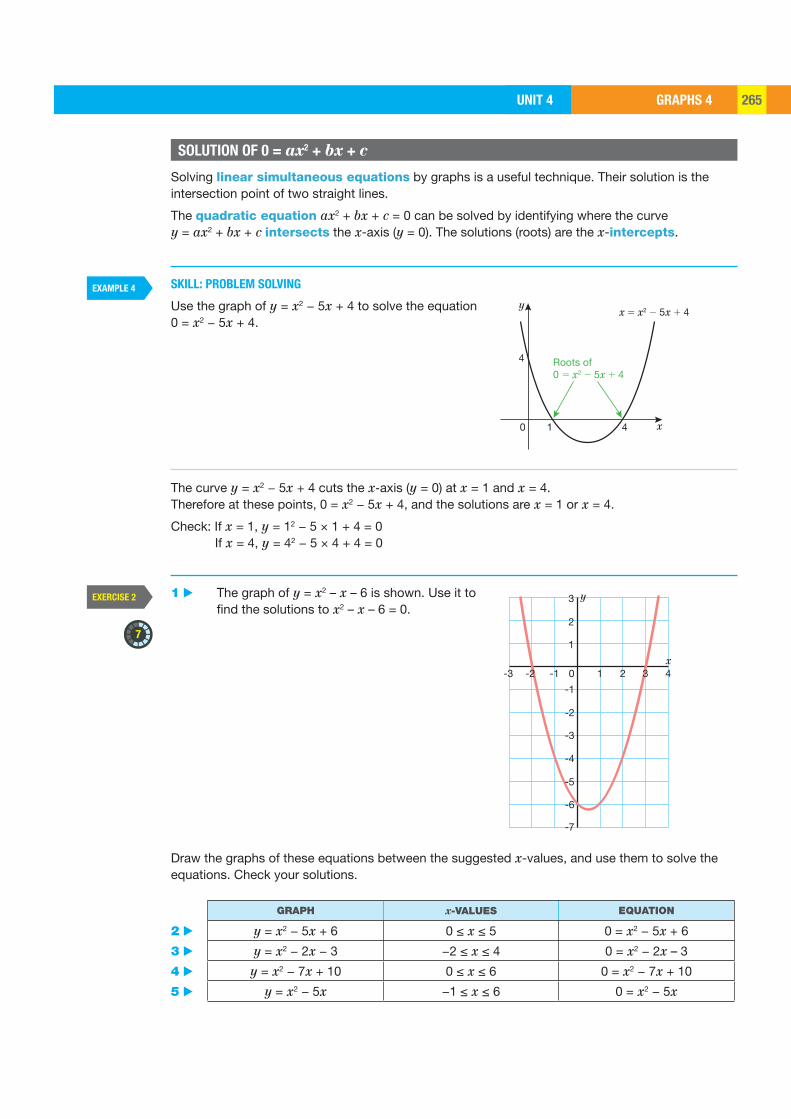
GRAPHS 4UNIT 4 265
EXAMPLE 4
EXERCISE 2
7
0 1 4
4 Roots of0 5 x2 2 5x 1 4
yx 5 x2 2 5x 1 4
x
y3
2
1
-1
-2
-3
-4
-5
-6
-7
-3 -2 -1 10 2 3 4x
Solving linear simultaneous equations by graphs is a useful technique. Their solution is the intersection point of two straight lines.
The quadratic equation ax2 + bx + c = 0 can be solved by identifying where the curve y = ax2 + bx + c intersects the x-axis (y = 0). The solutions (roots) are the x-intercepts.
SKILL: PROBLEM SOLVING
Use the graph of y = x2 − 5x + 4 to solve the equation 0 = x2 − 5x + 4.
The curve y = x2 − 5x + 4 cuts the x-axis (y = 0) at x = 1 and x = 4. Therefore at these points, 0 = x2 − 5x + 4, and the solutions are x = 1 or x = 4.
Check: If x = 1, y = 12 − 5 × 1 + 4 = 0 If x = 4, y = 42 − 5 × 4 + 4 = 0
1 ▶ The graph of y = x2 – x – 6 is shown. Use it to find the solutions to x2 – x – 6 = 0.
Draw the graphs of these equations between the suggested x-values, and use them to solve the equations. Check your solutions.
SOLUTION OF 0 = ax2 + bx + c
GRAPH x-VALUES EQUATION
y = x2 − 5x + 6 0 ≤ x ≤ 5 0 = x2 − 5x + 6
y = x2 − 2x − 3 −2 ≤ x ≤ 4 0 = x2 − 2x – 3
y = x2 − 7x + 10 0 ≤ x ≤ 6 0 = x2 − 7x + 10
y = x2 − 5x −1 ≤ x ≤ 6 0 = x2 − 5x
2 ▶3 ▶4 ▶5 ▶
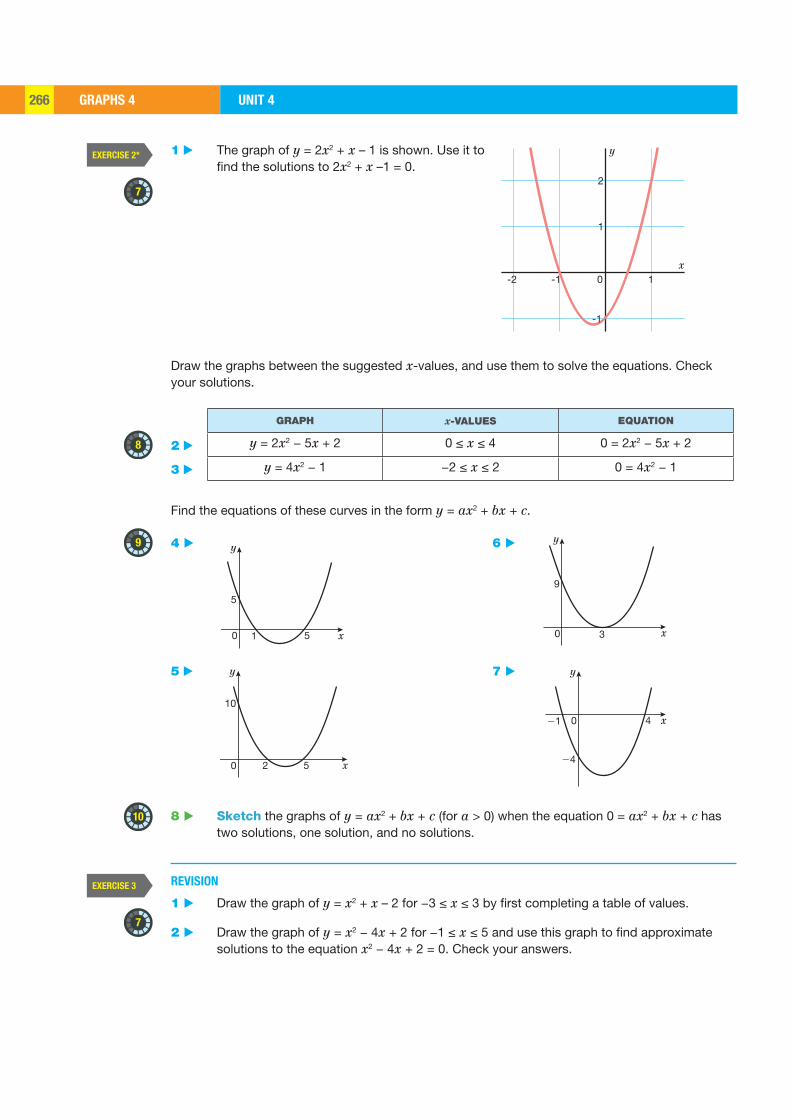
GRAPHS 4 UNIT 4266
EXERCISE 2*
EXERCISE 3
7
8
9
10
7
0
5
1 5
y
x
0
10
2 5
y
x
0 3
9
y
x
y
x-1 10-2
2
1
-1
021
24
4
y
x
1 ▶ The graph of y = 2x2 + x – 1 is shown. Use it to find the solutions to 2x2 + x –1 = 0.
Draw the graphs between the suggested x-values, and use them to solve the equations. Check your solutions.
GRAPH x-VALUES EQUATION
y = 2x2 − 5x + 2 0 ≤ x ≤ 4 0 = 2x2 − 5x + 2
y = 4x2 − 1 −2 ≤ x ≤ 2 0 = 4x2 − 1
Find the equations of these curves in the form y = ax2 + bx + c.
4 ▶ 6 ▶
5 ▶ 7 ▶
8 ▶ Sketch the graphs of y = ax2 + bx + c (for a > 0) when the equation 0 = ax2 + bx + c has two solutions, one solution, and no solutions.
REVISION
1 ▶ Draw the graph of y = x2 + x – 2 for −3 ≤ x ≤ 3 by first completing a table of values.
2 ▶ Draw the graph of y = x2 − 4x + 2 for −1 ≤ x ≤ 5 and use this graph to find approximate solutions to the equation x2 − 4x + 2 = 0. Check your answers.
2 ▶
3 ▶
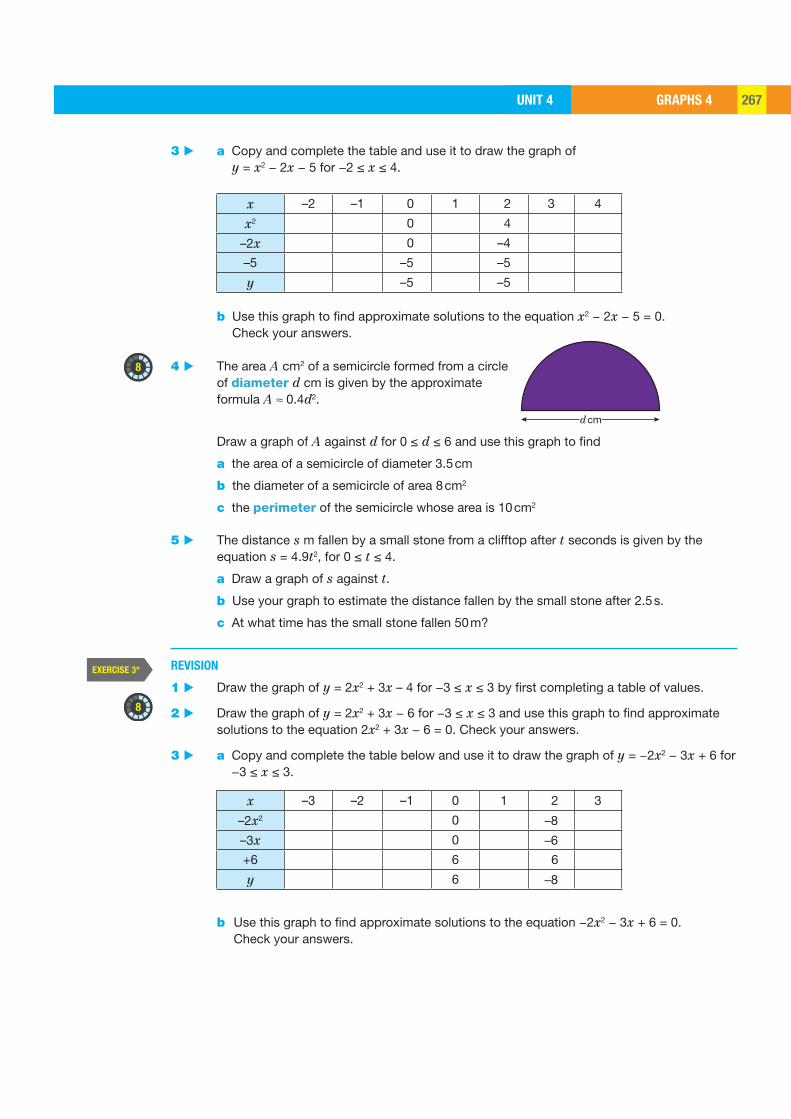
GRAPHS 4UNIT 4 267
EXERCISE 3*
8
8
d cm
3 ▶ a Copy and complete the table and use it to draw the graph of y = x2 − 2x − 5 for −2 ≤ x ≤ 4.
x –2 –1 0 1 2 3 4
x2 0 4
–2x 0 –4
–5 –5 –5
y –5 –5
b Use this graph to find approximate solutions to the equation x2 − 2x − 5 = 0. Check your answers.
4 ▶ The area A cm2 of a semicircle formed from a circle of diameter d cm is given by the approximate formula A ≈ 0.4d2.
Draw a graph of A against d for 0 ≤ d ≤ 6 and use this graph to find
a the area of a semicircle of diameter 3.5 cm
b the diameter of a semicircle of area 8 cm2
c the perimeter of the semicircle whose area is 10 cm2
5 ▶ The distance s m fallen by a small stone from a clifftop after t seconds is given by the equation s = 4.9t2, for 0 ≤ t ≤ 4.
a Draw a graph of s against t.
b Use your graph to estimate the distance fallen by the small stone after 2.5 s.
c At what time has the small stone fallen 50 m?
REVISION
1 ▶ Draw the graph of y = 2x2 + 3x – 4 for −3 ≤ x ≤ 3 by first completing a table of values.
2 ▶ Draw the graph of y = 2x2 + 3x − 6 for −3 ≤ x ≤ 3 and use this graph to find approximate solutions to the equation 2x2 + 3x − 6 = 0. Check your answers.
3 ▶ a Copy and complete the table below and use it to draw the graph of y = −2x2 − 3x + 6 for −3 ≤ x ≤ 3.
x –3 –2 –1 0 1 2 3
–2x2 0 –8
–3x 0 –6
+6 6 6
y 6 –8
b Use this graph to find approximate solutions to the equation −2x2 − 3x + 6 = 0. Check your answers.

GRAPHS 4 UNIT 4268
9
x
y
0
4 ▶ Lee is designing a bridge to cross a jungle river. She decides that it will be supported by a parabolic arch. The equation = − 21
2y x is used as the mathematical model to design the
arch, where the axes are as shown in the diagram.
a Draw the graph of the arch for −4 ≤ x ≤ 4.
b Draw the line y = −6 to represent the water level of the river, and use your graph to estimate the width of the arch 10 m above the river, if the scale of the graph is 1 unit to 5 m.
5 ▶ The equation for the flight path of a golf ball is y = 0.2x − 0.001x2, for 0 ≤ x ≤ 200, where y m is the ball’s height, and x m is the horizontal distance moved by the ball.
a Draw a graph of y against x by first completing a suitable table of values between the stated x-values.
b Use your graph to estimate the maximum height of the ball.
c Between what distances is the ball at least 5 m above the ground?
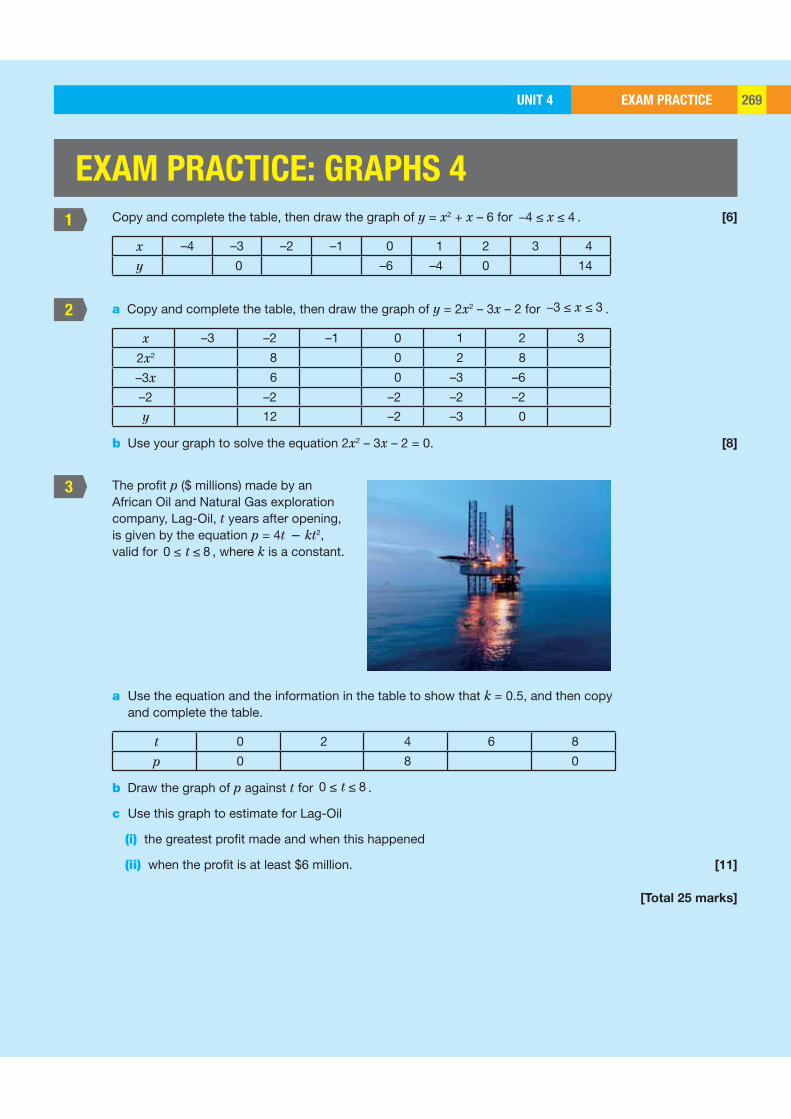
EXAM PRACTICEUNIT 4 269
1
2
3
EXAM PRACTICE: GRAPHS 4
Copy and complete the table, then draw the graph of y = x2 + x – 6 for − ≤ ≤4 4x . [6]
x –4 –3 –2 –1 0 1 2 3 4
y 0 –6 –4 0 14
a Copy and complete the table, then draw the graph of y = 2x2 – 3x – 2 for − ≤ ≤3 3x .
x –3 –2 –1 0 1 2 3
2x2 8 0 2 8
–3x 6 0 –3 –6
–2 –2 –2 –2 –2
y 12 –2 –3 0
b Use your graph to solve the equation 2x2 – 3x – 2 = 0. [8]
The profit p ($ millions) made by an African Oil and Natural Gas exploration company, Lag-Oil, t years after opening, is given by the equation p = 4t – kt2, valid for ≤ ≤0 8t , where k is a constant.
a Use the equation and the information in the table to show that k = 0.5, and then copy and complete the table.
t 0 2 4 6 8
p 0 8 0
b Draw the graph of p against t for ≤ ≤0 8t .
c Use this graph to estimate for Lag-Oil
(i) the greatest profit made and when this happened
(ii) when the profit is at least $6 million. [11]
[Total 25 marks]
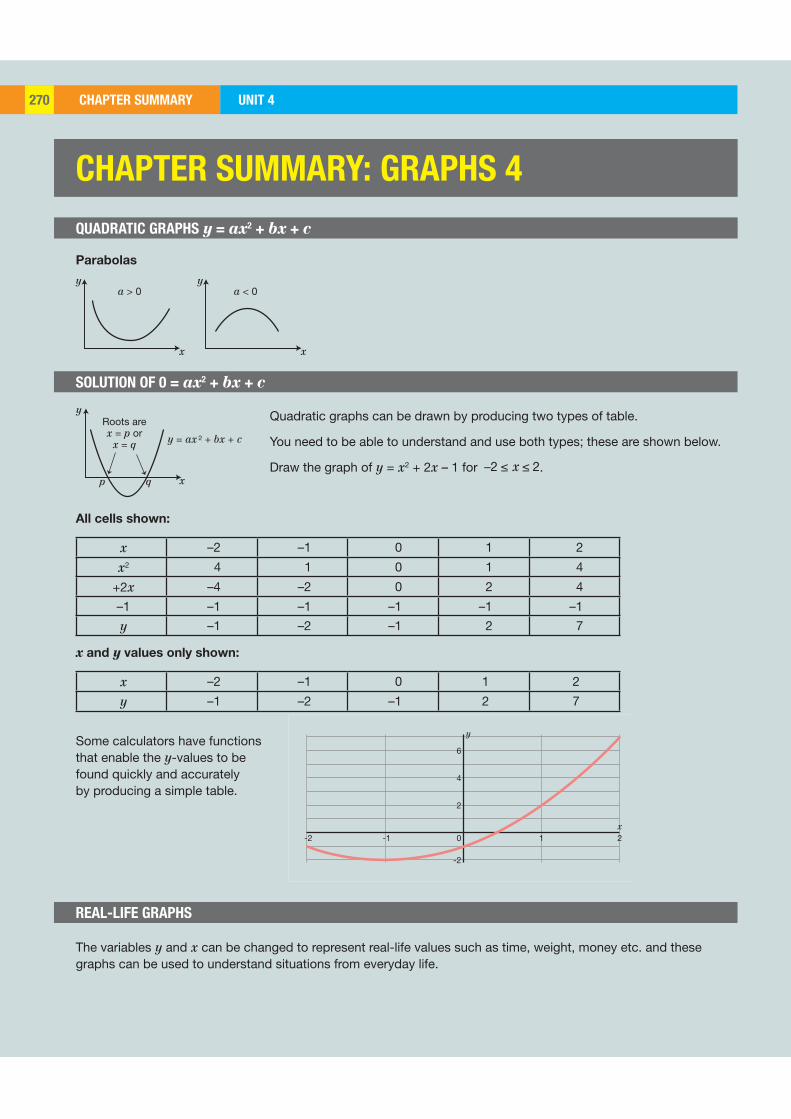
CHAPTER SUMMARY UNIT 4270
y
x
y
x
a > 0 a < 0
y
x
Roots arex = p or
x = q
p q
y = ax 2 + bx + c
y
6
4
2
-2 -1 10 2x
-2
QUADRATIC GRAPHS y = ax2 + bx + c
SOLUTION OF 0 = ax2 + bx + c
REAL-LIFE GRAPHS
Parabolas
All cells shown:
x –2 –1 0 1 2
x2 4 1 0 1 4
+2x –4 –2 0 2 4
–1 –1 –1 –1 –1 –1
y –1 –2 –1 2 7
x and y values only shown:
x –2 –1 0 1 2
y –1 –2 –1 2 7
CHAPTER SUMMARY: GRAPHS 4
Quadratic graphs can be drawn by producing two types of table.
You need to be able to understand and use both types; these are shown below.
Draw the graph of y = x2 + 2x – 1 for − ≤ ≤2 2x .
Some calculators have functions that enable the y-values to be found quickly and accurately by producing a simple table.
The variables y and x can be changed to represent real-life values such as time, weight, money etc. and these graphs can be used to understand situations from everyday life.
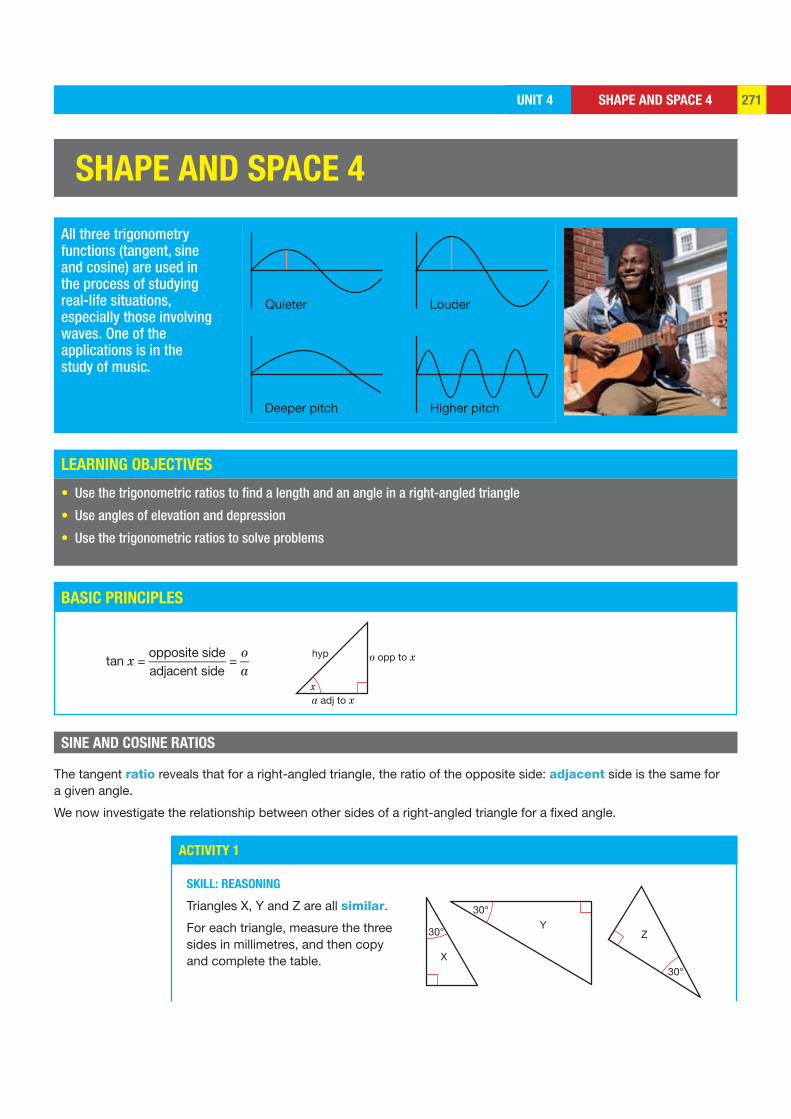
SHAPE AND SPACE 4UNIT 4 271
LEARNING OBJECTIVES
BASIC PRINCIPLES
ACTIVITY 1
x
hyp o opp to x
a adj to x
30°
30°
30°Y
Z
X
Quieter
Deeper pitch Higher pitch
Louder
SHAPE AND SPACE 4
All three trigonometry functions (tangent, sine and cosine) are used in the process of studying real-life situations, especially those involving waves. One of the applications is in the study of music.
• Use the trigonometric ratios to find a length and an angle in a right-angled triangle
• Use angles of elevation and depression
• Use the trigonometric ratios to solve problems
SINE AND COSINE RATIOS
tan x =opposite sideadjacent side
=oa
SKILL: REASONING
Triangles X, Y and Z are all similar.
For each triangle, measure the three sides in millimetres, and then copy and complete the table.
The tangent ratio reveals that for a right-angled triangle, the ratio of the opposite side: adjacent side is the same for a given angle.
We now investigate the relationship between other sides of a right-angled triangle for a fixed angle.
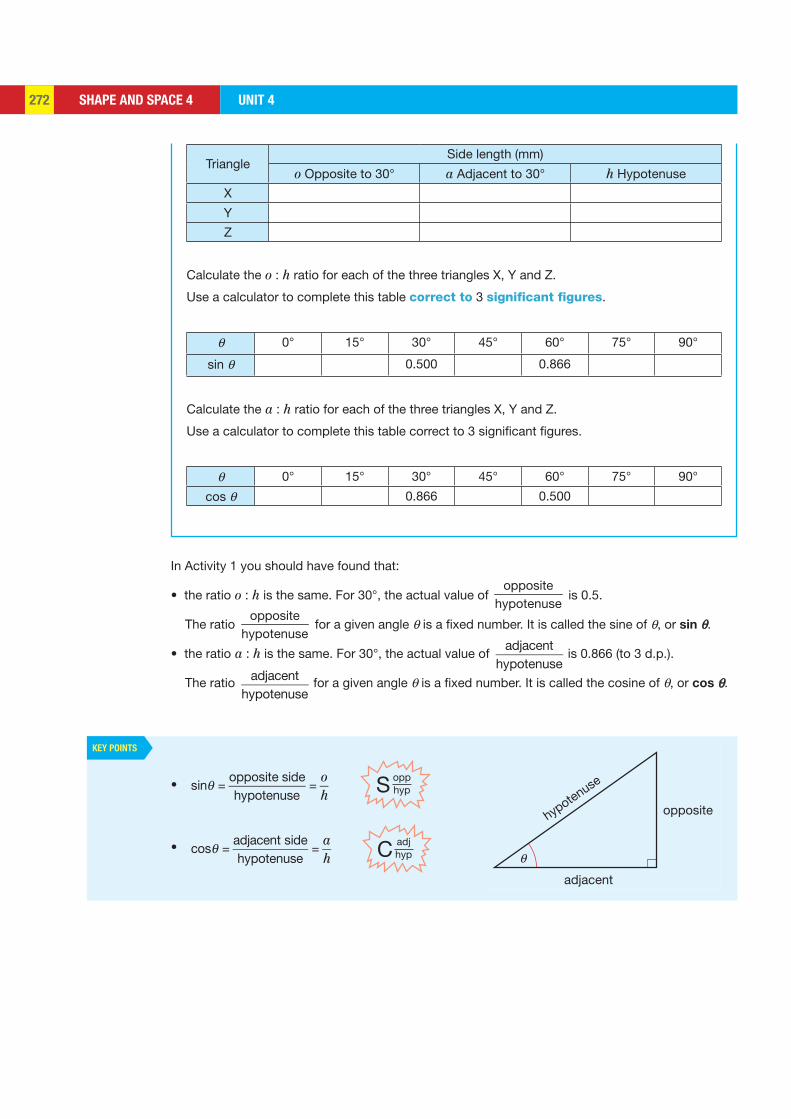
SHAPE AND SPACE 4 UNIT 4272
KEY POINTS
opphypS
adjhypC
hypotenuse
θ
opposite
adjacent
TriangleSide length (mm)
o Opposite to 30° a Adjacent to 30° h Hypotenuse
X
Y
Z
Calculate the o : h ratio for each of the three triangles X, Y and Z.
Use a calculator to complete this table correct to 3 significant figures.
θ 0° 15° 30° 45° 60° 75° 90°
sin θ 0.500 0.866
Calculate the a : h ratio for each of the three triangles X, Y and Z.
Use a calculator to complete this table correct to 3 significant figures.
θ 0° 15° 30° 45° 60° 75° 90°
cos θ 0.866 0.500
In Activity 1 you should have found that:
• the ratio o : h is the same. For 30°, the actual value of opposite
hypotenuse is 0.5.
The ratio opposite
hypotenuse for a given angle θ is a fixed number. It is called the sine of θ, or sin θ.
• the ratio a : h is the same. For 30°, the actual value of adjacent
hypotenuse is 0.866 (to 3 d.p.).
The ratio adjacenthypotenuse
for a given angle θ is a fixed number. It is called the cosine of θ, or cos θ.
• sin =opposite sidehypotenuse
=oh
• cos =adjacent sidehypotenuse
=ah
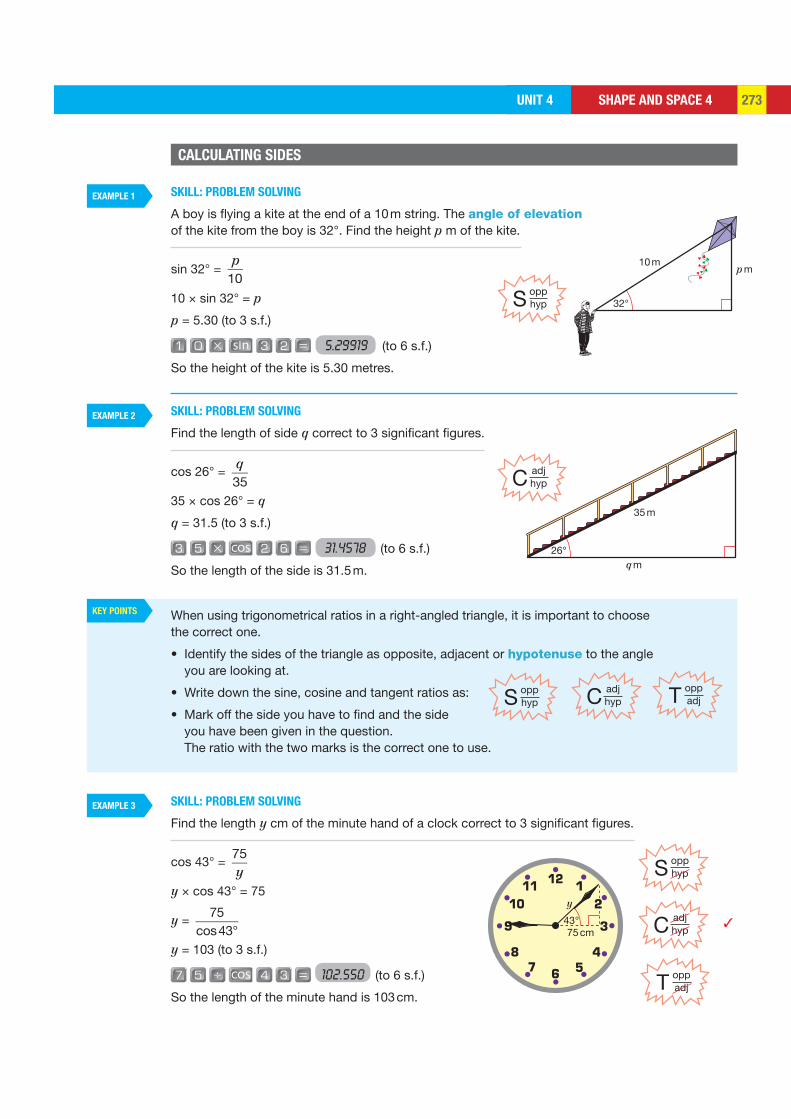
SHAPE AND SPACE 4UNIT 4 273
KEY POINTS
EXAMPLE 1
EXAMPLE 2
EXAMPLE 3
32°
10 mp m
opphypS
26°
35 m
q m
adjhypC
opphypS
opphypS adj
hypC oppadjT
75 cm
y
43° adjhyp
✓C
oppadjT
SKILL: PROBLEM SOLVING
A boy is flying a kite at the end of a 10 m string. The angle of elevation of the kite from the boy is 32°. Find the height p m of the kite.
sin 32° = p
10
10 × sin 32° = p
p = 5.30 (to 3 s.f.)
5.29919 (to 6 s.f.)
So the height of the kite is 5.30 metres.
SKILL: PROBLEM SOLVING
Find the length of side q correct to 3 significant figures.
cos 26° = q35
35 × cos 26° = q
q = 31.5 (to 3 s.f.)
cos 31.4578 (to 6 s.f.)
So the length of the side is 31.5 m.
When using trigonometrical ratios in a right-angled triangle, it is important to choose the correct one.
• Identify the sides of the triangle as opposite, adjacent or hypotenuse to the angle you are looking at.
• Write down the sine, cosine and tangent ratios as:
• Mark off the side you have to find and the side you have been given in the question. The ratio with the two marks is the correct one to use.
SKILL: PROBLEM SOLVING
Find the length y cm of the minute hand of a clock correct to 3 significant figures.
cos 43° = 75y
y × cos 43° = 75
y = 75
cos43°
y = 103 (to 3 s.f.)
7 cos 102.550 (to 6 s.f.)
So the length of the minute hand is 103 cm.
CALCULATING SIDES
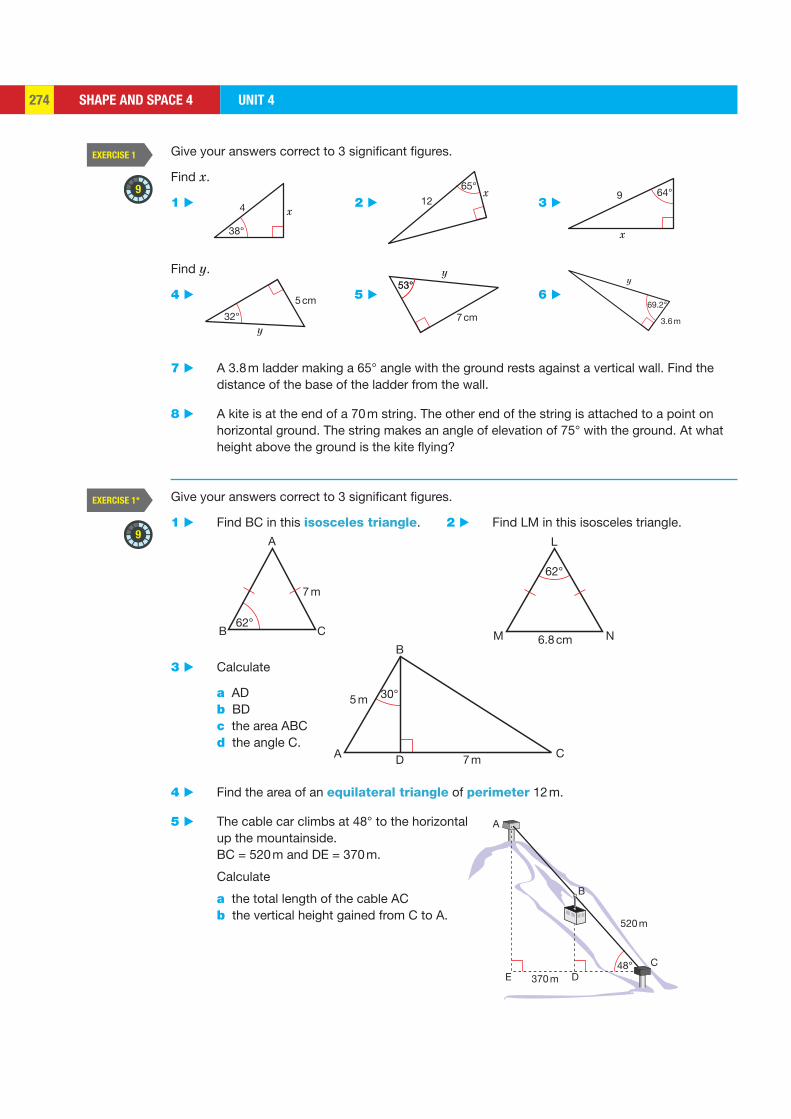
SHAPE AND SPACE 4 UNIT 4274
EXERCISE 1
EXERCISE 1*
9
9
38°
4 x
65°
12x
5 cm
32°y
53°
7 cm
y53°
69.2°
3.6 m
y
7 m
B C
A
62°
62°
6.8 cm
L
NM
5 m
7 m
30°
B
D CA
370 m
520 m
48°D
CE
A
B
64°9
x
Give your answers correct to 3 significant figures.
Find x.
1 ▶ 2 ▶ 3 ▶
Find y.
4 ▶ 5 ▶ 6 ▶
7 ▶ A 3.8 m ladder making a 65° angle with the ground rests against a vertical wall. Find the distance of the base of the ladder from the wall.
8 ▶ A kite is at the end of a 70 m string. The other end of the string is attached to a point on horizontal ground. The string makes an angle of elevation of 75° with the ground. At what height above the ground is the kite flying?
Give your answers correct to 3 significant figures.
1 ▶ Find BC in this isosceles triangle. 2 ▶ Find LM in this isosceles triangle.
3 ▶ Calculate
a AD b BD c the area ABC d the angle C.
4 ▶ Find the area of an equilateral triangle of perimeter 12 m.
5 ▶ The cable car climbs at 48° to the horizontal up the mountainside. BC = 520 m and DE = 370 m.
Calculate
a the total length of the cable AC b the vertical height gained from C to A.
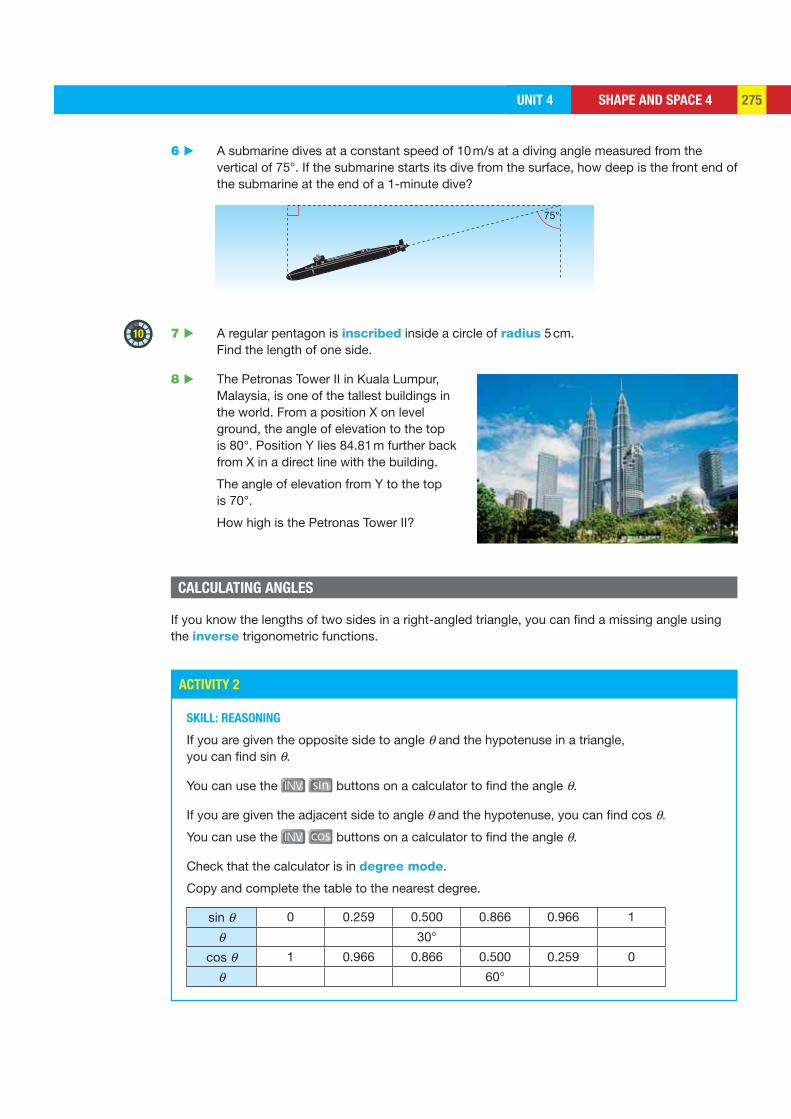
SHAPE AND SPACE 4UNIT 4 275
ACTIVITY 2
10
75°
6 ▶ A submarine dives at a constant speed of 10 m/s at a diving angle measured from the vertical of 75°. If the submarine starts its dive from the surface, how deep is the front end of the submarine at the end of a 1-minute dive?
7 ▶ A regular pentagon is inscribed inside a circle of radius 5 cm. Find the length of one side.
8 ▶ The Petronas Tower II in Kuala Lumpur, Malaysia, is one of the tallest buildings in the world. From a position X on level ground, the angle of elevation to the top is 80°. Position Y lies 84.81 m further back from X in a direct line with the building.
The angle of elevation from Y to the top is 70°.
How high is the Petronas Tower II?
If you know the lengths of two sides in a right-angled triangle, you can find a missing angle using the inverse trigonometric functions.
SKILL: REASONING
If you are given the opposite side to angle θ and the hypotenuse in a triangle, you can find sin θ.
You can use the buttons on a calculator to find the angle θ.
If you are given the adjacent side to angle θ and the hypotenuse, you can find cos θ.
You can use the cos buttons on a calculator to find the angle θ.
Check that the calculator is in degree mode.
Copy and complete the table to the nearest degree.
sin θ 0 0.259 0.500 0.866 0.966 1
θ 30°
cos θ 1 0.966 0.866 0.500 0.259 0
θ 60°
CALCULATING ANGLES
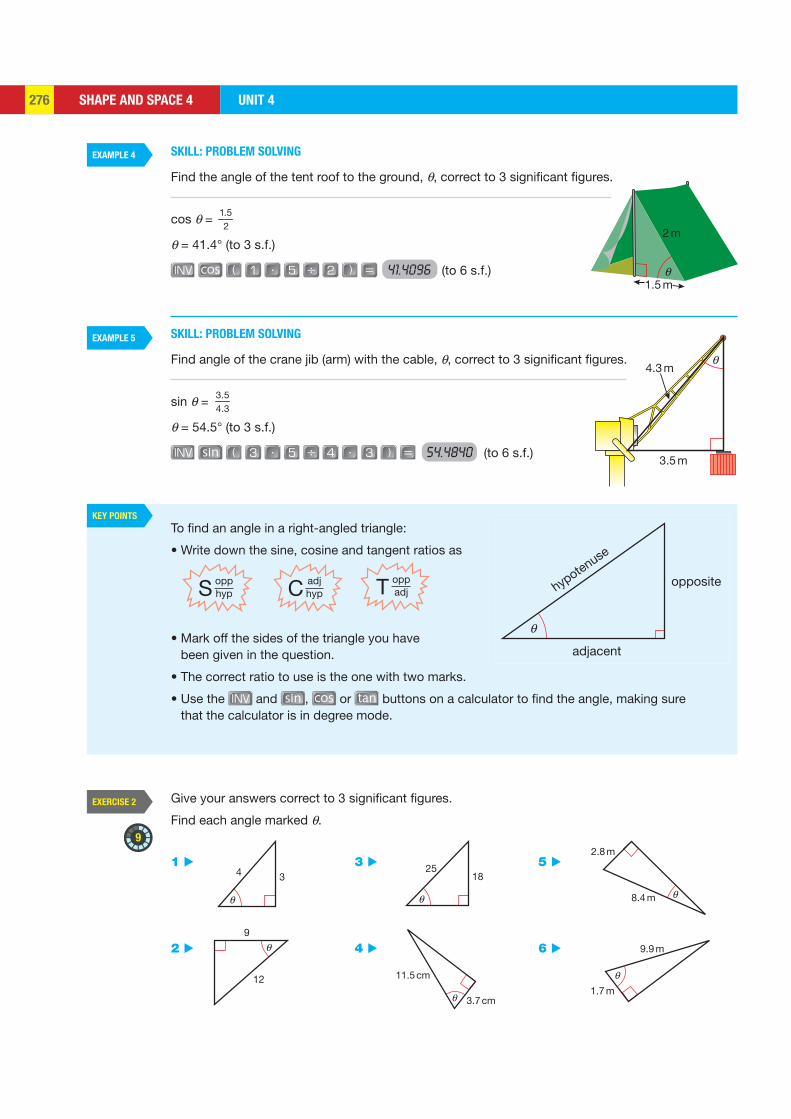
SHAPE AND SPACE 4 UNIT 4276
EXAMPLE 4
EXAMPLE 5
KEY POINTS
EXERCISE 2
9
2 m
1.5 mθ
3.5 m
4.3 mθ
opphypS
oppadjTadj
hypC
4 3
12
9
2518
11.5 cm
3.7 cm
8.4 m
2.8 m
9.9 m
1.7 m
hypotenuse
opposite
adjacent
θ
SKILL: PROBLEM SOLVING
Find the angle of the tent roof to the ground, θ, correct to 3 significant figures.
cos θ = 1.52
θ = 41.4° (to 3 s.f.)
cos 41.4096 (to 6 s.f.)
SKILL: PROBLEM SOLVING
Find angle of the crane jib (arm) with the cable, θ, correct to 3 significant figures.
sin θ = 3.54.3
θ = 54.5° (to 3 s.f.)
54.4840 (to 6 s.f.)
To find an angle in a right-angled triangle:
• Write down the sine, cosine and tangent ratios as
• Mark off the sides of the triangle you have been given in the question.
• The correct ratio to use is the one with two marks.
• Use the and , cos or tan buttons on a calculator to find the angle, making sure that the calculator is in degree mode.
Give your answers correct to 3 significant figures.
Find each angle marked θ.
1 ▶ 3 ▶ 5 ▶
2 ▶ 4 ▶ 6 ▶
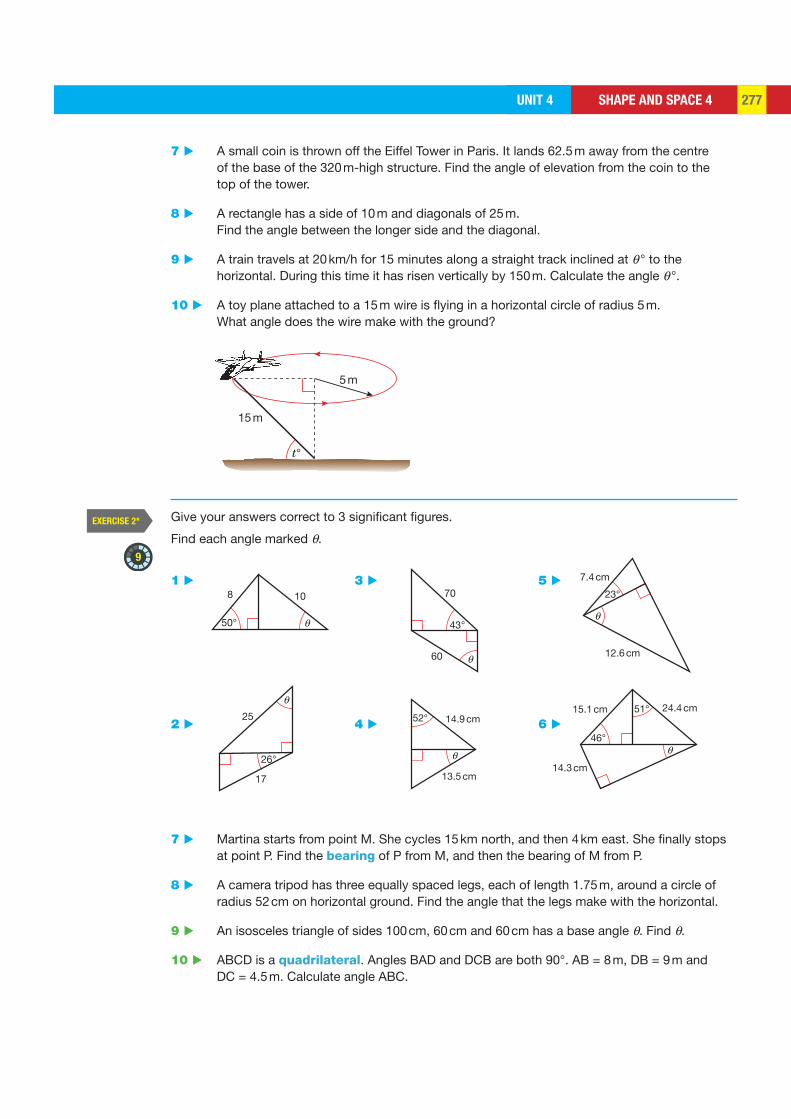
SHAPE AND SPACE 4UNIT 4 277
EXERCISE 2*
9
15 m
5 m
t°
8 10
50° θ
24.4 cm15.1 cm
14.3 cm
46°
51°
θ26°
25
17
θ
43°
70
60 θ
52° 14.9 cm
13.5 cm
θ
7.4 cm
23°
12.6 cm
θ
7 ▶ A small coin is thrown off the Eiffel Tower in Paris. It lands 62.5 m away from the centre of the base of the 320 m-high structure. Find the angle of elevation from the coin to the top of the tower.
8 ▶ A rectangle has a side of 10 m and diagonals of 25 m. Find the angle between the longer side and the diagonal.
9 ▶ A train travels at 20 km/h for 15 minutes along a straight track inclined at θ ° to the horizontal. During this time it has risen vertically by 150 m. Calculate the angle θ °.
10 ▶ A toy plane attached to a 15 m wire is flying in a horizontal circle of radius 5 m. What angle does the wire make with the ground?
Give your answers correct to 3 significant figures.
Find each angle marked θ.
1 ▶ 3 ▶ 5 ▶
2 ▶ 4 ▶ 6 ▶
7 ▶ Martina starts from point M. She cycles 15 km north, and then 4 km east. She finally stops at point P. Find the bearing of P from M, and then the bearing of M from P.
8 ▶ A camera tripod has three equally spaced legs, each of length 1.75 m, around a circle of radius 52 cm on horizontal ground. Find the angle that the legs make with the horizontal.
9 ▶ An isosceles triangle of sides 100 cm, 60 cm and 60 cm has a base angle θ. Find θ.
10 ▶ ABCD is a quadrilateral. Angles BAD and DCB are both 90°. AB = 8 m, DB = 9 m and DC = 4.5 m. Calculate angle ABC.
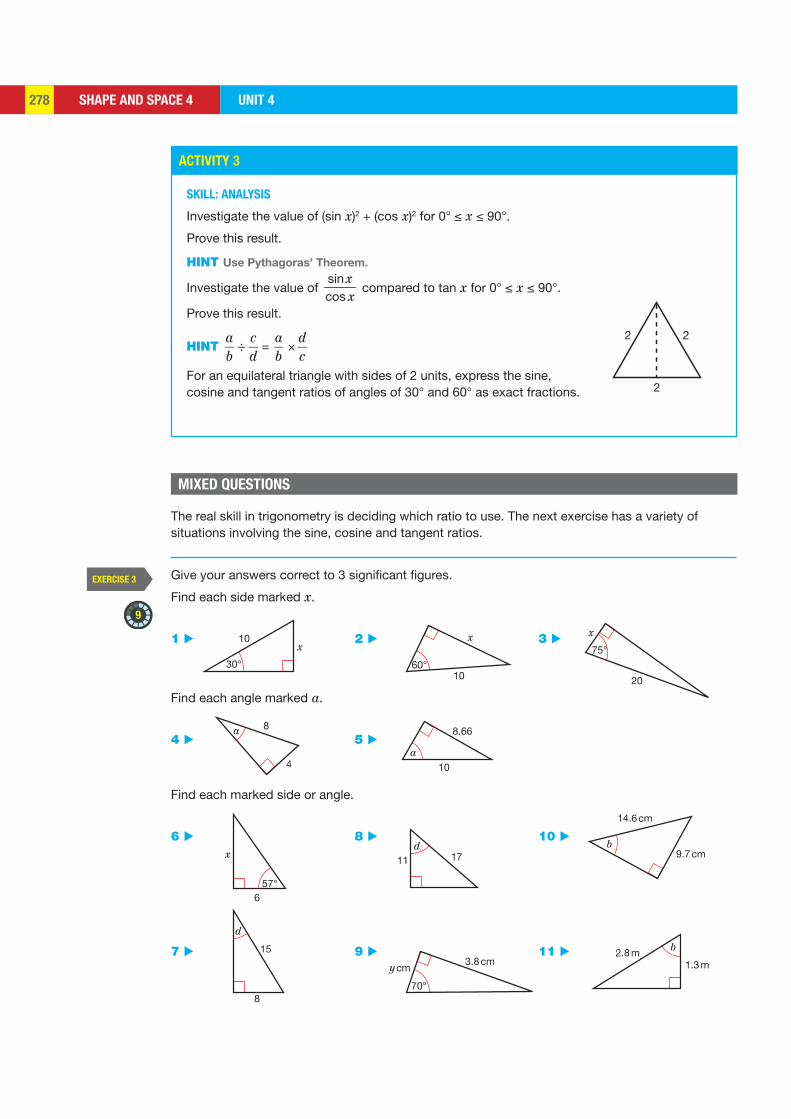
SHAPE AND SPACE 4 UNIT 4278
ACTIVITY 3
EXERCISE 3
9
2 2
2
10
30°
x
1060°
x75°
20
x
8
4
a 8.66
10a
657°
x
d
15
8
11 17d
70°
3.8 cmy cm
14.6 cm
9.7 cmb
2.8 m1.3 m
b
SKILL: ANALYSIS
Investigate the value of (sin x)2 + (cos x)2 for 0° ≤ x ≤ 90°.
Prove this result.
HINT Use Pythagoras’ Theorem.
Investigate the value of sincos
xx
compared to tan x for 0° ≤ x ≤ 90°.
Prove this result.
HINT ab
÷cd
= ab
dc
×
For an equilateral triangle with sides of 2 units, express the sine, cosine and tangent ratios of angles of 30° and 60° as exact fractions.
Give your answers correct to 3 significant figures.
Find each side marked x.
1 ▶ 2 ▶ 3 ▶
Find each angle marked a.
4 ▶ 5 ▶
Find each marked side or angle.
6 ▶ 8 ▶ 10 ▶
7 ▶ 9 ▶ 11 ▶
The real skill in trigonometry is deciding which ratio to use. The next exercise has a variety of situations involving the sine, cosine and tangent ratios.
MIXED QUESTIONS
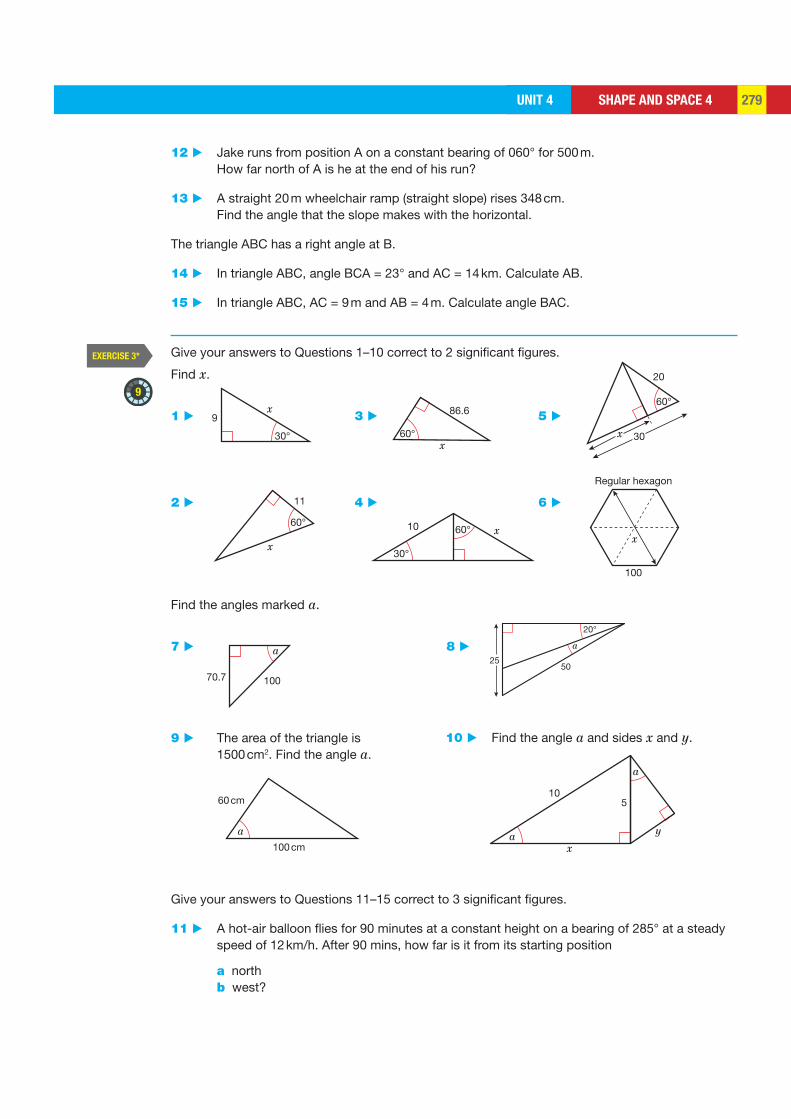
SHAPE AND SPACE 4UNIT 4 279
EXERCISE 3*
9
30°
9x
60°
11
x
60°x
86.6
30°
60°10 x
60°
20
30x
100
Regular hexagon
x
70.7 100
a25
50
a
20°
60 cm
100 cm
a
105
ax
y
a
12 ▶ Jake runs from position A on a constant bearing of 060° for 500 m. How far north of A is he at the end of his run?
13 ▶ A straight 20 m wheelchair ramp (straight slope) rises 348 cm. Find the angle that the slope makes with the horizontal.
The triangle ABC has a right angle at B.
14 ▶ In triangle ABC, angle BCA = 23° and AC = 14 km. Calculate AB.
15 ▶ In triangle ABC, AC = 9 m and AB = 4 m. Calculate angle BAC.
Give your answers to Questions 1–10 correct to 2 significant figures.
Find x.
1 ▶ 3 ▶ 5 ▶
2 ▶ 4 ▶ 6 ▶
Find the angles marked a.
7 ▶ 8 ▶
9 ▶ The area of the triangle is 1500 cm2. Find the angle a.
Give your answers to Questions 11–15 correct to 3 significant figures.
11 ▶ A hot-air balloon flies for 90 minutes at a constant height on a bearing of 285° at a steady speed of 12 km/h. After 90 mins, how far is it from its starting position
a north b west?
10 ▶ Find the angle a and sides x and y.
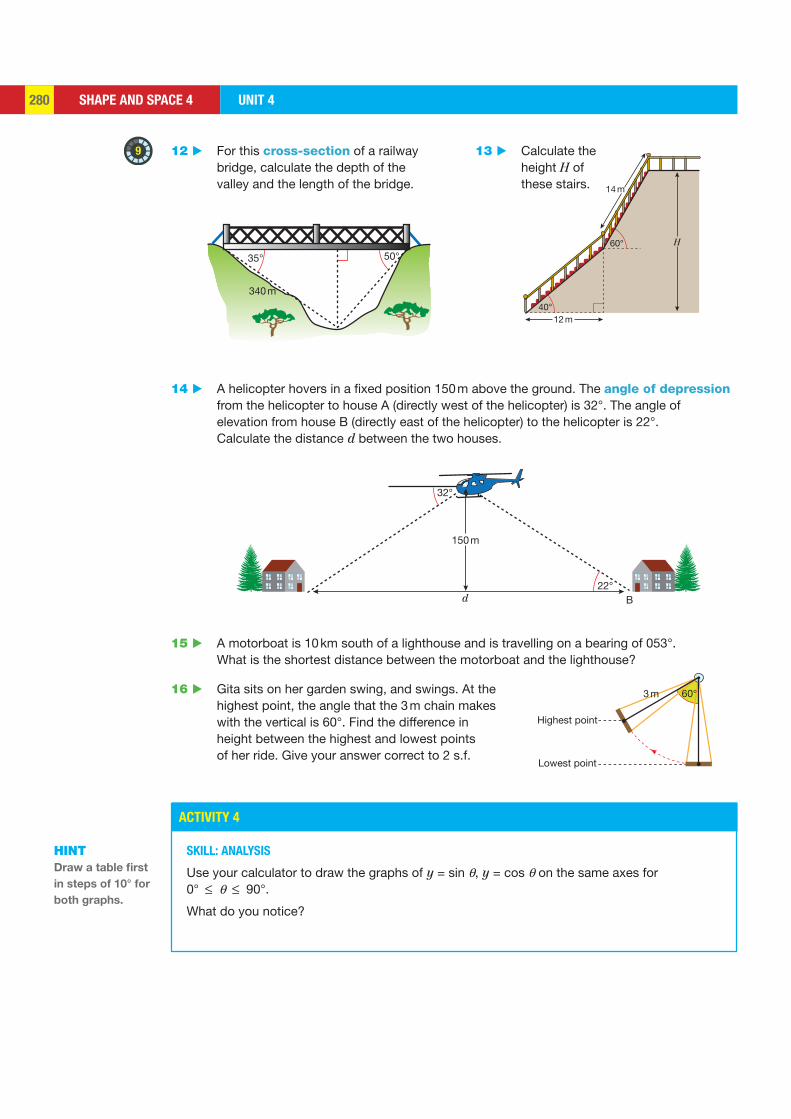
SHAPE AND SPACE 4 UNIT 4280
ACTIVITY 4
9
3 m
Highest point
Lowest point
60°
35°
340 m
50°
40°
60°
14 m
12 m
H
32°
d
150 m
22°B
12 ▶ For this cross-section of a railway bridge, calculate the depth of the valley and the length of the bridge.
14 ▶ A helicopter hovers in a fixed position 150 m above the ground. The angle of depression from the helicopter to house A (directly west of the helicopter) is 32°. The angle of elevation from house B (directly east of the helicopter) to the helicopter is 22°. Calculate the distance d between the two houses.
15 ▶ A motorboat is 10 km south of a lighthouse and is travelling on a bearing of 053°. What is the shortest distance between the motorboat and the lighthouse?
16 ▶ Gita sits on her garden swing, and swings. At the highest point, the angle that the 3 m chain makes with the vertical is 60°. Find the difference in height between the highest and lowest points of her ride. Give your answer correct to 2 s.f.
13 ▶ Calculate the height H of these stairs.
SKILL: ANALYSIS
Use your calculator to draw the graphs of y = sin θ, y = cos θ on the same axes for 0° θ 90°.
What do you notice?
HINT Draw a table first
in steps of 10° for
both graphs.
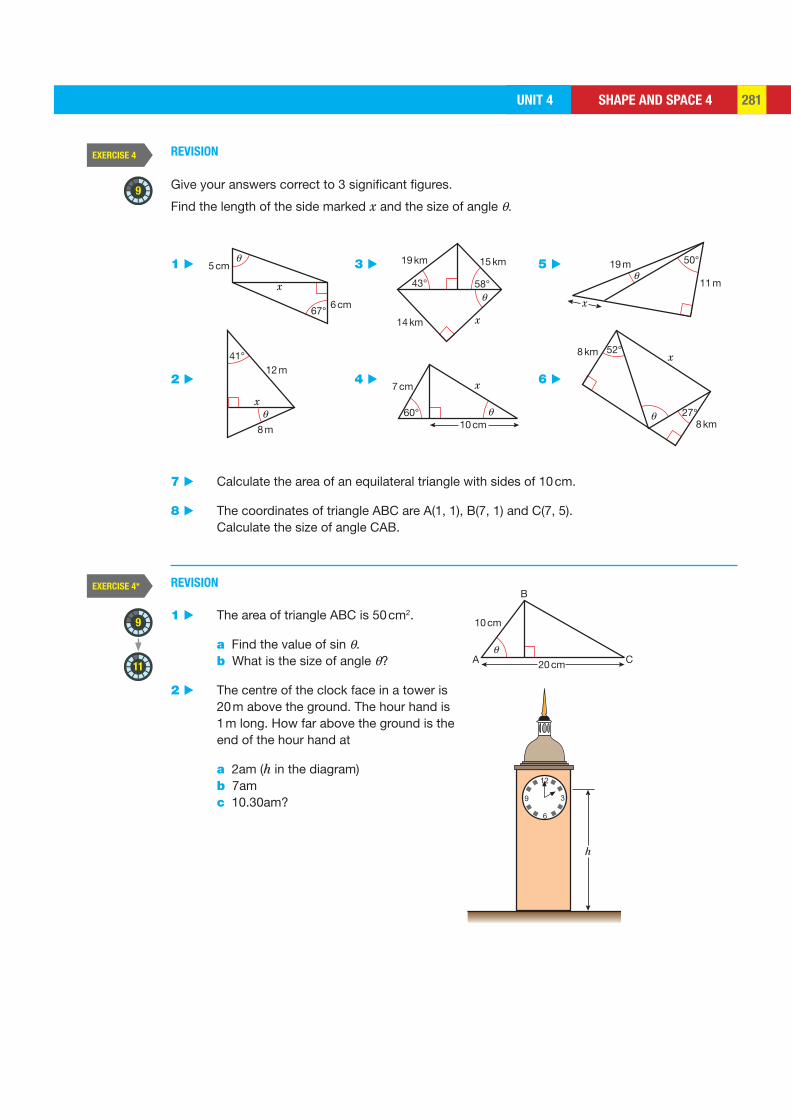
SHAPE AND SPACE 4UNIT 4 281
EXERCISE 4
EXERCISE 4*
9
9
11
41°
θx
8 m
12 m
67°
θ5 cm
6 cm
x 43° 58°θ
x
19 km 15 km
14 km
60° θ
x7 cm
10 cm
50°
θ
x
11 m
19 m
52°
27°
x
θ8 km
8 km
A
B
Cθ
20 cm
10 cm
h
REVISION
Give your answers correct to 3 significant figures.
Find the length of the side marked x and the size of angle θ.
1 ▶ 3 ▶ 5 ▶
2 ▶ 4 ▶ 6 ▶
7 ▶ Calculate the area of an equilateral triangle with sides of 10 cm.
8 ▶ The coordinates of triangle ABC are A(1, 1), B(7, 1) and C(7, 5). Calculate the size of angle CAB.
REVISION
1 ▶ The area of triangle ABC is 50 cm2.
a Find the value of sin θ. b What is the size of angle θ?
2 ▶ The centre of the clock face in a tower is 20 m above the ground. The hour hand is 1 m long. How far above the ground is the end of the hour hand at
a 2am (h in the diagram) b 7am c 10.30am?
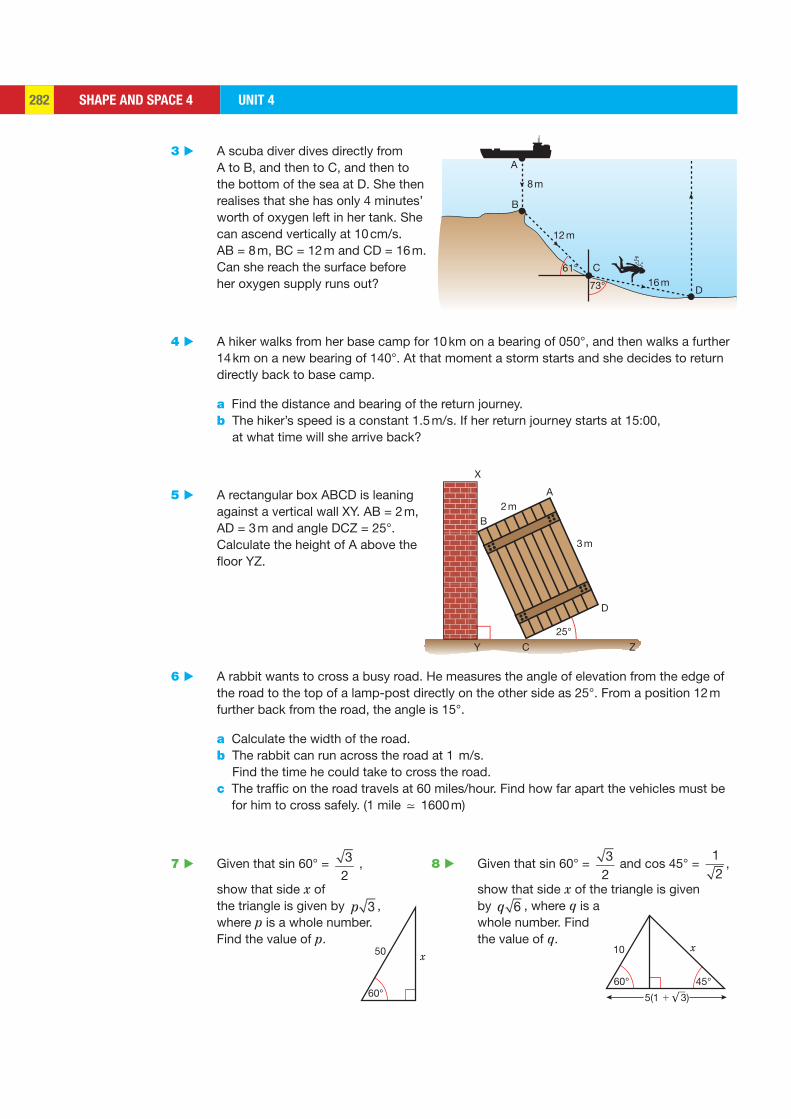
SHAPE AND SPACE 4 UNIT 4282
3 m
2 m
X
B
A
D
C
25°
Y Z
60°
50 x
60° 45°
5(1 1 3)
10 x
61°
73°
C
D
12 m
16 m
8 m
A
B
3 ▶ A scuba diver dives directly from A to B, and then to C, and then to the bottom of the sea at D. She then realises that she has only 4 minutes’ worth of oxygen left in her tank. She can ascend vertically at 10 cm/s. AB = 8 m, BC = 12 m and CD = 16 m. Can she reach the surface before her oxygen supply runs out?
4 ▶ A hiker walks from her base camp for 10 km on a bearing of 050°, and then walks a further 14 km on a new bearing of 140°. At that moment a storm starts and she decides to return directly back to base camp.
a Find the distance and bearing of the return journey. b The hiker’s speed is a constant 1.5 m/s. If her return journey starts at 15:00,
at what time will she arrive back?
5 ▶ A rectangular box ABCD is leaning against a vertical wall XY. AB = 2 m, AD = 3 m and angle DCZ = 25°. Calculate the height of A above the floor YZ.
6 ▶ A rabbit wants to cross a busy road. He measures the angle of elevation from the edge of the road to the top of a lamp-post directly on the other side as 25°. From a position 12 m further back from the road, the angle is 15°.
a Calculate the width of the road. b The rabbit can run across the road at 1 m/s.
Find the time he could take to cross the road. c The traffic on the road travels at 60 miles/hour. Find how far apart the vehicles must be
for him to cross safely. (1 mile 1600 m)
7 ▶ Given that sin 60° = 32
,
show that side x of the triangle is given by p 3 , where p is a whole number. Find the value of p.
8 ▶ Given that sin 60° = 32
and cos 45° = 12
,
show that side x of the triangle is given by q 6 , where q is a whole number. Find the value of q.
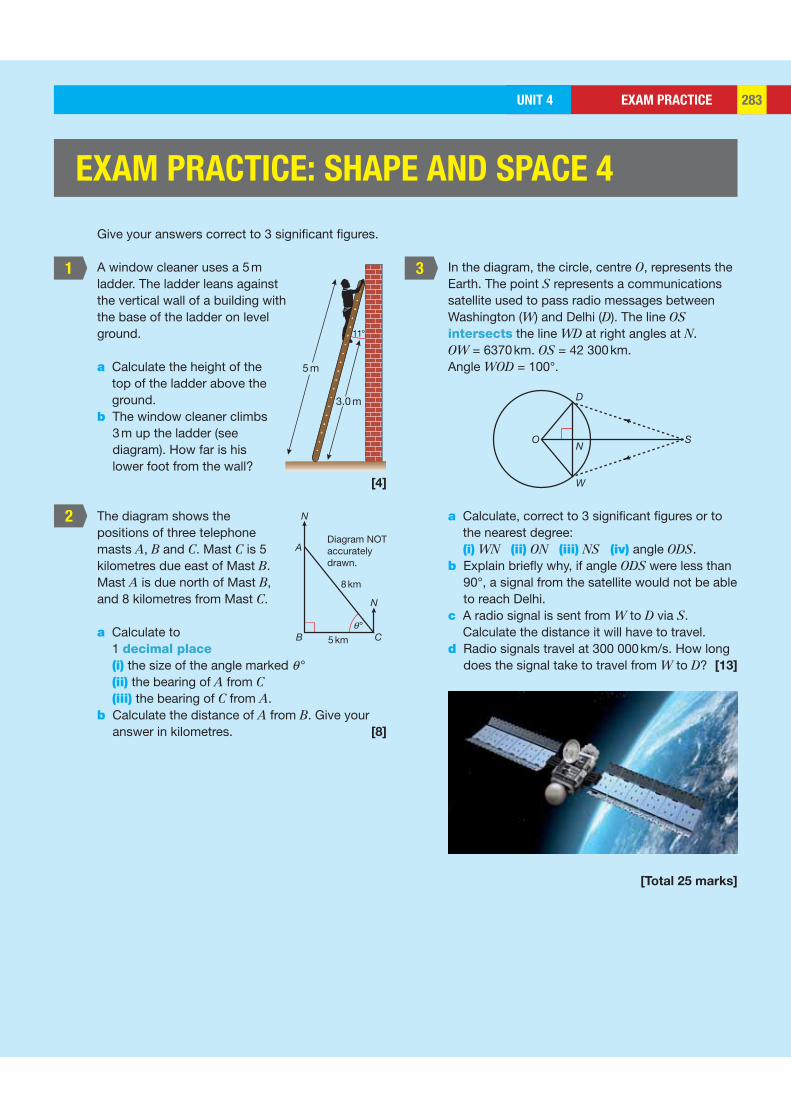
EXAM PRACTICEUNIT 4 283283
1
2
3
5 m
3.0 m
11°
5 km
8 km
Diagram NOTaccuratelydrawn.
B C
A
N
θ°
N
O
D
W
NS
Give your answers correct to 3 significant figures.
A window cleaner uses a 5 m ladder. The ladder leans against the vertical wall of a building with the base of the ladder on level ground.
a Calculate the height of the top of the ladder above the ground.
b The window cleaner climbs 3 m up the ladder (see diagram). How far is his lower foot from the wall? [4]
The diagram shows the positions of three telephone masts A, B and C. Mast C is 5 kilometres due east of Mast B. Mast A is due north of Mast B, and 8 kilometres from Mast C.
a Calculate to 1 decimal place (i) the size of the angle marked θ ° (ii) the bearing of A from C (iii) the bearing of C from A.
b Calculate the distance of A from B. Give your answer in kilometres. [8]
In the diagram, the circle, centre O, represents the Earth. The point S represents a communications satellite used to pass radio messages between Washington (W) and Delhi (D). The line OS intersects the line WD at right angles at N. OW = 6370 km. OS = 42 300 km. Angle WOD = 100°.
a Calculate, correct to 3 significant figures or to the nearest degree: (i) WN (ii) ON (iii) NS (iv) angle ODS.
b Explain briefly why, if angle ODS were less than 90°, a signal from the satellite would not be able to reach Delhi.
c A radio signal is sent from W to D via S. Calculate the distance it will have to travel.
d Radio signals travel at 300 000 km/s. How long does the signal take to travel from W to D? [13]
[Total 25 marks]
EXAM PRACTICE: SHAPE AND SPACE 4
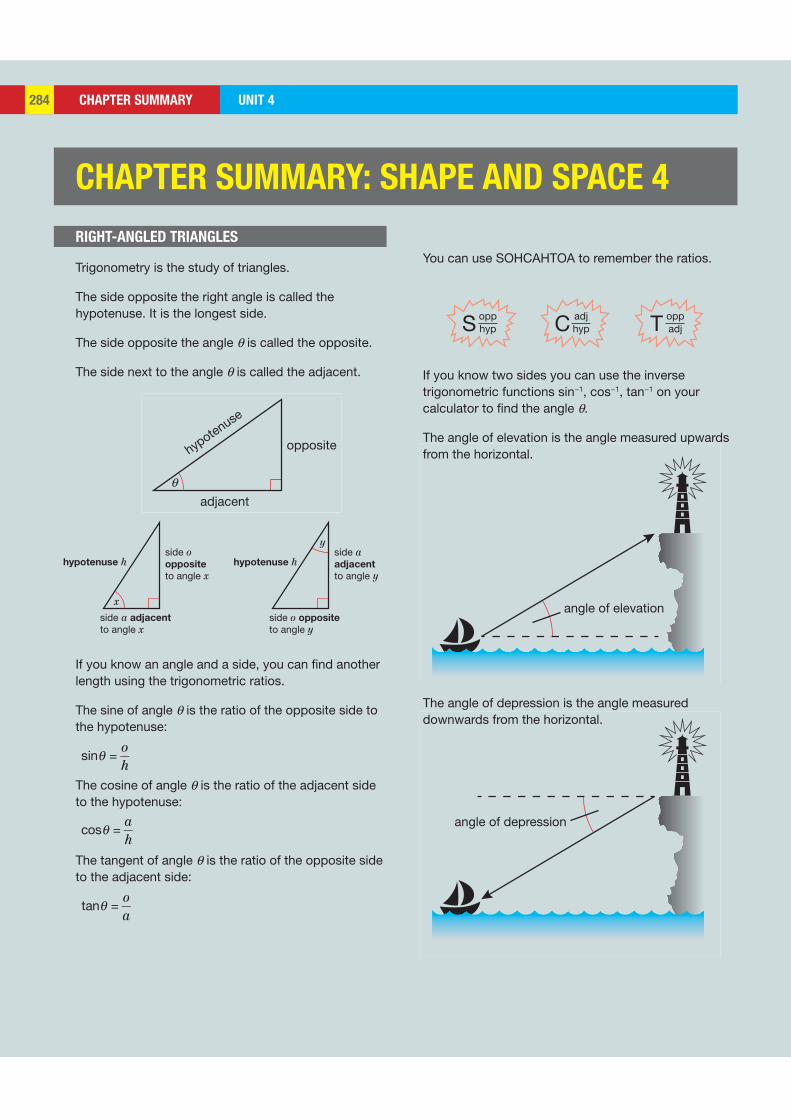
CHAPTER SUMMARY UNIT 4284 UNIT 4284
x
side a adjacent
to angle x
side oopposite
to angle xhypotenuse h
y
side o opposite
to angle y
side aadjacent
to angle yhypotenuse h
opphypS adj
hypC oppadjT
hypotenuse
θ
opposite
adjacent
angle of elevation
angle of depression
CHAPTER SUMMARY: SHAPE AND SPACE 4
RIGHT-ANGLED TRIANGLES
You can use SOHCAHTOA to remember the ratios.
If you know two sides you can use the inverse trigonometric functions sin−1, cos−1, tan−1 on your calculator to find the angle θ.
The angle of elevation is the angle measured upwards from the horizontal.
The angle of depression is the angle measured downwards from the horizontal.
Trigonometry is the study of triangles.
The side opposite the right angle is called the hypotenuse. It is the longest side.
The side opposite the angle θ is called the opposite.
The side next to the angle θ is called the adjacent.
If you know an angle and a side, you can find another length using the trigonometric ratios.
The sine of angle θ is the ratio of the opposite side to the hypotenuse:
sin =oh
The cosine of angle θ is the ratio of the adjacent side to the hypotenuse:
cos =ah
The tangent of angle θ is the ratio of the opposite side to the adjacent side:
tan =oa
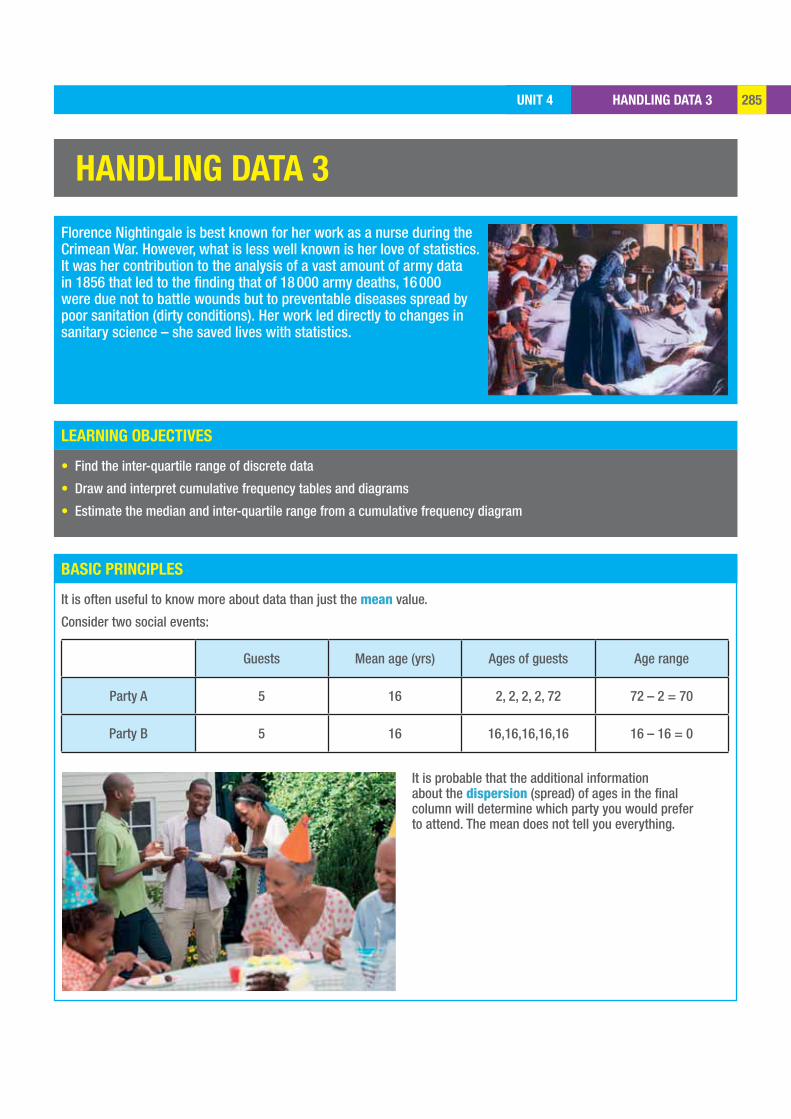
HANDLING DATA 3UNIT 4 285
LEARNING OBJECTIVES
BASIC PRINCIPLES
HANDLING DATA 3
Florence Nightingale is best known for her work as a nurse during the Crimean War. However, what is less well known is her love of statistics. It was her contribution to the analysis of a vast amount of army data in 1856 that led to the finding that of 18 000 army deaths, 16 000 were due not to battle wounds but to preventable diseases spread by poor sanitation (dirty conditions). Her work led directly to changes in sanitary science – she saved lives with statistics.
• Find the inter-quartile range of discrete data
• Draw and interpret cumulative frequency tables and diagrams
• Estimate the median and inter-quartile range from a cumulative frequency diagram
It is often useful to know more about data than just the mean value.
Consider two social events:
Guests Mean age (yrs) Ages of guests Age range
Party A 5 16 2, 2, 2, 2, 72 72 – 2 = 70
Party B 5 16 16,16,16,16,16 16 – 16 = 0
It is probable that the additional information about the dispersion (spread) of ages in the final column will determine which party you would prefer to attend. The mean does not tell you everything.
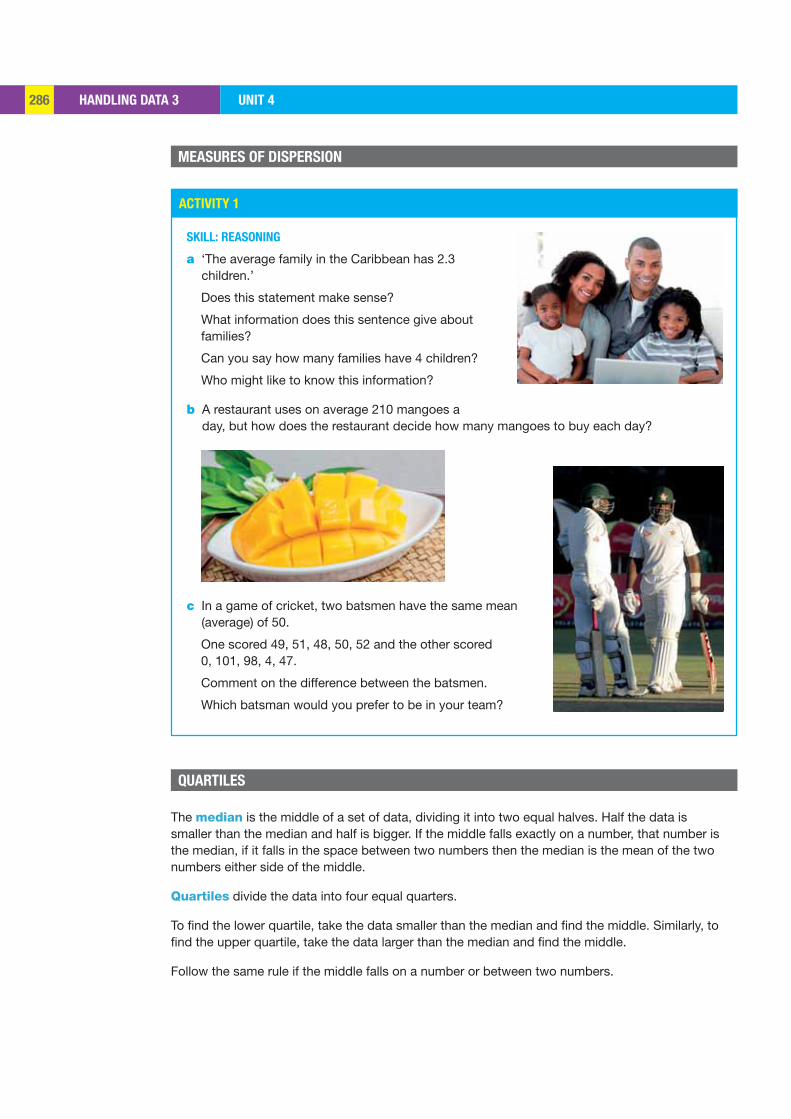
HANDLING DATA 3 UNIT 4286
ACTIVITY 1
MEASURES OF DISPERSION
QUARTILES
SKILL: REASONING
a ‘The average family in the Caribbean has 2.3 children.’
Does this statement make sense?
What information does this sentence give about families?
Can you say how many families have 4 children?
Who might like to know this information?
b A restaurant uses on average 210 mangoes a day, but how does the restaurant decide how many mangoes to buy each day?
c In a game of cricket, two batsmen have the same mean (average) of 50.
One scored 49, 51, 48, 50, 52 and the other scored 0, 101, 98, 4, 47.
Comment on the difference between the batsmen.
Which batsman would you prefer to be in your team?
The median is the middle of a set of data, dividing it into two equal halves. Half the data is smaller than the median and half is bigger. If the middle falls exactly on a number, that number is the median, if it falls in the space between two numbers then the median is the mean of the two numbers either side of the middle.
Quartiles divide the data into four equal quarters.
To find the lower quartile, take the data smaller than the median and find the middle. Similarly, to find the upper quartile, take the data larger than the median and find the middle.
Follow the same rule if the middle falls on a number or between two numbers.
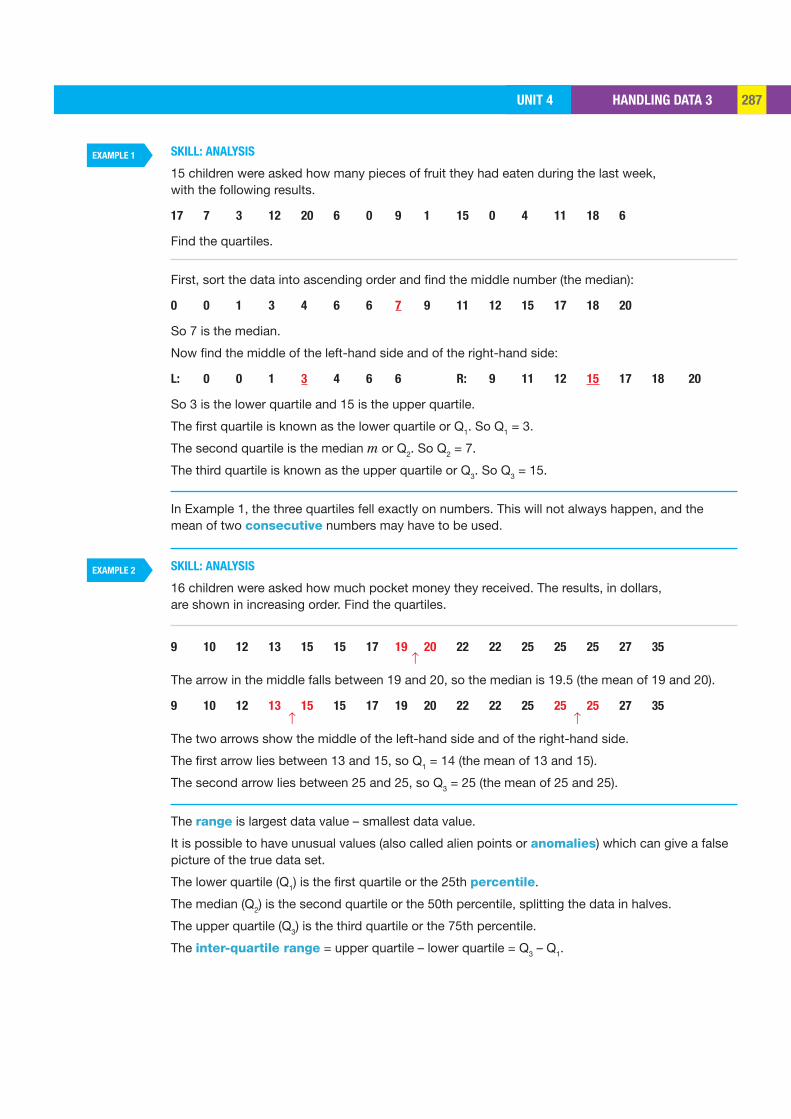
HANDLING DATA 3UNIT 4 287
EXAMPLE 1
EXAMPLE 2
SKILL: ANALYSIS
15 children were asked how many pieces of fruit they had eaten during the last week, with the following results.
17 7 3 12 20 6 0 9 1 15 0 4 11 18 6
Find the quartiles.
First, sort the data into ascending order and find the middle number (the median):
0 0 1 3 4 6 6 7 9 11 12 15 17 18 20
So 7 is the median.
Now find the middle of the left-hand side and of the right-hand side:
L: 0 0 1 3 4 6 6 R: 9 11 12 15 17 18 20
So 3 is the lower quartile and 15 is the upper quartile.
The first quartile is known as the lower quartile or Q1. So Q1 = 3.
The second quartile is the median m or Q2. So Q2 = 7.
The third quartile is known as the upper quartile or Q3. So Q3 = 15.
In Example 1, the three quartiles fell exactly on numbers. This will not always happen, and the mean of two consecutive numbers may have to be used.
SKILL: ANALYSIS
16 children were asked how much pocket money they received. The results, in dollars, are shown in increasing order. Find the quartiles.
9 10 12 13 15 15 17 19 20 22 22 25 25 25 27 35
↑The arrow in the middle falls between 19 and 20, so the median is 19.5 (the mean of 19 and 20).
9 10 12 13 15 15 17 19 20 22 22 25 25 25 27 35
↑ ↑ The two arrows show the middle of the left-hand side and of the right-hand side.
The first arrow lies between 13 and 15, so Q1 = 14 (the mean of 13 and 15).
The second arrow lies between 25 and 25, so Q3 = 25 (the mean of 25 and 25).
The range is largest data value – smallest data value.
It is possible to have unusual values (also called alien points or anomalies) which can give a false picture of the true data set.
The lower quartile (Q1) is the first quartile or the 25th percentile.
The median (Q2) is the second quartile or the 50th percentile, splitting the data in halves.
The upper quartile (Q3) is the third quartile or the 75th percentile.
The inter-quartile range = upper quartile – lower quartile = Q3 – Q1.
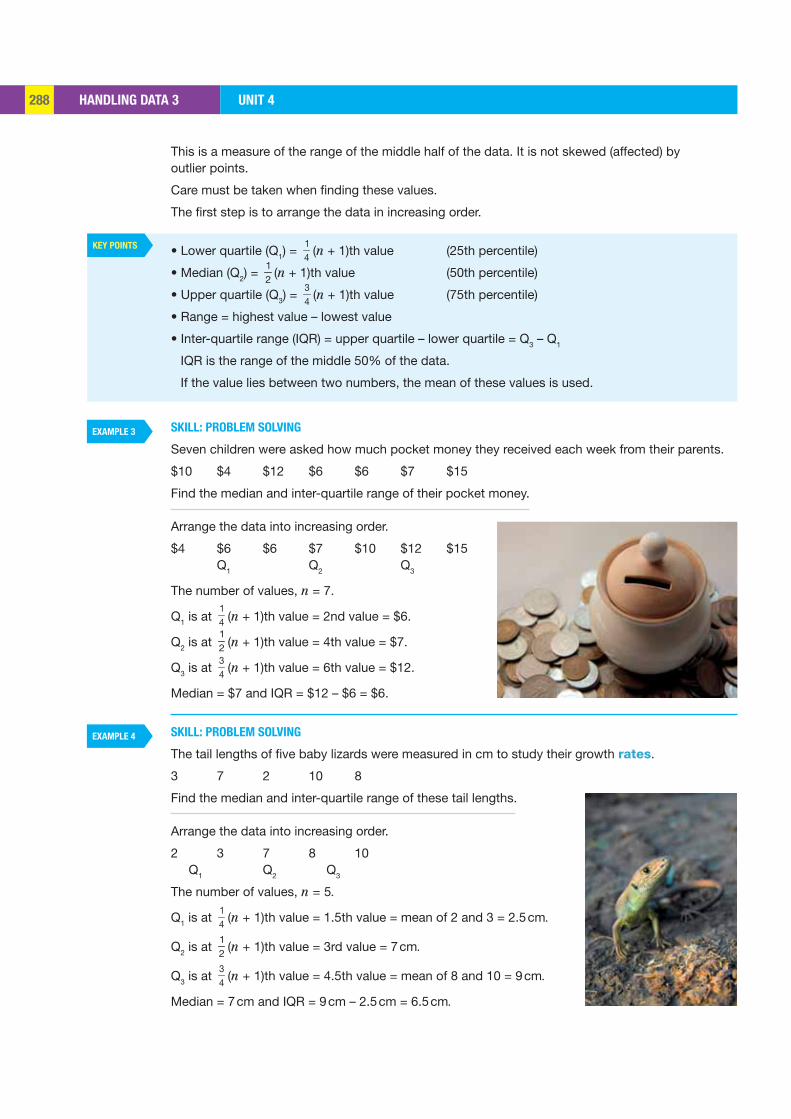
HANDLING DATA 3 UNIT 4288
KEY POINTS
EXAMPLE 3
EXAMPLE 4
This is a measure of the range of the middle half of the data. It is not skewed (affected) by outlier points.
Care must be taken when finding these values.
The first step is to arrange the data in increasing order.
• Lower quartile (Q1) = 14
(n + 1)th value (25th percentile)
• Median (Q2) = 12
(n + 1)th value (50th percentile)
• Upper quartile (Q3) = 34
(n + 1)th value (75th percentile)
• Range = highest value – lowest value
• Inter-quartile range (IQR) = upper quartile – lower quartile = Q3 – Q1
IQR is the range of the middle 50% of the data.
If the value lies between two numbers, the mean of these values is used.
SKILL: PROBLEM SOLVING
Seven children were asked how much pocket money they received each week from their parents.
$10 $4 $12 $6 $6 $7 $15
Find the median and inter-quartile range of their pocket money.
Arrange the data into increasing order.
$4 $6 $6 $7 $10 $12 $15 Q1 Q2 Q3
The number of values, n = 7.
Q1 is at 14 (n + 1)th value = 2nd value = $6.
Q2 is at 12 (n + 1)th value = 4th value = $7.
Q3 is at 34
(n + 1)th value = 6th value = $12.
Median = $7 and IQR = $12 – $6 = $6.
SKILL: PROBLEM SOLVING
The tail lengths of five baby lizards were measured in cm to study their growth rates.
3 7 2 10 8
Find the median and inter-quartile range of these tail lengths.
Arrange the data into increasing order.
2 3 7 8 10 Q1 Q2 Q3
The number of values, n = 5.
Q1 is at 14
(n + 1)th value = 1.5th value = mean of 2 and 3 = 2.5 cm.
Q2 is at 12
(n + 1)th value = 3rd value = 7 cm.
Q3 is at 34
(n + 1)th value = 4.5th value = mean of 8 and 10 = 9 cm.
Median = 7 cm and IQR = 9 cm – 2.5 cm = 6.5 cm.
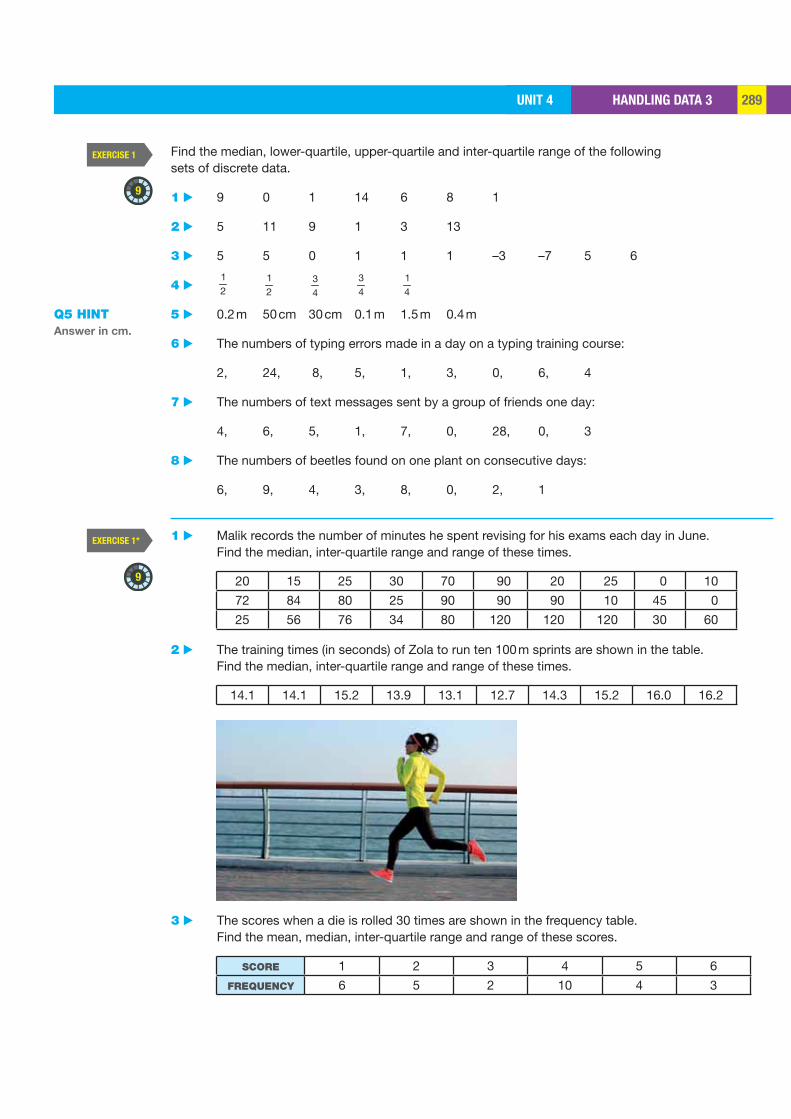
HANDLING DATA 3UNIT 4 289
EXERCISE 1
EXERCISE 1*
9
9
Find the median, lower-quartile, upper-quartile and inter-quartile range of the following sets of discrete data.
1 ▶ 9 0 1 14 6 8 1
2 ▶ 5 11 9 1 3 13
3 ▶ 5 5 0 1 1 1 –3 –7 5 6
4 ▶ 12
12
34
34
14
5 ▶ 0.2 m 50 cm 30 cm 0.1 m 1.5 m 0.4 m
6 ▶ The numbers of typing errors made in a day on a typing training course:
2, 24, 8, 5, 1, 3, 0, 6, 4
7 ▶ The numbers of text messages sent by a group of friends one day:
4, 6, 5, 1, 7, 0, 28, 0, 3
8 ▶ The numbers of beetles found on one plant on consecutive days:
6, 9, 4, 3, 8, 0, 2, 1
1 ▶ Malik records the number of minutes he spent revising for his exams each day in June. Find the median, inter-quartile range and range of these times.
20 15 25 30 70 90 20 25 0 10
72 84 80 25 90 90 90 10 45 0
25 56 76 34 80 120 120 120 30 60
2 ▶ The training times (in seconds) of Zola to run ten 100 m sprints are shown in the table. Find the median, inter-quartile range and range of these times.
14.1 14.1 15.2 13.9 13.1 12.7 14.3 15.2 16.0 16.2
3 ▶ The scores when a die is rolled 30 times are shown in the frequency table. Find the mean, median, inter-quartile range and range of these scores.
SCORE 1 2 3 4 5 6
FREQUENCY 6 5 2 10 4 3
Q5 HINTAnswer in cm.
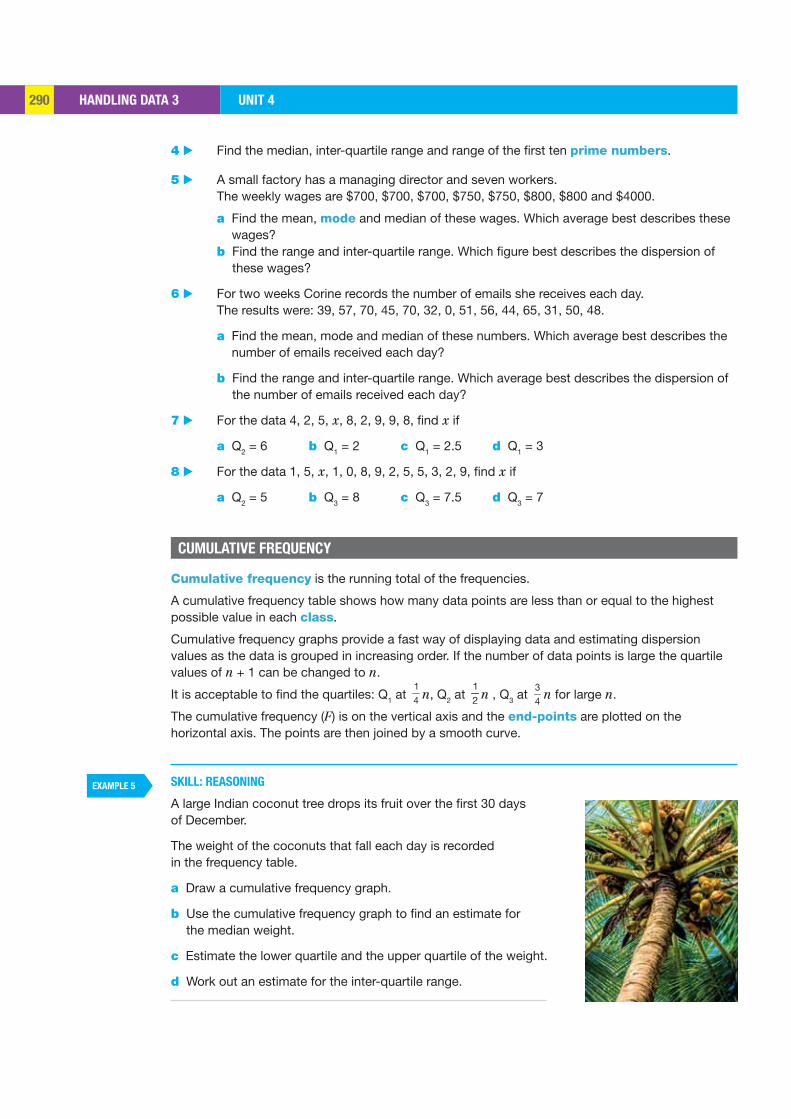
HANDLING DATA 3 UNIT 4290
EXAMPLE 5
4 ▶ Find the median, inter-quartile range and range of the first ten prime numbers.
5 ▶ A small factory has a managing director and seven workers. The weekly wages are $700, $700, $700, $750, $750, $800, $800 and $4000.
a Find the mean, mode and median of these wages. Which average best describes these wages?
b Find the range and inter-quartile range. Which figure best describes the dispersion of these wages?
6 ▶ For two weeks Corine records the number of emails she receives each day. The results were: 39, 57, 70, 45, 70, 32, 0, 51, 56, 44, 65, 31, 50, 48.
a Find the mean, mode and median of these numbers. Which average best describes the number of emails received each day?
b Find the range and inter-quartile range. Which average best describes the dispersion of the number of emails received each day?
7 ▶ For the data 4, 2, 5, x, 8, 2, 9, 9, 8, find x if
a Q2 = 6 b Q1 = 2 c Q1 = 2.5 d Q1 = 3
8 ▶ For the data 1, 5, x, 1, 0, 8, 9, 2, 5, 5, 3, 2, 9, find x if
a Q2 = 5 b Q3 = 8 c Q3 = 7.5 d Q3 = 7
Cumulative frequency is the running total of the frequencies.
A cumulative frequency table shows how many data points are less than or equal to the highest possible value in each class.
Cumulative frequency graphs provide a fast way of displaying data and estimating dispersion values as the data is grouped in increasing order. If the number of data points is large the quartile values of n + 1 can be changed to n.
It is acceptable to find the quartiles: Q1 at 14 n, Q2 at
12 n , Q3 at
34
n for large n.
The cumulative frequency (F) is on the vertical axis and the end-points are plotted on the horizontal axis. The points are then joined by a smooth curve.
SKILL: REASONING
A large Indian coconut tree drops its fruit over the first 30 days of December.
The weight of the coconuts that fall each day is recorded in the frequency table.
a Draw a cumulative frequency graph.
b Use the cumulative frequency graph to find an estimate for the median weight.
c Estimate the lower quartile and the upper quartile of the weight.
d Work out an estimate for the inter-quartile range.
CUMULATIVE FREQUENCY
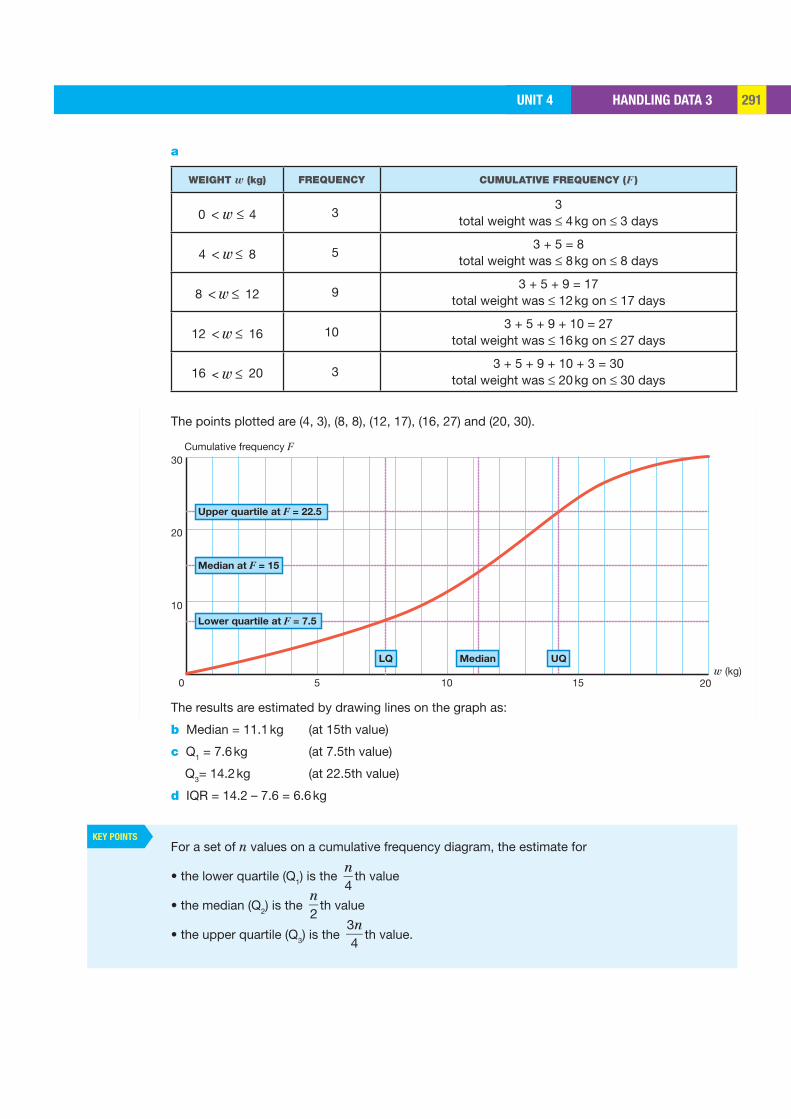
HANDLING DATA 3UNIT 4 291
KEY POINTS
Cumulative frequency F30
20
10
50 10w (kg)
2015
Median at F = 15
Upper quartile at F = 22.5
Lower quartile at F = 7.5
MedianLQ UQ
a
WEIGHT w (kg) FREQUENCY CUMULATIVE FREQUENCY ( F )
0 < w 4 33
total weight was ≤ 4 kg on ≤ 3 days
4 < w 8 53 + 5 = 8
total weight was ≤ 8 kg on ≤ 8 days
8 < w 12 93 + 5 + 9 = 17
total weight was ≤ 12 kg on ≤ 17 days
12 < w 16 103 + 5 + 9 + 10 = 27
total weight was ≤ 16 kg on ≤ 27 days
16 < w 20 33 + 5 + 9 + 10 + 3 = 30
total weight was ≤ 20 kg on ≤ 30 days
The points plotted are (4, 3), (8, 8), (12, 17), (16, 27) and (20, 30).
The results are estimated by drawing lines on the graph as:
b Median = 11.1 kg (at 15th value)
c Q1 = 7.6 kg (at 7.5th value)
Q3= 14.2 kg (at 22.5th value)
d IQR = 14.2 – 7.6 = 6.6 kg
For a set of n values on a cumulative frequency diagram, the estimate for
• the lower quartile (Q1) is the n4
th value
• the median (Q2) is the n2
th value
• the upper quartile (Q3) is the 3n4
th value.
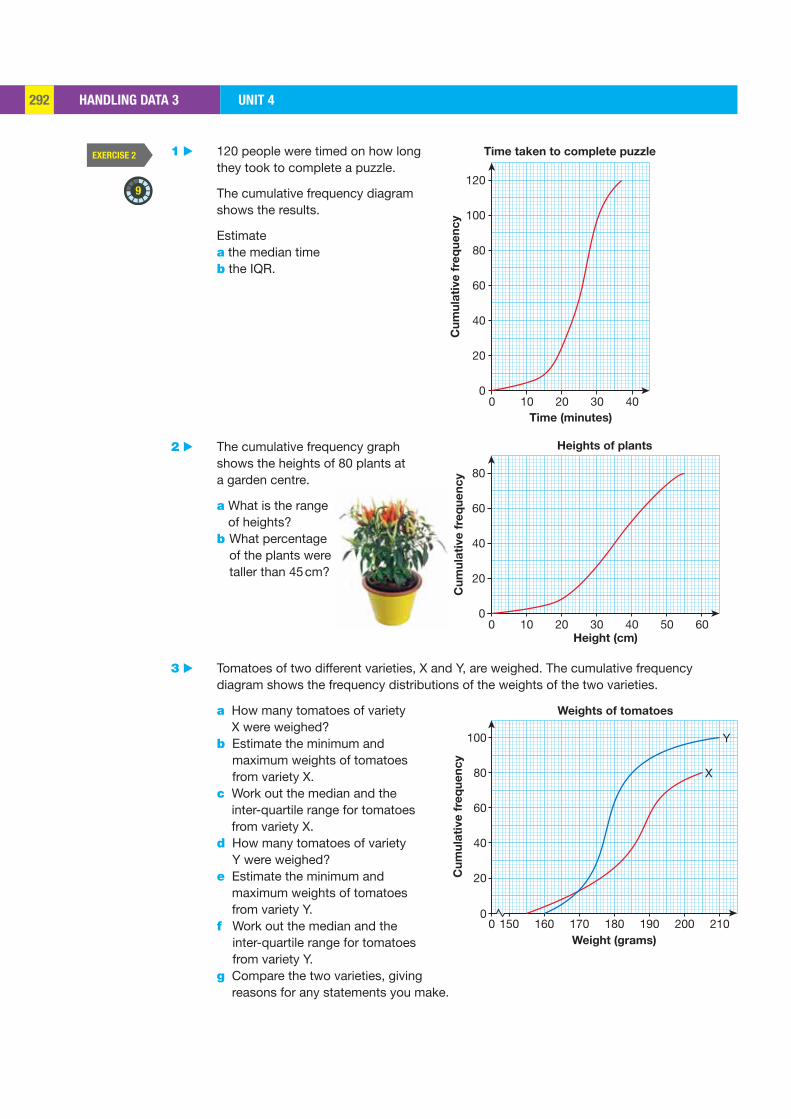
HANDLING DATA 3 UNIT 4292
EXERCISE 2
9
40
100
120
20
0
80
60
100 20 30 40Time (minutes)
Time taken to complete puzzle
Cu
mu
lati
ve
fre
qu
en
cy
40
20
80
0
60
100 20 30 40 50 60Height (cm)
Heights of plantsC
um
ula
tive
fre
qu
en
cy
20
0
40
60
80
100
1500 170 190160 180 200 210Weight (grams)
Weights of tomatoes
Cu
mu
lati
ve
fre
qu
en
cy
X
Y
1 ▶ 120 people were timed on how long they took to complete a puzzle.
The cumulative frequency diagram shows the results.
Estimate a the median time b the IQR.
2 ▶ The cumulative frequency graph shows the heights of 80 plants at a garden centre.
a What is the range of heights?
b What percentage of the plants were taller than 45 cm?
3 ▶ Tomatoes of two different varieties, X and Y, are weighed. The cumulative frequency diagram shows the frequency distributions of the weights of the two varieties.
a How many tomatoes of variety X were weighed?
b Estimate the minimum and maximum weights of tomatoes from variety X.
c Work out the median and the inter-quartile range for tomatoes from variety X.
d How many tomatoes of variety Y were weighed?
e Estimate the minimum and maximum weights of tomatoes from variety Y.
f Work out the median and the inter-quartile range for tomatoes from variety Y.
g Compare the two varieties, giving reasons for any statements you make.
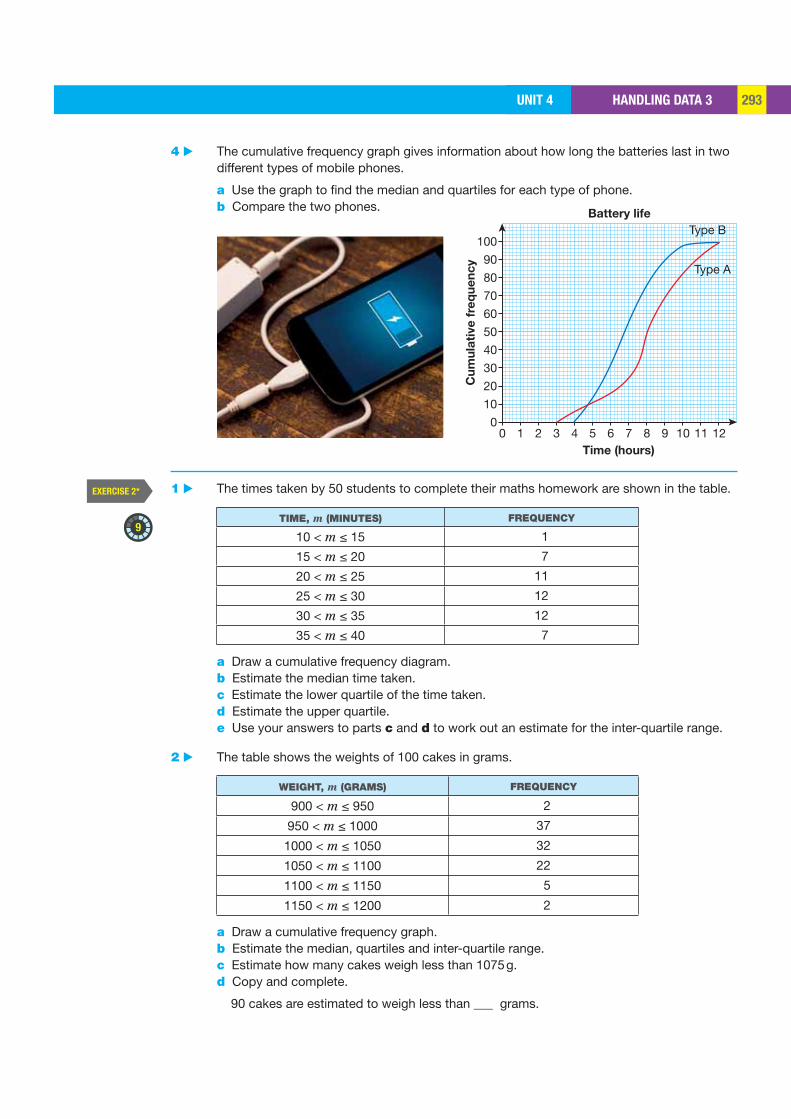
HANDLING DATA 3UNIT 4 293
EXERCISE 2*
9
20
40
60
80
90
100
10
0
30
50
70
5 10 11 124 9
Type B
Type A
3 82 710 6Time (hours)
Battery life
Cu
mu
lati
ve
fre
qu
en
cy
4 ▶ The cumulative frequency graph gives information about how long the batteries last in two different types of mobile phones.
a Use the graph to find the median and quartiles for each type of phone. b Compare the two phones.
1 ▶ The times taken by 50 students to complete their maths homework are shown in the table.
TIME, m (MINUTES) FREQUENCY
10 < m ≤ 15 1
15 < m ≤ 20 7
20 < m ≤ 25 11
25 < m ≤ 30 12
30 < m ≤ 35 12
35 < m ≤ 40 7
a Draw a cumulative frequency diagram. b Estimate the median time taken. c Estimate the lower quartile of the time taken. d Estimate the upper quartile. e Use your answers to parts c and d to work out an estimate for the inter-quartile range.
2 ▶ The table shows the weights of 100 cakes in grams.
WEIGHT, m (GRAMS) FREQUENCY
900 < m ≤ 950 2
950 < m ≤ 1000 37
1000 < m ≤ 1050 32
1050 < m ≤ 1100 22
1100 < m ≤ 1150 5
1150 < m ≤ 1200 2
a Draw a cumulative frequency graph. b Estimate the median, quartiles and inter-quartile range. c Estimate how many cakes weigh less than 1075 g. d Copy and complete.
90 cakes are estimated to weigh less than ___ grams.
HANDLING DATA 3 UNIT 4294
EXERCISE 3
9
3 ▶ The table shows the marks obtained by 50 pupils in a violin exam.
MARKS, x FREQUENCY
0 < x ≤ 30 5
30 < x ≤ 60 8
60 < x ≤ 90 14
90 < x ≤ 120 13
120 < x ≤ 150 10
a Draw a cumulative frequency table and use it to draw a cumulative frequency graph. b Use this graph to estimate the (i) median (ii) lower quartile (iii) upper quartile (iv) inter-quartile range. c If the mark for the highest grade pass (merit) in this exam was 130 marks, calculate the
percentage of pupils who gained this merit.
4 ▶ The weights (in kilograms) of the waste produced by Zara the elephant on a daily basis are shown in the table. The data is produced to check on the elephant’s health over a 50-day period.
WEIGHT, x (kg) FREQUENCY
50 < x ≤ 70 8
70 < x ≤ 90 15
90 < x ≤ 110 14
110 < x ≤ 130 9
130 < x ≤ 150 4
a Draw a cumulative frequency table and use it to draw a cumulative frequency graph. b Use this graph to estimate the (i) median (ii) lower quartile (iii) upper quartile (iv) inter-quartile range. c The park vet decides that her elephants are healthy if their daily production of waste is
more than 100 kg for at least 50% of this period. Having this information, is Zara healthy?
REVISION
1 ▶ Find the median, lower quartile, upper quartile, inter-quartile range and range of the following numbers.
a 2 5 11 2 7 4 b 5 12 9 17 19 3 3
2 ▶ Find the median, lower quartile, upper quartile, inter-quartile range and range of the first ten even numbers.
3 ▶ The times (t secs) taken by eight pupils to solve a puzzle are given below.
PUPIL A B C D E F G H
TIME, t (secs) 22 32 17 17 35 54 25 30
a Find the median, inter-quartile range and range of these times. b Which pupils are outside the middle 50%?
Q2 HINT 0 is the first even
number.
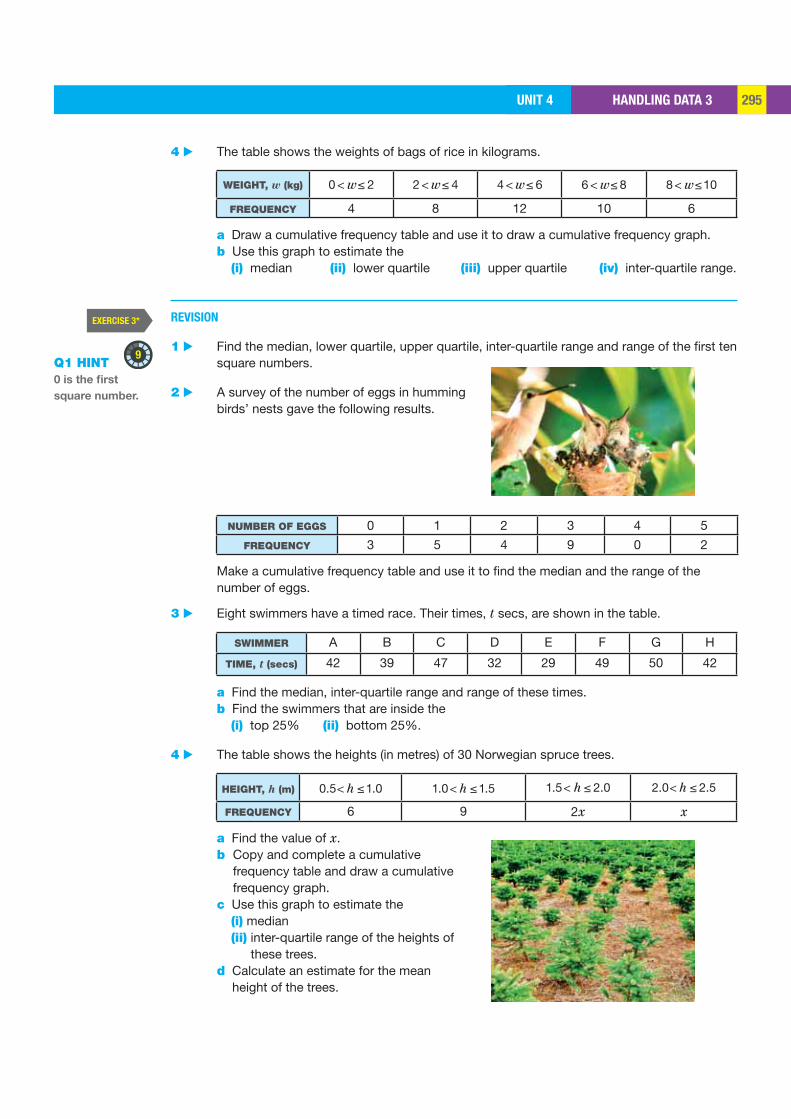
HANDLING DATA 3UNIT 4 295
EXERCISE 3*
9
4 ▶ The table shows the weights of bags of rice in kilograms.
WEIGHT, w (kg) 0 2w< ≤ 2 4w< ≤ 4 6w< ≤ 6 8w< ≤ 8 10w< ≤
FREQUENCY 4 8 12 10 6
a Draw a cumulative frequency table and use it to draw a cumulative frequency graph. b Use this graph to estimate the (i) median (ii) lower quartile (iii) upper quartile (iv) inter-quartile range.
REVISION
1 ▶ Find the median, lower quartile, upper quartile, inter-quartile range and range of the first ten square numbers.
2 ▶ A survey of the number of eggs in humming birds’ nests gave the following results.
NUMBER OF EGGS 0 1 2 3 4 5
FREQUENCY 3 5 4 9 0 2
Make a cumulative frequency table and use it to find the median and the range of the number of eggs.
3 ▶ Eight swimmers have a timed race. Their times, t secs, are shown in the table.
SWIMMER A B C D E F G H
TIME, t (secs) 42 39 47 32 29 49 50 42
a Find the median, inter-quartile range and range of these times. b Find the swimmers that are inside the (i) top 25% (ii) bottom 25%.
4 ▶ The table shows the heights (in metres) of 30 Norwegian spruce trees.
HEIGHT, h (m) 0.5 1.0< ≤h 1.0 1.5< ≤h 1.5 2.0< ≤h 2.0 2.5< ≤h
FREQUENCY 6 9 2x x
a Find the value of x. b Copy and complete a cumulative
frequency table and draw a cumulative frequency graph.
c Use this graph to estimate the (i) median (ii) inter-quartile range of the heights of
these trees. d Calculate an estimate for the mean
height of the trees.
Q1 HINT 0 is the first
square number.
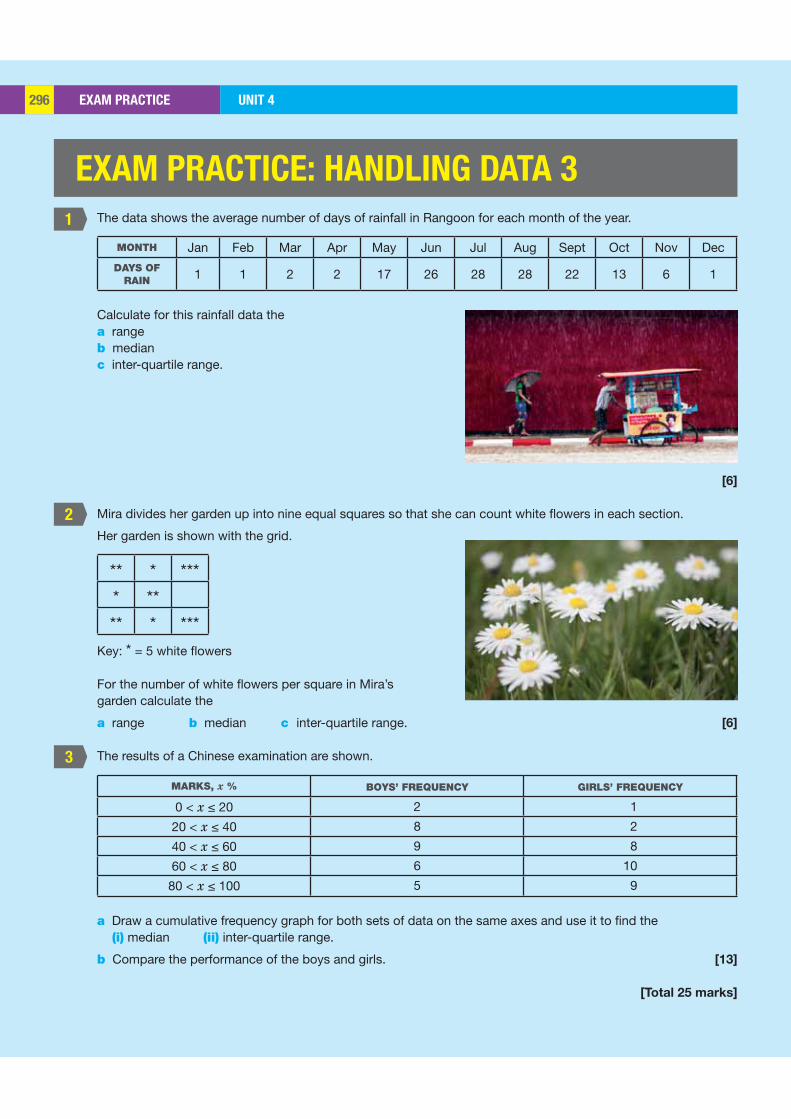
EXAM PRACTICE UNIT 4296
1
2
3
EXAM PRACTICE: HANDLING DATA 3
The data shows the average number of days of rainfall in Rangoon for each month of the year.
MONTH Jan Feb Mar Apr May Jun Jul Aug Sept Oct Nov Dec
DAYS OF RAIN 1 1 2 2 17 26 28 28 22 13 6 1
Calculate for this rainfall data the a range b median c inter-quartile range.
[6]
Mira divides her garden up into nine equal squares so that she can count white flowers in each section.
Her garden is shown with the grid.
** * **** **** * ***
Key: * = 5 white flowers
For the number of white flowers per square in Mira’s garden calculate the
a range b median c inter-quartile range. [6]
The results of a Chinese examination are shown.
MARKS, x % BOYS’ FREQUENCY GIRLS’ FREQUENCY
0 < x ≤ 20 2 1
20 < x ≤ 40 8 2
40 < x ≤ 60 9 8
60 < x ≤ 80 6 10
80 < x ≤ 100 5 9
a Draw a cumulative frequency graph for both sets of data on the same axes and use it to find the (i) median (ii) inter-quartile range.
b Compare the performance of the boys and girls. [13]
[Total 25 marks]
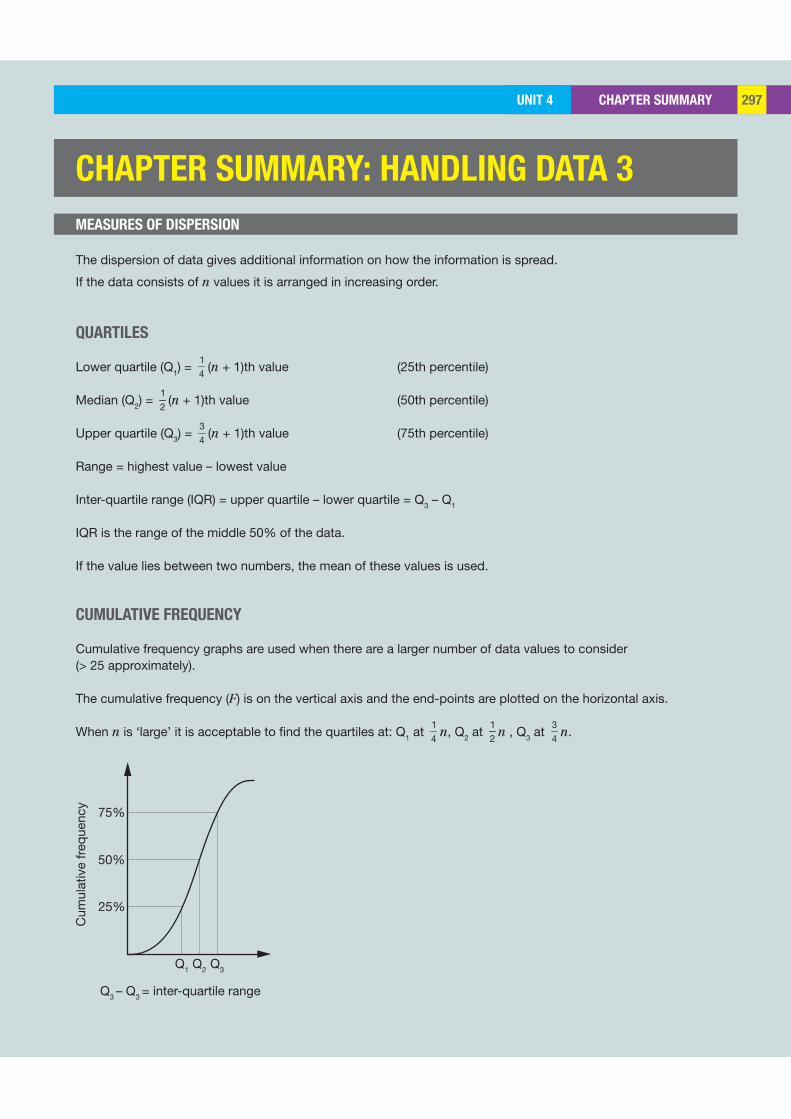
CHAPTER SUMMARYUNIT 4 297
Q1
Cum
ulat
ive
freq
uenc
y
25%
Q2 Q3
50%
75%
Q3 – Q3 = inter-quartile range
CHAPTER SUMMARY: HANDLING DATA 3
The dispersion of data gives additional information on how the information is spread.
If the data consists of n values it is arranged in increasing order.
QUARTILES
Lower quartile (Q1) = 14
(n + 1)th value (25th percentile)
Median (Q2) = 12
(n + 1)th value (50th percentile)
Upper quartile (Q3) = 34
(n + 1)th value (75th percentile)
Range = highest value – lowest value
Inter-quartile range (IQR) = upper quartile – lower quartile = Q3 – Q1
IQR is the range of the middle 50% of the data.
If the value lies between two numbers, the mean of these values is used.
CUMULATIVE FREQUENCY
Cumulative frequency graphs are used when there are a larger number of data values to consider (> 25 approximately).
The cumulative frequency (F) is on the vertical axis and the end-points are plotted on the horizontal axis.
When n is ‘large’ it is acceptable to find the quartiles at: Q1 at 14
n, Q2 at 12
n , Q3 at 34
n.
MEASURES OF DISPERSION
UNIT 5 NUMBER 299 ALGEBRA 311 GRAPHS 326 SHAPE AND SPACE 338 HANDLING DATA 357
5 is the only prime number ending in 5. A 5-sided polygon is called a pentagon and is the only polygon with the same number of diagonals as sides.
5n always ends in a 5 except when n = 0.
Human beings have 5 senses!

NUMBER 5UNIT 5 299
LEARNING OBJECTIVES
BASIC PRINCIPLES
NUMBER 5
The world’s fi rst all-electronic desktop calculator was produced in 1961. The ANITA (A New Inspiration To Arithmetic) was made in the UK. The push-button keys were the only moving parts. It weighed 15 kg compared with present-day devices which weigh about 100 g.
• Use a calculator
• Estimate an answer
• Identify the upper and lower bound of a number given the accuracy to which it has been written
• Solve problems using upper and lower bounds
CALCULATORS
The word BIDMAS will help you perform the operations in the right order.
B Brackets I Indices D Division M Multiplication A Addition S Subtraction
4.79583152
The answer can be rounded to various degrees of accuracy as shown in the table.
DEGREE OF ACCURACY SIGNIFICANT FIGURES DECIMAL PLACES
5 4.7958 4.79583
3 4.80 4.796
1 5 4.8
BIDMAS is helpful with the order of calculations. More complex calculations will require the use of brackets. Be familiar with your calculator and use the instructions that came with it when you bought it.
CALCULATOR FUNCTIONS
• To calculate 67, press x 7 279936
• To enter 2.5 × 10⁻³ (written in standard form), press x
• To enter 89 , press 8 abc 9
• To enter 3 15
, press abc abc
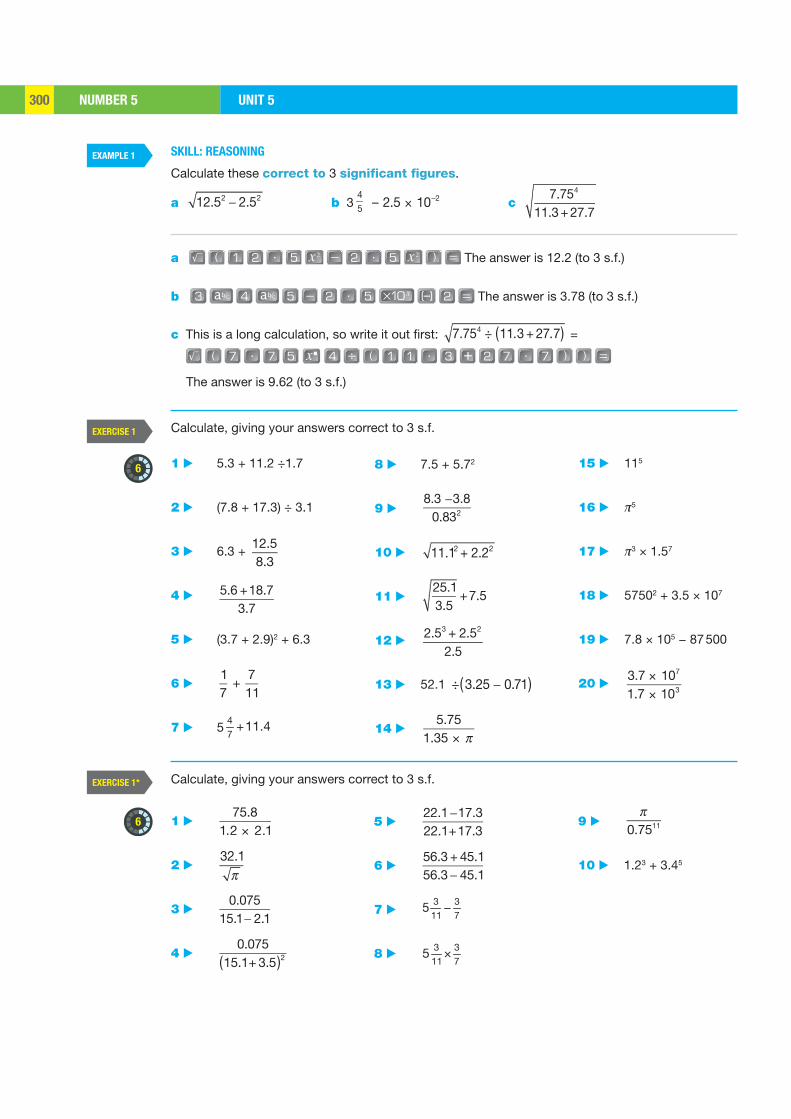
NUMBER 5 UNIT 5300
EXAMPLE 1
EXERCISE 1
EXERCISE 1*
6
6
SKILL: REASONING
Calculate these correct to 3 significant figures.
a 12.52 2.52 b 345 – 2.5 10 2× c
7.754
11.3 + 27.7
a x 2 x 2 The answer is 12.2 (to 3 s.f.)
b abc abc x The answer is 3.78 (to 3 s.f.)
c This is a long calculation, so write it out first: 7.754 ÷ 11.3 + 27.7( ) =
7 7 x � 7 7
The answer is 9.62 (to 3 s.f.)
Calculate, giving your answers correct to 3 s.f.
1 ▶ 5.3 + 11.2 ÷1.7
2 ▶ (7.8 + 17.3) ÷ 3.1
3 ▶ 6.3 + 12.58.3
4 ▶ 5.6 +18.73.7
5 ▶ (3.7 + 2.9)2 + 6.3
6 ▶ 17
+ 711
7 ▶ 5 +47
11.4
8 ▶ 7.5 + 5.72
9 ▶ 8.3 3.8
0.832
10 ▶ 11.12 + 2.22
11 ▶ 25.13.5
+7.5
12 ▶ 2.53 + 2.52
2.5
13 ▶ 52.1 ÷ 3.25 0.71( )
14 ▶ 5.75
1.35 ×
15 ▶ 115
16 ▶ π5
17 ▶ π3 × 1.57
18 ▶ 57502 + 3.5 × 10⁷
19 ▶ 7.8 × 10⁵ − 87 500
20 ▶ 3.7 107
1.7 103
××
Calculate, giving your answers correct to 3 s.f.
1 ▶ 75.8
1.2 2.1×
2 ▶ 32.1
3 ▶ 0.075
15.1 2.1
4 ▶ 0.075
15.1+ 3.5( )2
5 ▶ 22.1 17.322.1+17.3
6 ▶ 56.3 + 45.156.3 45.1
7 ▶ −3 311 7
5
8 ▶ ×3 311 7
5
9 ▶ 0.7511
10 ▶ 1.23 + 3.45
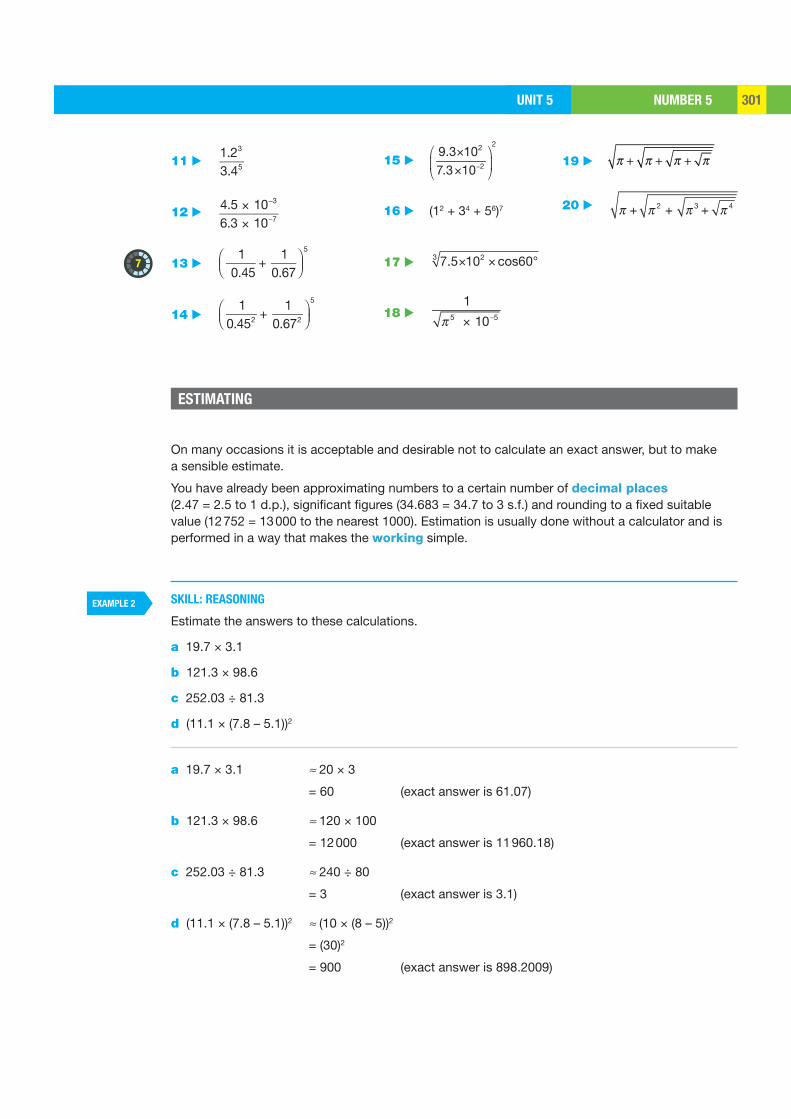
NUMBER 5UNIT 5 301
EXAMPLE 2
7
11 ▶ 1.23
3.45
12 ▶ 4.5 10 3
6.3 10 7
××
13 ▶ 1
0.45+
10.67
5
14 ▶ 1
0.452 + 1
0.672
5
15 ▶ −
⎛ ⎞×⎜ ⎟
×⎝ ⎠
22
2
9.3 1 07.3 10
16 ▶ (12 + 34 + 56)7
17 ▶ × × °3 2 7.5 10 cos60
18 ▶ 1
5 10 5×
19 ▶ + + +
20 ▶ + 2 + 3 + 4
ESTIMATING
On many occasions it is acceptable and desirable not to calculate an exact answer, but to make a sensible estimate.
You have already been approximating numbers to a certain number of decimal places (2.47 = 2.5 to 1 d.p.), significant figures (34.683 = 34.7 to 3 s.f.) and rounding to a fixed suitable value (12 752 = 13 000 to the nearest 1000). Estimation is usually done without a calculator and is performed in a way that makes the working simple.
SKILL: REASONING
Estimate the answers to these calculations.
a 19.7 × 3.1
b 121.3 × 98.6
c 252.03 ÷ 81.3
d (11.1 × (7.8 – 5.1))2
a 19.7 × 3.1 ≈ 20 × 3
= 60 (exact answer is 61.07)
b 121.3 × 98.6 ≈ 120 × 100
= 12 000 (exact answer is 11 960.18)
c 252.03 ÷ 81.3 ≈ 240 ÷ 80
= 3 (exact answer is 3.1)
d (11.1 × (7.8 – 5.1))2 ≈ (10 × (8 – 5))2
= (30)2
= 900 (exact answer is 898.2009)
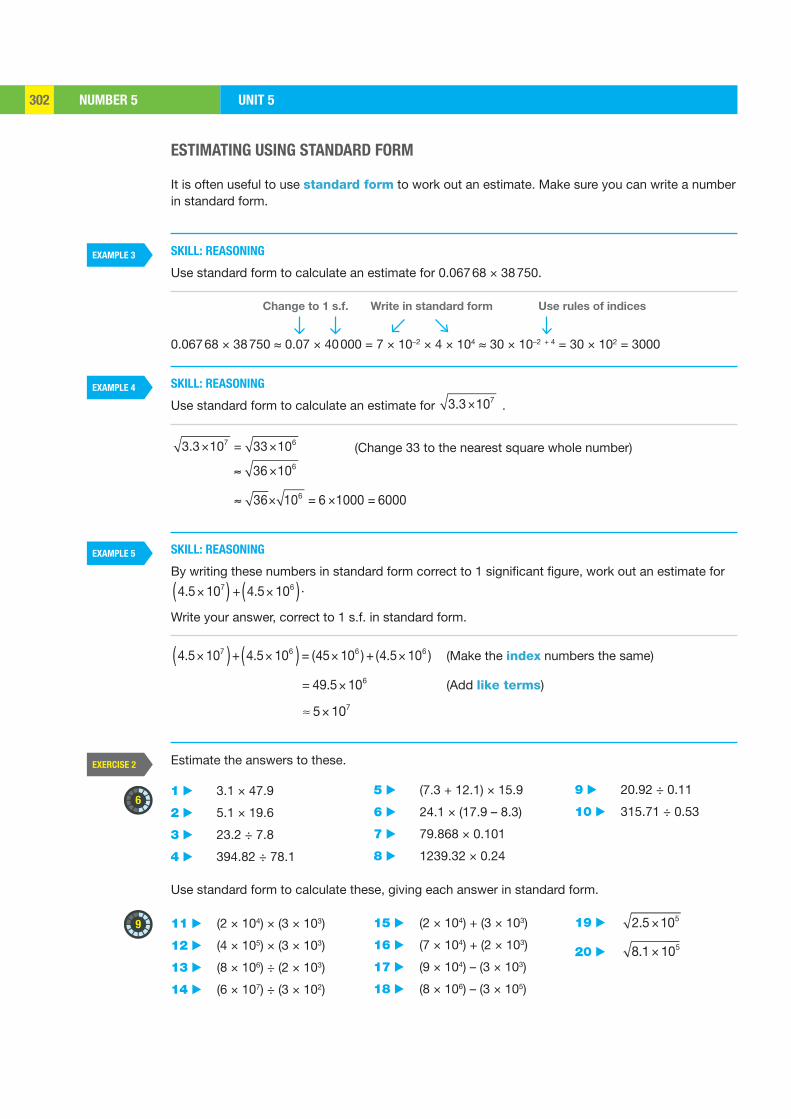
NUMBER 5 UNIT 5302
EXAMPLE 3
EXAMPLE 4
EXAMPLE 5
EXERCISE 2
6
9
ESTIMATING USING STANDARD FORM
It is often useful to use standard form to work out an estimate. Make sure you can write a number in standard form.
SKILL: REASONING
Use standard form to calculate an estimate for 0.067 68 × 38 750. Change to 1 s.f. Write in standard form Use rules of indices
0.067 68 × 38 750 ≈ 0.07 × 40 000 = 7 × 10–2 × 4 × 104 ≈ 30 × 10–2 + 4 = 30 × 102 = 3000
SKILL: REASONING
Use standard form to calculate an estimate for × 73.3 10 .
× = ×7 63.3 10 33 10 (Change 33 to the nearest square whole number)
≈ × 636 10
≈ × = × =636 10 6 1000 6000
SKILL: REASONING
By writing these numbers in standard form correct to 1 significant figure, work out an estimate for
4.5 107( ) + 4.5 106( )× × .
Write your answer, correct to 1 s.f. in standard form.
4.5 107( )+ 4.5 106( ) = (45 106 ) + (4.5 106 )× × × × (Make the index numbers the same)
= 49.5 106× (Add like terms)
5 107×
Estimate the answers to these.
1 ▶ 3.1 × 47.9
2 ▶ 5.1 × 19.6
3 ▶ 23.2 ÷ 7.8
4 ▶ 394.82 ÷ 78.1
5 ▶ (7.3 + 12.1) × 15.9
6 ▶ 24.1 × (17.9 – 8.3)
7 ▶ 79.868 × 0.101
8 ▶ 1239.32 × 0.24
9 ▶ 20.92 ÷ 0.11
10 ▶ 315.71 ÷ 0.53
11 ▶ (2 × 104) × (3 × 103)
12 ▶ (4 × 105) × (3 × 103)
13 ▶ (8 × 10⁶) ÷ (2 × 10³)
14 ▶ (6 × 10⁷) ÷ (3 × 10²)
Use standard form to calculate these, giving each answer in standard form.
15 ▶ (2 × 10⁴) + (3 × 10³)
16 ▶ (7 × 10⁴) + (2 × 10³)
17 ▶ (9 × 10⁴) – (3 × 10³)
18 ▶ (8 × 10⁶) – (3 × 10⁵)
19 ▶ 2.5 105×
20 ▶ 8.1 105×
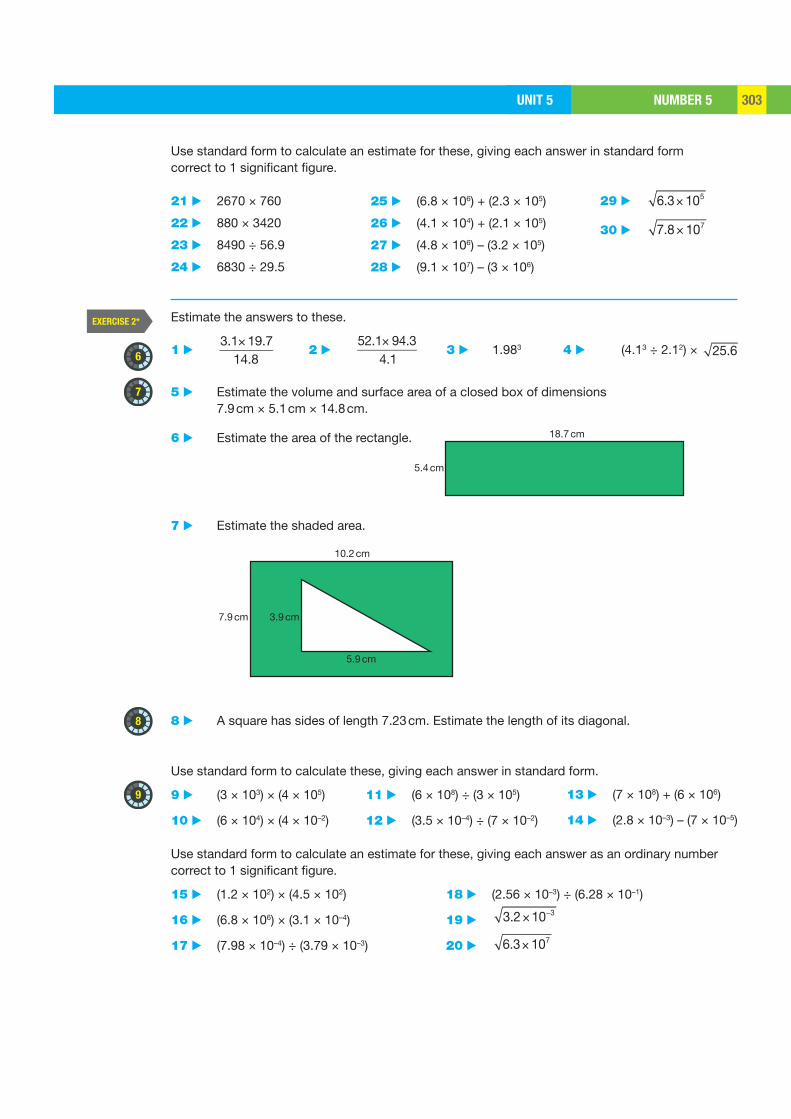
NUMBER 5UNIT 5 303
EXERCISE 2*
6
9
7
8
18.7 cm
5.4 cm
10.2 cm
5.9 cm
3.9 cm7.9 cm
Use standard form to calculate an estimate for these, giving each answer in standard form correct to 1 significant figure.
21 ▶ 2670 × 760
22 ▶ 880 × 3420
23 ▶ 8490 ÷ 56.9
24 ▶ 6830 ÷ 29.5
25 ▶ (6.8 × 10⁶) + (2.3 × 10⁵)
26 ▶ (4.1 × 10⁴) + (2.1 × 10⁵)
27 ▶ (4.8 × 10⁶) – (3.2 × 10⁵)
28 ▶ (9.1 × 10⁷) – (3 × 10⁶)
29 ▶ 6.3 105×
30 ▶ 7.8 107×
Estimate the answers to these.
1 ▶ 3.1 19.7
14.8×
2 ▶ 52.1 94.3
4.1×
3 ▶ 1.983 4 ▶ (4.13 ÷ 2.12) × 25.6
5 ▶ Estimate the volume and surface area of a closed box of dimensions 7.9 cm × 5.1 cm × 14.8 cm.
6 ▶ Estimate the area of the rectangle.
7 ▶ Estimate the shaded area.
8 ▶ A square has sides of length 7.23 cm. Estimate the length of its diagonal.
Use standard form to calculate these, giving each answer in standard form.
Use standard form to calculate an estimate for these, giving each answer as an ordinary number correct to 1 significant figure.
9 ▶ (3 × 103) × (4 × 105)
10 ▶ (6 × 104) × (4 × 10–2)
11 ▶ (6 × 10⁸) ÷ (3 × 10⁵)
12 ▶ (3.5 × 10⁻⁴) ÷ (7 × 10⁻²)
13 ▶ (7 × 10⁸) + (6 × 10⁶)
14 ▶ (2.8 × 10⁻³) – (7 × 10⁻⁵)
15 ▶ (1.2 × 102) × (4.5 × 102)
16 ▶ (6.8 × 106) × (3.1 × 10–4)
17 ▶ (7.98 × 10⁻⁴) ÷ (3.79 × 10⁻³)
18 ▶ (2.56 × 10⁻³) ÷ (6.28 × 10⁻¹)
19 ▶ 3.2 10 3×
20 ▶ 6.3 107×
NUMBER 5 UNIT 5304
Speed (miles/h) 65 000 65 500 66 000 66 500 67 000
10 10.5 11 11.5 12 12.5 13 13.5 14 14.5 15
21 ▶ A warehouse sells 8.7 million cups at an average price of $0.65 each. Use standard form to calculate an estimate of the total sales. Give your answer correct to 1 significant figure.
22 ▶ A human kidney has a volume of 120 cm3. It contains 1.35 million nephrons (small tubes). Use standard form to calculate an estimate of the average number of nephrons per cubic centimetre. Give your answer correct to 1 significant figure.
By writing these numbers in standard form correct to 1 significant figure, work out an estimate for the following in standard form to 1 s.f.
23 ▶ 5003 × 393
24 ▶ 0.041 × 5700
25 ▶ 47.8 × 0.0059
26 ▶ 0.000 57 × 0.002 87
27 ▶ 80920
0.00418
Rounding is often necessary as it can be impossible to give values exactly. Knowing the degree of accuracy of the numbers is useful. Unless requested, it is important not to round too much, otherwise the final answer can be too inaccurate.
We are often given information that is not exact.
For example, a scientific publication may state that ‘the Earth is moving around the Sun at 66 000 miles/hour’. If this figure has been rounded to the nearest 1000 miles/hour, the exact speed will be between 65 500 miles/hour and 66 500 miles/hour.
This range can be shown on a number line.
The range can also be written as 66 000 ± 500 miles/hour.
Numbers that can be expressed as a ± b have a given tolerance. The tolerance in the example above is 500.
This is a convenient way to express a number that can lie within a set range.
If x is given as 12 ± 0.5, x can lie between 11.5 and 12.5 (or 11.5 x 12.5 ).≤ ≤
28 ▶ 530
0.000802
29 ▶ 0.6597729.8
30 ▶ 0.0678 ÷ 0.003 21
ROUNDING, UPPER AND LOWER BOUNDS
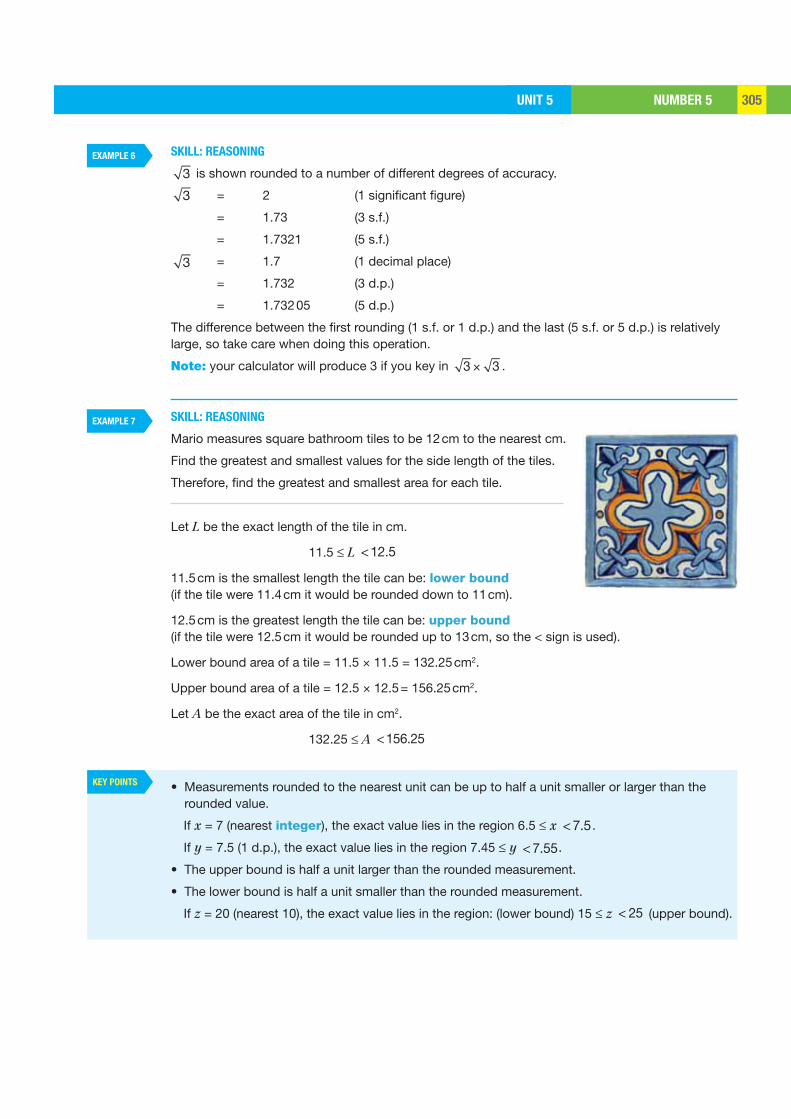
NUMBER 5UNIT 5 305
EXAMPLE 6
EXAMPLE 7
KEY POINTS
SKILL: REASONING
3 is shown rounded to a number of different degrees of accuracy.
3 = 2 (1 significant figure)
= 1.73 (3 s.f.)
= 1.7321 (5 s.f.)
3 = 1.7 (1 decimal place)
= 1.732 (3 d.p.)
= 1.732 05 (5 d.p.)
The difference between the first rounding (1 s.f. or 1 d.p.) and the last (5 s.f. or 5 d.p.) is relatively large, so take care when doing this operation.
Note: your calculator will produce 3 if you key in 3 3× .
SKILL: REASONING
Mario measures square bathroom tiles to be 12 cm to the nearest cm.
Find the greatest and smallest values for the side length of the tiles.
Therefore, find the greatest and smallest area for each tile.
Let L be the exact length of the tile in cm.
11.5 ≤ L <12.5
11.5 cm is the smallest length the tile can be: lower bound (if the tile were 11.4 cm it would be rounded down to 11 cm).
12.5 cm is the greatest length the tile can be: upper bound (if the tile were 12.5 cm it would be rounded up to 13 cm, so the < sign is used).
Lower bound area of a tile = 11.5 × 11.5 = 132.25 cm2.
Upper bound area of a tile = 12.5 × 12.5 = 156.25 cm2.
Let A be the exact area of the tile in cm2.
132.25 ≤ A <156.25
• Measurements rounded to the nearest unit can be up to half a unit smaller or larger than the rounded value.
If x = 7 (nearest integer), the exact value lies in the region 6.5 ≤ x < 7.5.
If y = 7.5 (1 d.p.), the exact value lies in the region 7.45 ≤ y < 7.55.
• The upper bound is half a unit larger than the rounded measurement.
• The lower bound is half a unit smaller than the rounded measurement.
If z = 20 (nearest 10), the exact value lies in the region: (lower bound) 15 ≤ z < 25 (upper bound).
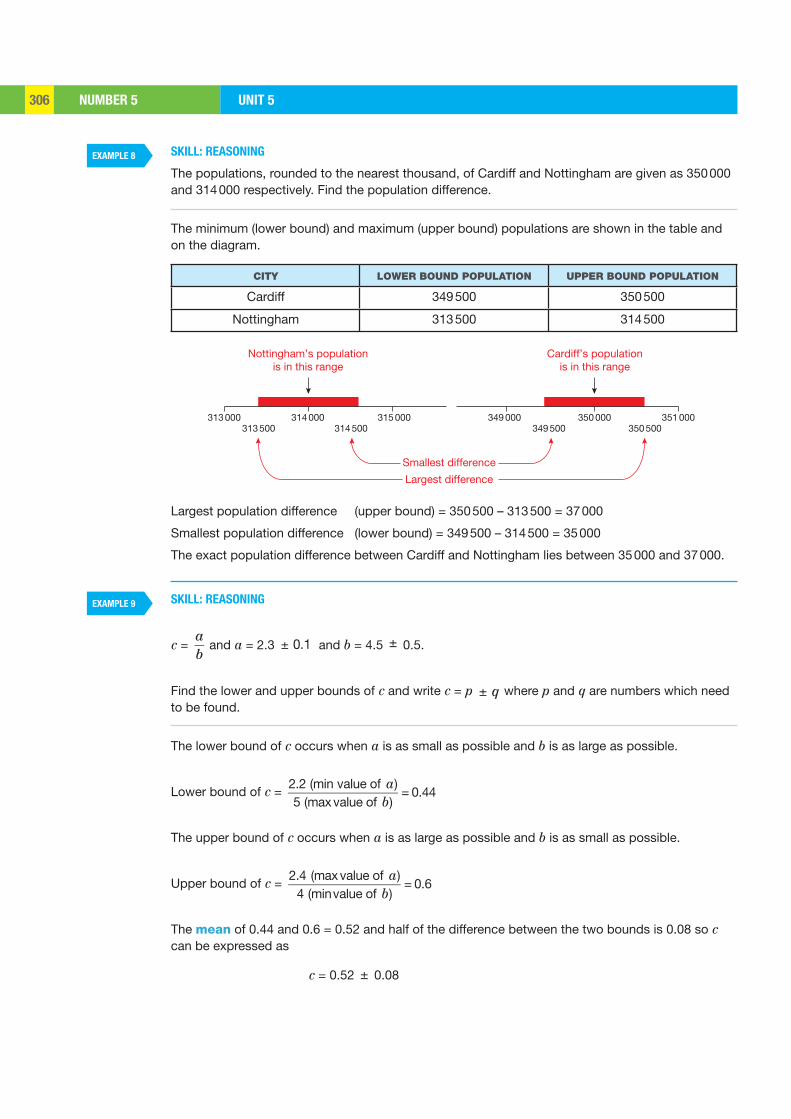
NUMBER 5 UNIT 5306
EXAMPLE 8
EXAMPLE 9
313 500 314 500 349 500313 000 351 000314 000 315 000 350 000349 000
350 500
Cardiff’s populationis in this range
Nottingham’s populationis in this range
Largest difference
Smallest difference
SKILL: REASONING
The populations, rounded to the nearest thousand, of Cardiff and Nottingham are given as 350 000 and 314 000 respectively. Find the population difference.
The minimum (lower bound) and maximum (upper bound) populations are shown in the table and on the diagram.
CITY LOWER BOUND POPULATION UPPER BOUND POPULATION
Cardiff 349 500 350 500
Nottingham 313 500 314 500
Largest population difference (upper bound) = 350 500 – 313 500 = 37 000
Smallest population difference (lower bound) = 349 500 – 314 500 = 35 000
The exact population difference between Cardiff and Nottingham lies between 35 000 and 37 000.
SKILL: REASONING
c = ab
and a = 2.3 ± 0.1 and b = 4.5 ± 0.5.
Find the lower and upper bounds of c and write c = p ± q where p and q are numbers which need to be found.
The lower bound of c occurs when a is as small as possible and b is as large as possible.
Lower bound of c = 2.2 (min value of a)5 (maxvalue of b)
= 0.44
The upper bound of c occurs when a is as large as possible and b is as small as possible.
Upper bound of c = 2.4 (maxvalue of a)
4 (minvalue of b)= 0.6
The mean of 0.44 and 0.6 = 0.52 and half of the difference between the two bounds is 0.08 so c can be expressed as
c = 0.52 ± 0.08
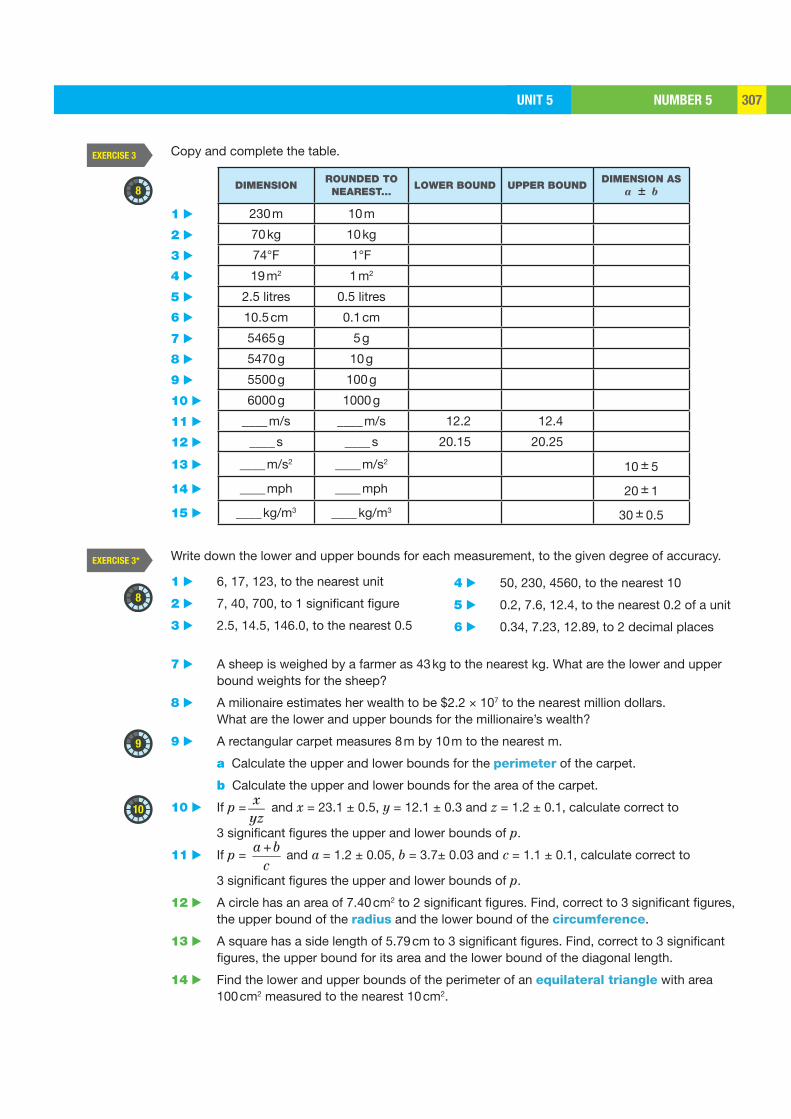
NUMBER 5UNIT 5 307
EXERCISE 3
EXERCISE 3*
8
8
9
10
Copy and complete the table.
Write down the lower and upper bounds for each measurement, to the given degree of accuracy.
1 ▶ 6, 17, 123, to the nearest unit
2 ▶ 7, 40, 700, to 1 significant figure
3 ▶ 2.5, 14.5, 146.0, to the nearest 0.5
7 ▶ A sheep is weighed by a farmer as 43 kg to the nearest kg. What are the lower and upper bound weights for the sheep?
8 ▶ A milionaire estimates her wealth to be $2.2 × 10⁷ to the nearest million dollars. What are the lower and upper bounds for the millionaire’s wealth?
9 ▶ A rectangular carpet measures 8 m by 10 m to the nearest m.
a Calculate the upper and lower bounds for the perimeter of the carpet.
b Calculate the upper and lower bounds for the area of the carpet.
10 ▶ If p = xyz
and x = 23.1 ± 0.5, y = 12.1 ± 0.3 and z = 1.2 ± 0.1, calculate correct to
3 significant figures the upper and lower bounds of p.
11 ▶ If p = a +b
c and a = 1.2 ± 0.05, b = 3.7± 0.03 and c = 1.1 ± 0.1, calculate correct to
3 significant figures the upper and lower bounds of p.
12 ▶ A circle has an area of 7.40 cm2 to 2 significant figures. Find, correct to 3 significant figures, the upper bound of the radius and the lower bound of the circumference.
13 ▶ A square has a side length of 5.79 cm to 3 significant figures. Find, correct to 3 significant figures, the upper bound for its area and the lower bound of the diagonal length.
14 ▶ Find the lower and upper bounds of the perimeter of an equilateral triangle with area 100 cm2 measured to the nearest 10 cm2.
4 ▶ 50, 230, 4560, to the nearest 10
5 ▶ 0.2, 7.6, 12.4, to the nearest 0.2 of a unit
6 ▶ 0.34, 7.23, 12.89, to 2 decimal places
DIMENSIONROUNDED TO NEAREST…
LOWER BOUND UPPER BOUNDDIMENSION AS
a ± b
230 m 10 m
70 kg 10 kg
74°F 1°F
19 m2 1 m2
2.5 litres 0.5 litres
10.5 cm 0.1 cm
5465 g 5 g
5470 g 10 g
5500 g 100 g
6000 g 1000 g
____ m/s ____ m/s 12.2 12.4
____ s ____ s 20.15 20.25
____ m/s2 ____ m/s2 10 ± 5
____ mph ____ mph 20 ± 1
____ kg/m3 ____ kg/m3 30 ± 0.5
1 ▶
2 ▶3 ▶4 ▶
5 ▶6 ▶
7 ▶8 ▶
9 ▶
10 ▶
11 ▶12 ▶
13 ▶
14 ▶
15 ▶
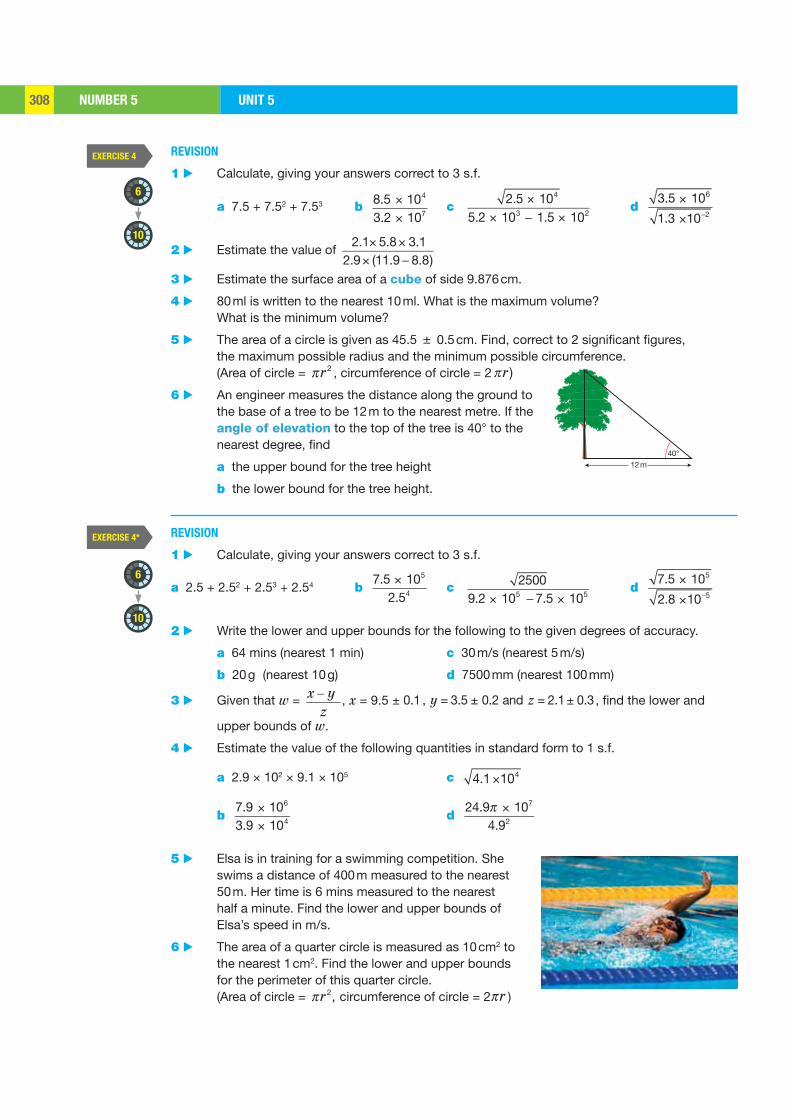
NUMBER 5 UNIT 5308
EXERCISE 4
EXERCISE 4*
6
6
10
10
40°12 m
REVISION
1 ▶ Calculate, giving your answers correct to 3 s.f. a 7.5 + 7.52 + 7.53 b 8.5 104
3.2 107
××
c 2.5 104
5.2 103 1.5 102
×× ×
d 3.5 106
1.3 10 2
×
×
2 ▶ Estimate the value of 2.1 5.8 3.1
2.9 (11.9 8.8)× ×
×
3 ▶ Estimate the surface area of a cube of side 9.876 cm.
4 ▶ 80 ml is written to the nearest 10 ml. What is the maximum volume? What is the minimum volume?
5 ▶ The area of a circle is given as 45.5 ± 0.5 cm. Find, correct to 2 significant figures, the maximum possible radius and the minimum possible circumference. (Area of circle = r2 , circumference of circle = 2 r )
6 ▶ An engineer measures the distance along the ground to the base of a tree to be 12 m to the nearest metre. If the angle of elevation to the top of the tree is 40° to the nearest degree, find
a the upper bound for the tree height
b the lower bound for the tree height.
REVISION
1 ▶ Calculate, giving your answers correct to 3 s.f.
a 2.5 + 2.52 + 2.53 + 2.54 b 7.5 105
2.54
× c 2500
9.2 105 7.5 105× × d
7.5 105
2.8 10 5
×
×
2 ▶ Write the lower and upper bounds for the following to the given degrees of accuracy.
a 64 mins (nearest 1 min) c 30 m/s (nearest 5 m/s)
b 20 g (nearest 10 g) d 7500 mm (nearest 100 mm)
3 ▶ Given that w = x y z
, x = 9.5 ± 0.1 , y = 3.5 ± 0.2 and z = 2.1 ± 0.3 , find the lower and
upper bounds of w.
4 ▶ Estimate the value of the following quantities in standard form to 1 s.f.
a 2.9 × 102 × 9.1 × 105 c 4.1 104×
b 7.9 106
3.9 104
××
d 24.9 107
4.92
×
5 ▶ Elsa is in training for a swimming competition. She swims a distance of 400 m measured to the nearest 50 m. Her time is 6 mins measured to the nearest half a minute. Find the lower and upper bounds of Elsa’s speed in m/s.
6 ▶ The area of a quarter circle is measured as 10 cm2 to the nearest 1 cm2. Find the lower and upper bounds for the perimeter of this quarter circle. (Area of circle = r2, circumference of circle = 2 r )
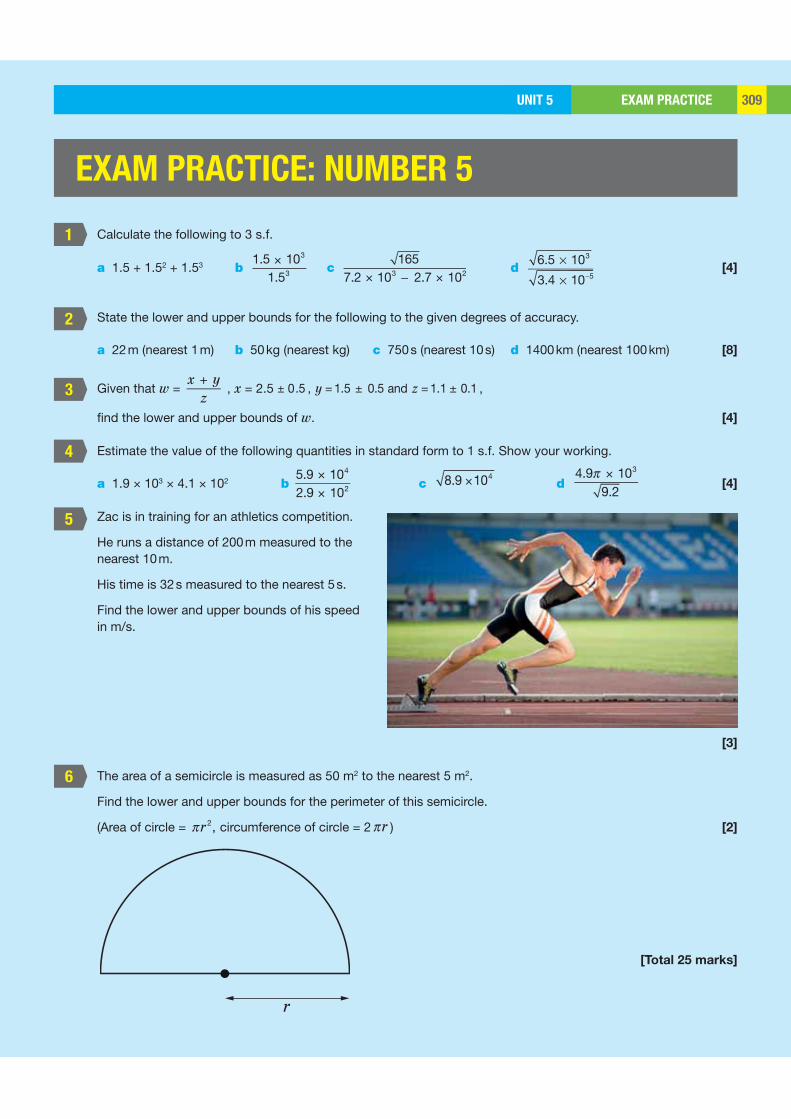
EXAM PRACTICEUNIT 5 309UNIT 5 309
1
2
3
4
6
5
r
EXAM PRACTICE: NUMBER 5
Calculate the following to 3 s.f.
a 1.5 + 1.52 + 1.53 b 1.5 103
1.53
× c
1657.2 103 2.7 102××
d 6.5 103
3.4 10 5 [4]
State the lower and upper bounds for the following to the given degrees of accuracy.
a 22 m (nearest 1 m) b 50 kg (nearest kg) c 750 s (nearest 10 s) d 1400 km (nearest 100 km) [8]
Given that w = x + y
z , x = 2.5 ± 0.5 , y = 1.5 ± 0.5 and z = 1.1 ± 0.1 ,
find the lower and upper bounds of w. [4]
Estimate the value of the following quantities in standard form to 1 s.f. Show your working. a 1.9 × 103 × 4.1 × 102 b
5.9 104
2.9 102
××
c 8.9 104× d 4.9 103
9.2×
[4]
Zac is in training for an athletics competition.
He runs a distance of 200 m measured to the nearest 10 m.
His time is 32 s measured to the nearest 5 s.
Find the lower and upper bounds of his speed in m/s.
[3]
The area of a semicircle is measured as 50 m2 to the nearest 5 m2.
Find the lower and upper bounds for the perimeter of this semicircle.
(Area of circle = r2, circumference of circle = 2 r ) [2]
[Total 25 marks]
CHAPTER SUMMARY UNIT 5310
CHAPTER SUMMARY: NUMBER 5
CALCULATORS
Use the word BIDMAS to help you remember the order of calculations. Longer calculations will require brackets. Be familiar with your calculator and use the instruction booklet provided when you bought it.
To estimate the answer to a calculation, including calculations involving powers, round numbers to 1 s.f. and then perform the calculation.
For very large or very small numbers, it is often easier to estimate a calculation if the numbers are written in standard form.
ESTIMATING
ROUNDING, UPPER AND LOWER BOUNDS
Measurements rounded to the nearest unit can be up to half a unit smaller or larger than the rounded value.
If x = 10 (nearest integer), the exact value lies in the region 9.5 ≤ x <10.5.
If y = 10.5 (1 d.p.), the exact value lies in the region 10.45 ≤ y <10.55.
The upper bound is half a unit larger than the rounded measurement.
The lower bound is half a unit smaller than the rounded measurement.
If z = 50 (nearest 10), the exact value lies in the region: (lower bound) 45 ≤ z < 55 (upper bound)
If p = a × b (where a and b are rounded values) and pmin and pmax are the lower and upper bounds for p then
pmin = amin × bmin and pmax = amax × bmax
If q = ab
(where a and b are rounded values) and qmin
and qmax are the lower and upper bounds for q then
qmin = amin
bmax
and qmax = amax
bmin
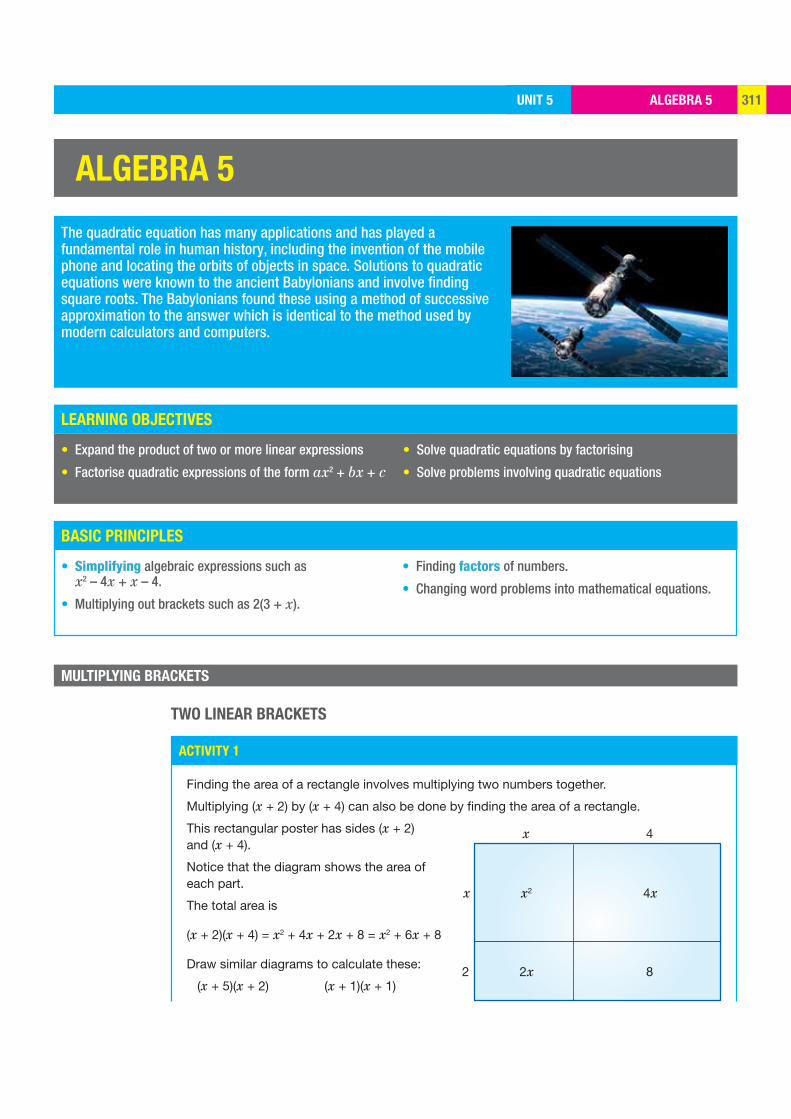
ALGEBRA 5UNIT 5 311
LEARNING OBJECTIVES
BASIC PRINCIPLES
ACTIVITY 1
2x 8
x2 4x
2
x
x 4
ALGEBRA 5
The quadratic equation has many applications and has played a fundamental role in human history, including the invention of the mobile phone and locating the orbits of objects in space. Solutions to quadratic equations were known to the ancient Babylonians and involve finding square roots. The Babylonians found these using a method of successive approximation to the answer which is identical to the method used by modern calculators and computers.
• Expand the product of two or more linear expressions
• Factorise quadratic expressions of the form ax2 + bx + c
• Solve quadratic equations by factorising
• Solve problems involving quadratic equations
MULTIPLYING BRACKETS
• Simplifying algebraic expressions such as x2 – 4x + x – 4.
• Multiplying out brackets such as 2(3 + x).
• Finding factors of numbers.
• Changing word problems into mathematical equations.
TWO LINEAR BRACKETS
Finding the area of a rectangle involves multiplying two numbers together.
Multiplying (x + 2) by (x + 4) can also be done by finding the area of a rectangle.
This rectangular poster has sides (x + 2) and (x + 4).
Notice that the diagram shows the area of each part.
The total area is
(x + 2)(x + 4) = x2 + 4x + 2x + 8 = x2 + 6x + 8
Draw similar diagrams to calculate these:
(x + 5)(x + 2) (x + 1)(x + 1)
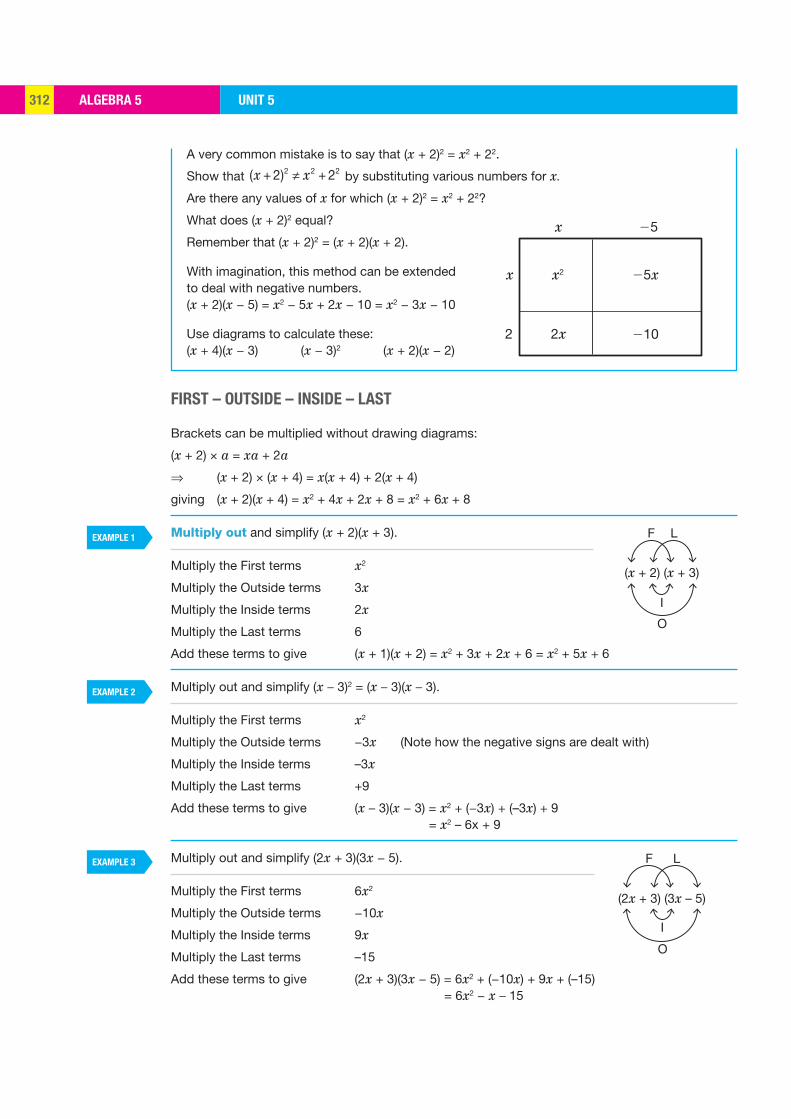
ALGEBRA 5 UNIT 5312
EXAMPLE 1
EXAMPLE 2
EXAMPLE 3
2x
x2 25x
2102
x
x 25
(x + 2) (x + 3)
F
O
I
L
(2x + 3) (3x – 5)
F
O
I
L
A very common mistake is to say that (x + 2)2 = x2 + 22.
Show that (x + 2)2 x2 + 22 by substituting various numbers for x.
Are there any values of x for which (x + 2)2 = x2 + 22?
What does (x + 2)2 equal?
Remember that (x + 2)2 = (x + 2)(x + 2).
With imagination, this method can be extended to deal with negative numbers.(x + 2)(x − 5) = x2 − 5x + 2x − 10 = x2 − 3x − 10
Use diagrams to calculate these:(x + 4)(x − 3) (x − 3)2 (x + 2)(x − 2)
FIRST – OUTSIDE – INSIDE – LAST
Brackets can be multiplied without drawing diagrams:
(x + 2) × a = xa + 2a
⇒ (x + 2) × (x + 4) = x(x + 4) + 2(x + 4)
giving (x + 2)(x + 4) = x2 + 4x + 2x + 8 = x2 + 6x + 8
Multiply out and simplify (x + 2)(x + 3).
Multiply the First terms x2
Multiply the Outside terms 3x
Multiply the Inside terms 2x
Multiply the Last terms 6
Add these terms to give (x + 1)(x + 2) = x2 + 3x + 2x + 6 = x2 + 5x + 6
Multiply out and simplify (x – 3)2 = (x – 3)(x – 3).
Multiply the First terms x2
Multiply the Outside terms −3x (Note how the negative signs are dealt with)
Multiply the Inside terms –3x
Multiply the Last terms +9
Add these terms to give (x – 3)(x − 3) = x2 + (−3x) + (–3x) + 9 = x2 – 6x + 9
Multiply out and simplify (2x + 3)(3x − 5).
Multiply the First terms 6x2
Multiply the Outside terms −10x
Multiply the Inside terms 9x
Multiply the Last terms –15
Add these terms to give (2x + 3)(3x − 5) = 6x2 + (−10x) + 9x + (–15) = 6x2 − x – 15
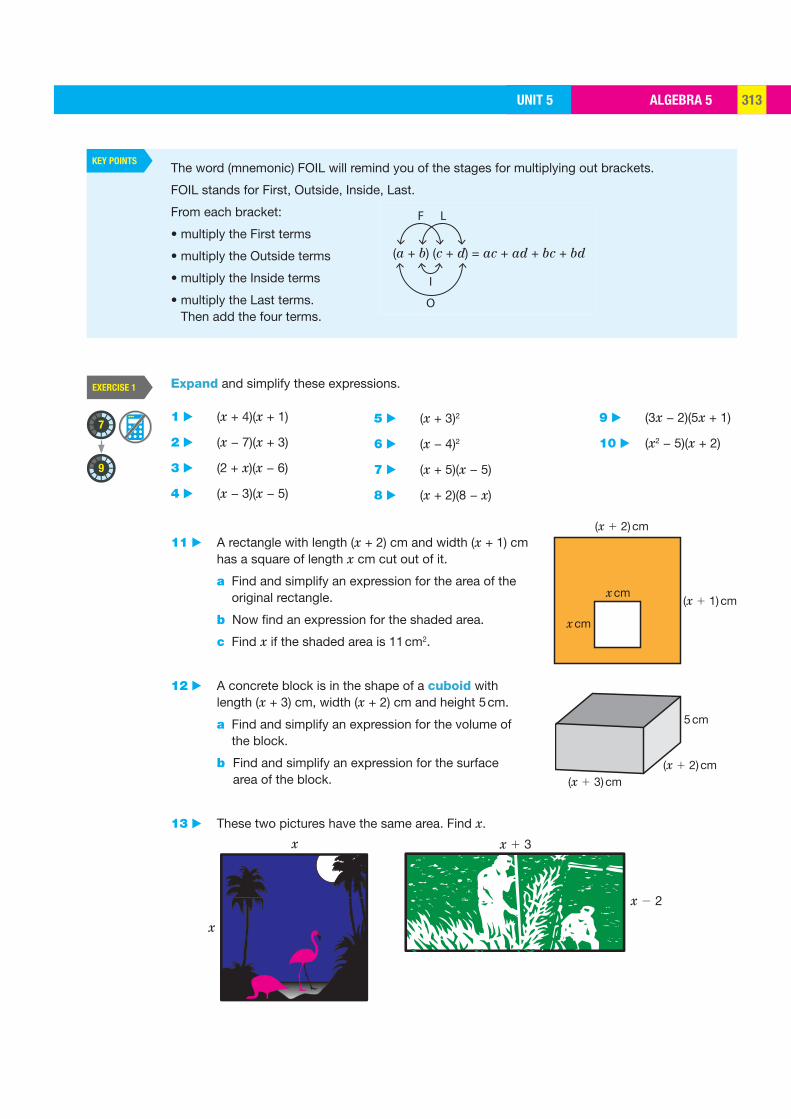
ALGEBRA 5UNIT 5 313
KEY POINTS
EXERCISE 1
7
9
(x 1 2) cm
(x 1 1) cm
x cm
x cm
5 cm
(x 1 2) cm(x 1 3) cm
x
x
x 1 3
x 2 2
(a + b) (c + d) = ac + ad + bc + bd
F
O
I
L
The word (mnemonic) FOIL will remind you of the stages for multiplying out brackets.
FOIL stands for First, Outside, Inside, Last.
From each bracket:
• multiply the First terms
• multiply the Outside terms
• multiply the Inside terms
• multiply the Last terms. Then add the four terms.
1 ▶ (x + 4)(x + 1)
2 ▶ (x − 7)(x + 3)
3 ▶ (2 + x)(x − 6)
4 ▶ (x − 3)(x − 5)
5 ▶ (x + 3)2
6 ▶ (x − 4)2
7 ▶ (x + 5)(x − 5)
8 ▶ (x + 2)(8 − x)
9 ▶ (3x − 2)(5x + 1)
10 ▶ (x2 − 5)(x + 2)
Expand and simplify these expressions.
11 ▶ A rectangle with length (x + 2) cm and width (x + 1) cm has a square of length x cm cut out of it.
a Find and simplify an expression for the area of the original rectangle.
b Now find an expression for the shaded area.
c Find x if the shaded area is 11 cm2.
12 ▶ A concrete block is in the shape of a cuboid with length (x + 3) cm, width (x + 2) cm and height 5 cm.
a Find and simplify an expression for the volume of the block.
b Find and simplify an expression for the surface area of the block.
13 ▶ These two pictures have the same area. Find x.
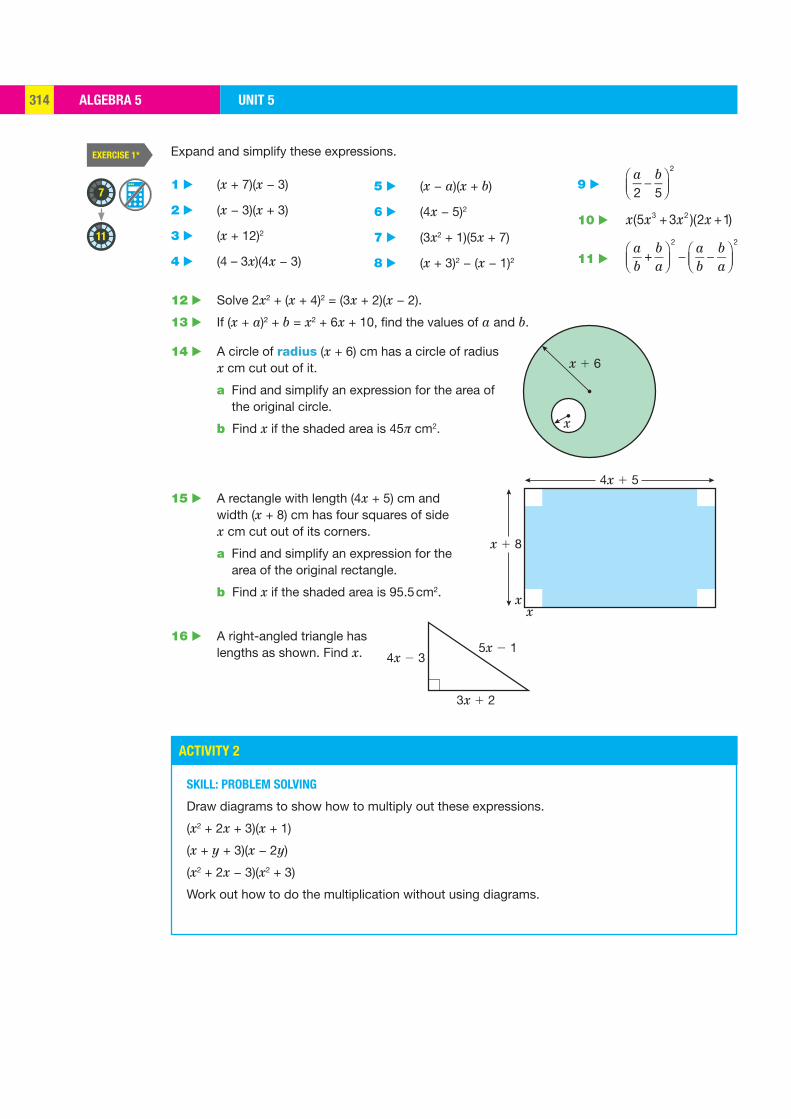
ALGEBRA 5 UNIT 5314
EXERCISE 1*
ACTIVITY 2
7
11
x 1 6
x
4x 2 3
3x 1 2
5x 2 1
4x 1 5
x 1 8
xx
1 ▶ (x + 7)(x − 3)
2 ▶ (x − 3)(x + 3)
3 ▶ (x + 12)2
4 ▶ (4 – 3x)(4x − 3)
5 ▶ (x − a)(x + b)
6 ▶ (4x − 5)2
7 ▶ (3x2 + 1)(5x + 7)
8 ▶ (x + 3)2 − (x − 1)2
9 ▶ a2
b5
2
10 ▶ x(5x3 + 3x2 )(2x +1)
11 ▶ ab
+ba
2 ab
ba
2
Expand and simplify these expressions.
12 ▶ Solve 2x2 + (x + 4)2 = (3x + 2)(x − 2).
13 ▶ If (x + a)2 + b = x2 + 6x + 10, find the values of a and b.
14 ▶ A circle of radius (x + 6) cm has a circle of radius x cm cut out of it.
a Find and simplify an expression for the area of the original circle.
b Find x if the shaded area is 45π cm2.
15 ▶ A rectangle with length (4x + 5) cm and width (x + 8) cm has four squares of side x cm cut out of its corners.
a Find and simplify an expression for the area of the original rectangle.
b Find x if the shaded area is 95.5 cm2.
16 ▶ A right-angled triangle has lengths as shown. Find x.
SKILL: PROBLEM SOLVING
Draw diagrams to show how to multiply out these expressions.
(x2 + 2x + 3)(x + 1)
(x + y + 3)(x − 2y)
(x2 + 2x − 3)(x2 + 3)
Work out how to do the multiplication without using diagrams.
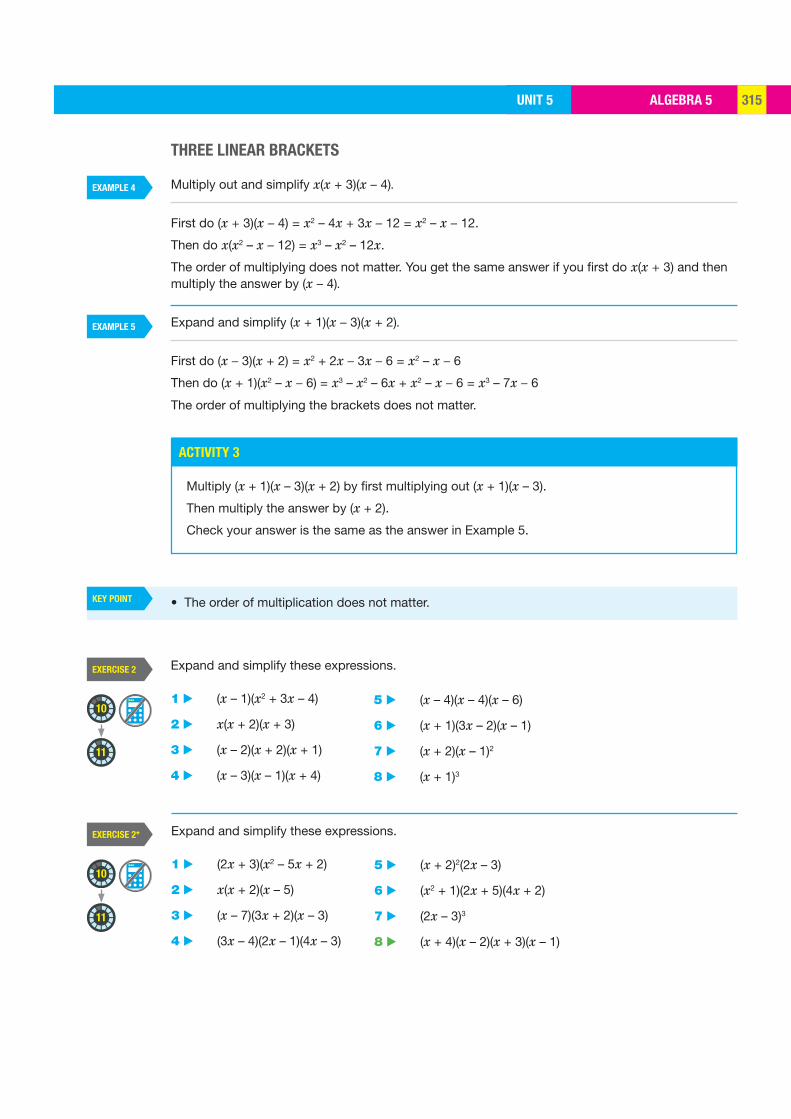
ALGEBRA 5UNIT 5 315
EXERCISE 2
EXERCISE 2*
ACTIVITY 3
EXAMPLE 4
EXAMPLE 5
KEY POINT
11
10
11
10
THREE LINEAR BRACKETS
Multiply out and simplify x(x + 3)(x – 4).
First do (x + 3)(x – 4) = x2 – 4x + 3x – 12 = x2 – x – 12.
Then do x(x2 – x – 12) = x3 – x2 – 12x.
The order of multiplying does not matter. You get the same answer if you first do x(x + 3) and then multiply the answer by (x – 4).
Expand and simplify (x + 1)(x – 3)(x + 2).
First do (x – 3)(x + 2) = x2 + 2x – 3x – 6 = x2 – x – 6
Then do (x + 1)(x2 – x – 6) = x3 – x2 – 6x + x2 – x – 6 = x3 – 7x – 6
The order of multiplying the brackets does not matter.
1 ▶ (x – 1)(x2 + 3x – 4)
2 ▶ x(x + 2)(x + 3)
3 ▶ (x – 2)(x + 2)(x + 1)
4 ▶ (x – 3)(x – 1)(x + 4)
1 ▶ (2x + 3)(x2 – 5x + 2)
2 ▶ x(x + 2)(x – 5)
3 ▶ (x – 7)(3x + 2)(x – 3)
4 ▶ (3x – 4)(2x – 1)(4x – 3)
5 ▶ (x – 4)(x – 4)(x – 6)
6 ▶ (x + 1)(3x – 2)(x – 1)
7 ▶ (x + 2)(x – 1)2
8 ▶ (x + 1)3
5 ▶ (x + 2)2(2x – 3)
6 ▶ (x2 + 1)(2x + 5)(4x + 2)
7 ▶ (2x – 3)3
8 ▶ (x + 4)(x – 2)(x + 3)(x – 1)
Expand and simplify these expressions.
Expand and simplify these expressions.
Multiply (x + 1)(x – 3)(x + 2) by first multiplying out (x + 1)(x – 3).
Then multiply the answer by (x + 2).
Check your answer is the same as the answer in Example 5.
• The order of multiplication does not matter.

ALGEBRA 5 UNIT 5316
EXAMPLE 6
EXAMPLE 7
ACTIVITY 4
KEY POINTS
EXERCISE 3
6
8
FACTORISING QUADRATIC EXPRESSIONS WITH TWO TERMS
Factorising quadratic expressions such as x2 + 2x is easy because x is always a common factor.
Factorise x2 − 12x.
x is a common factor, and so
x2 − 12x = x(x − 12)
Factorising x2 – 9 is a little more difficult.
Expand (x − 3)(x + 3) using FOIL.
x2 + 3x − 3x − 9 = x2 − 9
So factorising x2 − 9 gives (x − 3)(x + 3).
FACTORISING QUADRATIC EXPRESSIONS
SKILL: REASONING
Expand and simplify (x − 3)(x + 3).
Expand and simplify (x + 3)(x − 3).
What have you found?
What is the link between the numbers in the brackets and the number in the simplified expression?
Does the order of the brackets make a difference?
Use the result above to factorise x2 – 16.
Can you factorise x2 + 9 in the same way?
• x2 + ax = x(x + a) and x2 – ax = x(x – a).
• x2 – a2 = (x + a)(x – a) This is called ‘the difference of two squares’.
• x2 + a2 cannot be factorised.
• Always check your factorisation by multiplying out.
1 ▶ x2 − 3x
2 ▶ x2 + 2x
3 ▶ x2 − 31x
4 ▶ x2 + 42x
5 ▶ x2 − 16
6 ▶ x2 − 49
Factorise these expressions.
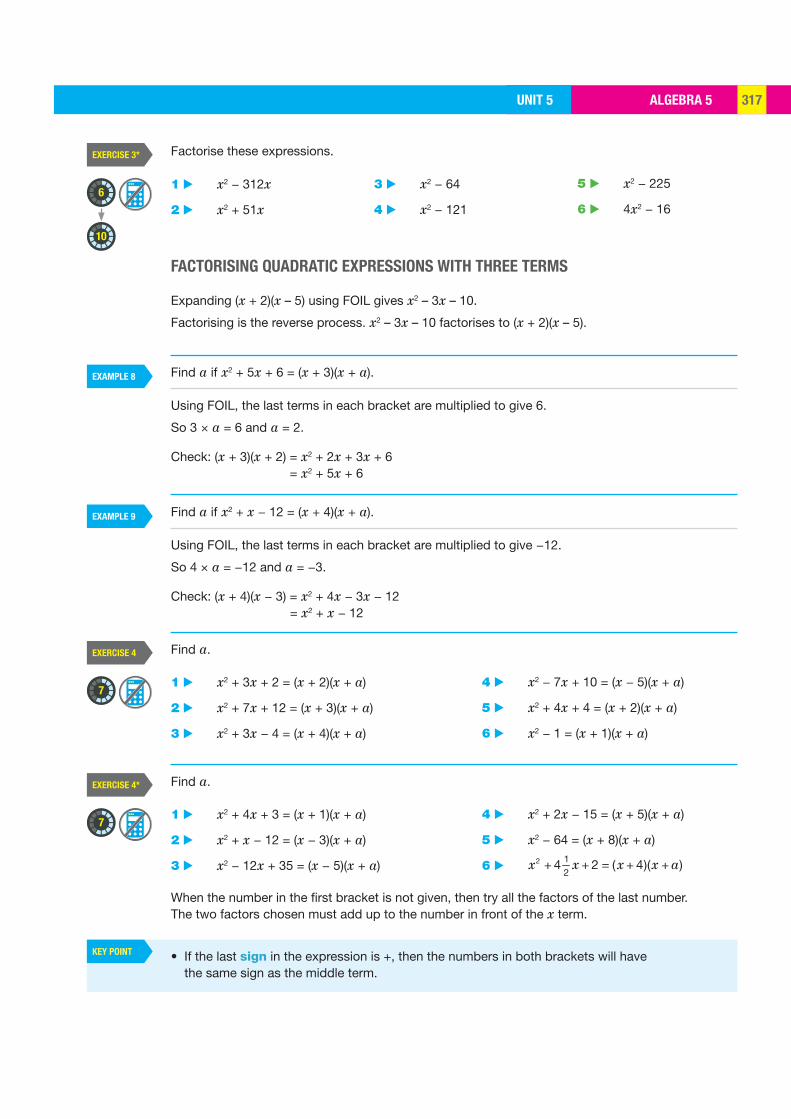
ALGEBRA 5UNIT 5 317
EXAMPLE 8
EXAMPLE 9
EXERCISE 3*
EXERCISE 4
EXERCISE 4*
KEY POINT
6
10
7
7
FACTORISING QUADRATIC EXPRESSIONS WITH THREE TERMS
Expanding (x + 2)(x – 5) using FOIL gives x2 – 3x – 10.
Factorising is the reverse process. x2 – 3x – 10 factorises to (x + 2)(x – 5).
Find a if x2 + 5x + 6 = (x + 3)(x + a).
Using FOIL, the last terms in each bracket are multiplied to give 6.
So 3 × a = 6 and a = 2.
Check: (x + 3)(x + 2) = x2 + 2x + 3x + 6 = x2 + 5x + 6
Find a if x2 + x − 12 = (x + 4)(x + a).
Using FOIL, the last terms in each bracket are multiplied to give −12.
So 4 × a = −12 and a = −3.
Check: (x + 4)(x − 3) = x2 + 4x − 3x − 12 = x2 + x − 12
1 ▶ x2 − 312x
2 ▶ x2 + 51x
1 ▶ x2 + 3x + 2 = (x + 2)(x + a)
2 ▶ x2 + 7x + 12 = (x + 3)(x + a)
3 ▶ x2 + 3x − 4 = (x + 4)(x + a)
1 ▶ x2 + 4x + 3 = (x + 1)(x + a)
2 ▶ x2 + x − 12 = (x − 3)(x + a)
3 ▶ x2 − 12x + 35 = (x − 5)(x + a)
3 ▶ x2 − 64
4 ▶ x2 − 121
4 ▶ x2 − 7x + 10 = (x − 5)(x + a)
5 ▶ x2 + 4x + 4 = (x + 2)(x + a)
6 ▶ x2 − 1 = (x + 1)(x + a)
4 ▶ x2 + 2x − 15 = (x + 5)(x + a)
5 ▶ x2 − 64 = (x + 8)(x + a)
6 ▶ + + = + +2 12
4 2 ( 4)( )x x x x a
5 ▶ x2 − 225
6 ▶ 4x2 − 16
Factorise these expressions.
Find a.
Find a.
When the number in the first bracket is not given, then try all the factors of the last number. The two factors chosen must add up to the number in front of the x term.
• If the last sign in the expression is +, then the numbers in both brackets will have the same sign as the middle term.
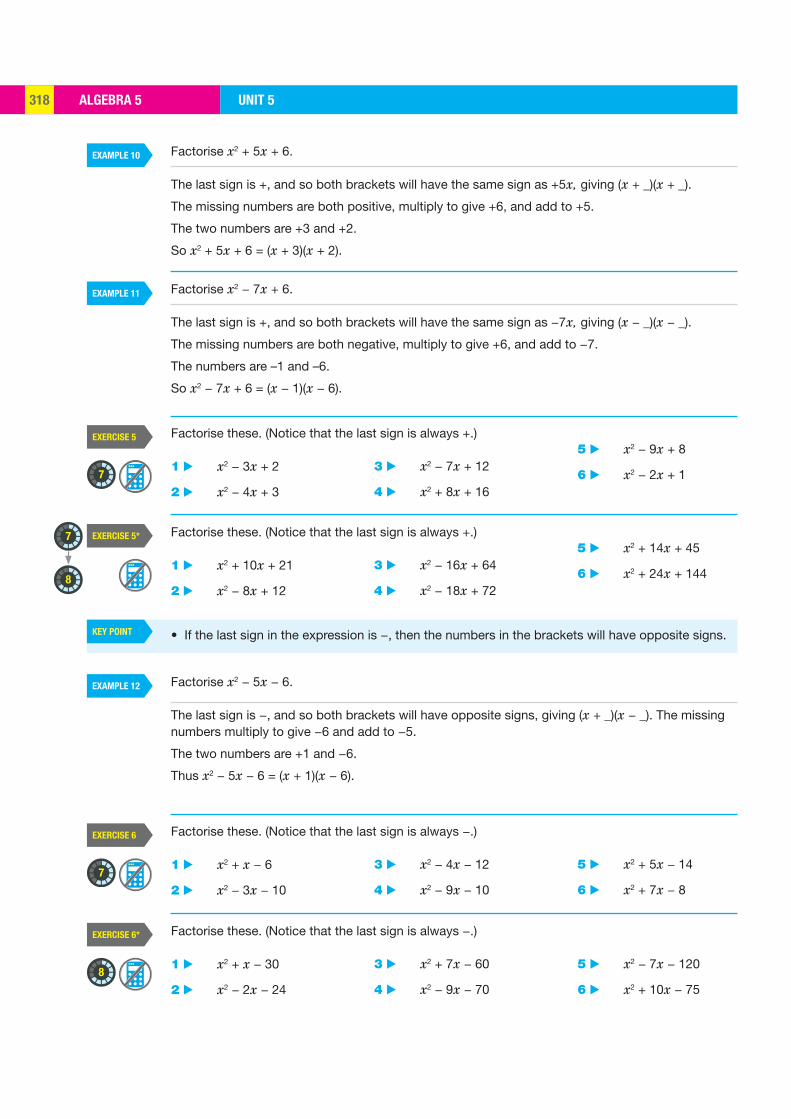
ALGEBRA 5 UNIT 5318
EXAMPLE 10
EXAMPLE 12
EXAMPLE 11
EXERCISE 5
EXERCISE 5*
EXERCISE 6
EXERCISE 6*
KEY POINT
7
7
8
7
8
Factorise x2 + 5x + 6.
The last sign is +, and so both brackets will have the same sign as +5x, giving (x + _)(x + _).
The missing numbers are both positive, multiply to give +6, and add to +5.
The two numbers are +3 and +2.
So x2 + 5x + 6 = (x + 3)(x + 2).
Factorise x2 − 7x + 6.
The last sign is +, and so both brackets will have the same sign as −7x, giving (x − _)(x − _).
The missing numbers are both negative, multiply to give +6, and add to −7.
The numbers are –1 and –6.
So x2 − 7x + 6 = (x − 1)(x − 6).
Factorise x2 − 5x − 6.
The last sign is −, and so both brackets will have opposite signs, giving (x + _)(x − _). The missing numbers multiply to give −6 and add to −5.
The two numbers are +1 and −6.
Thus x2 − 5x − 6 = (x + 1)(x − 6).
1 ▶ x2 − 3x + 2
2 ▶ x2 − 4x + 3
1 ▶ x2 + 10x + 21
2 ▶ x2 − 8x + 12
1 ▶ x2 + x − 6
2 ▶ x2 − 3x − 10
1 ▶ x2 + x − 30
2 ▶ x2 − 2x − 24
3 ▶ x2 − 7x + 12
4 ▶ x2 + 8x + 16
3 ▶ x2 − 16x + 64
4 ▶ x2 − 18x + 72
3 ▶ x2 − 4x − 12
4 ▶ x2 − 9x − 10
3 ▶ x2 + 7x − 60
4 ▶ x2 − 9x − 70
5 ▶ x2 − 9x + 8
6 ▶ x2 − 2x + 1
5 ▶ x2 + 14x + 45
6 ▶ x2 + 24x + 144
5 ▶ x2 + 5x − 14
6 ▶ x2 + 7x − 8
5 ▶ x2 − 7x − 120
6 ▶ x2 + 10x − 75
Factorise these. (Notice that the last sign is always +.)
Factorise these. (Notice that the last sign is always +.)
Factorise these. (Notice that the last sign is always −.)
Factorise these. (Notice that the last sign is always −.)
• If the last sign in the expression is −, then the numbers in the brackets will have opposite signs.
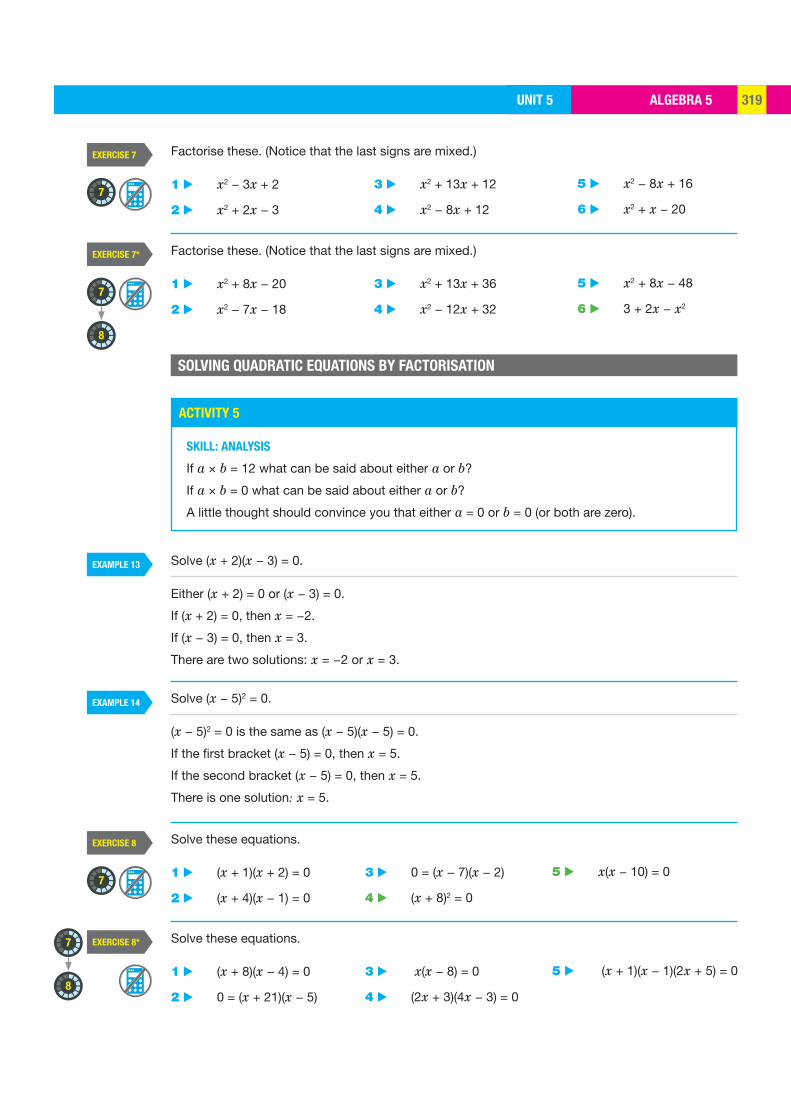
ALGEBRA 5UNIT 5 319
EXAMPLE 13
EXAMPLE 14
EXERCISE 7*
EXERCISE 8
EXERCISE 8*
EXERCISE 7
ACTIVITY 5
7
7
8
7
7
8
Solve (x + 2)(x − 3) = 0.
Either (x + 2) = 0 or (x − 3) = 0.
If (x + 2) = 0, then x = −2.
If (x − 3) = 0, then x = 3.
There are two solutions: x = −2 or x = 3.
Solve (x − 5)2 = 0.
(x − 5)2 = 0 is the same as (x − 5)(x − 5) = 0.
If the first bracket (x − 5) = 0, then x = 5.
If the second bracket (x − 5) = 0, then x = 5.
There is one solution: x = 5.
1 ▶ x2 + 8x − 20
2 ▶ x2 − 7x − 18
1 ▶ (x + 1)(x + 2) = 0
2 ▶ (x + 4)(x − 1) = 0
1 ▶ (x + 8)(x − 4) = 0
2 ▶ 0 = (x + 21)(x − 5)
1 ▶ x2 − 3x + 2
2 ▶ x2 + 2x − 3
3 ▶ x2 + 13x + 36
4 ▶ x2 − 12x + 32
3 ▶ 0 = (x − 7)(x − 2)
4 ▶ (x + 8)2 = 0
3 ▶ x(x − 8) = 0
4 ▶ (2x + 3)(4x − 3) = 0
3 ▶ x2 + 13x + 12
4 ▶ x2 − 8x + 12
5 ▶ x2 + 8x − 48
6 ▶ 3 + 2x − x2
5 ▶ x(x − 10) = 0
5 ▶ (x + 1)(x − 1)(2x + 5) = 0
5 ▶ x2 − 8x + 16
6 ▶ x2 + x − 20
Factorise these. (Notice that the last signs are mixed.)
Solve these equations.
Solve these equations.
Factorise these. (Notice that the last signs are mixed.)
SKILL: ANALYSIS
If a × b = 12 what can be said about either a or b?
If a × b = 0 what can be said about either a or b?
A little thought should convince you that either a = 0 or b = 0 (or both are zero).
SOLVING QUADRATIC EQUATIONS BY FACTORISATION
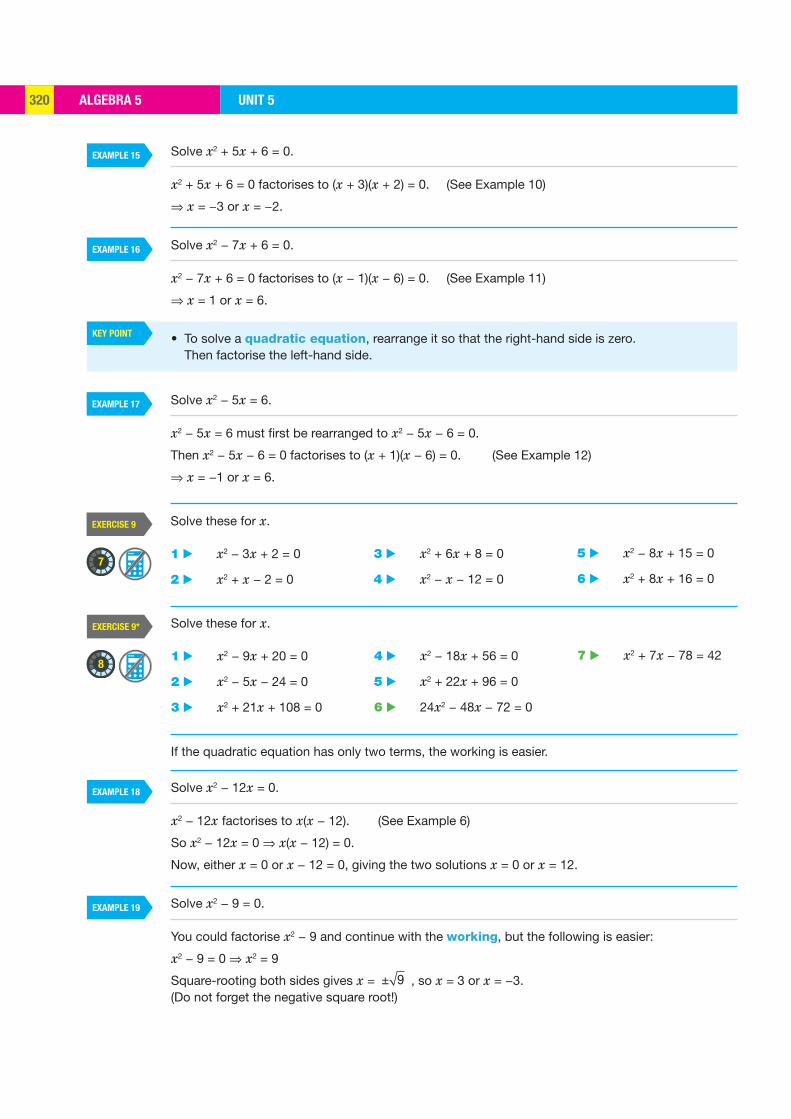
ALGEBRA 5 UNIT 5320
EXAMPLE 15
EXAMPLE 18
EXAMPLE 17
EXAMPLE 16
EXAMPLE 19
KEY POINT
EXERCISE 9
EXERCISE 9*
7
8
Solve x2 + 5x + 6 = 0.
x2 + 5x + 6 = 0 factorises to (x + 3)(x + 2) = 0. (See Example 10)
⇒ x = −3 or x = −2.
Solve x2 − 7x + 6 = 0.
x2 − 7x + 6 = 0 factorises to (x − 1)(x − 6) = 0. (See Example 11)
⇒ x = 1 or x = 6.
If the quadratic equation has only two terms, the working is easier.
Solve x2 − 5x = 6.
x2 − 5x = 6 must first be rearranged to x2 − 5x − 6 = 0.
Then x2 − 5x − 6 = 0 factorises to (x + 1)(x − 6) = 0. (See Example 12)
⇒ x = −1 or x = 6.
• To solve a quadratic equation, rearrange it so that the right-hand side is zero. Then factorise the left-hand side.
1 ▶ x2 − 3x + 2 = 0
2 ▶ x2 + x − 2 = 0
1 ▶ x2 − 9x + 20 = 0
2 ▶ x2 − 5x − 24 = 0
3 ▶ x2 + 21x + 108 = 0
3 ▶ x2 + 6x + 8 = 0
4 ▶ x2 − x − 12 = 0
4 ▶ x2 − 18x + 56 = 0
5 ▶ x2 + 22x + 96 = 0
6 ▶ 24x2 − 48x − 72 = 0
5 ▶ x2 − 8x + 15 = 0
6 ▶ x2 + 8x + 16 = 0
7 ▶ x2 + 7x − 78 = 42
Solve these for x.
Solve these for x.
Solve x2 − 12x = 0.
x2 − 12x factorises to x(x − 12). (See Example 6)
So x2 − 12x = 0 ⇒ x(x − 12) = 0.
Now, either x = 0 or x − 12 = 0, giving the two solutions x = 0 or x = 12.
Solve x2 − 9 = 0.
You could factorise x2 − 9 and continue with the working, but the following is easier:
x2 − 9 = 0 ⇒ x2 = 9
Square-rooting both sides gives x = ± 9 , so x = 3 or x = −3. (Do not forget the negative square root!)
ALGEBRA 5UNIT 5 321
EXAMPLE 20
EXAMPLE 21
EXERCISE 10
EXERCISE 10*
7
7
9
9
x 1 3
x
The product of two consecutive even numbers is 120. What are the numbers?
Let the first number be x. The second even number is two more than x and can be written as x + 2.
Then x × (x + 2) = 120 (Multiply out the bracket)
x2 + 2x = 120 (Rearrange to equal zero)
x2 + 2x − 120 = 0
(x − 10)(x + 12) = 0 (Factorise)
x = 10 or −12
So, the numbers are 10 and 12 or −12 and −10.
There are two possible answers. Answering the question by ‘trial and improvement’ would find the positive answer, but probably not the negative answer.
SKILL: PROBLEM SOLVING AND REASONING
The length of a rectangular terrace is 3 m more than the width. If the area is 28 m2, find the length and width of the terrace.
Let x be the width in metres. Then the length is (x + 3) metres.
The area is x × (x + 3) = 28 (Multiply out the bracket)
x2 + 3x = 28 (Rearrange to equal zero)
x2 + 3x − 28 = 0 (Factorise)
(x + 7)(x − 4) = 0
x = −7 or x = 4
As the answer cannot be negative, the width is 4 m and the length is 7 m.
1 ▶ x2 − 2x = 0
2 ▶ x2 + 7x = 0
1 ▶ x2 − 125x = 0
2 ▶ x2 + 231x = 0
3 ▶ x2 − 25x = 0
4 ▶ x2 + 23x = 0
3 ▶ x2 − 64 = 0
4 ▶ x2 − 169 = 0
5 ▶ x2 − 4 = 0
6 ▶ x2 − 25 = 0
5 ▶ x2 − 7 = 0
6 ▶ x2 + 9 = 0
Solve these for x.
Solve these for x.
PROBLEMS LEADING TO QUADRATIC EQUATIONS
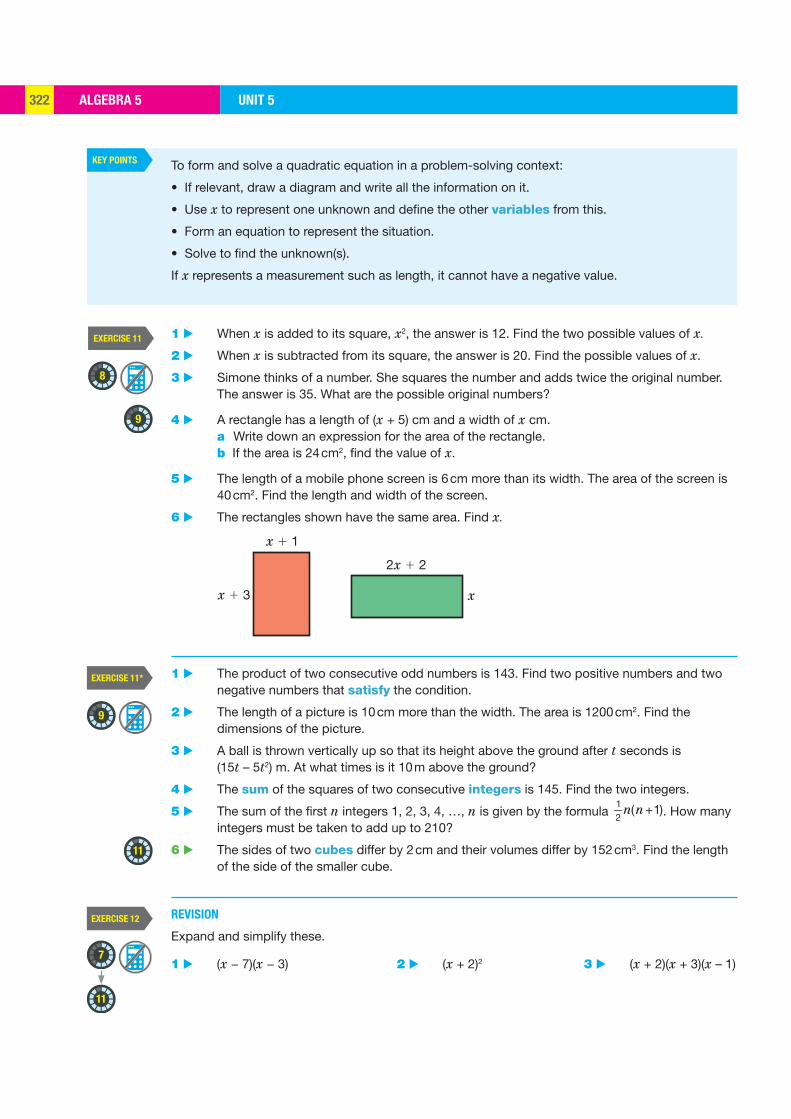
ALGEBRA 5 UNIT 5322
KEY POINTS
EXERCISE 11
EXERCISE 11*
EXERCISE 12
8
9
9
11
11
7
x 1 3
x 1 1
2x 1 2
x
To form and solve a quadratic equation in a problem-solving context:
• If relevant, draw a diagram and write all the information on it.
• Use x to represent one unknown and define the other variables from this.
• Form an equation to represent the situation.
• Solve to find the unknown(s).
If x represents a measurement such as length, it cannot have a negative value.
1 ▶ When x is added to its square, x2, the answer is 12. Find the two possible values of x.
2 ▶ When x is subtracted from its square, the answer is 20. Find the possible values of x.
3 ▶ Simone thinks of a number. She squares the number and adds twice the original number. The answer is 35. What are the possible original numbers?
4 ▶ A rectangle has a length of (x + 5) cm and a width of x cm. a Write down an expression for the area of the rectangle. b If the area is 24 cm2, find the value of x.
5 ▶ The length of a mobile phone screen is 6 cm more than its width. The area of the screen is 40 cm2. Find the length and width of the screen.
6 ▶ The rectangles shown have the same area. Find x.
1 ▶ The product of two consecutive odd numbers is 143. Find two positive numbers and two negative numbers that satisfy the condition.
2 ▶ The length of a picture is 10 cm more than the width. The area is 1200 cm2. Find the dimensions of the picture.
3 ▶ A ball is thrown vertically up so that its height above the ground after t seconds is (15t – 5t2) m. At what times is it 10 m above the ground?
4 ▶ The sum of the squares of two consecutive integers is 145. Find the two integers.
5 ▶ The sum of the first n integers 1, 2, 3, 4, …, n is given by the formula +12
( 1)n n . How many integers must be taken to add up to 210?
6 ▶ The sides of two cubes differ by 2 cm and their volumes differ by 152 cm3. Find the length of the side of the smaller cube.
REVISION
Expand and simplify these.
1 ▶ (x − 7)(x − 3) 2 ▶ (x + 2)2 3 ▶ (x + 2)(x + 3)(x – 1)

ALGEBRA 5UNIT 5 323
EXERCISE 12*
7
12
(x 1 3) cm
(x 1 2) cm
x cm
x cm
A B
D
H G
5 cm
FE
C
2 m
5 ▶ x2 − 36
8 ▶ x2 − 4x − 12 = 0
9 ▶ x2 − 5x = 0
1 ▶ (x + 9)(x − 12)
6 ▶ x2 + 4x + 3
10 ▶ x2 − 36 = 0
11 ▶ x2 − x = 20
2 ▶ (2x − 3)2
7 ▶ x2 + 2x − 8
4 ▶ A rectangle with length (x + 3) cm and width (x + 2) cm has a square of length x cm cut out of it.
a Find and simplify an expression for the area of the original rectangle.
b Therefore, find an expression for the shaded area.
c The shaded area is 26 cm2. Find the value of x.
Factorise.
12 ▶ The width of a laptop screen is 10 cm more than the height. The area of the screen is 600 cm2. Find the dimensions of the screen.
REVISION
Expand and simplify these.
Solve for x.
5 ▶ The foot of a ladder is 2 m away from a vertical wall. The height that the ladder reaches up the wall is
12 m less
than the length of the ladder. Find the length of the ladder.
6 ▶ An abstract painting is a square of side 96 cm, and shows three circles that touch each other and the sides of the square. The top two circles have the same radius. What is the radius of the third circle?
Solve these for x.
7 ▶ x2 − 121 = 0
8 ▶ x2 − 7x = 0
9 ▶ x2 − x = 56
10 ▶ x2 − 15x + 54 = 0
11 ▶ Two integers differ by 6. The sum of the squares of these integers is 116. Find the two integers.
12 ▶ The stopping distance of a car travelling at x kph is x2 + 30x
150 m.
a After braking, a car travels 12 m before stopping. Show that x2 + 30x = 1800.
b Find the value of x.
13 ▶ A square picture has a border 5 cm wide. The picture area is
49 of the total
area. Find the area of the picture.
3 ▶ (3x − 1)(2x + 3) 4 ▶ (x + 3)(x – 2)(x + 5)
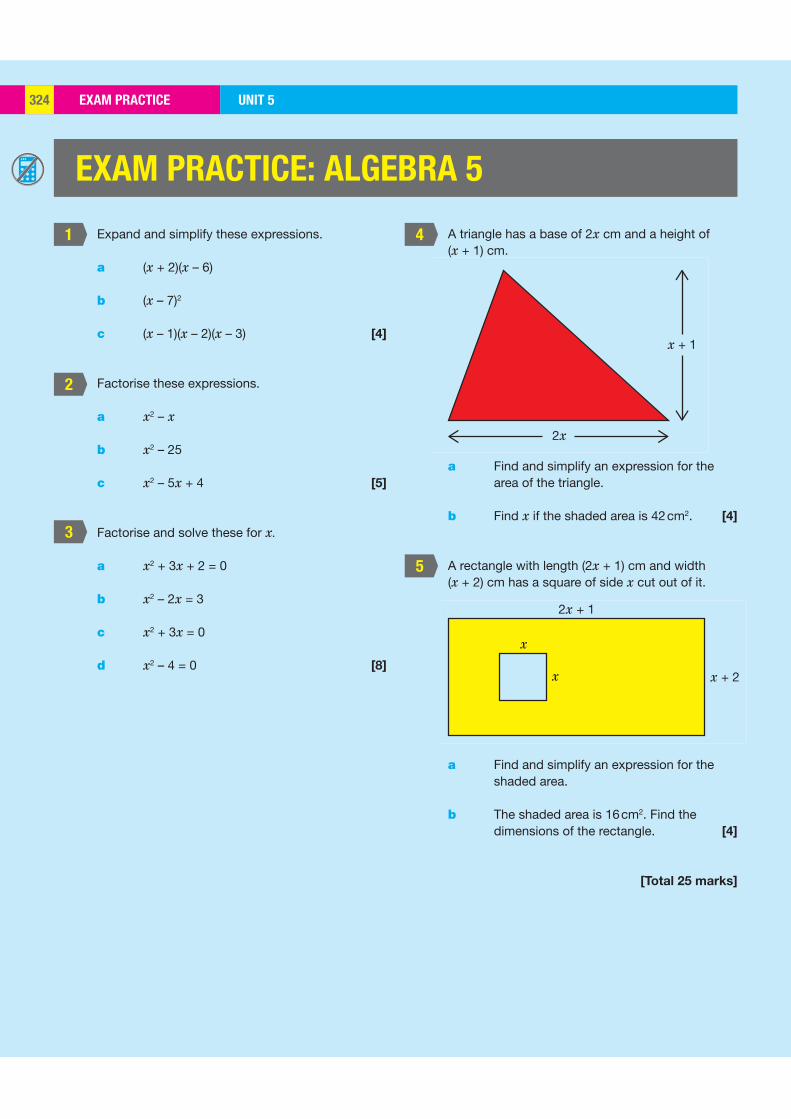
EXAM PRACTICE UNIT 5324
1
2
3
4
5
x + 1
2x
x + 2
2x + 1
x
x
Expand and simplify these expressions.
a (x + 2)(x – 6)
b (x – 7)2
c (x – 1)(x – 2)(x – 3) [4]
Factorise these expressions.
a x2 – x
b x2 – 25
c x2 – 5x + 4 [5]
Factorise and solve these for x.
a x2 + 3x + 2 = 0
b x2 – 2x = 3
c x2 + 3x = 0
d x2 – 4 = 0 [8]
A triangle has a base of 2x cm and a height of (x + 1) cm.
a Find and simplify an expression for the area of the triangle.
b Find x if the shaded area is 42 cm2. [4]
A rectangle with length (2x + 1) cm and width (x + 2) cm has a square of side x cut out of it.
a Find and simplify an expression for the shaded area.
b The shaded area is 16 cm2. Find the dimensions of the rectangle. [4]
[Total 25 marks]
EXAM PRACTICE: ALGEBRA 5
CHAPTER SUMMARYUNIT 5 325
(a + b) (c + d) = ac + ad + bc + bd
F
O
I
L
CHAPTER SUMMARY: ALGEBRA 5
MULTIPLYING BRACKETS
FACTORISING QUADRATIC EXPRESSIONS
Solve x2 – x = 6.
x2 – x – 6 = 0 Rearrange the equation so that the right-hand side equals zero.
(x – 3)(x + 2) = 0 Factorise the left-hand side.
x = 3 or x = –2 Use the fact that a × b = 0 ⇒ a = 0 or b = 0 (or both are zero) to solve.
Define your variable.
Change the word problem into a mathematical equation.
Solve the equation.
Choose the real-life solution.
SOLVING QUADRATIC EQUATIONS BY FACTORISATION
PROBLEMS LEADING TO QUADRATIC EQUATIONS
Use the word (mnemonic) FOIL.
From each bracket:
• multiply the First terms• multiply the Outside terms• multiply the Inside terms• multiply the Last terms.
Then add the four terms and simplify.
You can multiply brackets in any order.
With two terms:
x2 – ax = x(x – a)x2 – a2 = (x – a)(x + a)x2 + a2 does not factorise.
With three terms:
The numbers in the brackets add up to the number in front of the x term.If the number term is positive, then the numbers in the brackets will have the same sign as the x term.
x2 + 5x + 6 = (x + 3)(x + 2) x2 – 5x + 6 = (x – 3)(x – 2)
If the number term is negative, then the numbers in the brackets will have opposite signs.
x2 – x – 6 = (x – 3)(x + 2) x2 + x – 6 = (x + 3)(x – 2)
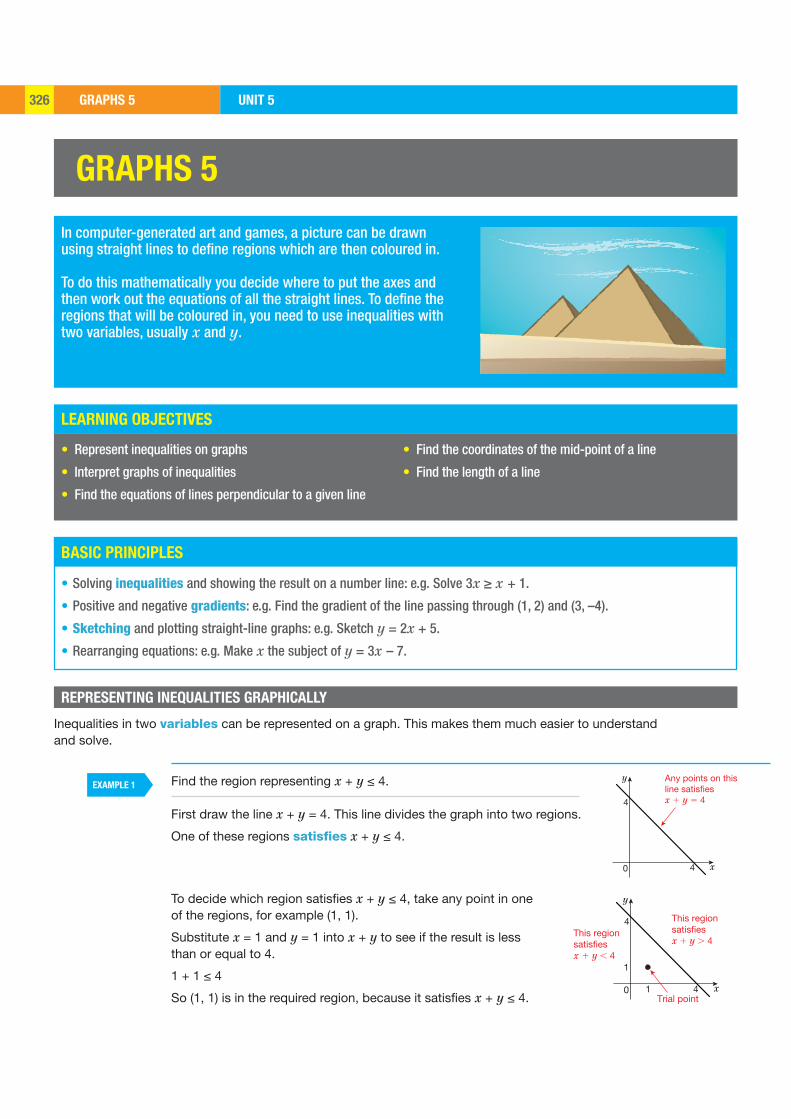
GRAPHS 5 UNIT 5326
LEARNING OBJECTIVES
BASIC PRINCIPLES
EXAMPLE 1
40
4
x
y Any points on thisline satisfiesx 1 y 5 4
41
1
0
4
x
y
This regionsatisfiesx 1 y . 4
This regionsatisfiesx 1 y , 4
Trial point
GRAPHS 5
In computer-generated art and games, a picture can be drawn using straight lines to defi ne regions which are then coloured in.
To do this mathematically you decide where to put the axes and then work out the equations of all the straight lines. To defi ne the regions that will be coloured in, you need to use inequalities with two variables, usually x and y.
• Represent inequalities on graphs
• Interpret graphs of inequalities
• Find the equations of lines perpendicular to a given line
• Find the coordinates of the mid-point of a line
• Find the length of a line
REPRESENTING INEQUALITIES GRAPHICALLY
Inequalities in two variables can be represented on a graph. This makes them much easier to understand and solve.
• Solving inequalities and showing the result on a number line: e.g. Solve 3x ≥ x + 1.
• Positive and negative gradients: e.g. Find the gradient of the line passing through (1, 2) and (3, –4).
• Sketching and plotting straight-line graphs: e.g. Sketch y = 2x + 5.
• Rearranging equations: e.g. Make x the subject of y = 3x – 7.
Find the region representing x + y ≤ 4.
First draw the line x + y = 4. This line divides the graph into two regions.
One of these regions satisfies x + y ≤ 4.
To decide which region satisfies x + y ≤ 4, take any point in one of the regions, for example (1, 1).
Substitute x = 1 and y = 1 into x + y to see if the result is less than or equal to 4.
1 + 1 ≤ 4
So (1, 1) is in the required region, because it satisfies x + y ≤ 4.
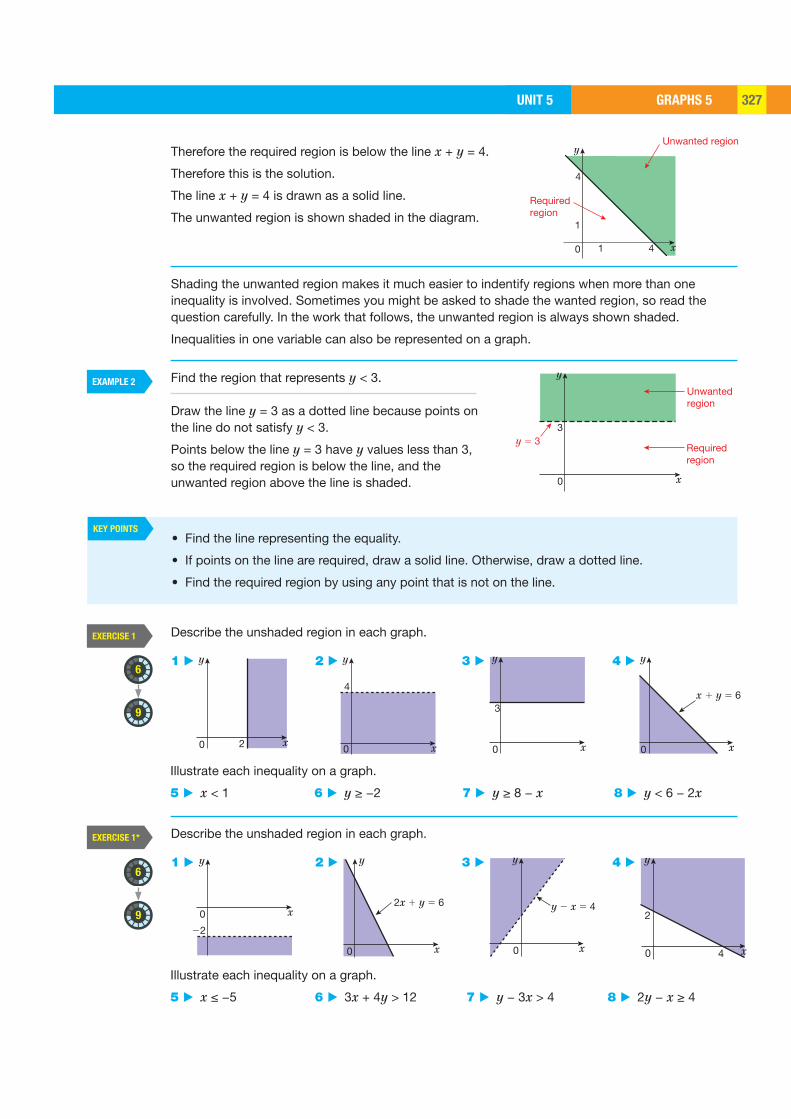
GRAPHS 5UNIT 5 327
EXAMPLE 2
41
1
0
4
x
yUnwanted region
Requiredregion
0
3
x
y
y 5 3
Unwantedregion
Requiredregion
0 2 x
y
4
0 x
y
3
0 x
y
0 x
y
x 1 y 5 6
2x 1 y 5 6
0 x
y
2
40 x
y
y 2 x 5 4
0 x
y
22
0 x
y
Therefore the required region is below the line x + y = 4.
Therefore this is the solution.
The line x + y = 4 is drawn as a solid line.
The unwanted region is shown shaded in the diagram.
Shading the unwanted region makes it much easier to indentify regions when more than one inequality is involved. Sometimes you might be asked to shade the wanted region, so read the question carefully. In the work that follows, the unwanted region is always shown shaded.
Inequalities in one variable can also be represented on a graph.
Find the region that represents y < 3.
Draw the line y = 3 as a dotted line because points on the line do not satisfy y < 3.
Points below the line y = 3 have y values less than 3, so the required region is below the line, and the unwanted region above the line is shaded.
KEY POINTS• Find the line representing the equality.
• If points on the line are required, draw a solid line. Otherwise, draw a dotted line.
• Find the required region by using any point that is not on the line.
6
6
9
9
EXERCISE 1
EXERCISE 1*
Describe the unshaded region in each graph.
1 ▶ 2 ▶ 3 ▶ 4 ▶
Describe the unshaded region in each graph.
1 ▶ 2 ▶ 3 ▶ 4 ▶
Illustrate each inequality on a graph.
5 ▶ x < 1 6 ▶ y ≥ −2 7 ▶ y ≥ 8 − x 8 ▶ y < 6 − 2x
Illustrate each inequality on a graph.
5 ▶ x ≤ −5 6 ▶ 3x + 4y > 12 7 ▶ y − 3x > 4 8 ▶ 2y − x ≥ 4

GRAPHS 5 UNIT 5328
EXAMPLE 3 EXAMPLE 4
0 1 4 x
y
x 5 1
x 5 4
0 4
2
4
x
y
y – x = 2 x + y = 4
0 2 5 x
y
22
3
0 x
y
23 40 x
y
3
9
0 x
y
0 x
y x 2 y 5 2
x 1 y 5 3
0 x
yy 5 x 1 3
2y 1 x 5 6
023 4
y
x
2y 1 x 5 10
2y 1 x 5 40
y
x0 322
4
y
x
Illustrate on a graph the region that satisfies 1 ≤ x < 4.
Find the region representing x + y ≤ 4 and y − x < 2.
ACTIVITY 1
What would several inequalities drawn on one graph look like if the wanted region were shaded?
EXERCISE 2
EXERCISE 2*
Describe the unshaded region in the graph.
1 ▶ 2 ▶ 3 ▶
4 ▶ 5 ▶ 6 ▶
Illustrate each inequality on a graph.
7 ▶ 2 ≤ y < 5 8 ▶ x < −1 or x ≥ 4
9 ▶ y > 5 − x and y ≥ 2x − 2 10 ▶ x ≥ 0, y > 2x − 3 and y 2x2
Describe the unshaded region in the graph.
1 ▶ 2 ▶ 3 ▶
More than one inequality can be represented on a graph.
7
7
9
9
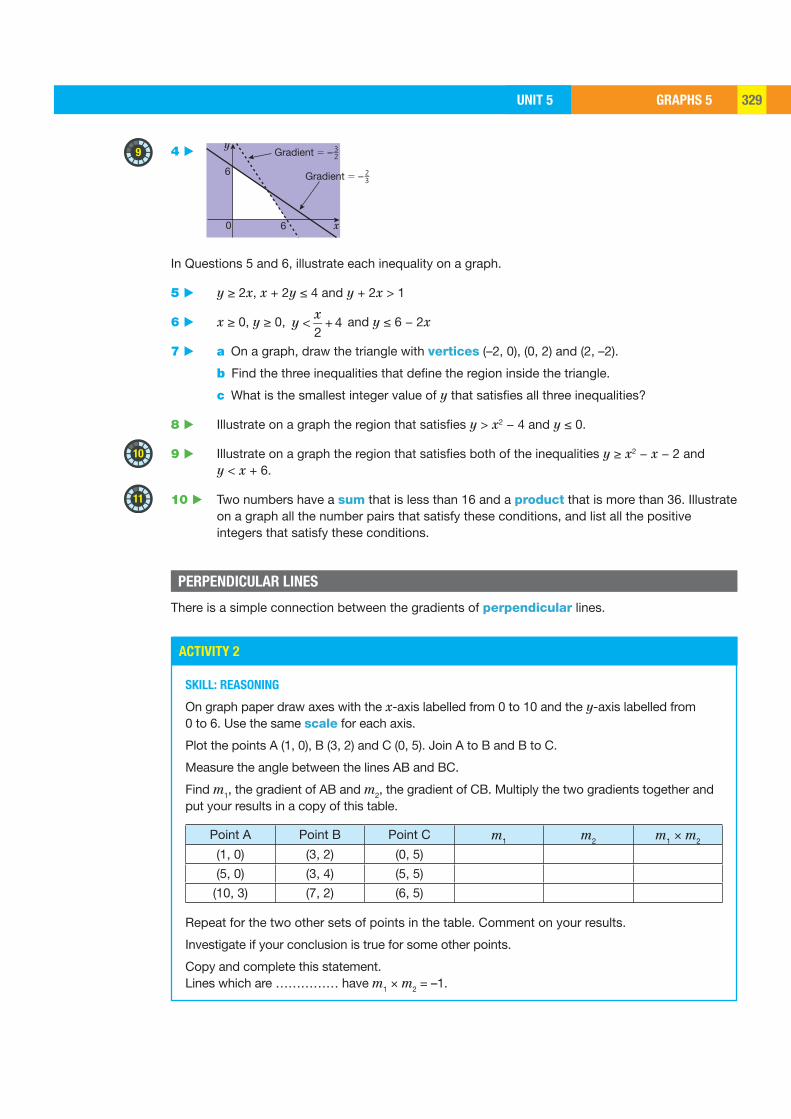
GRAPHS 5UNIT 5 329
6
60
y
x
Gradient 5 – 32
Gradient 5 – 23
ACTIVITY 2
SKILL: REASONING
On graph paper draw axes with the x-axis labelled from 0 to 10 and the y-axis labelled from 0 to 6. Use the same scale for each axis.
Plot the points A (1, 0), B (3, 2) and C (0, 5). Join A to B and B to C.
Measure the angle between the lines AB and BC.
Find m1, the gradient of AB and m2, the gradient of CB. Multiply the two gradients together and put your results in a copy of this table.
Point A Point B Point C m1 m2 m1 × m2
(1, 0) (3, 2) (0, 5)
(5, 0) (3, 4) (5, 5)
(10, 3) (7, 2) (6, 5)
Repeat for the two other sets of points in the table. Comment on your results.
Investigate if your conclusion is true for some other points.
Copy and complete this statement. Lines which are …………… have m1 × m2 = –1.
4 ▶
In Questions 5 and 6, illustrate each inequality on a graph.
5 ▶ y ≥ 2x, x + 2y ≤ 4 and y + 2x > 1
6 ▶ x ≥ 0, y ≥ 0, y <x2
+ 4 and y ≤ 6 − 2x
7 ▶ a On a graph, draw the triangle with vertices (–2, 0), (0, 2) and (2, –2).
b Find the three inequalities that define the region inside the triangle.
c What is the smallest integer value of y that satisfies all three inequalities?
8 ▶ Illustrate on a graph the region that satisfies y > x2 − 4 and y ≤ 0.
9 ▶ Illustrate on a graph the region that satisfies both of the inequalities y ≥ x2 − x − 2 and y < x + 6.
10 ▶ Two numbers have a sum that is less than 16 and a product that is more than 36. Illustrate on a graph all the number pairs that satisfy these conditions, and list all the positive integers that satisfy these conditions.
PERPENDICULAR LINES
There is a simple connection between the gradients of perpendicular lines.
9
10
11
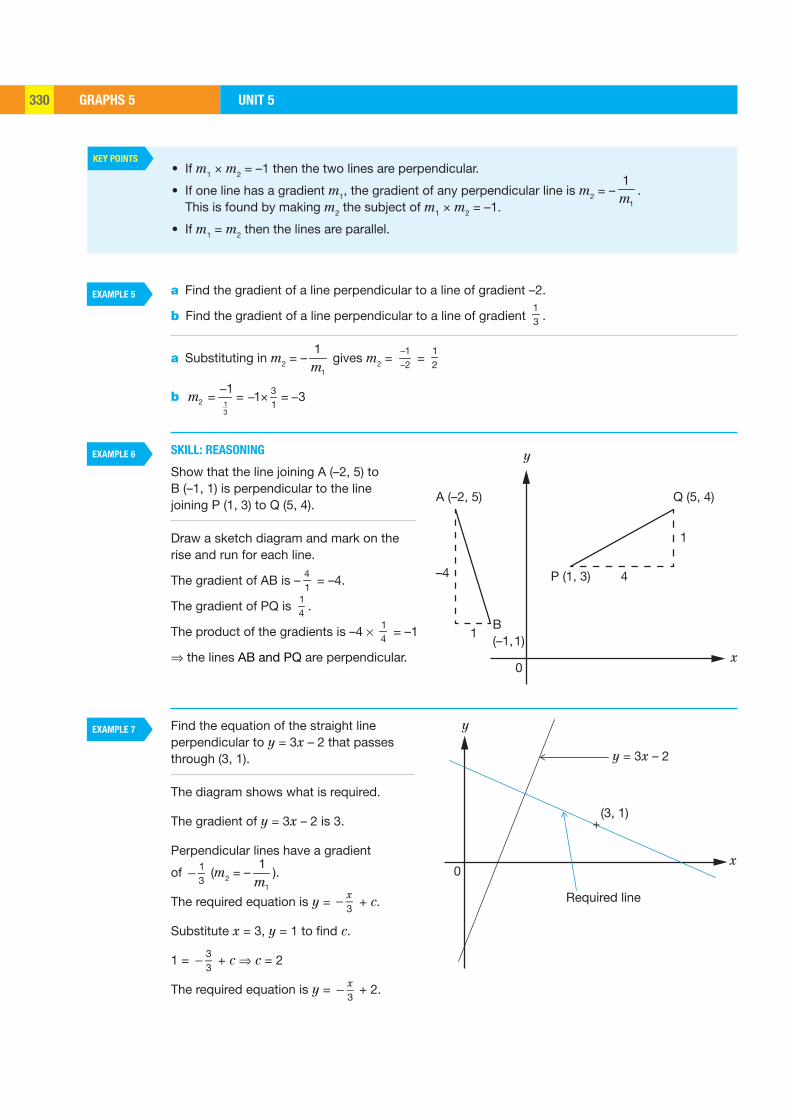
GRAPHS 5 UNIT 5330
KEY POINTS
EXAMPLE 5
EXAMPLE 6
EXAMPLE 7
4
x
y
0
P (1, 3)
Q (5, 4)
1
A (–2, 5)
B(–1,1)
1
–4
x
y
0
(3, 1)
y = 3x – 2
+
Required line
• If m1 × m2 = –1 then the two lines are perpendicular.
• If one line has a gradient m1, the gradient of any perpendicular line is m2 = –1
1m
. This is found by making m2 the subject of m1 × m2 = –1.
• If m1 = m2 then the lines are parallel.
a Find the gradient of a line perpendicular to a line of gradient –2.
b Find the gradient of a line perpendicular to a line of gradient 13 .
a Substituting in m2 = –1
1m
gives m2 = −−12
= 12
b −
= = − × = −2 13
31
11 3m
SKILL: REASONING
Show that the line joining A (–2, 5) to B (–1, 1) is perpendicular to the line joining P (1, 3) to Q (5, 4).
Draw a sketch diagram and mark on the rise and run for each line.
The gradient of AB is –41
= –4.
The gradient of PQ is 14
.
The product of the gradients is –4 × 14
= –1
⇒ the lines AB and PQ are perpendicular.
Find the equation of the straight line perpendicular to y = 3x – 2 that passes through (3, 1).
The diagram shows what is required.
The gradient of y = 3x – 2 is 3.
Perpendicular lines have a gradient
of 13
(m2 = –1
1m
).
The required equation is y = x3
+ c.
Substitute x = 3, y = 1 to find c.
1 = 33
+ c ⇒ c = 2
The required equation is y = x3
+ 2.
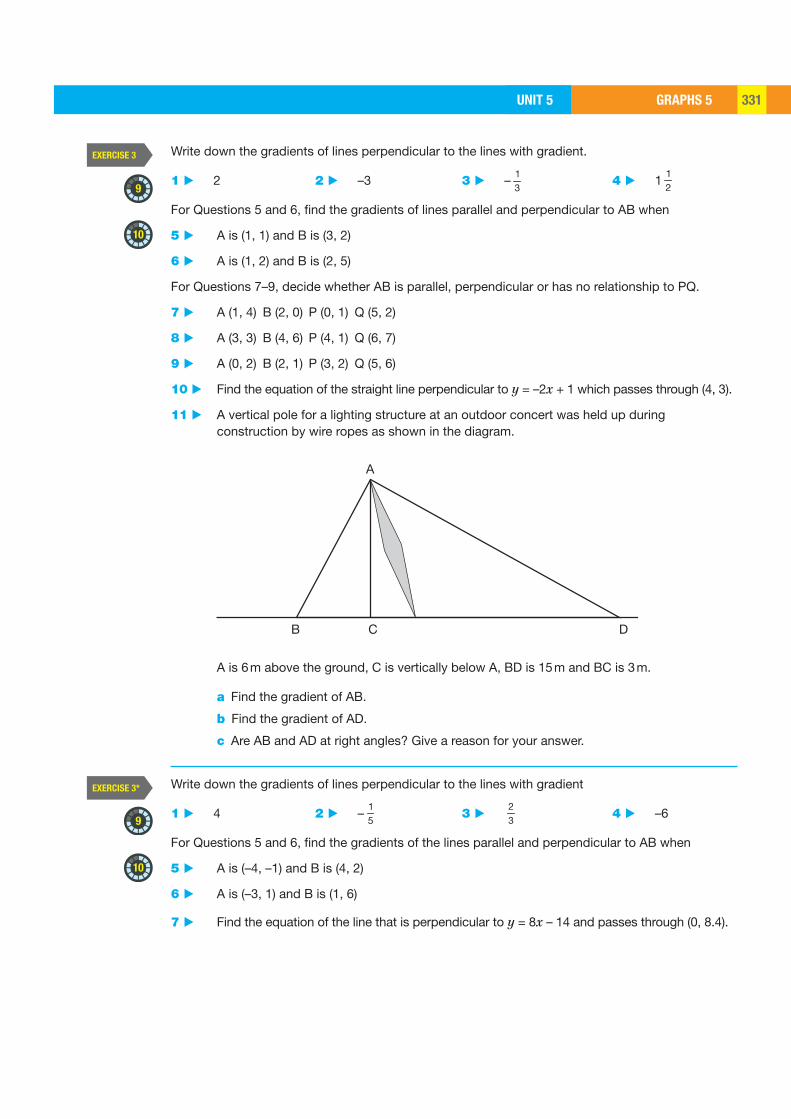
GRAPHS 5UNIT 5 331
A
B C D
EXERCISE 3
EXERCISE 3*
Write down the gradients of lines perpendicular to the lines with gradient.
1 ▶ 2 2 ▶ –3 3 ▶ –13
4 ▶ 112
For Questions 5 and 6, find the gradients of lines parallel and perpendicular to AB when
5 ▶ A is (1, 1) and B is (3, 2)
6 ▶ A is (1, 2) and B is (2, 5)
For Questions 7–9, decide whether AB is parallel, perpendicular or has no relationship to PQ.
7 ▶ A (1, 4) B (2, 0) P (0, 1) Q (5, 2)
8 ▶ A (3, 3) B (4, 6) P (4, 1) Q (6, 7)
9 ▶ A (0, 2) B (2, 1) P (3, 2) Q (5, 6)
10 ▶ Find the equation of the straight line perpendicular to y = –2x + 1 which passes through (4, 3).
11 ▶ A vertical pole for a lighting structure at an outdoor concert was held up during construction by wire ropes as shown in the diagram.
Write down the gradients of lines perpendicular to the lines with gradient
1 ▶ 4 2 ▶ –15
3 ▶ 23
4 ▶ –6
For Questions 5 and 6, find the gradients of the lines parallel and perpendicular to AB when
5 ▶ A is (–4, –1) and B is (4, 2)
6 ▶ A is (–3, 1) and B is (1, 6)
7 ▶ Find the equation of the line that is perpendicular to y = 8x – 14 and passes through (0, 8.4).
A is 6 m above the ground, C is vertically below A, BD is 15 m and BC is 3 m.
a Find the gradient of AB.
b Find the gradient of AD.
c Are AB and AD at right angles? Give a reason for your answer.
9
9
10
10

GRAPHS 5 UNIT 5332
A
B
C D E
F
x
y
B
A
CR
P
W
8 ▶ An architect is designing a roof on a building. The cross-section is shown in the diagram. The point D is vertically below A, BC and FE are 3 m and CD is 5 m.
a The gradient of AB is 0.8. How high is A above D? b AF is at right angles to AB. What is the gradient of AF? c What is the width of the building?
9 ▶ ‘Speedy Pot’ Joe has ‘been snookered’. The situation is shown in the diagram where corner A of the snooker table has been taken as the origin.
Joe wants to hit the red ball R at (5, 8) with the white ball W at (2, 2) but the pink ball P at (4, 6) is in the way. He aims the white ball at a point B (0, 5) on the cushion at the edge of the table.
a What is the gradient of the line BW?
The ball bounces back along the line BC which is perpendicular to BW.
b What is the gradient of BC? c What is the equation of the line BC? d Does the white ball hit the red ball?
10 ▶ Find b such that the line from the origin to (3, 4b) is perpendicular to the line from the origin to (3, –b).
11 ▶ The vertices of a triangle are A (–2, 1), B (6.1, 3.7) and C (1, c). Find the value of c so that angle ABC is a right angle.
12 ▶ Find the value of p if the line joining (3, p) to (7, –4p) is perpendicular to the line joining (–1, –3) to (3, 7).
11
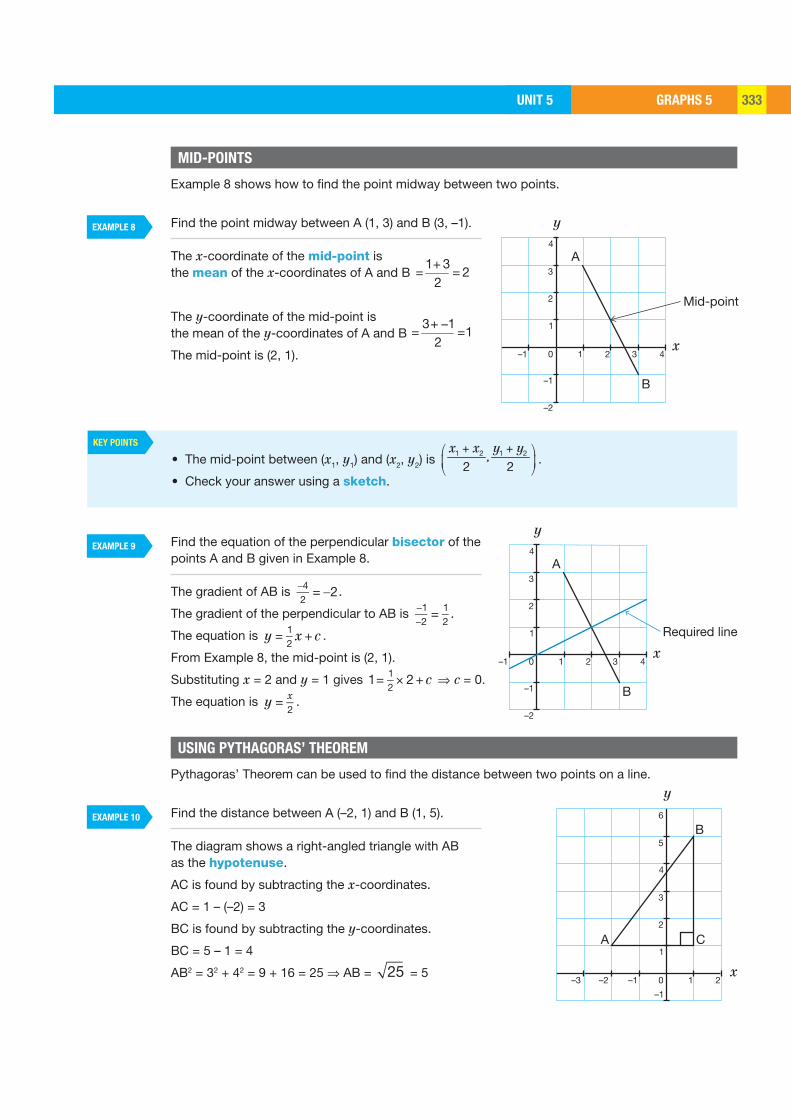
GRAPHS 5UNIT 5 333
KEY POINTS
2 4
1
2
1 3–1
3
4
0
–1
–2
x
y
A
B
Mid-point
2 4
1
2
1 3–1
3
4
0
–1
–2
x
y
A
B
Required line
2–2
1
2
1–3 –1
3
4
5
6
–1
0x
y
A
B
C
MID-POINTS
USING PYTHAGORAS’ THEOREM
Example 8 shows how to find the point midway between two points.
Pythagoras’ Theorem can be used to find the distance between two points on a line.
EXAMPLE 8
EXAMPLE 10
EXAMPLE 9
Find the point midway between A (1, 3) and B (3, –1).
The x-coordinate of the mid-point is the mean of the x-coordinates of A and B
1 32
2+
= =
The y-coordinate of the mid-point is the mean of the y-coordinates of A and B
3 11
2+ −
= =
The mid-point is (2, 1).
Find the distance between A (–2, 1) and B (1, 5).
The diagram shows a right-angled triangle with AB as the hypotenuse.
AC is found by subtracting the x-coordinates.
AC = 1 – (–2) = 3
BC is found by subtracting the y-coordinates.
BC = 5 – 1 = 4
AB2 = 32 + 42 = 9 + 16 = 25 ⇒ AB = 25 = 5
Find the equation of the perpendicular bisector of the points A and B given in Example 8.
The gradient of AB is 42
= 2.
The gradient of the perpendicular to AB is 12
= 12
.
The equation is y = 12
x +c .
From Example 8, the mid-point is (2, 1).
Substituting x = 2 and y = 1 gives 1= 12
2 +c× ⇒ c = 0.
The equation is y = x2
.
• The mid-point between (x1, y1) and (x2, y2) is + +⎛ ⎞
⎜ ⎟⎝ ⎠
1 2 1 2, 2 2
x x y y.
• Check your answer using a sketch.
GRAPHS 5 UNIT 5334
KEY POINTS
8
• The mean of the coordinates gives the coordinates of the mid-point.
• Use Pythagoras’ Theorem to find the distance between two points.
• Draw a diagram to check if your answer is reasonable.
EXERCISE 4
EXERCISE 4*
1 ▶ Find the mid-point between A (2, 5) and B (10, 7).
2 ▶ Find the mid-point between A (–3, –4) and B (5, –2).
3 ▶ Find the distance between A (8, 1) and B (2, 6).
4 ▶ Find the distance between A (–5, 1) and B (–3,–4).
5 ▶ Find the equation of the perpendicular bisector of the line AB when A is (4, 1) and B is (–2, –1).
6 ▶ Show that the points A (–1, 1), B (11, 6), C (6, 18) and D (–6, 13) form a square.
1 ▶ Find the equation of the perpendicular bisector of the line AB when A is (4, 0) and B is (–2, 4).
2 ▶ The four points A (4, 2), B (10, 4), C (10, 8) and D (6, 10) form a quadrilateral. The mid-point of AB is P, the mid-point of BC is Q, the mid-point of CD is R and the mid-point of AD is S. Show that PQRS is a parallelogram.
3 ▶ A is (0, –4), B is (2, 2) and C is (–1, 3).
a Show that the points A, B and C form a right-angled triangle by (i) showing that the triangle satisfies Pythagoras’ Theorem (ii) showing that two of the sides are perpendicular.
b Find the area of triangle ABC.
4 ▶ A is (1, 5), B is (5, 3) and C is (6, 7). Find the equation of the median of the triangle ABC that passes through C.
5 ▶ l is the line y = 2x + 2 and A is (6, 4).
a Find the equation of the straight line through A perpendicular to l.
b The line in part a crosses l at the point B. Calculate the coordinates of B.
c AB is the shortest distance from A to the line l. Calculate the distance AB.
6 ▶ A is (5, 6), B is (7, 2) and C is (–2, 5).
a Find the equation of the perpendicular bisector of AB.
b Find the equation of the perpendicular bisector of AC.
c These two lines cross at point D. Calculate the coordinates of D.
d Calculate the distances AD, BD and CD.
e What is the geometrical connection between the points A, B, C and D?
Q4 HINT A median of a
triangle is the line
passing through
a vertex and the
mid-point of the
opposite side.
Q6c HINT Use
simultaneous
equations.
Q5b HINT Use
simultaneous equations.
7
10
10
11
11
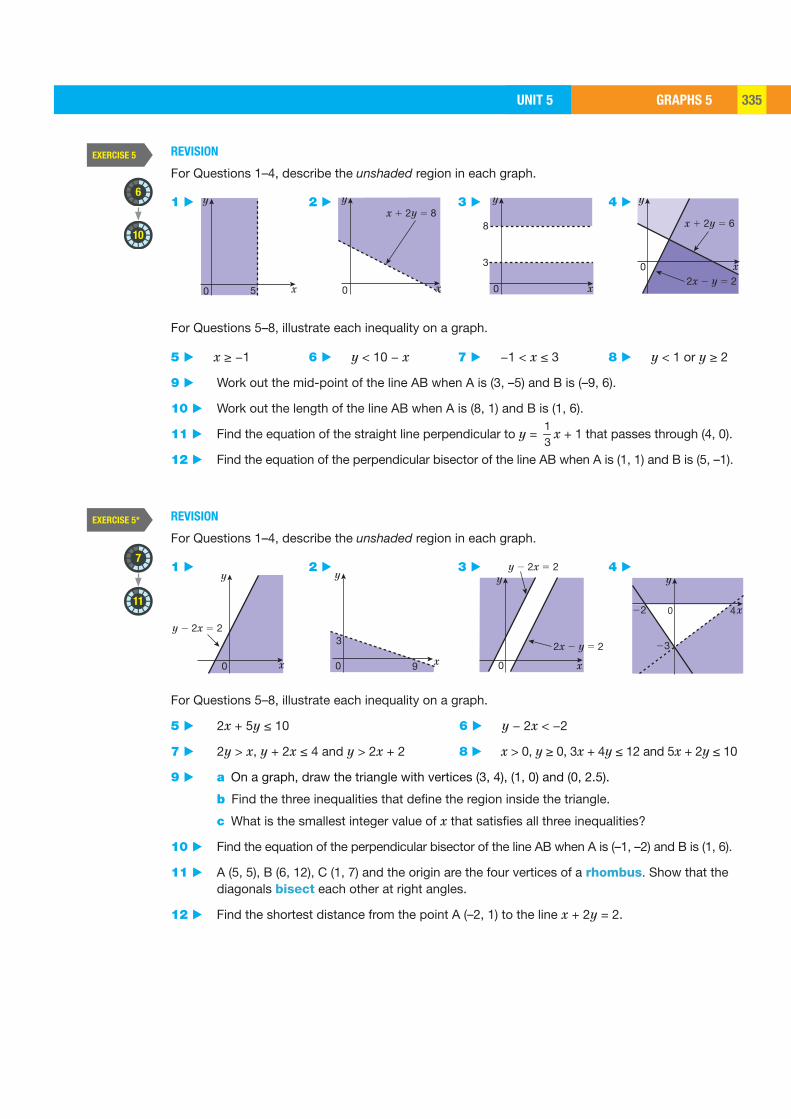
GRAPHS 5UNIT 5 335
EXERCISE 5
EXERCISE 5*
50 x
yx 1 2y 5 8
0 x
y
8
3
0 x
y
x 1 2y 5 6
2x 2 y 5 20 x
y
y 2 2x 5 2
0 x
y
0 x
y
3
9 0
y
x
2x 2 y 5 2
y 2 2x 5 2
23
22 40
y
x
REVISION
For Questions 1–4, describe the unshaded region in each graph.
1 ▶ 2 ▶ 3 ▶ 4 ▶
REVISION
For Questions 1–4, describe the unshaded region in each graph.
1 ▶ 2 ▶ 3 ▶ 4 ▶
For Questions 5–8, illustrate each inequality on a graph.
5 ▶ 2x + 5y ≤ 10 6 ▶ y − 2x < −2
7 ▶ 2y > x, y + 2x ≤ 4 and y > 2x + 2 8 ▶ x > 0, y ≥ 0, 3x + 4y ≤ 12 and 5x + 2y ≤ 10
9 ▶ a On a graph, draw the triangle with vertices (3, 4), (1, 0) and (0, 2.5).
b Find the three inequalities that define the region inside the triangle.
c What is the smallest integer value of x that satisfies all three inequalities?
10 ▶ Find the equation of the perpendicular bisector of the line AB when A is (–1, –2) and B is (1, 6).
11 ▶ A (5, 5), B (6, 12), C (1, 7) and the origin are the four vertices of a rhombus. Show that the diagonals bisect each other at right angles.
12 ▶ Find the shortest distance from the point A (–2, 1) to the line x + 2y = 2.
For Questions 5–8, illustrate each inequality on a graph.
5 ▶ x ≥ −1 6 ▶ y < 10 − x 7 ▶ −1 < x ≤ 3 8 ▶ y < 1 or y ≥ 2
9 ▶ Work out the mid-point of the line AB when A is (3, –5) and B is (–9, 6).
10 ▶ Work out the length of the line AB when A is (8, 1) and B is (1, 6).
11 ▶ Find the equation of the straight line perpendicular to y = 13
x + 1 that passes through (4, 0).
12 ▶ Find the equation of the perpendicular bisector of the line AB when A is (1, 1) and B is (5, –1).
7
10
11
6
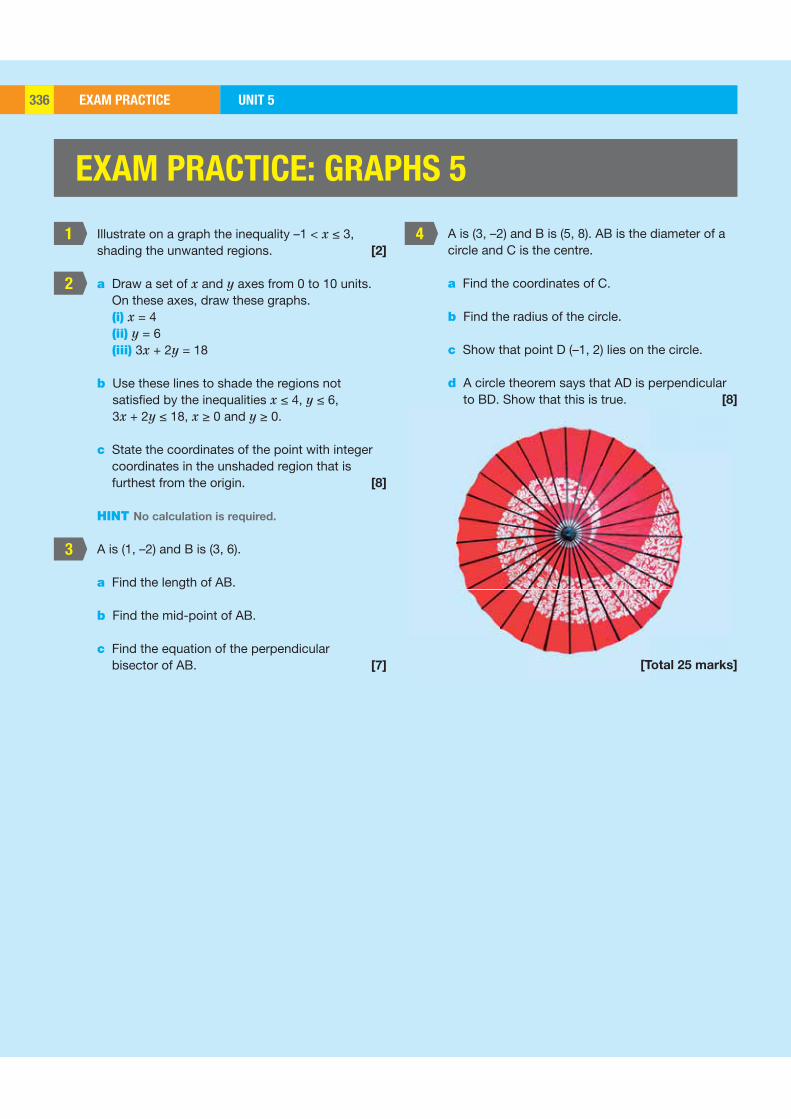
EXAM PRACTICE UNIT 5336
1
2
3
4
EXAM PRACTICE: GRAPHS 5
Illustrate on a graph the inequality –1 < x ≤ 3, shading the unwanted regions. [2]
a Draw a set of x and y axes from 0 to 10 units. On these axes, draw these graphs.(i) x = 4(ii) y = 6(iii) 3x + 2y = 18
b Use these lines to shade the regions not satisfi ed by the inequalities x ≤ 4, y ≤ 6, 3x + 2y ≤ 18, x ≥ 0 and y ≥ 0.
c State the coordinates of the point with integer coordinates in the unshaded region that is furthest from the origin. [8]
HINT No calculation is required.
A is (1, –2) and B is (3, 6).
a Find the length of AB.
b Find the mid-point of AB.
c Find the equation of the perpendicular bisector of AB. [7]
A is (3, –2) and B is (5, 8). AB is the diameter of a circle and C is the centre.
a Find the coordinates of C.
b Find the radius of the circle.
c Show that point D (–1, 2) lies on the circle.
d A circle theorem says that AD is perpendicular to BD. Show that this is true. [8]
[Total 25 marks]
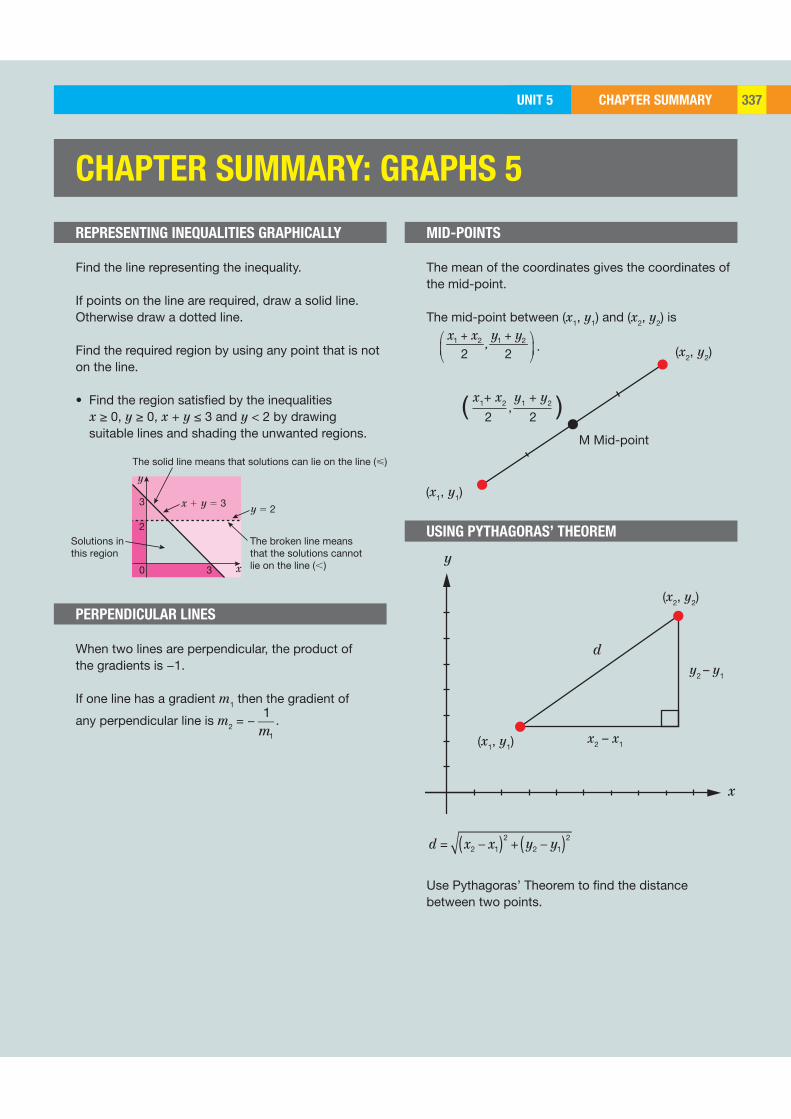
CHAPTER SUMMARYUNIT 5 337
0 3
2
3 x 1 y 5 3
y
x
The solid line means that solutions can lie on the line (ø)
The broken line meansthat the solutions cannotlie on the line (,)
Solutions inthis region
y 5 2
(x1, y1)
x1+ x2 , y1 + y2
22( )
(x2, y2)
M Mid-point
x
y
(x2, y2)
y2 – y1
x2 – x1(x1, y1)
d
CHAPTER SUMMARY: GRAPHS 5
REPRESENTING INEQUALITIES GRAPHICALLY MID-POINTS
USING PYTHAGORAS’ THEOREM
PERPENDICULAR LINES
Find the line representing the inequality.
If points on the line are required, draw a solid line. Otherwise draw a dotted line.
Find the required region by using any point that is not on the line.
• Find the region satisfied by the inequalities x ≥ 0, y ≥ 0, x + y ≤ 3 and y < 2 by drawing suitable lines and shading the unwanted regions.
The mean of the coordinates gives the coordinates of the mid-point.
The mid-point between (x1, y1) and (x2, y2) is
+ +⎛ ⎞
⎜ ⎟⎝ ⎠
1 2 1 2, 2 2
x x y y.
d = x2 x1( )2+ y2 y1( )2
Use Pythagoras’ Theorem to find the distance between two points.
When two lines are perpendicular, the product of the gradients is −1.
If one line has a gradient m1 then the gradient of
any perpendicular line is m2 = −1
m1
.

SHAPE AND SPACE 5 UNIT 5338
LEARNING OBJECTIVES
BASIC PRINCIPLES
–5 5x
y
–1
–2
–3
–4
1
0
2
4
3y = – x
x = – 3
y = – 3
y = xx = 0
x + y = 3
y = 0
x
y
–5 5
–5
0
5
A
B C
F
D
SHAPE AND SPACE 5
Islamic art and architecture has many repeating shapes and patterns that have been turned (rotated), flipped (reflected), moved (translated) and enlarged to create beautiful images.
In computer graphics, reflections, rotations, enlargements and translations (sliding movements) are all used to position and shape objects and to change viewing positions.
• Translate a shape using a vector
• Describe a translation
• Reflect a shape in a mirror line
• Describe a reflection
• Rotate a shape about a centre of rotation
• Describe a rotation
• Enlarge a shape about a centre of enlargement
• Describe an enlargement
• Carry out and describe combinations of transformations
It is important that you are able to recognise certain equations of lines on a Cartesian graph. Many of these are shown here.
There are four basic transformations that you need to understand and be able to describe: translations, reflections, rotations and enlargements.
Flag F (object) goes through the following transformations to give the images A to D.
Object Image Transformation Notes
Flag F Flag A Reflection in y-axisAll points are the same
distance from the mirror line.
Flag F Flag B
Translation by vector
64
The orientation of the image is the same after a translation.
Flag F Flag CRotation of 90°
clockwise about O+ angles are anti-clockwise
– angles are clockwise.
Flag F Flag DEnlargement of scale
factor 2 about O
If the scale factor k is defined (0 < k < 1) then the object is decreased in size.
TRANSFORMATIONS
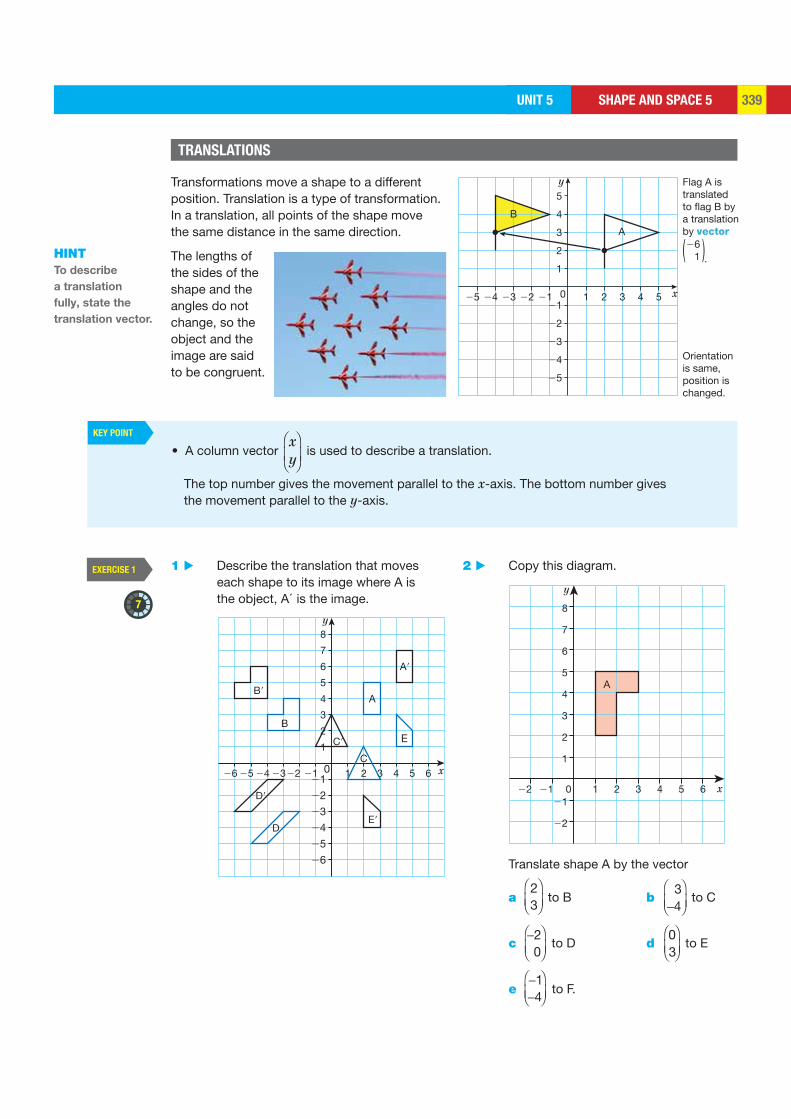
SHAPE AND SPACE 5UNIT 5 339
KEY POINT
y
x2425 22 2123 20
22
23
24
25
21
1
2
3
4B
A
5
41 3 5
Flag A is translatedto flag B by a translation by vector
Orientation is same,position is changed.
( )261 .
y
x1 2 3 4 5 6
A
2122 0
1
21
22
2
3
4
5
6
7
8y
x2122 23242526 1 2 3 4 5 6021
22
23
24
25
26
B9
A9
E9
C9
D9
D
B
C
E
A
1
2
3
4
5
6
7
8
TRANSLATIONS
Transformations move a shape to a different position. Translation is a type of transformation. In a translation, all points of the shape move the same distance in the same direction.
The lengths of the sides of the shape and the angles do not change, so the object and the image are said to be congruent.
• A column vector xy
is used to describe a translation.
The top number gives the movement parallel to the x-axis. The bottom number gives the movement parallel to the y-axis.
7
EXERCISE 1 1 ▶ Describe the translation that moves each shape to its image where A is the object, A´ is the image.
2 ▶ Copy this diagram.
Translate shape A by the vector
a 23
to B b 34
to C
c 20
to D d 03
to E
e 14
to F.
HINT To describe
a translation
fully, state the
translation vector.
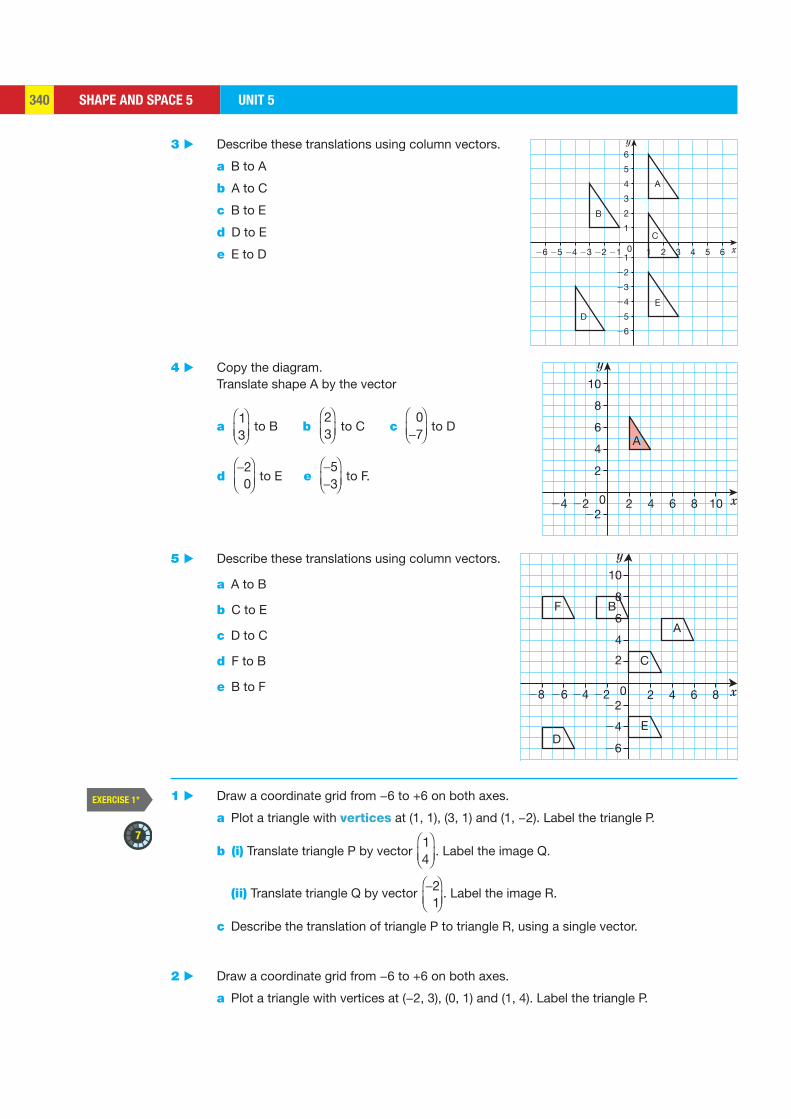
SHAPE AND SPACE 5 UNIT 5340
y
x212223242526 1 2 3 4 5 6021
22
23
24
25
26
1
2
3
4
5
6
B
C
A
E
D
y
x22224 4 6 8 100
2
22
4
6
8
10
A
y
x222242628 4 6 80
2
22
24
26
4
6
8
10
BF
C
A
ED
3 ▶ Describe these translations using column vectors.
a B to A
b A to C
c B to E
d D to E
e E to D
4 ▶ Copy the diagram. Translate shape A by the vector
a 13
to B b 23
to C c 07
to D
d
20
to E e 53
to F.
5 ▶ Describe these translations using column vectors.
a A to B
b C to E
c D to C
d F to B
e B to F
7
EXERCISE 1* 1 ▶ Draw a coordinate grid from −6 to +6 on both axes.
a Plot a triangle with vertices at (1, 1), (3, 1) and (1, −2). Label the triangle P.
b (i) Translate triangle P by vector 14
. Label the image Q.
(ii) Translate triangle Q by vector 21
. Label the image R.
c Describe the translation of triangle P to triangle R, using a single vector.
2 ▶ Draw a coordinate grid from −6 to +6 on both axes.
a Plot a triangle with vertices at (−2, 3), (0, 1) and (1, 4). Label the triangle P.

SHAPE AND SPACE 5UNIT 5 341
EXAMPLE 1
y
x121222324 2
A
B3 40
1
212223
23456
y
x121222324 2
A
B3 40
1
212223
23456
11 22 33 440
11
A
211
22334455
y
x121222324 2
A
B3 40
1
212223
23456
111 22 3021B
11
221122
2233445566
A
Trace the shape.
Rotate the tracing paper about a fixed point with your pencil. Repeat for different positions until your tracing ends up on top of the image.
b (i) Translate triangle P by vector 27
.
(ii) Translate this new triangle by vector 43
. Label the image Q.
c Describe the translation of triangle P to triangle Q, using a single vector.
3 ▶ a A shape is translated by vector 23
followed by a translation by vector 31
.
What is the resultant vector (single vector that performs the translation in one step)?
b The resultant of two vectors is 34
. The first vector is 12 . What is the second vector?
4 ▶ a A shape is translated by vector 34
followed by a translation by vector 13
. What is the resultant vector?
b What is the resultant vector for a translation of ab
followed by a translation of cd
? Explain your answer.
5 ▶ Point Q (1, 2) is the image of point P after it has been translated by vector 12
, then vector
53
. Find the coordinates of P.
Reflections and rotations are two other types of transformations.
In reflections and rotations, the lengths of the sides of the shape and the angles do not change, so the object and the image are said to be congruent.
SKILL: REASONING
Describe the rotation that takes shape A onto shape B.
Rotation anti-clockwise 90° about (1, −1)
(Always give the direction, angle and centre of rotation.)
REFLECTIONS AND ROTATIONS
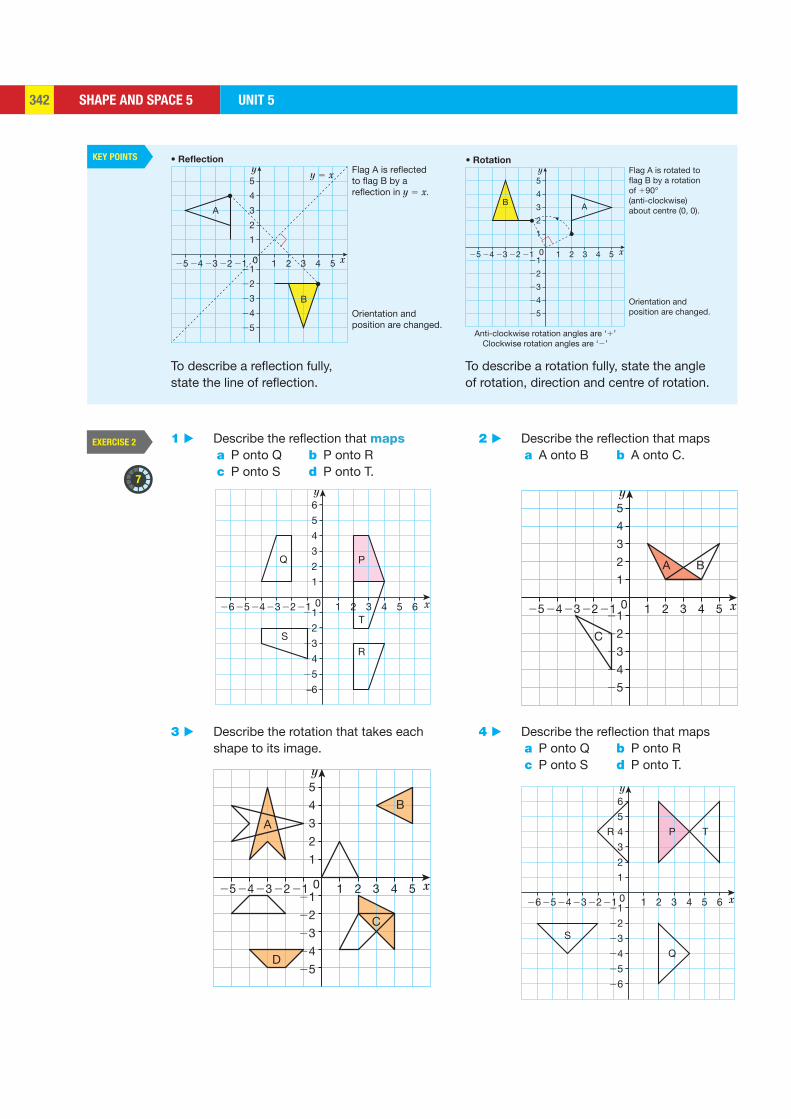
SHAPE AND SPACE 5 UNIT 5342
KEY POINTS
yy 5 x
x2425 22 2123 0
22
23
24
25
21
B
A
• Reflection
1
2
3
4
5
2 41 3 5
Flag A is reflectedto flag B by areflection in y 5 x.
Orientation andposition are changed.
Flag A is rotated toflag B by a rotationof 190°(anti-clockwise)about centre (0, 0).
Orientation andposition are changed.
Anti-clockwise rotation angles are ‘1’Clockwise rotation angles are ‘2’
y
x 2425 22 2123 0
22
23
24
25
21
B A
1
2
3
4
5
2 41 3 5
• Rotation
y
x1212223242526 2 3 4 5
P
T
R
S
Q
60
1
21
22
23
24
25
–6
2
3
4
5
6y
x12122232425 2 3
A B
C
4 50
1
21
22
23
24
25
2
3
4
5
y
x12122232425 2
B
A
D
C
3 4 50
1
21
22
23
24
25
2
3
4
5 y
x 1212223242526 2 3 4 5 6
1
PR T
21
22
23
24
25
26
2
3
4
5
6
Q
S
0
7
EXERCISE 2 1 ▶ Describe the reflection that maps a P onto Q b P onto R c P onto S d P onto T.
4 ▶ Describe the reflection that maps a P onto Q b P onto R c P onto S d P onto T.
3 ▶ Describe the rotation that takes each shape to its image.
2 ▶ Describe the reflection that maps a A onto B b A onto C.
To describe a reflection fully, state the line of reflection.
To describe a rotation fully, state the angle of rotation, direction and centre of rotation.
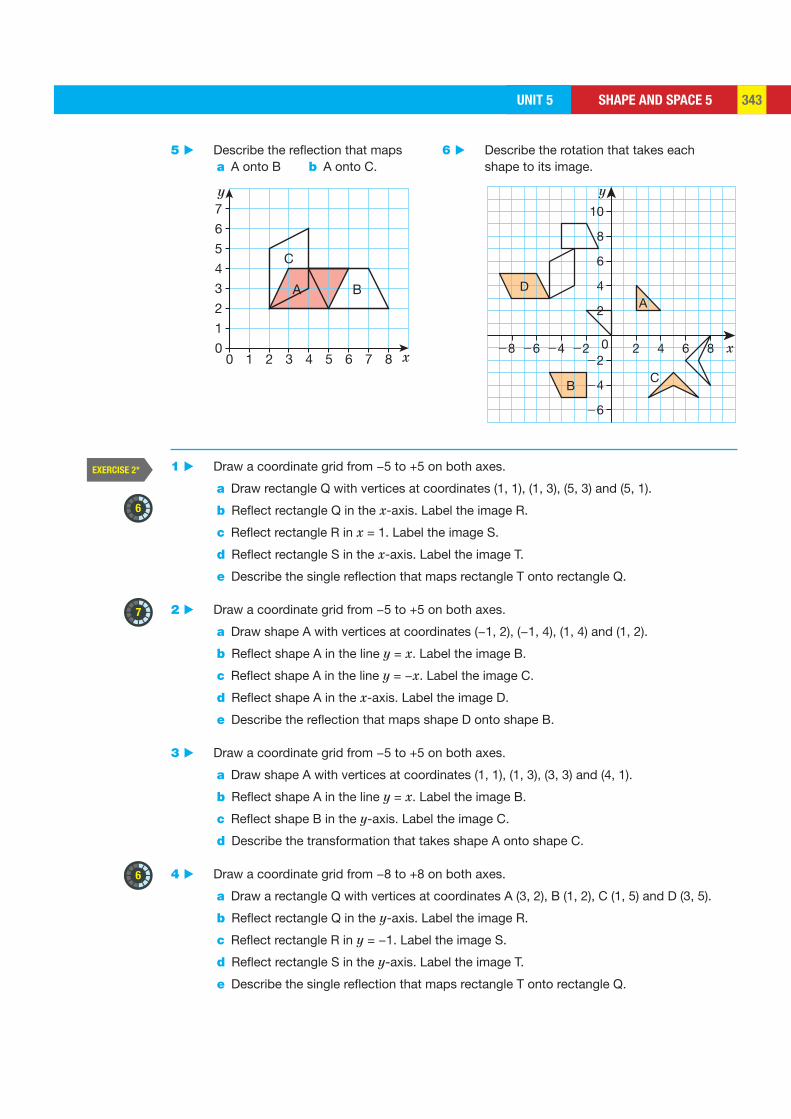
SHAPE AND SPACE 5UNIT 5 343
y
x10
1
0
2
3
4
5
6
7
2 3 4 5 6 7 8
C
BA
y
x22242628 2 4 6 8022
24
26
2
4
6
8
10
BC
AD
EXERCISE 2* 1 ▶ Draw a coordinate grid from −5 to +5 on both axes.
a Draw rectangle Q with vertices at coordinates (1, 1), (1, 3), (5, 3) and (5, 1).
b Reflect rectangle Q in the x-axis. Label the image R.
c Reflect rectangle R in x = 1. Label the image S.
d Reflect rectangle S in the x-axis. Label the image T.
e Describe the single reflection that maps rectangle T onto rectangle Q.
2 ▶ Draw a coordinate grid from −5 to +5 on both axes.
a Draw shape A with vertices at coordinates (−1, 2), (−1, 4), (1, 4) and (1, 2).
b Reflect shape A in the line y = x. Label the image B.
c Reflect shape A in the line y = −x. Label the image C.
d Reflect shape A in the x-axis. Label the image D.
e Describe the reflection that maps shape D onto shape B.
3 ▶ Draw a coordinate grid from −5 to +5 on both axes.
a Draw shape A with vertices at coordinates (1, 1), (1, 3), (3, 3) and (4, 1).
b Reflect shape A in the line y = x. Label the image B.
c Reflect shape B in the y-axis. Label the image C.
d Describe the transformation that takes shape A onto shape C.
4 ▶ Draw a coordinate grid from −8 to +8 on both axes.
a Draw a rectangle Q with vertices at coordinates A (3, 2), B (1, 2), C (1, 5) and D (3, 5).
b Reflect rectangle Q in the y-axis. Label the image R.
c Reflect rectangle R in y = −1. Label the image S.
d Reflect rectangle S in the y-axis. Label the image T.
e Describe the single reflection that maps rectangle T onto rectangle Q.
6 ▶ Describe the rotation that takes each shape to its image.
5 ▶ Describe the reflection that maps a A onto B b A onto C.
6
6
7
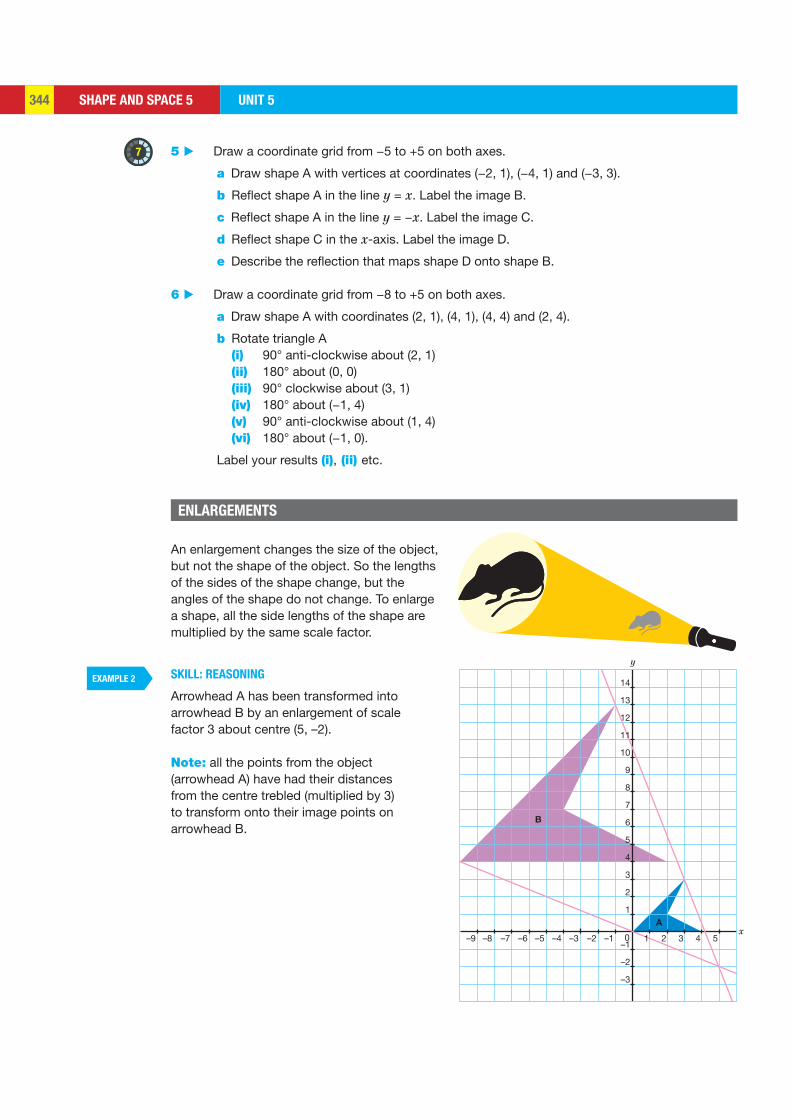
SHAPE AND SPACE 5 UNIT 5344
x
y
B
A
14
13
12
11
10
9
8
7
6
5
4
3
2
1
–1
–2
–3
–1 0–2–3–4–5–6–7–8–9 1 32 4 5
An enlargement changes the size of the object, but not the shape of the object. So the lengths of the sides of the shape change, but the angles of the shape do not change. To enlarge a shape, all the side lengths of the shape are multiplied by the same scale factor.
EXAMPLE 2 SKILL: REASONING
Arrowhead A has been transformed into arrowhead B by an enlargement of scale factor 3 about centre (5, –2).
Note: all the points from the object (arrowhead A) have had their distances from the centre trebled (multiplied by 3) to transform onto their image points on arrowhead B.
5 ▶ Draw a coordinate grid from −5 to +5 on both axes.
a Draw shape A with vertices at coordinates (−2, 1), (−4, 1) and (−3, 3).
b Reflect shape A in the line y = x. Label the image B.
c Reflect shape A in the line y = −x. Label the image C.
d Reflect shape C in the x-axis. Label the image D.
e Describe the reflection that maps shape D onto shape B.
6 ▶ Draw a coordinate grid from −8 to +5 on both axes.
a Draw shape A with coordinates (2, 1), (4, 1), (4, 4) and (2, 4).
b Rotate triangle A (i) 90° anti-clockwise about (2, 1) (ii) 180° about (0, 0) (iii) 90° clockwise about (3, 1) (iv) 180° about (−1, 4) (v) 90° anti-clockwise about (1, 4) (vi) 180° about (−1, 0).
Label your results (i), (ii) etc.
7
ENLARGEMENTS
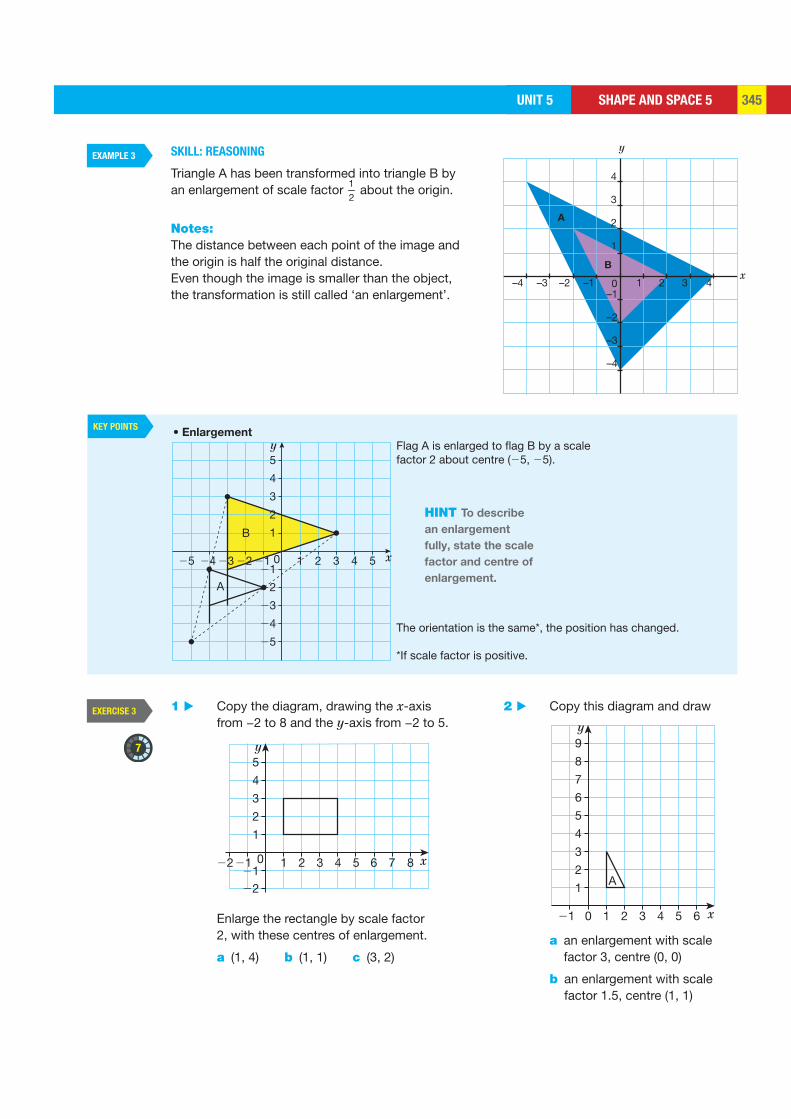
SHAPE AND SPACE 5UNIT 5 345
KEY POINTS
4
3
2
1
–1
–2
–3
–4
x
y
–1 0–2–3 –4 1 32 4
A
B
Flag A is enlarged to flag B by a scale factor 2 about centre (25, 25).
The orientation is the same*, the position has changed.
*If scale factor is positive.
y
x2425 22 2123 0
22
23
24
25
21
B
A
1
2
3
4
5
2 41 3 5
• Enlargement
y
x12122 0
1
2122
2
3
4
5
2 3 4 5 6 7 8
y
x21
1
2
3
4
5
6
7
8
9
0 1 2
A
3 4 5 6
EXAMPLE 3 SKILL: REASONING
Triangle A has been transformed into triangle B by an enlargement of scale factor 1
2 about the origin.
Notes: The distance between each point of the image and the origin is half the original distance.Even though the image is smaller than the object, the transformation is still called ‘an enlargement’.
7
EXERCISE 3 1 ▶ Copy the diagram, drawing the x-axis from −2 to 8 and the y-axis from −2 to 5.
Enlarge the rectangle by scale factor 2, with these centres of enlargement.
a (1, 4) b (1, 1) c (3, 2)
2 ▶ Copy this diagram and draw
a an enlargement with scale factor 3, centre (0, 0)
b an enlargement with scale factor 1.5, centre (1, 1)
HINT To describe
an enlargement
fully, state the scale
factor and centre of
enlargement.
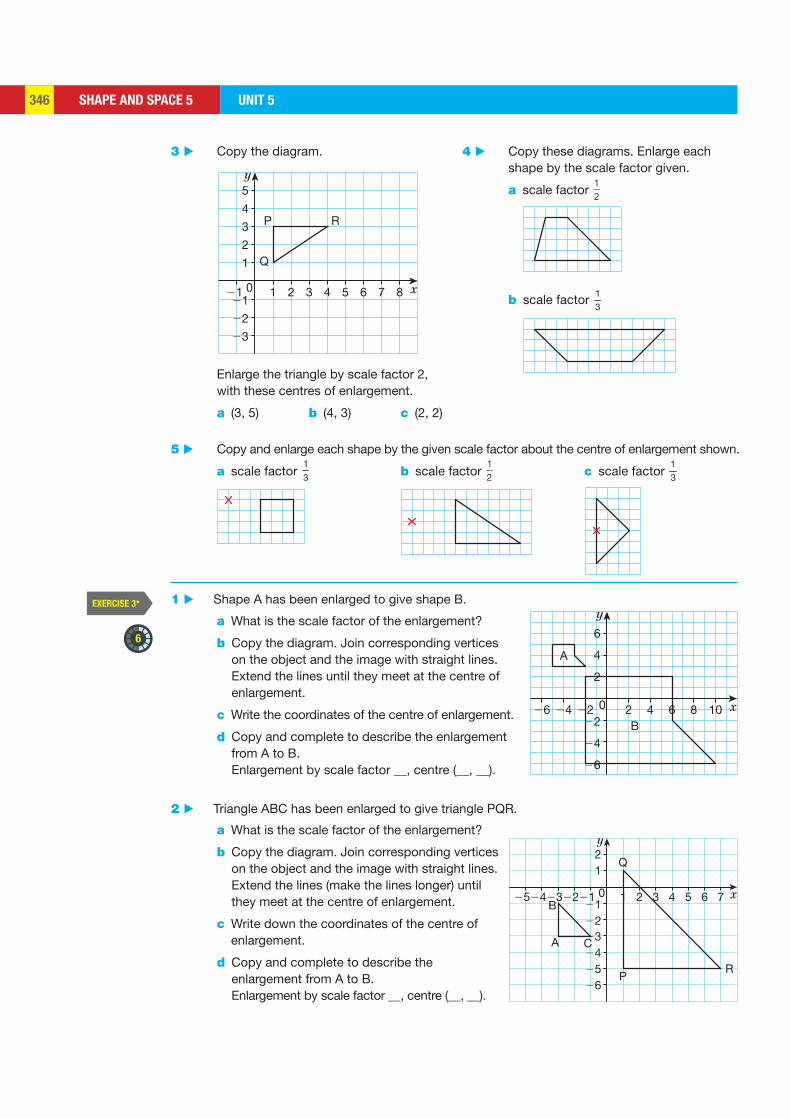
SHAPE AND SPACE 5 UNIT 5346
y
x121 2
P R
Q
3 4 5 6 7 80
1
23
22
21
2
3
4
5
y
x2222426 4 6 8 10
2
22
24
26
4
6
B
A
0
y
x12122232425 2
Q
B
A C
PR
3 4 5 6 70
1
212223242526
2
3 ▶ Copy the diagram.
5 ▶ Copy and enlarge each shape by the given scale factor about the centre of enlargement shown.
a scale factor 13 b scale factor
12 c scale factor
13
4 ▶ Copy these diagrams. Enlarge each shape by the scale factor given.
a scale factor 12
Enlarge the triangle by scale factor 2, with these centres of enlargement.
a (3, 5) b (4, 3) c (2, 2)
b scale factor 13
EXERCISE 3* 1 ▶ Shape A has been enlarged to give shape B.
a What is the scale factor of the enlargement?
b Copy the diagram. Join corresponding vertices on the object and the image with straight lines. Extend the lines until they meet at the centre of enlargement.
c Write the coordinates of the centre of enlargement.
d Copy and complete to describe the enlargement from A to B. Enlargement by scale factor __, centre (__, __).
2 ▶ Triangle ABC has been enlarged to give triangle PQR.
a What is the scale factor of the enlargement?
b Copy the diagram. Join corresponding vertices on the object and the image with straight lines. Extend the lines (make the lines longer) until they meet at the centre of enlargement.
c Write down the coordinates of the centre of enlargement.
d Copy and complete to describe the enlargement from A to B. Enlargement by scale factor __, centre (__, __).
6
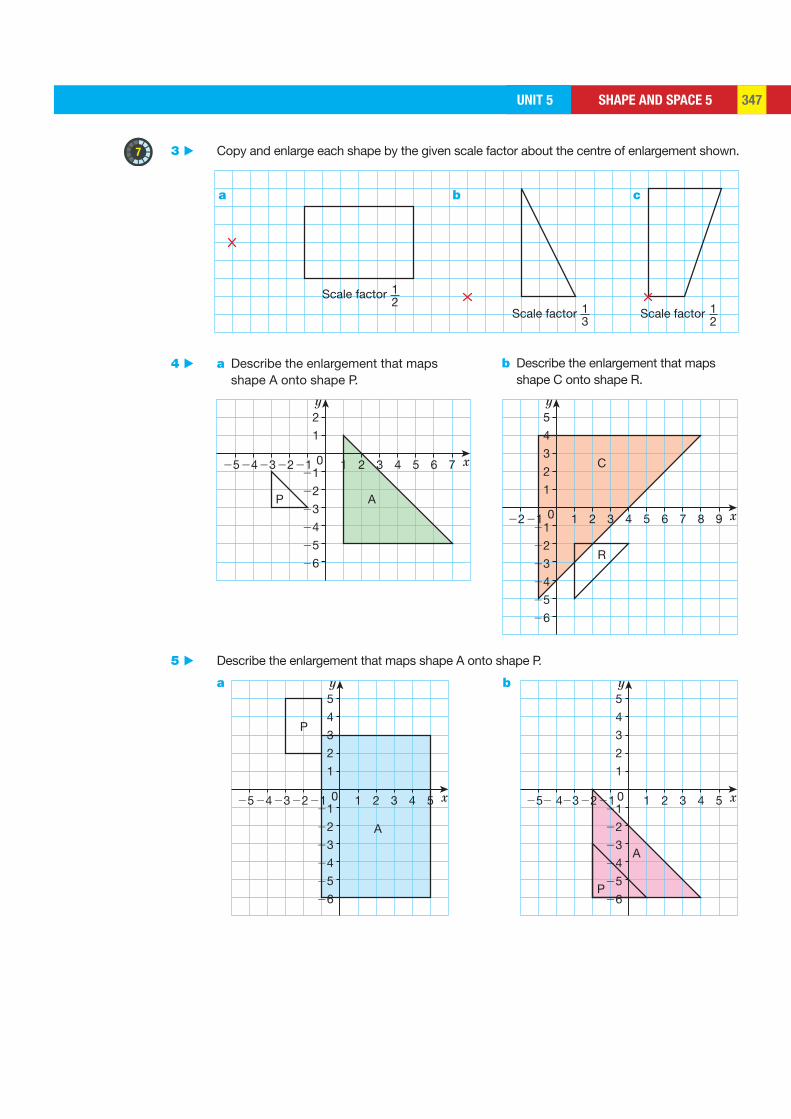
SHAPE AND SPACE 5UNIT 5 347
Scale factor 12
Scale factor 13
Scale factor 12
y
x12122232425 2 3 4 5
AP
6 70
1
21
22
23
24
25
26
2y
x12122 2 3 4 5
R
C
6 7 8 90
1
21
22
23
24
25
26
2
3
4
5
y
x12122232425 2 3 4 5
1
21
22
23
24
25
26
2
3
4
5
P
A
0
y
x12122232 425 2 3 4 5
1
21
22
23
24
25
26
2
3
4
5
A
P
0
5 ▶ Describe the enlargement that maps shape A onto shape P.
a b
3 ▶ Copy and enlarge each shape by the given scale factor about the centre of enlargement shown.
4 ▶ a Describe the enlargement that maps shape A onto shape P.
b Describe the enlargement that maps shape C onto shape R.
a b c
7
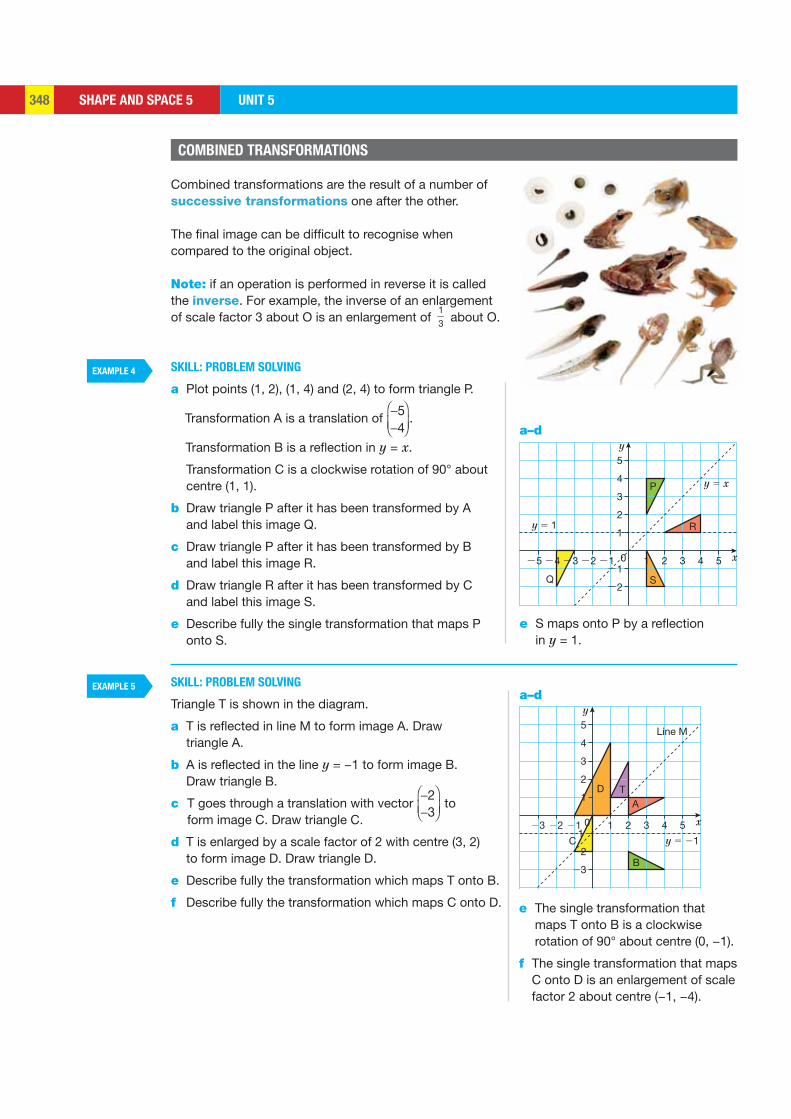
SHAPE AND SPACE 5 UNIT 5348
y
y 5 1
x2425 22 2123 2
S
P
0
Q
R
22
21
1
2
3
4
5
41 3 5
y 5 x
y
y 5 21
x22 2123 20
22
23
21
1
2
3
4
5
4
TD
A
B
1 3 5
Line M
C
Combined transformations are the result of a number of successive transformations one after the other.
The final image can be difficult to recognise when compared to the original object.
Note: if an operation is performed in reverse it is called the inverse. For example, the inverse of an enlargement of scale factor 3 about O is an enlargement of
13 about O.
EXAMPLE 4
EXAMPLE 5
SKILL: PROBLEM SOLVING
a Plot points (1, 2), (1, 4) and (2, 4) to form triangle P.
Transformation A is a translation of 54
.
Transformation B is a reflection in y = x.
Transformation C is a clockwise rotation of 90° about centre (1, 1).
b Draw triangle P after it has been transformed by A and label this image Q.
c Draw triangle P after it has been transformed by B and label this image R.
d Draw triangle R after it has been transformed by C and label this image S.
e Describe fully the single transformation that maps P onto S.
SKILL: PROBLEM SOLVING
Triangle T is shown in the diagram.
a T is reflected in line M to form image A. Draw triangle A.
b A is reflected in the line y = −1 to form image B. Draw triangle B.
c T goes through a translation with vector 23
to form image C. Draw triangle C.
d T is enlarged by a scale factor of 2 with centre (3, 2) to form image D. Draw triangle D.
e Describe fully the transformation which maps T onto B.
f Describe fully the transformation which maps C onto D.
e S maps onto P by a reflection in y = 1.
a–d
a–d
e The single transformation that maps T onto B is a clockwise rotation of 90° about centre (0, −1).
f The single transformation that maps C onto D is an enlargement of scale factor 2 about centre (−1, −4).
COMBINED TRANSFORMATIONS
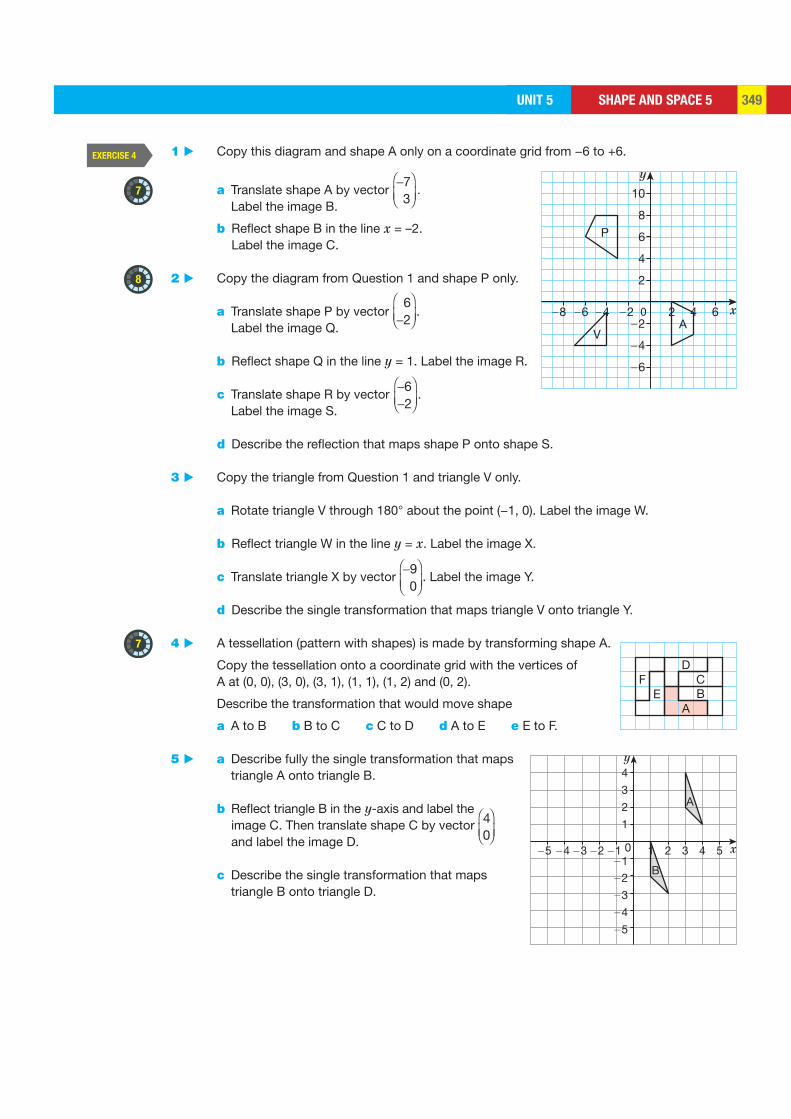
SHAPE AND SPACE 5UNIT 5 349
y
x22 2242628 4 60
2
22
24
26
4
6
8
10
P
VA
EA
D
BCF
y
x12122232425 2 3 4 50
1
2122
23
24
25
2
3
4
A
B
EXERCISE 4 1 ▶ Copy this diagram and shape A only on a coordinate grid from −6 to +6.
a Translate shape A by vector 73
. Label the image B.
b Reflect shape B in the line x = –2. Label the image C.
2 ▶ Copy the diagram from Question 1 and shape P only.
a Translate shape P by vector 62
. Label the image Q.
b Reflect shape Q in the line y = 1. Label the image R.
c Translate shape R by vector 62
. Label the image S.
d Describe the reflection that maps shape P onto shape S.
3 ▶ Copy the triangle from Question 1 and triangle V only.
a Rotate triangle V through 180° about the point (−1, 0). Label the image W.
b Reflect triangle W in the line y = x. Label the image X.
c Translate triangle X by vector 90
. Label the image Y.
d Describe the single transformation that maps triangle V onto triangle Y.
4 ▶ A tessellation (pattern with shapes) is made by transforming shape A.
Copy the tessellation onto a coordinate grid with the vertices of A at (0, 0), (3, 0), (3, 1), (1, 1), (1, 2) and (0, 2).
Describe the transformation that would move shape
a A to B b B to C c C to D d A to E e E to F.
5 ▶ a Describe fully the single transformation that maps triangle A onto triangle B.
b Reflect triangle B in the y-axis and label the image C. Then translate shape C by vector 4
0
and label the image D.
c Describe the single transformation that maps triangle B onto triangle D.
7
7
8
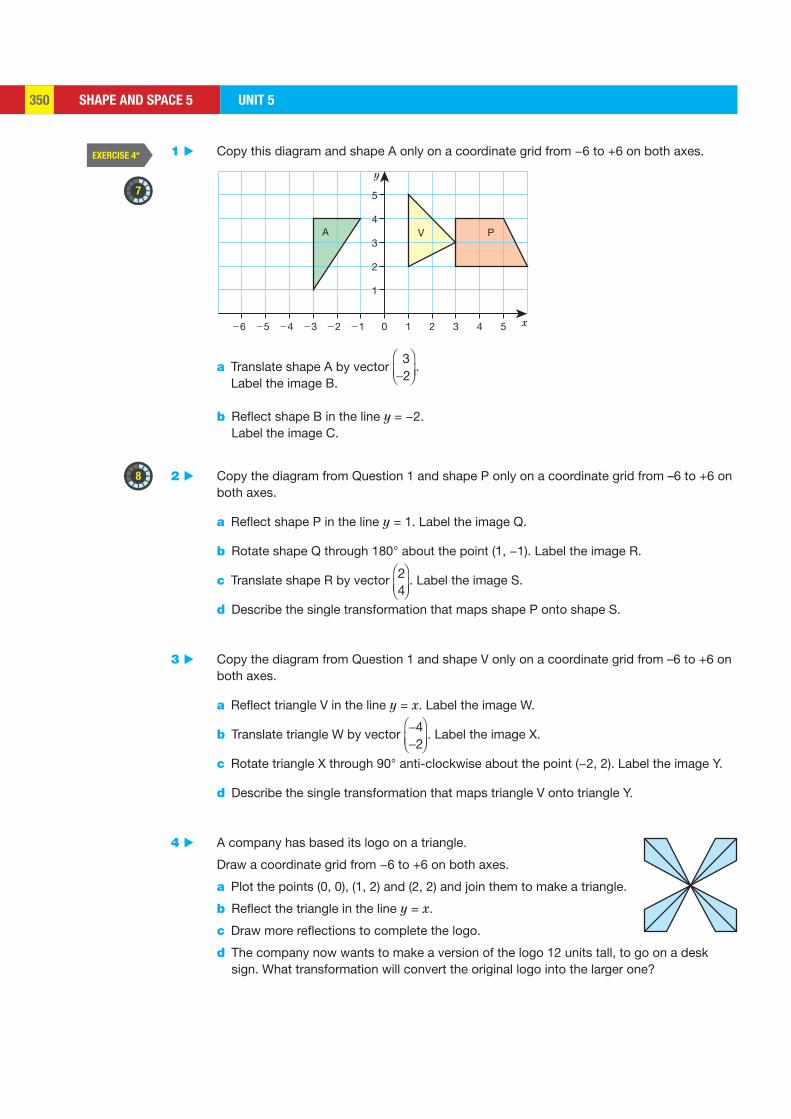
SHAPE AND SPACE 5 UNIT 5350
y
x10212223242526 2 3 4 5
1
2
3
4
5
A V P
EXERCISE 4* 1 ▶ Copy this diagram and shape A only on a coordinate grid from −6 to +6 on both axes.
a Translate shape A by vector 32
. Label the image B.
b Reflect shape B in the line y = −2. Label the image C.
2 ▶ Copy the diagram from Question 1 and shape P only on a coordinate grid from –6 to +6 on both axes.
a Reflect shape P in the line y = 1. Label the image Q.
b Rotate shape Q through 180° about the point (1, −1). Label the image R.
c Translate shape R by vector 24
. Label the image S.
d Describe the single transformation that maps shape P onto shape S.
3 ▶ Copy the diagram from Question 1 and shape V only on a coordinate grid from –6 to +6 on both axes.
a Reflect triangle V in the line y = x. Label the image W.
b Translate triangle W by vector 42
. Label the image X.
c Rotate triangle X through 90° anti-clockwise about the point (−2, 2). Label the image Y.
d Describe the single transformation that maps triangle V onto triangle Y.
4 ▶ A company has based its logo on a triangle.
Draw a coordinate grid from −6 to +6 on both axes.
a Plot the points (0, 0), (1, 2) and (2, 2) and join them to make a triangle.
b Reflect the triangle in the line y = x.
c Draw more reflections to complete the logo.
d The company now wants to make a version of the logo 12 units tall, to go on a desk sign. What transformation will convert the original logo into the larger one?
7
8
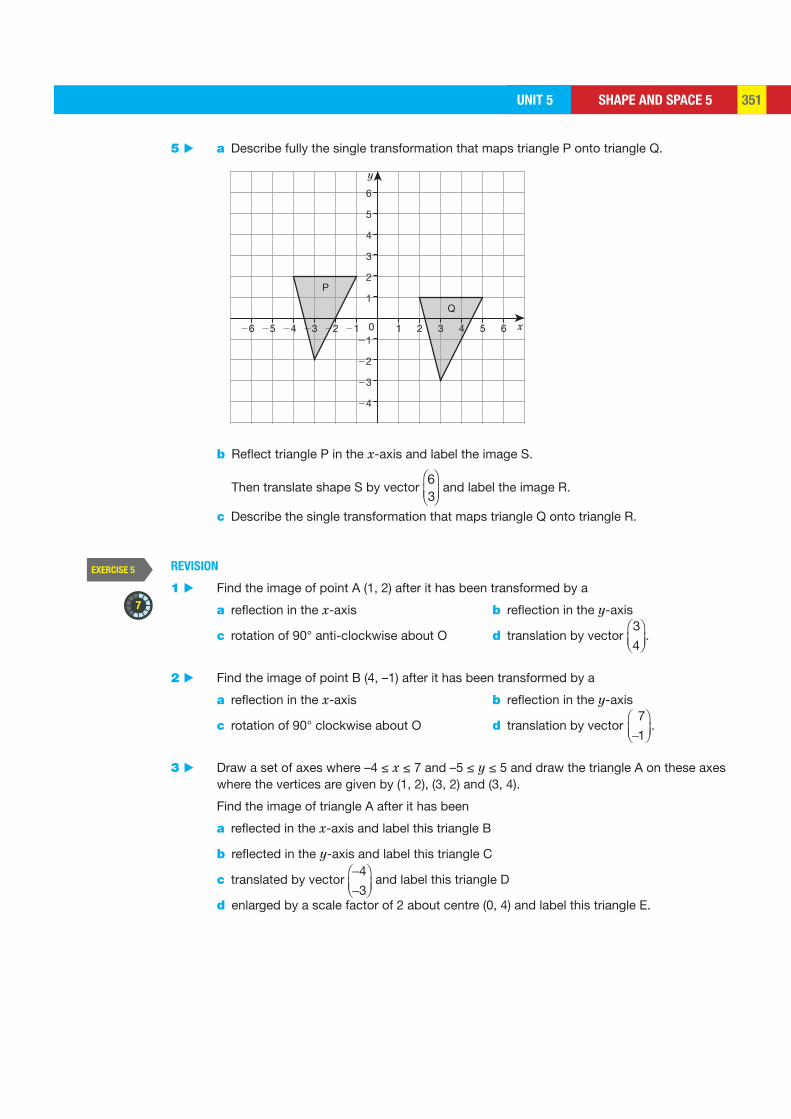
SHAPE AND SPACE 5UNIT 5 351
y
x212223242526
Q
1 2 3 4 5 6021
22
23
24
1
2
3
4
5
6
P
EXERCISE 5 REVISION
1 ▶ Find the image of point A (1, 2) after it has been transformed by a
a reflection in the x-axis b reflection in the y-axis
c rotation of 90° anti-clockwise about O d translation by vector 3
4.
2 ▶ Find the image of point B (4, –1) after it has been transformed by a
a reflection in the x-axis b reflection in the y-axis
c rotation of 90° clockwise about O d translation by vector 7
1.
3 ▶ Draw a set of axes where –4 ≤ x ≤ 7 and –5 ≤ y ≤ 5 and draw the triangle A on these axes where the vertices are given by (1, 2), (3, 2) and (3, 4).
Find the image of triangle A after it has been
a reflected in the x-axis and label this triangle B
b reflected in the y-axis and label this triangle C
c translated by vector 4
3 and label this triangle D
d enlarged by a scale factor of 2 about centre (0, 4) and label this triangle E.
7
5 ▶ a Describe fully the single transformation that maps triangle P onto triangle Q.
b Reflect triangle P in the x-axis and label the image S. Then translate shape S by vector
63
and label the image R.
c Describe the single transformation that maps triangle Q onto triangle R.
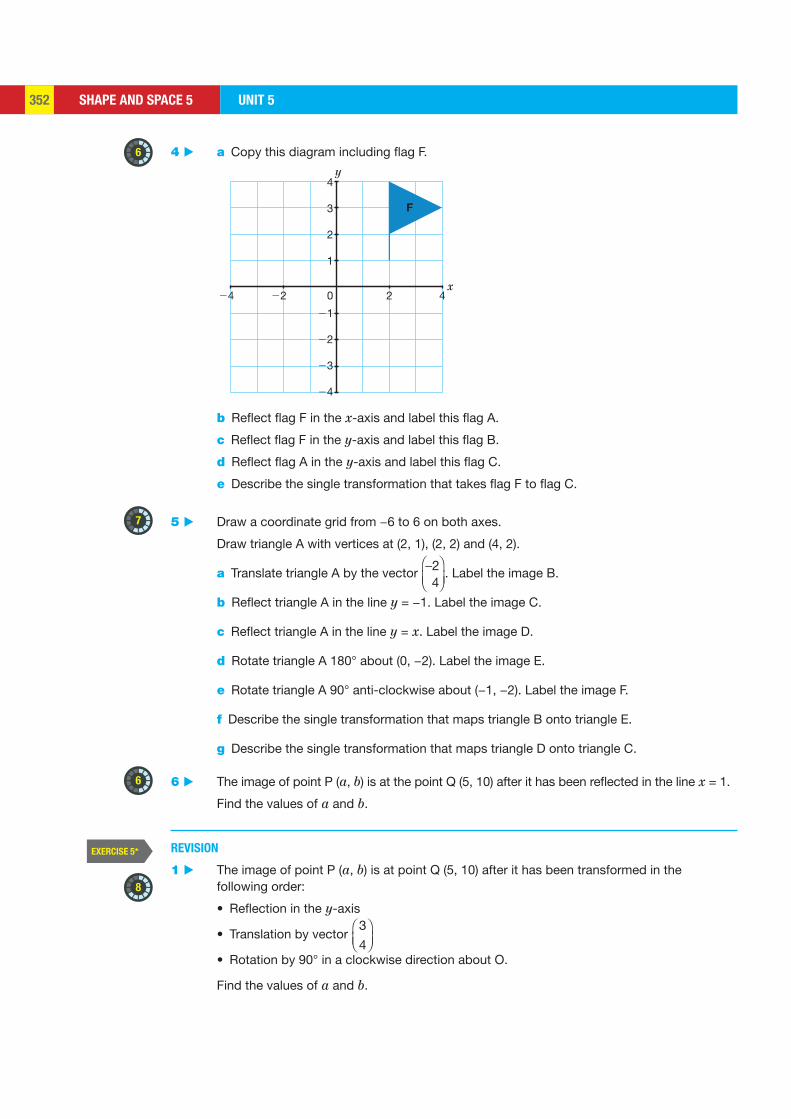
SHAPE AND SPACE 5 UNIT 5352
y
x
4
3
2
1
21
22
23
24
20 424 22
F
8
EXERCISE 5* REVISION
1 ▶ The image of point P (a, b) is at point Q (5, 10) after it has been transformed in the following order:
• Reflection in the y-axis
• Translation by vector 3
4 • Rotation by 90° in a clockwise direction about O.
Find the values of a and b.
4 ▶ a Copy this diagram including flag F.
b Reflect flag F in the x-axis and label this flag A.
c Reflect flag F in the y-axis and label this flag B.
d Reflect flag A in the y-axis and label this flag C.
e Describe the single transformation that takes flag F to flag C.
5 ▶ Draw a coordinate grid from −6 to 6 on both axes.
Draw triangle A with vertices at (2, 1), (2, 2) and (4, 2).
a Translate triangle A by the vector 24
. Label the image B.
b Reflect triangle A in the line y = −1. Label the image C.
c Reflect triangle A in the line y = x. Label the image D.
d Rotate triangle A 180° about (0, −2). Label the image E.
e Rotate triangle A 90° anti-clockwise about (−1, −2). Label the image F.
f Describe the single transformation that maps triangle B onto triangle E.
g Describe the single transformation that maps triangle D onto triangle C.
6 ▶ The image of point P (a, b) is at the point Q (5, 10) after it has been reflected in the line x = 1.
Find the values of a and b.
6
7
6

SHAPE AND SPACE 5UNIT 5 353
x
y
5
4
3
2
1
21
22
23
20 4 626 24 22
A
2 ▶ The triangle A has vertices at (0, 4), (4, 0) and (4, 4) after it has been transformed from triangle B in the following order:
• Reflection in the line y = x.
• Enlargement by scale factor of 2 about O.
• Rotation of 180° about O.
Find the coordinates of triangle B.
3 ▶ a Copy this diagram including triangle A.
Triangle A goes through transformations in the following order:
• Reflection in y = –x to produce image triangle B
• A 180° rotation about (0, 2) to produce image triangle C.
b Triangle D is the image of triangle C after a rotation of 180° about (3, 1). Draw triangles B, C and D on the same axes.
c Describe the single transformation that maps triangle D onto triangle B.
4 ▶ Draw a coordinate grid from −6 to 6 on both axes.
Draw trapezium P with vertices at (−4, −1), (−6, −1), (−6, −4) and (−4, −2).
a Reflect shape P in the line y = x. Label the image Q.
b Rotate shape Q 90° anti-clockwise about (0, −1). Label the image R.
c Translate shape R by the vector 46
. Label the image S.
d Rotate shape S 90° anti-clockwise about (1, 6). Label the image T.
e Reflect shape T in the line y = x. Label the image U.
f Describe the single transformation that maps shape U onto shape P.
g Describe the single transformation that maps shape S onto shape Q.
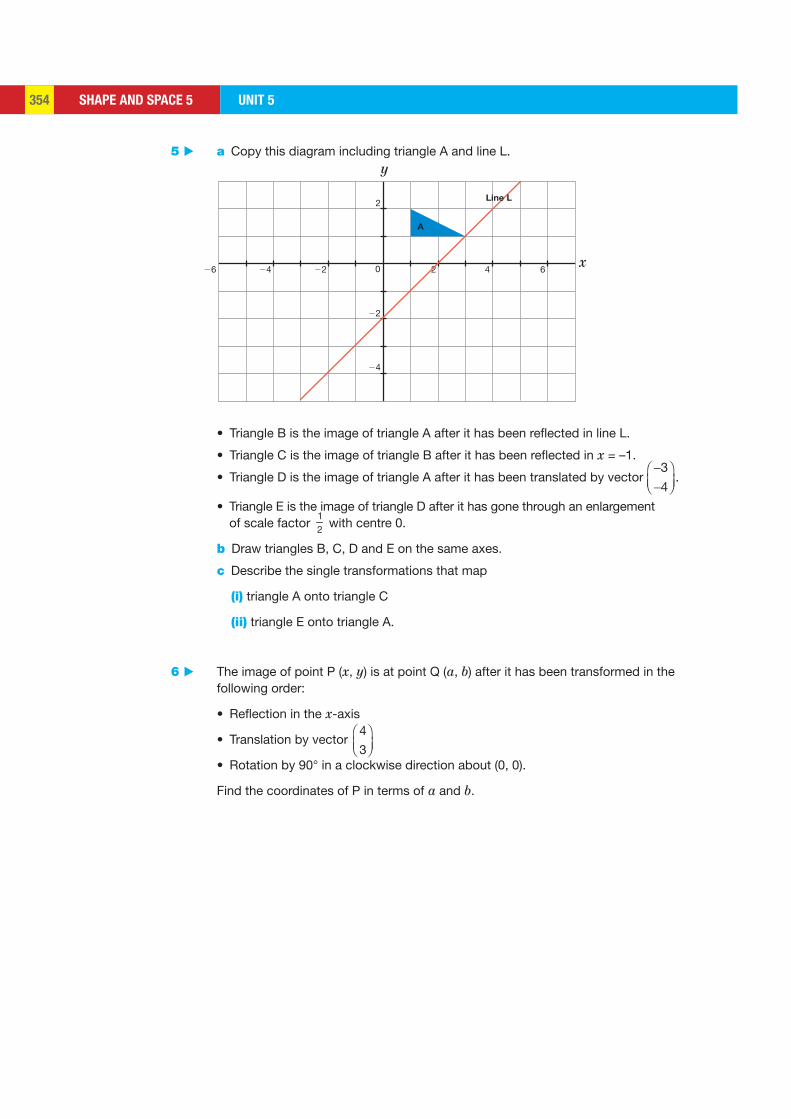
SHAPE AND SPACE 5 UNIT 5354
2
22
24
22 02426 2 4 6x
y
A
Line L
5 ▶ a Copy this diagram including triangle A and line L.
• Triangle B is the image of triangle A after it has been reflected in line L.
• Triangle C is the image of triangle B after it has been reflected in x = –1.
• Triangle D is the image of triangle A after it has been translated by vector 3
4.
• Triangle E is the image of triangle D after it has gone through an enlargement of scale factor
12 with centre 0.
b Draw triangles B, C, D and E on the same axes.
c Describe the single transformations that map
(i) triangle A onto triangle C
(ii) triangle E onto triangle A.
6 ▶ The image of point P (x, y) is at point Q (a, b) after it has been transformed in the following order:
• Reflection in the x-axis
• Translation by vector 4
3 • Rotation by 90° in a clockwise direction about (0, 0).
Find the coordinates of P in terms of a and b.
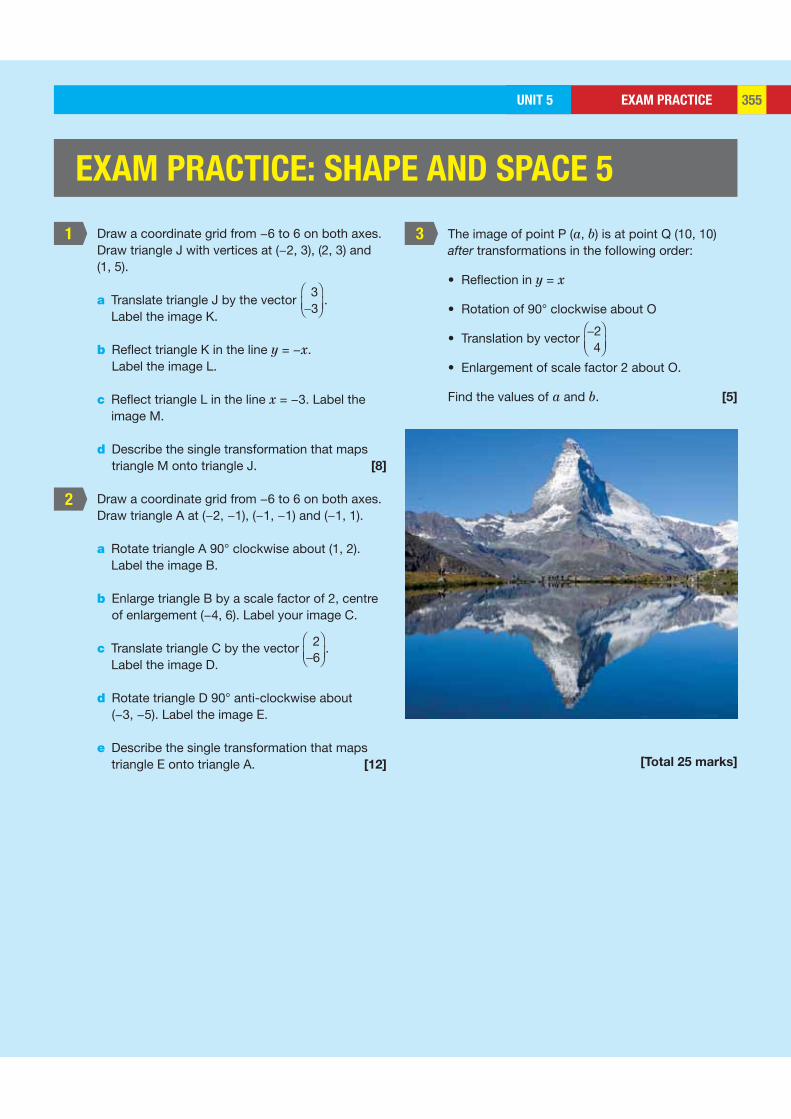
EXAM PRACTICEUNIT 5 355
1
2
3
EXAM PRACTICE: SHAPE AND SPACE 5
Draw a coordinate grid from −6 to 6 on both axes.Draw triangle J with vertices at (−2, 3), (2, 3) and (1, 5).
a Translate triangle J by the vector 33
. Label the image K.
b Reflect triangle K in the line y = −x. Label the image L.
c Reflect triangle L in the line x = −3. Label the image M.
d Describe the single transformation that maps triangle M onto triangle J. [8]
Draw a coordinate grid from −6 to 6 on both axes. Draw triangle A at (−2, −1), (−1, −1) and (−1, 1).
a Rotate triangle A 90° clockwise about (1, 2). Label the image B.
b Enlarge triangle B by a scale factor of 2, centre of enlargement (−4, 6). Label your image C.
c Translate triangle C by the vector 26
. Label the image D.
d Rotate triangle D 90° anti-clockwise about (−3, −5). Label the image E.
e Describe the single transformation that maps triangle E onto triangle A. [12]
The image of point P (a, b) is at point Q (10, 10) after transformations in the following order:
• Reflection in y = x
• Rotation of 90° clockwise about O
• Translation by vector 24
• Enlargement of scale factor 2 about O.
Find the values of a and b. [5]
[Total 25 marks]
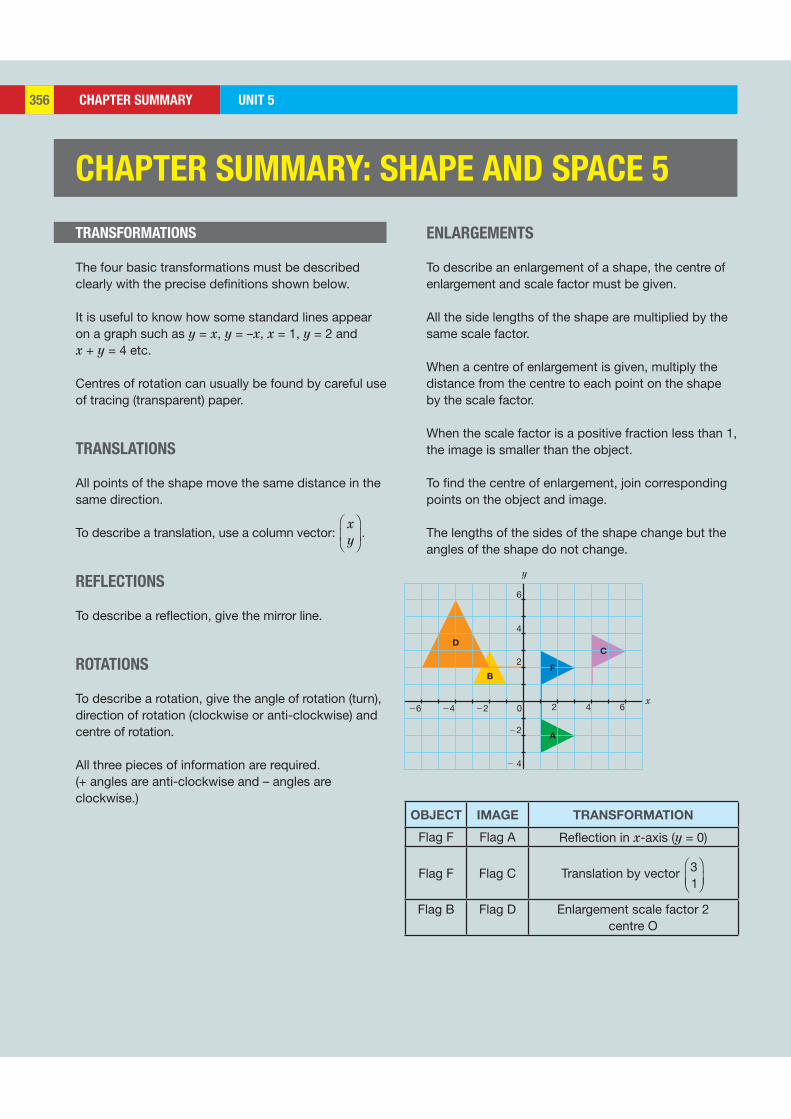
CHAPTER SUMMARY UNIT 5356
x
y
22 4 6 2 02426
2
22
2 4
4
6
A
B
C
F
D
CHAPTER SUMMARY: SHAPE AND SPACE 5
TRANSFORMATIONS ENLARGEMENTS
To describe an enlargement of a shape, the centre of enlargement and scale factor must be given.
All the side lengths of the shape are multiplied by the same scale factor.
When a centre of enlargement is given, multiply the distance from the centre to each point on the shape by the scale factor.
When the scale factor is a positive fraction less than 1, the image is smaller than the object.
To find the centre of enlargement, join corresponding points on the object and image.
The lengths of the sides of the shape change but the angles of the shape do not change.
OBJECT IMAGE TRANSFORMATION
Flag F Flag A Reflection in x-axis (y = 0)
Flag F Flag C Translation by vector 31
Flag B Flag D Enlargement scale factor 2 centre O
The four basic transformations must be described clearly with the precise definitions shown below.
It is useful to know how some standard lines appear on a graph such as y = x, y = –x, x = 1, y = 2 and x + y = 4 etc.
Centres of rotation can usually be found by careful use of tracing (transparent) paper.
TRANSLATIONS
All points of the shape move the same distance in the same direction.
To describe a translation, use a column vector: xy .
REFLECTIONS
To describe a reflection, give the mirror line.
ROTATIONS
To describe a rotation, give the angle of rotation (turn), direction of rotation (clockwise or anti-clockwise) and centre of rotation.
All three pieces of information are required.(+ angles are anti-clockwise and – angles are clockwise.)
HANDLING DATA 4UNIT 5 357
LEARNING OBJECTIVES
BASIC PRINCIPLES
KEY POINTS
HANDLING DATA 4
To be able to analyse random events and how likely they are to occur, mathematicians have used probability theory since the 16th century. One of the earliest known works on probability, ‘On Casting the Die’, was written in the 16th century by an Italian mathematician, Cardano.
• Use a sample space diagram to record all possible outcomes
• Find the probability of mutually exclusive outcomes and events
• Find the probability of an event not happening
• Estimate probabilities from experimental data
• Find the expected number of outcomes
Consider these statements. They all involve a degree of uncertainty, which could be estimated through experiment or using previous knowledge.
• I doubt I will ever win the lottery.
• My dog will probably not live more than 5 years.
• It is unlikely to snow in the Sahara Desert.
• Roses will probably never grow at the South Pole.
Girolamo Cardano (1501–1576) ▶
EXPERIMENTAL PROBABILITY
PROBABILITY – SINGLE EVENTS
It is possible to find the experimental probability, p(A), of A occurring through an experiment. The experiment should include a number of trials to see how often event A happens.
• p(A) means the probability of event A happening.
• p( )A means the probability of event A not happening.
• =number of times occurs
p( )total number of trials
AA
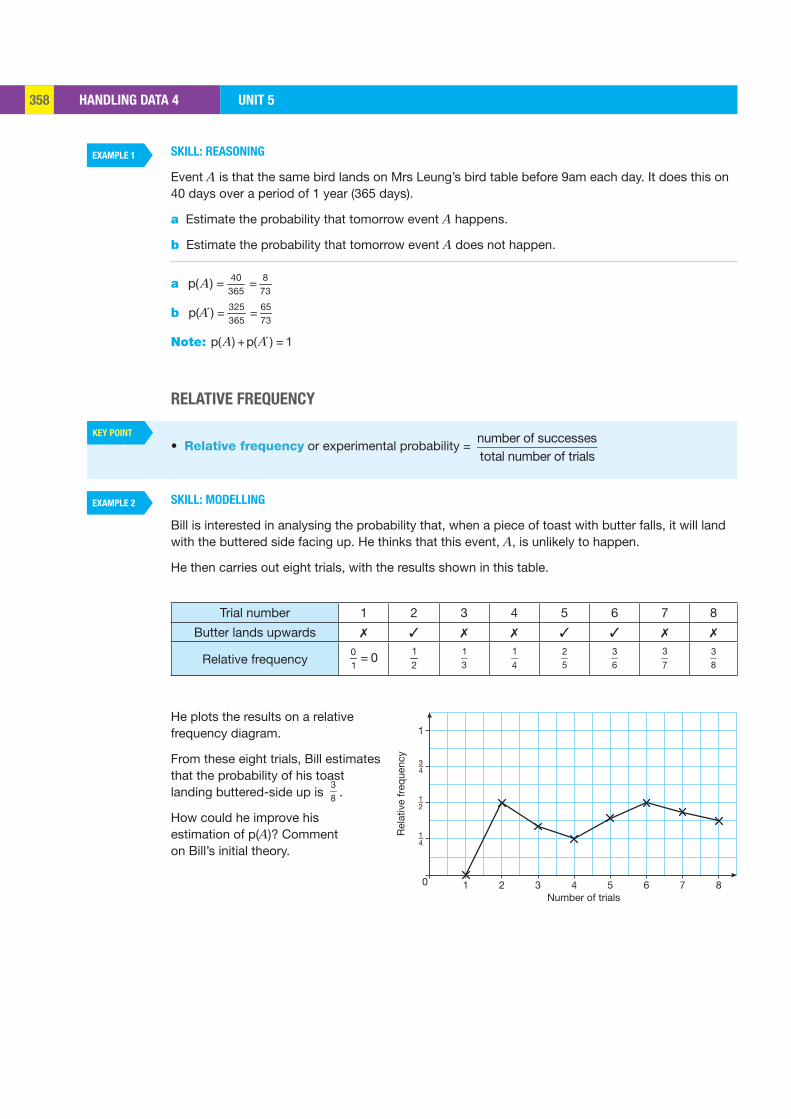
HANDLING DATA 4 UNIT 5358
EXAMPLE 1
EXAMPLE 2
KEY POINT
10
Rel
ativ
e fr
eque
ncy
1
2 3 4 5Number of trials
6 7 8
34
12
14
SKILL: REASONING
Event A is that the same bird lands on Mrs Leung’s bird table before 9am each day. It does this on 40 days over a period of 1 year (365 days).
a Estimate the probability that tomorrow event A happens.
b Estimate the probability that tomorrow event A does not happen.
a = =40 8365 73
p( )A
b = =325 65365 73
p( )A
Note: Ap( ) p( ) 1+ =A
RELATIVE FREQUENCY
• Relative frequency or experimental probability = number of successestotal number of trials
SKILL: MODELLING
Bill is interested in analysing the probability that, when a piece of toast with butter falls, it will land with the buttered side facing up. He thinks that this event, A, is unlikely to happen.
He then carries out eight trials, with the results shown in this table.
Trial number 1 2 3 4 5 6 7 8
Butter lands upwards ✗ ✓ ✗ ✗ ✓ ✓ ✗ ✗
Relative frequency =01
0 12
13
14
25
36
37
38
He plots the results on a relative frequency diagram.
From these eight trials, Bill estimates that the probability of his toast landing buttered-side up is
38 .
How could he improve his estimation of p(A)? Comment on Bill’s initial theory.
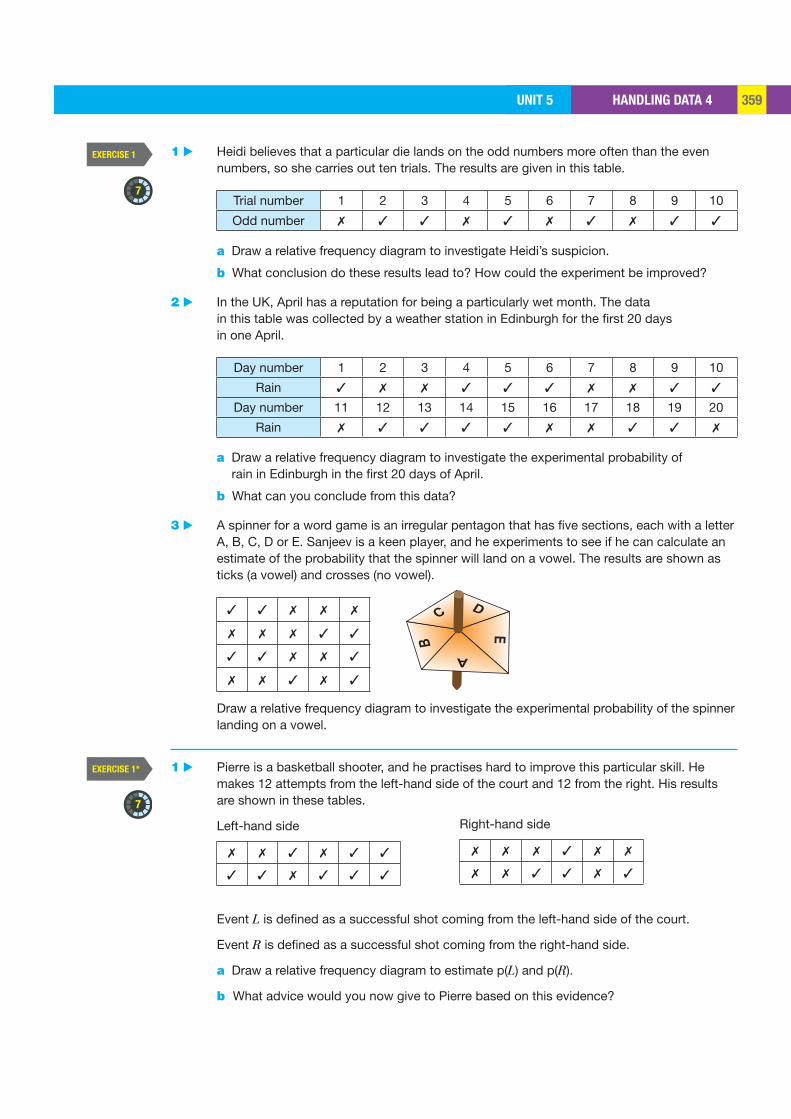
HANDLING DATA 4UNIT 5 359
EXERCISE 1
EXERCISE 1*
7
7
1 ▶ Heidi believes that a particular die lands on the odd numbers more often than the even numbers, so she carries out ten trials. The results are given in this table.
Trial number 1 2 3 4 5 6 7 8 9 10
Odd number ✗ ✓ ✓ ✗ ✓ ✗ ✓ ✗ ✓ ✓
a Draw a relative frequency diagram to investigate Heidi’s suspicion.
b What conclusion do these results lead to? How could the experiment be improved?
2 ▶ In the UK, April has a reputation for being a particularly wet month. The data in this table was collected by a weather station in Edinburgh for the first 20 days in one April.
Day number 1 2 3 4 5 6 7 8 9 10
Rain ✓ ✗ ✗ ✓ ✓ ✓ ✗ ✗ ✓ ✓
Day number 11 12 13 14 15 16 17 18 19 20
Rain ✗ ✓ ✓ ✓ ✓ ✗ ✗ ✓ ✓ ✗
a Draw a relative frequency diagram to investigate the experimental probability of rain in Edinburgh in the first 20 days of April.
b What can you conclude from this data?
3 ▶ A spinner for a word game is an irregular pentagon that has five sections, each with a letter A, B, C, D or E. Sanjeev is a keen player, and he experiments to see if he can calculate an estimate of the probability that the spinner will land on a vowel. The results are shown as ticks (a vowel) and crosses (no vowel).
✓ ✓ ✗ ✗ ✗
✗ ✗ ✗ ✓ ✓
✓ ✓ ✗ ✗ ✓
✗ ✗ ✓ ✗ ✓
Draw a relative frequency diagram to investigate the experimental probability of the spinner landing on a vowel.
1 ▶ Pierre is a basketball shooter, and he practises hard to improve this particular skill. He makes 12 attempts from the left-hand side of the court and 12 from the right. His results are shown in these tables.
Left-hand side
✗ ✗ ✓ ✗ ✓ ✓
✓ ✓ ✗ ✓ ✓ ✓
Event L is defined as a successful shot coming from the left-hand side of the court.
Event R is defined as a successful shot coming from the right-hand side.
a Draw a relative frequency diagram to estimate p(L) and p(R).
b What advice would you now give to Pierre based on this evidence?
Right-hand side
✗ ✗ ✗ ✓ ✗ ✗
✗ ✗ ✓ ✓ ✗ ✓
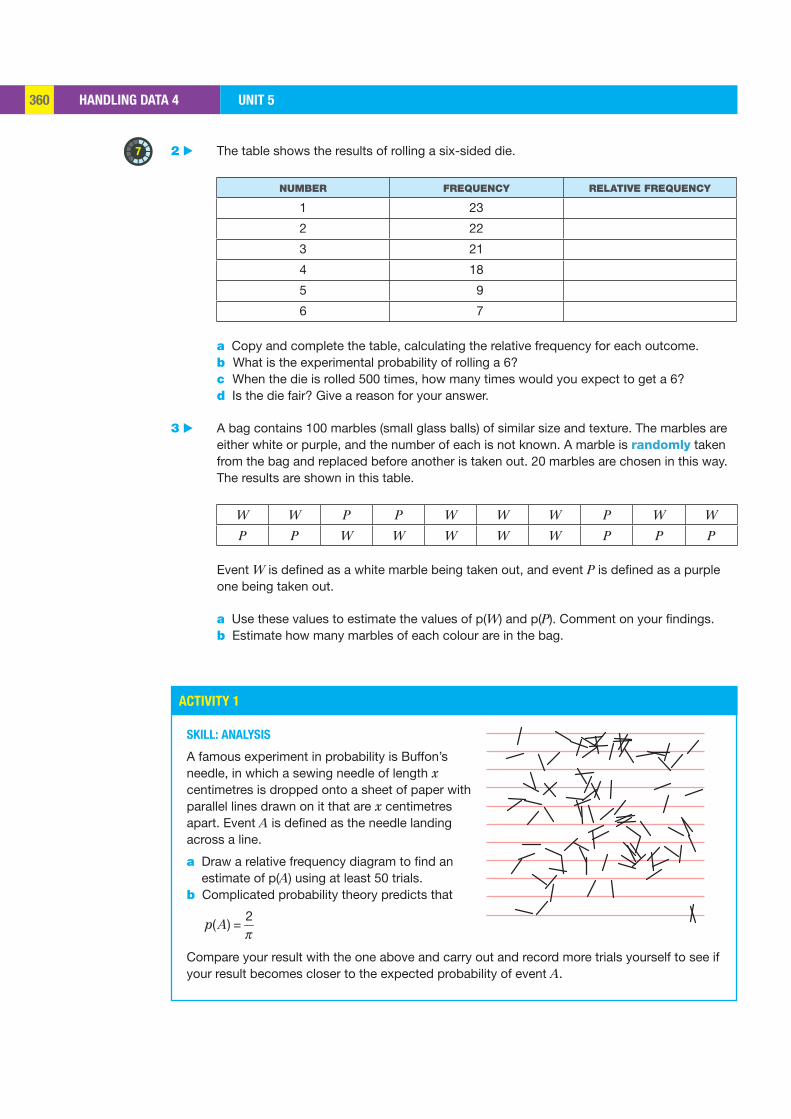
HANDLING DATA 4 UNIT 5360
ACTIVITY 1
7 2 ▶ The table shows the results of rolling a six-sided die.
NUMBER FREQUENCY RELATIVE FREQUENCY
1 23
2 22
3 21
4 18
5 9
6 7
a Copy and complete the table, calculating the relative frequency for each outcome. b What is the experimental probability of rolling a 6? c When the die is rolled 500 times, how many times would you expect to get a 6? d Is the die fair? Give a reason for your answer.
3 ▶ A bag contains 100 marbles (small glass balls) of similar size and texture. The marbles are either white or purple, and the number of each is not known. A marble is randomly taken from the bag and replaced before another is taken out. 20 marbles are chosen in this way. The results are shown in this table.
W W P P W W W P W W
P P W W W W W P P P
Event W is defined as a white marble being taken out, and event P is defined as a purple one being taken out.
a Use these values to estimate the values of p(W) and p(P). Comment on your findings. b Estimate how many marbles of each colour are in the bag.
SKILL: ANALYSIS
A famous experiment in probability is Buffon’s needle, in which a sewing needle of length x centimetres is dropped onto a sheet of paper with parallel lines drawn on it that are x centimetres apart. Event A is defined as the needle landing across a line.
a Draw a relative frequency diagram to find an estimate of p(A) using at least 50 trials.
b Complicated probability theory predicts that
p( A) =2
Compare your result with the one above and carry out and record more trials yourself to see if your result becomes closer to the expected probability of event A.
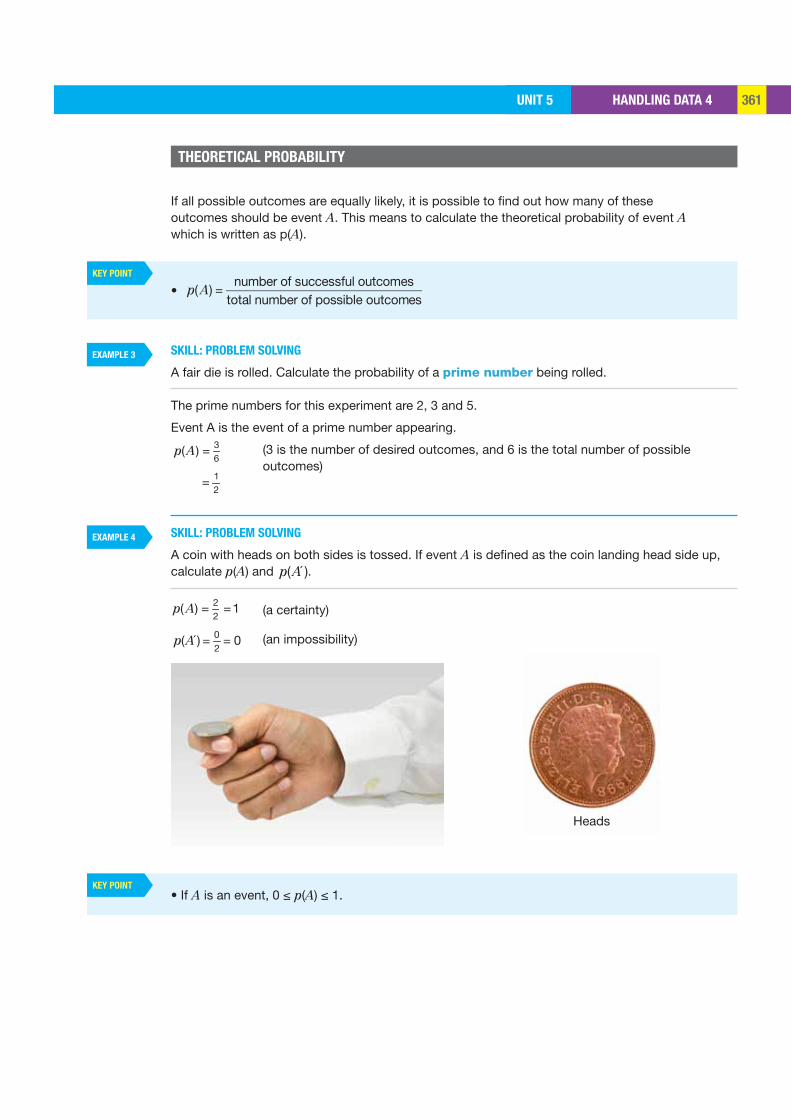
HANDLING DATA 4UNIT 5 361
KEY POINT
KEY POINT
EXAMPLE 3
EXAMPLE 4
If all possible outcomes are equally likely, it is possible to find out how many of these outcomes should be event A. This means to calculate the theoretical probability of event A which is written as p(A).
• p( A) =number of successful outcomes
total number of possible outcomes
SKILL: PROBLEM SOLVING
A fair die is rolled. Calculate the probability of a prime number being rolled.
The prime numbers for this experiment are 2, 3 and 5.
Event A is the event of a prime number appearing.
= 36
( )p A (3 is the number of desired outcomes, and 6 is the total number of possible outcomes)
= 12
SKILL: PROBLEM SOLVING
A coin with heads on both sides is tossed. If event A is defined as the coin landing head side up, calculate p(A) and p( A ).
= =22
( ) 1p A (a certainty)
02
( ) 0p = =A (an impossibility)
• If A is an event, 0 ≤ p(A) ≤ 1.
THEORETICAL PROBABILITY
Heads
HANDLING DATA 4 UNIT 5362
ACTIVITY 2
EXAMPLE 5
KEY POINTS
KEY POINTS
0 1
ImpossibleProbability
Certain
12
SKILL: ADAPTIVE LEARNING
Copy this scale across your page.
Label the scale, marking approximately where you think the probability of these five events A–E should be placed.
• A hockey captain wins the toss at the start of a match (A).
• A heart is taken out from a pack of playing cards (B).
• A heart is not taken out from a pack of playing cards (C).
• You will be taken away by aliens on your way home from school today (D).
• Your teacher will be wearing shoes for your next geography lesson (E).
SKILL: PROBLEM SOLVING
A card is randomly selected from a pack of 52 playing cards. Calculate the probability that a queen is not chosen.
Event Q is defined as a queen is chosen.4 48 1252 52 13
p(Q ) = 1 – p(Q ) = 1 – = =
• + =A Ap( ) p( ) 1
or, perhaps more usefully,
• p( A ) = 1− p( A)
EXPECTED FREQUENCY
If a die is rolled 60 times it would be reasonable to expect ten 6’s to turn up.
This figure is obtained by multiplying the number of trials by the probability of the event.
Expected number of 6’s = 60 × 16
= 10
Ten is not necessarily the exact number of 6’s that will occur every time, but it is the most likely number.
• Expected frequency = number of trials × probability of the event
If A is an event, it either occurs (A) or it does not occur ( A ).
It is certain that nothing else can happen.
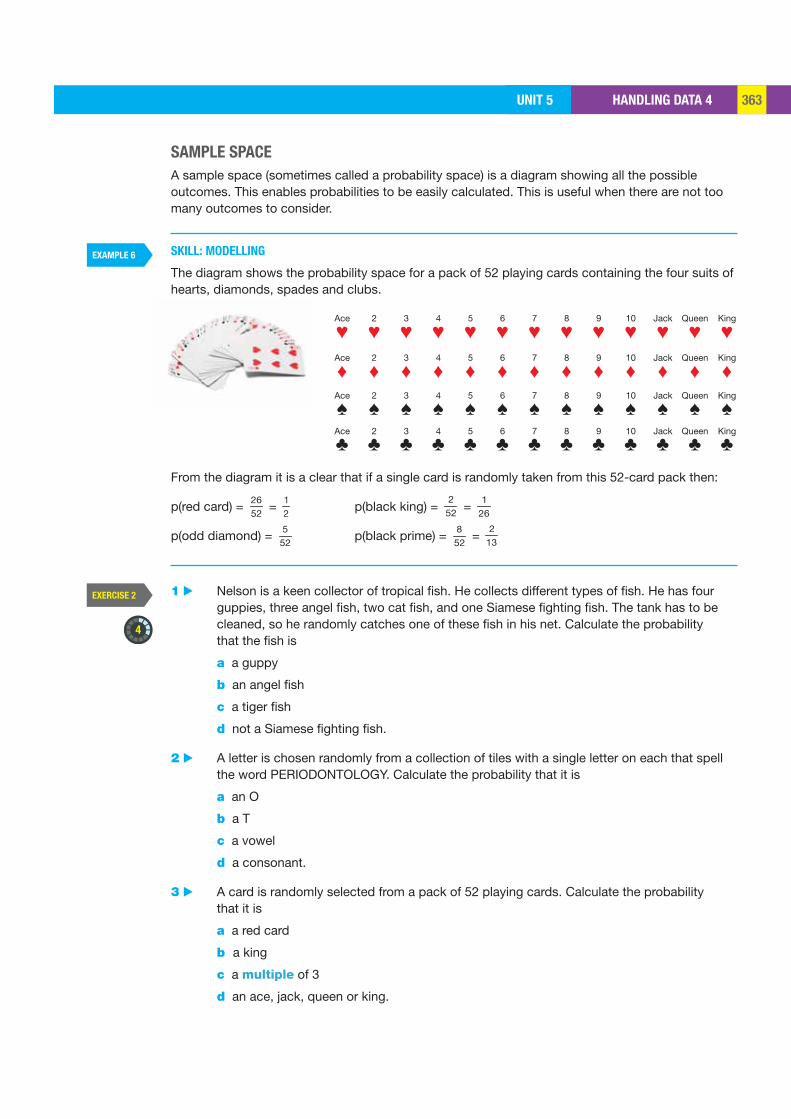
HANDLING DATA 4UNIT 5 363
EXAMPLE 6
EXERCISE 2
4
Ace 2 3 4 5 6 7 8 9 10 Jack Queen King
Ace 2 3 4 5 6 7 8 9 10 Jack Queen King
Ace 2 3 4 5 6 7 8 9 10 Jack Queen King
Ace 2 3 4 5 6 7 8 9 10 Jack Queen King
SAMPLE SPACE
A sample space (sometimes called a probability space) is a diagram showing all the possible outcomes. This enables probabilities to be easily calculated. This is useful when there are not too many outcomes to consider.
SKILL: MODELLING
The diagram shows the probability space for a pack of 52 playing cards containing the four suits of hearts, diamonds, spades and clubs.
From the diagram it is a clear that if a single card is randomly taken from this 52-card pack then:
p(red card) = 2652
= 12
p(black king) = 2
52 = 1
26
p(odd diamond) = 552
p(black prime) = 852
= 2
13
1 ▶ Nelson is a keen collector of tropical fish. He collects different types of fish. He has four guppies, three angel fish, two cat fish, and one Siamese fighting fish. The tank has to be cleaned, so he randomly catches one of these fish in his net. Calculate the probability that the fish is
a a guppy
b an angel fish
c a tiger fish
d not a Siamese fighting fish.
2 ▶ A letter is chosen randomly from a collection of tiles with a single letter on each that spell the word PERIODONTOLOGY. Calculate the probability that it is
a an O
b a T
c a vowel
d a consonant.
3 ▶ A card is randomly selected from a pack of 52 playing cards. Calculate the probability that it is
a a red card
b a king
c a multiple of 3
d an ace, jack, queen or king.
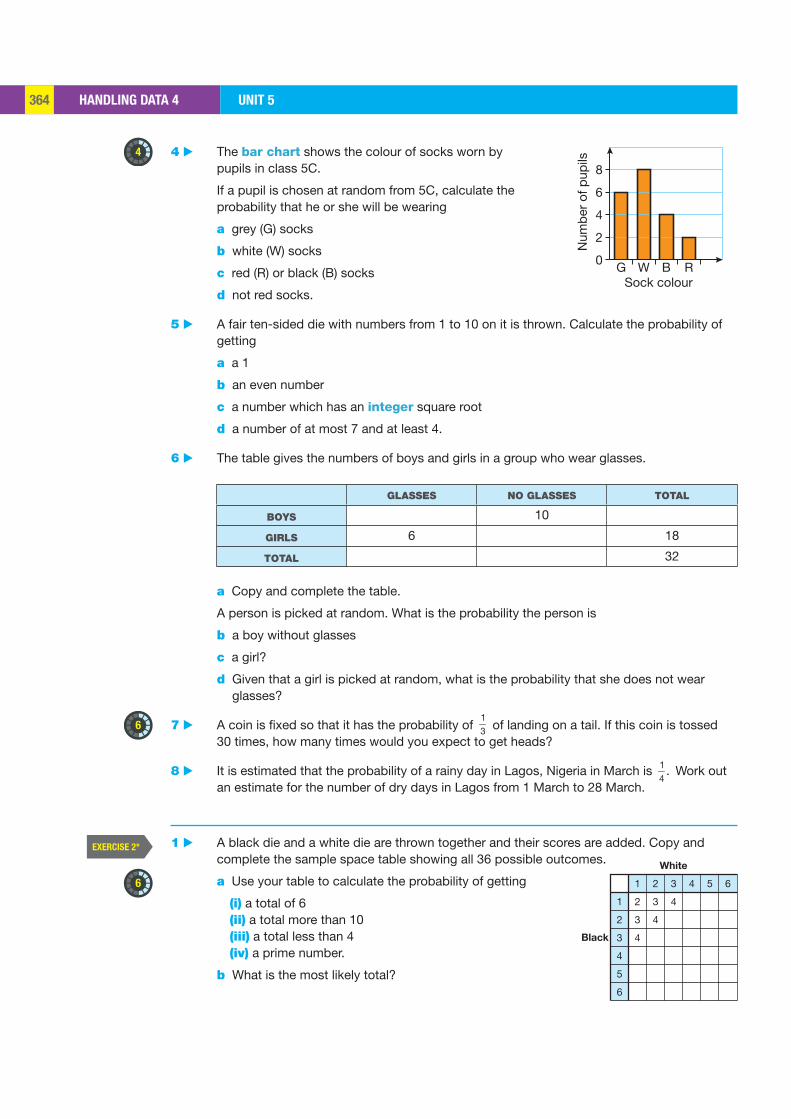
HANDLING DATA 4 UNIT 5364
EXERCISE 2*
4
6
6
G W B RSock colour
0
2
4
6
8
Num
ber
of p
upils
1
2
3
4
5
6
1
2
3
4
2
3
4
3
4
4 5 6
White
Black
4 ▶ The bar chart shows the colour of socks worn by pupils in class 5C.
If a pupil is chosen at random from 5C, calculate the probability that he or she will be wearing
a grey (G) socks
b white (W) socks
c red (R) or black (B) socks
d not red socks.
5 ▶ A fair ten-sided die with numbers from 1 to 10 on it is thrown. Calculate the probability of getting
a a 1
b an even number
c a number which has an integer square root
d a number of at most 7 and at least 4.
6 ▶ The table gives the numbers of boys and girls in a group who wear glasses.
GLASSES NO GLASSES TOTAL
BOYS 10
GIRLS 6 18
TOTAL 32
a Copy and complete the table.
A person is picked at random. What is the probability the person is
b a boy without glasses
c a girl?
d Given that a girl is picked at random, what is the probability that she does not wear glasses?
7 ▶ A coin is fixed so that it has the probability of 13 of landing on a tail. If this coin is tossed
30 times, how many times would you expect to get heads?
8 ▶ It is estimated that the probability of a rainy day in Lagos, Nigeria in March is 14
. Work out an estimate for the number of dry days in Lagos from 1 March to 28 March.
1 ▶ A black die and a white die are thrown together and their scores are added. Copy and complete the sample space table showing all 36 possible outcomes.
a Use your table to calculate the probability of getting
(i) a total of 6 (ii) a total more than 10 (iii) a total less than 4 (iv) a prime number.
b What is the most likely total?
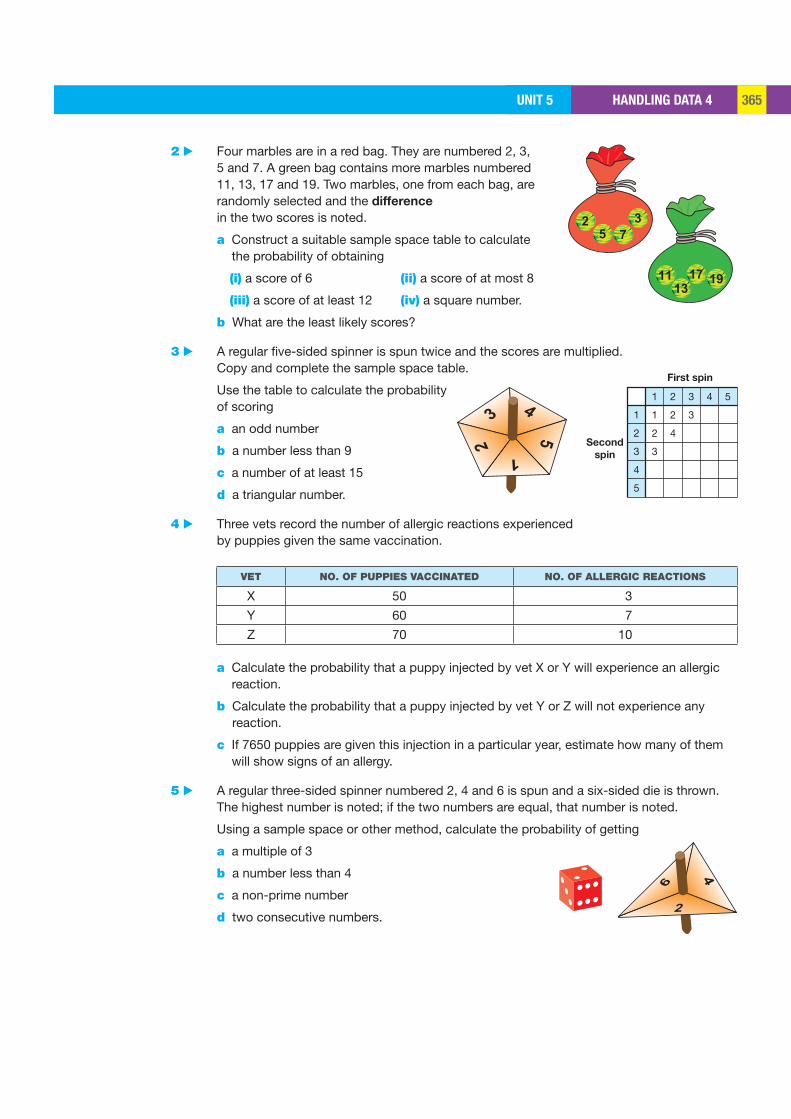
HANDLING DATA 4UNIT 5 365
1
2
3
4
5
1
1
2
3
2
2
4
3
3
4 5
First spin
Second
spin
2 ▶ Four marbles are in a red bag. They are numbered 2, 3, 5 and 7. A green bag contains more marbles numbered 11, 13, 17 and 19. Two marbles, one from each bag, are randomly selected and the difference in the two scores is noted.
a Construct a suitable sample space table to calculate the probability of obtaining
(i) a score of 6 (ii) a score of at most 8
(iii) a score of at least 12 (iv) a square number.
b What are the least likely scores?
3 ▶ A regular five-sided spinner is spun twice and the scores are multiplied. Copy and complete the sample space table.
Use the table to calculate the probability of scoring
a an odd number
b a number less than 9
c a number of at least 15
d a triangular number.
4 ▶ Three vets record the number of allergic reactions experienced by puppies given the same vaccination.
VET NO. OF PUPPIES VACCINATED NO. OF ALLERGIC REACTIONS
X 50 3
Y 60 7
Z 70 10 a Calculate the probability that a puppy injected by vet X or Y will experience an allergic
reaction.
b Calculate the probability that a puppy injected by vet Y or Z will not experience any reaction.
c If 7650 puppies are given this injection in a particular year, estimate how many of them will show signs of an allergy.
5 ▶ A regular three-sided spinner numbered 2, 4 and 6 is spun and a six-sided die is thrown. The highest number is noted; if the two numbers are equal, that number is noted.
Using a sample space or other method, calculate the probability of getting
a a multiple of 3
b a number less than 4
c a non-prime number
d two consecutive numbers.
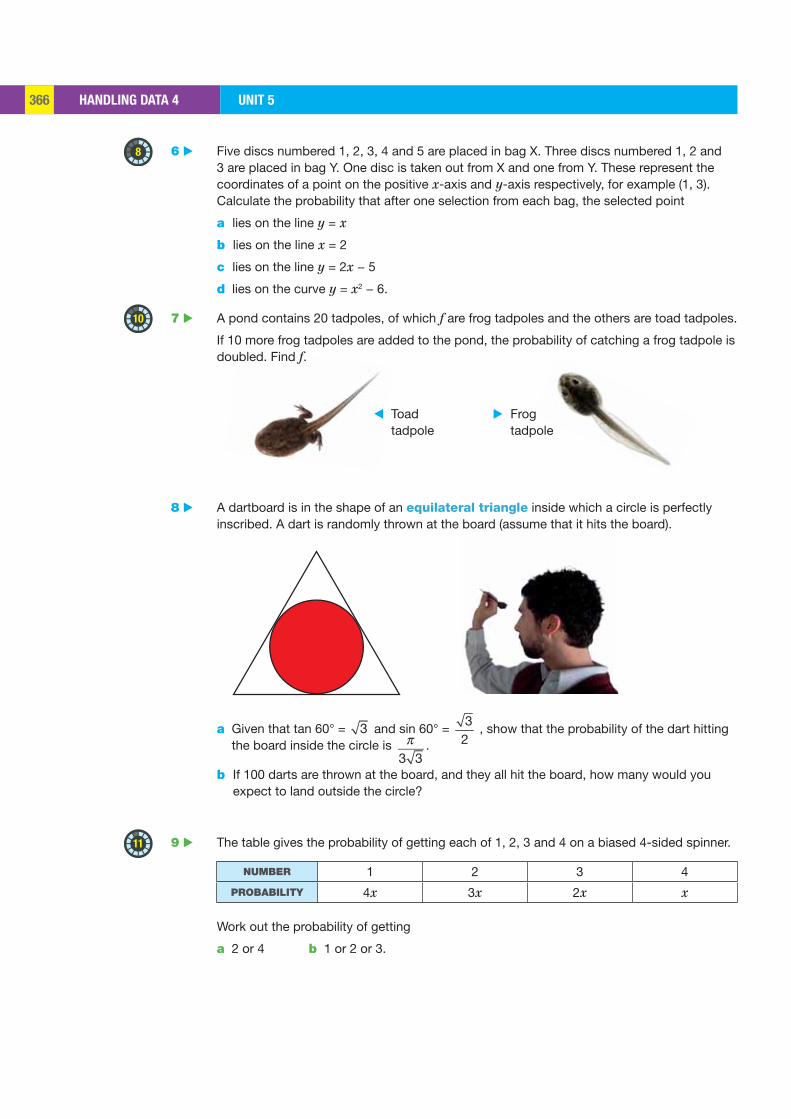
HANDLING DATA 4 UNIT 5366
8
10
11
6 ▶ Five discs numbered 1, 2, 3, 4 and 5 are placed in bag X. Three discs numbered 1, 2 and 3 are placed in bag Y. One disc is taken out from X and one from Y. These represent the coordinates of a point on the positive x-axis and y-axis respectively, for example (1, 3). Calculate the probability that after one selection from each bag, the selected point
a lies on the line y = x
b lies on the line x = 2
c lies on the line y = 2x − 5
d lies on the curve y = x2 − 6.
7 ▶ A pond contains 20 tadpoles, of which f are frog tadpoles and the others are toad tadpoles.
If 10 more frog tadpoles are added to the pond, the probability of catching a frog tadpole is doubled. Find f.
8 ▶ A dartboard is in the shape of an equilateral triangle inside which a circle is perfectly inscribed. A dart is randomly thrown at the board (assume that it hits the board).
a Given that tan 60° = 3 and sin 60° = 3
2 , show that the probability of the dart hitting
the board inside the circle is 3 3
.
b If 100 darts are thrown at the board, and they all hit the board, how many would you expect to land outside the circle?
9 ▶ The table gives the probability of getting each of 1, 2, 3 and 4 on a biased 4-sided spinner.
NUMBER 1 2 3 4
PROBABILITY 4x 3x 2x x
Work out the probability of getting
a 2 or 4 b 1 or 2 or 3.
▶ Frog tadpole
◀ Toad tadpole
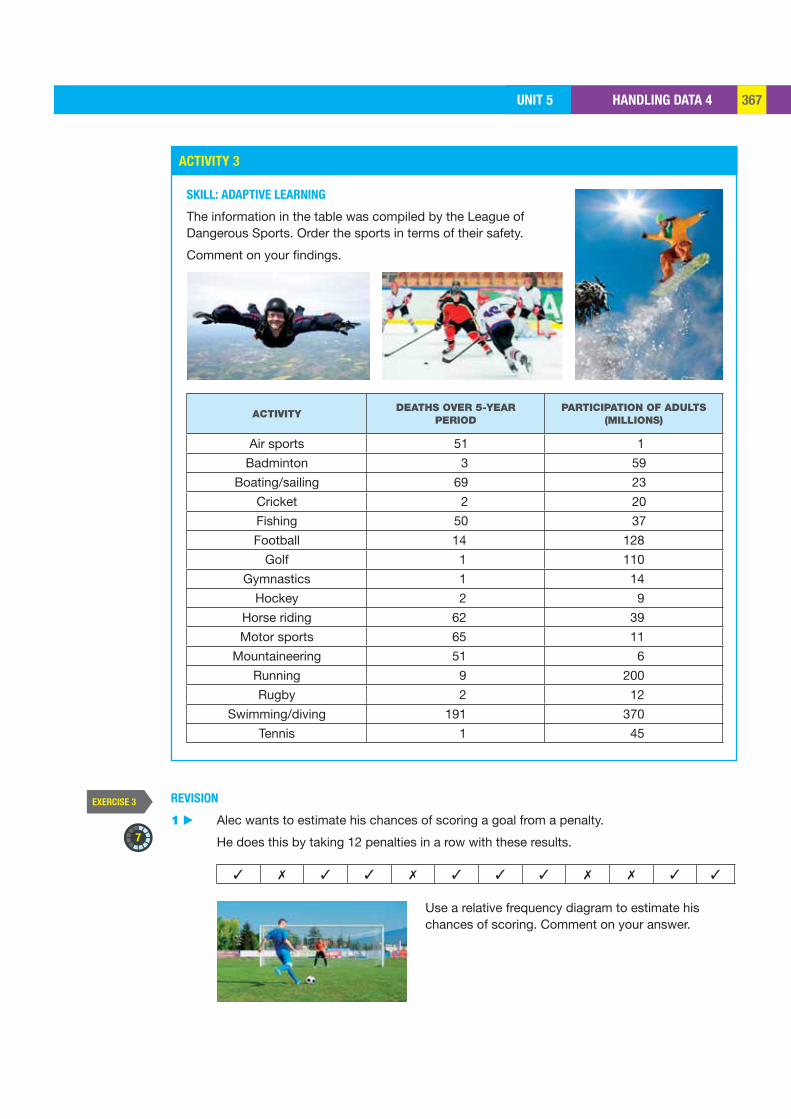
HANDLING DATA 4UNIT 5 367
ACTIVITY 3
EXERCISE 3
7
SKILL: ADAPTIVE LEARNING
The information in the table was compiled by the League of Dangerous Sports. Order the sports in terms of their safety.
Comment on your findings.
ACTIVITYDEATHS OVER 5-YEAR
PERIODPARTICIPATION OF ADULTS
(MILLIONS)
Air sports 51 1
Badminton 3 59
Boating/sailing 69 23
Cricket 2 20
Fishing 50 37
Football 14 128
Golf 1 110
Gymnastics 1 14
Hockey 2 9
Horse riding 62 39
Motor sports 65 11
Mountaineering 51 6
Running 9 200
Rugby 2 12
Swimming/diving 191 370
Tennis 1 45
REVISION
1 ▶ Alec wants to estimate his chances of scoring a goal from a penalty.
He does this by taking 12 penalties in a row with these results.
✓ ✗ ✓ ✓ ✗ ✓ ✓ ✓ ✗ ✗ ✓ ✓
Use a relative frequency diagram to estimate his chances of scoring. Comment on your answer.
HANDLING DATA 4 UNIT 5368
EXERCISE 3*
4
7
7
2 ▶ The probability that a new truck gets a puncture in a tyre during its first 30 000 km is 2
15 . What is the probability of a puncture-free first 30 000 km for this vehicle?
3 ▶ One letter is randomly chosen from this sentence: ‘All the world’s a stage and all the men and women merely players.’ What is the probability of the letter being
a an ‘a’ b a ‘t’ c a vowel d an ‘x’?
4 ▶ A $1 coin and a $2 coin are tossed. Write down all the possible outcomes in a sample space, and calculate the probability of getting
a two tails b a head and a tail.
5 ▶ Umberto has $1, $10, $20 and $50 notes in his wallet. He has one of each type. He randomly removes two notes together. Find the probability that these two notes total
a $11 b $70 c $80 d at least $11.
6 ▶ Frances buys ten lottery tickets from 500 sold. If she does not win anything with any of the first six tickets selected, what is the probability that she will win with the seventh ticket? (Assume that there is only one prize in the lottery.)
7 ▶ The probability of a rainy day in Rome in April is 13. How many dry days would you expect
in Rome from 1 to 30 April?
8 ▶ Saul picks a ball from a bag containing a very large number of different coloured balls of the same size. Each ball is either red or black in the ratio of 1: 3 respectively.
Calculate an estimate of the probability that Saul picks out a ball which is
a red b not red c white.
REVISION
1 ▶ Germaine is a keen bird-watcher and sees an Australian magpie at the same place in a forest from 1 to 10 January for three years in a row. She keeps a record, shown below.
a Use these values to estimate the probability of seeing an Australian magpie in this place for each year.
b Comment on your findings.
YEAR1 2 3 4 5 6 7 8 9 10
2014 1 0 1 0 1 1 1 0 1 1
2015 0 0 1 1 0 1 1 1 1 0
2016 0 0 1 0 0 1 0 0 1 1
JAN
HANDLING DATA 4UNIT 5 369
6
4
7
2 ▶ A black die and a red die are thrown at the same time. Both dice are numbered from 1 to 6. Their scores are multiplied together. Use a sample space diagram to calculate the probability of getting
a 4 b an even number c at least 16.
3 ▶ A region of Eastern China is called ‘GUANGXI ZHUANGZU ZIZHIQU’. One letter is randomly chosen from this name.
a Find the probability of the letter being (i) an A (ii) a Z (iii) a B.
b What is the most likely letter to be chosen?
4 ▶ The sets A and B consist of the following numbers:
A = {1, 3, 5, 7, 9, 11} B = {1, 5, 9, 13, 17, 21}
A whole number from 1 to 25 inclusive is randomly chosen. Find the probability that this number is in the set
a A
b ʹB
c ∩A B
d ∪A B .
5 ▶ A spinner is turned and a die is thrown. £5 is won when the score on the die is at least the score on the spinner. How much would you expect to win if this game were played 12 times in a row? (Assume that there is no cost to play the game.)
6 ▶ Three coins are tossed simultaneously. List all the possible outcomes in a sample space and use it to calculate the probability of getting
a three heads
b two heads and a tail
c at least two heads.
7 ▶ In a game, two dice are rolled and their scores are added. This is done 12 times. How many times would you expect a seven to be scored?
8 ▶ Varoosha picks out a ball from a bag containing a very large number of different coloured balls of the same size. Each ball is either red, white or black in the ratio of 2 : 3 : 4 respectively.
Calculate an estimate of the probability that Varoosha picks out a ball which is
a red
b black or white
c not white.
Tails Heads
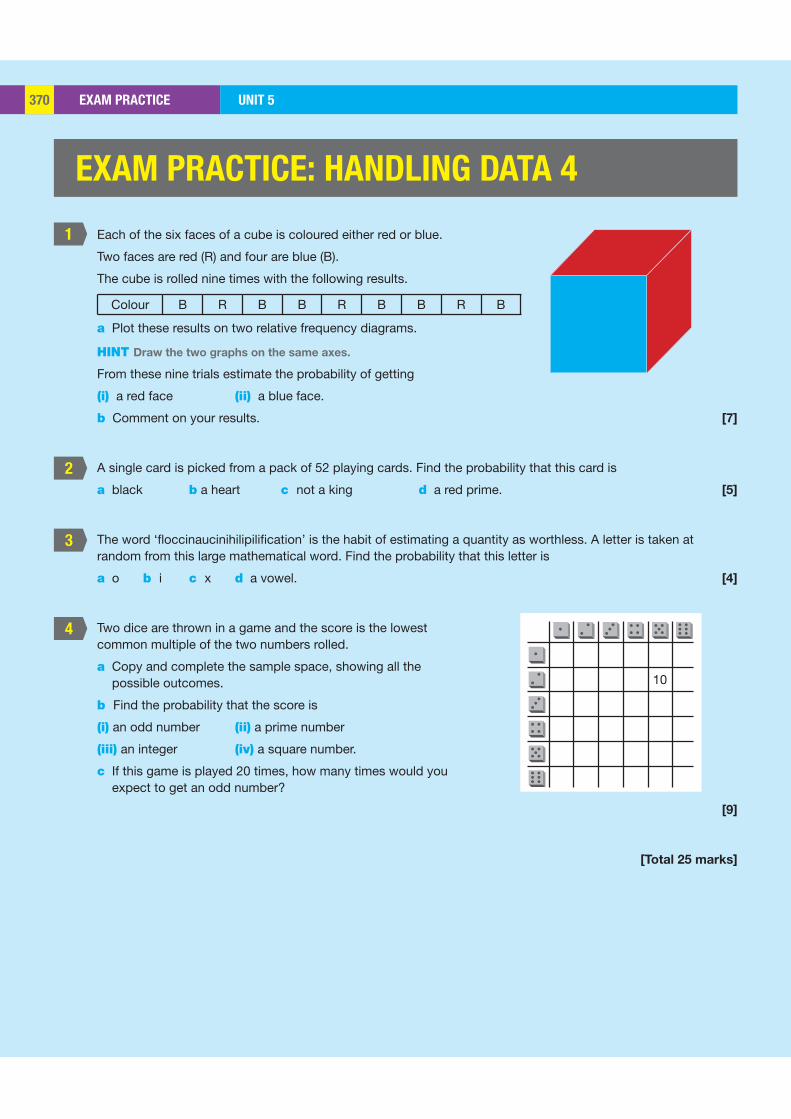
EXAM PRACTICE UNIT 5370370
1
2
3
4
10
Each of the six faces of a cube is coloured either red or blue.
Two faces are red (R) and four are blue (B).
The cube is rolled nine times with the following results.
Colour B R B B R B B R B
a Plot these results on two relative frequency diagrams.
HINT Draw the two graphs on the same axes.
From these nine trials estimate the probability of getting
(i) a red face (ii) a blue face.
b Comment on your results. [7]
A single card is picked from a pack of 52 playing cards. Find the probability that this card is
a black b a heart c not a king d a red prime. [5]
The word ‘floccinaucinihilipilification’ is the habit of estimating a quantity as worthless. A letter is taken at random from this large mathematical word. Find the probability that this letter is
a o b i c x d a vowel. [4]
Two dice are thrown in a game and the score is the lowest common multiple of the two numbers rolled.
a Copy and complete the sample space, showing all the possible outcomes.
b Find the probability that the score is
(i) an odd number (ii) a prime number
(iii) an integer (iv) a square number.
c If this game is played 20 times, how many times would you expect to get an odd number?
[9]
[Total 25 marks]
EXAM PRACTICE: HANDLING DATA 4
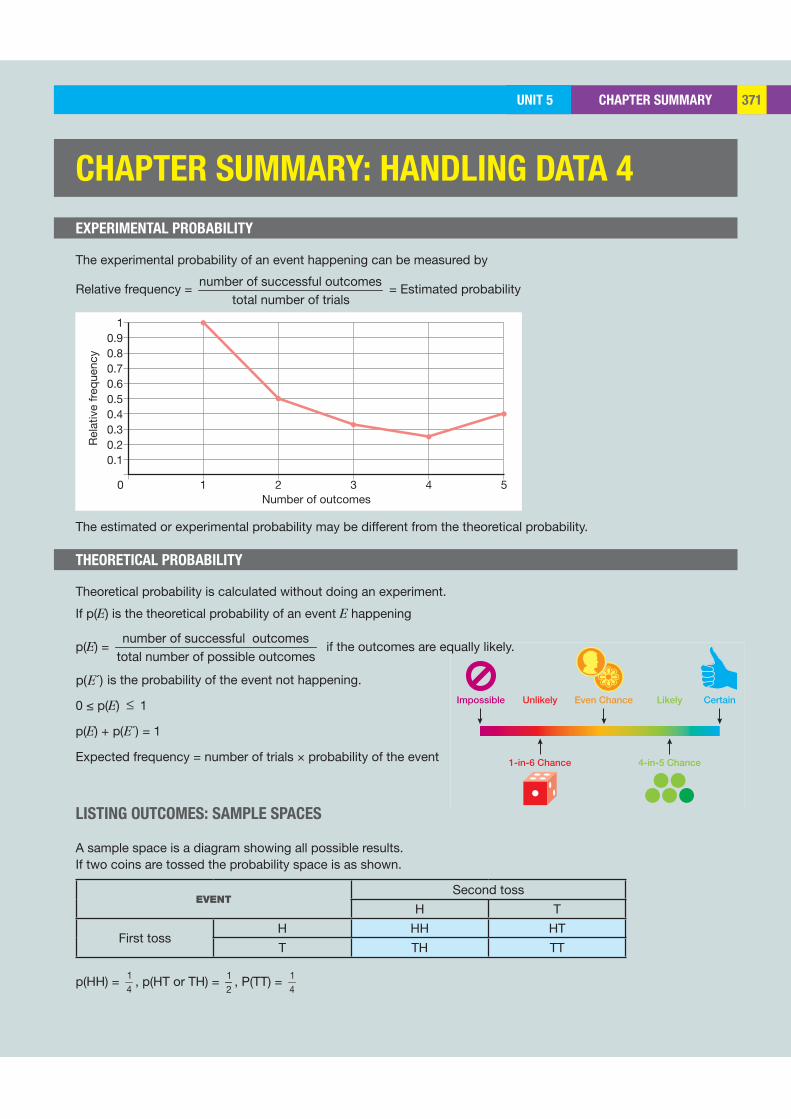
CHAPTER SUMMARYUNIT 5 371371
1
Rel
ativ
e fr
eque
ncy
Number of outcomes
0.90.80.70.60.50.40.30.20.1
10 2 3 4 5
Impossible Even Chance
1-in-6 Chance
Unlikely
4-in-5 Chance
Likely Certain
EXPERIMENTAL PROBABILITY
THEORETICAL PROBABILITY
CHAPTER SUMMARY: HANDLING DATA 4
The experimental probability of an event happening can be measured by
Relative frequency = number of successful outcomes
total number of trials = Estimated probability
The estimated or experimental probability may be different from the theoretical probability.
Theoretical probability is calculated without doing an experiment.
If p(E) is the theoretical probability of an event E happening
p(E) = number of successful outcomes
total number of possible outcomes if the outcomes are equally likely.
p( )E´ is the probability of the event not happening.
0 ≤ p(E) 1
p(E) + p( )E´ = 1
Expected frequency = number of trials × probability of the event
LISTING OUTCOMES: SAMPLE SPACES
A sample space is a diagram showing all possible results.If two coins are tossed the probability space is as shown.
EVENTSecond toss
H T
First tossH HH HT
T TH TT
p(HH) = 14
, p(HT or TH) = 12
, P(TT) = 14
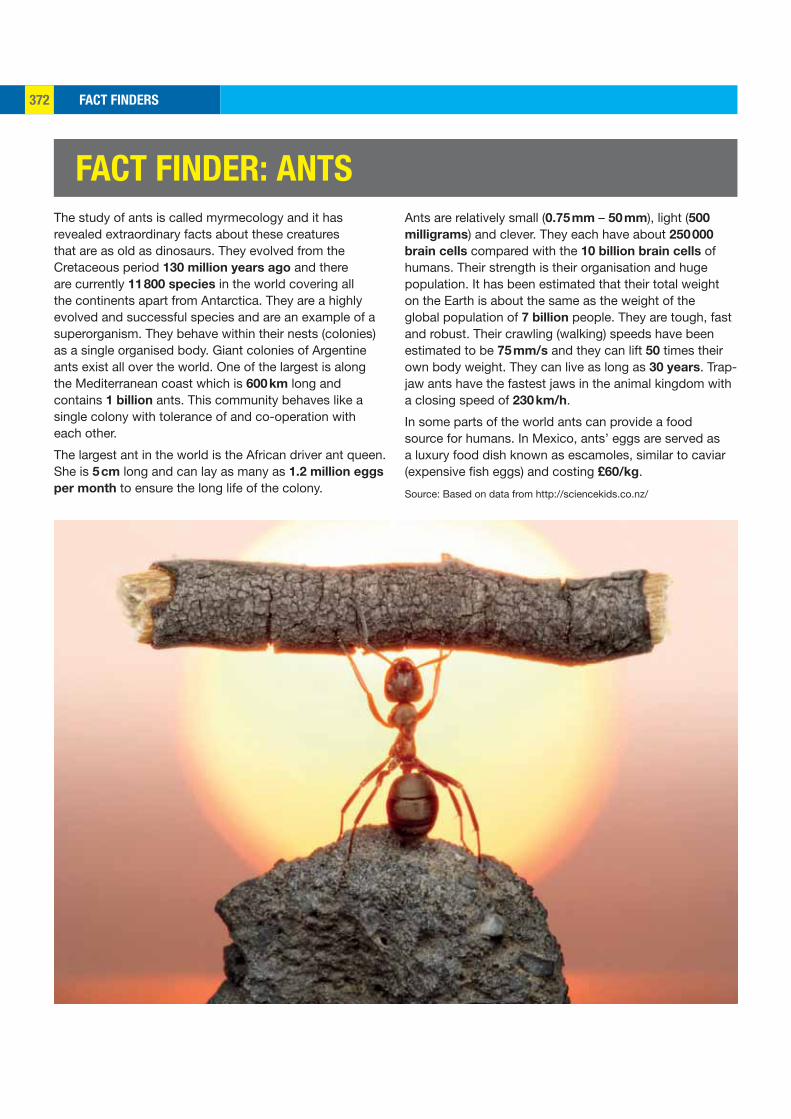
FACT FINDERS372
The study of ants is called myrmecology and it has revealed extraordinary facts about these creatures that are as old as dinosaurs. They evolved from the Cretaceous period 130 million years ago and there are currently 11 800 species in the world covering all the continents apart from Antarctica. They are a highly evolved and successful species and are an example of a superorganism. They behave within their nests (colonies) as a single organised body. Giant colonies of Argentine ants exist all over the world. One of the largest is along the Mediterranean coast which is 600 km long and contains 1 billion ants. This community behaves like a single colony with tolerance of and co-operation with each other.
The largest ant in the world is the African driver ant queen. She is 5 cm long and can lay as many as 1.2 million eggs per month to ensure the long life of the colony.
Ants are relatively small (0.75 mm – 50 mm), light (500
milligrams) and clever. They each have about 250 000
brain cells compared with the 10 billion brain cells of humans. Their strength is their organisation and huge population. It has been estimated that their total weight on the Earth is about the same as the weight of the global population of 7 billion people. They are tough, fast and robust. Their crawling (walking) speeds have been estimated to be 75 mm/s and they can lift 50 times their own body weight. They can live as long as 30 years. Trap-jaw ants have the fastest jaws in the animal kingdom with a closing speed of 230 km/h.
In some parts of the world ants can provide a food source for humans. In Mexico, ants’ eggs are served as a luxury food dish known as escamoles, similar to caviar (expensive fish eggs) and costing £60/kg.
Source: Based on data from http://sciencekids.co.nz/
FACT FINDER: ANTS
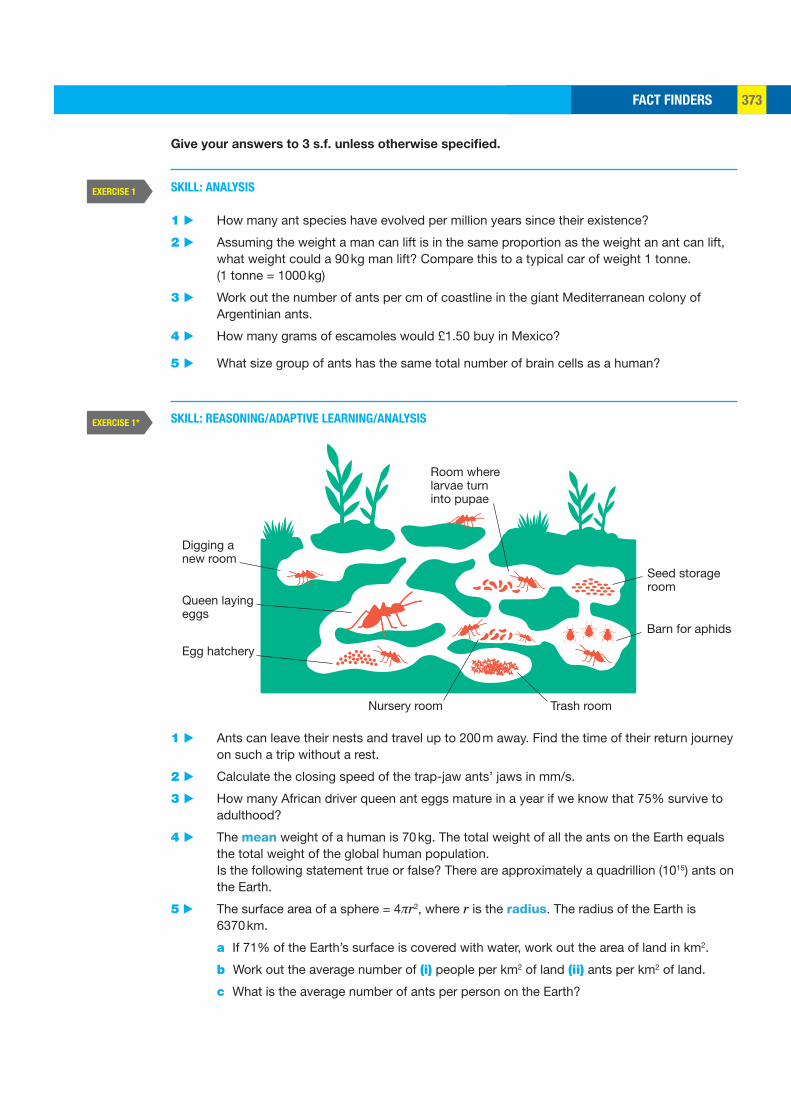
FACT FINDERS 373
EXERCISE 1
EXERCISE 1*
Digging a new room
Queen laying eggs
Egg hatchery
Room where larvae turn into pupae
Trash room
Seed storage room
Nursery room
Barn for aphids
Give your answers to 3 s.f. unless otherwise specified.
SKILL: ANALYSIS
1 ▶ How many ant species have evolved per million years since their existence?
2 ▶ Assuming the weight a man can lift is in the same proportion as the weight an ant can lift, what weight could a 90 kg man lift? Compare this to a typical car of weight 1 tonne. (1 tonne = 1000 kg)
3 ▶ Work out the number of ants per cm of coastline in the giant Mediterranean colony of Argentinian ants.
4 ▶ How many grams of escamoles would £1.50 buy in Mexico?
5 ▶ What size group of ants has the same total number of brain cells as a human?
SKILL: REASONING/ADAPTIVE LEARNING/ANALYSIS
1 ▶ Ants can leave their nests and travel up to 200 m away. Find the time of their return journey on such a trip without a rest.
2 ▶ Calculate the closing speed of the trap-jaw ants’ jaws in mm/s.
3 ▶ How many African driver queen ant eggs mature in a year if we know that 75% survive to adulthood?
4 ▶ The mean weight of a human is 70 kg. The total weight of all the ants on the Earth equals the total weight of the global human population. Is the following statement true or false? There are approximately a quadrillion (1015) ants on the Earth.
5 ▶ The surface area of a sphere = 4πr2, where r is the radius. The radius of the Earth is 6370 km.
a If 71% of the Earth’s surface is covered with water, work out the area of land in km2.
b Work out the average number of (i) people per km2 of land (ii) ants per km2 of land.
c What is the average number of ants per person on the Earth?
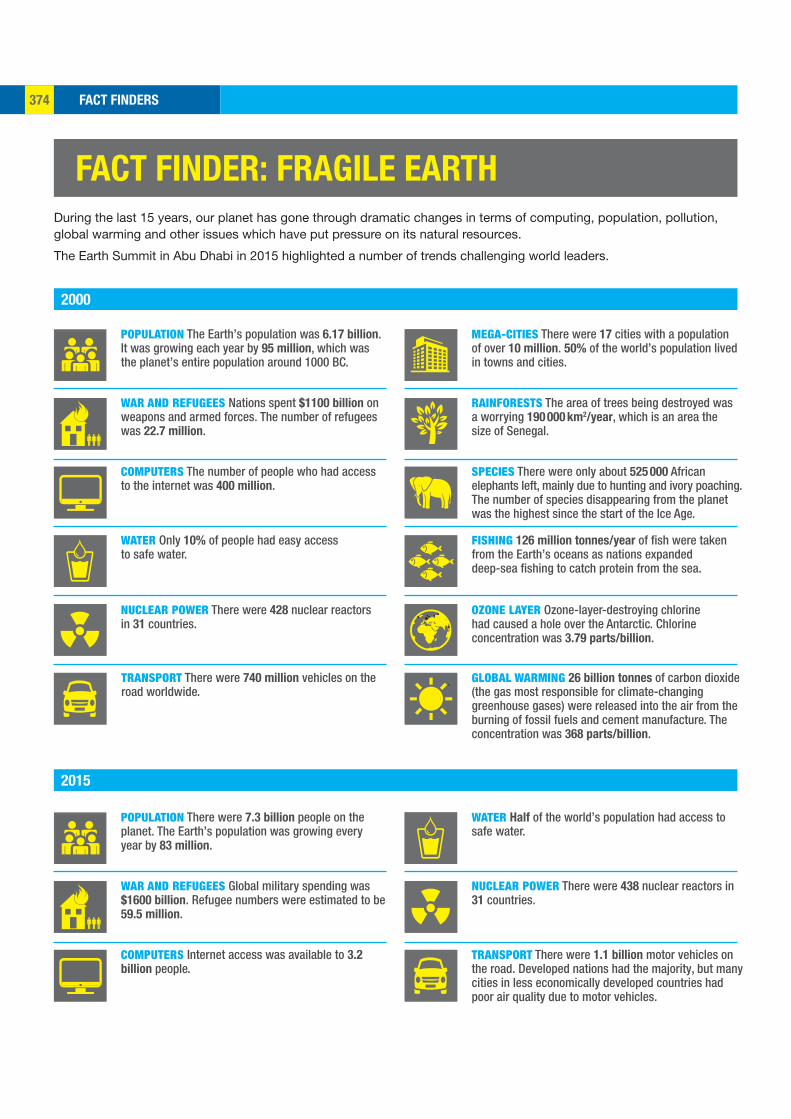
FACT FINDERS374
2000
2015
During the last 15 years, our planet has gone through dramatic changes in terms of computing, population, pollution, global warming and other issues which have put pressure on its natural resources.
The Earth Summit in Abu Dhabi in 2015 highlighted a number of trends challenging world leaders.
POPULATION The Earth’s population was 6.17 billion. It was growing each year by 95 million, which was the planet’s entire population around 1000 BC.
POPULATION There were 7.3 billion people on the planet. The Earth’s population was growing every year by 83 million.
WAR AND REFUGEES Nations spent $1100 billion on weapons and armed forces. The number of refugees was 22.7 million.
WAR AND REFUGEES Global military spending was $1600 billion. Refugee numbers were estimated to be 59.5 million.
COMPUTERS The number of people who had access to the internet was 400 million.
COMPUTERS Internet access was available to 3.2 billion people.
WATER Only 10% of people had easy access to safe water.
NUCLEAR POWER There were 428 nuclear reactors in 31 countries.
TRANSPORT There were 740 million vehicles on the road worldwide.
MEGA-CITIES There were 17 cities with a population of over 10 million. 50% of the world’s population lived in towns and cities.
WATER Half of the world’s population had access to safe water.
RAINFORESTS The area of trees being destroyed was a worrying 190 000 km2/year, which is an area the size of Senegal.
NUCLEAR POWER There were 438 nuclear reactors in 31 countries.
SPECIES There were only about 525 000 African elephants left, mainly due to hunting and ivory poaching. The number of species disappearing from the planet was the highest since the start of the Ice Age.
TRANSPORT There were 1.1 billion motor vehicles on the road. Developed nations had the majority, but many cities in less economically developed countries had poor air quality due to motor vehicles.
FISHING 126 million tonnes/year of fish were taken from the Earth’s oceans as nations expanded deep-sea fishing to catch protein from the sea.
OZONE LAYER Ozone-layer-destroying chlorine had caused a hole over the Antarctic. Chlorine concentration was 3.79 parts/billion.
GLOBAL WARMING 26 billion tonnes of carbon dioxide (the gas most responsible for climate-changing greenhouse gases) were released into the air from the burning of fossil fuels and cement manufacture. The concentration was 368 parts/billion.
FACT FINDER: FRAGILE EARTH
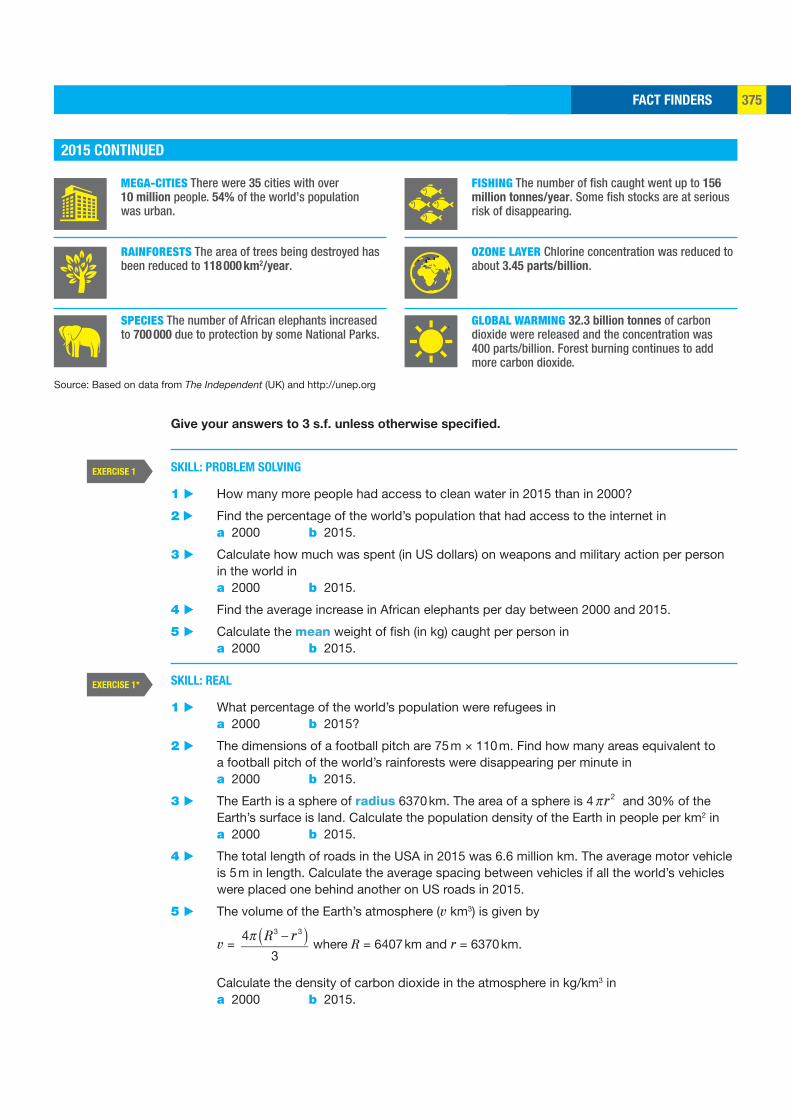
FACT FINDERS 375
EXERCISE 1
EXERCISE 1*
2015 CONTINUED
Give your answers to 3 s.f. unless otherwise specified.
SKILL: PROBLEM SOLVING
1 ▶ How many more people had access to clean water in 2015 than in 2000?
2 ▶ Find the percentage of the world’s population that had access to the internet in a 2000 b 2015.
3 ▶ Calculate how much was spent (in US dollars) on weapons and military action per person in the world in
a 2000 b 2015.
4 ▶ Find the average increase in African elephants per day between 2000 and 2015.
5 ▶ Calculate the mean weight of fish (in kg) caught per person in a 2000 b 2015.
SKILL: REAL
1 ▶ What percentage of the world’s population were refugees in a 2000 b 2015?
2 ▶ The dimensions of a football pitch are 75 m × 110 m. Find how many areas equivalent to a football pitch of the world’s rainforests were disappearing per minute in
a 2000 b 2015.
3 ▶ The Earth is a sphere of radius 6370 km. The area of a sphere is 4 r2 and 30% of the Earth’s surface is land. Calculate the population density of the Earth in people per km2 in
a 2000 b 2015.
4 ▶ The total length of roads in the USA in 2015 was 6.6 million km. The average motor vehicle is 5 m in length. Calculate the average spacing between vehicles if all the world’s vehicles were placed one behind another on US roads in 2015.
5 ▶ The volume of the Earth’s atmosphere (v km3) is given by
v = 4 R3 r3
3 where R = 6407 km and r = 6370 km.
Calculate the density of carbon dioxide in the atmosphere in kg/km3 in a 2000 b 2015.
MEGA-CITIES There were 35 cities with over 10 million people. 54% of the world’s population was urban.
RAINFORESTS The area of trees being destroyed has been reduced to 118 000 km2/year.
SPECIES The number of African elephants increased to 700 000 due to protection by some National Parks.
FISHING The number of fish caught went up to 156 million tonnes/year. Some fish stocks are at serious risk of disappearing.
OZONE LAYER Chlorine concentration was reduced to about 3.45 parts/billion.
GLOBAL WARMING 32.3 billion tonnes of carbon dioxide were released and the concentration was 400 parts/billion. Forest burning continues to add more carbon dioxide.
Source: Based on data from The Independent (UK) and http://unep.org
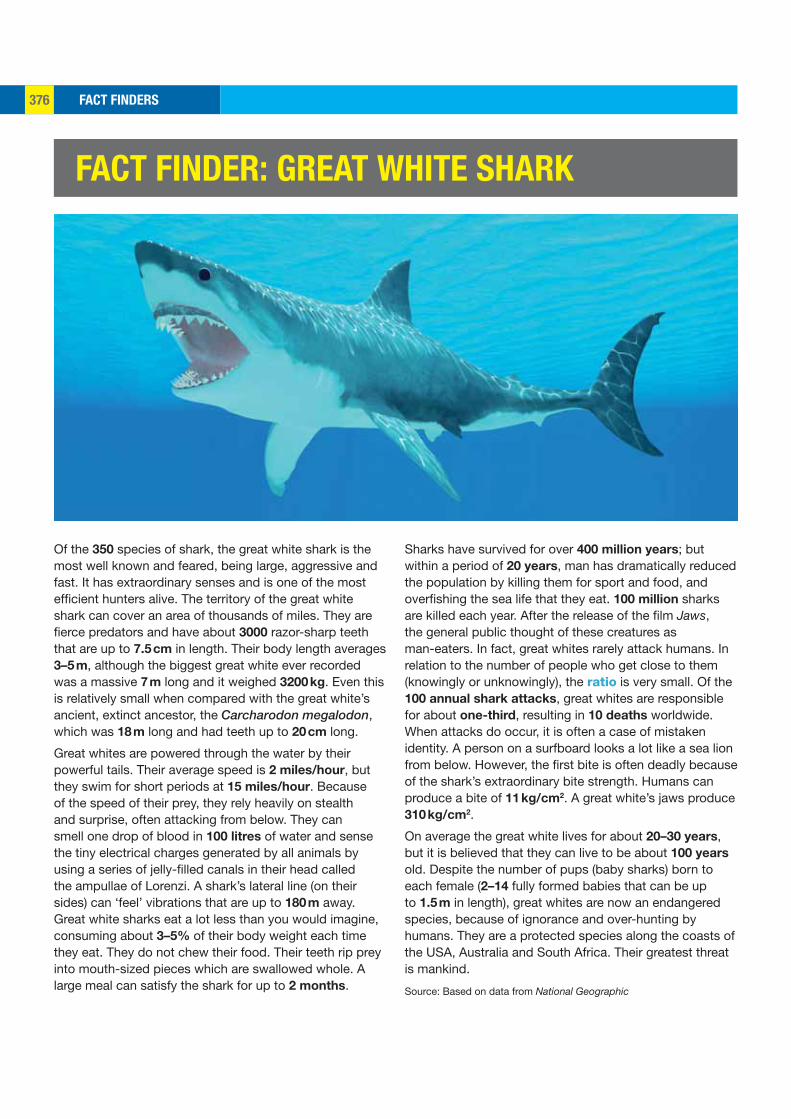
FACT FINDERS376
Of the 350 species of shark, the great white shark is the most well known and feared, being large, aggressive and fast. It has extraordinary senses and is one of the most efficient hunters alive. The territory of the great white shark can cover an area of thousands of miles. They are fierce predators and have about 3000 razor-sharp teeth that are up to 7.5 cm in length. Their body length averages 3–5 m, although the biggest great white ever recorded was a massive 7 m long and it weighed 3200 kg. Even this is relatively small when compared with the great white’s ancient, extinct ancestor, the Carcharodon megalodon, which was 18 m long and had teeth up to 20 cm long.
Great whites are powered through the water by their powerful tails. Their average speed is 2 miles/hour, but they swim for short periods at 15 miles/hour. Because of the speed of their prey, they rely heavily on stealth and surprise, often attacking from below. They can smell one drop of blood in 100 litres of water and sense the tiny electrical charges generated by all animals by using a series of jelly-filled canals in their head called the ampullae of Lorenzi. A shark’s lateral line (on their sides) can ‘feel’ vibrations that are up to 180 m away. Great white sharks eat a lot less than you would imagine, consuming about 3–5% of their body weight each time they eat. They do not chew their food. Their teeth rip prey into mouth-sized pieces which are swallowed whole. A large meal can satisfy the shark for up to 2 months.
Sharks have survived for over 400 million years; but within a period of 20 years, man has dramatically reduced the population by killing them for sport and food, and overfishing the sea life that they eat. 100 million sharks are killed each year. After the release of the film Jaws, the general public thought of these creatures as man-eaters. In fact, great whites rarely attack humans. In relation to the number of people who get close to them (knowingly or unknowingly), the ratio is very small. Of the 100 annual shark attacks, great whites are responsible for about one-third, resulting in 10 deaths worldwide. When attacks do occur, it is often a case of mistaken identity. A person on a surfboard looks a lot like a sea lion from below. However, the first bite is often deadly because of the shark’s extraordinary bite strength. Humans can produce a bite of 11 kg/cm2. A great white’s jaws produce 310 kg/cm2.
On average the great white lives for about 20–30 years, but it is believed that they can live to be about 100 years old. Despite the number of pups (baby sharks) born to each female (2–14 fully formed babies that can be up to 1.5 m in length), great whites are now an endangered species, because of ignorance and over-hunting by humans. They are a protected species along the coasts of the USA, Australia and South Africa. Their greatest threat is mankind.
Source: Based on data from National Geographic
FACT FINDER: GREAT WHITE SHARK
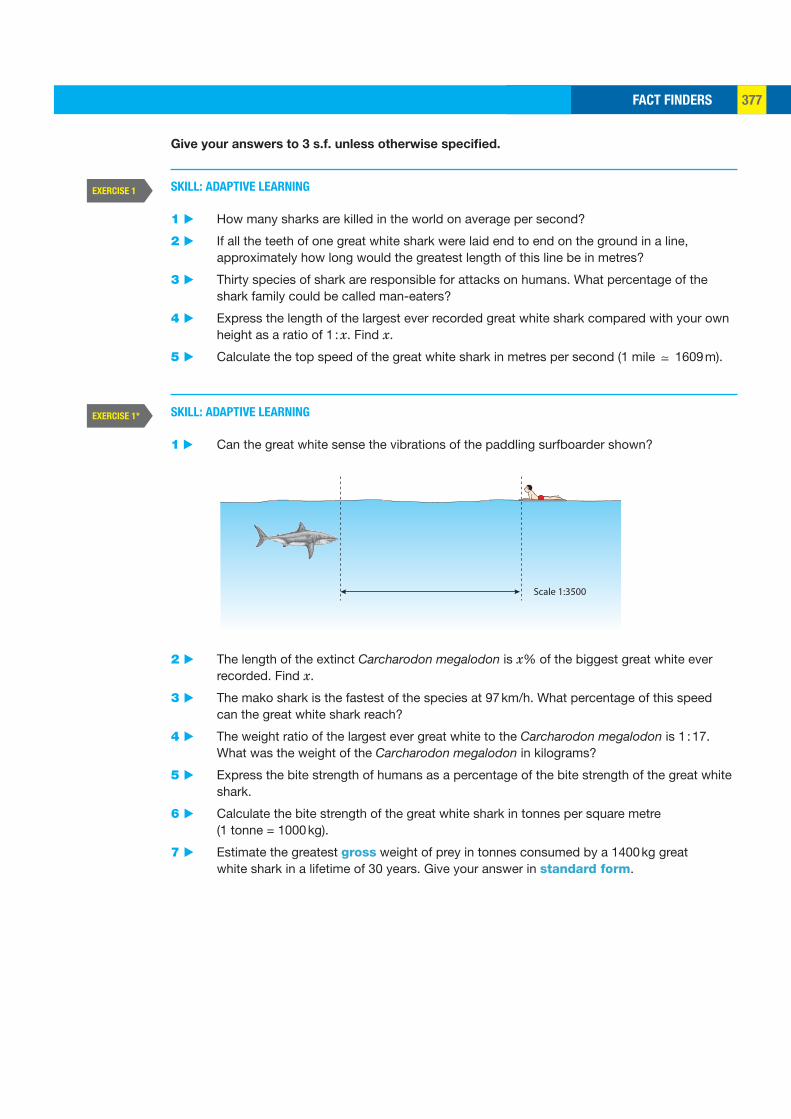
FACT FINDERS 377
EXERCISE 1
EXERCISE 1*
Scale 1:3500
Give your answers to 3 s.f. unless otherwise specified.
SKILL: ADAPTIVE LEARNING
1 ▶ How many sharks are killed in the world on average per second?
2 ▶ If all the teeth of one great white shark were laid end to end on the ground in a line, approximately how long would the greatest length of this line be in metres?
3 ▶ Thirty species of shark are responsible for attacks on humans. What percentage of the shark family could be called man-eaters?
4 ▶ Express the length of the largest ever recorded great white shark compared with your own height as a ratio of 1 : x. Find x.
5 ▶ Calculate the top speed of the great white shark in metres per second (1 mile 1609 m).
SKILL: ADAPTIVE LEARNING
1 ▶ Can the great white sense the vibrations of the paddling surfboarder shown?
2 ▶ The length of the extinct Carcharodon megalodon is x% of the biggest great white ever recorded. Find x.
3 ▶ The mako shark is the fastest of the species at 97 km/h. What percentage of this speed can the great white shark reach?
4 ▶ The weight ratio of the largest ever great white to the Carcharodon megalodon is 1 : 17. What was the weight of the Carcharodon megalodon in kilograms?
5 ▶ Express the bite strength of humans as a percentage of the bite strength of the great white shark.
6 ▶ Calculate the bite strength of the great white shark in tonnes per square metre (1 tonne = 1000 kg).
7 ▶ Estimate the greatest gross weight of prey in tonnes consumed by a 1400 kg great white shark in a lifetime of 30 years. Give your answer in standard form.
FACT FINDERS378
The Opening Ceremony of the London 2012 Olympic Games took place in the Olympic Stadium which was full to its capacity of 80 000. The cost of this single event was £28 million. The Games lasted 19 days and the final cost of the entire Games was £11.3 billion.
10 568 athletes came from across the world; 5892 of the athletes were men. The majority of them slept and ate in the Olympic Village, which was home to 17 000 competitors for the duration of the Games. Over this period, the competitors consumed 19 tonnes of eggs.
Worldwide interest was enormous with an estimated 4 billion people watching the events across the globe via 350 miles of broadcasting cable.
The total area of London used for the Olympic Park was 2.5 km2 and it was planted with 3000 trees.
The Games had many superb performances, but two World Records caught the public imagination: Usain Bolt’s time of 9.58 s in the 100 m and David Rudisha’s 1 min 40.91 s in the 800 m. More World Records were broken at these Games than any other Games.
Source: Based on data from The Telegraph (UK)
CATEGORY NUMBER OF WORLD RECORDS
Swimming 8
Athletics 4
Weight Lifting 5
Cycling 4
Shooting 3
Archery 2
Rowing 1
LONDON 2012 OLYMPIC GAMES MEDAL TABLE
RANK BY GOLD COUNTRY GOLD SILVER BRONZE POPULATION (MILLIONS)
1 USA 46 29 9 314
2 China 38 27 23 1350
3 UK 29 17 19 61
4 Russia 24 26 32 143
5 South Korea 13 8 7 50
6 Germany 11 19 14 80
7 France 11 11 12 53
8 Italy 8 9 11 51
9 Hungary 8 4 5 10
10 Australia 7 16 12 23
FACT FINDER: LONDON 2012 OLYMPIC GAMES
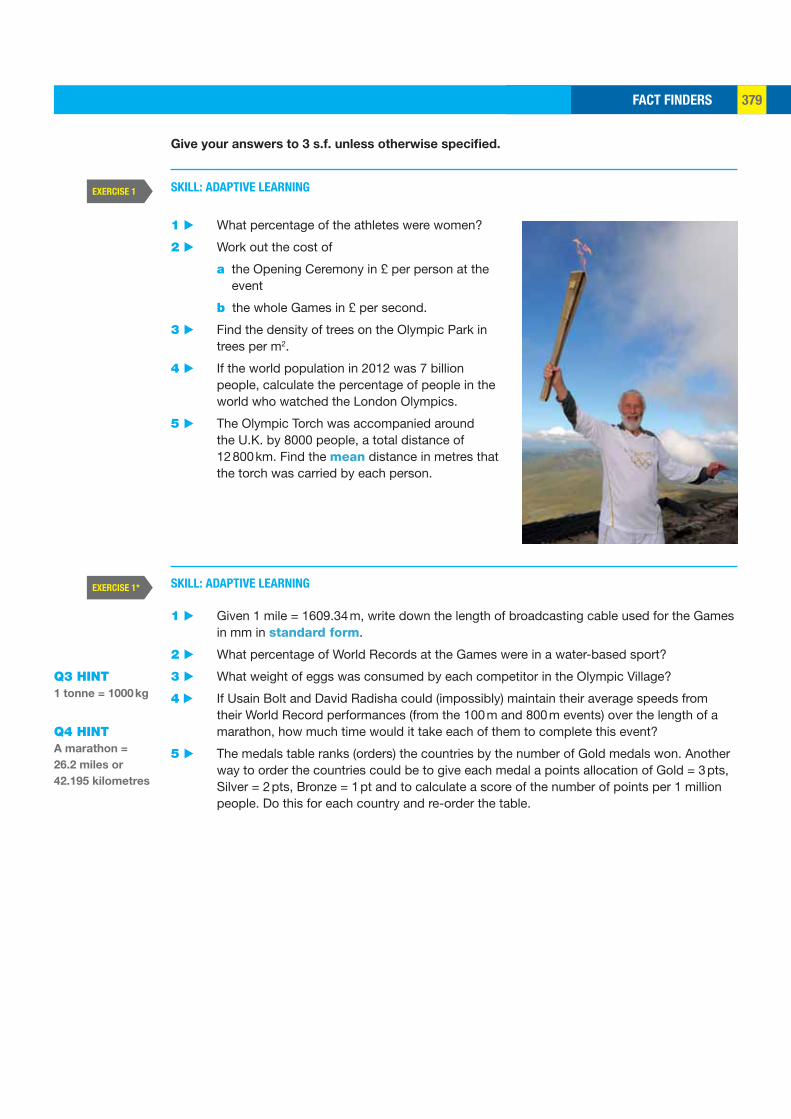
FACT FINDERS 379
EXERCISE 1
EXERCISE 1*
Give your answers to 3 s.f. unless otherwise specified.
SKILL: ADAPTIVE LEARNING
1 ▶ What percentage of the athletes were women?
2 ▶ Work out the cost of
a the Opening Ceremony in £ per person at the event
b the whole Games in £ per second.
3 ▶ Find the density of trees on the Olympic Park in trees per m2.
4 ▶ If the world population in 2012 was 7 billion people, calculate the percentage of people in the world who watched the London Olympics.
5 ▶ The Olympic Torch was accompanied around the U.K. by 8000 people, a total distance of 12 800 km. Find the mean distance in metres that the torch was carried by each person.
SKILL: ADAPTIVE LEARNING
1 ▶ Given 1 mile = 1609.34 m, write down the length of broadcasting cable used for the Games in mm in standard form.
2 ▶ What percentage of World Records at the Games were in a water-based sport?
3 ▶ What weight of eggs was consumed by each competitor in the Olympic Village?
4 ▶ If Usain Bolt and David Radisha could (impossibly) maintain their average speeds from their World Record performances (from the 100 m and 800 m events) over the length of a marathon, how much time would it take each of them to complete this event?
5 ▶ The medals table ranks (orders) the countries by the number of Gold medals won. Another way to order the countries could be to give each medal a points allocation of Gold = 3 pts, Silver = 2 pts, Bronze = 1 pt and to calculate a score of the number of points per 1 million people. Do this for each country and re-order the table.
Q3 HINT1 tonne = 1000 kg
Q4 HINTA marathon =
26.2 miles or
42.195 kilometres
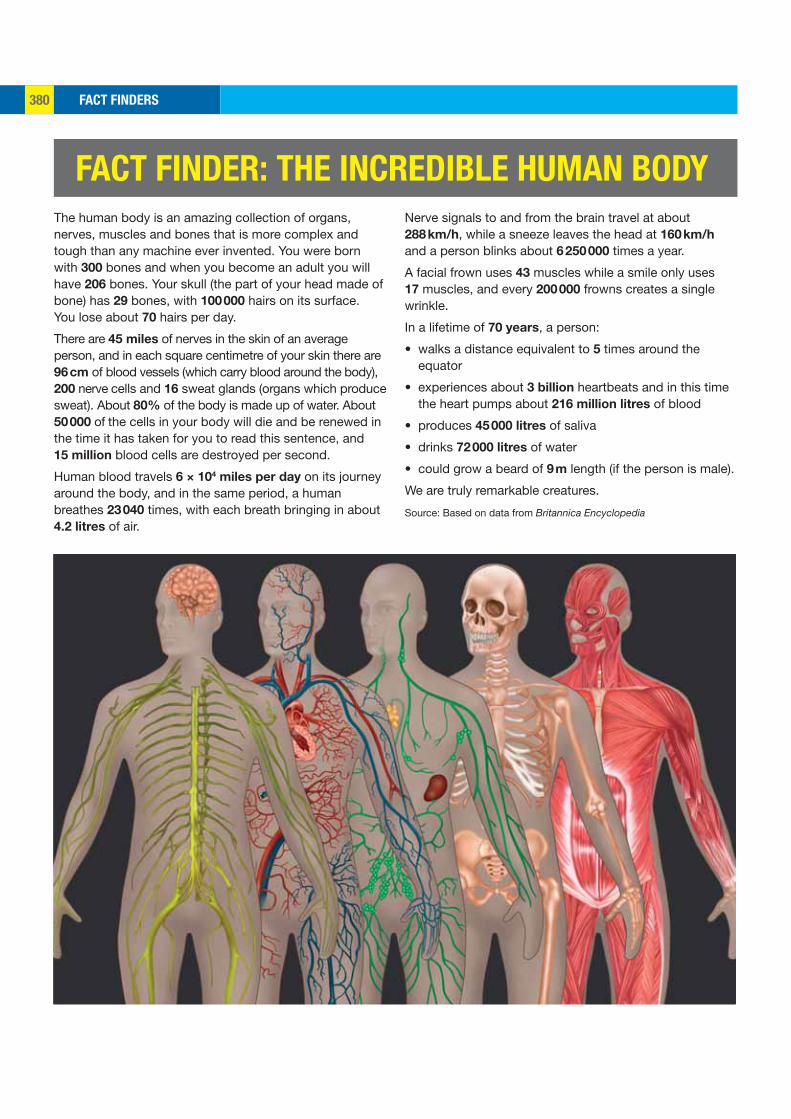
FACT FINDERS380
The human body is an amazing collection of organs, nerves, muscles and bones that is more complex and tough than any machine ever invented. You were born with 300 bones and when you become an adult you will have 206 bones. Your skull (the part of your head made of bone) has 29 bones, with 100 000 hairs on its surface. You lose about 70 hairs per day.
There are 45 miles of nerves in the skin of an average person, and in each square centimetre of your skin there are 96 cm of blood vessels (which carry blood around the body), 200 nerve cells and 16 sweat glands (organs which produce sweat). About 80% of the body is made up of water. About 50 000 of the cells in your body will die and be renewed in the time it has taken for you to read this sentence, and 15 million blood cells are destroyed per second.
Human blood travels 6 × 10⁴ miles per day on its journey around the body, and in the same period, a human breathes 23 040 times, with each breath bringing in about 4.2 litres of air.
Nerve signals to and from the brain travel at about 288 km/h, while a sneeze leaves the head at 160 km/h and a person blinks about 6 250 000 times a year.
A facial frown uses 43 muscles while a smile only uses 17 muscles, and every 200 000 frowns creates a single wrinkle.
In a lifetime of 70 years, a person:
• walks a distance equivalent to 5 times around the equator
• experiences about 3 billion heartbeats and in this time the heart pumps about 216 million litres of blood
• produces 45 000 litres of saliva
• drinks 72 000 litres of water
• could grow a beard of 9 m length (if the person is male).
We are truly remarkable creatures.
Source: Based on data from Britannica Encyclopedia
FACT FINDER: THE INCREDIBLE HUMAN BODY

FACT FINDERS 381
EXERCISE 1
EXERCISE 1*
Give your answers to 3 s.f. unless otherwise specified.
SKILL: ADAPTIVE LEARNING
1 ▶ What percentage of your bones as an adult are in your skull?
2 ▶ How many muscle movements are used to create 100 wrinkles (lines on your skin)?
3 ▶ Find the number of litres of blood that go around the human body per minute.
4 ▶ How many blinks will occur in a classroom of 20 children in a one-hour lesson?
5 ▶ A male can grow hair on his face from the age of 18 years. Find the speed of growth of a beard in mm per second, expressed in standard form.
SKILL: ADAPTIVE LEARNING
1 ▶ Calculate the average heart rate of a human in beats per minute.
2 ▶ Given that the radius of the Earth is 6370 km, calculate the average speed, in m/s, that a human walks in a lifetime.
3 ▶ A glass of water is 250 cm3. How many glasses does a human drink per day on average?
4 ▶ Calculate the volume of air breathed by a human in mm3 in a lifetime of 70 years, expressed in standard form. Compare this to a rectangular classroom of dimensions 10 m × 8 m × 3 m.
5 ▶ A Maths teacher, Mr Quixote, is drawn to a scale of 1 : 60.
a If he stubs (hurts) his toe, how many seconds will it take before he feels any pain?
b Mr Quixote has an unusual reaction to stubbing his toe; he sneezes once his brain registers the event. Unfortunately Mr Quixote has a bad cold.
Jose is sitting 1 m away and he knows his teacher’s reaction to pain in his toe. He can move away in 0.05 s from the moment Mr Quixote stubs his toe.
Is Jose likely to catch a cold?
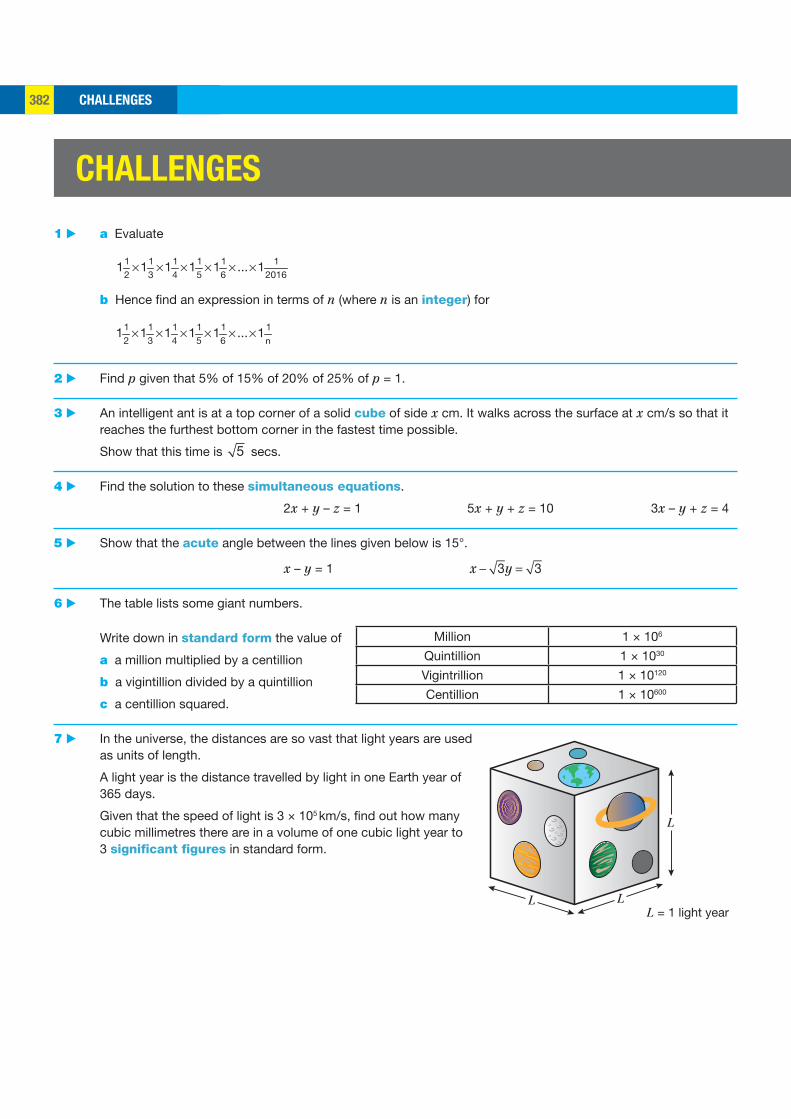
CHALLENGES382
L = 1 light year
L
L L
1 ▶ a Evaluate
× × × × × ×1 1 1 1 1 1
2 3 4 5 6 20161 1 1 1 1 ... 1
b Hence find an expression in terms of n (where n is an integer) for
× × × × × ×1 1 1 1 1 1
2 3 4 5 61 1 1 1 1 ... 1
n
2 ▶ Find p given that 5% of 15% of 20% of 25% of p = 1.
3 ▶ An intelligent ant is at a top corner of a solid cube of side x cm. It walks across the surface at x cm/s so that it reaches the furthest bottom corner in the fastest time possible.
Show that this time is 5 secs.
4 ▶ Find the solution to these simultaneous equations.
2x + y – z = 1 5x + y + z = 10 3x – y + z = 4
5 ▶ Show that the acute angle between the lines given below is 15°.
x – y = 1 x 3y 3
6 ▶ The table lists some giant numbers.
Write down in standard form the value of
a a million multiplied by a centillion
b a vigintillion divided by a quintillion
c a centillion squared.
7 ▶ In the universe, the distances are so vast that light years are used as units of length.
A light year is the distance travelled by light in one Earth year of 365 days.
Given that the speed of light is 3 × 10⁵ km/s, find out how many cubic millimetres there are in a volume of one cubic light year to 3 significant figures in standard form.
Million 1 × 10⁶
Quintillion 1 × 1030
Vigintrillion 1 × 10120
Centillion 1 × 10600
CHALLENGES
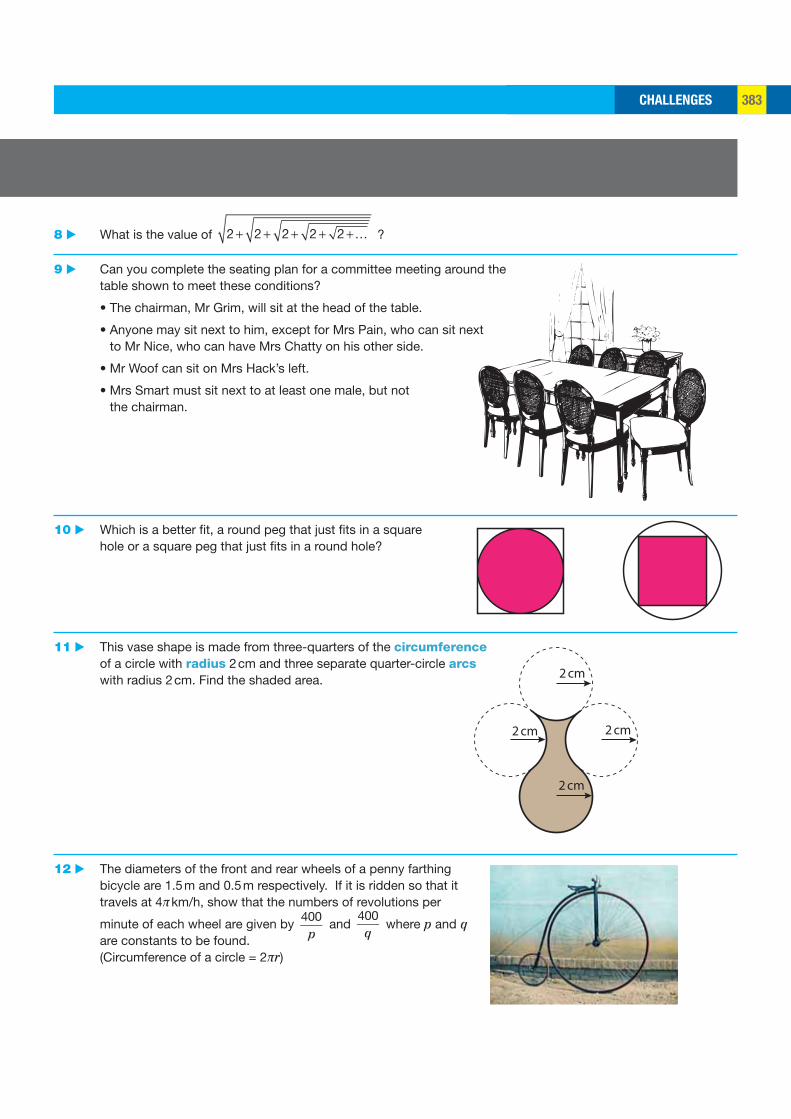
CHALLENGES 383
2 cm
2 cm
2 cm
2 cm
8 ▶ What is the value of 2 2 2 2 2 … ?
9 ▶ Can you complete the seating plan for a committee meeting around the table shown to meet these conditions?
• The chairman, Mr Grim, will sit at the head of the table.
• Anyone may sit next to him, except for Mrs Pain, who can sit next to Mr Nice, who can have Mrs Chatty on his other side.
• Mr Woof can sit on Mrs Hack’s left.
• Mrs Smart must sit next to at least one male, but not the chairman.
10 ▶ Which is a better fit, a round peg that just fits in a square hole or a square peg that just fits in a round hole?
11 ▶ This vase shape is made from three-quarters of the circumference of a circle with radius 2 cm and three separate quarter-circle arcs with radius 2 cm. Find the shaded area.
12 ▶ The diameters of the front and rear wheels of a penny farthing bicycle are 1.5 m and 0.5 m respectively. If it is ridden so that it travels at 4π km/h, show that the numbers of revolutions per
minute of each wheel are given by
400p
and 400q
where p and q are constants to be found. (Circumference of a circle = 2πr)
GLOSSARY384
MATHS A GLOSSARY TERMSacute angle (noun) an angle that is less than 90o
acute triangle (noun) a triangle that has all angles less than 90o
adjacent (adjective) next to
adjacent angles (noun) (plural) angles that share a common side and a common vertex (= corner point)
alternate angles (noun) (plural) two equal angles formed on opposite sides and at opposite ends of a line that crosses two parallel lines
angle of depression (noun) the angle measured downwards from the horizontal
angle of elevation (noun) the angle measured upwards from the horizontal
anomaly (noun) (plural anomalies) something that is noticeable because it is different from what is usual
appreciate (verb) to gain value over time
arc (noun) part of a curve or circle
axis of symmetry (noun) (or line of symmetry) a line through a shape such that each side is a mirror image of the other
bar chart (noun) a diagram using rectangles of equal width (bars) whose heights represent an amount or quantity
bearing (noun) an angle measured clockwise from north, used to describe a direction
bisect (verb) to divide something into two equal parts
bisector (noun) a straight line that divides an angle or another line into two equal parts
cancel down (verb) to simplify a fraction by dividing the numerator (= top number) and denominator (= bottom number) by the same number (a common factor)
chord (noun) a straight line joining two points on a curve
circumference (noun) the total distance around a circle
class (noun) a group of data in a collection of grouped data
clear (verb) to remove fractions in an equation by multiplying both sides of the equation by the lowest common denominator
common denominator (noun) a number that can be divided exactly by all the denominators (= bottom numbers) in a set of fractions
common factor (noun) a number (a factor) that two or more other numbers can be exactly divided by; for example, 2 is a common factor of 4, 6 and 8
compasses (noun) a V-shaped instrument with one sharp point and a pencil at the other end used for drawing circles
complement (noun) the complement of a set is all those members (objects) which are not in that set but which are in the universal set (all members being considered)
compound interest (noun) interest is the extra money that you must pay back when you borrow money or money paid to you by a bank or financial institution when you keep money in an account there; compound interest is calculated on both the sum of money lent or borrowed or saved and on the unpaid interest already earned or charged
consecutive (adjective) numbers follow each other in order, with no gaps, from smallest to largest
correct to (adjective) accurate to; a number given correct to ‘…’ has been rounded, e.g. 3.592 is 3.6 correct to 1 decimal place and 3.59 correct to 2 decimal places
corresponding angles (noun) (plural) two equal angles that are formed when a line crosses two parallel lines; each angle is on the same side of the two parallel lines and on the same side of the line which they cross
cross-section (noun) something that has been cut in half so that you can look at the inside, or a drawing of this
cube (noun) a solid object that has 6 identical square faces (= flat surfaces)
cuboid (noun) a solid object that has 6 rectangular faces (= flat surfaces)
cumulative frequency (noun) the total of all the frequencies of a set of data up to any particular group of data; a ‘running total’ of the frequencies
decimal place (or d.p.) (noun) the position of a digit to the right of a decimal point
degree mode (noun) the angle mode setting on a scientific calculator
degree of accuracy (noun) tells you how accurate a number is; a number could be given to ‘…’ decimal places or ‘…’ significant figures
GLOSSARY 385
denominator (noun) the number below the line in a fraction
depreciate (verb) to lose value over time
diameter (noun) a straight line passing through the centre of a circle and joining two points that lie on the circle; a chord that passes through the centre of a circle
dispersion (noun) a measure of the way in which a set of data is spread out
dodecahedron (noun) a solid object that has 12 faces (= flat surfaces) which each have 5 edges
end-point (noun) the upper class boundary of a class of grouped data
equidistant (adjective) at an equal distance from two places or points
equilateral triangle (noun) a triangle whose 3 sides are all the same length and all the angles are 60°
expand (an expression) (verb) to multiply out brackets (= remove brackets)
exterior angle (noun) the angle formed outside a polygon between any one edge and the extended adjacent edge
face (noun) the flat surface of a solid object
factor (noun) a number that divides exactly into another number
factorise (verb) to put an expression into brackets; the reverse of expand
frequency polygon (noun) a diagram joining the mid-points of the tops of the bars of a bar chart with straight lines; frequency is on the vertical axis and the mid-points for each group are on the horizontal axis
gradient (noun) the measure of the slope of a straight line relative to the horizontal; for a straight line
gradient = changein the y coordinates
changein the x coordinates
'rise'
'run'=
gross (adjective) before any deductions; a gross weight is the total weight of something
hypotenuse (noun) the longest side of a right-angled
triangle; it is the side opposite the right angle
icosahedron (noun) a solid object that has 20 faces (= flat surfaces) which each have 3 edges
improper fraction (noun) a fraction such as 1078
in
which the numerator (= top number) is larger than the denominator (= bottom number)
indices (noun) (plural) (singular index) (= powers) a number which tells you how many times to multiply the given number or term by itself; for example, the 2 in 42 is the index
inequality (noun) (plural inequalities) an expression containing one or more of the symbols <, >, ≤ or ≥
integer (noun) a whole number
intercept (noun) the point on a graph where the graph crosses an axis
interior angle (noun) an angle formed inside a polygon between two adjacent edges
inter-quartile range (noun) the difference between the upper and lower quartiles of a set of data
intersect (verb) if two lines intersect, they meet or cross over each other
inverse (noun) opposite in effect or the reverse of; for example, addition (+) is the inverse of subtraction (−)
inverted (adjective) in the opposite position to the one it was in before, often turned upside down (= the bottom is on the top and the top is on the bottom)
isosceles triangle (noun) a triangle with two equal sides and two equal angles
like terms (noun) terms whose variables (such as x or y) and powers (such as 2 or 3) are exactly the same; for example, 2x and 5x are like terms, and 4x2 and 2x2 are like terms
linear simultaneous equations (noun) two equations, whose graphs are straight lines, that are solved together to find two unknowns
long division (noun) a method of dividing one large number by another
lower bound (noun) the value half a unit less than the rounded measurement
map (noun) the connection from one set to another
map (verb) to translate, reflect or rotate a shape so that it fits (maps) onto another shape exactly
mass (noun) a measure of how much matter is in an object
mean (noun) the numerical value found by adding together all the separate values of a data set and dividing by how many pieces of data there are
median (noun) the middle value of a set of values that have been arranged in size order
mid-point (noun) a point that is halfway along the line segment joining two points
GLOSSARY386
mixed number (noun) a number that consists of a whole
number and a fraction; for example 14
7
modal class (noun) the class of grouped data which has the highest frequency
mode (noun) the piece of data that occurs most often in a set of data
multiple (of a number) (noun) is the product of that number and an integer (whole number)
multiply out (verb) (= expand) to remove brackets; to multiply out a bracket, multiply each term inside the bracket by the term outside the bracket; to multiply out double brackets, multiply each term in one bracket by each term in the other bracket
multiplying factor (noun) a number which multiplies another number
numerator (noun) the number above the line in a fraction;
for example 5 is the numerator in 56
obtuse angle (noun) an angle that is greater than 90° but less than 180°
obtuse triangle (noun) a triangle that has an angle greater than 90°
octahedron (noun) a solid object that has 8 faces (= flat surfaces) which each have 3 edges
parabola (noun) a special curve, shaped like an arch (or upside-down arch); the path of an object that is thrown into the air follows a curve of this shape
parallelogram (noun) a flat shape with 4 sides (= a quadrilateral) in which opposite sides are parallel and the same length
percentile (noun) one of 100 equal groups into which a data set can be divided
perimeter (noun) the total distance around the edge of a shape
perpendicular (adjective) if one line is perpendicular to another line, they form an angle of 90o (= a right angle)
pictogram (noun) a diagram that shows numbers or amounts in the form of pictures or symbols
pie chart (noun) a diagram in which a circle is divided from its centre into sectors (parts) to show how the total is split up between the different categories
polygon (noun) a flat shape with 3 or more straight sides
power (noun) (= index) the small number written to the right and above another number
prime factor (noun) a factor that is a prime number
prime number (noun) a number that can only be divided by 1 and itself; for example, 3 and 7 are prime numbers
product (noun) the number you get by multiplying two or more numbers
protractor (noun) an instrument for measuring and drawing angles
quadratic curve (noun) another name for a parabola
quadratic equation (or quadratic) (noun) an equation where the highest power of x is 2; for example 3x2 + 5x – 4 = 0
quadratic graph (noun) the graph of a quadratic equation of the form y = ax2 + bx + c where a, b and c are numbers and the highest power of x is 2; its shape is that of a parabola
quadrilateral (noun) a flat shape with 4 straight sides
quartile (noun) each of 4 equal groups into which a data set can be divided
radius (noun) (plural radii) the distance from the centre to the curve which makes a circle; any straight line from the centre to the curve
random (adjective) happening or chosen by chance; a result is random if each possible result has the same chance of happening, and a selection is random if each object (or number) has the same chance of being chosen
range (noun) the difference between the lowest and highest values of a set of data
rate (noun) a fixed price paid or charged for something
rate (of change) (noun) how fast something changes over a period of time
rate (of inflation) (noun) percentage increase in the price of goods and services
ratio (noun) a ratio shows the relative sizes of two or more quantities
reading (noun) a value taken or found from a graph
reflex angle (noun) an angle that is greater than 180°
relative frequency (noun) (or experimental probability) an estimate of probability based on experimental data; it is how often something happens divided by the total number of trials (= experiments)
resultant vector (noun) a vector that is equivalent to two or more other vectors
retardation (noun) (= deceleration) the process of slowing down
GLOSSARY 387
rhombus (noun) a flat shape with 4 equal sides (= a quadrilateral) in which opposite sides are parallel and opposite angles are equal
right angle (noun) an angle that is 90° exactly
right-angled triangle (noun) a triangle that has a right
angle (= 90°)
rotational symmetry (noun) the symmetry of a shape which can be turned and fitted onto itself within one full turn
round (verb) to alter an exact figure to one that is less exact
sample (noun) a small set of objects chosen from a larger set of objects which is examined to find out something about the larger set
satisfy (verb) to make an equation or an inequality true
scale (noun) a set of marks with regular spaces between them on the axes of a graph
scale (noun) a ratio such as 1 : 100 which shows the relationship between a length on a drawing or map and the actual length in real life
to scale (adjective) a uniform reduction or increase in size (according to a scale)
scale factor (noun) the scale factor of an enlargement is the number of times by which each original length has been multiplied
segment (noun) the part of a circle that is separated from the rest of the circle when you draw a straight line across it
set (noun) a collection of objects (numbers, letters, symbols, etc.)
sign (noun) a mathematical symbol such as +, −, ×, ÷
significant figure (or s.f.) (noun) each of the digits of a number that are used to express it to the required accuracy, starting from the first non-zero digit from the left-hand end of the number
similar triangles (noun) two triangles are similar if they are the same in shape but different in size
simplify (an expression) (verb) to collect all like terms so the expression is a collection of terms connected by + and – signs
simplify (a fraction) (verb) to divide the numerator (= top number) and denominator (= bottom number) by the same number (a common factor)
simultaneous equations (noun) two equations that are solved together to find two unknowns
sketch (verb) to make a rough drawing of a diagram, graph or shape
sketch (noun) a rough drawing of a diagram or graph which gives a general idea of the shape or relationship, or a rough drawing of a shape showing angles and lengths
standard form (noun) a number is written in standard form when it is expressed as A × 10n where A is always between 1 and 10 and n is a positive or negative integer
subset (noun) a collection of objects (= set) which contains part of another set
subtended angle (noun) (in a circle) an angle in which the arms start and finish at the ends of an arc
successive transformations (noun) a combination of transformations (translation, reflection, rotation or enlargement) performed on a shape, followed one after another
sum (noun) the total resulting from the addition of two or more numbers, amounts or items
sum (verb) to add two or more numbers or amounts together
tangent (noun) a straight line that touches a curve at one point only
tetrahedron (noun) a solid object that has 4 faces (= flat surfaces) which each have 3 edges
trapezium (noun) (British English) a flat shape with 4 sides (= a quadrilateral) where one pair of opposite sides are parallel
trial (noun) an experiment (carried out a number of times to estimate the probability of an event)
upper bound (noun) the value half a unit greater than the rounded measurement
variable (noun) a letter such as x or y in a term, expression, formula or equation whose value can vary; a letter used to represent an unknown quantity to solve a problem using an equation(s)
vector (column) (noun) a vector such as ⎛ ⎞⎜ ⎟⎝ ⎠
3
8 used
to describe a translation; the top number gives the movement parallel to the horizontal axis (to the right or left); the bottom number gives the movement parallel to the vertical axis (up or down)
vertices (noun) (plural) (singular vertex) points where two or more edges meet (a corner)
working (noun) a record of the calculations made when solving a problem
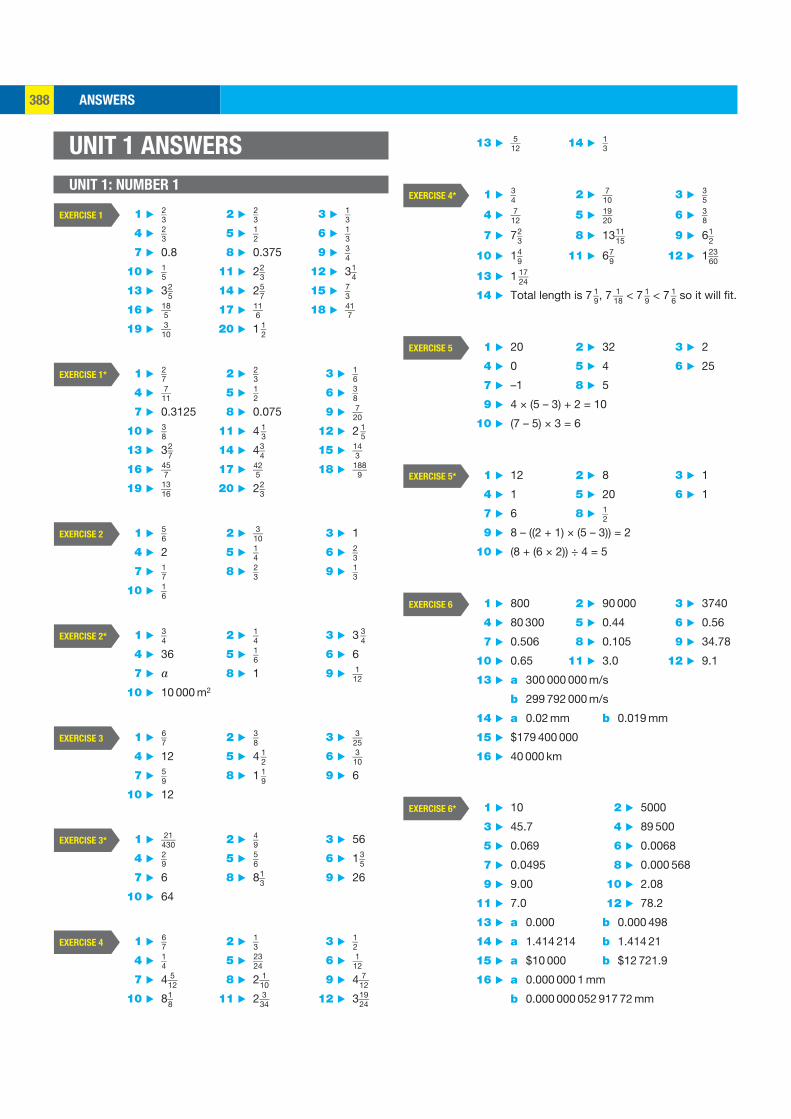
ANSWERS388
13 ▶ 5 __ 12 14 ▶ 1 _ 3
1 ▶ 3 _ 4 2 ▶ 7 __ 10 3 ▶ 3 _ 5
4 ▶ 7 __ 12 5 ▶ 19 __ 20 6 ▶ 3 _ 8
7 ▶ 7 2 _ 3 8 ▶ 13 11 __ 15 9 ▶ 6 1 _ 2
10 ▶ 1 4 _ 9 11 ▶ 6 7 _ 9 12 ▶ 1 23 __ 60
13 ▶ 1 17 __ 24
14 ▶ Total length is 7 1 _ 9 , 7 1 __ 18 < 7 1 _ 9 < 7 1 _ 6 so it will fit.
1 ▶ 20 2 ▶ 32 3 ▶ 2
4 ▶ 0 5 ▶ 4 6 ▶ 25
7 ▶ –1 8 ▶ 5
9 ▶ 4 × (5 – 3) + 2 = 10
10 ▶ (7 – 5) × 3 = 6
1 ▶ 12 2 ▶ 8 3 ▶ 1
4 ▶ 1 5 ▶ 20 6 ▶ 1
7 ▶ 6 8 ▶ 1 _ 2
9 ▶ 8 – ((2 + 1) × (5 – 3)) = 2
10 ▶ (8 + (6 × 2)) ÷ 4 = 5
1 ▶ 800 2 ▶ 90 000 3 ▶ 3740
4 ▶ 80 300 5 ▶ 0.44 6 ▶ 0.56
7 ▶ 0.506 8 ▶ 0.105 9 ▶ 34.78
10 ▶ 0.65 11 ▶ 3.0 12 ▶ 9.1
13 ▶ a 300 000 000 m/s
b 299 792 000 m/s
14 ▶ a 0.02 mm b 0.019 mm
15 ▶ $179 400 000
16 ▶ 40 000 km
1 ▶ 10 2 ▶ 5000
3 ▶ 45.7 4 ▶ 89 500
5 ▶ 0.069 6 ▶ 0.0068
7 ▶ 0.0495 8 ▶ 0.000 568
9 ▶ 9.00 10 ▶ 2.08
11 ▶ 7.0 12 ▶ 78.2
13 ▶ a 0.000 b 0.000 498
14 ▶ a 1.414 214 b 1.414 21
15 ▶ a $10 000 b $12 721.9
16 ▶ a 0.000 000 1 mm
b 0.000 000 052 917 72 mm
EXERCISE 4*
EXERCISE 5
EXERCISE 5*
EXERCISE 6
EXERCISE 6*
UNIT 1 ANSWERS
UNIT 1: NUMBER 1
1 ▶ 2 _ 3 2 ▶ 2 _ 3 3 ▶ 1 _ 3
4 ▶ 2 _ 3 5 ▶ 1 _ 2 6 ▶ 1 _ 3
7 ▶ 0.8 8 ▶ 0.375 9 ▶ 3 _ 4
10 ▶ 1 _ 5 11 ▶ 2 2 _ 3 12 ▶ 3 1 _ 4
13 ▶ 3 2 _ 5 14 ▶ 2 5 _ 7 15 ▶ 7 _ 3
16 ▶ 18 __ 5 17 ▶ 11 __ 6 18 ▶ 41 __ 7
19 ▶ 3 __ 10 20 ▶ 1 1 _ 2
1 ▶ 2 _ 7 2 ▶ 2 _ 3 3 ▶ 1 _ 6
4 ▶ 7 __ 11 5 ▶ 1 _ 2 6 ▶ 3 _ 8
7 ▶ 0.3125 8 ▶ 0.075 9 ▶ 7 __ 20
10 ▶ 3 _ 8 11 ▶ 4 1 _ 3 12 ▶ 2 1 _ 5
13 ▶ 3 2 _ 7 14 ▶ 4 3 _ 4 15 ▶ 14 __ 3
16 ▶ 45 __ 7 17 ▶ 42 __ 5 18 ▶ 188 ___ 9
19 ▶ 13 __ 16 20 ▶ 2 2 _ 3
1 ▶ 5 _ 6 2 ▶ 3 __ 10 3 ▶ 1
4 ▶ 2 5 ▶ 1 _ 4 6 ▶ 2 _ 3
7 ▶ 1 _ 7 8 ▶ 2 _ 3 9 ▶ 1 _ 3
10 ▶ 1 _ 6
1 ▶ 3 _ 4 2 ▶ 1 _ 4 3 ▶ 3 3 _ 4
4 ▶ 36 5 ▶ 1 _ 6 6 ▶ 6
7 ▶ a 8 ▶ 1 9 ▶ 1 __ 12
10 ▶ 10 000 m2
1 ▶ 6 _ 7 2 ▶ 3 _ 8 3 ▶ 3 __ 25
4 ▶ 12 5 ▶ 4 1 _ 2 6 ▶ 3 __ 10
7 ▶ 5 _ 9 8 ▶ 1 1 _ 9 9 ▶ 6
10 ▶ 12
1 ▶ 21 ___ 430 2 ▶ 4 _ 9 3 ▶ 56
4 ▶ 2 _ 9 5 ▶ 5 _ 6 6 ▶ 1 3 _ 5
7 ▶ 6 8 ▶ 8 1 _ 3 9 ▶ 26
10 ▶ 64
1 ▶ 6 _ 7 2 ▶ 1 _ 3 3 ▶ 1 _ 2
4 ▶ 1 _ 4 5 ▶ 23 __ 24 6 ▶ 1 __ 12
7 ▶ 4 5 __ 12 8 ▶ 2 1 __ 10 9 ▶ 4 7 __ 12
10 ▶ 8 1 _ 8 11 ▶ 2 3 __ 34 12 ▶ 3 19 __ 24
EXERCISE 1
EXERCISE 1*
EXERCISE 2
EXERCISE 2*
EXERCISE 3
EXERCISE 3*
EXERCISE 4
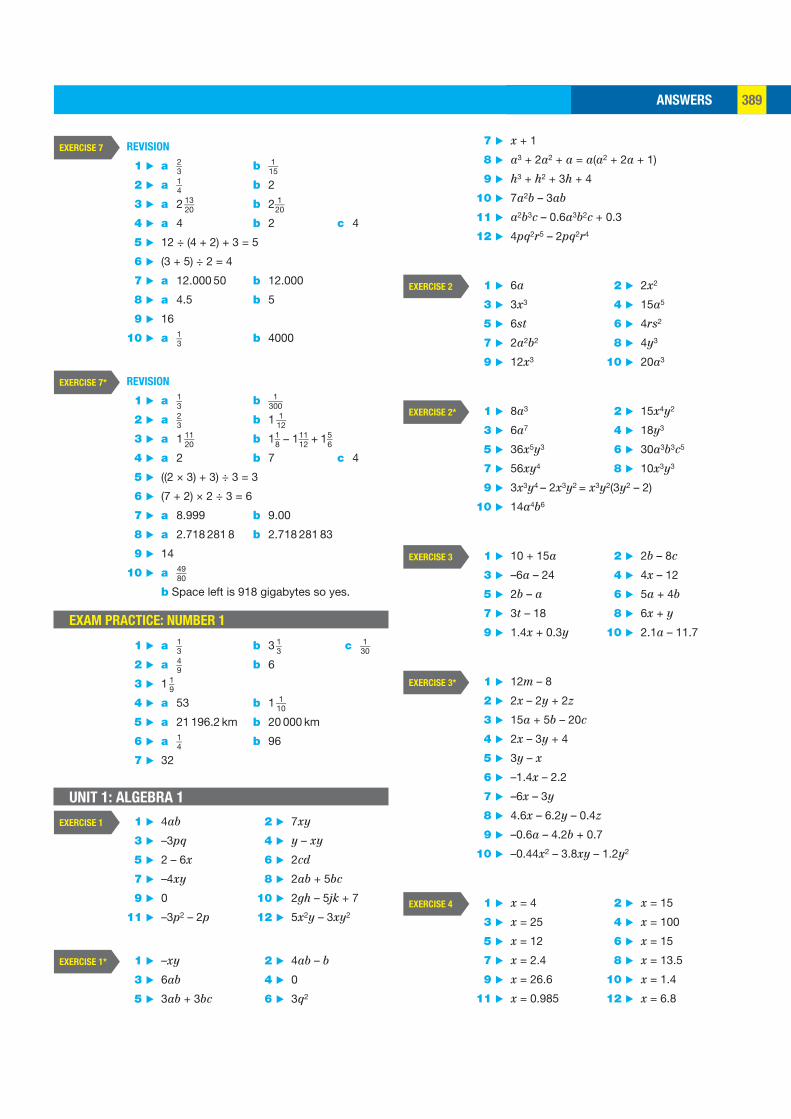
ANSWERS 389
7 ▶ x + 1
8 ▶ a3 + 2a2 + a = a(a2 + 2a + 1)
9 ▶ h3 + h2 + 3h + 4
10 ▶ 7a2b – 3ab
11 ▶ a2b3c – 0.6a3b2c + 0.3
12 ▶ 4pq2r5 – 2pq2r4
1 ▶ 6a 2 ▶ 2x2
3 ▶ 3x3 4 ▶ 15a5
5 ▶ 6st 6 ▶ 4rs2
7 ▶ 2a2b2 8 ▶ 4y3
9 ▶ 12x3 10 ▶ 20a3
1 ▶ 8a3 2 ▶ 15x4y2
3 ▶ 6a7 4 ▶ 18y3
5 ▶ 36x5y3 6 ▶ 30a3b3c5
7 ▶ 56xy4 8 ▶ 10x3y3
9 ▶ 3x3y4 – 2x3y2 = x3y2(3y2 – 2)
10 ▶ 14a4b6
1 ▶ 10 + 15a 2 ▶ 2b – 8c
3 ▶ –6a – 24 4 ▶ 4x – 12
5 ▶ 2b – a 6 ▶ 5a + 4b
7 ▶ 3t – 18 8 ▶ 6x + y
9 ▶ 1.4x + 0.3y 10 ▶ 2.1a – 11.7
1 ▶ 12m – 8
2 ▶ 2x – 2y + 2z
3 ▶ 15a + 5b – 20c
4 ▶ 2x – 3y + 4
5 ▶ 3y – x
6 ▶ –1.4x – 2.2
7 ▶ –6x – 3y
8 ▶ 4.6x – 6.2y – 0.4z
9 ▶ –0.6a – 4.2b + 0.7
10 ▶ –0.44x2 – 3.8xy – 1.2y2
1 ▶ x = 4 2 ▶ x = 15
3 ▶ x = 25 4 ▶ x = 100
5 ▶ x = 12 6 ▶ x = 15
7 ▶ x = 2.4 8 ▶ x = 13.5
9 ▶ x = 26.6 10 ▶ x = 1.4
11 ▶ x = 0.985 12 ▶ x = 6.8
EXERCISE 2
EXERCISE 2*
EXERCISE 3
EXERCISE 3*
EXERCISE 4
REVISION
1 ▶ a 2 _ 3 b 1 __ 15
2 ▶ a 1 _ 4 b 2
3 ▶ a 2 13 __ 20 b 2 1 __ 20
4 ▶ a 4 b 2 c 4
5 ▶ 12 ÷ (4 + 2) + 3 = 5
6 ▶ (3 + 5) ÷ 2 = 4
7 ▶ a 12.000 50 b 12.000
8 ▶ a 4.5 b 5
9 ▶ 16
10 ▶ a 1 _ 3 b 4000
REVISION
1 ▶ a 1 _ 3 b 1 ___ 300
2 ▶ a 2 _ 3 b 1 1 __ 12
3 ▶ a 1 11 __ 20 b 1 1 _ 8 − 1 11 __ 12 + 1 5 _ 6
4 ▶ a 2 b 7 c 4
5 ▶ ((2 × 3) + 3) ÷ 3 = 3
6 ▶ (7 + 2) × 2 ÷ 3 = 6
7 ▶ a 8.999 b 9.00
8 ▶ a 2.718 281 8 b 2.718 281 83
9 ▶ 14
10 ▶ a 49 __ 80
b Space left is 918 gigabytes so yes.
EXAM PRACTICE: NUMBER 1
1 ▶ a 1 _ 3 b 3 1 _ 3 c 1 __ 30
2 ▶ a 4 _ 9 b 6
3 ▶ 1 1 _ 9
4 ▶ a 53 b 1 1 __ 10
5 ▶ a 21 196.2 km b 20 000 km
6 ▶ a 1 _ 4 b 96
7 ▶ 32
UNIT 1: ALGEBRA 1
1 ▶ 4ab 2 ▶ 7xy
3 ▶ –3pq 4 ▶ y – xy
5 ▶ 2 – 6x 6 ▶ 2cd
7 ▶ –4xy 8 ▶ 2ab + 5bc
9 ▶ 0 10 ▶ 2gh – 5jk + 7
11 ▶ –3p2 – 2p 12 ▶ 5x2y – 3xy2
1 ▶ –xy 2 ▶ 4ab – b
3 ▶ 6ab 4 ▶ 0
5 ▶ 3ab + 3bc 6 ▶ 3q2
EXERCISE 7
EXERCISE 7*
EXERCISE 1
EXERCISE 1*
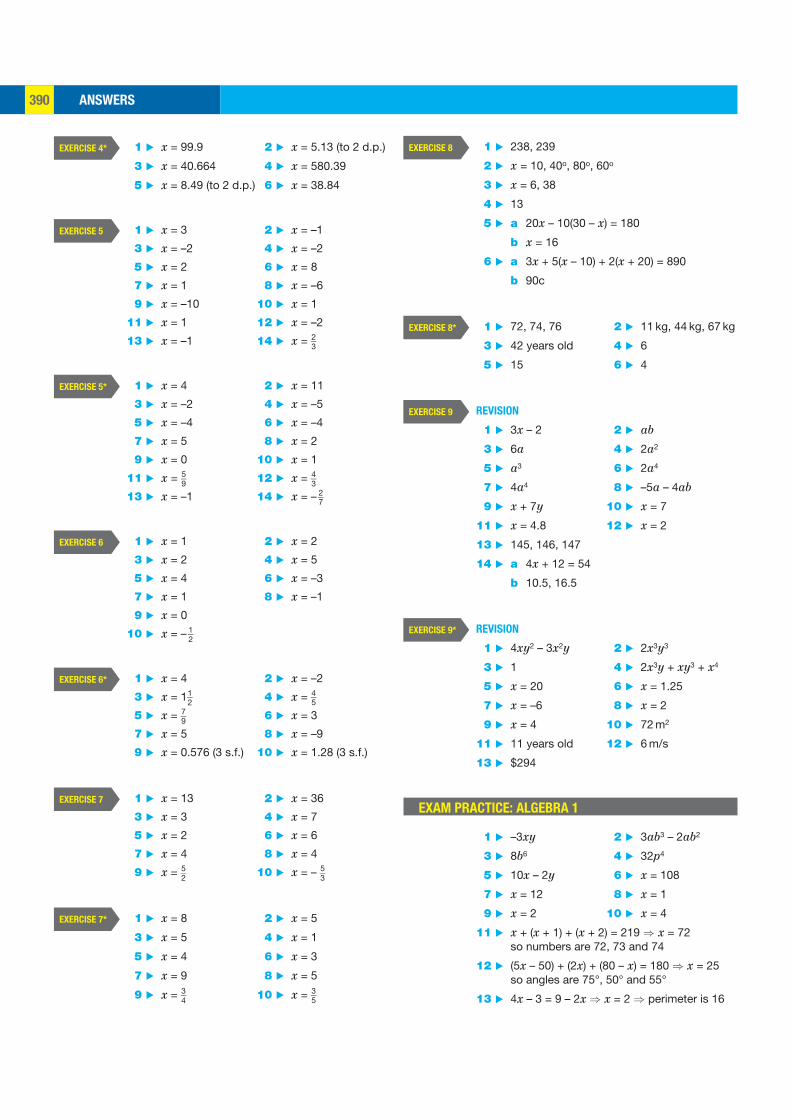
ANSWERS390
1 ▶ 238, 239
2 ▶ x = 10, 40o, 80o, 60o
3 ▶ x = 6, 38
4 ▶ 13
5 ▶ a 20x – 10(30 – x) = 180
b x = 16
6 ▶ a 3x + 5(x – 10) + 2(x + 20) = 890
b 90c
1 ▶ 72, 74, 76 2 ▶ 11 kg, 44 kg, 67 kg
3 ▶ 42 years old 4 ▶ 6
5 ▶ 15 6 ▶ 4
REVISION
1 ▶ 3x – 2 2 ▶ ab
3 ▶ 6a 4 ▶ 2a2
5 ▶ a3 6 ▶ 2a4
7 ▶ 4a4 8 ▶ –5a – 4ab
9 ▶ x + 7y 10 ▶ x = 7
11 ▶ x = 4.8 12 ▶ x = 2
13 ▶ 145, 146, 147
14 ▶ a 4x + 12 = 54
b 10.5, 16.5
REVISION
1 ▶ 4xy2 – 3x2y 2 ▶ 2x3y3
3 ▶ 1 4 ▶ 2x3y + xy3 + x4
5 ▶ x = 20 6 ▶ x = 1.25
7 ▶ x = –6 8 ▶ x = 2
9 ▶ x = 4 10 ▶ 72 m2
11 ▶ 11 years old 12 ▶ 6 m/s
13 ▶ $294
EXAM PRACTICE: ALGEBRA 1
1 ▶ –3xy 2 ▶ 3ab3 – 2ab2
3 ▶ 8b6 4 ▶ 32p4
5 ▶ 10x – 2y 6 ▶ x = 108
7 ▶ x = 12 8 ▶ x = 1
9 ▶ x = 2 10 ▶ x = 4
11 ▶ x + (x + 1) + (x + 2) = 219 ⇒ x = 72 so numbers are 72, 73 and 74
12 ▶ (5x – 50) + (2x) + (80 – x) = 180 ⇒ x = 25 so angles are 75°, 50° and 55°
13 ▶ 4x – 3 = 9 – 2x ⇒ x = 2 ⇒ perimeter is 16
EXERCISE 8
EXERCISE 8*
EXERCISE 9
EXERCISE 9*
1 ▶ x = 99.9 2 ▶ x = 5.13 (to 2 d.p.)
3 ▶ x = 40.664 4 ▶ x = 580.39
5 ▶ x = 8.49 (to 2 d.p.) 6 ▶ x = 38.84
1 ▶ x = 3 2 ▶ x = –1
3 ▶ x = –2 4 ▶ x = –2
5 ▶ x = 2 6 ▶ x = 8
7 ▶ x = 1 8 ▶ x = –6
9 ▶ x = –10 10 ▶ x = 1
11 ▶ x = 1 12 ▶ x = –2
13 ▶ x = –1 14 ▶ x = 2 _ 3
1 ▶ x = 4 2 ▶ x = 11
3 ▶ x = –2 4 ▶ x = –5
5 ▶ x = –4 6 ▶ x = –4
7 ▶ x = 5 8 ▶ x = 2
9 ▶ x = 0 10 ▶ x = 1
11 ▶ x = 5 _ 9 12 ▶ x = 4 _ 3
13 ▶ x = –1 14 ▶ x = – 2 _ 7
1 ▶ x = 1 2 ▶ x = 2
3 ▶ x = 2 4 ▶ x = 5
5 ▶ x = 4 6 ▶ x = –3
7 ▶ x = 1 8 ▶ x = –1
9 ▶ x = 0
10 ▶ x = – 1 _ 2
1 ▶ x = 4 2 ▶ x = –2
3 ▶ x = 1 1 _ 2 4 ▶ x = 4 _ 5
5 ▶ x = 7 _ 9 6 ▶ x = 3
7 ▶ x = 5 8 ▶ x = –9
9 ▶ x = 0.576 (3 s.f.) 10 ▶ x = 1.28 (3 s.f.)
1 ▶ x = 13 2 ▶ x = 36
3 ▶ x = 3 4 ▶ x = 7
5 ▶ x = 2 6 ▶ x = 6
7 ▶ x = 4 8 ▶ x = 4
9 ▶ x = 5 _ 2 10 ▶ x = – 5 _ 3
1 ▶ x = 8 2 ▶ x = 5
3 ▶ x = 5 4 ▶ x = 1
5 ▶ x = 4 6 ▶ x = 3
7 ▶ x = 9 8 ▶ x = 5
9 ▶ x = 3 _ 4 10 ▶ x = 3 _ 5
EXERCISE 4*
EXERCISE 5
EXERCISE 5*
EXERCISE 6
EXERCISE 6*
EXERCISE 7
EXERCISE 7*

ANSWERS 391
3 ▶ a
x
y
2 4 6 8 10Extension (cm)
Wei
ght (
g)
12 14 16 18 20
1
2
3
4
5
6
7
8
9
10
11
0
b (i) 9.5 g (ii) 8 cm
c 1998 cm, outside validity range
4 ▶ a
t
y
1 2 3 4 5Time (years)
Hei
ght (
m)
6 7 8 9 10
1
2
3
4
5
6
7
8
9
10
0
b (i) 1 m and 2.5 m (ii) 5 years
c t = 20 years, outside validity range
5 ▶ a
t
d
5 10 15 20 25Days
Dep
th o
f wat
er (m
)
30
123456789
10
0
b (i) 2.5 m (ii) 10 December
c t ≈ 33.3 days, outside validity range
UNIT 1: GRAPHS 1
1 ▶ 1 2 ▶ –0.5
3 ▶ 3 4 ▶ 1 _ 4
5 ▶ − 1 _ 4 6 ▶ 2
7 ▶ –1 8 ▶ 3 m
9 ▶ 10 km 10 ▶ 2.325 m
11 ▶ 2 m
12 ▶ a 14 m b 1 __ 30
1 ▶ 3 _ 8
2 ▶ − 6 _ 7
3 ▶ 0.5
4 ▶ –3
5 ▶ 652
6 ▶ a –2 b 159 m
7 ▶ a 1 _ 6 cm b 0.1 cm
8 ▶ a 4 m b 8.2 m
9 ▶ No, the gradients between pairs of points are different.
10 ▶ s − q
_____ r − p
11 ▶ p = –2
12 ▶ q = 2.5
13 ▶ 26 m
1 ▶ a x –2 –1 0 1 2 3
y –7 –5 –3 –1 1 3
b
x
y
1–1–2 2 3
1
0–1
–2
–3
–4
–5
–6
–7
2
3
c Gradient = 2, y-intercept = –3
d –1.8; reading from a graph is not exact
2 ▶ a y = 4x – 2
b y = –3x + 5
c y = 2x + 3 and y = 2x – 4
EXERCISE 1
EXERCISE 1*
EXERCISE 2

ANSWERS392
3 ▶ a C = 40t + 60
b
Time (days)
Vite-Voitures
Cos
t of c
ar h
ire (€
)
1 2 3 4 5 6 7
40
80
120
160
200
240
280
320
360
t
C
0
c (i) €300 (ii) 3 days
4 ▶ a V = –1.5x + 9
b
1 2 3 4 5
1
2
3
4
5
6
7
8
9
10
x
V
0
c (i) $525 (ii) 4 years
d 6 years
5 ▶ a Zenith: V = –5x + 25
Bubble: V = –2x + 10
b
Years
Val
ue (£
thou
sand
s)
x
V
1 2
9
Zenith
Bubble
3 4 5
5
10
15
20
25
0
c (i) 5 years, £0 (ii) 2 years, £9000
6 ▶ a
t1 2 3 4 5
Time (hours)
Tem
pera
ture
(°C
)
6
5
0
–5
–10
10
15
20T
b (i) 15°C (ii) 3:45pm, 5pm
c –15°C, outside validity range
1 ▶ a x –2 0 2 4
y = 1 _ 2 x + 1 0 1 2 3
y = 1 _ 2 x – 2 –3 –2 –1 0
b
x
y
1–1–2 2 3 4
1
0–1
–2
–3
–4
2
3
4
c For y = 1 _ 2 x + 1 gradient = 1 _ 2 ,
y-intercept = 1; for y = 1 _ 2 x – 2
gradient = 1 _ 2 , y-intercept = –2
d No, they are parallel lines.
2 ▶ a
b (i) 34 000 (ii) 8 June
c 59 000
EXERCISE 2*
t
N
1 2 3 4 5Time (days)
Pop
ulat
ion
of m
osqu
itoes
(thou
sand
s)
6 7 8 9 10
32
30
34
36
38
40
42
44
46
48
50
0
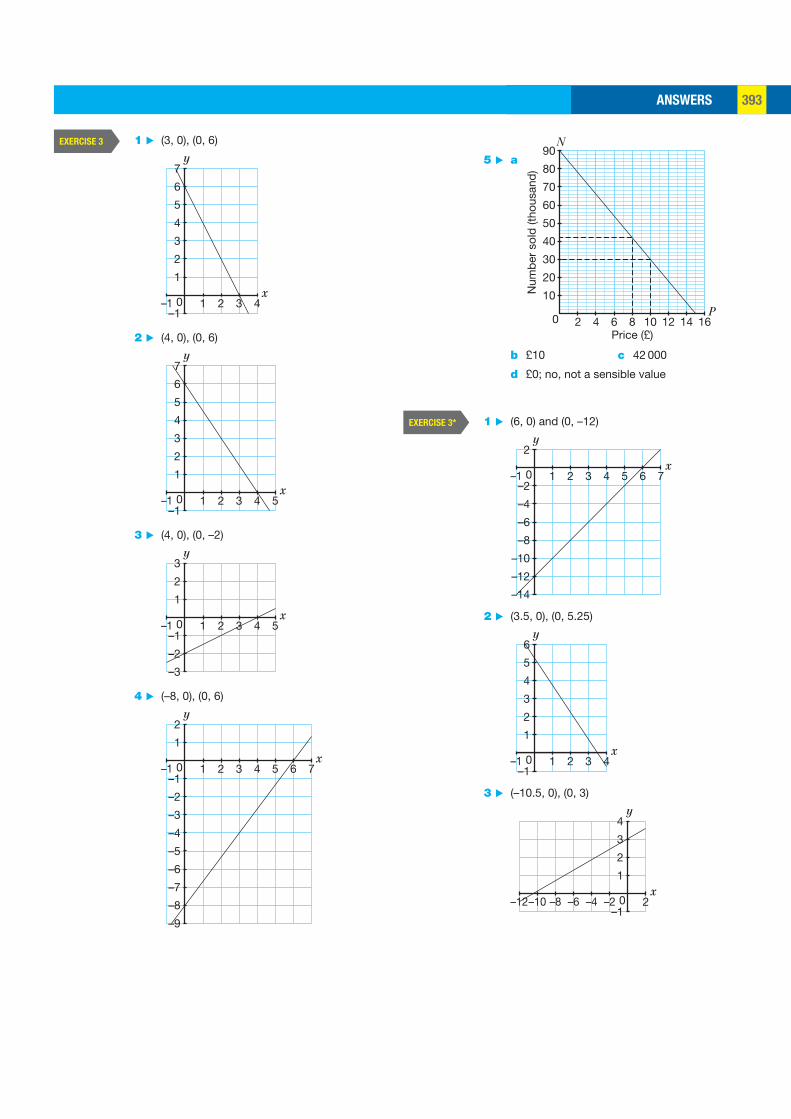
ANSWERS 393
5 ▶ a
P
N
Price (£)
Num
ber
sold
(tho
usan
d)
2 4 6 8 10 12 14 16
10
20
30
40
50
60
70
80
90
0
b £10 c 42 000
d £0; no, not a sensible value
1 ▶ (6, 0) and (0, –12)
y2
0x
1–1 2 3 4 5 6 7–2
–4
–6
–8
–10
–12
–14
2 ▶ (3.5, 0), (0, 5.25)
y
2
3
4
5
6
0x
1–1 2 3 4
1
–1
3 ▶ (–10.5, 0), (0, 3)
y
2
3
4
0x
–2–4–6–8–10–12 2
1
–1
EXERCISE 3*
1 ▶ (3, 0), (0, 6)
2
3
4
5
6
7
0x
1–1 2 3 4
1
–1
y
2 ▶ (4, 0), (0, 6)
2
3
4
5
6
7
0x
1–1 2 3 4 5
1
–1
y
3 ▶ (4, 0), (0, –2)
2
3
0x
1–1 2 3 4 5
1
–1
–2
–3
y
4 ▶ (–8, 0), (0, 6)
2
0x
1–1 2 3 4 5 6 7
1
–1
–2
–3
–4
–5
–6
–7
–8
–9
y
EXERCISE 3
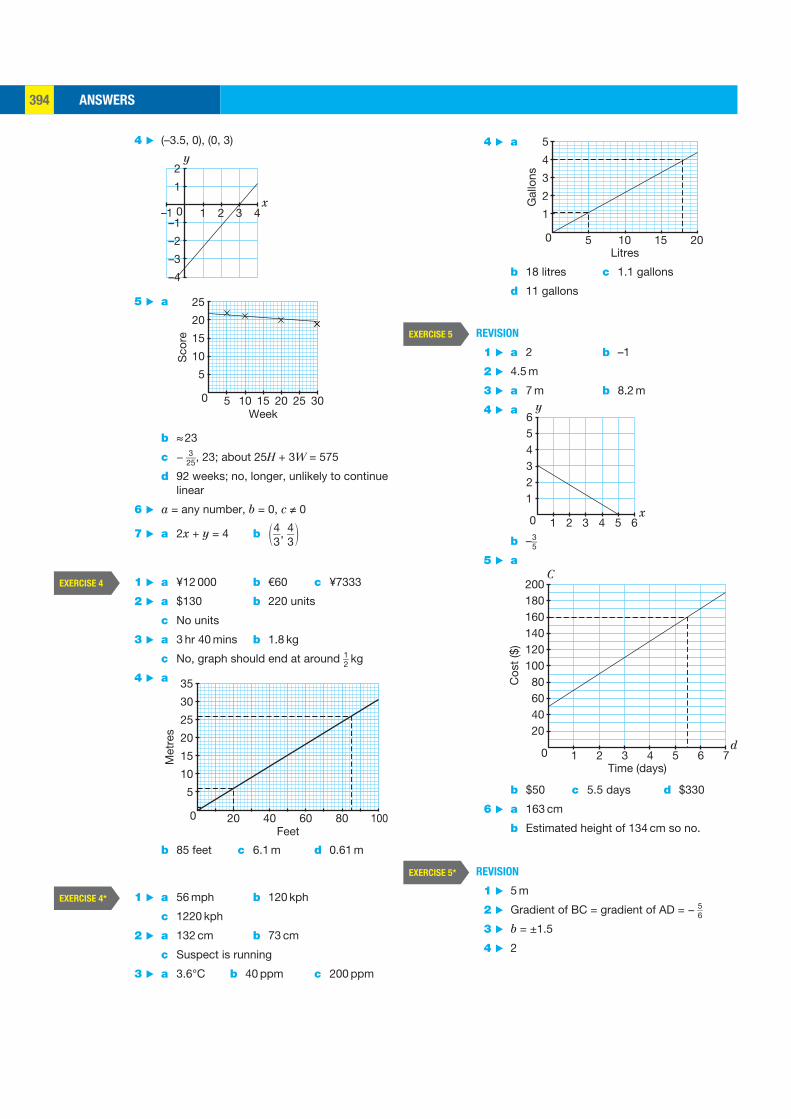
ANSWERS394
4 ▶ a
Litres
Gal
lons
5 10 15 20
1
2
3
4
5
0
b 18 litres c 1.1 gallons
d 11 gallons
REVISION
1 ▶ a 2 b –1
2 ▶ 4.5 m
3 ▶ a 7 m b 8.2 m
4 ▶ a
123456
1 2 3 4 5 6x
y
0
b – 3 _ 5
5 ▶ a
20406080
100120140160180200
1 2 3 4 5 6 7d
C
Time (days)
Cos
t ($)
0
b $50 c 5.5 days d $330
6 ▶ a 163 cm
b Estimated height of 134 cm so no.
REVISION
1 ▶ 5 m
2 ▶ Gradient of BC = gradient of AD = − 5 _ 6
3 ▶ b = ±1.5
4 ▶ 2
EXERCISE 5
EXERCISE 5*
4 ▶ (–3.5, 0), (0, 3)
2
0x
1–1 2 3 4
1
–1
–2
–3
–4
y
5 ▶ a
Sco
re
Week
5
10
15
20
25
5 10 15 20 25 300
b ≈ 23
c − 3 __ 25 , 23; about 25H + 3W = 575
d 92 weeks; no, longer, unlikely to continue linear
6 ▶ a = any number, b = 0, c ≠ 0
7 ▶ a 2x + y = 4 b ( 4 __ 3
, 4 __ 3
)
1 ▶ a ¥12 000 b €60 c ¥7333
2 ▶ a $130 b 220 units
c No units
3 ▶ a 3 hr 40 mins b 1.8 kg
c No, graph should end at around 1 _ 2 kg
4 ▶ a
b 85 feet c 6.1 m d 0.61 m
1 ▶ a 56 mph b 120 kph
c 1220 kph
2 ▶ a 132 cm b 73 cm
c Suspect is running
3 ▶ a 3.6°C b 40 ppm c 200 ppm
EXERCISE 4
Feet
Met
res
20 40 60 80 100
5
10
15
20
25
30
35
0
EXERCISE 4*
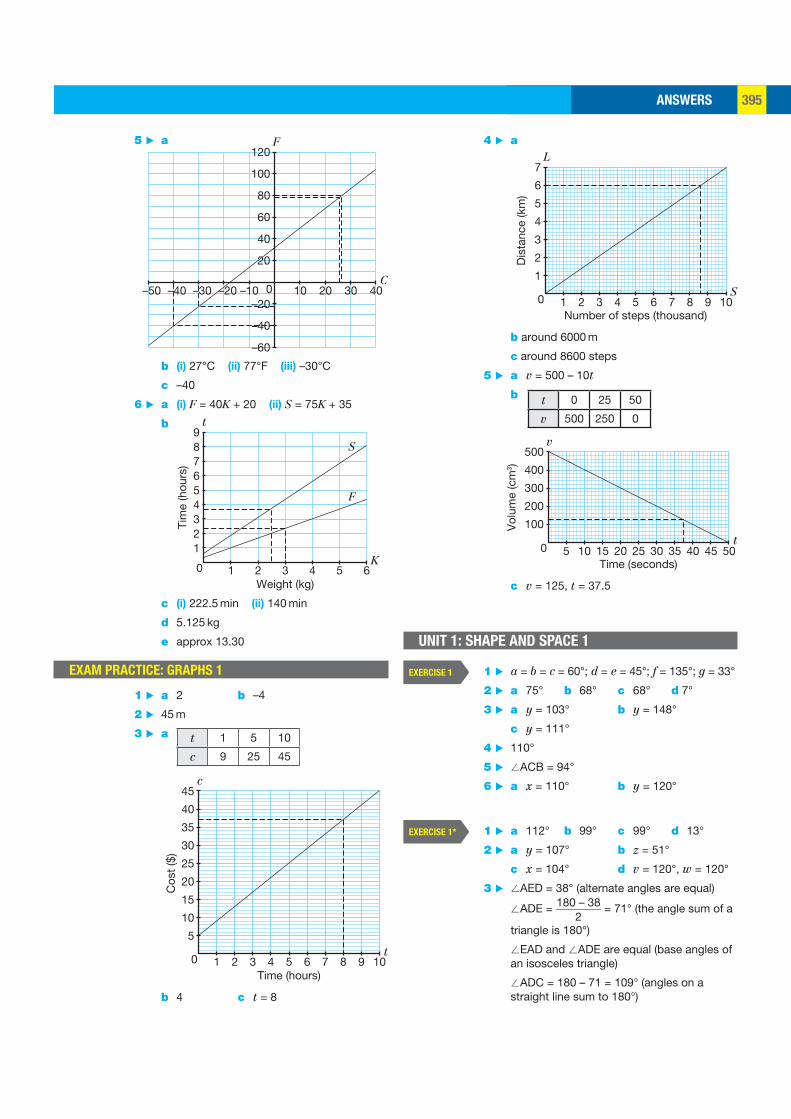
ANSWERS 395
4 ▶ a
Dis
tanc
e (k
m)
L
Number of steps (thousand)
S1
2
3
4
5
6
7
1 2 3 4 5 6 7 8 9 100
b around 6000 m
c around 8600 steps
5 ▶ a v = 500 – 10t
b
Vol
ume
(cm
3 )
v
Time (seconds)
t100
200
300
400
500
5 10 15 20 25 30 35 40 45 500
c v = 125, t = 37.5
UNIT 1: SHAPE AND SPACE 1
1 ▶ a = b = c = 60°; d = e = 45°; f = 135°; g = 33°
2 ▶ a 75° b 68° c 68° d 7°
3 ▶ a y = 103° b y = 148°
c y = 111°
4 ▶ 110°
5 ▶ /ACB = 94°
6 ▶ a x = 110° b y = 120°
1 ▶ a 112° b 99° c 99° d 13°
2 ▶ a y = 107° b z = 51°
c x = 104° d v = 120°, w = 120°
3 ▶ /AED = 38° (alternate angles are equal)
/ADE = 180 – 38 ________ 2
= 71° (the angle sum of a
triangle is 180°)
/EAD and /ADE are equal (base angles of an isosceles triangle)
/ADC = 180 – 71 = 109° (angles on a straight line sum to 180°)
t 0 25 50
v 500 250 0
EXERCISE 1
EXERCISE 1*
5 ▶ a
b (i) 27°C (ii) 77°F (iii) –30°C
c –40
6 ▶ a (i) F = 40K + 20 (ii) S = 75K + 35
b
Tim
e (h
ours
)
Weight (kg)
F
S
K
t
123456789
1 2 3 4 5 60
c (i) 222.5 min (ii) 140 min
d 5.125 kg
e approx 13.30
EXAM PRACTICE: GRAPHS 1
1 ▶ a 2 b –4
2 ▶ 45 m
3 ▶ a
Cos
t ($)
c
Time (hours)
t5
10
15
20
25
30
35
40
45
1 2 3 4 5 6 7 8 9 100
b 4 c t = 8
C
F
10–10–20–30–40–50 20 30 40
20
0–20
–40
–60
40
60
80
100
120
t 1 5 10
c 9 25 45
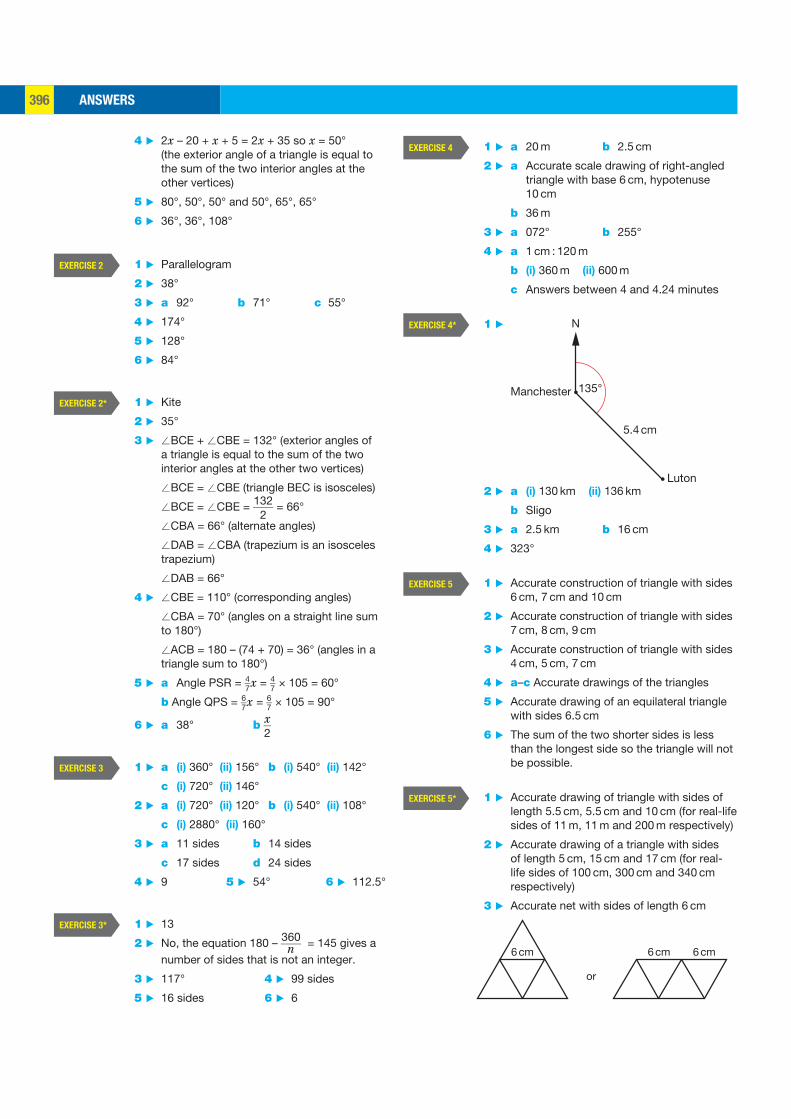
ANSWERS396
1 ▶ a 20 m b 2.5 cm
2 ▶ a Accurate scale drawing of right-angled triangle with base 6 cm, hypotenuse 10 cm
b 36 m
3 ▶ a 072° b 255°
4 ▶ a 1 cm : 120 m
b (i) 360 m (ii) 600 m
c Answers between 4 and 4.24 minutes
1 ▶
5.4 cm
Manchester
Luton
135°
N
2 ▶ a (i) 130 km (ii) 136 km
b Sligo
3 ▶ a 2.5 km b 16 cm
4 ▶ 323°
1 ▶ Accurate construction of triangle with sides 6 cm, 7 cm and 10 cm
2 ▶ Accurate construction of triangle with sides 7 cm, 8 cm, 9 cm
3 ▶ Accurate construction of triangle with sides 4 cm, 5 cm, 7 cm
4 ▶ a–c Accurate drawings of the triangles
5 ▶ Accurate drawing of an equilateral triangle with sides 6.5 cm
6 ▶ The sum of the two shorter sides is less than the longest side so the triangle will not be possible.
1 ▶ Accurate drawing of triangle with sides of length 5.5 cm, 5.5 cm and 10 cm (for real-life sides of 11 m, 11 m and 200 m respectively)
2 ▶ Accurate drawing of a triangle with sides of length 5 cm, 15 cm and 17 cm (for real-life sides of 100 cm, 300 cm and 340 cm respectively)
3 ▶ Accurate net with sides of length 6 cm
6 cm 6 cm
or
6 cm
EXERCISE 4
EXERCISE 4*
EXERCISE 5
EXERCISE 5*
4 ▶ 2x – 20 + x + 5 = 2x + 35 so x = 50° (the exterior angle of a triangle is equal to the sum of the two interior angles at the other vertices)
5 ▶ 80°, 50°, 50° and 50°, 65°, 65°
6 ▶ 36°, 36°, 108°
1 ▶ Parallelogram
2 ▶ 38°
3 ▶ a 92° b 71° c 55°
4 ▶ 174°
5 ▶ 128°
6 ▶ 84°
1 ▶ Kite
2 ▶ 35°
3 ▶ /BCE + /CBE = 132° (exterior angles of a triangle is equal to the sum of the two interior angles at the other two vertices)
/BCE = /CBE (triangle BEC is isosceles)
/BCE = /CBE = 132 ____ 2
= 66°
/CBA = 66° (alternate angles)
/DAB = /CBA (trapezium is an isosceles trapezium)
/DAB = 66°
4 ▶ /CBE = 110° (corresponding angles)
/CBA = 70° (angles on a straight line sum to 180°)
/ACB = 180 – (74 + 70) = 36° (angles in a triangle sum to 180°)
5 ▶ a Angle PSR = 4 _ 7 x = 4 _ 7 × 105 = 60°
b Angle QPS = 6 _ 7 x = 6 _ 7 × 105 = 90°
6 ▶ a 38° b x __ 2
1 ▶ a (i) 360° (ii) 156° b (i) 540° (ii) 142°
c (i) 720° (ii) 146°
2 ▶ a (i) 720° (ii) 120° b (i) 540° (ii) 108°
c (i) 2880° (ii) 160°
3 ▶ a 11 sides b 14 sides
c 17 sides d 24 sides
4 ▶ 9 5 ▶ 54° 6 ▶ 112.5°
1 ▶ 13
2 ▶ No, the equation 180 – 360 ____ n = 145 gives a number of sides that is not an integer.
3 ▶ 117° 4 ▶ 99 sides
5 ▶ 16 sides 6 ▶ 6
EXERCISE 2
EXERCISE 2*
EXERCISE 3
EXERCISE 3*
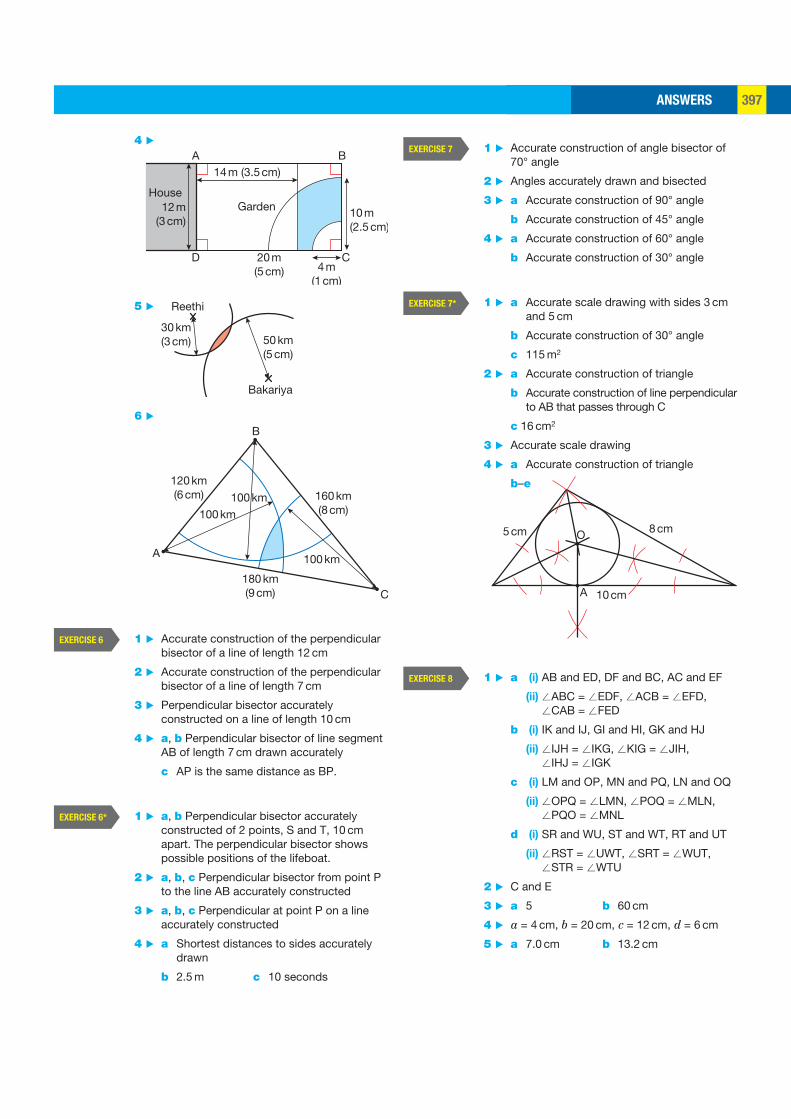
ANSWERS 397
1 ▶ Accurate construction of angle bisector of 70° angle
2 ▶ Angles accurately drawn and bisected
3 ▶ a Accurate construction of 90° angle
b Accurate construction of 45° angle
4 ▶ a Accurate construction of 60° angle
b Accurate construction of 30° angle
1 ▶ a Accurate scale drawing with sides 3 cm and 5 cm
b Accurate construction of 30° angle
c 115 m2
2 ▶ a Accurate construction of triangle
b Accurate construction of line perpendicular to AB that passes through C
c 16 cm2
3 ▶ Accurate scale drawing
4 ▶ a Accurate construction of triangle
b–e
8 cm5 cm
10 cmA
O
1 ▶ a i(i) AB and ED, DF and BC, AC and EF
(ii) /ABC = /EDF, /ACB = /EFD, /CAB = /FED
b i(i) IK and IJ, GI and HI, GK and HJ
(ii) /IJH = /IKG, /KIG = /JIH, /IHJ = /IGK
c i(i) LM and OP, MN and PQ, LN and OQ
(ii) /OPQ = /LMN, /POQ = /MLN, /PQO = /MNL
d i(i) SR and WU, ST and WT, RT and UT
(ii) /RST = /UWT, /SRT = /WUT, /STR = /WTU
2 ▶ C and E
3 ▶ a 5 b 60 cm
4 ▶ a = 4 cm, b = 20 cm, c = 12 cm, d = 6 cm
5 ▶ a 7.0 cm b 13.2 cm
EXERCISE 7
EXERCISE 7*
EXERCISE 8
4 ▶ A B
D C20 m(5 cm)
14 m (3.5 cm)
4 m(1 cm)
10 m(2.5 cm)
12 m(3 cm)
HouseGarden
5 ▶ Reethi
Bakariya
50 km(5 cm)
30 km(3 cm)
6 ▶
A
C
B
120 km(6 cm)
100 km100 km
100 km
180 km(9 cm)
160 km(8 cm)
1 ▶ Accurate construction of the perpendicular bisector of a line of length 12 cm
2 ▶ Accurate construction of the perpendicular bisector of a line of length 7 cm
3 ▶ Perpendicular bisector accurately constructed on a line of length 10 cm
4 ▶ a, b Perpendicular bisector of line segment AB of length 7 cm drawn accurately
c AP is the same distance as BP.
1 ▶ a, b Perpendicular bisector accurately constructed of 2 points, S and T, 10 cm apart. The perpendicular bisector shows possible positions of the lifeboat.
2 ▶ a, b, c Perpendicular bisector from point P to the line AB accurately constructed
3 ▶ a, b, c Perpendicular at point P on a line accurately constructed
4 ▶ a Shortest distances to sides accurately drawn
b 2.5 m c 10 seconds
EXERCISE 6
EXERCISE 6*
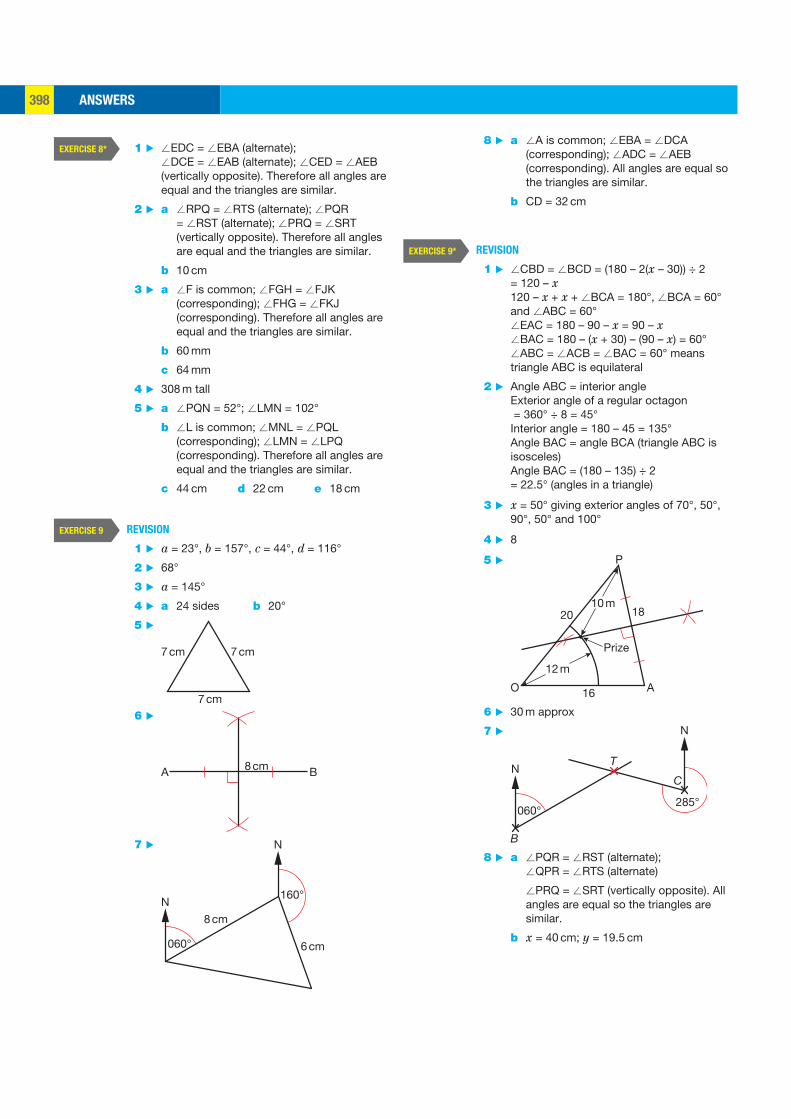
ANSWERS398
8 ▶ a /A is common; /EBA = /DCA (corresponding); /ADC = /AEB (corresponding). All angles are equal so the triangles are similar.
b CD = 32 cm
REVISION
1 ▶ /CBD = /BCD = (180 – 2(x – 30)) ÷ 2 = 120 – x120 – x + x + /BCA = 180°, /BCA = 60° and /ABC = 60°/EAC = 180 – 90 – x = 90 – x/BAC = 180 – (x + 30) – (90 – x) = 60°/ABC = /ACB = /BAC = 60° means triangle ABC is equilateral
2 ▶ Angle ABC = interior angleExterior angle of a regular octagon = 360° ÷ 8 = 45°Interior angle = 180 – 45 = 135°Angle BAC = angle BCA (triangle ABC is isosceles) Angle BAC = (180 – 135) ÷ 2 = 22.5° (angles in a triangle)
3 ▶ x = 50° giving exterior angles of 70°, 50°, 90°, 50° and 100°
4 ▶ 8
5 ▶
10 m
12 m
1820
16
Prize
O A
P
6 ▶ 30 m approx
7 ▶
060°285°
B
C
T
N
N
8 ▶ a /PQR = /RST (alternate); /QPR = /RTS (alternate)
/PRQ = /SRT (vertically opposite). All angles are equal so the triangles are similar.
b x = 40 cm; y = 19.5 cm
EXERCISE 9*
1 ▶ /EDC = /EBA (alternate); /DCE = /EAB (alternate); /CED = /AEB (vertically opposite). Therefore all angles are equal and the triangles are similar.
2 ▶ a /RPQ = /RTS (alternate); /PQR = /RST (alternate); /PRQ = /SRT (vertically opposite). Therefore all angles are equal and the triangles are similar.
b 10 cm
3 ▶ a /F is common; /FGH = /FJK (corresponding); /FHG = /FKJ (corresponding). Therefore all angles are equal and the triangles are similar.
b 60 mm
c 64 mm
4 ▶ 308 m tall
5 ▶ a /PQN = 52°; /LMN = 102°
b /L is common; /MNL = /PQL (corresponding); /LMN = /LPQ (corresponding). Therefore all angles are equal and the triangles are similar.
c 44 cm d 22 cm e 18 cm
REVISION
1 ▶ a = 23°, b = 157°, c = 44°, d = 116°
2 ▶ 68°
3 ▶ a = 145°
4 ▶ a 24 sides b 20°
5 ▶
7 cm
7 cm7 cm
6 ▶
A B8 cm
7 ▶
060°
160°
6 cm
8 cm
N
N
EXERCISE 8*
EXERCISE 9
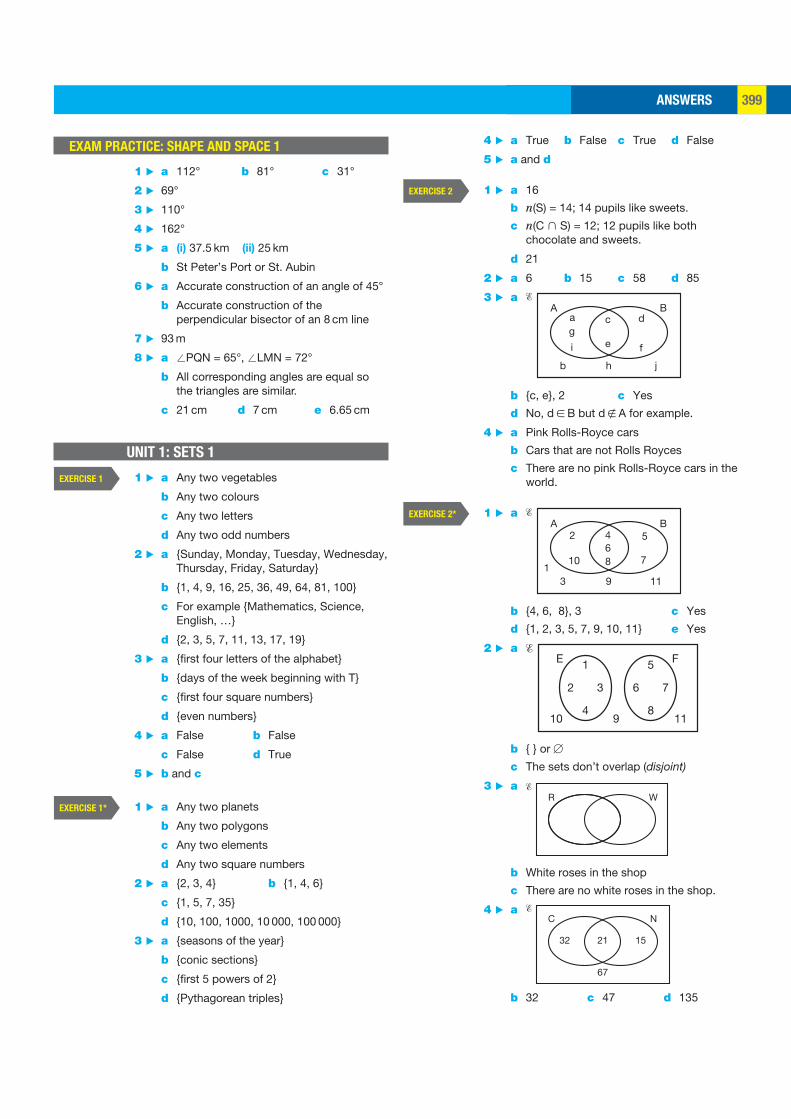
ANSWERS 399
4 ▶ a True b False c True d False
5 ▶ a and d
1 ▶ a 16
b n(S) = 14; 14 pupils like sweets.
c n(C > S) = 12; 12 pupils like both chocolate and sweets.
d 21
2 ▶ a 6 b 15 c 58 d 85
3 ▶ a A B
jhb
i
ag
c
e
d
f
%
b {c, e}, 2 c Yes
d No, d [ B but d Ó A for example.
4 ▶ a Pink Rolls-Royce cars
b Cars that are not Rolls Royces
c There are no pink Rolls-Royce cars in the world.
1 ▶ a A B
11931
10
264
8
5
7
%
b {4, 6, 8}, 3 c Yes
d {1, 2, 3, 5, 7, 9, 10, 11} e Yes
2 ▶ a E F1
2 3
10 94
5
6 7
811
%
b { } or [
c The sets don’t overlap (disjoint)
3 ▶ a %R W
b White roses in the shop
c There are no white roses in the shop.
4 ▶ a C N
67
32 21 15
%
b 32 c 47 d 135
EXERCISE 2
EXERCISE 2*
EXAM PRACTICE: SHAPE AND SPACE 1
1 ▶ a 112° b 81° c 31°
2 ▶ 69°
3 ▶ 110°
4 ▶ 162°
5 ▶ a (i) 37.5 km (ii) 25 km
b St Peter’s Port or St. Aubin
6 ▶ a Accurate construction of an angle of 45°
b Accurate construction of the perpendicular bisector of an 8 cm line
7 ▶ 93 m
8 ▶ a /PQN = 65°, /LMN = 72°
b All corresponding angles are equal so the triangles are similar.
c 21 cm d 7 cm e 6.65 cm
UNIT 1: SETS 1
1 ▶ a Any two vegetables
b Any two colours
c Any two letters
d Any two odd numbers
2 ▶ a {Sunday, Monday, Tuesday, Wednesday, Thursday, Friday, Saturday}
b {1, 4, 9, 16, 25, 36, 49, 64, 81, 100}
c For example {Mathematics, Science, English, …}
d {2, 3, 5, 7, 11, 13, 17, 19}
3 ▶ a {first four letters of the alphabet}
b {days of the week beginning with T}
c {first four square numbers}
d {even numbers}
4 ▶ a False b False
c False d True
5 ▶ b and c
1 ▶ a Any two planets
b Any two polygons
c Any two elements
d Any two square numbers
2 ▶ a {2, 3, 4} b {1, 4, 6}
c {1, 5, 7, 35}
d {10, 100, 1000, 10 000, 100 000}
3 ▶ a {seasons of the year}
b {conic sections}
c {first 5 powers of 2}
d {Pythagorean triples}
EXERCISE 1
EXERCISE 1*
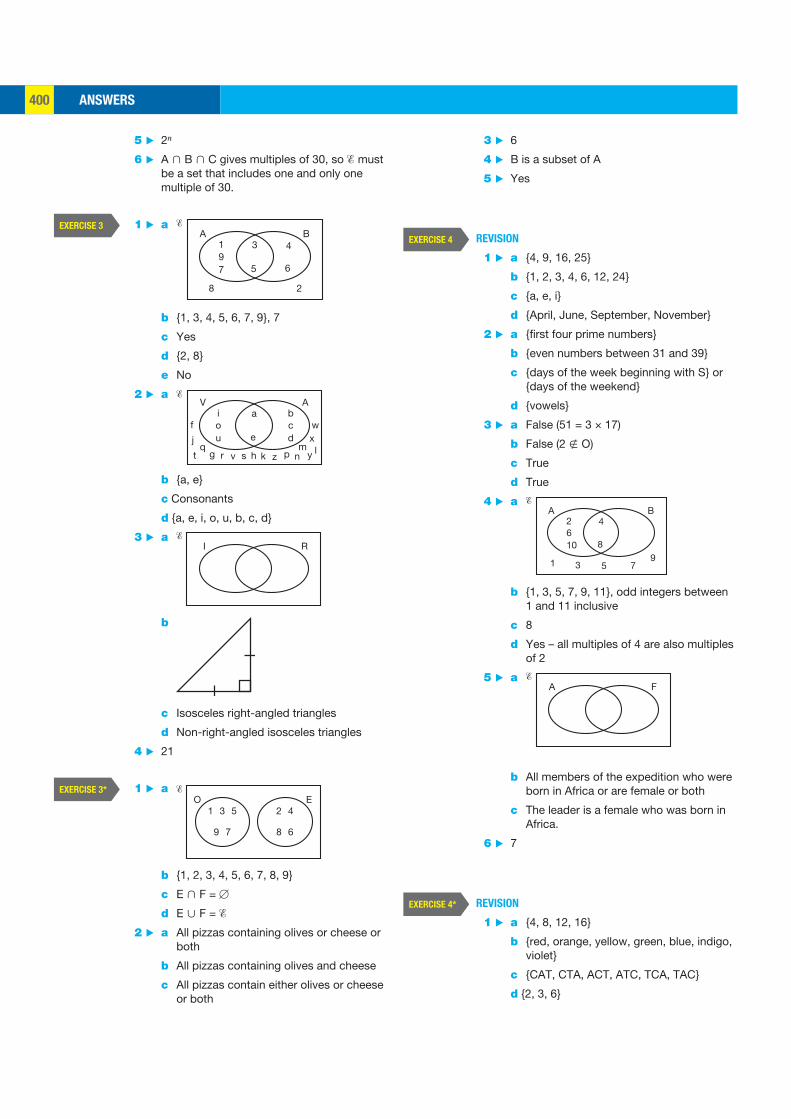
ANSWERS400
3 ▶ 6
4 ▶ B is a subset of A
5 ▶ Yes
REVISION
1 ▶ a {4, 9, 16, 25}
b {1, 2, 3, 4, 6, 12, 24}
c {a, e, i}
d {April, June, September, November}
2 ▶ a {first four prime numbers}
b {even numbers between 31 and 39}
c {days of the week beginning with S} or {days of the weekend}
d {vowels}
3 ▶ a False (51 = 3 × 17)
b False (2 Ó O)
c True
d True
4 ▶ a A B
91
8
462
10
3 5 7
%
b {1, 3, 5, 7, 9, 11}, odd integers between 1 and 11 inclusive
c 8
d Yes – all multiples of 4 are also multiples of 2
5 ▶ a A F
%
b All members of the expedition who were born in Africa or are female or both
c The leader is a female who was born in Africa.
6 ▶ 7
REVISION
1 ▶ a {4, 8, 12, 16}
b {red, orange, yellow, green, blue, indigo, violet}
c {CAT, CTA, ACT, ATC, TCA, TAC}
d {2, 3, 6}
EXERCISE 4
EXERCISE 4*
5 ▶ 2n
6 ▶ A > B > C gives multiples of 30, so � must be a set that includes one and only one multiple of 30.
1 ▶ a A B
28
5
391
7
4
6
%
b {1, 3, 4, 5, 6, 7, 9}, 7
c Yes
d {2, 8}
e No
2 ▶ a V A
e
aoi
j
tq
g r v hs zk p nm
y lxwf
ucb
d
%
b {a, e}
c Consonants
d {a, e, i, o, u, b, c, d}
3 ▶ a I R
%
b
c Isosceles right-angled triangles
d Non-right-angled isosceles triangles
4 ▶ 21
1 ▶ a O
1 3
9 7
5E
8 6
2 4
%
b {1, 2, 3, 4, 5, 6, 7, 8, 9}
c E > F = [
d E < F = �
2 ▶ a All pizzas containing olives or cheese or both
b All pizzas containing olives and cheese
c All pizzas contain either olives or cheese or both
EXERCISE 3
EXERCISE 3*
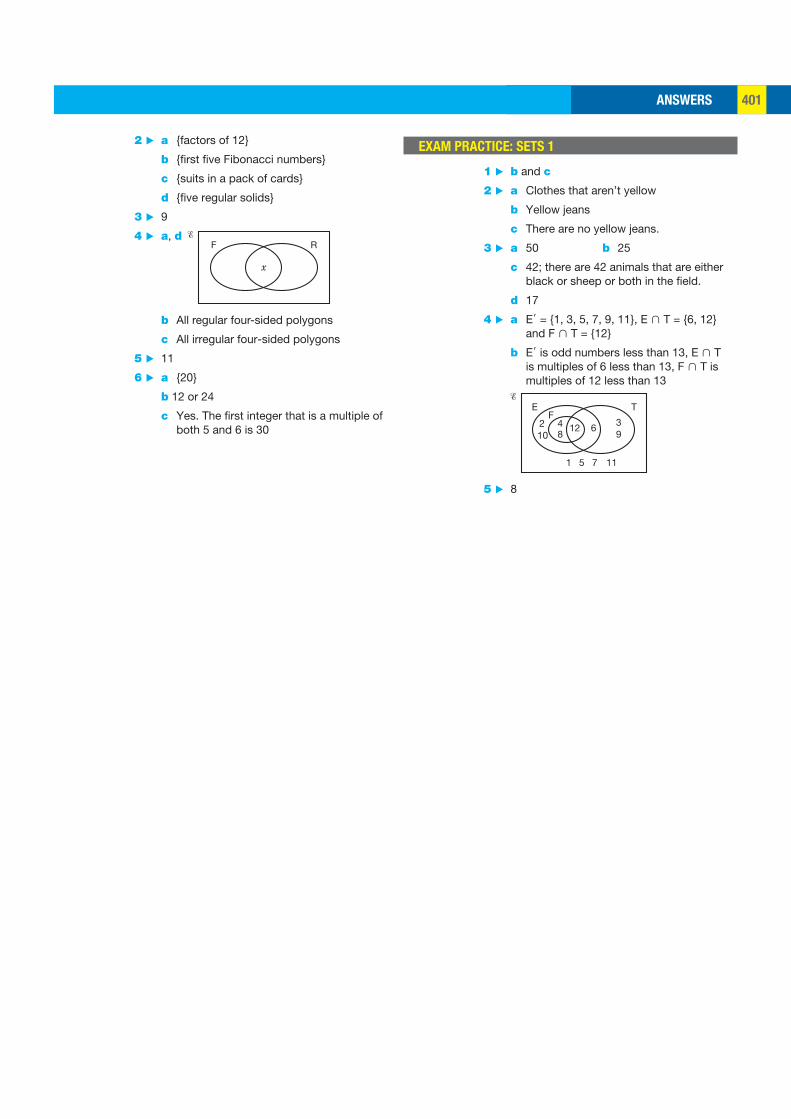
ANSWERS 401
EXAM PRACTICE: SETS 1
1 ▶ b and c
2 ▶ a Clothes that aren’t yellow
b Yellow jeans
c There are no yellow jeans.
3 ▶ a 50 b 25
c 42; there are 42 animals that are either black or sheep or both in the field.
d 17
4 ▶ a E� = {1, 3, 5, 7, 9, 11}, E > T = {6, 12} and F > T = {12}
b E� is odd numbers less than 13, E > T is multiples of 6 less than 13, F > T is multiples of 12 less than 13
EF
2 48
39
6
1 5 7 11
1210
T%
5 ▶ 8
2 ▶ a {factors of 12}
b {first five Fibonacci numbers}
c {suits in a pack of cards}
d {five regular solids}
3 ▶ 9
4 ▶ a, d F R
x
%
b All regular four-sided polygons
c All irregular four-sided polygons
5 ▶ 11
6 ▶ a {20}
b 12 or 24
c Yes. The first integer that is a multiple of both 5 and 6 is 30
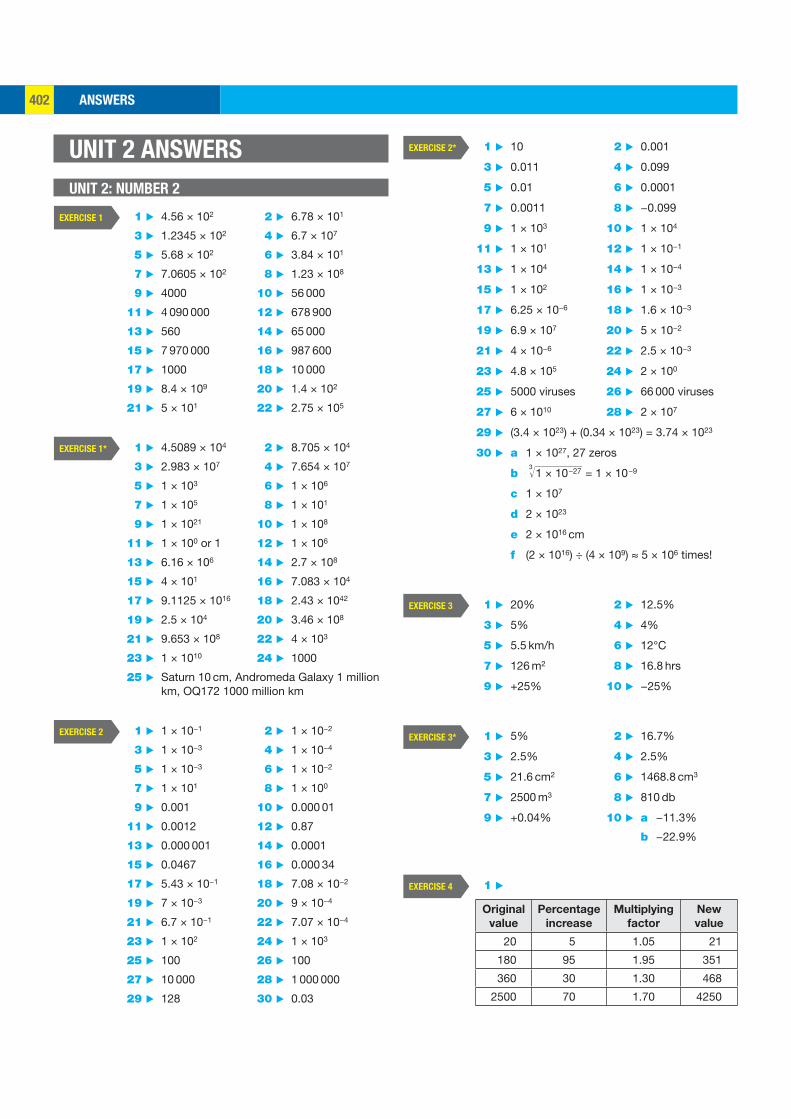
ANSWERS402
1 ▶ 10 2 ▶ 0.001
3 ▶ 0.011 4 ▶ 0.099
5 ▶ 0.01 6 ▶ 0.0001
7 ▶ 0.0011 8 ▶ −0.099
9 ▶ 1 × 10³ 10 ▶ 1 × 10⁴
11 ▶ 1 × 101 12 ▶ 1 × 10⁻¹
13 ▶ 1 × 10⁴ 14 ▶ 1 × 10⁻⁴
15 ▶ 1 × 10² 16 ▶ 1 × 10⁻³
17 ▶ 6.25 × 10⁻⁶ 18 ▶ 1.6 × 10⁻³
19 ▶ 6.9 × 10⁷ 20 ▶ 5 × 10⁻²
21 ▶ 4 × 10⁻⁶ 22 ▶ 2.5 × 10⁻³
23 ▶ 4.8 × 10⁵ 24 ▶ 2 × 100
25 ▶ 5000 viruses 26 ▶ 66 000 viruses
27 ▶ 6 × 10¹⁰ 28 ▶ 2 × 10⁷
29 ▶ (3.4 × 10²³) + (0.34 × 10²³) = 3.74 × 10²³
30 ▶ a 1 × 1027, 27 zeros
b 3 √ _________
1 × 1 0 −27 = 1 × 1 0 −9
c 1 × 10⁷
d 2 × 10²³
e 2 × 1016 cm
f (2 × 10¹⁶) ÷ (4 × 10⁹) ≈ 5 × 10⁶ times!
1 ▶ 20% 2 ▶ 12.5%
3 ▶ 5% 4 ▶ 4%
5 ▶ 5.5 km/h 6 ▶ 12°C
7 ▶ 126 m2 8 ▶ 16.8 hrs
9 ▶ +25% 10 ▶ −25%
1 ▶ 5% 2 ▶ 16.7%
3 ▶ 2.5% 4 ▶ 2.5%
5 ▶ 21.6 cm2 6 ▶ 1468.8 cm3
7 ▶ 2500 m3 8 ▶ 810 db
9 ▶ +0.04% 10 ▶ a −11.3%
b −22.9%
1 ▶
Original
value
Percentage
increase
Multiplying
factor
New
value
20 5 1.05 21
180 95 1.95 351
360 30 1.30 468
2500 70 1.70 4250
EXERCISE 2*
EXERCISE 3
EXERCISE 3*
EXERCISE 4
UNIT 2 ANSWERS
UNIT 2: NUMBER 2
1 ▶ 4.56 × 10² 2 ▶ 6.78 × 101
3 ▶ 1.2345 × 10² 4 ▶ 6.7 × 10⁷
5 ▶ 5.68 × 10² 6 ▶ 3.84 × 101
7 ▶ 7.0605 × 10² 8 ▶ 1.23 × 10⁸
9 ▶ 4000 10 ▶ 56 000
11 ▶ 4 090 000 12 ▶ 678 900
13 ▶ 560 14 ▶ 65 000
15 ▶ 7 970 000 16 ▶ 987 600
17 ▶ 1000 18 ▶ 10 000
19 ▶ 8.4 × 10⁹ 20 ▶ 1.4 × 10²
21 ▶ 5 × 101 22 ▶ 2.75 × 10⁵
1 ▶ 4.5089 × 10⁴ 2 ▶ 8.705 × 10⁴
3 ▶ 2.983 × 10⁷ 4 ▶ 7.654 × 10⁷
5 ▶ 1 × 10³ 6 ▶ 1 × 10⁶
7 ▶ 1 × 10⁵ 8 ▶ 1 × 101
9 ▶ 1 × 10²¹ 10 ▶ 1 × 10⁸
11 ▶ 1 × 100 or 1 12 ▶ 1 × 10⁶
13 ▶ 6.16 × 10⁶ 14 ▶ 2.7 × 10⁸
15 ▶ 4 × 101 16 ▶ 7.083 × 10⁴
17 ▶ 9.1125 × 10¹⁶ 18 ▶ 2.43 × 1042
19 ▶ 2.5 × 10⁴ 20 ▶ 3.46 × 10⁸
21 ▶ 9.653 × 10⁸ 22 ▶ 4 × 10³
23 ▶ 1 × 10¹⁰ 24 ▶ 1000
25 ▶ Saturn 10 cm, Andromeda Galaxy 1 million km, OQ172 1000 million km
1 ▶ 1 × 10⁻¹ 2 ▶ 1 × 10⁻²
3 ▶ 1 × 10⁻³ 4 ▶ 1 × 10⁻⁴
5 ▶ 1 × 10⁻³ 6 ▶ 1 × 10⁻²
7 ▶ 1 × 101 8 ▶ 1 × 100
9 ▶ 0.001 10 ▶ 0.000 01
11 ▶ 0.0012 12 ▶ 0.87
13 ▶ 0.000 001 14 ▶ 0.0001
15 ▶ 0.0467 16 ▶ 0.000 34
17 ▶ 5.43 × 10⁻¹ 18 ▶ 7.08 × 10⁻²
19 ▶ 7 × 10⁻³ 20 ▶ 9 × 10⁻⁴
21 ▶ 6.7 × 10⁻¹ 22 ▶ 7.07 × 10⁻⁴
23 ▶ 1 × 10² 24 ▶ 1 × 10³
25 ▶ 100 26 ▶ 100
27 ▶ 10 000 28 ▶ 1 000 000
29 ▶ 128 30 ▶ 0.03
EXERCISE 1
EXERCISE 1*
EXERCISE 2
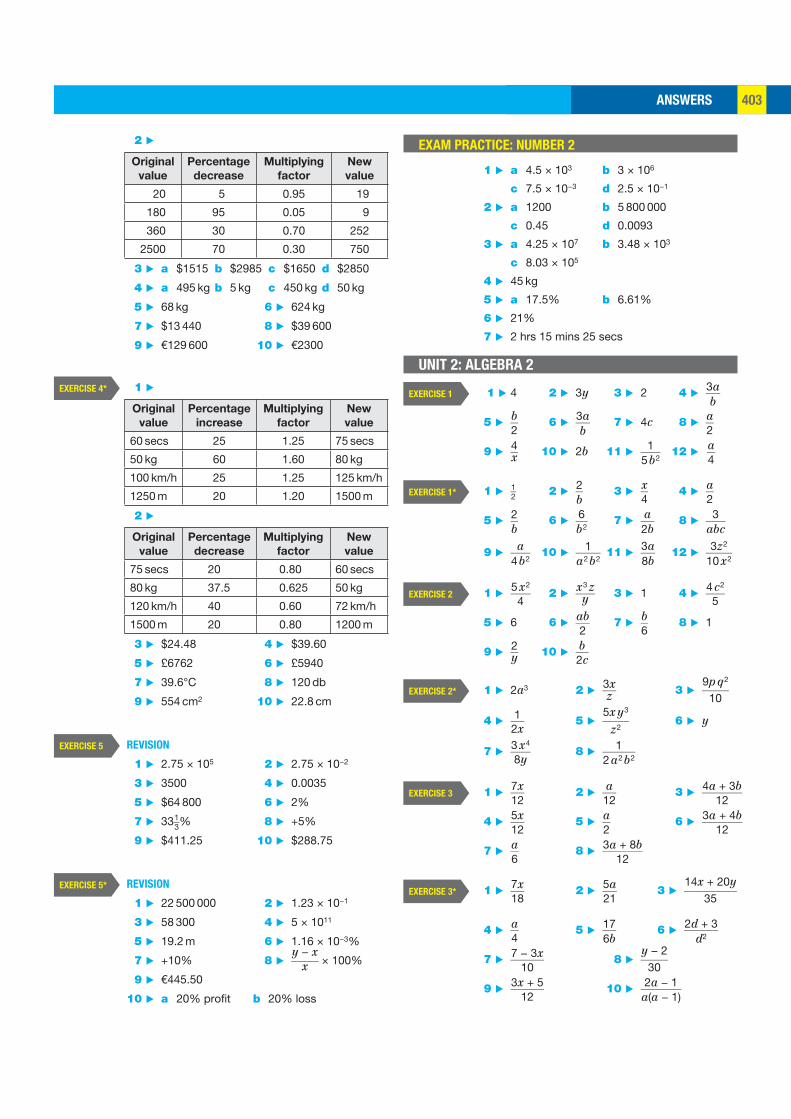
ANSWERS 403
EXAM PRACTICE: NUMBER 2
1 ▶ a 4.5 × 10³ b 3 × 10⁶
c 7.5 × 10⁻³ d 2.5 × 10⁻¹
2 ▶ a 1200 b 5 800 000
c 0.45 d 0.0093
3 ▶ a 4.25 × 10⁷ b 3.48 × 10³
c 8.03 × 10⁵
4 ▶ 45 kg
5 ▶ a 17.5% b 6.61%
6 ▶ 21%
7 ▶ 2 hrs 15 mins 25 secs
UNIT 2: ALGEBRA 2
1 ▶ 4 2 ▶ 3y 3 ▶ 2 4 ▶ 3a ___ b
5 ▶ b __ 2
6 ▶ 3a ___ b 7 ▶ 4c 8 ▶ a __
2
9 ▶ 4 __ x 10 ▶ 2b 11 ▶ 1 ____ 5 b 2
12 ▶ a __ 4
1 ▶ 1 _ 2 2 ▶ 2 __ b 3 ▶ x __
4 4 ▶ a __
2
5 ▶ 2 __ b 6 ▶ 6 ___
b 2 7 ▶ a ___
2b 8 ▶ 3 ____
abc
9 ▶ a ____ 4 b 2
10 ▶ 1 _____ a 2 b 2
11 ▶ 3a ___ 8b
12 ▶ 3 z 2 _____ 10 x 2
1 ▶ 5 x 2 ____ 4
2 ▶ x 3 z ____ y 3 ▶ 1 4 ▶ 4 c 2 ____ 5
5 ▶ 6 6 ▶ ab ___ 2
7 ▶ b __ 6
8 ▶ 1
9 ▶ 2 __ y 10 ▶ b ___ 2c
1 ▶ 2a3 2 ▶ 3x ___ z 3 ▶ 9p q 2
_____ 10
4 ▶ 1 ___ 2x
5 ▶ 5x y 3
_____ z 2
6 ▶ y
7 ▶ 3 x 4 ____ 8y
8 ▶ 1 ______ 2 a 2 b 2
1 ▶ 7x ___ 12
2 ▶ a ___ 12
3 ▶ 4a + 3b ________ 12
4 ▶ 5x ___ 12
5 ▶ a __ 2
6 ▶ 3a + 4b ________ 12
7 ▶ a __ 6
8 ▶ 3a + 8b ________ 12
1 ▶ 7x ___ 18
2 ▶ 5a ___ 21
3 ▶ 14x + 20y
__________ 35
4 ▶ a __ 4
5 ▶ 17 ___ 6b
6 ▶ 2d + 3 ______ d2
7 ▶ 7 − 3x ______ 10
8 ▶ y − 2
_____ 30
9 ▶ 3x + 5 ______ 12
10 ▶ 2a − 1 ________ a(a − 1)
EXERCISE 1
EXERCISE 1*
EXERCISE 2
EXERCISE 2*
EXERCISE 3
EXERCISE 3*
2 ▶
Original
value
Percentage
decrease
Multiplying
factor
New
value
20 5 0.95 19
180 95 0.05 9
360 30 0.70 252
2500 70 0.30 750
3 ▶ a $1515 b $2985 c $1650 d $2850
4 ▶ a 495 kg b 5 kg c 450 kg d 50 kg
5 ▶ 68 kg 6 ▶ 624 kg
7 ▶ $13 440 8 ▶ $39 600
9 ▶ €129 600 10 ▶ €2300
1 ▶
Original
value
Percentage
increase
Multiplying
factor
New
value
60 secs 25 1.25 75 secs
50 kg 60 1.60 80 kg
100 km/h 25 1.25 125 km/h
1250 m 20 1.20 1500 m
2 ▶
Original
value
Percentage
decrease
Multiplying
factor
New
value
75 secs 20 0.80 60 secs
80 kg 37.5 0.625 50 kg
120 km/h 40 0.60 72 km/h
1500 m 20 0.80 1200 m
3 ▶ $24.48 4 ▶ $39.60
5 ▶ £6762 6 ▶ £5940
7 ▶ 39.6°C 8 ▶ 120 db
9 ▶ 554 cm2 10 ▶ 22.8 cm
REVISION
1 ▶ 2.75 × 10⁵ 2 ▶ 2.75 × 10⁻²
3 ▶ 3500 4 ▶ 0.0035
5 ▶ $64 800 6 ▶ 2%
7 ▶ 33 1 _ 3 % 8 ▶ +5%
9 ▶ $411.25 10 ▶ $288.75
REVISION
1 ▶ 22 500 000 2 ▶ 1.23 × 10⁻¹
3 ▶ 58 300 4 ▶ 5 × 10¹¹
5 ▶ 19.2 m 6 ▶ 1.16 × 10⁻³%
7 ▶ +10% 8 ▶ y − x
_____ x × 100%
9 ▶ €445.50
10 ▶ a 20% profit b 20% loss
EXERCISE 4*
EXERCISE 5
EXERCISE 5*
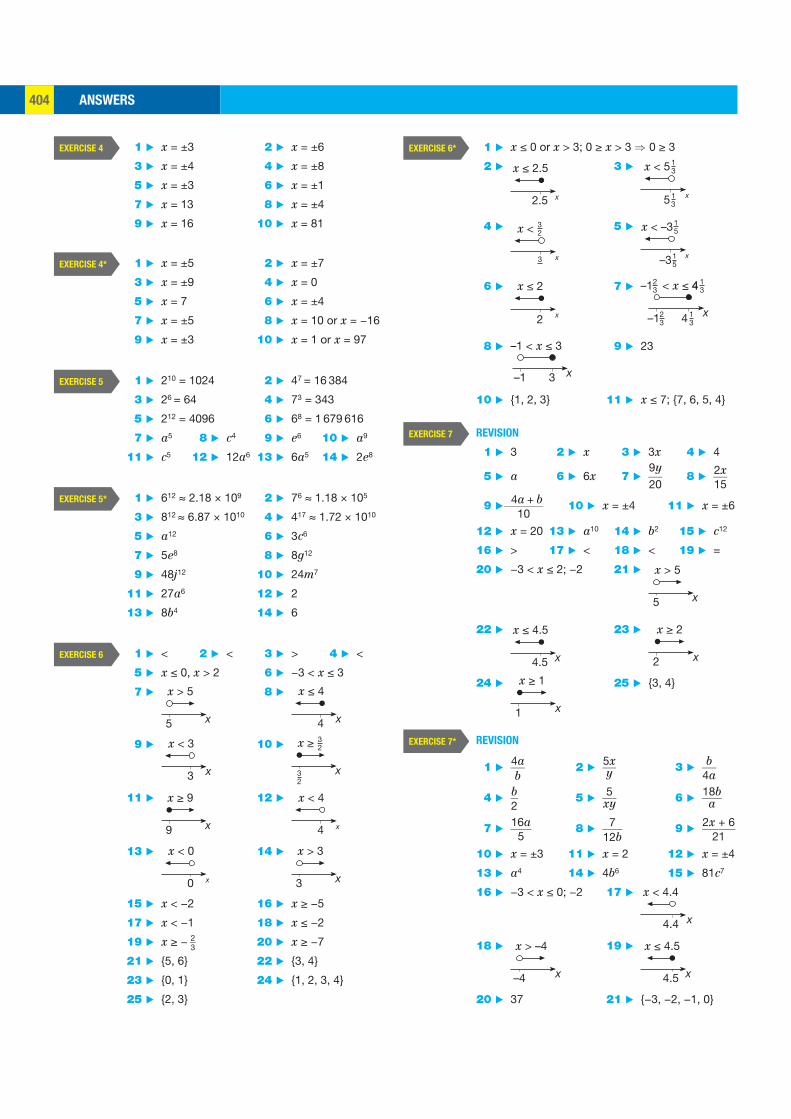
ANSWERS404
1 ▶ x ≤ 0 or x > 3; 0 ≥ x > 3 ⇒ 0 ≥ 3
2 ▶
x
x ≤ 2.5
2.5
3 ▶
13
x
x < 5
5
13
4 ▶
3 x
x < 32
5 ▶
15
x
x < –3
–3
15
6 ▶
x
x ≤ 2
2
7 ▶
x
–1 < x ≤ 4
23–1 1
34
23
134
8 ▶
x–1 3
–1 < x ≤ 3 9 ▶ 23
10 ▶ {1, 2, 3} 11 ▶ x ≤ 7; {7, 6, 5, 4}
REVISION
1 ▶ 3 2 ▶ x 3 ▶ 3x 4 ▶ 4
5 ▶ a 6 ▶ 6x 7 ▶ 9y
___ 20
8 ▶ 2x ___ 15
9 ▶ 4a + b _______ 10
10 ▶ x = ±4 11 ▶ x = ±6
12 ▶ x = 20 13 ▶ a10 14 ▶ b2 15 ▶ c12
16 ▶ > 17 ▶ < 18 ▶ < 19 ▶ =
20 ▶ −3 < x ≤ 2; −2 21 ▶ x > 5
x5
22 ▶
x
x ≤ 4.5
4.5
23 ▶
x
x ≥ 2
2
24 ▶
x
x ≥ 1
1
25 ▶ {3, 4}
REVISION
1 ▶ 4a ___ b 2 ▶ 5x ___ y 3 ▶ b ___
4a
4 ▶ b __ 2
5 ▶ 5 ___ xy 6 ▶ 18b ____ a
7 ▶ 16a ____ 5
8 ▶ 7 ____ 12b
9 ▶ 2x + 6 ______ 21
10 ▶ x = ±3 11 ▶ x = 2 12 ▶ x = ±4
13 ▶ a4 14 ▶ 4b6 15 ▶ 81c7
16 ▶ −3 < x ≤ 0; −2 17 ▶
x
x < 4.4
4.4
18 ▶
x
x > –4
–4
19 ▶
x
x ≤ 4.5
4.5
20 ▶ 37 21 ▶ {−3, −2, −1, 0}
EXERCISE 6*
EXERCISE 7
EXERCISE 7*
1 ▶ x = ±3 2 ▶ x = ±6
3 ▶ x = ±4 4 ▶ x = ±8
5 ▶ x = ±3 6 ▶ x = ±1
7 ▶ x = 13 8 ▶ x = ±4
9 ▶ x = 16 10 ▶ x = 81
1 ▶ x = ±5 2 ▶ x = ±7
3 ▶ x = ±9 4 ▶ x = 0
5 ▶ x = 7 6 ▶ x = ±4
7 ▶ x = ±5 8 ▶ x = 10 or x = −16
9 ▶ x = ±3 10 ▶ x = 1 or x = 97
1 ▶ 210 = 1024 2 ▶ 47 = 16 384
3 ▶ 26 = 64 4 ▶ 73 = 343
5 ▶ 212 = 4096 6 ▶ 68 = 1 679 616
7 ▶ a5 8 ▶ c4 9 ▶ e6 10 ▶ a9
11 ▶ c5 12 ▶ 12a6 13 ▶ 6a5 14 ▶ 2e8
1 ▶ 612 ≈ 2.18 × 10⁹ 2 ▶ 76 ≈ 1.18 × 10⁵
3 ▶ 812 ≈ 6.87 × 10¹⁰ 4 ▶ 417 ≈ 1.72 × 10¹⁰
5 ▶ a12 6 ▶ 3c6
7 ▶ 5e8 8 ▶ 8g12
9 ▶ 48j 12 10 ▶ 24m7
11 ▶ 27a6 12 ▶ 2
13 ▶ 8b4 14 ▶ 6
1 ▶ < 2 ▶ < 3 ▶ > 4 ▶ <
5 ▶ x ≤ 0, x > 2 6 ▶ −3 < x ≤ 3
7 ▶ x > 5
x5
8 ▶
x
x ≤ 4
4
9 ▶
x
x < 3
3
10 ▶ x ≥
x32
32
11 ▶ x ≥ 9
x9
12 ▶
x
x < 4
4
13 ▶
x
x < 0
0
14 ▶ x > 3
x3
15 ▶ x < −2 16 ▶ x ≥ −5
17 ▶ x < −1 18 ▶ x ≤ −2
19 ▶ x ≥ − 2 _ 3 20 ▶ x ≥ −7
21 ▶ {5, 6} 22 ▶ {3, 4}
23 ▶ {0, 1} 24 ▶ {1, 2, 3, 4}
25 ▶ {2, 3}
EXERCISE 4
EXERCISE 4*
EXERCISE 5
EXERCISE 5*
EXERCISE 6
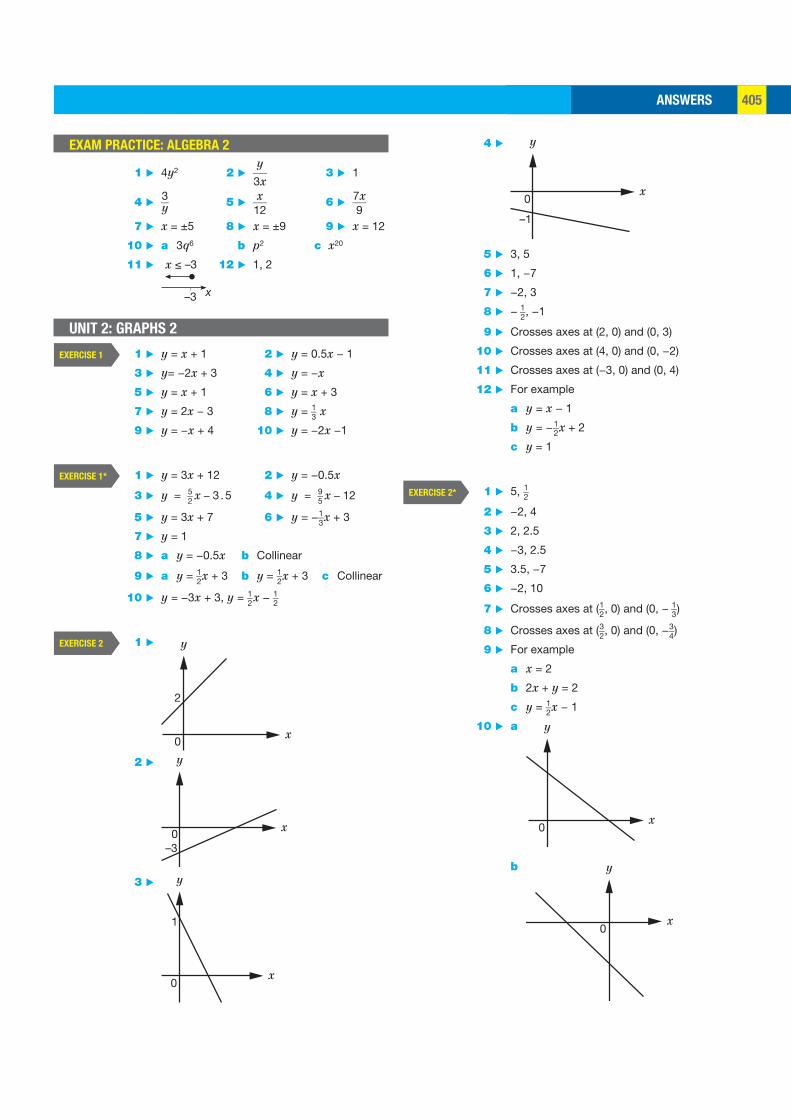
ANSWERS 405
4 ▶
0
–1
x
y
5 ▶ 3, 5
6 ▶ 1, −7
7 ▶ −2, 3
8 ▶ − 1 _ 2 , −1
9 ▶ Crosses axes at (2, 0) and (0, 3)
10 ▶ Crosses axes at (4, 0) and (0, −2)
11 ▶ Crosses axes at (−3, 0) and (0, 4)
12 ▶ For example
a y = x − 1
b y = − 1 _ 2 x + 2
c y = 1
1 ▶ 5, 1 _ 2
2 ▶ −2, 4
3 ▶ 2, 2.5
4 ▶ −3, 2.5
5 ▶ 3.5, −7
6 ▶ −2, 10
7 ▶ Crosses axes at ( 1 _ 2 , 0) and (0, − 1 _ 3 )
8 ▶ Crosses axes at ( 3 _ 2 , 0) and (0, − 3 _ 4 )
9 ▶ For example
a x = 2
b 2x + y = 2
c y = 1 _ 2 x − 1
10 ▶ a
0x
y
b
x
y
0
EXERCISE 2*
EXAM PRACTICE: ALGEBRA 2
1 ▶ 4y2 2 ▶ y ___ 3x
3 ▶ 1
4 ▶ 3 __ y 5 ▶ x ___ 12
6 ▶ 7x ___ 9
7 ▶ x = ±5 8 ▶ x = ±9 9 ▶ x = 12
10 ▶ a 3q6 b p2 c x20
11 ▶
x
x ≤ –3
–3
12 ▶ 1, 2
UNIT 2: GRAPHS 2
1 ▶ y = x + 1 2 ▶ y = 0.5x − 1
3 ▶ y= −2x + 3 4 ▶ y = −x
5 ▶ y = x + 1 6 ▶ y = x + 3
7 ▶ y = 2x − 3 8 ▶ y = 1 _ 3 x
9 ▶ y = −x + 4 10 ▶ y = −2x −1
1 ▶ y = 3x + 12 2 ▶ y = −0.5x
3 ▶ y = 5 _ 2 x − 3 . 5 4 ▶ y = 9 _ 5 x − 12
5 ▶ y = 3x + 7 6 ▶ y = − 1 _ 3 x + 3
7 ▶ y = 1
8 ▶ a y = −0.5x b Collinear
9 ▶ a y = 1 _ 2 x + 3 b y = 1 _ 2 x + 3 c Collinear
10 ▶ y = −3x + 3, y = 1 _ 2 x − 1 _ 2
1 ▶
x
y
0
2
2 ▶
0–3
x
y
3 ▶
0
1
x
y
EXERCISE 1
EXERCISE 1*
EXERCISE 2
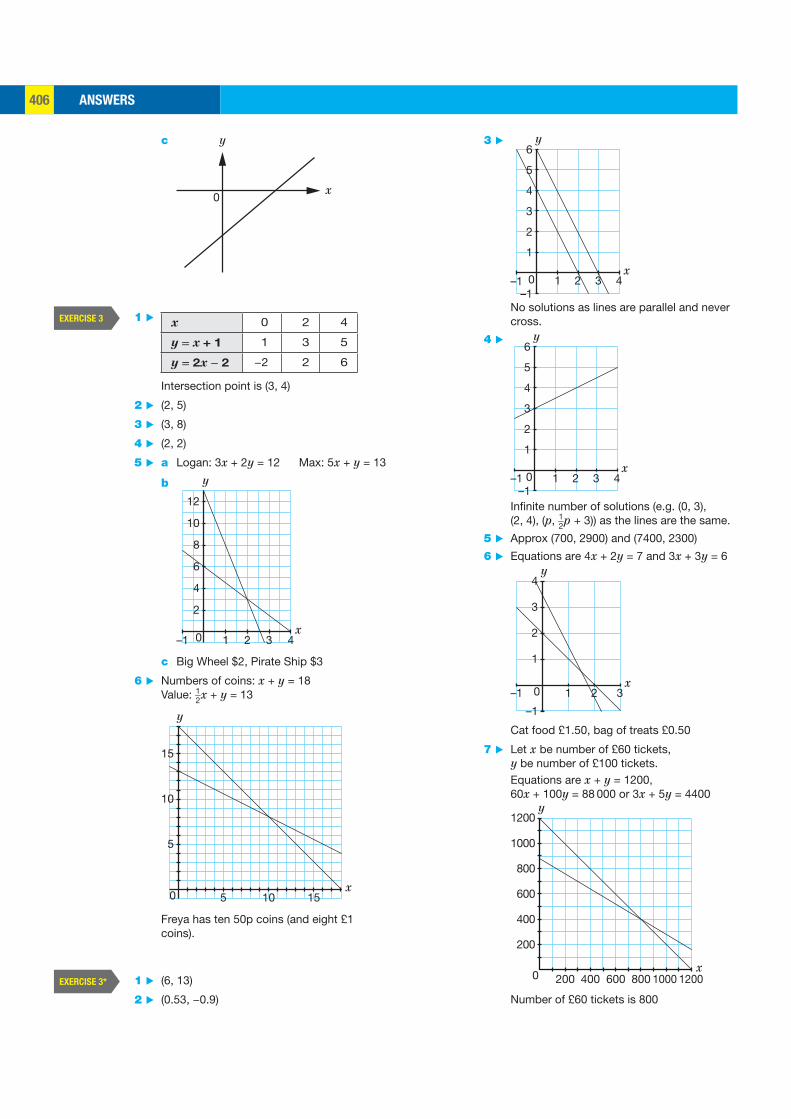
ANSWERS406
3 ▶ 6
5
4
3
2
1
0–1
1–1 2 3 4x
y
No solutions as lines are parallel and never cross.
4 ▶ 6
5
4
3
2
1
0–1
1–1 2 3 4x
y
Infinite number of solutions (e.g. (0, 3), (2, 4), (p, 1 _ 2 p + 3)) as the lines are the same.
5 ▶ Approx (700, 2900) and (7400, 2300)
6 ▶ Equations are 4x + 2y = 7 and 3x + 3y = 6
x
y
1 2 3–1
1
0
2
3
4
–1
Cat food £1.50, bag of treats £0.50
7 ▶ Let x be number of £60 tickets, y be number of £100 tickets.Equations are x + y = 1200, 60x + 100y = 88 000 or 3x + 5y = 4400
1200
1000
800
600
400
200
200 400 600 800 1000 1200x
y
0
Number of £60 tickets is 800
c
x
y
0
1 ▶ x 0 2 4
y = x + 1 1 3 5
y = 2x − 2 −2 2 6
Intersection point is (3, 4)
2 ▶ (2, 5)
3 ▶ (3, 8)
4 ▶ (2, 2)
5 ▶ a Logan: 3x + 2y = 12 Max: 5x + y = 13
b
–1 1 2 3 4
2
4
6
8
10
12
x
y
0
c Big Wheel $2, Pirate Ship $3
6 ▶ Numbers of coins: x + y = 18 Value: 1 _ 2 x + y = 13
5 10 15
5
10
15
x
y
0
Freya has ten 50p coins (and eight £1 coins).
1 ▶ (6, 13)
2 ▶ (0.53, −0.9)
EXERCISE 3
EXERCISE 3*

ANSWERS 407
REVISION
1 ▶ 3y = x + 6
2 ▶ a 3y + x = −7
b y = 2x − 4
3 ▶ a
0–2
x
y
b
0
2.5
5x
y
c
0 2
103
x
y
4 ▶ x = −1.4, y = −0.8
5 ▶ Let x be number correct, y be number wrong. Then x + y = 20 and 4x − y = 50.
10 20
10
20
x
y
0
From graph number wrong is 6.
6 ▶ y = 3x + 9 − 6p
EXAM PRACTICE: GRAPHS 2
1 ▶ y = 5x − 3
2 ▶ a y = − 1 _ 2 x
b y = − 1 _ 2 x − 1 _ 2
EXERCISE 4* 8 ▶ a Angles: 0°, 90°, 180°, 270°, 0°, 90°, 180°,
270°, 0°, 90°, 180°
b, c
0 1
180°
360°
2 3Time
Ang
le
4 5 6
d 1 h 5.45 min; 2 h 10.9 min; 3 h 16.4 min; 4 h 21.8 min; 5 h 27.3 min
REVISION
1 ▶ a y = 2x b y = −3x + 6
2 ▶ a y = 2x − 2 b y = −x + 1
3 ▶ a
0
–3
x
y
b
0
4
4x
y
c
0
2
5x
y
4 ▶ x = 2, y = 1
5 ▶ x = −1, y = 3
6 ▶ a Rahul: 3x + 2y = 6, Mia: x + 4y = 7
b
–1
4
3
2
1
0–1
1 2 3 4x
y
c Banana $1, Musedown $1.50
EXERCISE 4
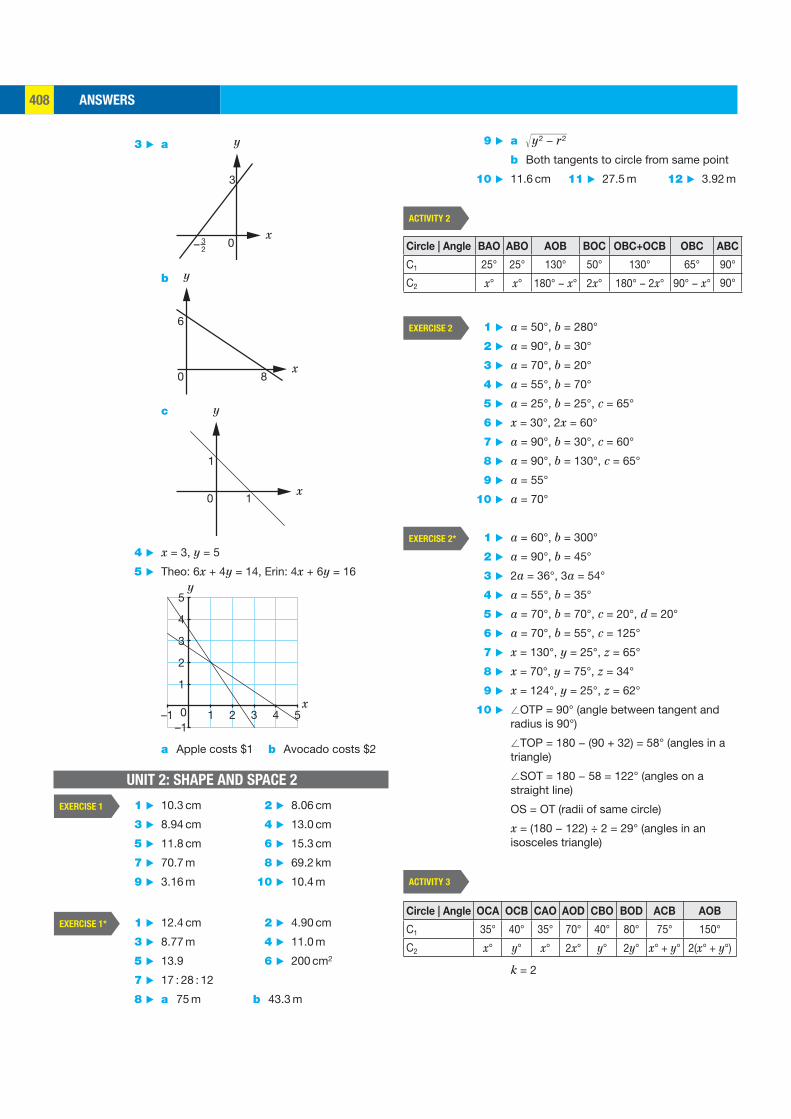
ANSWERS408
9 ▶ a √ _______
y2 − r2
b Both tangents to circle from same point
10 ▶ 11.6 cm 11 ▶ 27.5 m 12 ▶ 3.92 m
Circle | Angle BAO ABO AOB BOC OBC+OCB OBC ABC
C1 25° 25° 130° 50° 130° 65° 90°
C2 x° x° 180° − x° 2x° 180° − 2x° 90° − x° 90°
1 ▶ a = 50°, b = 280°
2 ▶ a = 90°, b = 30°
3 ▶ a = 70°, b = 20°
4 ▶ a = 55°, b = 70°
5 ▶ a = 25°, b = 25°, c = 65°
6 ▶ x = 30°, 2x = 60°
7 ▶ a = 90°, b = 30°, c = 60°
8 ▶ a = 90°, b = 130°, c = 65°
9 ▶ a = 55°
10 ▶ a = 70°
1 ▶ a = 60°, b = 300°
2 ▶ a = 90°, b = 45°
3 ▶ 2a = 36°, 3a = 54°
4 ▶ a = 55°, b = 35°
5 ▶ a = 70°, b = 70°, c = 20°, d = 20°
6 ▶ a = 70°, b = 55°, c = 125°
7 ▶ x = 130°, y = 25°, z = 65°
8 ▶ x = 70°, y = 75°, z = 34°
9 ▶ x = 124°, y = 25°, z = 62°
10 ▶ /OTP = 90° (angle between tangent and radius is 90°)
/TOP = 180 − (90 + 32) = 58° (angles in a triangle)
/SOT = 180 − 58 = 122° (angles on a straight line)
OS = OT (radii of same circle)
x = (180 − 122) ÷ 2 = 29° (angles in an isosceles triangle)
Circle | Angle OCA OCB CAO AOD CBO BOD ACB AOB
C1 35° 40° 35° 70° 40° 80° 75° 150°
C2 x° y° x° 2x° y° 2y° x° + y° 2(x° + y°)
k = 2
ACTIVITY 2
EXERCISE 2
EXERCISE 2*
ACTIVITY 3
3 ▶ a
0
3
x
y
32–
b
0
6
8x
y
c
x
y
0 1
1
4 ▶ x = 3, y = 5
5 ▶ Theo: 6x + 4y = 14, Erin: 4x + 6y = 16
x
y
–1
1
0
2
3
4
5
1 2 3 4 5–1
a Apple costs $1 b Avocado costs $2
UNIT 2: SHAPE AND SPACE 2
1 ▶ 10.3 cm 2 ▶ 8.06 cm
3 ▶ 8.94 cm 4 ▶ 13.0 cm
5 ▶ 11.8 cm 6 ▶ 15.3 cm
7 ▶ 70.7 m 8 ▶ 69.2 km
9 ▶ 3.16 m 10 ▶ 10.4 m
1 ▶ 12.4 cm 2 ▶ 4.90 cm
3 ▶ 8.77 m 4 ▶ 11.0 m
5 ▶ 13.9 6 ▶ 200 cm2
7 ▶ 17 : 28 : 12
8 ▶ a 75 m b 43.3 m
EXERCISE 1
EXERCISE 1*

ANSWERS 409
6 ▶ OB = OC = OA (radii same circle)
/OAC = /OCA (base angles of isosceles triangle are equal)
/OCB = (180° – 40° – 70°) ÷ 2 = 35°
/OBC = /OCB (base angles of isosceles triangle are equal)
/OCB = (180° – 40°) ÷ 2 = 70°
= 2 × /ACO
Hence AC bisects /OCB
7 ▶ /ODC = 66° (opposite angles of a cyclic quadrilateral add to 180°)
OC = OD (radii same circle)
/ODC = /OCD (base angles of isosceles triangle are equal)
/COD = 180° − 66° − 66° = 48° (angles in a triangle add to 180°)
8 ▶ /BCD = 30° (opposite angles of a cyclic quadrilateral add to 180°)
/BOD = 60° (angle at the centre is twice angle at the circumference when both are subtended by the same arc)
OB = OD (radii same circle)
/OBD = /ODB = (180° − 60°) ÷ 2 = 60° (base angles of isosceles triangle are equal and angles in a triangle add to 180°)
In triangle OBD all the angles are 60° so it is equilateral.
REVISION
1 ▶ 2 m
2 ▶ 3.71 cm
3 ▶ OA = OB radii same circle. Angle OAB = angle OBA (base angles of isosceles triangle are equal) Angle OAB = (180° − 124°) ÷ 2 = 28° (angles in a triangle add to 180°) Angle OAT = 90° (angle between tangent and radius is 90°) Angle BAT = 90° − 28° = 62° (Note: these angles may be annotated on the diagram.)
4 ▶ Angle BAD = 70°. Angle BOD = 140°. Opposite angles of cyclic quadrilateral add to 180° and angle at centre equals twice angle at circumference when both are subtended by the same arc.
5 ▶ a Angle BAD = 90° (the angle in a semicircle is a right angle). Angle ABD = 180 − 90° − 19° = 71° (angles in a triangle add to 180°)
b Angle ACB = 19° (angles subtended at the circumference by the same arc are equal)
EXERCISE 4*
1 ▶ a = 60°
2 ▶ a = 140°
3 ▶ a = 50°
4 ▶ a = 140°
5 ▶ a = 40°, b = 20°
6 ▶ a = 120°, b = 30°
7 ▶ a = 65°, b = 115°
8 ▶ a = 50°, b = 130°
9 ▶ a = 72° (opposite angles of a cyclic quadrilateral add to 180°)
b = 108° (angles on a straight line add to 180°)
c = 93° (angles in a quadrilateral add to 360°)
10 ▶ k = 46° and m = 38° (angles subtended by the same arc)
l = 54°(angles in a triangle add to 180°)
1 ▶ a = 100°
2 ▶ a = 80°
3 ▶ a = 290°
4 ▶ a = 102°
5 ▶ a = 40°, b = 60°
6 ▶ a = 35°, b = 25°
7 ▶ a = 110°, b = 70°
8 ▶ a = 60°, b = 60°
9 ▶ /ADC = y __
2 (angle at centre is twice the
angle at the circumference)
/ABC = 180 − y __
2 (opposite angles in cyclic
quadrilateral add to 180°)
10 ▶ Angle TAO = 90° (angle between tangent and radius = 90°)
Angle OAB = angle OBA = 32° (base angles of isosceles triangle are equal)
Angle ABT = 81° (angles in a triangle add to 180°)
Angle OBT = 32 + 81 = 113°
REVISION
1 ▶ a 13.0 cm b 11.2 cm
2 ▶ 44.7 cm
3 ▶ a 2.5 m b 6.5 m2
4 ▶ a = 60° (OBC is an equilateral triangle)
OA = OB so OAB is isosceles (radii same circle)
c = /OBA = 130° − 60° = 70° (base angles of an isosceles triangle are equal)
b = 180 − 70 − 70 = 40° (angles in a triangle add to 180°)
5 ▶ /ABC = 90°; /ACB = 36°; /BAC = 54°
EXERCISE 3
EXERCISE 3*
EXERCISE 4
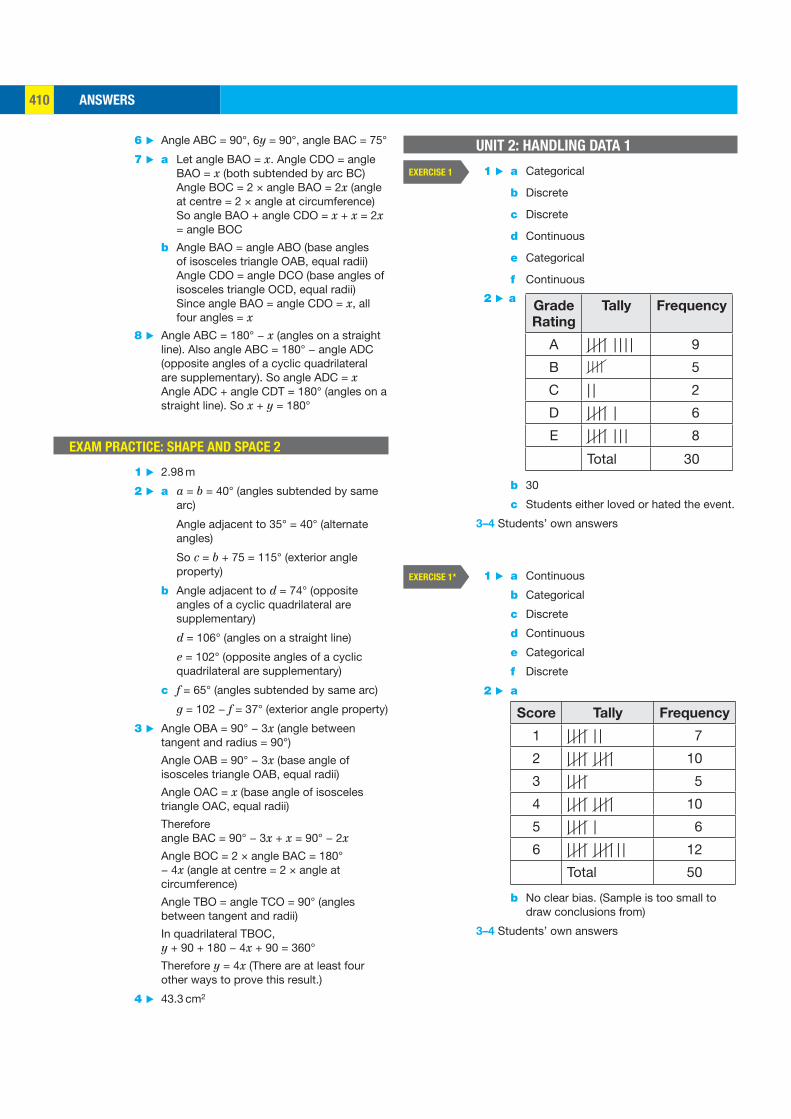
ANSWERS410
UNIT 2: HANDLING DATA 1
1 ▶ a Categorical
b Discrete
c Discrete
d Continuous
e Categorical
f Continuous
2 ▶ aGrade
Rating
Tally Frequency
A | | | | | | | | 9
B | | | | 5
C | | 2
D | | | | | 6
E | | | | | | | 8
Total 30
b 30
c Students either loved or hated the event.
3–4 Students’ own answers
1 ▶ a Continuous
b Categorical
c Discrete
d Continuous
e Categorical
f Discrete
2 ▶ a
Score Tally Frequency
1 | | | | | | 7
2 | | | | | | | | 10
3 | | | | 5
4 | | | | | | | | 10
5 | | | | | 6
6 | | | | | | | | | | 12
Total 50
b No clear bias. (Sample is too small to draw conclusions from)
3–4 Students’ own answers
EXERCISE 1
EXERCISE 1*
6 ▶ Angle ABC = 90°, 6y = 90°, angle BAC = 75°
7 ▶ a Let angle BAO = x. Angle CDO = angle BAO = x (both subtended by arc BC) Angle BOC = 2 × angle BAO = 2x (angle at centre = 2 × angle at circumference) So angle BAO + angle CDO = x + x = 2x = angle BOC
b Angle BAO = angle ABO (base angles of isosceles triangle OAB, equal radii) Angle CDO = angle DCO (base angles of isosceles triangle OCD, equal radii) Since angle BAO = angle CDO = x, all four angles = x
8 ▶ Angle ABC = 180° − x (angles on a straight line). Also angle ABC = 180° − angle ADC (opposite angles of a cyclic quadrilateral are supplementary). So angle ADC = x Angle ADC + angle CDT = 180° (angles on a straight line). So x + y = 180°
EXAM PRACTICE: SHAPE AND SPACE 2
1 ▶ 2.98 m
2 ▶ a a = b = 40° (angles subtended by same arc)
Angle adjacent to 35° = 40° (alternate angles)
So c = b + 75 = 115° (exterior angle property)
b Angle adjacent to d = 74° (opposite angles of a cyclic quadrilateral are supplementary)
d = 106° (angles on a straight line)
e = 102° (opposite angles of a cyclic quadrilateral are supplementary)
c f = 65° (angles subtended by same arc)
g = 102 − f = 37° (exterior angle property)
3 ▶ Angle OBA = 90° − 3x (angle between tangent and radius = 90°)
Angle OAB = 90° − 3x (base angle of isosceles triangle OAB, equal radii)
Angle OAC = x (base angle of isosceles triangle OAC, equal radii)
Therefore angle BAC = 90° − 3x + x = 90° − 2x
Angle BOC = 2 × angle BAC = 180° − 4x (angle at centre = 2 × angle at circumference)
Angle TBO = angle TCO = 90° (angles between tangent and radii)
In quadrilateral TBOC, y + 90 + 180 − 4x + 90 = 360°
Therefore y = 4x (There are at least four other ways to prove this result.)
4 ▶ 43.3 cm2
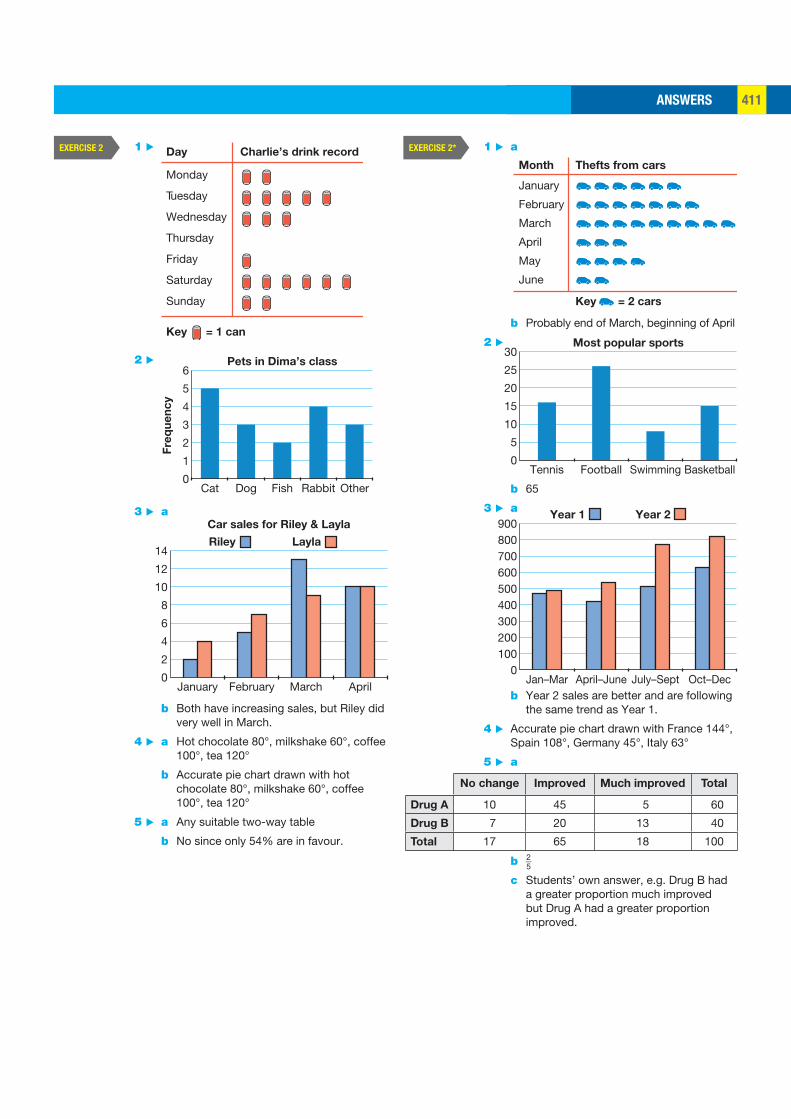
ANSWERS 411
1 ▶ a
Month
January
February
March
April
May
June
Thefts from cars
Key = 2 cars
b Probably end of March, beginning of April
2 ▶
b 65
3 ▶ a
b Year 2 sales are better and are following the same trend as Year 1.
4 ▶ Accurate pie chart drawn with France 144°, Spain 108°, Germany 45°, Italy 63°
5 ▶ a
No change Improved Much improved Total
Drug A 10 45 5 60
Drug B 7 20 13 40
Total 17 65 18 100
b 2 _ 5
c Students’ own answer, e.g. Drug B had a greater proportion much improved but Drug A had a greater proportion improved.
EXERCISE 2*
Tennis0
5
10
15
20
25
30
Football Swimming
Most popular sports
Basketball
Jan–Mar0
100200300400500600700800900
April–June July–Sept
Year 2Year 1
Oct–Dec
1 ▶ Day
Monday
Tuesday
Wednesday
Thursday
Friday
Saturday
Sunday
Charlie’s drink record
Key = 1 can
2 ▶
Cat0
1
2
3
4
5
6
Dog Fish
Pets in Dima’s class
Fre
qu
en
cy
Rabbit Other
3 ▶ a
January0
2
4
6
8
10
12
14
February March
LaylaRiley
Car sales for Riley & Layla
April
b Both have increasing sales, but Riley did very well in March.
4 ▶ a Hot chocolate 80°, milkshake 60°, coffee 100°, tea 120°
b Accurate pie chart drawn with hot chocolate 80°, milkshake 60°, coffee 100°, tea 120°
5 ▶ a Any suitable two-way table
b No since only 54% are in favour.
EXERCISE 2

ANSWERS412
3 ▶ a Mean = £212, median = £190, mode = £180
b Mean, which takes into account all five values and could be used to work out the total bill.
4 ▶ a Mode. Data is non-numerical.
b Median. The mean would not give a whole number and the mode is the lowest value so not representative of the data set.
REVISION
1 ▶ Accurate pie chart drawn with strawberries 125°, banana 75°, yoghurt 100°, iced water 60°
2 ▶
Fre
qu
en
cy
Perch0
10
20
30
40
50
Bream Carp
Types of fish caught
Pike 3 ▶ a
Year 2Year 1F
req
ue
nc
y
May0
5
10
15
20
25
June July August
b Second year started with roughly the same number of sunny days, but then rapidly deteriorated.
4 ▶
French German Mandarin Total
History 57 51 18 126
Geography 45 12 17 74
Total 102 63 35 200
b 17.5%
c History
EXERCISE 5
1 ▶ Mean = 4, median = 4, mode = 4
2 ▶ Mean = 5, median = 4, mode = none
3 ▶ Mean = 6, median = 4, mode = 0
4 ▶ Mean = 4.75, median = 5, mode = 7 and 9
5 ▶ Mean = 30.5, median = 31, mode = 31
6 ▶ 4
7 ▶ 43
8 ▶ 1
1 ▶ Mean = 3, median = 2, mode = 0
2 ▶ Mean = 66, median = 70.5, mode = 72
3 ▶ Mean = 82.375, median = 71, mode = none
4 ▶ Mean = 0.62, median = 0.575, mode = 0.46
5 ▶ Mean = 12.9, median = 12, mode = none
6 ▶ Mean = 92.9
7 ▶ 11 and 15, 12 and 14, or 13 and 13
8 ▶ x = 3, y = 6, z = 9
1 ▶ a Mean £19 400, median £15 000, mode £12 000
b Median; mean is distorted by one high salary and mode is lowest salary so neither of these gives a typical salary.
2 ▶ a Median; the low value of 6 s distorts the mean, making it too low, and the mode gives the longest time so neither of these is typical.
b Mode; the data is qualitative so you cannot work out the mean or median.
3 ▶ a Mean = 14.2, median = 13, mode = 12
b Size 12; the most popular size is the one that is most likely to be purchased.
4 ▶ a Mean = 194, mode = 180, median = 180
b Mean. This takes into account lower and higher values throughout the week.
1 ▶ a Mean = 8.375, median = 7.75, mode = 7
b Mode; this is the most popular shoe size so it makes sense to order what customers are likely to want to buy. The values of mean and median aren’t proper shoe sizes.
2 ▶ a Mean = 53, median = 47, mode = 47
b Mean. This is the highest therefore they will wish to work on a ‘worst case scenario’. They will also want an excuse to charge more!
EXERCISE 3
EXERCISE 3*
EXERCISE 4
EXERCISE 4*
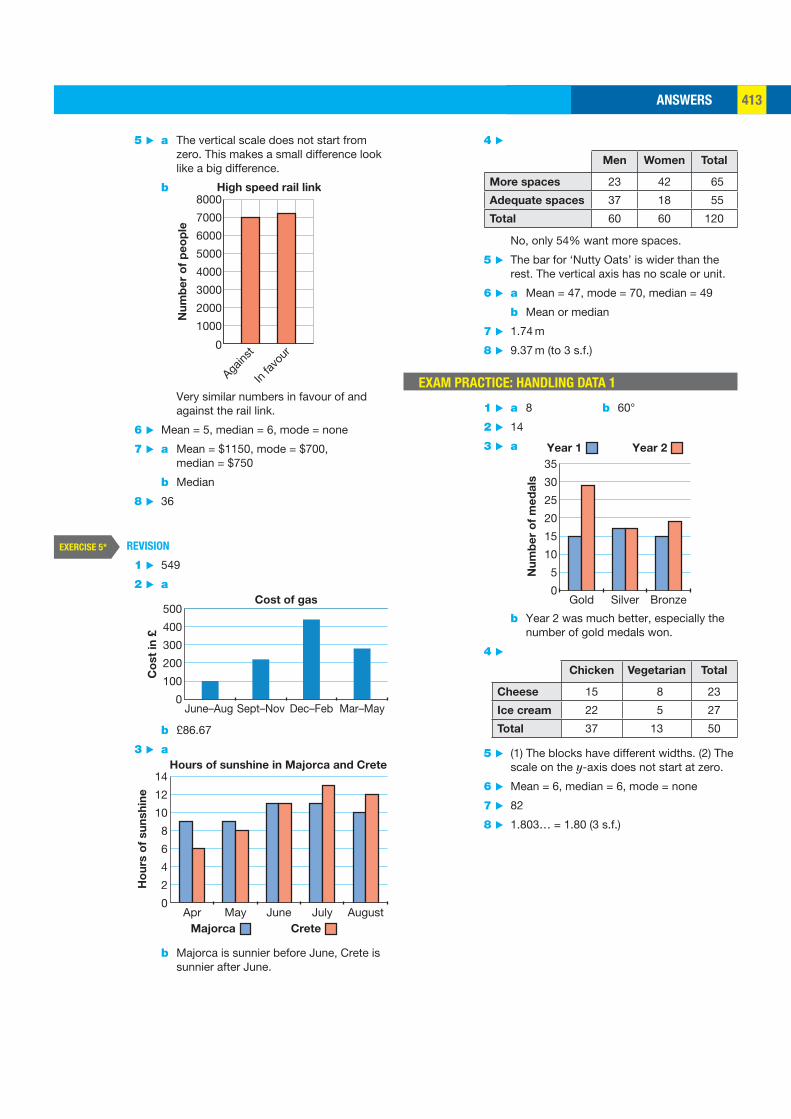
ANSWERS 413
4 ▶
Men Women Total
More spaces 23 42 65
Adequate spaces 37 18 55
Total 60 60 120
No, only 54% want more spaces.
5 ▶ The bar for ‘Nutty Oats’ is wider than the rest. The vertical axis has no scale or unit.
6 ▶ a Mean = 47, mode = 70, median = 49
b Mean or median
7 ▶ 1.74 m
8 ▶ 9.37 m (to 3 s.f.)
EXAM PRACTICE: HANDLING DATA 1
1 ▶ a 8 b 60°
2 ▶ 14
3 ▶ a
Nu
mb
er
of
me
da
ls
Gold0
5
10
15
20
25
30
35
Silver Bronze
Year 2Year 1
b Year 2 was much better, especially the number of gold medals won.
4 ▶
Chicken Vegetarian Total
Cheese 15 8 23
Ice cream 22 5 27
Total 37 13 50
5 ▶ (1) The blocks have different widths. (2) The scale on the y-axis does not start at zero.
6 ▶ Mean = 6, median = 6, mode = none
7 ▶ 82
8 ▶ 1.803… = 1.80 (3 s.f.)
5 ▶ a The vertical scale does not start from zero. This makes a small difference look like a big difference.
b
2000
0
4000
6000
8000High speed rail link
Nu
mb
er
of
pe
op
le
1000
3000
5000
7000
Agains
t
In fav
our
Very similar numbers in favour of and against the rail link.
6 ▶ Mean = 5, median = 6, mode = none
7 ▶ a Mean = $1150, mode = $700, median = $750
b Median
8 ▶ 36
REVISION
1 ▶ 549
2 ▶ a
Co
st
in £
June–Aug0
100
200
300
400
500
Sept–Nov Dec–Feb
Cost of gas
Mar–May
b £86.67
3 ▶ a
Ho
urs
of
su
nsh
ine
Hours of sunshine in Majorca and Crete
Apr0
2
4
6
8
10
12
14
May JuneCreteMajorca
July August
b Majorca is sunnier before June, Crete is sunnier after June.
EXERCISE 5*
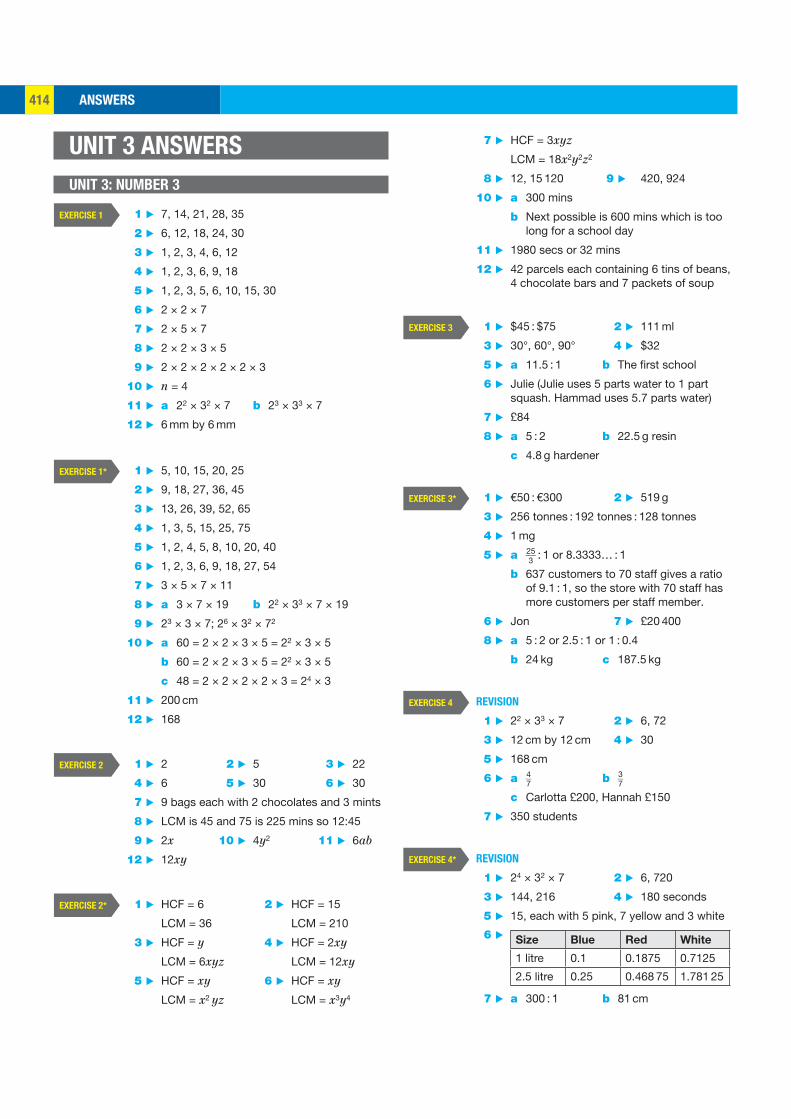
ANSWERS414
7 ▶ HCF = 3xyz
LCM = 18x2y2z2
8 ▶ 12, 15 120 9 ▶ 420, 924
10 ▶ a 300 mins
b Next possible is 600 mins which is too long for a school day
11 ▶ 1980 secs or 32 mins
12 ▶ 42 parcels each containing 6 tins of beans, 4 chocolate bars and 7 packets of soup
1 ▶ $45 : $75 2 ▶ 111 ml
3 ▶ 30°, 60°, 90° 4 ▶ $32
5 ▶ a 11.5 : 1 b The first school
6 ▶ Julie (Julie uses 5 parts water to 1 part squash. Hammad uses 5.7 parts water)
7 ▶ £84
8 ▶ a 5 : 2 b 22.5 g resin
c 4.8 g hardener
1 ▶ €50 : €300 2 ▶ 519 g
3 ▶ 256 tonnes : 192 tonnes : 128 tonnes
4 ▶ 1 mg
5 ▶ a 25 __ 3 : 1 or 8.3333… : 1
b 637 customers to 70 staff gives a ratio of 9.1 : 1, so the store with 70 staff has more customers per staff member.
6 ▶ Jon 7 ▶ £20 400
8 ▶ a 5 : 2 or 2.5 : 1 or 1 : 0.4
b 24 kg c 187.5 kg
REVISION
1 ▶ 22 × 33 × 7 2 ▶ 6, 72
3 ▶ 12 cm by 12 cm 4 ▶ 30
5 ▶ 168 cm
6 ▶ a 4 _ 7 b 3 _ 7
c Carlotta £200, Hannah £150
7 ▶ 350 students
REVISION
1 ▶ 24 × 32 × 7 2 ▶ 6, 720
3 ▶ 144, 216 4 ▶ 180 seconds
5 ▶ 15, each with 5 pink, 7 yellow and 3 white
6 ▶ Size Blue Red White
1 litre 0.1 0.1875 0.7125
2.5 litre 0.25 0.468 75 1.781 25
7 ▶ a 300 : 1 b 81 cm
EXERCISE 3
EXERCISE 3*
EXERCISE 4
EXERCISE 4*
UNIT 3 ANSWERS
UNIT 3: NUMBER 3
1 ▶ 7, 14, 21, 28, 35
2 ▶ 6, 12, 18, 24, 30
3 ▶ 1, 2, 3, 4, 6, 12
4 ▶ 1, 2, 3, 6, 9, 18
5 ▶ 1, 2, 3, 5, 6, 10, 15, 30
6 ▶ 2 × 2 × 7
7 ▶ 2 × 5 × 7
8 ▶ 2 × 2 × 3 × 5
9 ▶ 2 × 2 × 2 × 2 × 2 × 3
10 ▶ n = 4
11 ▶ a 22 × 32 × 7 b 23 × 33 × 7
12 ▶ 6 mm by 6 mm
1 ▶ 5, 10, 15, 20, 25
2 ▶ 9, 18, 27, 36, 45
3 ▶ 13, 26, 39, 52, 65
4 ▶ 1, 3, 5, 15, 25, 75
5 ▶ 1, 2, 4, 5, 8, 10, 20, 40
6 ▶ 1, 2, 3, 6, 9, 18, 27, 54
7 ▶ 3 × 5 × 7 × 11
8 ▶ a 3 × 7 × 19 b 22 × 33 × 7 × 19
9 ▶ 23 × 3 × 7; 26 × 32 × 72
10 ▶ a 60 = 2 × 2 × 3 × 5 = 22 × 3 × 5
b 60 = 2 × 2 × 3 × 5 = 22 × 3 × 5
c 48 = 2 × 2 × 2 × 2 × 3 = 24 × 3
11 ▶ 200 cm
12 ▶ 168
1 ▶ 2 2 ▶ 5 3 ▶ 22
4 ▶ 6 5 ▶ 30 6 ▶ 30
7 ▶ 9 bags each with 2 chocolates and 3 mints
8 ▶ LCM is 45 and 75 is 225 mins so 12:45
9 ▶ 2x 10 ▶ 4y2 11 ▶ 6ab
12 ▶ 12xy
1 ▶ HCF = 6 2 ▶ HCF = 15
LCM = 36 LCM = 210
3 ▶ HCF = y 4 ▶ HCF = 2xy
LCM = 6xyz LCM = 12xy
5 ▶ HCF = xy 6 ▶ HCF = xy
LCM = x2 yz LCM = x3y4
EXERCISE 1
EXERCISE 1*
EXERCISE 2
EXERCISE 2*
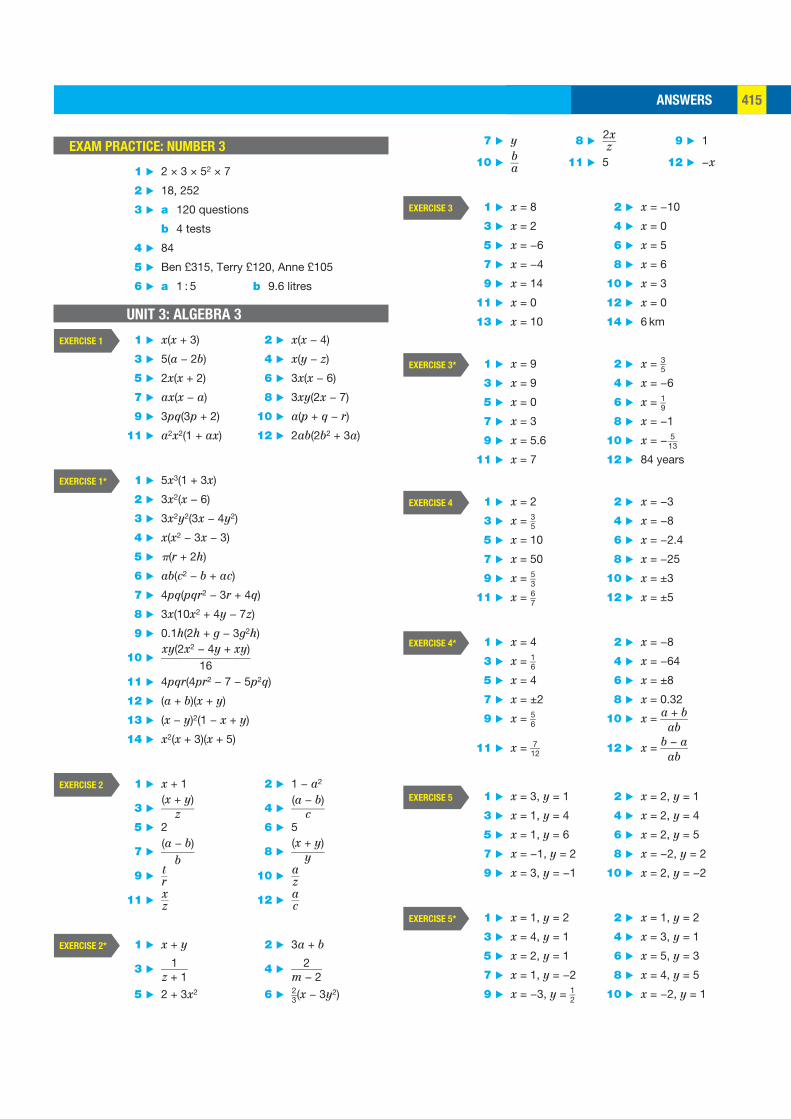
ANSWERS 415
7 ▶ y 8 ▶ 2x ___ z 9 ▶ 1
10 ▶ b __ a 11 ▶ 5 12 ▶ −x
1 ▶ x = 8 2 ▶ x = −10
3 ▶ x = 2 4 ▶ x = 0
5 ▶ x = −6 6 ▶ x = 5
7 ▶ x = −4 8 ▶ x = 6
9 ▶ x = 14 10 ▶ x = 3
11 ▶ x = 0 12 ▶ x = 0
13 ▶ x = 10 14 ▶ 6 km
1 ▶ x = 9 2 ▶ x = 3 _ 5
3 ▶ x = 9 4 ▶ x = −6
5 ▶ x = 0 6 ▶ x = 1 _ 9
7 ▶ x = 3 8 ▶ x = −1
9 ▶ x = 5.6 10 ▶ x = − 5 __ 13
11 ▶ x = 7 12 ▶ 84 years
1 ▶ x = 2 2 ▶ x = −3
3 ▶ x = 3 _ 5 4 ▶ x = −8
5 ▶ x = 10 6 ▶ x = −2.4
7 ▶ x = 50 8 ▶ x = −25
9 ▶ x = 5 _ 3 10 ▶ x = ±3
11 ▶ x = 6 _ 7 12 ▶ x = ±5
1 ▶ x = 4 2 ▶ x = −8
3 ▶ x = 1 _ 6 4 ▶ x = −64
5 ▶ x = 4 6 ▶ x = ±8
7 ▶ x = ±2 8 ▶ x = 0.32
9 ▶ x = 5 _ 6 10 ▶ x = a + b _____ ab
11 ▶ x = 7 __ 12 12 ▶ x = b − a _____ ab
1 ▶ x = 3, y = 1 2 ▶ x = 2, y = 1
3 ▶ x = 1, y = 4 4 ▶ x = 2, y = 4
5 ▶ x = 1, y = 6 6 ▶ x = 2, y = 5
7 ▶ x = −1, y = 2 8 ▶ x = −2, y = 2
9 ▶ x = 3, y = −1 10 ▶ x = 2, y = −2
1 ▶ x = 1, y = 2 2 ▶ x = 1, y = 2
3 ▶ x = 4, y = 1 4 ▶ x = 3, y = 1
5 ▶ x = 2, y = 1 6 ▶ x = 5, y = 3
7 ▶ x = 1, y = −2 8 ▶ x = 4, y = 5
9 ▶ x = −3, y = 1 _ 2 10 ▶ x = −2, y = 1
EXERCISE 3
EXERCISE 3*
EXERCISE 4
EXERCISE 4*
EXERCISE 5
EXERCISE 5*
EXAM PRACTICE: NUMBER 3
1 ▶ 2 × 3 × 52 × 7
2 ▶ 18, 252
3 ▶ a 120 questions
b 4 tests
4 ▶ 84
5 ▶ Ben £315, Terry £120, Anne £105
6 ▶ a 1 : 5 b 9.6 litres
UNIT 3: ALGEBRA 3
1 ▶ x(x + 3) 2 ▶ x(x − 4)
3 ▶ 5(a − 2b) 4 ▶ x(y − z)
5 ▶ 2x(x + 2) 6 ▶ 3x(x − 6)
7 ▶ ax(x − a) 8 ▶ 3xy(2x − 7)
9 ▶ 3pq(3p + 2) 10 ▶ a(p + q − r)
11 ▶ a2x2(1 + ax) 12 ▶ 2ab(2b2 + 3a)
1 ▶ 5x3(1 + 3x)
2 ▶ 3x2(x − 6)
3 ▶ 3x2y2(3x − 4y2)
4 ▶ x(x2 − 3x − 3)
5 ▶ �(r + 2h)
6 ▶ ab(c2 − b + ac)
7 ▶ 4pq(pqr2 − 3r + 4q)
8 ▶ 3x(10x2 + 4y − 7z)
9 ▶ 0.1h(2h + g − 3g2h)
10 ▶ xy(2x2 − 4y + xy)
________________ 16
11 ▶ 4pqr(4pr2 − 7 − 5p2q)
12 ▶ (a + b)(x + y)
13 ▶ (x − y)2(1 − x + y)
14 ▶ x2(x + 3)(x + 5)
1 ▶ x + 1 2 ▶ 1 − a2
3 ▶ (x + y)
______ z 4 ▶ (a − b)
______ c
5 ▶ 2 6 ▶ 5
7 ▶ (a − b)
______ b 8 ▶
(x + y) ______ y
9 ▶ t __ r 10 ▶ a __ z
11 ▶ x __ z 12 ▶ a __ c
1 ▶ x + y 2 ▶ 3a + b
3 ▶ 1 _____ z + 1
4 ▶ 2 ______ m − 2
5 ▶ 2 + 3x2 6 ▶ 2 _ 3 (x − 3y2)
EXERCISE 1
EXERCISE 1*
EXERCISE 2
EXERCISE 2*
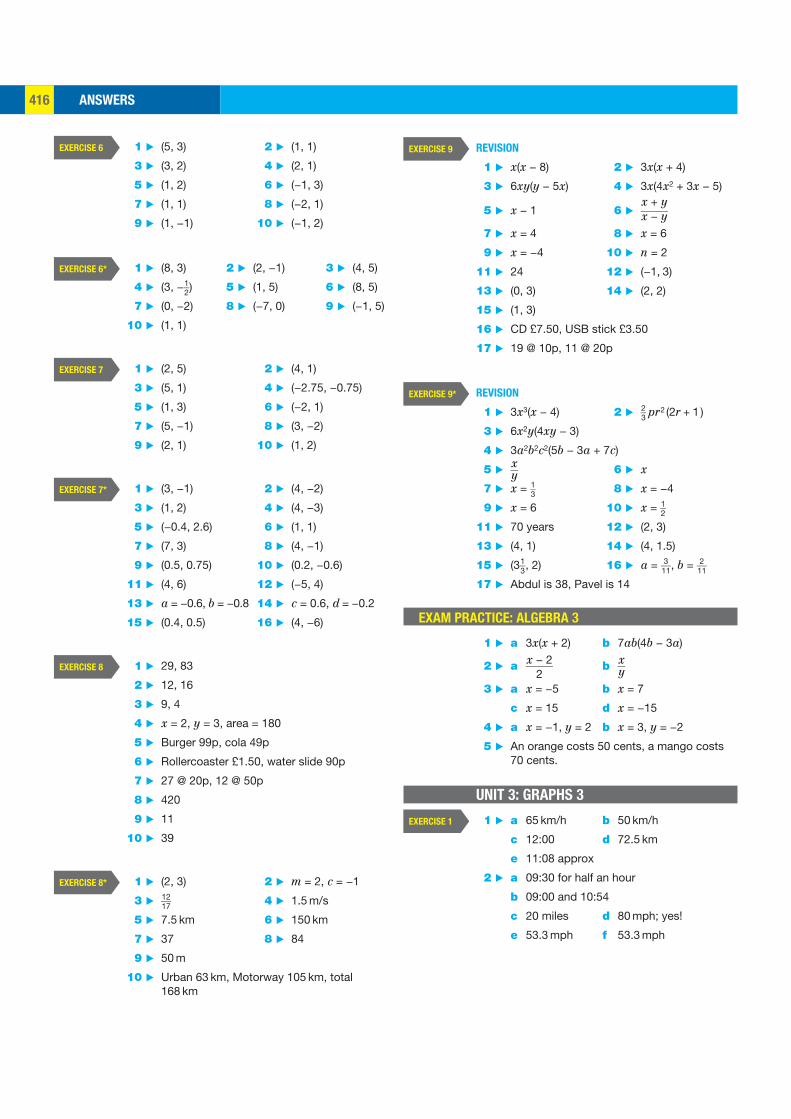
ANSWERS416
REVISION
1 ▶ x(x − 8) 2 ▶ 3x(x + 4)
3 ▶ 6xy(y − 5x) 4 ▶ 3x(4x2 + 3x − 5)
5 ▶ x − 1 6 ▶ x + y
_____ x − y
7 ▶ x = 4 8 ▶ x = 6
9 ▶ x = −4 10 ▶ n = 2
11 ▶ 24 12 ▶ (−1, 3)
13 ▶ (0, 3) 14 ▶ (2, 2)
15 ▶ (1, 3)
16 ▶ CD £7.50, USB stick £3.50
17 ▶ 19 @ 10p, 11 @ 20p
REVISION
1 ▶ 3x3(x − 4) 2 ▶ 2 _ 3 pr 2 (2r + 1 )
3 ▶ 6x2y(4xy − 3)
4 ▶ 3a2b2c2(5b − 3a + 7c)
5 ▶ x __ y 6 ▶ x
7 ▶ x = 1 _ 3 8 ▶ x = −4
9 ▶ x = 6 10 ▶ x = 1 _ 2
11 ▶ 70 years 12 ▶ (2, 3)
13 ▶ (4, 1) 14 ▶ (4, 1.5)
15 ▶ (3 1 _ 3 , 2) 16 ▶ a = 3 __ 11 , b = 2 __ 11
17 ▶ Abdul is 38, Pavel is 14
EXAM PRACTICE: ALGEBRA 3
1 ▶ a 3x(x + 2) b 7ab(4b − 3a)
2 ▶ a x − 2 _____ 2
b x __ y
3 ▶ a x = −5 b x = 7
c x = 15 d x = −15
4 ▶ a x = −1, y = 2 b x = 3, y = −2
5 ▶ An orange costs 50 cents, a mango costs 70 cents.
UNIT 3: GRAPHS 3
1 ▶ a 65 km/h b 50 km/h
c 12:00 d 72.5 km
e 11:08 approx
2 ▶ a 09:30 for half an hour
b 09:00 and 10:54
c 20 miles d 80 mph; yes!
e 53.3 mph f 53.3 mph
EXERCISE 9
EXERCISE 9*
EXERCISE 1
1 ▶ (5, 3) 2 ▶ (1, 1)
3 ▶ (3, 2) 4 ▶ (2, 1)
5 ▶ (1, 2) 6 ▶ (−1, 3)
7 ▶ (1, 1) 8 ▶ (−2, 1)
9 ▶ (1, −1) 10 ▶ (−1, 2)
1 ▶ (8, 3) 2 ▶ (2, −1) 3 ▶ (4, 5)
4 ▶ (3, − 1 _ 2 ) 5 ▶ (1, 5) 6 ▶ (8, 5)
7 ▶ (0, −2) 8 ▶ (−7, 0) 9 ▶ (−1, 5)
10 ▶ (1, 1)
1 ▶ (2, 5) 2 ▶ (4, 1)
3 ▶ (5, 1) 4 ▶ (−2.75, −0.75)
5 ▶ (1, 3) 6 ▶ (−2, 1)
7 ▶ (5, −1) 8 ▶ (3, −2)
9 ▶ (2, 1) 10 ▶ (1, 2)
1 ▶ (3, −1) 2 ▶ (4, −2)
3 ▶ (1, 2) 4 ▶ (4, −3)
5 ▶ (−0.4, 2.6) 6 ▶ (1, 1)
7 ▶ (7, 3) 8 ▶ (4, −1)
9 ▶ (0.5, 0.75) 10 ▶ (0.2, −0.6)
11 ▶ (4, 6) 12 ▶ (−5, 4)
13 ▶ a = −0.6, b = −0.8 14 ▶ c = 0.6, d = −0.2
15 ▶ (0.4, 0.5) 16 ▶ (4, −6)
1 ▶ 29, 83
2 ▶ 12, 16
3 ▶ 9, 4
4 ▶ x = 2, y = 3, area = 180
5 ▶ Burger 99p, cola 49p
6 ▶ Rollercoaster £1.50, water slide 90p
7 ▶ 27 @ 20p, 12 @ 50p
8 ▶ 420
9 ▶ 11
10 ▶ 39
1 ▶ (2, 3) 2 ▶ m = 2, c = −1
3 ▶ 12 __ 17 4 ▶ 1.5 m/s
5 ▶ 7.5 km 6 ▶ 150 km
7 ▶ 37 8 ▶ 84
9 ▶ 50 m
10 ▶ Urban 63 km, Motorway 105 km, total 168 km
EXERCISE 6
EXERCISE 6*
EXERCISE 7
EXERCISE 7*
EXERCISE 8
EXERCISE 8*
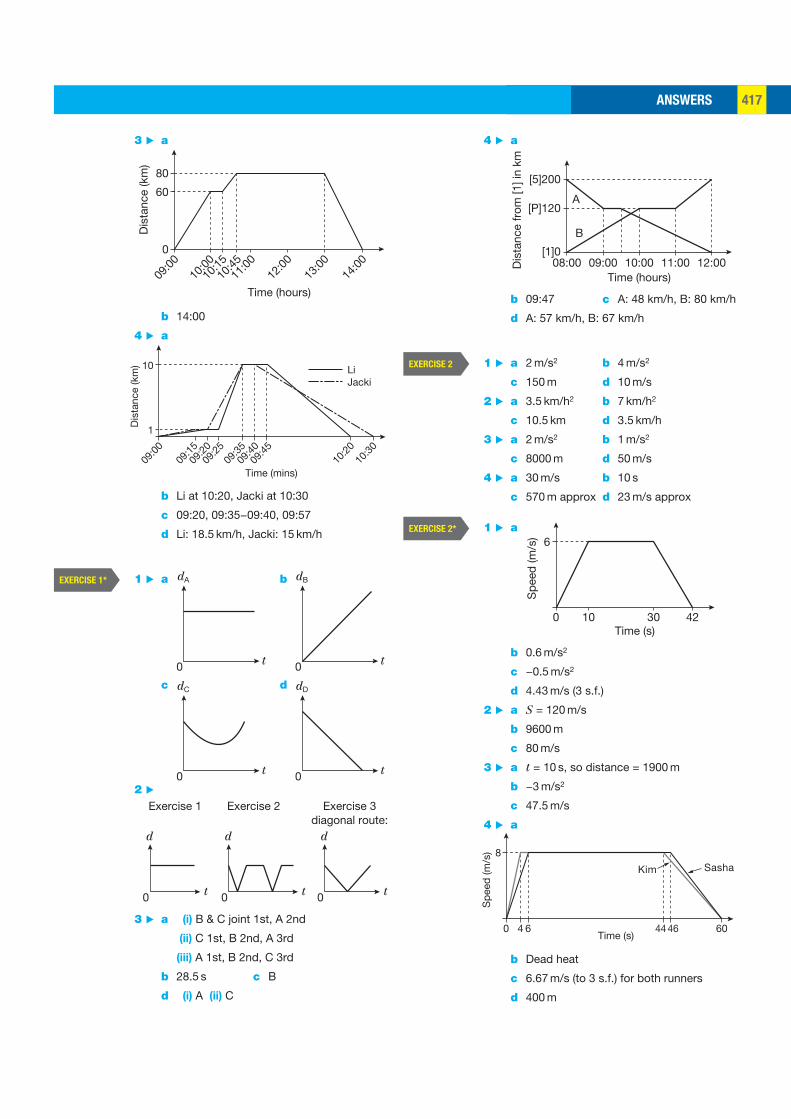
ANSWERS 417
4 ▶ a
08:00 09:00 10:00Time (hours)
B
A
Dis
tanc
e fr
om [1
] in
km
11:00 12:00[1]0
[P]120
[5]200
b 09:47 c A: 48 km/h, B: 80 km/h
d A: 57 km/h, B: 67 km/h
1 ▶ a 2 m/s2 b 4 m/s2
c 150 m d 10 m/s
2 ▶ a 3.5 km/h2 b 7 km/h2
c 10.5 km d 3.5 km/h
3 ▶ a 2 m/s2 b 1 m/s2
c 8000 m d 50 m/s
4 ▶ a 30 m/s b 10 s
c 570 m approx d 23 m/s approx
1 ▶ a S
peed
(m/s
)
0 10 30 42
6
Time (s)
b 0.6 m/s2
c −0.5 m/s2
d 4.43 m/s (3 s.f.)
2 ▶ a S = 120 m/s
b 9600 m
c 80 m/s
3 ▶ a t = 10 s, so distance = 1900 m
b −3 m/s2
c 47.5 m/s
4 ▶ a
Time (s)0
8SashaKim
Spe
ed (m
/s)
64 4644 60
b Dead heat
c 6.67 m/s (to 3 s.f.) for both runners
d 400 m
EXERCISE 2
EXERCISE 2*
3 ▶ a
Time (hours)
0
09:00
Dis
tanc
e (k
m)
60
80
10:0010
:1510
:4511
:0012
:0013
:0014
:00
b 14:00
4 ▶ a
Time (mins)
JackiLi
Dis
tanc
e (k
m) 10
1
09:00
09:1509
:2009
:2509
:3509
:4009
:4510
:2010
:30
b Li at 10:20, Jacki at 10:30
c 09:20, 09:35−09:40, 09:57
d Li: 18.5 km/h, Jacki: 15 km/h
1 ▶ a
t
dA
0
b
t
dB
0
c
t
dC
0
d
t
dD
0 2 ▶
t
d
Exercise 1
t
d
Exercise 2
t
d
Exercise 3diagonal route:
0 0 0
3 ▶ a (i) B & C joint 1st, A 2nd
(ii) C 1st, B 2nd, A 3rd
(iii) A 1st, B 2nd, C 3rd
b 28.5 s c B
d (i) A (ii) C
EXERCISE 1*
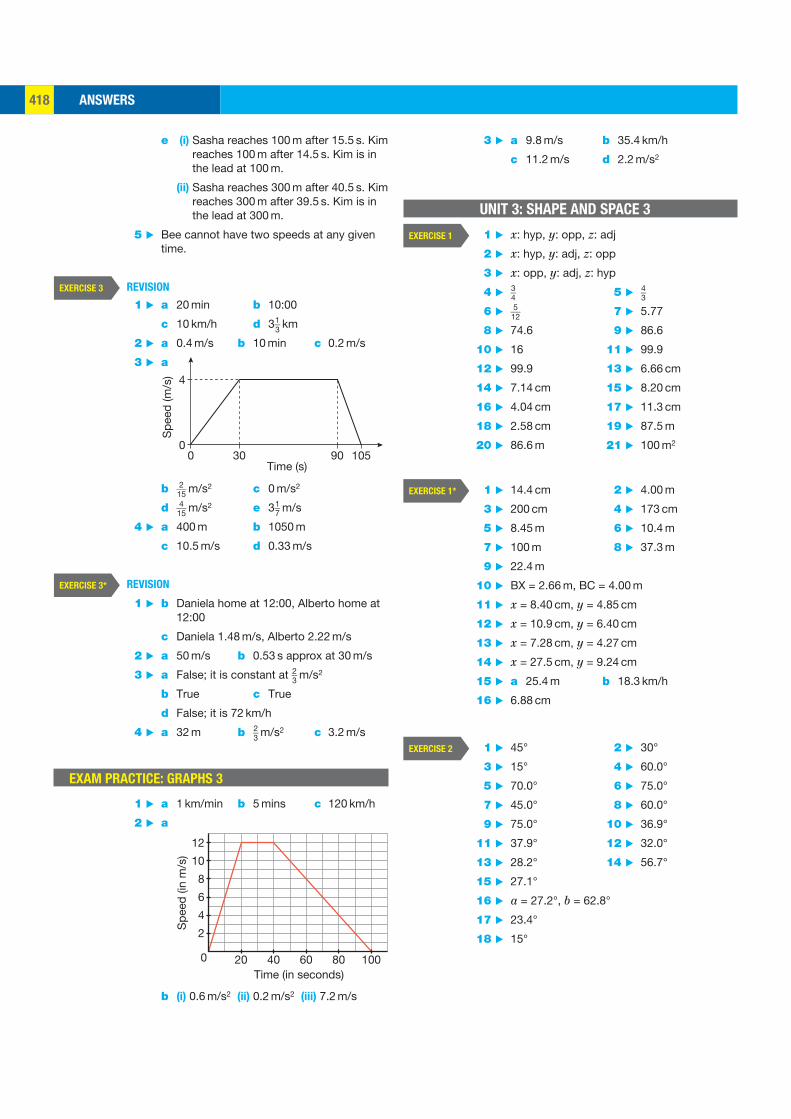
ANSWERS418
3 ▶ a 9.8 m/s b 35.4 km/h
c 11.2 m/s d 2.2 m/s2
UNIT 3: SHAPE AND SPACE 3
1 ▶ x: hyp, y: opp, z: adj
2 ▶ x: hyp, y: adj, z: opp
3 ▶ x: opp, y: adj, z: hyp
4 ▶ 3 _ 4 5 ▶ 4 _ 3
6 ▶ 5 __ 12 7 ▶ 5.77
8 ▶ 74.6 9 ▶ 86.6
10 ▶ 16 11 ▶ 99.9
12 ▶ 99.9 13 ▶ 6.66 cm
14 ▶ 7.14 cm 15 ▶ 8.20 cm
16 ▶ 4.04 cm 17 ▶ 11.3 cm
18 ▶ 2.58 cm 19 ▶ 87.5 m
20 ▶ 86.6 m 21 ▶ 100 m2
1 ▶ 14.4 cm 2 ▶ 4.00 m
3 ▶ 200 cm 4 ▶ 173 cm
5 ▶ 8.45 m 6 ▶ 10.4 m
7 ▶ 100 m 8 ▶ 37.3 m
9 ▶ 22.4 m
10 ▶ BX = 2.66 m, BC = 4.00 m
11 ▶ x = 8.40 cm, y = 4.85 cm
12 ▶ x = 10.9 cm, y = 6.40 cm
13 ▶ x = 7.28 cm, y = 4.27 cm
14 ▶ x = 27.5 cm, y = 9.24 cm
15 ▶ a 25.4 m b 18.3 km/h
16 ▶ 6.88 cm
1 ▶ 45° 2 ▶ 30°
3 ▶ 15° 4 ▶ 60.0°
5 ▶ 70.0° 6 ▶ 75.0°
7 ▶ 45.0° 8 ▶ 60.0°
9 ▶ 75.0° 10 ▶ 36.9°
11 ▶ 37.9° 12 ▶ 32.0°
13 ▶ 28.2° 14 ▶ 56.7°
15 ▶ 27.1°
16 ▶ a = 27.2°, b = 62.8°
17 ▶ 23.4°
18 ▶ 15°
EXERCISE 1
EXERCISE 1*
EXERCISE 2
e (i) Sasha reaches 100 m after 15.5 s. Kim reaches 100 m after 14.5 s. Kim is in the lead at 100 m.
(ii) Sasha reaches 300 m after 40.5 s. Kim reaches 300 m after 39.5 s. Kim is in the lead at 300 m.
5 ▶ Bee cannot have two speeds at any given time.
REVISION
1 ▶ a 20 min b 10:00
c 10 km/h d 3 1 _ 3 km
2 ▶ a 0.4 m/s b 10 min c 0.2 m/s
3 ▶ a
Time (s)
Spe
ed (m
/s)
00
4
30 90 105
b 2 __ 15 m/s2 c 0 m/s2
d 4 __ 15 m/s2 e 3 1 _ 7 m/s
4 ▶ a 400 m b 1050 m
c 10.5 m/s d 0.33 m/s
REVISION
1 ▶ b Daniela home at 12:00, Alberto home at 12:00
c Daniela 1.48 m/s, Alberto 2.22 m/s
2 ▶ a 50 m/s b 0.53 s approx at 30 m/s
3 ▶ a False; it is constant at 2 _ 3 m/s2
b True c True
d False; it is 72 km/h
4 ▶ a 32 m b 2 _ 3 m/s2 c 3.2 m/s
EXAM PRACTICE: GRAPHS 3
1 ▶ a 1 km/min b 5 mins c 120 km/h
2 ▶ a
Time (in seconds)
Spe
ed (i
n m
/s)
2
0
4
6
8
10
12
20 40 60 80 100
b (i) 0.6 m/s2 (ii) 0.2 m/s2 (iii) 7.2 m/s
EXERCISE 3
EXERCISE 3*
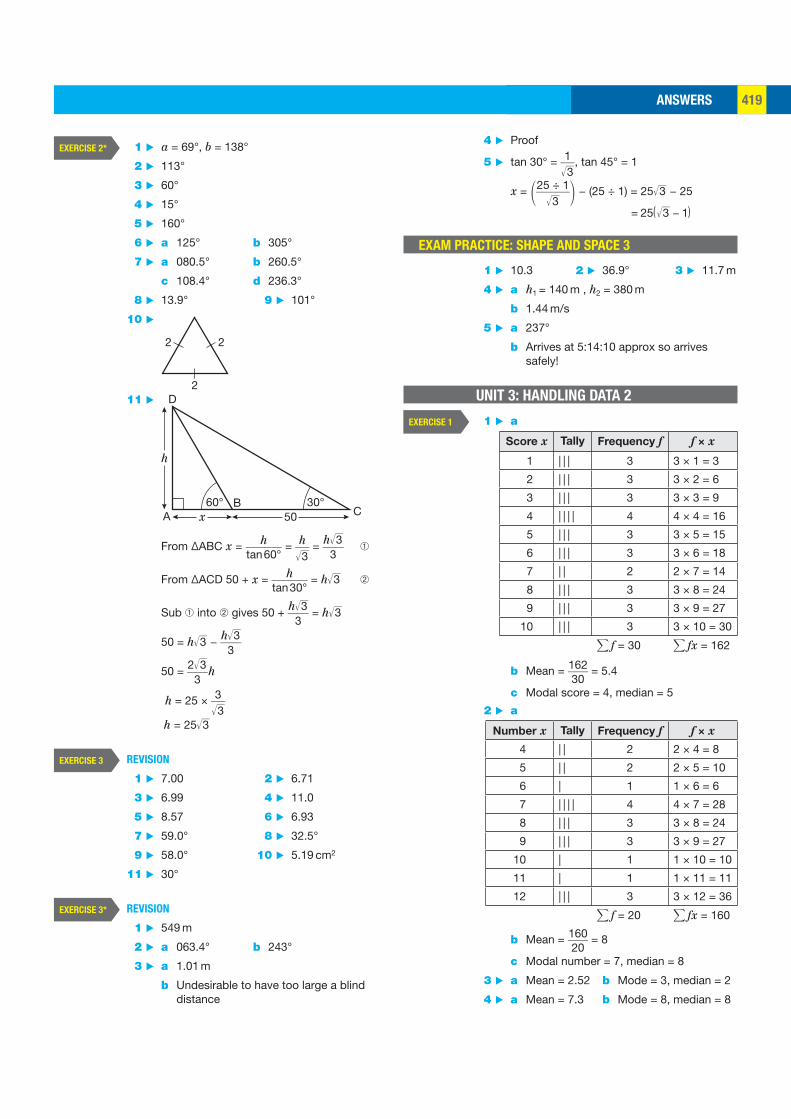
ANSWERS 419
4 ▶ Proof
5 ▶ tan 30° = 1 ___ √
__ 3 , tan 45° = 1
x = ( 25 ÷ 1 ______ √
__ 3 ) − (25 ÷ 1) = 25 √
__ 3 − 25
= 25 ( √ __
3 − 1)
EXAM PRACTICE: SHAPE AND SPACE 3
1 ▶ 10.3 2 ▶ 36.9° 3 ▶ 11.7 m
4 ▶ a h1 = 140 m , h2 = 380 m
b 1.44 m/s
5 ▶ a 237°
b Arrives at 5:14:10 approx so arrives safely!
UNIT 3: HANDLING DATA 2
1 ▶ a
Score x Tally Frequency f f × x
1 | | | 3 3 × 1 = 3
2 | | | 3 3 × 2 = 6
3 | | | 3 3 × 3 = 9
4 | | | | 4 4 × 4 = 16
5 | | | 3 3 × 5 = 15
6 | | | 3 3 × 6 = 18
7 | | 2 2 × 7 = 14
8 | | | 3 3 × 8 = 24
9 | | | 3 3 × 9 = 27
10 | | | 3 3 × 10 = 30
∑ f = 30 ∑ fx = 162
b Mean = 162 ____ 30
= 5.4
c Modal score = 4, median = 5
2 ▶ a
Number x Tally Frequency f f × x
4 | | 2 2 × 4 = 8
5 | | 2 2 × 5 = 10
6 | 1 1 × 6 = 6
7 | | | | 4 4 × 7 = 28
8 | | | 3 3 × 8 = 24
9 | | | 3 3 × 9 = 27
10 | 1 1 × 10 = 10
11 | 1 1 × 11 = 11
12 | | | 3 3 × 12 = 36
∑ f = 20 ∑ fx = 160
b Mean = 160 ____ 20
= 8
c Modal number = 7, median = 8
3 ▶ a Mean = 2.52 b Mode = 3, median = 2
4 ▶ a Mean = 7.3 b Mode = 8, median = 8
EXERCISE 1
1 ▶ a = 69°, b = 138°
2 ▶ 113°
3 ▶ 60°
4 ▶ 15°
5 ▶ 160°
6 ▶ a 125° b 305°
7 ▶ a 080.5° b 260.5°
c 108.4° d 236.3°
8 ▶ 13.9° 9 ▶ 101°
10 ▶
2
2 2
11 ▶ D
A x
h
CB60° 30°
50
From ΔABC x = h _______ tan 60°
= h ___ √
__ 3 = h √
__ 3 ____
3
From ΔACD 50 + x = h _______ tan 30°
= h √ __
3
Sub into gives 50 + h √ __
3 ____ 3
= h √ __
3
50 = h √ __
3 − h √ __
3 ____ 3
50 = 2 √ __
3 ____ 3
h
h = 25 × 3 ___ √
__ 3
h = 25 √ __
3
REVISION
1 ▶ 7.00 2 ▶ 6.71
3 ▶ 6.99 4 ▶ 11.0
5 ▶ 8.57 6 ▶ 6.93
7 ▶ 59.0° 8 ▶ 32.5°
9 ▶ 58.0° 10 ▶ 5.19 cm2
11 ▶ 30°
REVISION
1 ▶ 549 m
2 ▶ a 063.4° b 243°
3 ▶ a 1.01 m
b Undesirable to have too large a blind distance
EXERCISE 2*
EXERCISE 3
EXERCISE 3*
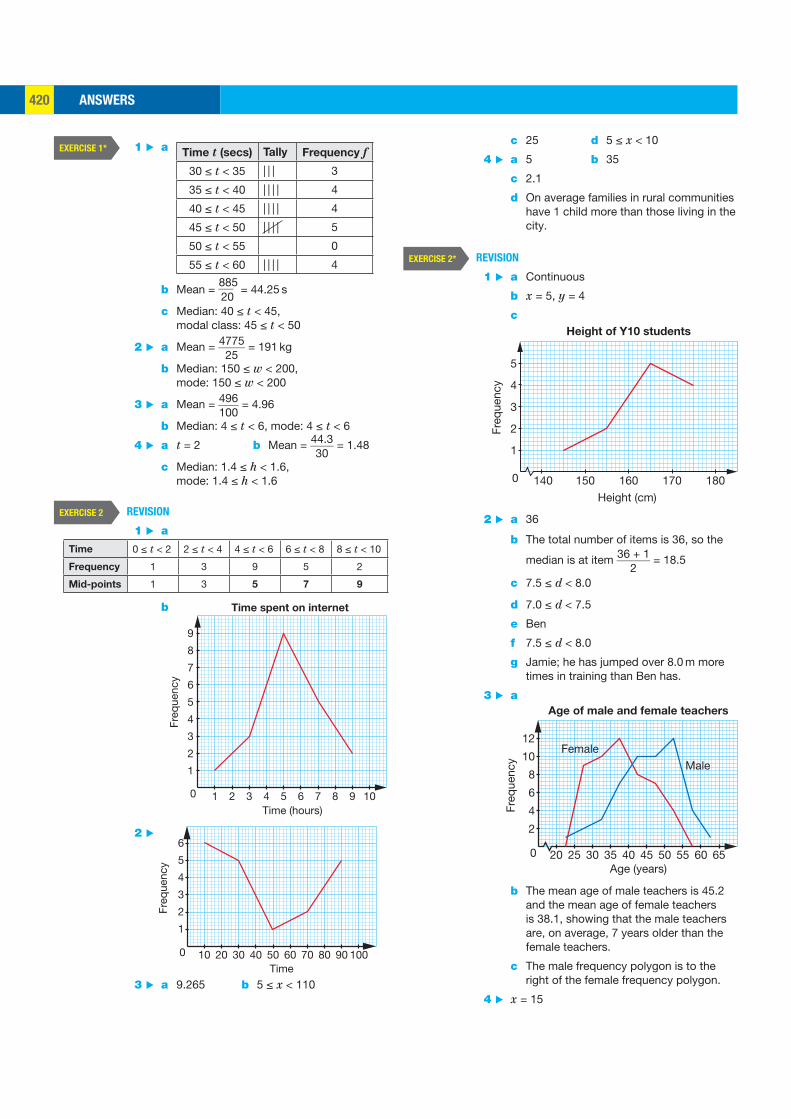
ANSWERS420
c 25 d 5 ≤ x < 10
4 ▶ a 5 b 35
c 2.1
d On average families in rural communities have 1 child more than those living in the city.
REVISION
1 ▶ a Continuous
b x = 5, y = 4
c
0
2
4
1
3
5
140 150 160 170 180Fr
eque
ncy
Height (cm)
Height of Y10 students
2 ▶ a 36
b The total number of items is 36, so the
median is at item 36 + 1 ______ 2
= 18.5
c 7.5 ≤ d < 8.0
d 7.0 ≤ d < 7.5
e Ben
f 7.5 ≤ d < 8.0
g Jamie; he has jumped over 8.0 m more times in training than Ben has.
3 ▶ a
2
4
6
8
10
12
25 3520
FemaleMale
30 45 55 60 6540 50
Freq
uenc
y
Age (years)
Age of male and female teachers
0
b The mean age of male teachers is 45.2 and the mean age of female teachers is 38.1, showing that the male teachers are, on average, 7 years older than the female teachers.
c The male frequency polygon is to the right of the female frequency polygon.
4 ▶ x = 15
EXERCISE 2*
1 ▶ aTime t (secs) Tally Frequency f
30 ≤ t < 35 | | | 3
35 ≤ t < 40 | | | | 4
40 ≤ t < 45 | | | | 4
45 ≤ t < 50 | | | | 5
50 ≤ t < 55 0
55 ≤ t < 60 | | | | 4
b Mean = 885
___ 20
= 44.25 s
c Median: 40 ≤ t < 45, modal class: 45 ≤ t < 50
2 ▶ a Mean = 4775 _____ 25
= 191 kg
b Median: 150 ≤ w < 200, mode: 150 ≤ w < 200
3 ▶ a Mean = 496 ____ 100
= 4.96
b Median: 4 ≤ t < 6, mode: 4 ≤ t < 6
4 ▶ a t = 2 b Mean = 44.3 _____ 30
= 1.48
c Median: 1.4 ≤ h < 1.6, mode: 1.4 ≤ h < 1.6
REVISION
1 ▶ a
Time 0 ≤ t < 2 2 ≤ t < 4 4 ≤ t < 6 6 ≤ t < 8 8 ≤ t < 10
Frequency 1 3 9 5 2
Mid-points 1 3 5 7 9
b
1
2
3
4
5
6
7
8
9
2 41 3 6 8 9 105 7
Freq
uenc
y
Time (hours)
Time spent on internet
0
2 ▶
1
20 4010 30 60 8050 70 10090
2
3
4
5
6
Freq
uenc
y
Time
0
3 ▶ a 9.265 b 5 ≤ x < 110
EXERCISE 1*
EXERCISE 2
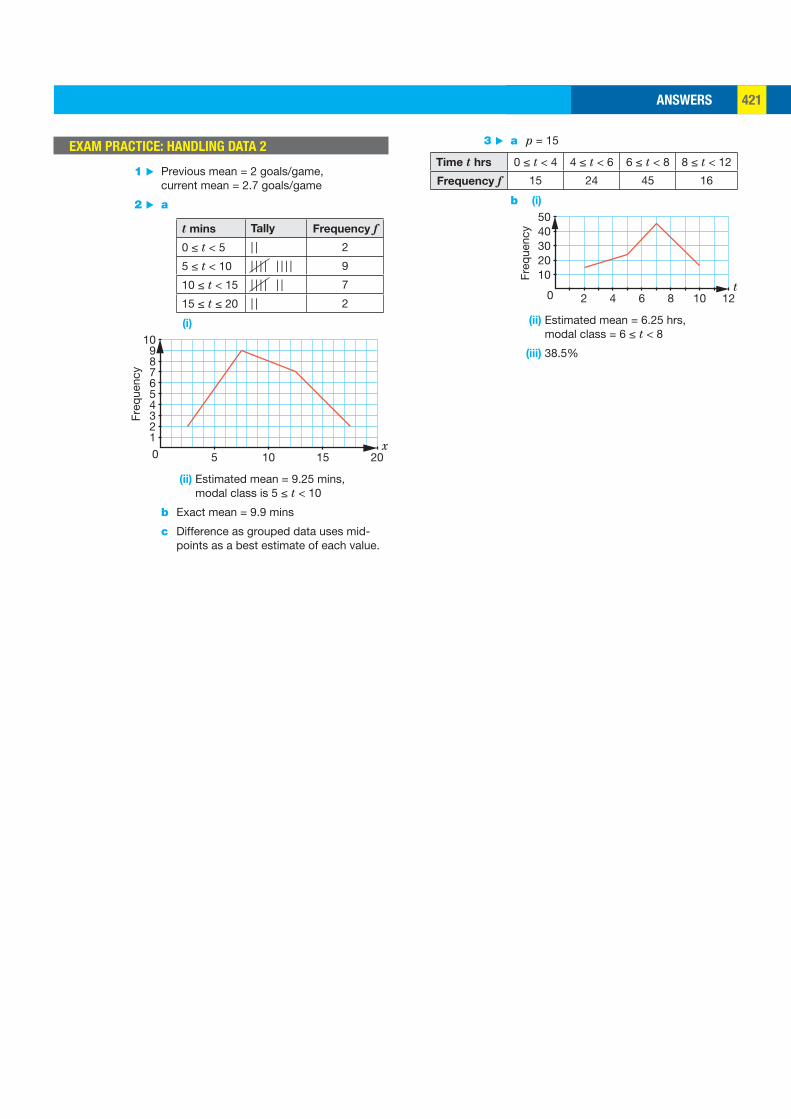
ANSWERS 421
3 ▶ a p = 15
Time t hrs 0 ≤ t < 4 4 ≤ t < 6 6 ≤ t < 8 8 ≤ t < 12
Frequency f 15 24 45 16
b (i)
Freq
uenc
y
t1020304050
2 4 6 8 10 120
(ii) Estimated mean = 6.25 hrs, modal class = 6 ≤ t < 8
(iii) 38.5%
EXAM PRACTICE: HANDLING DATA 2
1 ▶ Previous mean = 2 goals/game, current mean = 2.7 goals/game
2 ▶ a
t mins Tally Frequency f
0 ≤ t < 5 | | 2
5 ≤ t < 10 | | | | | | | | 9
10 ≤ t < 15 | | | | | | 7
15 ≤ t ≤ 20 | | 2
(i)
Freq
uenc
y
123456789
10
5 10 15 20x
0
(ii) Estimated mean = 9.25 mins, modal class is 5 ≤ t < 10
b Exact mean = 9.9 mins
c Difference as grouped data uses mid-points as a best estimate of each value.
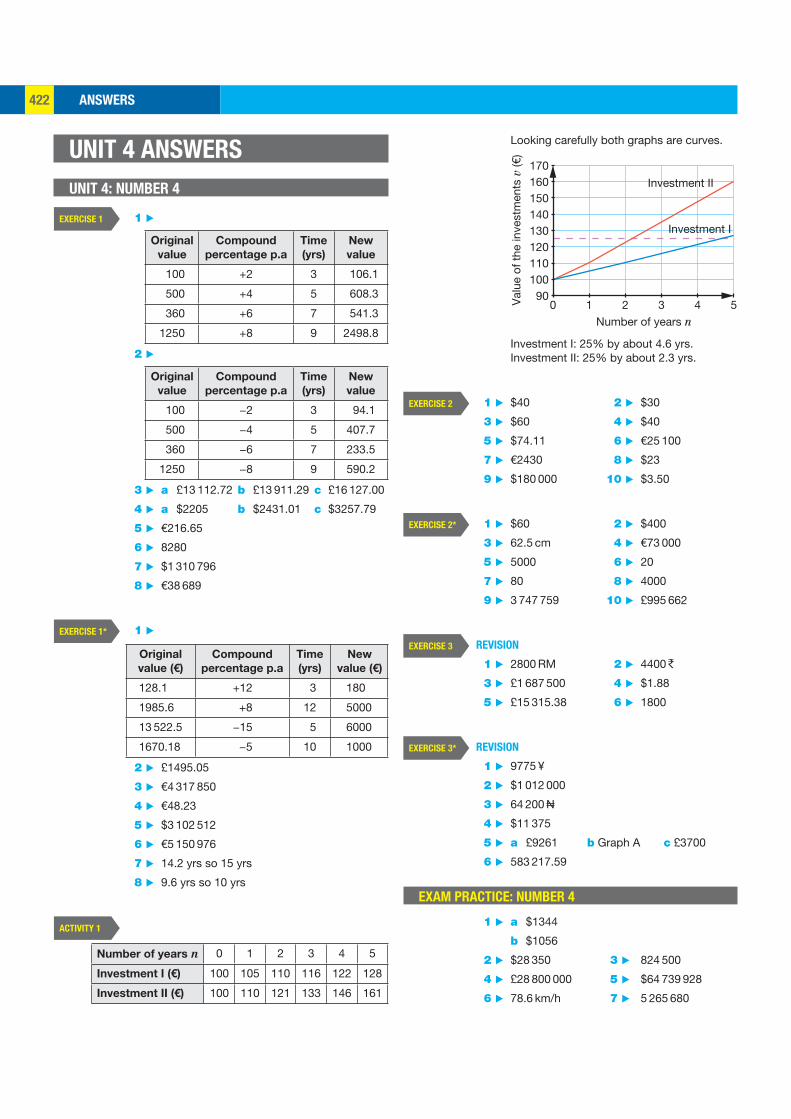
ANSWERS422
Looking carefully both graphs are curves.
Val
ue o
f the
inve
stm
ents
v (€
)
Number of years n
90100110120130140150160170
0 1 2 3 4 5
Investment I
Investment II
Investment I: 25% by about 4.6 yrs. Investment II: 25% by about 2.3 yrs.
1 ▶ $40 2 ▶ $30
3 ▶ $60 4 ▶ $40
5 ▶ $74.11 6 ▶ €25 100
7 ▶ €2430 8 ▶ $23
9 ▶ $180 000 10 ▶ $3.50
1 ▶ $60 2 ▶ $400
3 ▶ 62.5 cm 4 ▶ €73 000
5 ▶ 5000 6 ▶ 20
7 ▶ 80 8 ▶ 4000
9 ▶ 3 747 759 10 ▶ £995 662
REVISION
1 ▶ 2800 RM 2 ▶ 4400
3 ▶ £1 687 500 4 ▶ $1.88
5 ▶ £15 315.38 6 ▶ 1800
REVISION
1 ▶ 9775 ¥
2 ▶ $1 012 000
3 ▶ 64 200 N
4 ▶ $11 375
5 ▶ a £9261 b Graph A c £3700
6 ▶ 583 217.59
EXAM PRACTICE: NUMBER 4
1 ▶ a $1344
b $1056
2 ▶ $28 350 3 ▶ 824 500
4 ▶ £28 800 000 5 ▶ $64 739 928
6 ▶ 78.6 km/h 7 ▶ 5 265 680
EXERCISE 2
EXERCISE 2*
EXERCISE 3
EXERCISE 3*
UNIT 4 ANSWERS
UNIT 4: NUMBER 4
1 ▶
Original
value
Compound
percentage p.a
Time
(yrs)
New
value
100 +2 3 106.1
500 +4 5 608.3
360 +6 7 541.3
1250 +8 9 2498.8
2 ▶
Original
value
Compound
percentage p.a
Time
(yrs)
New
value
100 −2 3 94.1
500 −4 5 407.7
360 −6 7 233.5
1250 −8 9 590.2
3 ▶ a £13 112.72 b £13 911.29 c £16 127.00
4 ▶ a $2205 b $2431.01 c $3257.79
5 ▶ €216.65
6 ▶ 8280
7 ▶ $1 310 796
8 ▶ €38 689
1 ▶
Original
value (€)
Compound
percentage p.a
Time
(yrs)
New
value (€)
128.1 +12 3 180
1985.6 +8 12 5000
13 522.5 −15 5 6000
1670.18 −5 10 1000
2 ▶ £1495.05
3 ▶ €4 317 850
4 ▶ €48.23
5 ▶ $3 102 512
6 ▶ €5 150 976
7 ▶ 14.2 yrs so 15 yrs
8 ▶ 9.6 yrs so 10 yrs
Number of years n 0 1 2 3 4 5
Investment I (€) 100 105 110 116 122 128
Investment II (€) 100 110 121 133 146 161
EXERCISE 1
EXERCISE 1*
ACTIVITY 1
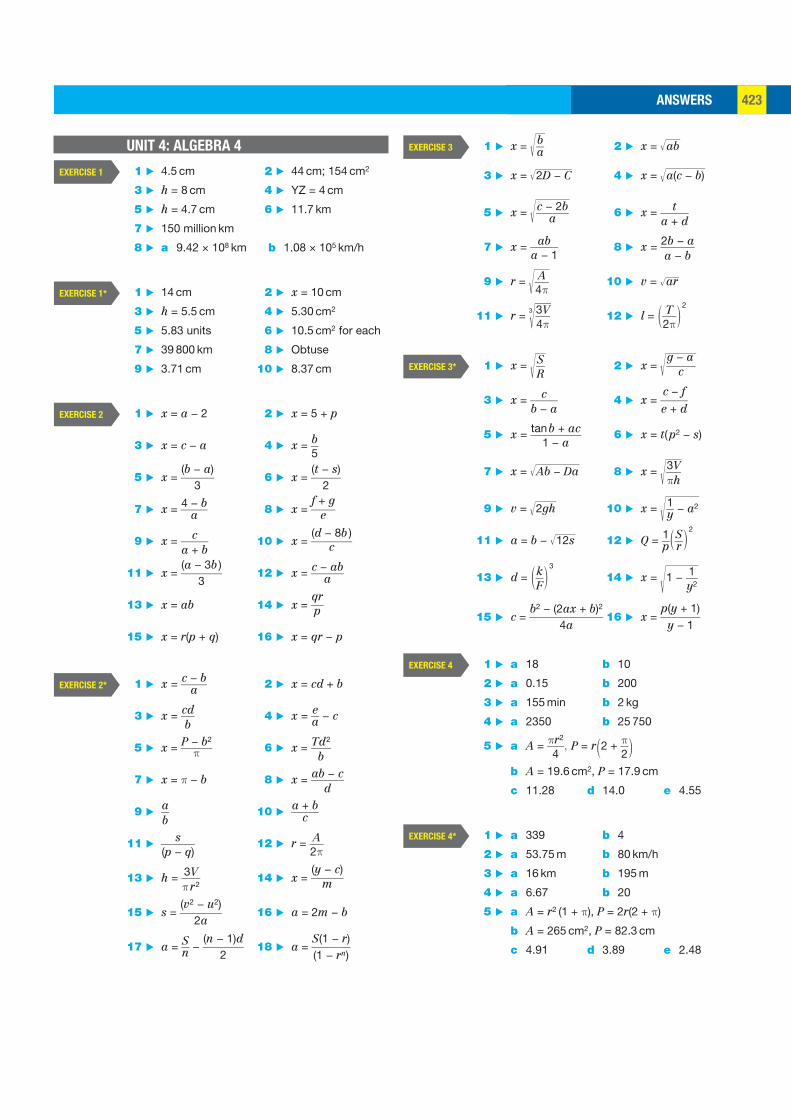
ANSWERS 423
1 ▶ x = √ __
b __ a 2 ▶ x = √ ___
ab
3 ▶ x = √ _______
2D − C 4 ▶ x = √ _______
a(c − b)
5 ▶ x = √ ______
c − 2b ______ a 6 ▶ x = t _____ a + d
7 ▶ x = ab _____ a − 1
8 ▶ x = 2b − a ______ a − b
9 ▶ r = √ ___
A ___ 4π
10 ▶ v = √ ___
ar
11 ▶ r = 3 √ ___
3V ___ 4π
12 ▶ l = ( T ___ 2π
) 2
1 ▶ x = √ __
S __ R
2 ▶ x = √ ______
g − a
______ c
3 ▶ x = c _____ b − a
4 ▶ x = c − f
_____ e + d
5 ▶ x = tan b + ac _________ 1 − a
6 ▶ x = t( p2 − s)
7 ▶ x = √ ________
Ab − Da 8 ▶ x = √ ___
3V ___ πh
9 ▶ v = √ ____
2gh 10 ▶ x = √ ______
1 __ y − a2
11 ▶ a = b − √ ____
12s 12 ▶ Q = 1 __ p ( S __ r ) 2
13 ▶ d = ( k __ F
) 3
14 ▶ x = √ ______
1 − 1 ___ y2
15 ▶ c = b2 − (2ax + b)2
_____________ 4a
16 ▶ x = p(y + 1)
_______ y − 1
1 ▶ a 18 b 10
2 ▶ a 0.15 b 200
3 ▶ a 155 min b 2 kg
4 ▶ a 2350 b 25 750
5 ▶ a A = πr2 ___
4 , P = r (2 + π __
2 )
b A = 19.6 cm2, P = 17.9 cm
c 11.28 d 14.0 e 4.55
1 ▶ a 339 b 4
2 ▶ a 53.75 m b 80 km/h
3 ▶ a 16 km b 195 m
4 ▶ a 6.67 b 20
5 ▶ a A = r2 (1 + π), P = 2r(2 + π)
b A = 265 cm2, P = 82.3 cm
c 4.91 d 3.89 e 2.48
EXERCISE 3
EXERCISE 3*
EXERCISE 4
EXERCISE 4*
UNIT 4: ALGEBRA 4
1 ▶ 4.5 cm 2 ▶ 44 cm; 154 cm2
3 ▶ h = 8 cm 4 ▶ YZ = 4 cm
5 ▶ h = 4.7 cm 6 ▶ 11.7 km
7 ▶ 150 million km
8 ▶ a 9.42 × 10⁸ km b 1.08 × 10⁵ km/h
1 ▶ 14 cm 2 ▶ x = 10 cm
3 ▶ h = 5.5 cm 4 ▶ 5.30 cm2
5 ▶ 5.83 units 6 ▶ 10.5 cm2 for each
7 ▶ 39 800 km 8 ▶ Obtuse
9 ▶ 3.71 cm 10 ▶ 8.37 cm
1 ▶ x = a − 2 2 ▶ x = 5 + p
3 ▶ x = c − a 4 ▶ x = b __ 5
5 ▶ x = (b − a)
______ 3
6 ▶ x = (t − s)
______ 2
7 ▶ x = 4 − b _____ a 8 ▶ x = f + g
_____ e
9 ▶ x = c _____ a + b
10 ▶ x = (d − 8b )
________ c
11 ▶ x = (a − 3b )
________ 3
12 ▶ x = c − ab ______ a
13 ▶ x = ab 14 ▶ x = qr
___ p
15 ▶ x = r(p + q) 16 ▶ x = qr − p
1 ▶ x = c − b _____ a 2 ▶ x = cd + b
3 ▶ x = cd ___ b 4 ▶ x = e __ a − c
5 ▶ x = P − b2 ______ π 6 ▶ x = Td2
____ b
7 ▶ x = π − b 8 ▶ x = ab − c ______ d
9 ▶ a __ b 10 ▶ a + b _____ c
11 ▶ s ______ (p − q)
12 ▶ r = A ___ 2π
13 ▶ h = 3V ____ π r 2
14 ▶ x = (y − c)
______ m
15 ▶ s = (v2 − u2)
________ 2a
16 ▶ a = 2m − b
17 ▶ a = S __ n − (n − 1)d
________ 2
18 ▶ a = S(1 − r)
_______ (1 − rn)
EXERCISE 1
EXERCISE 1*
EXERCISE 2
EXERCISE 2*

ANSWERS424
UNIT 4: GRAPHS 4
1 ▶
x
yy = x2 + 2
2
2 ▶ y = x2 + 2x
y
x–2
3 ▶
x
y = x2 + x + 2
2
4 ▶
y = 2x2 + 3x + 2
2
y
x
5 ▶ b
x 0 0.4 0.8 1.2 1.6 2.0
V 0 0.32 1.28 2.88 5.12 8
V = 2x2y
x
c 1.41 m × 1.41 m
d 0.72 m3
e 1.23 ≤ x ≤ 1.8
6 ▶ t 0 1 2 3 4 5 6
y 5 2.5 1 0.5 1 2.5 5
y = 0.5t2 – 3t + 55
y
t
b 5 m c 0.5 m, 3 s
d 0 m e 0 ≤ t ≤ 0.76, 5.24 ≤ t ≤ 6
EXERCISE 1
REVISION
1 ▶ x = b __ a 2 ▶ x = ac
3 ▶ x = a − c _____ b 4 ▶ y = √
__
d __ b
5 ▶ y = b2 __ a 6 ▶ y = d _____ a − c
7 ▶ y = bc _____ c − 1
8 ▶ a 35 km b 200 m c 27 km
9 ▶ a $26 b 100 c $1800
10 ▶ a A = πr2 ___
2 , P = r(2 + π)
b A = 39.3, P = 25.7
c 3.57 d 11.7 e 3.27
REVISION
1 ▶ x = c − b _____ a 2 ▶ x = b _____ a − d
3 ▶ x = ab − tan c _________ a 4 ▶ y = √ _____
a _____ b − c
5 ▶ y = ac − d ______ a − b
6 ▶ y = b − d(c − a)2
7 ▶ a A = r 2 __ 2
(1 + π), P = r(2 + √ __
2 + π )
b A = 18.6, P = 19.7
c 2.41 d 5.19 e 3.17
8 ▶ a 2 _ 3 b 3 s c 2.45 m
9 ▶ 3 : 1
10 ▶ a 0.75 b m1 − t
_______ m1t + 1
c 1
EXAM PRACTICE: ALGEBRA 4
1 ▶ a x = d − f
_____ 3
b x = p
__ 2
− q or x = p − 2q
______ 2
c x = bc − a
2 ▶ a x = √ _______
3C + B
b x = √ _______
y(a + z)
c x = pq _____
p − 1
3 ▶ a a = 2(s − ut)
________ t2
b a = 7.2 m/s
4 ▶ a P = r(π + 2)
b A = πr2 ___
2
c 2 + 4 __ π = 3.27 to 3 s.f.
EXERCISE 5
EXERCISE 5*
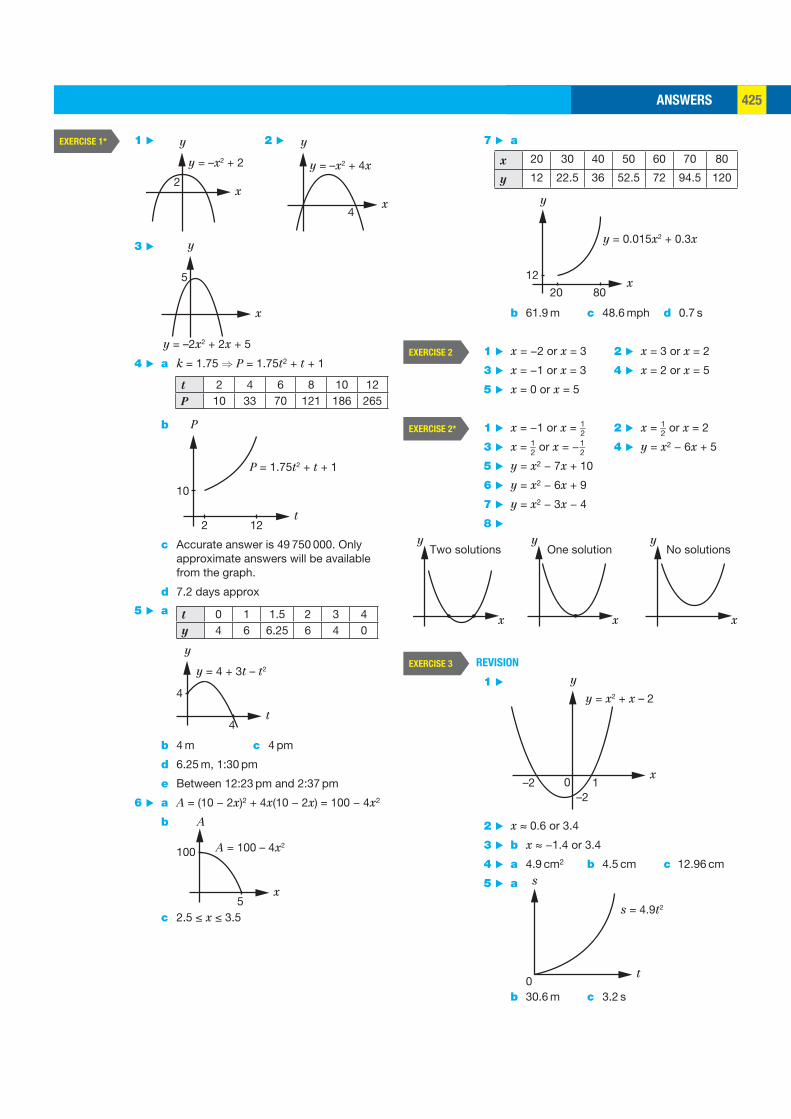
ANSWERS 425
7 ▶ a
x 20 30 40 50 60 70 80
y 12 22.5 36 52.5 72 94.5 120
y = 0.015x2 + 0.3x
12
y
x20 80
b 61.9 m c 48.6 mph d 0.7 s
1 ▶ x = −2 or x = 3 2 ▶ x = 3 or x = 2
3 ▶ x = −1 or x = 3 4 ▶ x = 2 or x = 5
5 ▶ x = 0 or x = 5
1 ▶ x = −1 or x = 1 _ 2 2 ▶ x = 1 _ 2 or x = 2
3 ▶ x = 1 _ 2 or x = − 1 _ 2 4 ▶ y = x2 − 6x + 5
5 ▶ y = x2 − 7x + 10
6 ▶ y = x2 − 6x + 9
7 ▶ y = x2 − 3x − 4
8 ▶
Two solutionsy
x
One solutiony
x
No solutionsy
x
REVISION
1 ▶ y = x2 + x – 2
y
x–2
–210
2 ▶ x ≈ 0.6 or 3.4
3 ▶ b x ≈ −1.4 or 3.4
4 ▶ a 4.9 cm2 b 4.5 cm c 12.96 cm
5 ▶ a
s = 4.9t2
s
t0
b 30.6 m c 3.2 s
EXERCISE 2
EXERCISE 2*
EXERCISE 3
1 ▶ 2 ▶
3 ▶
y = –2x2 + 2x + 5
5
y
x
4 ▶ a k = 1.75 ⇒ P = 1.75t2 + t + 1
t 2 4 6 8 10 12P 10 33 70 121 186 265
b
2
10
P = 1.75t2 + t + 1
P
t12
c Accurate answer is 49 750 000. Only approximate answers will be available from the graph.
d 7.2 days approx
5 ▶ a t 0 1 1.5 2 3 4y 4 6 6.25 6 4 0
y = 4 + 3t – t2
4
y
t4
b 4 m c 4 pm
d 6.25 m, 1:30 pm
e Between 12:23 pm and 2:37 pm
6 ▶ a A = (10 − 2x)2 + 4x(10 − 2x) = 100 − 4x2
b
A = 100 – 4x2100
A
x5
c 2.5 ≤ x ≤ 3.5
EXERCISE 1*
y = –x2 + 2
2
y
x
y = –x2 + 4x
4
y
x
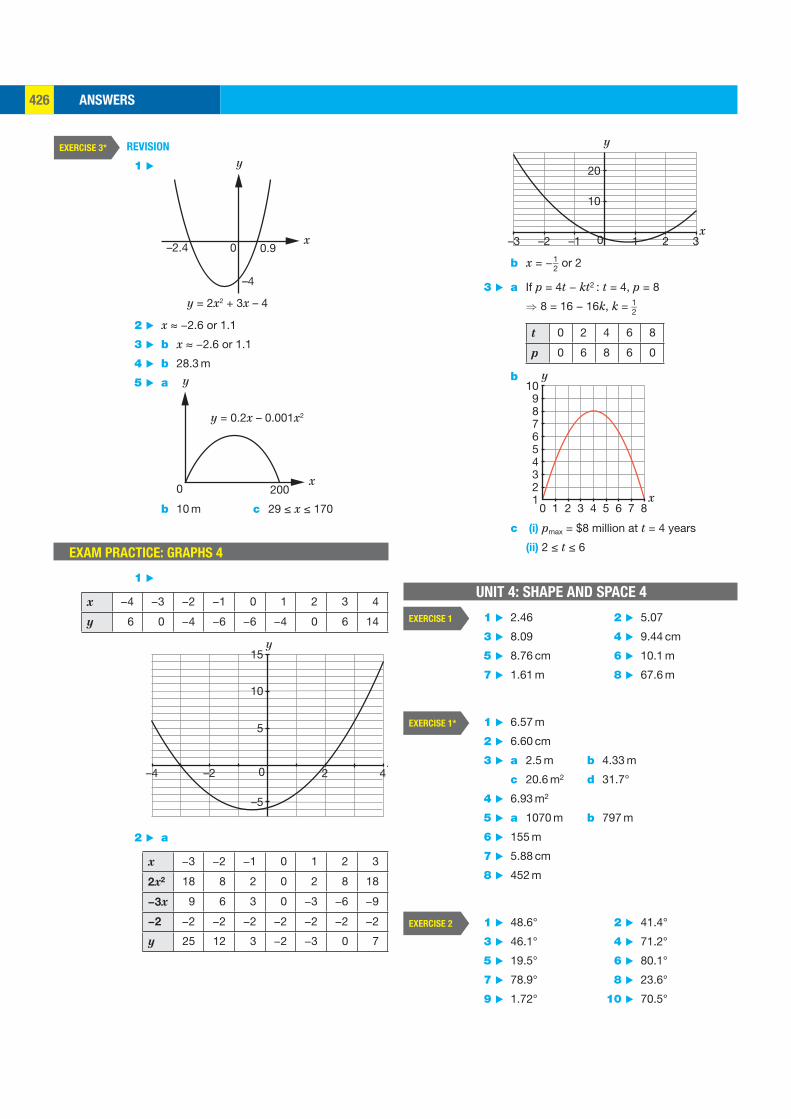
ANSWERS426
1–1
10
0
20
–2–3 2 3x
y
b x = − 1 _ 2 or 2
3 ▶ a If p = 4t − kt2 : t = 4, p = 8
⇒ 8 = 16 − 16k, k = 1 _ 2
t 0 2 4 6 8
p 0 6 8 6 0
b 10
2
4
6
8
1
3
5
7
9
2 4 6 810 3 5 7x
y
c (i) pmax = $8 million at t = 4 years
(ii) 2 ≤ t ≤ 6
UNIT 4: SHAPE AND SPACE 4
1 ▶ 2.46 2 ▶ 5.07
3 ▶ 8.09 4 ▶ 9.44 cm
5 ▶ 8.76 cm 6 ▶ 10.1 m
7 ▶ 1.61 m 8 ▶ 67.6 m
1 ▶ 6.57 m
2 ▶ 6.60 cm
3 ▶ a 2.5 m b 4.33 m
c 20.6 m2 d 31.7°
4 ▶ 6.93 m2
5 ▶ a 1070 m b 797 m
6 ▶ 155 m
7 ▶ 5.88 cm
8 ▶ 452 m
1 ▶ 48.6° 2 ▶ 41.4°
3 ▶ 46.1° 4 ▶ 71.2°
5 ▶ 19.5° 6 ▶ 80.1°
7 ▶ 78.9° 8 ▶ 23.6°
9 ▶ 1.72° 10 ▶ 70.5°
EXERCISE 1
EXERCISE 1*
EXERCISE 2
REVISION
1 ▶
y = 2x2 + 3x – 4
y
x–2.4 0.9
–4
0
2 ▶ x ≈ −2.6 or 1.1
3 ▶ b x ≈ −2.6 or 1.1
4 ▶ b 28.3 m
5 ▶ a
y = 0.2x – 0.001x2
200
y
x0
b 10 m c 29 ≤ x ≤ 170
EXAM PRACTICE: GRAPHS 4
1 ▶
x −4 −3 −2 −1 0 1 2 3 4
y 6 0 −4 −6 −6 −4 0 6 14
–5
5
10
15
–2 2 4–4x
y
0
2 ▶ a
x −3 −2 −1 0 1 2 3
2x2 18 8 2 0 2 8 18
−3x 9 6 3 0 −3 −6 −9
−2 −2 −2 −2 −2 −2 −2 −2
y 25 12 3 −2 −3 0 7
EXERCISE 3*
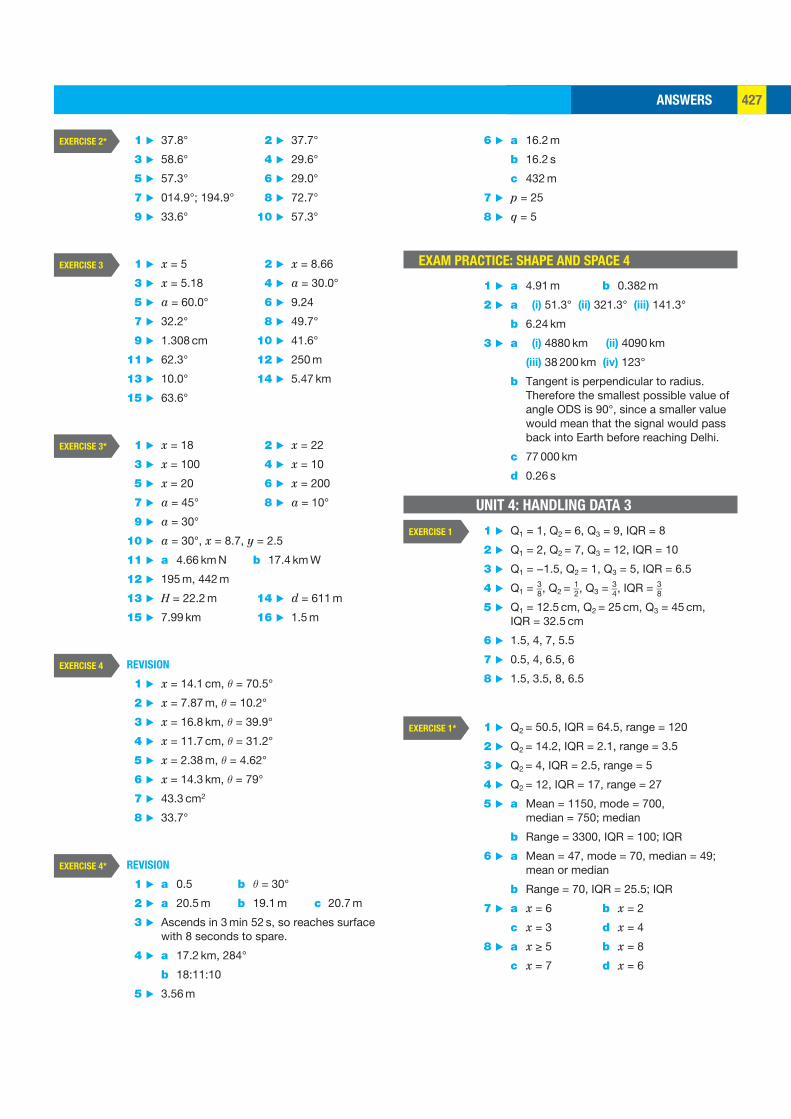
ANSWERS 427
6 ▶ a 16.2 m
b 16.2 s
c 432 m
7 ▶ p = 25
8 ▶ q = 5
EXAM PRACTICE: SHAPE AND SPACE 4
1 ▶ a 4.91 m b 0.382 m
2 ▶ a (i) 51.3° (ii) 321.3° (iii) 141.3°
b 6.24 km
3 ▶ a (i) 4880 km (ii) 4090 km
(iii) 38 200 km (iv) 123°
b Tangent is perpendicular to radius. Therefore the smallest possible value of angle ODS is 90°, since a smaller value would mean that the signal would pass back into Earth before reaching Delhi.
c 77 000 km
d 0.26 s
UNIT 4: HANDLING DATA 3
1 ▶ Q1 = 1, Q2 = 6, Q3 = 9, IQR = 8
2 ▶ Q1 = 2, Q2 = 7, Q3 = 12, IQR = 10
3 ▶ Q1 = −1.5, Q2 = 1, Q3 = 5, IQR = 6.5
4 ▶ Q1 = 3 _ 8 , Q2 = 1 _ 2 , Q3 = 3 _ 4 , IQR = 3 _ 8
5 ▶ Q1 = 12.5 cm, Q2 = 25 cm, Q3 = 45 cm, IQR = 32.5 cm
6 ▶ 1.5, 4, 7, 5.5
7 ▶ 0.5, 4, 6.5, 6
8 ▶ 1.5, 3.5, 8, 6.5
1 ▶ Q2 = 50.5, IQR = 64.5, range = 120
2 ▶ Q2 = 14.2, IQR = 2.1, range = 3.5
3 ▶ Q2 = 4, IQR = 2.5, range = 5
4 ▶ Q2 = 12, IQR = 17, range = 27
5 ▶ a Mean = 1150, mode = 700, median = 750; median
b Range = 3300, IQR = 100; IQR
6 ▶ a Mean = 47, mode = 70, median = 49; mean or median
b Range = 70, IQR = 25.5; IQR
7 ▶ a x = 6 b x = 2
c x = 3 d x = 4
8 ▶ a x ≥ 5 b x = 8
c x = 7 d x = 6
EXERCISE 1
EXERCISE 1*
1 ▶ 37.8° 2 ▶ 37.7°
3 ▶ 58.6° 4 ▶ 29.6°
5 ▶ 57.3° 6 ▶ 29.0°
7 ▶ 014.9°; 194.9° 8 ▶ 72.7°
9 ▶ 33.6° 10 ▶ 57.3°
1 ▶ x = 5 2 ▶ x = 8.66
3 ▶ x = 5.18 4 ▶ a = 30.0°
5 ▶ a = 60.0° 6 ▶ 9.24
7 ▶ 32.2° 8 ▶ 49.7°
9 ▶ 1.308 cm 10 ▶ 41.6°
11 ▶ 62.3° 12 ▶ 250 m
13 ▶ 10.0° 14 ▶ 5.47 km
15 ▶ 63.6°
1 ▶ x = 18 2 ▶ x = 22
3 ▶ x = 100 4 ▶ x = 10
5 ▶ x = 20 6 ▶ x = 200
7 ▶ a = 45° 8 ▶ a = 10°
9 ▶ a = 30°
10 ▶ a = 30°, x = 8.7, y = 2.5
11 ▶ a 4.66 km N b 17.4 km W
12 ▶ 195 m, 442 m
13 ▶ H = 22.2 m 14 ▶ d = 611 m
15 ▶ 7.99 km 16 ▶ 1.5 m
REVISION
1 ▶ x = 14.1 cm, θ = 70.5°
2 ▶ x = 7.87 m, θ = 10.2°
3 ▶ x = 16.8 km, θ = 39.9°
4 ▶ x = 11.7 cm, θ = 31.2°
5 ▶ x = 2.38 m, θ = 4.62°
6 ▶ x = 14.3 km, θ = 79°
7 ▶ 43.3 cm2
8 ▶ 33.7°
REVISION
1 ▶ a 0.5 b θ = 30°
2 ▶ a 20.5 m b 19.1 m c 20.7 m
3 ▶ Ascends in 3 min 52 s, so reaches surface with 8 seconds to spare.
4 ▶ a 17.2 km, 284°
b 18:11:10
5 ▶ 3.56 m
EXERCISE 2*
EXERCISE 3
EXERCISE 3*
EXERCISE 4
EXERCISE 4*

ANSWERS428
1 ▶ a
10
20
30
40
50
10 20 30 40
Cum
ulat
ive
freq
uenc
y
Time (minutes)
Time to complete homework
0
b 27 to 28 minutes
c 22 to 23 minutes
d 32 to 33 minutes
e 10 to 11 minutes
2 ▶ a
20
40
60
80
100
900 1000 1100 1200
Cum
ulat
ive
freq
uenc
y
Mass (g)
10
30
50
70
90
Masses of cakes
0
b Median = 1010 g to 1020 g, LQ = 990 g, UQ = 1060 g
c Approximately 85 cakes
d 90 cakes are estimated to weigh less than 1090 g
3 ▶ aMarks, x, out of 150 F
0 < x ≤ 30 5
30 < x ≤ 60 13
60 < x ≤ 90 27
90 < x ≤ 120 40
120 < x ≤ 150 50
EXERCISE 2* 1 ▶ a 26 minutes
b 29 − 21 = 8 minutes
2 ▶ a 37 cm
b
0 10 20Height (cm)
30 40 50 60
Heights of shrubs
20%
3 ▶ a 80 tomatoes
b Minimum = 155 g, maximum = 205 g
c Median = 186 g, IQR = 191 − 176 = 15 g
d 100 tomatoes
e Minimum = 160 g, maximum = 210 g
f Median = 178 g, IQR = 183 − 174 = 9 g
g The median for variety X (186) is greater than the median for variety Y (178) so, on average, tomatoes from variety X weigh more than tomatoes from variety Y. The range is the same for both varieties (50 g), but the IQR for variety Y (9) is significantly smaller than the IQR for variety X (15), so the masses of tomatoes from variety Y are more consistent.
4 ▶ a Battery Life for different mobile phones
3 4 5Time (hours)
6 7 8 9 10 11 12
Type A
Type B
Type A: Median = 8 hours, LQ = 7 hours, UQ = 9.5 hours
Type B: Median = 6.8 hours, LQ = 5.7 hours, UQ = 8 hours
b Type B is more likely to last longer (median is higher). However, its range is also larger so the length of time it lasts is more variable.
EXERCISE 2
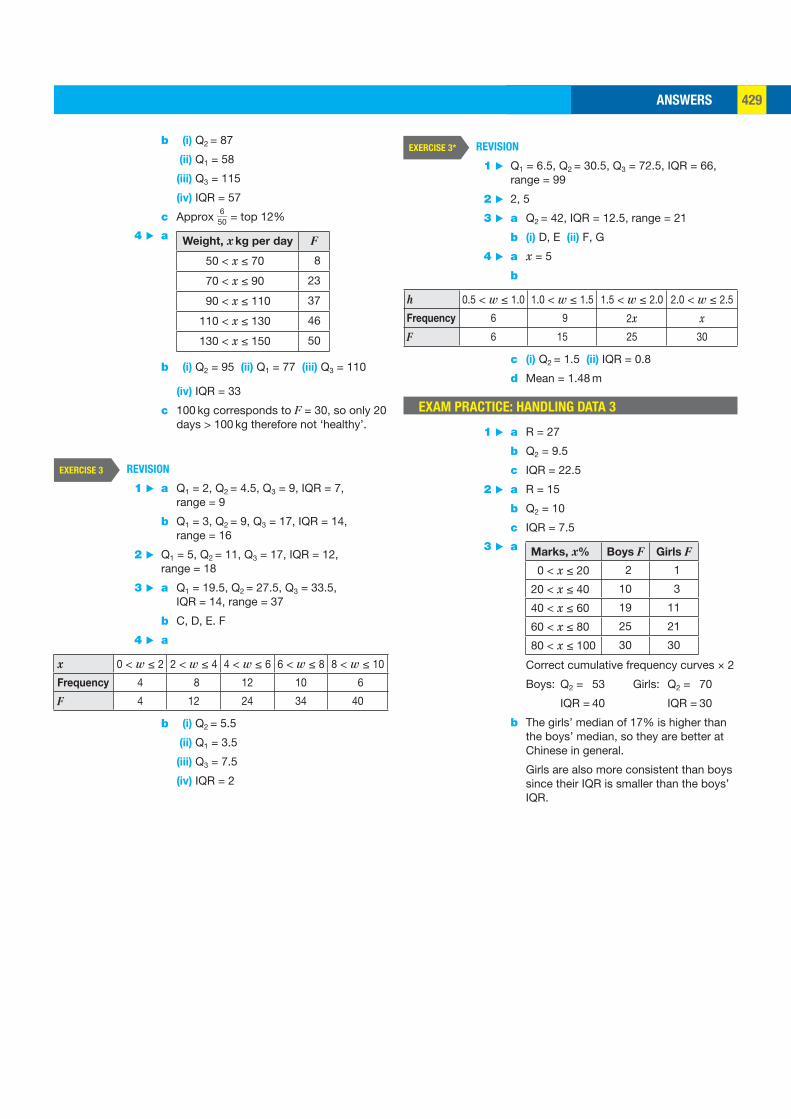
ANSWERS 429
REVISION
1 ▶ Q1 = 6.5, Q2 = 30.5, Q3 = 72.5, IQR = 66, range = 99
2 ▶ 2, 5
3 ▶ a Q2 = 42, IQR = 12.5, range = 21
b (i) D, E (ii) F, G
4 ▶ a x = 5
b
h 0.5 < w ≤ 1.0 1.0 < w ≤ 1.5 1.5 < w ≤ 2.0 2.0 < w ≤ 2.5
Frequency 6 9 2x x
F 6 15 25 30
c (i) Q2 = 1.5 (ii) IQR = 0.8
d Mean = 1.48 m
EXAM PRACTICE: HANDLING DATA 3
1 ▶ a R = 27
b Q2 = 9.5
c IQR = 22.5
2 ▶ a R = 15
b Q2 = 10
c IQR = 7.5
3 ▶ aMarks, x% Boys F Girls F
0 < x ≤ 20 2 1
20 < x ≤ 40 10 3
40 < x ≤ 60 19 11
60 < x ≤ 80 25 21
80 < x ≤ 100 30 30
Correct cumulative frequency curves × 2
Boys: Q2 = 53 Girls: Q2 = 70
IQR = 40 IQR = 30
b The girls’ median of 17% is higher than the boys’ median, so they are better at Chinese in general.
Girls are also more consistent than boys since their IQR is smaller than the boys’ IQR.
EXERCISE 3*b (i) Q2 = 87
(ii) Q1 = 58
(iii) Q3 = 115
(iv) IQR = 57
c Approx 6 __ 50 = top 12%
4 ▶ aWeight, x kg per day F
50 < x ≤ 70 8
70 < x ≤ 90 23
90 < x ≤ 110 37
110 < x ≤ 130 46
130 < x ≤ 150 50
b (i) Q2 = 95 (ii) Q1 = 77 (iii) Q3 = 110
(iv) IQR = 33
c 100 kg corresponds to F = 30, so only 20 days > 100 kg therefore not ‘healthy’.
REVISION
1 ▶ a Q1 = 2, Q2 = 4.5, Q3 = 9, IQR = 7, range = 9
b Q1 = 3, Q2 = 9, Q3 = 17, IQR = 14, range = 16
2 ▶ Q1 = 5, Q2 = 11, Q3 = 17, IQR = 12, range = 18
3 ▶ a Q1 = 19.5, Q2 = 27.5, Q3 = 33.5, IQR = 14, range = 37
b C, D, E. F
4 ▶ a
x 0 < w ≤ 2 2 < w ≤ 4 4 < w ≤ 6 6 < w ≤ 8 8 < w ≤ 10
Frequency 4 8 12 10 6
F 4 12 24 34 40
b (i) Q2 = 5.5
(ii) Q1 = 3.5
(iii) Q3 = 7.5
(iv) IQR = 2
EXERCISE 3
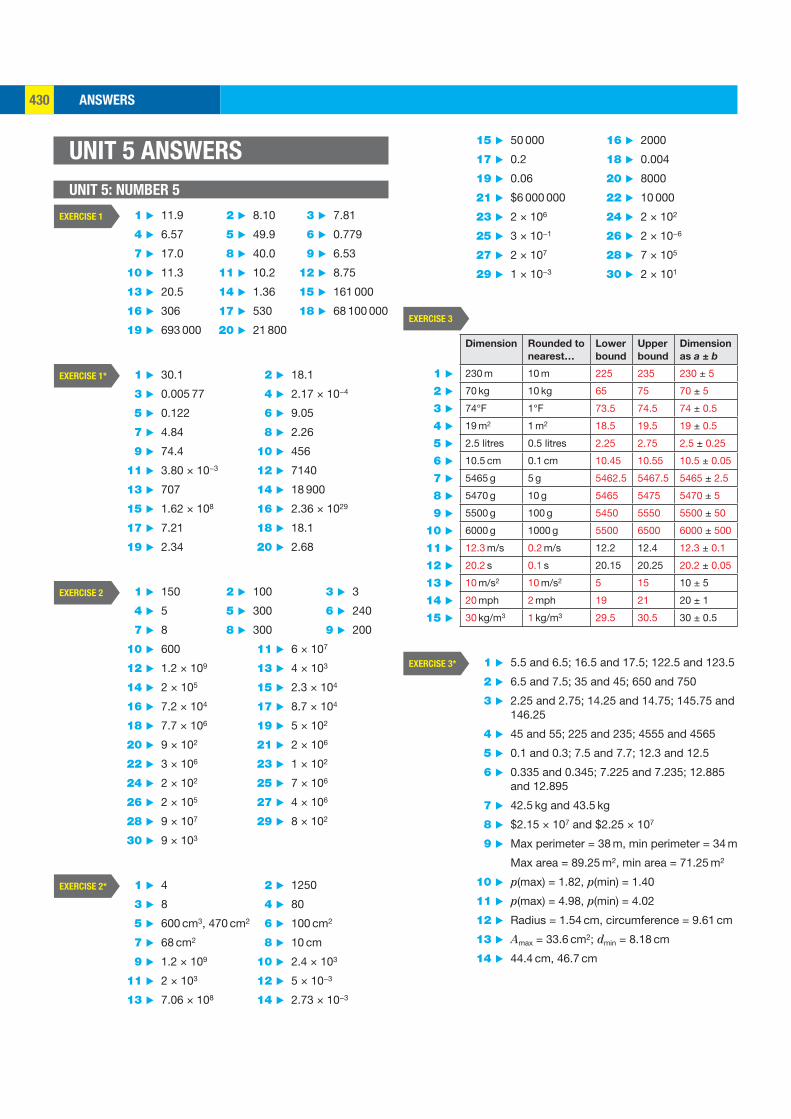
ANSWERS430
15 ▶ 50 000 16 ▶ 2000
17 ▶ 0.2 18 ▶ 0.004
19 ▶ 0.06 20 ▶ 8000
21 ▶ $6 000 000 22 ▶ 10 000
23 ▶ 2 × 10⁶ 24 ▶ 2 × 10²
25 ▶ 3 × 10⁻¹ 26 ▶ 2 × 10⁻⁶
27 ▶ 2 × 10⁷ 28 ▶ 7 × 10⁵
29 ▶ 1 × 10⁻³ 30 ▶ 2 × 101
Dimension Rounded to
nearest…
Lower
bound
Upper
bound
Dimension
as a ± b
1 ▶ 230 m 10 m 225 235 230 ± 5
2 ▶ 70 kg 10 kg 65 75 70 ± 5
3 ▶ 74°F 1°F 73.5 74.5 74 ± 0.5
4 ▶ 19 m2 1 m2 18.5 19.5 19 ± 0.5
5 ▶ 2.5 litres 0.5 litres 2.25 2.75 2.5 ± 0.25
6 ▶ 10.5 cm 0.1 cm 10.45 10.55 10.5 ± 0.05
7 ▶ 5465 g 5 g 5462.5 5467.5 5465 ± 2.5
8 ▶ 5470 g 10 g 5465 5475 5470 ± 5
9 ▶ 5500 g 100 g 5450 5550 5500 ± 50
10 ▶ 6000 g 1000 g 5500 6500 6000 ± 500
11 ▶ 12.3 m/s 0.2 m/s 12.2 12.4 12.3 ± 0.1
12 ▶ 20.2 s 0.1 s 20.15 20.25 20.2 ± 0.05
13 ▶ 10 m/s2 10 m/s2 5 15 10 ± 5
14 ▶ 20 mph 2 mph 19 21 20 ± 1
15 ▶ 30 kg/m3 1 kg/m3 29.5 30.5 30 ± 0.5
1 ▶ 5.5 and 6.5; 16.5 and 17.5; 122.5 and 123.5
2 ▶ 6.5 and 7.5; 35 and 45; 650 and 750
3 ▶ 2.25 and 2.75; 14.25 and 14.75; 145.75 and 146.25
4 ▶ 45 and 55; 225 and 235; 4555 and 4565
5 ▶ 0.1 and 0.3; 7.5 and 7.7; 12.3 and 12.5
6 ▶ 0.335 and 0.345; 7.225 and 7.235; 12.885 and 12.895
7 ▶ 42.5 kg and 43.5 kg
8 ▶ $2.15 × 10⁷ and $2.25 × 10⁷
9 ▶ Max perimeter = 38 m, min perimeter = 34 m
Max area = 89.25 m2, min area = 71.25 m2
10 ▶ p(max) = 1.82, p(min) = 1.40
11 ▶ p(max) = 4.98, p(min) = 4.02
12 ▶ Radius = 1.54 cm, circumference = 9.61 cm
13 ▶ Amax = 33.6 cm2; dmin = 8.18 cm
14 ▶ 44.4 cm, 46.7 cm
EXERCISE 3
EXERCISE 3*
UNIT 5 ANSWERS
UNIT 5: NUMBER 5
1 ▶ 11.9 2 ▶ 8.10 3 ▶ 7.81
4 ▶ 6.57 5 ▶ 49.9 6 ▶ 0.779
7 ▶ 17.0 8 ▶ 40.0 9 ▶ 6.53
10 ▶ 11.3 11 ▶ 10.2 12 ▶ 8.75
13 ▶ 20.5 14 ▶ 1.36 15 ▶ 161 000
16 ▶ 306 17 ▶ 530 18 ▶ 68 100 000
19 ▶ 693 000 20 ▶ 21 800
1 ▶ 30.1 2 ▶ 18.1
3 ▶ 0.005 77 4 ▶ 2.17 × 10⁻⁴
5 ▶ 0.122 6 ▶ 9.05
7 ▶ 4.84 8 ▶ 2.26
9 ▶ 74.4 10 ▶ 456
11 ▶ 3.80 × 10⁻³ 12 ▶ 7140
13 ▶ 707 14 ▶ 18 900
15 ▶ 1.62 × 10⁸ 16 ▶ 2.36 × 1029
17 ▶ 7.21 18 ▶ 18.1
19 ▶ 2.34 20 ▶ 2.68
1 ▶ 150 2 ▶ 100 3 ▶ 3
4 ▶ 5 5 ▶ 300 6 ▶ 240
7 ▶ 8 8 ▶ 300 9 ▶ 200
10 ▶ 600 11 ▶ 6 × 10⁷
12 ▶ 1.2 × 10⁹ 13 ▶ 4 × 10³
14 ▶ 2 × 10⁵ 15 ▶ 2.3 × 10⁴
16 ▶ 7.2 × 10⁴ 17 ▶ 8.7 × 10⁴
18 ▶ 7.7 × 10⁶ 19 ▶ 5 × 10²
20 ▶ 9 × 10² 21 ▶ 2 × 10⁶
22 ▶ 3 × 10⁶ 23 ▶ 1 × 10²
24 ▶ 2 × 10² 25 ▶ 7 × 10⁶
26 ▶ 2 × 10⁵ 27 ▶ 4 × 10⁶
28 ▶ 9 × 10⁷ 29 ▶ 8 × 10²
30 ▶ 9 × 10³
1 ▶ 4 2 ▶ 1250
3 ▶ 8 4 ▶ 80
5 ▶ 600 cm3, 470 cm2 6 ▶ 100 cm2
7 ▶ 68 cm2 8 ▶ 10 cm
9 ▶ 1.2 × 10⁹ 10 ▶ 2.4 × 10³
11 ▶ 2 × 10³ 12 ▶ 5 × 10⁻³
13 ▶ 7.06 × 10⁸ 14 ▶ 2.73 × 10⁻³
EXERCISE 1
EXERCISE 1*
EXERCISE 2
EXERCISE 2*
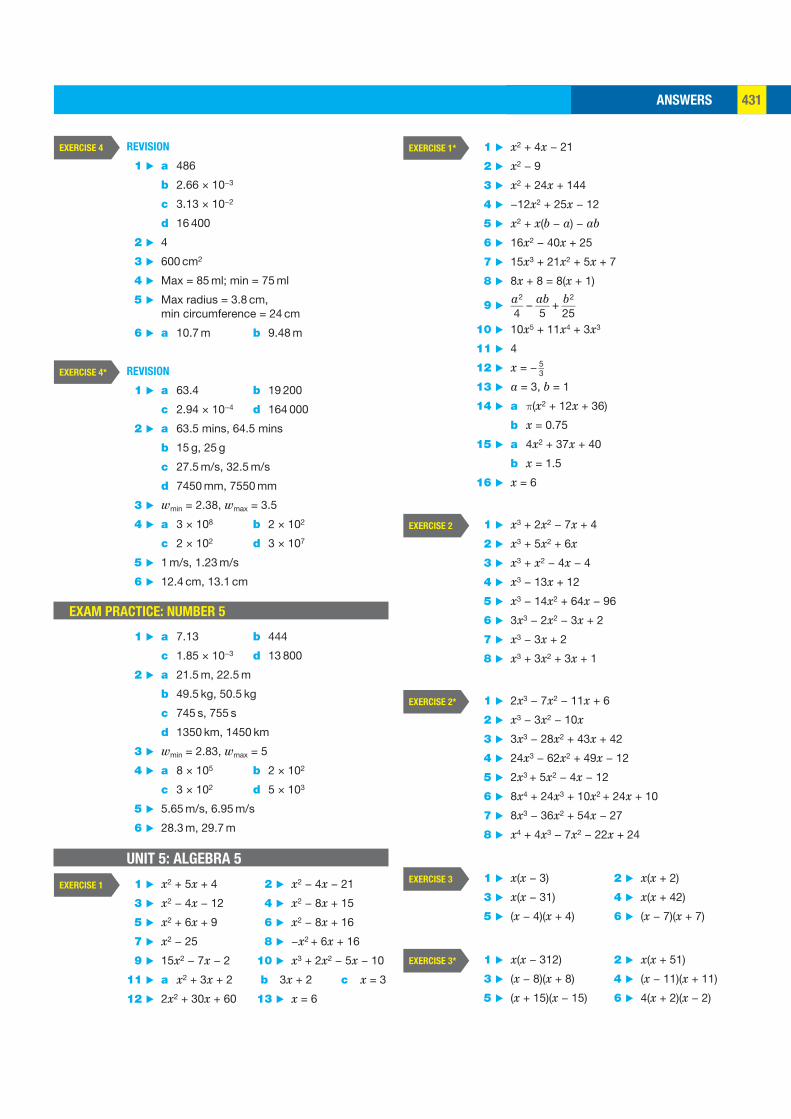
ANSWERS 431
1 ▶ x2 + 4x − 21
2 ▶ x2 − 9
3 ▶ x2 + 24x + 144
4 ▶ −12x2 + 25x − 12
5 ▶ x2 + x(b − a) − ab
6 ▶ 16x2 − 40x + 25
7 ▶ 15x3 + 21x2 + 5x + 7
8 ▶ 8x + 8 = 8(x + 1)
9 ▶ a 2 ___ 4
− ab ___ 5
+ b 2 ___ 25
10 ▶ 10x5 + 11x4 + 3x3
11 ▶ 4
12 ▶ x = − 5 _ 3
13 ▶ a = 3, b = 1
14 ▶ a π(x2 + 12x + 36)
b x = 0.75
15 ▶ a 4x2 + 37x + 40
b x = 1.5
16 ▶ x = 6
1 ▶ x3 + 2x2 − 7x + 4
2 ▶ x3 + 5x2 + 6x
3 ▶ x3 + x2 − 4x − 4
4 ▶ x3 − 13x + 12
5 ▶ x3 − 14x2 + 64x − 96
6 ▶ 3x3 − 2x2 − 3x + 2
7 ▶ x3 − 3x + 2
8 ▶ x3 + 3x2 + 3x + 1
1 ▶ 2x3 − 7x2 − 11x + 6
2 ▶ x3 − 3x2 − 10x
3 ▶ 3x3 − 28x2 + 43x + 42
4 ▶ 24x3 − 62x2 + 49x − 12
5 ▶ 2x3 + 5x2 − 4x − 12
6 ▶ 8x4 + 24x3 + 10x2 + 24x + 10
7 ▶ 8x3 − 36x2 + 54x − 27
8 ▶ x4 + 4x3 − 7x2 − 22x + 24
1 ▶ x(x − 3) 2 ▶ x(x + 2)
3 ▶ x(x − 31) 4 ▶ x(x + 42)
5 ▶ (x − 4)(x + 4) 6 ▶ (x − 7)(x + 7)
1 ▶ x(x − 312) 2 ▶ x(x + 51)
3 ▶ (x − 8)(x + 8) 4 ▶ (x − 11)(x + 11)
5 ▶ (x + 15)(x − 15) 6 ▶ 4(x + 2)(x − 2)
EXERCISE 1*
EXERCISE 2
EXERCISE 2*
EXERCISE 3
EXERCISE 3*
REVISION
1 ▶ a 486
b 2.66 × 10⁻³
c 3.13 × 10⁻²
d 16 400
2 ▶ 4
3 ▶ 600 cm2
4 ▶ Max = 85 ml; min = 75 ml
5 ▶ Max radius = 3.8 cm, min circumference = 24 cm
6 ▶ a 10.7 m b 9.48 m
REVISION
1 ▶ a 63.4 b 19 200
c 2.94 × 10⁻⁴ d 164 000
2 ▶ a 63.5 mins, 64.5 mins
b 15 g, 25 g
c 27.5 m/s, 32.5 m/s
d 7450 mm, 7550 mm
3 ▶ wmin = 2.38, wmax = 3.5
4 ▶ a 3 × 10⁸ b 2 × 10²
c 2 × 10² d 3 × 10⁷
5 ▶ 1 m/s, 1.23 m/s
6 ▶ 12.4 cm, 13.1 cm
EXAM PRACTICE: NUMBER 5
1 ▶ a 7.13 b 444
c 1.85 × 10⁻³ d 13 800
2 ▶ a 21.5 m, 22.5 m
b 49.5 kg, 50.5 kg
c 745 s, 755 s
d 1350 km, 1450 km
3 ▶ wmin = 2.83, wmax = 5
4 ▶ a 8 × 10⁵ b 2 × 10²
c 3 × 10² d 5 × 10³
5 ▶ 5.65 m/s, 6.95 m/s
6 ▶ 28.3 m, 29.7 m
UNIT 5: ALGEBRA 5
1 ▶ x2 + 5x + 4 2 ▶ x2 − 4x − 21
3 ▶ x2 − 4x − 12 4 ▶ x2 − 8x + 15
5 ▶ x2 + 6x + 9 6 ▶ x2 − 8x + 16
7 ▶ x2 − 25 8 ▶ −x2 + 6x + 16
9 ▶ 15x2 − 7x − 2 10 ▶ x3 + 2x2 − 5x − 10
11 ▶ a x2 + 3x + 2 b 3x + 2 c x = 3
12 ▶ 2x2 + 30x + 60 13 ▶ x = 6
EXERCISE 4
EXERCISE 4*
EXERCISE 1
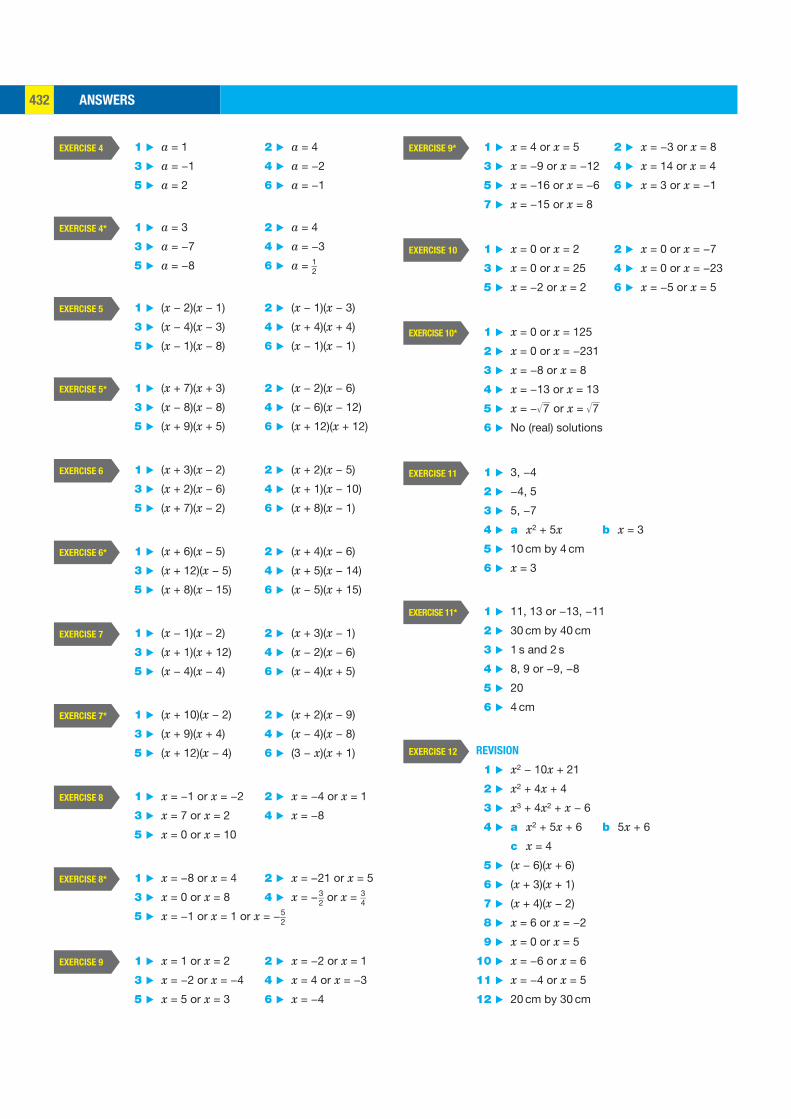
ANSWERS432
1 ▶ x = 4 or x = 5 2 ▶ x = −3 or x = 8
3 ▶ x = −9 or x = −12 4 ▶ x = 14 or x = 4
5 ▶ x = −16 or x = −6 6 ▶ x = 3 or x = −1
7 ▶ x = −15 or x = 8
1 ▶ x = 0 or x = 2 2 ▶ x = 0 or x = −7
3 ▶ x = 0 or x = 25 4 ▶ x = 0 or x = −23
5 ▶ x = −2 or x = 2 6 ▶ x = −5 or x = 5
1 ▶ x = 0 or x = 125
2 ▶ x = 0 or x = −231
3 ▶ x = −8 or x = 8
4 ▶ x = −13 or x = 13
5 ▶ x = − √ __
7 or x = √ __
7
6 ▶ No (real) solutions
1 ▶ 3, −4
2 ▶ −4, 5
3 ▶ 5, −7
4 ▶ a x2 + 5x b x = 3
5 ▶ 10 cm by 4 cm
6 ▶ x = 3
1 ▶ 11, 13 or −13, −11
2 ▶ 30 cm by 40 cm
3 ▶ 1 s and 2 s
4 ▶ 8, 9 or −9, −8
5 ▶ 20
6 ▶ 4 cm
REVISION
1 ▶ x2 − 10x + 21
2 ▶ x2 + 4x + 4
3 ▶ x3 + 4x2 + x − 6
4 ▶ a x2 + 5x + 6 b 5x + 6
c x = 4
5 ▶ (x − 6)(x + 6)
6 ▶ (x + 3)(x + 1)
7 ▶ (x + 4)(x − 2)
8 ▶ x = 6 or x = −2
9 ▶ x = 0 or x = 5
10 ▶ x = −6 or x = 6
11 ▶ x = −4 or x = 5
12 ▶ 20 cm by 30 cm
EXERCISE 9*
EXERCISE 10
EXERCISE 10*
EXERCISE 11
EXERCISE 11*
EXERCISE 12
1 ▶ a = 1 2 ▶ a = 4
3 ▶ a = −1 4 ▶ a = −2
5 ▶ a = 2 6 ▶ a = −1
1 ▶ a = 3 2 ▶ a = 4
3 ▶ a = −7 4 ▶ a = −3
5 ▶ a = −8 6 ▶ a = 1 _ 2
1 ▶ (x − 2)(x − 1) 2 ▶ (x − 1)(x − 3)
3 ▶ (x − 4)(x − 3) 4 ▶ (x + 4)(x + 4)
5 ▶ (x − 1)(x − 8) 6 ▶ (x − 1)(x − 1)
1 ▶ (x + 7)(x + 3) 2 ▶ (x − 2)(x − 6)
3 ▶ (x − 8)(x − 8) 4 ▶ (x − 6)(x − 12)
5 ▶ (x + 9)(x + 5) 6 ▶ (x + 12)(x + 12)
1 ▶ (x + 3)(x − 2) 2 ▶ (x + 2)(x − 5)
3 ▶ (x + 2)(x − 6) 4 ▶ (x + 1)(x − 10)
5 ▶ (x + 7)(x − 2) 6 ▶ (x + 8)(x − 1)
1 ▶ (x + 6)(x − 5) 2 ▶ (x + 4)(x − 6)
3 ▶ (x + 12)(x − 5) 4 ▶ (x + 5)(x − 14)
5 ▶ (x + 8)(x − 15) 6 ▶ (x − 5)(x + 15)
1 ▶ (x − 1)(x − 2) 2 ▶ (x + 3)(x − 1)
3 ▶ (x + 1)(x + 12) 4 ▶ (x − 2)(x − 6)
5 ▶ (x − 4)(x − 4) 6 ▶ (x − 4)(x + 5)
1 ▶ (x + 10)(x − 2) 2 ▶ (x + 2)(x − 9)
3 ▶ (x + 9)(x + 4) 4 ▶ (x − 4)(x − 8)
5 ▶ (x + 12)(x − 4) 6 ▶ (3 − x)(x + 1)
1 ▶ x = −1 or x = −2 2 ▶ x = −4 or x = 1
3 ▶ x = 7 or x = 2 4 ▶ x = −8
5 ▶ x = 0 or x = 10
1 ▶ x = −8 or x = 4 2 ▶ x = −21 or x = 5
3 ▶ x = 0 or x = 8 4 ▶ x = − 3 _ 2 or x = 3 _ 4
5 ▶ x = −1 or x = 1 or x = − 5 _ 2
1 ▶ x = 1 or x = 2 2 ▶ x = −2 or x = 1
3 ▶ x = −2 or x = −4 4 ▶ x = 4 or x = −3
5 ▶ x = 5 or x = 3 6 ▶ x = −4
EXERCISE 4
EXERCISE 4*
EXERCISE 5
EXERCISE 5*
EXERCISE 6
EXERCISE 6*
EXERCISE 7
EXERCISE 7*
EXERCISE 8
EXERCISE 8*
EXERCISE 9
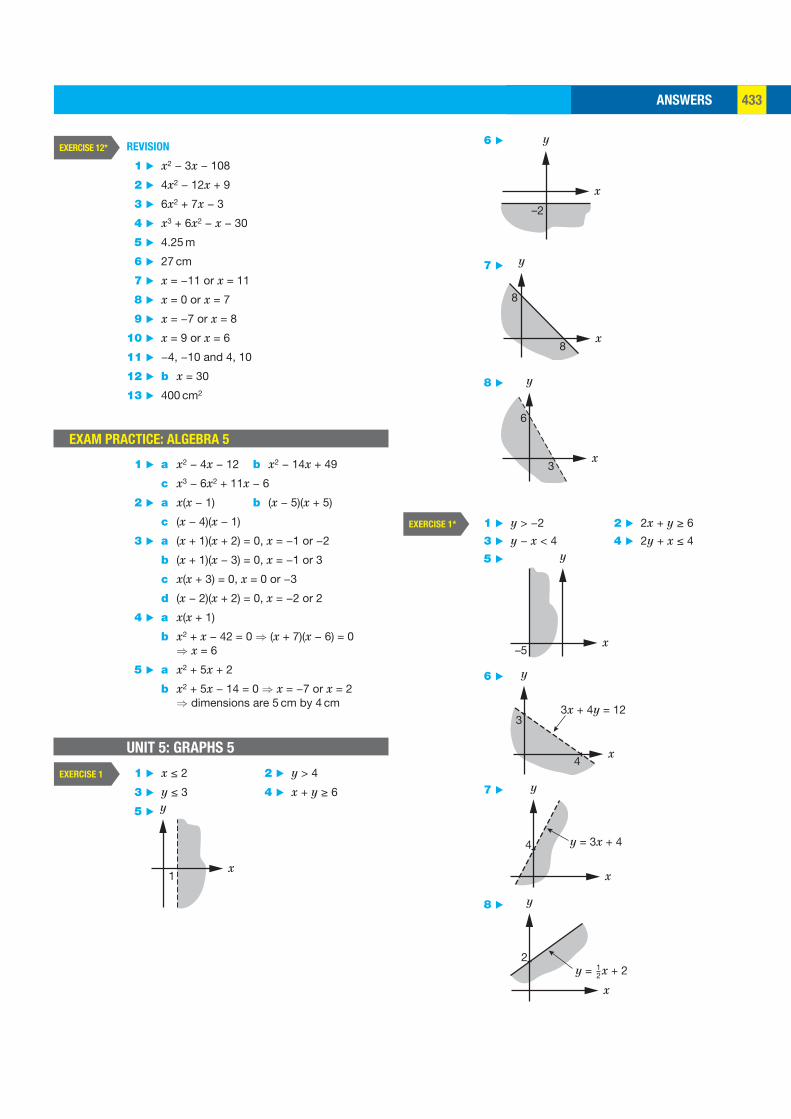
ANSWERS 433
6 ▶
7 ▶
8 ▶
1 ▶ y > −2 2 ▶ 2x + y ≥ 6
3 ▶ y − x < 4 4 ▶ 2y + x ≤ 4
5 ▶
x
y
–5
6 ▶
x
y
3
4
3x + 4y = 12
7 ▶
x
y
4 y = 3x + 4
8 ▶
x
y
212y = x + 2
x
y
–2
x
y
8
8
x
y
6
3
EXERCISE 1*
REVISION
1 ▶ x2 − 3x − 108
2 ▶ 4x2 − 12x + 9
3 ▶ 6x2 + 7x − 3
4 ▶ x3 + 6x2 − x − 30
5 ▶ 4.25 m
6 ▶ 27 cm
7 ▶ x = −11 or x = 11
8 ▶ x = 0 or x = 7
9 ▶ x = −7 or x = 8
10 ▶ x = 9 or x = 6
11 ▶ −4, −10 and 4, 10
12 ▶ b x = 30
13 ▶ 400 cm2
EXAM PRACTICE: ALGEBRA 5
1 ▶ a x2 − 4x − 12 b x2 − 14x + 49
c x3 − 6x2 + 11x − 6
2 ▶ a x(x − 1) b (x − 5)(x + 5)
c (x − 4)(x − 1)
3 ▶ a (x + 1)(x + 2) = 0, x = −1 or −2
b (x + 1)(x − 3) = 0, x = −1 or 3
c x(x + 3) = 0, x = 0 or −3
d (x − 2)(x + 2) = 0, x = −2 or 2
4 ▶ a x(x + 1)
b x2 + x − 42 = 0 ⇒ (x + 7)(x − 6) = 0 ⇒ x = 6
5 ▶ a x2 + 5x + 2
b x2 + 5x − 14 = 0 ⇒ x = −7 or x = 2 ⇒ dimensions are 5 cm by 4 cm
UNIT 5: GRAPHS 5
1 ▶ x ≤ 2 2 ▶ y > 4
3 ▶ y ≤ 3 4 ▶ x + y ≥ 6
5 ▶
EXERCISE 12*
EXERCISE 1
x
y
1
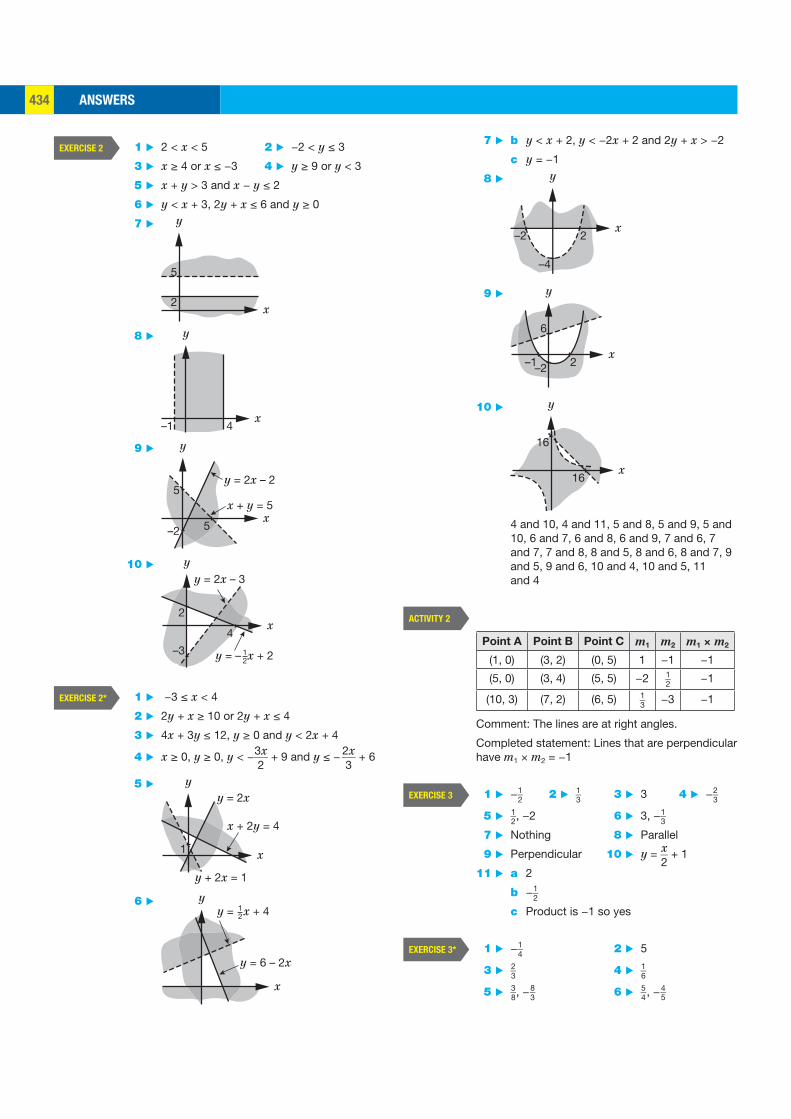
ANSWERS434
7 ▶ b y < x + 2, y < −2x + 2 and 2y + x > −2
c y = −1
8 ▶
x
y
2–2
–4
9 ▶
x
y
–1 2–2
6
10 ▶
x
y
16
16
4 and 10, 4 and 11, 5 and 8, 5 and 9, 5 and 10, 6 and 7, 6 and 8, 6 and 9, 7 and 6, 7 and 7, 7 and 8, 8 and 5, 8 and 6, 8 and 7, 9 and 5, 9 and 6, 10 and 4, 10 and 5, 11 and 4
Point A Point B Point C m1 m2 m1 × m2
(1, 0) (3, 2) (0, 5) 1 −1 −1
(5, 0) (3, 4) (5, 5) −2 1 _ 2 −1
(10, 3) (7, 2) (6, 5) 1 _ 3 −3 −1
Comment: The lines are at right angles.
Completed statement: Lines that are perpendicular have m1 × m2 = −1
1 ▶ − 1 _ 2 2 ▶ 1 _ 3 3 ▶ 3 4 ▶ − 2 _ 3
5 ▶ 1 _ 2 , −2 6 ▶ 3, − 1 _ 3
7 ▶ Nothing 8 ▶ Parallel
9 ▶ Perpendicular 10 ▶ y = x __ 2
+ 1
11 ▶ a 2
b − 1 _ 2
c Product is −1 so yes
1 ▶ − 1 _ 4 2 ▶ 5
3 ▶ 2 _ 3 4 ▶ 1 _ 6
5 ▶ 3 _ 8 , − 8 _ 3 6 ▶ 5 _ 4 , − 4 _ 5
ACTIVITY 2
EXERCISE 3
EXERCISE 3*
1 ▶ 2 < x < 5 2 ▶ −2 < y ≤ 3
3 ▶ x ≥ 4 or x ≤ −3 4 ▶ y ≥ 9 or y < 3
5 ▶ x + y > 3 and x − y ≤ 2
6 ▶ y < x + 3, 2y + x ≤ 6 and y ≥ 0
7 ▶
x
y
5
2
8 ▶
–1 4x
y
9 ▶
x
y
–2
5
5
y = 2x – 2
x + y = 5
10 ▶
12y = – x + 2
y = 2x – 3
x
y
–3
4
2
1 ▶ −3 ≤ x < 4
2 ▶ 2y + x ≥ 10 or 2y + x ≤ 4
3 ▶ 4x + 3y ≤ 12, y ≥ 0 and y < 2x + 4
4 ▶ x ≥ 0, y ≥ 0, y < − 3x ___ 2
+ 9 and y ≤ − 2x ___ 3
+ 6
5 ▶
y + 2x = 1
y = 2x
x + 2y = 4
x
y
1
6 ▶
y = 6 – 2x
12y = x + 4
x
y
EXERCISE 2
EXERCISE 2*
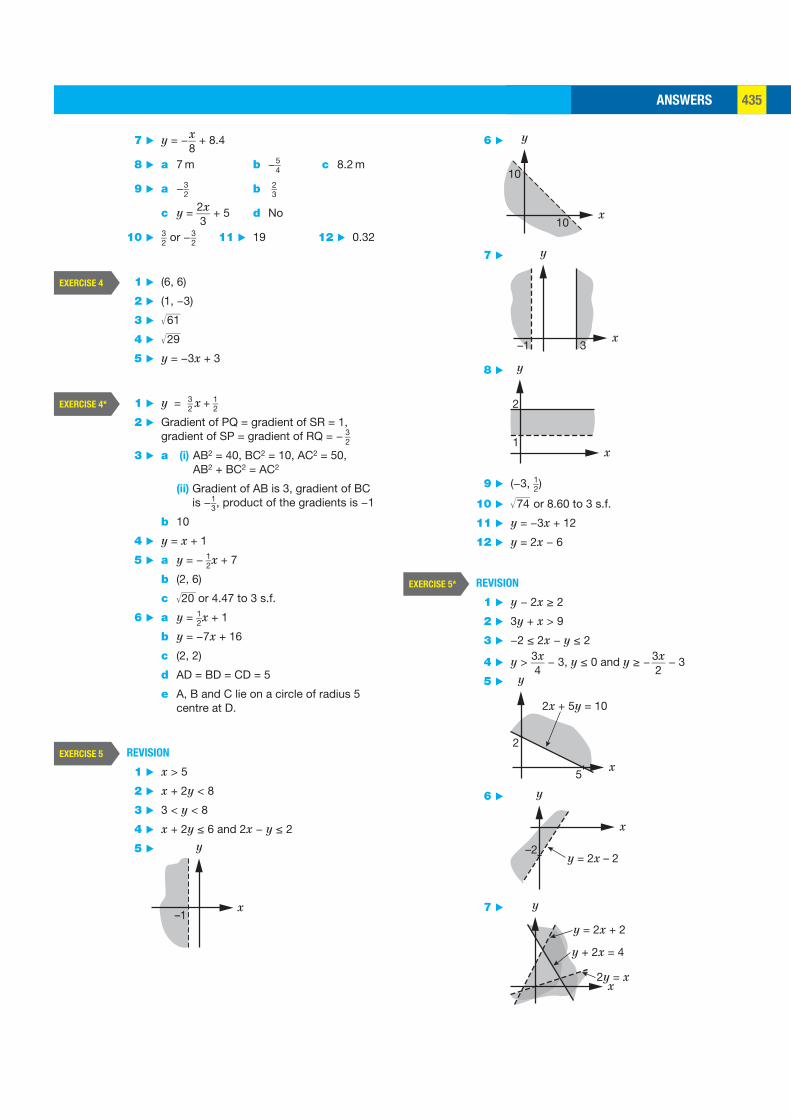
ANSWERS 435
6 ▶
7 ▶
x
y
3–1
8 ▶
1
2
x
y
9 ▶ (−3, 1 _ 2 )
10 ▶ √ ___
74 or 8.60 to 3 s.f.
11 ▶ y = −3x + 12
12 ▶ y = 2x − 6
REVISION
1 ▶ y − 2x ≥ 2
2 ▶ 3y + x > 9
3 ▶ −2 ≤ 2x − y ≤ 2
4 ▶ y > 3x ___ 4
− 3, y ≤ 0 and y ≥ − 3x ___ 2
− 3
5 ▶
x
y
5
2
2x + 5y = 10
6 ▶
x
y
–2y = 2x – 2
7 ▶
x
y
y = 2x + 2
y + 2x = 4
2y = x
x
y
10
10
EXERCISE 5*
7 ▶ y = − x __ 8
+ 8.4
8 ▶ a 7 m b − 5 _ 4 c 8.2 m
9 ▶ a − 3 _ 2 b 2 _ 3
c y = 2x ___ 3
+ 5 d No
10 ▶ 3 _ 2 or − 3 _ 2 11 ▶ 19 12 ▶ 0.32
1 ▶ (6, 6)
2 ▶ (1, −3)
3 ▶ √ ___
61
4 ▶ √ ___
29
5 ▶ y = −3x + 3
1 ▶ y = 3 _ 2 x + 1 _ 2
2 ▶ Gradient of PQ = gradient of SR = 1, gradient of SP = gradient of RQ = − 3 _ 2
3 ▶ a (i) AB2 = 40, BC2 = 10, AC2 = 50, AB2 + BC2 = AC2
(ii) Gradient of AB is 3, gradient of BC is − 1 _ 3 , product of the gradients is −1
b 10
4 ▶ y = x + 1
5 ▶ a y = − 1 _ 2 x + 7
b (2, 6)
c √ ___
20 or 4.47 to 3 s.f.
6 ▶ a y = 1 _ 2 x + 1
b y = −7x + 16
c (2, 2)
d AD = BD = CD = 5
e A, B and C lie on a circle of radius 5 centre at D.
REVISION
1 ▶ x > 5
2 ▶ x + 2y < 8
3 ▶ 3 < y < 8
4 ▶ x + 2y ≤ 6 and 2x − y ≤ 2
5 ▶
EXERCISE 4
EXERCISE 4*
EXERCISE 5
x
y
–1
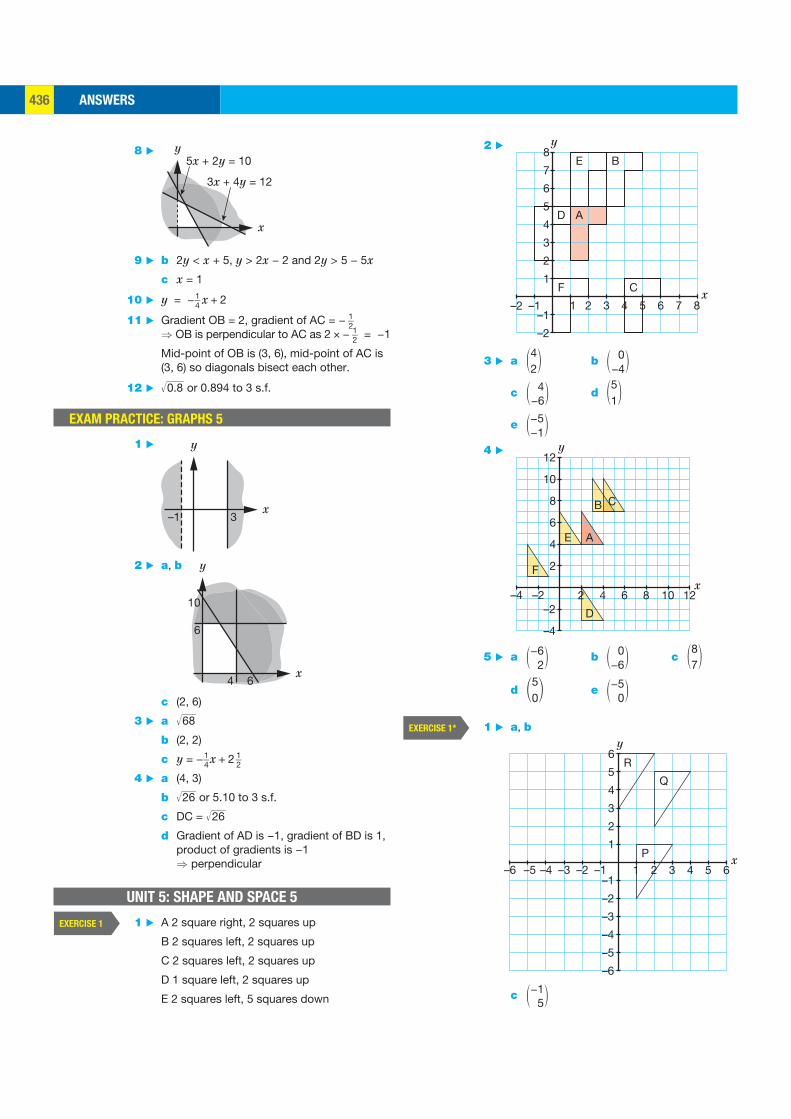
ANSWERS436
2 ▶
x
y
5
6
7
8
3
4
2
1
–1
–2
2 4 81 3 5 6 7–2 –1
D A
E B
CF
3 ▶ a ( 4
2
) b ( 0 −4
)
c ( 4 −6
) d ( 5
1
)
e ( −5 −1
)
4 ▶
x
y
10
12
6
8
4
2
–2
–4
4 8 122 6 10–2–4
B
AE
C
F
D
5 ▶ a ( −6 2
) b ( 0 −6
) c ( 8
7
)
d ( 5
0
) e ( −5 0
)
1 ▶ a, b
x
y
5
6
3
4
2
1
–1
–2
–3
–4
–5
–6
2 4 61 3 5–6 –1–2–3–4–5P
R
Q
c ( −1 5
)
EXERCISE 1*
8 ▶
x
y5x + 2y = 10
3x + 4y = 12
9 ▶ b 2y < x + 5, y > 2x − 2 and 2y > 5 − 5x
c x = 1
10 ▶ y = − 1 _ 4 x + 2
11 ▶ Gradient OB = 2, gradient of AC = − 1 _ 2 ⇒ OB is perpendicular to AC as 2 × − 1 _ 2 = −1
Mid-point of OB is (3, 6), mid-point of AC is (3, 6) so diagonals bisect each other.
12 ▶ √ ___
0.8 or 0.894 to 3 s.f.
EXAM PRACTICE: GRAPHS 5
1 ▶
x
y
3–1
2 ▶ a, b
6
10
4 6x
y
c (2, 6)
3 ▶ a √ ___
68
b (2, 2)
c y = − 1 _ 4 x + 2 1 _ 2
4 ▶ a (4, 3)
b √ ___
26 or 5.10 to 3 s.f.
c DC = √ ___
26
d Gradient of AD is −1, gradient of BD is 1, product of gradients is −1 ⇒ perpendicular
UNIT 5: SHAPE AND SPACE 5
1 ▶ A 2 square right, 2 squares up
B 2 squares left, 2 squares up
C 2 squares left, 2 squares up
D 1 square left, 2 squares up
E 2 squares left, 5 squares down
EXERCISE 1
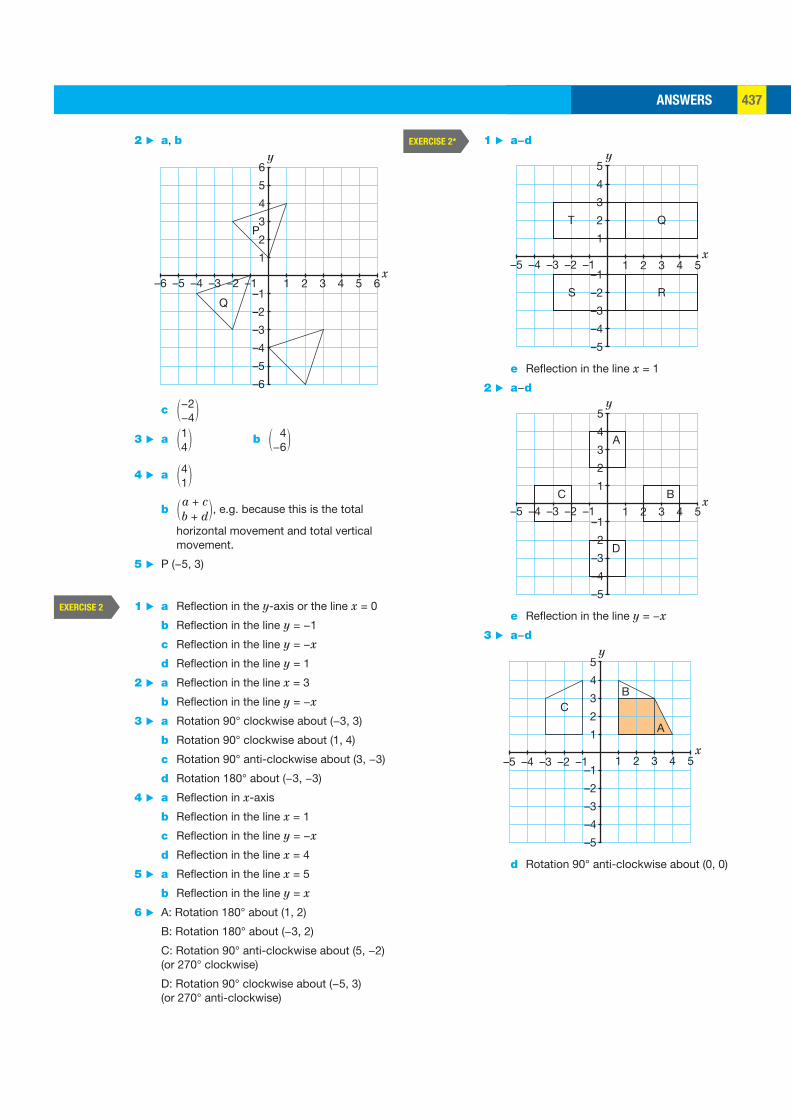
ANSWERS 437
1 ▶ a−d
x
y5
3
4
2
1
–1
–2
–3
–4
–5
2 41 3 5–1–2–3–4–5
QT
RS
e Reflection in the line x = 1
2 ▶ a−d
x
y5
3
4
2
1
–1
–2
–3
–4
–5
2 4 51 3–1–2–3–4–5
B
D
A
C
e Reflection in the line y = −x
3 ▶ a−d
x
y5
3
4
2
1
–1
–2
–3
–4
–5
2 4 51 3–1–2–3–4–5
CB
A
d Rotation 90° anti-clockwise about (0, 0)
EXERCISE 2* 2 ▶ a, b
x
y
5
6
3
4
2
1
–1
–2
–3
–4
–5
–6
2 4 61 3 5–6 –1–2–3–4–5
P
Q
c ( −2 −4
)
3 ▶ a ( 1 4
) b ( 4 −6
)
4 ▶ a ( 4 1
)
b ( a + c
b + d
) , e.g. because this is the total
horizontal movement and total vertical movement.
5 ▶ P (−5, 3)
1 ▶ a Reflection in the y-axis or the line x = 0
b Reflection in the line y = −1
c Reflection in the line y = −x
d Reflection in the line y = 1
2 ▶ a Reflection in the line x = 3
b Reflection in the line y = −x
3 ▶ a Rotation 90° clockwise about (−3, 3)
b Rotation 90° clockwise about (1, 4)
c Rotation 90° anti-clockwise about (3, −3)
d Rotation 180° about (−3, −3)
4 ▶ a Reflection in x-axis
b Reflection in the line x = 1
c Reflection in the line y = −x
d Reflection in the line x = 4
5 ▶ a Reflection in the line x = 5
b Reflection in the line y = x
6 ▶ A: Rotation 180° about (1, 2)
B: Rotation 180° about (−3, 2)
C: Rotation 90° anti-clockwise about (5, −2) (or 270° clockwise)
D: Rotation 90° clockwise about (−5, 3) (or 270° anti-clockwise)
EXERCISE 2
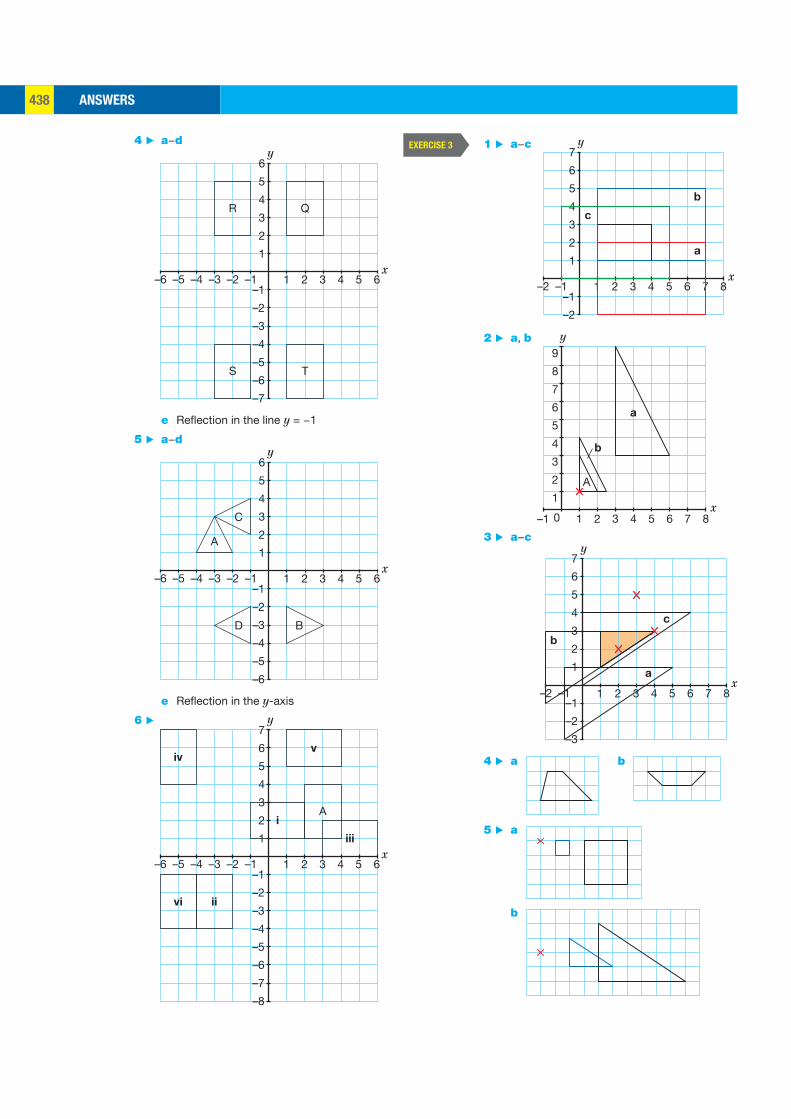
ANSWERS438
1 ▶ a−c
x
y
5
6
7
3
4
2
1
–1
–2
2 4 81 3 5 6 7–1–2
c
b
a
2 ▶ a, b
x
y
5
6
7
8
9
3
4
2
1
2 4 5 6 7 81 3–1 0
A
a
b
3 ▶ a−c
x
y
5
6
7
3
4
2
1
–1
–2
–3
2 4 5 6 7 81 3–1–2
c
a
b
4 ▶ a b
5 ▶ a
b
EXERCISE 3 4 ▶ a−d
x
y
5
6
3
4
2
1
–1
–2
–3
–4
–5
–6
–7
2 4 61 3 5–6 –1–2–3–4–5
R Q
S T
e Reflection in the line y = −1
5 ▶ a−d
x
y
5
6
3
4
2
1
–1
–2
–3
–4
–5
–6
2 4 61 3 5–6 –1–2–3–4–5
C
A
D B
e Reflection in the y-axis
6 ▶
x
y
5
6
7
3
4
2
1
–1
–2
–3
–4
–5
–6
–7
–8
2 4 61 3 5–6 –1–2–3–4–5
iv
vi ii
iii
Ai
v
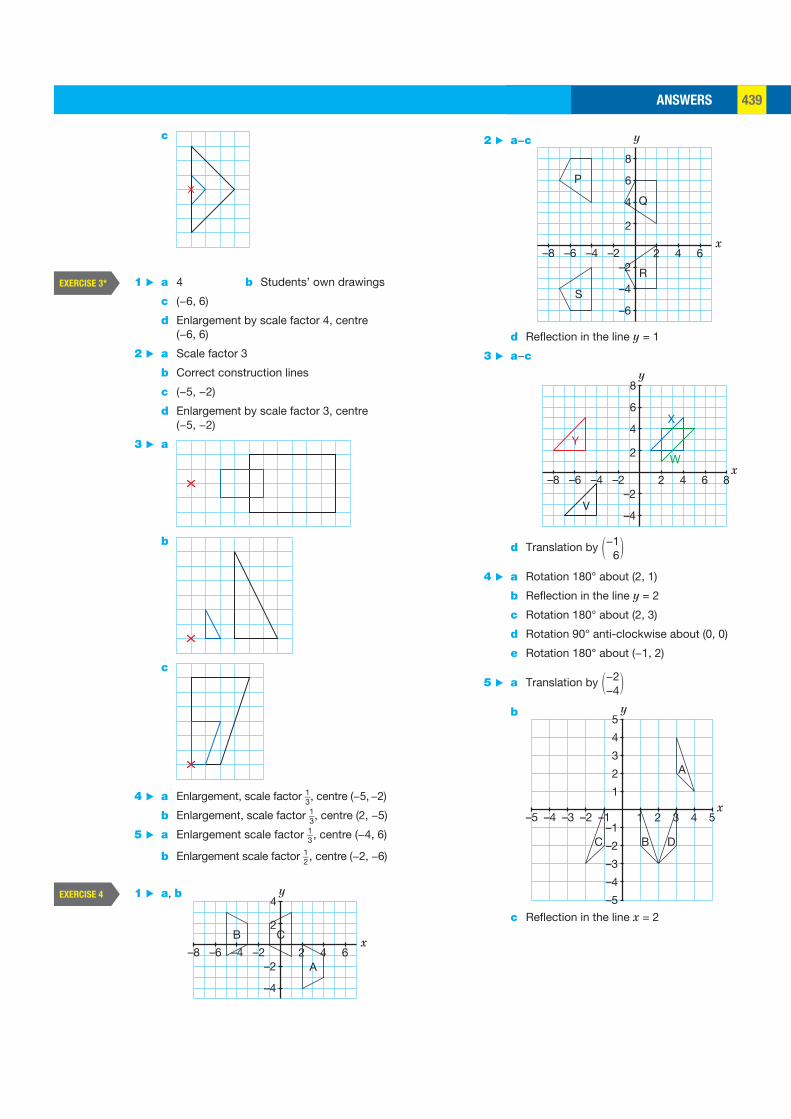
ANSWERS 439
2 ▶ a−c
x
y
6
8
4
2
–2
–4
–6
42 6–2–4–6–8
P
Q
R
S
d Reflection in the line y = 1
3 ▶ a−c
x
y
6
8
4
2
–2
–4
4 82 6–2–4–6–8
V
Y
X
W
d Translation by ( −1 6
)
4 ▶ a Rotation 180° about (2, 1)
b Reflection in the line y = 2
c Rotation 180° about (2, 3)
d Rotation 90° anti-clockwise about (0, 0)
e Rotation 180° about (−1, 2)
5 ▶ a Translation by ( −2 −4
)
b
x
y5
3
4
2
1
–1
–2
–3
–4
–5
2 41 3 5–1–2–3–4–5
A
B DC
c Reflection in the line x = 2
c
1 ▶ a 4 b Students’ own drawings
c (−6, 6)
d Enlargement by scale factor 4, centre (−6, 6)
2 ▶ a Scale factor 3
b Correct construction lines
c (−5, −2)
d Enlargement by scale factor 3, centre (−5, −2)
3 ▶ a
b
c
4 ▶ a Enlargement, scale factor 1 _ 3 , centre (−5, −2)
b Enlargement, scale factor 1 _ 3 , centre (2, −5)
5 ▶ a Enlargement scale factor 1 _ 3 , centre (−4, 6)
b Enlargement scale factor 1 _ 2 , centre (−2, −6)
1 ▶ a, b
x
y4
2
–2
–4
42A
6–2–4–6–8
CB
EXERCISE 3*
EXERCISE 4
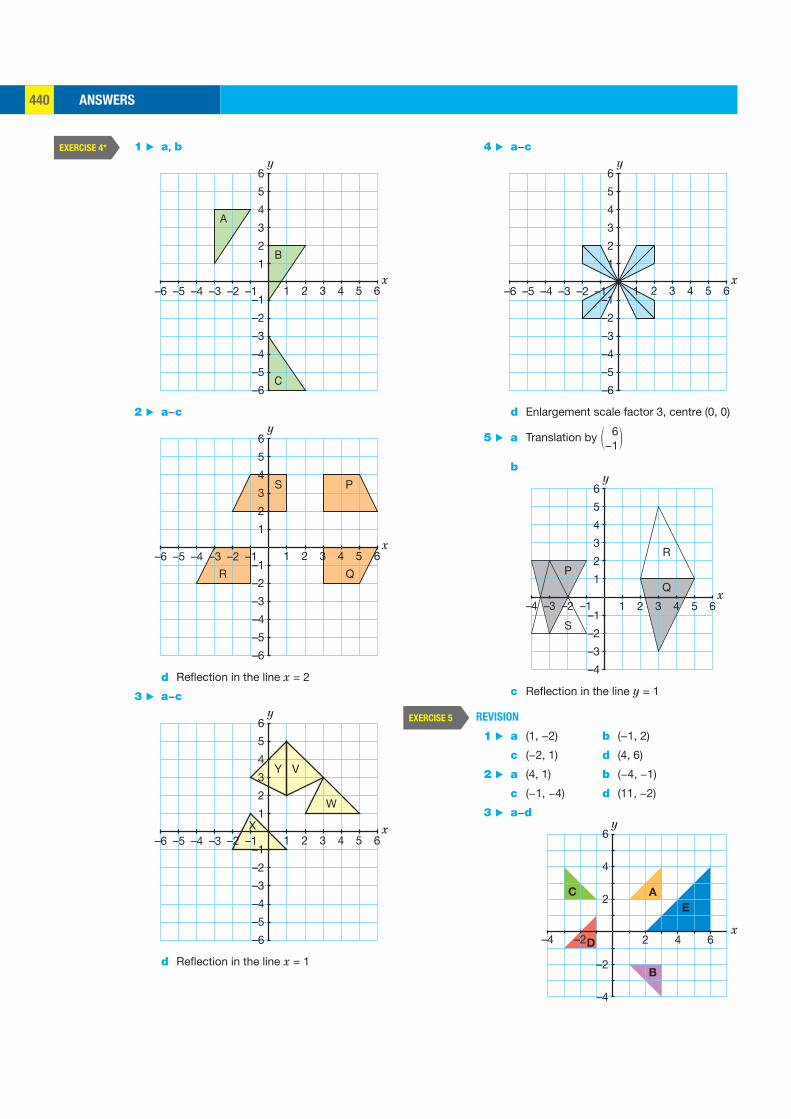
ANSWERS440
4 ▶ a−c
x
y
5
6
3
4
2
1
–1
–2
–3
–4
–5
–6
2 4 61 3 5–6 –1–2–3–4–5
d Enlargement scale factor 3, centre (0, 0)
5 ▶ a Translation by ( 6 −1
)
b
x
y
1–1–2–3–4 2 3 4 5 6
1
–1
–2
–3
–4
2
3
4
5
6
P
R
Q
S
c Reflection in the line y = 1
REVISION
1 ▶ a (1, −2) b (−1, 2)
c (−2, 1) d (4, 6)
2 ▶ a (4, 1) b (−4, −1)
c (−1, −4) d (11, −2)
3 ▶ a−d
x
y6
2
4
–2
–4
2 4 6–4 –2
E
A
B
D
C
EXERCISE 5
1 ▶ a, b
B
C
A
x
y
5
6
3
4
2
1
–1
–2
–3
–4
–5
–6
2 4 61 3 5–6 –1–2–3–4–5
2 ▶ a−c
R Q
PS
x
y
5
6
3
4
2
1
–1
–2
–3
–4
–5
–6
2 4 61 3 5–6 –1–2–3–4–5
d Reflection in the line x = 2
3 ▶ a−c
x
y
5
6
3
4
2
1
–1
–2
–3
–4
–5
–6
2 4 61 3 5–6 –1–2–3–4–5
Y V
W
X
d Reflection in the line x = 1
EXERCISE 4*
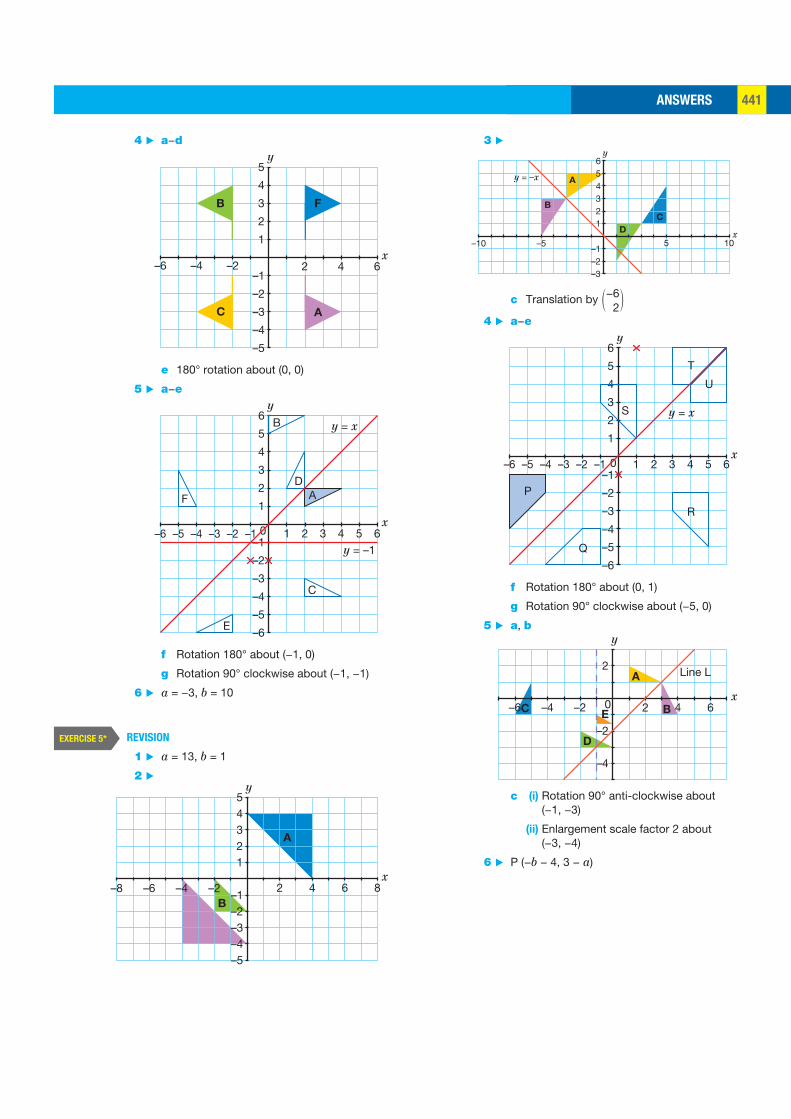
ANSWERS 441
3 ▶
x
y
56
34
21
–2–1
–3
5 10–10 –5
y = –x A
B
C
D
c Translation by ( −6 2
)
4 ▶ a−e
x
y
1–1–2–3–4–5–6 2 3 4 5 6
1
0–1
–2
–3
–4
–5
–6
2
3
4
5
6
y = x
P
Q
R
U
T
S
f Rotation 180° about (0, 1)
g Rotation 90° clockwise about (−5, 0)
5 ▶ a, b
x
y
2
0
–2
–4
2 4 6
Line L
–2–4–6
A
D
EC B
c (i) Rotation 90° anti-clockwise about (−1, −3)
(ii) Enlargement scale factor 2 about (−3, −4)
6 ▶ P (−b − 4, 3 − a)
4 ▶ a−d
x
y5
3
4
2
1
–1
–2
–3
–5
–4
2 4 6–6 –2–4
AC
B F
e 180° rotation about (0, 0)
5 ▶ a−e
x
y
1–1–2–3–4–5–6 2 3 4 5 6
1
0–1
–2
–3
–4
–5
–6
2
3
4
5
6
y = –1
y = x
F
E
C
A
B
D
f Rotation 180° about (−1, 0)
g Rotation 90° clockwise about (−1, −1)
6 ▶ a = −3, b = 10
REVISION
1 ▶ a = 13, b = 1
2 ▶
x
y5
34
21
–2–1
–3
–5–4
2 4 6 8–8 –2–4–6
A
B
EXERCISE 5*
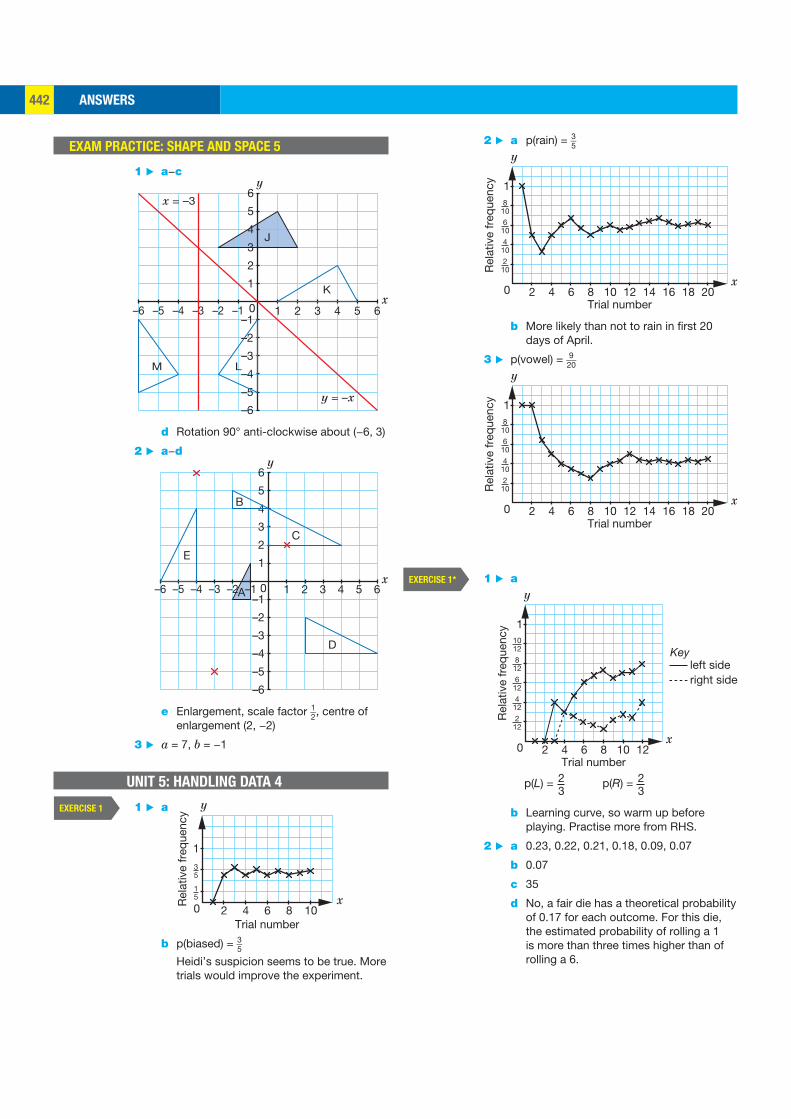
ANSWERS442
2 ▶ a p(rain) = 3 _ 5
810
x
y
1
2 4 6 8 10Trial number
Rel
ativ
e fr
eque
ncy
12 14 16 18 20
6104
102
10
0
b More likely than not to rain in first 20 days of April.
3 ▶ p(vowel) = 9 __ 20
810
x
y
1
2 4 6 8 10Trial number
Rel
ativ
e fr
eque
ncy
12 14 16 18 20
6104
102
10
0
1 ▶ a
812
1012
x
y
2 4 6 8 10Trial number
Rel
ativ
e fr
eque
ncy
12
6124
122
12
1
p(L) = 23
p(R) = 23
Key
right sideleft side
0
b Learning curve, so warm up before playing. Practise more from RHS.
2 ▶ a 0.23, 0.22, 0.21, 0.18, 0.09, 0.07
b 0.07
c 35
d No, a fair die has a theoretical probability of 0.17 for each outcome. For this die, the estimated probability of rolling a 1 is more than three times higher than of rolling a 6.
EXERCISE 1*
EXAM PRACTICE: SHAPE AND SPACE 5
1 ▶ a−c
x
y
1–1–2–3–4–5–6 2 3 4 5 6
1
0–1
–2
–3
–4
–5
–6
2
3
4
5
6x = –3
y = –x
J
K
LM
d Rotation 90° anti-clockwise about (−6, 3)
2 ▶ a−d
x
y
1–1–2–3–4–5–6 2 3 4 5 6
1
0–1
–2
–3
–4
–5
–6
2
3
4
5
6
A
E
B
C
D
e Enlargement, scale factor 1 _ 2 , centre of enlargement (2, −2)
3 ▶ a = 7, b = −1
UNIT 5: HANDLING DATA 4
1 ▶ a
15
1
x
y
2 4 6 8 10
35
Trial number
Rel
ativ
e fr
eque
ncy
0
b p(biased) = 3 _ 5
Heidi’s suspicion seems to be true. More trials would improve the experiment.
EXERCISE 1
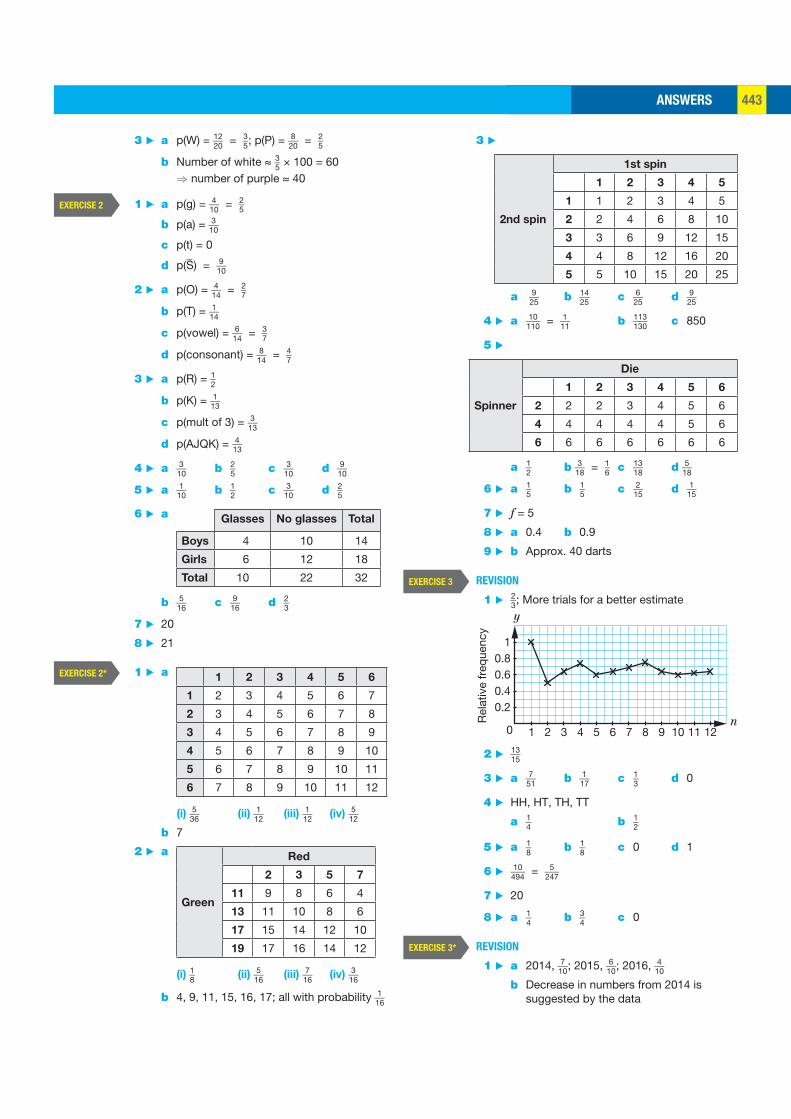
ANSWERS 443
3 ▶
2nd spin
1st spin
1 2 3 4 5
1 1 2 3 4 5
2 2 4 6 8 10
3 3 6 9 12 15
4 4 8 12 16 20
5 5 10 15 20 25
a 9 __ 25 b 14 __ 25 c 6 __ 25 d 9 __ 25
4 ▶ a 10 ___ 110 = 1 __ 11 b 113 ___ 130 c 850
5 ▶
Spinner
Die
1 2 3 4 5 6
2 2 2 3 4 5 6
4 4 4 4 4 5 6
6 6 6 6 6 6 6
a 1 _ 2 b 3 __ 18 = 1 _ 6 c 13 __ 18 d 5 __ 18
6 ▶ a 1 _ 5 b 1 _ 5 c 2 __ 15 d 1 __ 15
7 ▶ f = 5
8 ▶ a 0.4 b 0.9
9 ▶ b Approx. 40 darts
REVISION
1 ▶ 2 _ 3 ; More trials for a better estimate
Rel
ativ
e fr
eque
ncy
n
y
1
0.2
2 3 4 5 6 7 8 9 10 11 12
0.40.60.8
1
0
2 ▶ 13 __ 15
3 ▶ a 7 __ 51 b 1 __ 17 c 1 _ 3 d 0
4 ▶ HH, HT, TH, TT
a 1 _ 4 b 1 _ 2
5 ▶ a 1 _ 8 b 1 _ 8 c 0 d 1
6 ▶ 10 ___ 494 = 5 ___ 247
7 ▶ 20
8 ▶ a 1 _ 4 b 3 _ 4 c 0
REVISION
1 ▶ a 2014, 7 __ 10 ; 2015, 6 __ 10 ; 2016, 4 __ 10
b Decrease in numbers from 2014 is suggested by the data
EXERCISE 3
EXERCISE 3*
3 ▶ a p(W) = 12 __ 20 = 3 _ 5 ; p(P) = 8 __ 20 = 2 _ 5
b Number of white ≈ 3 _ 5 × 100 = 60 ⇒ number of purple ≈ 40
1 ▶ a p(g) = 4 __ 10 = 2 _ 5
b p(a) = 3 __ 10
c p(t) = 0
d p( S ) = 9 __ 10
2 ▶ a p(O) = 4 __ 14 = 2 _ 7
b p(T) = 1 __ 14
c p(vowel) = 6 __ 14 = 3 _ 7
d p(consonant) = 8 __ 14 = 4 _ 7
3 ▶ a p(R) = 1 _ 2
b p(K) = 1 __ 13
c p(mult of 3) = 3 __ 13
d p(AJQK) = 4 __ 13
4 ▶ a 3 __ 10 b 2 _ 5 c 3 __ 10 d 9 __ 10
5 ▶ a 1 __ 10 b 1 _ 2 c 3 __ 10 d 2 _ 5
6 ▶ a Glasses No glasses Total
Boys 4 10 14
Girls 6 12 18
Total 10 22 32
b 5 __ 16 c 9 __ 16 d 2 _ 3
7 ▶ 20
8 ▶ 21
1 ▶ a 1 2 3 4 5 6
1 2 3 4 5 6 7
2 3 4 5 6 7 8
3 4 5 6 7 8 9
4 5 6 7 8 9 10
5 6 7 8 9 10 11
6 7 8 9 10 11 12
(i) 5 __ 36 (ii) 1 __ 12 (iii) 1 __ 12 (iv) 5 __ 12
b 7
2 ▶ a
Green
Red
2 3 5 7
11 9 8 6 4
13 11 10 8 6
17 15 14 12 10
19 17 16 14 12
(i) 1 _ 8 (ii) 5 __ 16 (iii) 7 __ 16 (iv) 3 __ 16
b 4, 9, 11, 15, 16, 17; all with probability 1 __ 16
EXERCISE 2
EXERCISE 2*
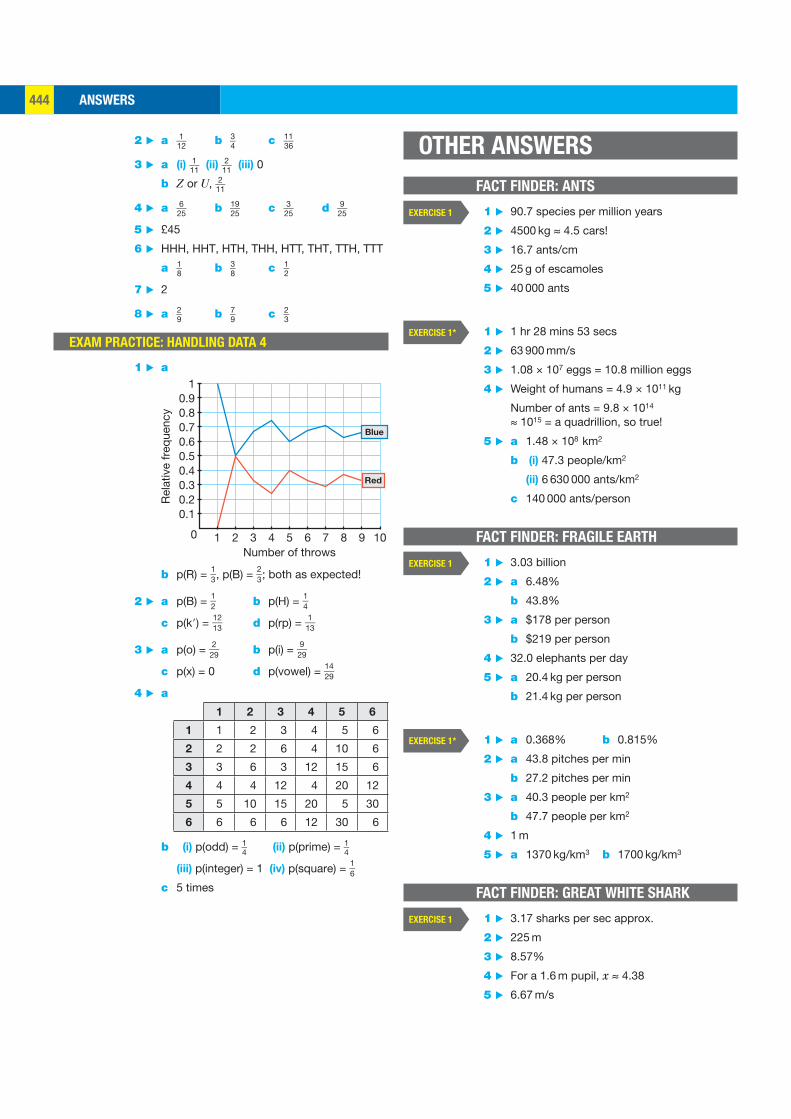
ANSWERS444
OTHER ANSWERS
FACT FINDER: ANTS
1 ▶ 90.7 species per million years
2 ▶ 4500 kg ≈ 4.5 cars!
3 ▶ 16.7 ants/cm
4 ▶ 25 g of escamoles
5 ▶ 40 000 ants
1 ▶ 1 hr 28 mins 53 secs
2 ▶ 63 900 mm/s
3 ▶ 1.08 × 10⁷ eggs = 10.8 million eggs
4 ▶ Weight of humans = 4.9 × 10¹¹ kg
Number of ants = 9.8 × 10¹⁴ ≈ 1015 = a quadrillion, so true!
5 ▶ a 1.48 × 10⁸ km2
b (i) 47.3 people/km2
(ii) 6 630 000 ants/km2
c 140 000 ants/person
FACT FINDER: FRAGILE EARTH
1 ▶ 3.03 billion
2 ▶ a 6.48%
b 43.8%
3 ▶ a $178 per person
b $219 per person
4 ▶ 32.0 elephants per day
5 ▶ a 20.4 kg per person
b 21.4 kg per person
1 ▶ a 0.368% b 0.815%
2 ▶ a 43.8 pitches per min
b 27.2 pitches per min
3 ▶ a 40.3 people per km2
b 47.7 people per km2
4 ▶ 1 m
5 ▶ a 1370 kg/km3 b 1700 kg/km3
FACT FINDER: GREAT WHITE SHARK
1 ▶ 3.17 sharks per sec approx.
2 ▶ 225 m
3 ▶ 8.57%
4 ▶ For a 1.6 m pupil, x ≈ 4.38
5 ▶ 6.67 m/s
EXERCISE 1
EXERCISE 1*
EXERCISE 1
EXERCISE 1*
EXERCISE 1
2 ▶ a 1 __ 12 b 3 _ 4 c 11 __ 36
3 ▶ a (i) 1 __ 11 (ii) 2 __ 11 (iii) 0
b Z or U, 2 __ 11
4 ▶ a 6 __ 25 b 19 __ 25 c 3 __ 25 d 9 __ 25
5 ▶ £45
6 ▶ HHH, HHT, HTH, THH, HTT, THT, TTH, TTT
a 1 _ 8 b 3 _ 8 c 1 _ 2
7 ▶ 2
8 ▶ a 2 _ 9 b 7 _ 9 c 2 _ 3
EXAM PRACTICE: HANDLING DATA 4
1 ▶ a
Number of throws
Rel
ativ
e fr
eque
ncy
1 2 3 4 5 6 7 8 9 10
0.10.20.30.40.50.60.70.80.9
1
Blue
Red
0
b p(R) = 1 _ 3 , p(B) = 2 _ 3 ; both as expected!
2 ▶ a p(B) = 1 _ 2 b p(H) = 1 _ 4
c p(k�) = 12 __ 13 d p(rp) = 1 __ 13
3 ▶ a p(o) = 2 __ 29 b p(i) = 9 __ 29
c p(x) = 0 d p(vowel) = 14 __ 29
4 ▶ a
1 2 3 4 5 6
1 1 2 3 4 5 6
2 2 2 6 4 10 6
3 3 6 3 12 15 6
4 4 4 12 4 20 12
5 5 10 15 20 5 30
6 6 6 6 12 30 6
b (i) p(odd) = 1 _ 4 (ii) p(prime) = 1 _ 4
(iii) p(integer) = 1 (iv) p(square) = 1 _ 6 c 5 times
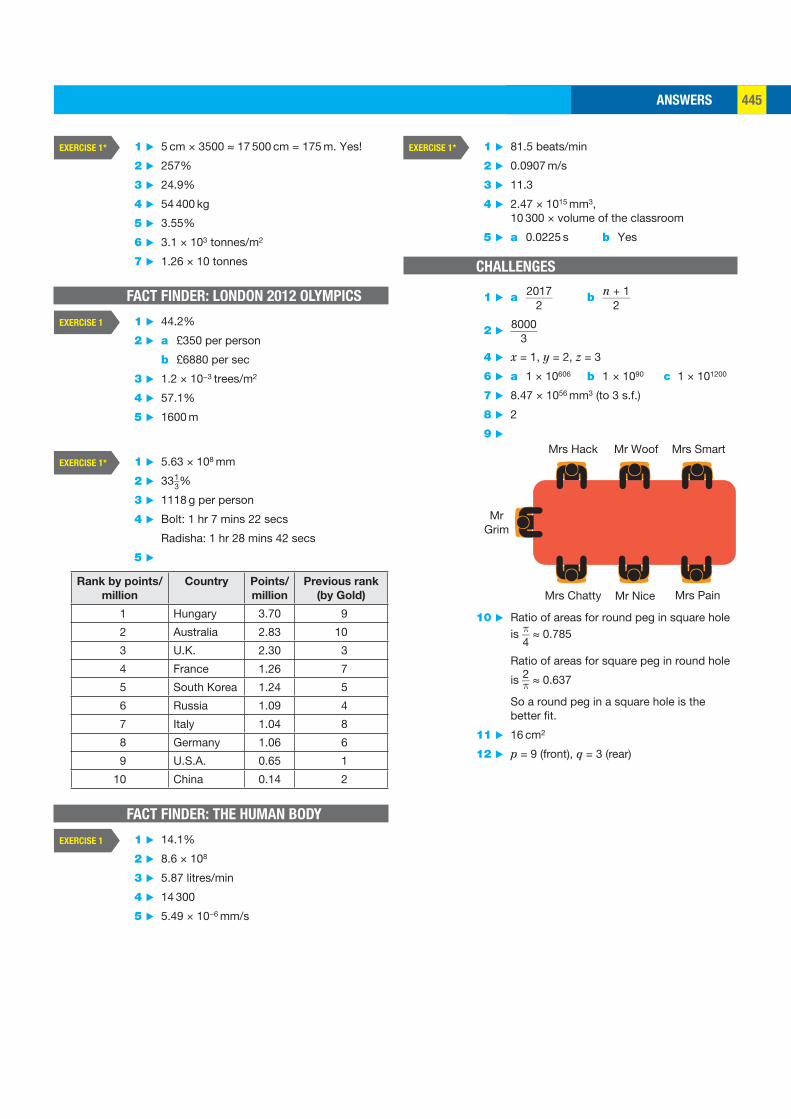
ANSWERS 445
1 ▶ 81.5 beats/min
2 ▶ 0.0907 m/s
3 ▶ 11.3
4 ▶ 2.47 × 1015 mm3, 10 300 × volume of the classroom
5 ▶ a 0.0225 s b Yes
CHALLENGES
1 ▶ a 2017 _____ 2
b n + 1 _____ 2
2 ▶ 8000 _____ 3
4 ▶ x = 1, y = 2, z = 3
6 ▶ a 1 × 10606 b 1 × 1090 c 1 × 101200
7 ▶ 8.47 × 1056 mm3 (to 3 s.f.)
8 ▶ 2
9 ▶ Mrs Hack Mr Woof Mrs Smart
MrGrim
Mr NiceMrs Chatty Mrs Pain
10 ▶ Ratio of areas for round peg in square hole is π __
4 ≈ 0.785
Ratio of areas for square peg in round hole
is 2 __ π ≈ 0.637
So a round peg in a square hole is the better fit.
11 ▶ 16 cm2
12 ▶ p = 9 (front), q = 3 (rear)
EXERCISE 1* 1 ▶ 5 cm × 3500 ≈ 17 500 cm = 175 m. Yes!
2 ▶ 257%
3 ▶ 24.9%
4 ▶ 54 400 kg
5 ▶ 3.55%
6 ▶ 3.1 × 10³ tonnes/m2
7 ▶ 1.26 × 10 tonnes
FACT FINDER: LONDON 2012 OLYMPICS
1 ▶ 44.2%
2 ▶ a £350 per person
b £6880 per sec
3 ▶ 1.2 × 10⁻³ trees/m2
4 ▶ 57.1%
5 ▶ 1600 m
1 ▶ 5.63 × 108 mm
2 ▶ 33 1 _ 3 %
3 ▶ 1118 g per person
4 ▶ Bolt: 1 hr 7 mins 22 secs
Radisha: 1 hr 28 mins 42 secs
5 ▶
Rank by points/
million
Country Points/
million
Previous rank
(by Gold)
1 Hungary 3.70 9
2 Australia 2.83 10
3 U.K. 2.30 3
4 France 1.26 7
5 South Korea 1.24 5
6 Russia 1.09 4
7 Italy 1.04 8
8 Germany 1.06 6
9 U.S.A. 0.65 1
10 China 0.14 2
FACT FINDER: THE HUMAN BODY
1 ▶ 14.1%
2 ▶ 8.6 × 10⁸
3 ▶ 5.87 litres/min
4 ▶ 14 300
5 ▶ 5.49 × 10⁻⁶ mm/s
EXERCISE 1*
EXERCISE 1
EXERCISE 1*
EXERCISE 1
INDEX446
INDEX
Aacceleration 206
accuracy, degree of 13, 304
addition
algebraic fractions 115–16
fractions 9–11
adjacent side 213, 271
Ahmes Papyrus 19
algebra 19–31, 113–25, 185–
200, 247–58, 311–25
basic types of equations 22
brackets 21–2, 31
change of subject 249–52,
258
equations with fractions
187–90, 200
exam practice 30, 124, 199,
257, 324
factorising 185–6, 200, 316–
21, 325
formulae 247–58
inequalities 119–22, 125
like terms 20
magic number tricks 19
multiplying brackets 311–15,
325
positive integer indices 118–
19, 125
revision exercises 28–9,
122–3, 197–8, 254–6, 322–3
simplifying algebraic
expressions 20–2, 31
simplifying algebraic fractions
113–16, 125, 186–7, 200
solving equations 22–8, 31
solving equations with roots
and powers 116–17,
125
solving simultaneous
equations 190–7, 200
alien points 287
Al’Khwarizmi 247
alternate angles 50
angles
alternate 50
bisector 71–3, 83
calculating angles in right-
angled triangles 218–20,
275–8
in circles 140–5, 149
corresponding 50, 73
of depression 213
of elevation 213
exterior 51–2, 57, 59, 62, 63
interior 51–2, 57, 59, 61–2, 63
on parallel lines 50
in semicircles 140–2
on a straight line 50
sum in a quadrilateral 57, 59
sum in a triangle 51–2, 54
vertically opposite 50
ANITA 299
anomalies 287
ants 372–3
appreciation 107
area formulae 248
assessment overview viii–ix
averages 150, 161–6, 173
axis of symmetry 53, 58
Bbar charts 155, 172
bearings 65–7, 213
bell-shaped distribution 163
Benford’s Law 2
BIDMAS 11, 18, 299
bisectors
angle 71–3, 83
perpendicular 70–1, 83
brackets
expanding 21–2
multiplying 311–15, 325
simplifying algebraic
expressions 21–2, 31
Buffon’s needle 360
INDEX 447
Ccalculators ix, 299–301, 310
cancel down 6
Cantor, Georg 84
Cardano, Girolamo 357
Cartesian graphs 32
categorical data 151
challenges 382–3
change of subject 249–52, 258
chord 137
circles
angles in 140–5, 149
area of 248
chord 137
circumference 248
diameter 137
tangent 137
theorems 140–5, 149
column vectors 339–41
combined transformations
348–51
common denominator 9–10
lowest common denominator
3, 185, 187–8
common factors 3, 7, 185, 316
highest common factor 177–
9, 184
complement 88, 89
compound interest 238
compound percentages 238–40,
246
congruent images 341
constructions 65–73, 83
angle bisector 71–3, 83
perpendicular bisector 70–1,
83
scale drawings 65–7
triangles 68–9, 83
continuous data 151, 225,
226–7, 235
conversion graphs 42–5, 49
corresponding angles 50, 73
cosine ratio 271–2
cumulative frequency 290–4,
297
cylinders, volume of 247
Ddata
averages for discrete data
161–6, 173
categorical 151
collecting 150–4
continuous 151, 225, 226–7,
235
discrete 151, 161–6, 173,
225–6, 235
misleading presentation
159–61, 173
presenting 154–9, 172
types of 151–4
data handling 150–73, 224–35,
285–97, 357–71
collecting data 150–4
cumulative frequency 290–4,
297
dispersion 285, 286, 297
distributions 165–6
exam practice 170–1, 234,
296, 370
frequency tables 225–30, 235
misleading data presentation
159–61, 173
presenting data 154–9, 172
probability 357–71
quartiles 286–90, 297
revision exercises 166–9,
230–3, 294–5, 367–9
samples 150
statistical investigation 150–4,
172
types of data 151–4
decimal places 13–15, 18
decimals
as fractions 4
powers as 100
degree of accuracy 13, 304
denominator 3
common denominator 9–10
lowest common denominator
3, 185, 187–8
depreciation 107
depression, angle of 213
Descartes, René 32
diameter 137
difference of two squares 316
Diophantus of Alexandria 185
discrete data 151, 161–6, 173,
225–6, 235
dispersion 285, 286, 297
distance–time graphs 202–5,
212
INDEX448
distributions
frequency polygons 156
normal (bell-shaped) 163
shape of 165–6
tally charts 151
division
algebraic fractions 113–15
fractions 8–9
positive indices 118
EEarth Summit (2015) 374–5
Einstein, Albert 238
elements of sets 84, 85
elevation, angle of 213
elimination method 191–4, 200
enlargements 344–7, 356
equations
basic types of 22
change of subject 249–52,
258
finding the equation of a
straight-line graph 126–8,
136
with fractions 187–90, 200
problems leading to 26–8, 31
see also solving equations
equilateral triangles 51, 53, 54
estimating 301–4, 310
Euclid 140
exam practice
algebra 30, 124, 199, 257,
324
data handling 170–1, 234,
296, 370
graphs 48, 135, 211, 269, 336
number 17, 111, 183, 245,
309
sets 94
shape and space 81, 148,
222, 283, 355
expanding brackets 21–2
expected frequency 362
experimental probability 357–60,
371
exterior angles 51–2, 57, 59, 62,
63
Ffactorising
quadratic expressions 316–
19, 325
simple 185–6, 200
solving quadratic equations
319–21, 325
factors 175
common factors 3, 7, 185,
316
highest common factor 177–
9, 184
multiplying factor 104, 106,
237
prime factors 175–7, 184
scale factor 65, 344, 345
Fermat’s Last Theorem 96
first–outside–inside–last (FOIL)
312–13
first significant figure 14
formulae 247–58
change of subject 249–52,
258
commonly used 248
fractions
adding 9–11
clearing 187–90, 200
decimals as 4
dividing 8–9
equations with 187–90, 200
improper 4, 5, 7
multiplying 6–7
reciprocal 8
simplifying algebraic fractions
113–16, 125, 186–7, 200
simplifying number fractions
3–5
subtracting 9–11
working with 3–11, 18
frequency
cumulative 290–4, 297
expected 362
polygons 156, 173, 226, 227
relative 358–60
tables 225–30, 235
Ggradient
distance–time graphs 202
perpendicular lines 329–32,
337
speed–time graphs 206
straight line 33–6, 49, 126
graphs 32–49, 126–36, 201–12,
INDEX 449
259–70, 326–37
0 = ax2 + bx + c 265–6, 270
ax + by = c 41–2, 49
conversion graphs 42–5, 49
cumulative frequency 290–4,
297
distance–time 202–5, 212
exam practice 48, 135, 211,
269, 336
finding the equation of a
straight-line graph 126–8,
136
gradient of a straight line
33–6, 49, 126
inequalities 326–9, 337
intersection 130, 132, 265
mid-points 333, 334, 337
perpendicular lines 329–32,
337
plotting straight-line graphs
37–42, 49
points on 32
quadratic 259–64, 270
real-life 38–41, 49, 260, 270
revision exercises 46–7, 134,
209–10, 266–8, 335
sketching straight-line graphs
128–30, 136
solving simultaneous
equations 130–3, 136,
265–6, 270
speed–time 205–9, 212
travel 201–12
x-axis 32
x-intercept 265
y-axis 32
y-intercept 37, 38
y = ax2 + bx +c 259–64, 270
y = mx + c 37, 38, 49, 126,
127
great white shark 376–7
Hhighest common factor 177–9,
184
human body 380–1
hypotenuse 53, 137, 213
Iimproper fractions 4, 5, 7
indices
rules of 118–19, 125
standard form with negative
indices 100
standard form with positive
indices 97–9
inequalities
number lines 119–22, 125
representing graphically
326–9, 337
solving linear inequalities
120–2, 125
integer 97
inter-quartile range 287–8
intercept
x-intercept 265
y-intercept 37, 38
interior angles 51–2, 57, 59,
61–2, 63
intersection
graphs 130, 132, 265
sets 88–91
inverse transformations 348
inverse trigonometric functions
218, 275
isosceles trapezium 58
isosceles triangles 51, 53, 54,
137
Izadi Tower 50
Kkite 58
Llike terms 20
linear inequalities
number lines 119–22, 125
representing graphically
326–9, 337
solving linear inequalities
120–2, 125
lines of symmetry 50
London 2012 Olympic Games
378–9
lower bounds 304–7, 310
lower quartile 286, 287, 288
lowest common denominator 3,
185, 187–8
lowest common multiple 177–9,
184
INDEX450
Mmagic number tricks 19
mean 150, 161–4, 225
frequency tables 226, 227
median 150, 161–4, 225, 286,
287, 288
members of sets 84, 85
Mersenne primes 175
mid-points 333, 334, 337
mnemonics
BIDMAS 11, 18, 299
FOIL 312–13
SOHCAHTOA 284
modal class 227
mode 150, 161–4, 225
multiples 175
lowest common multiple
177–9, 184
multiplication
algebraic fractions 113–15
brackets 311–15, 325
fractions 6–7
positive indices 118
multiplying factor 104, 106, 237
Nnegative gradient
distance–time graphs 202
speed–time graphs 206
straight line 34
negative indices 100
Nightingale, Florence 285
normal distribution 163
number 3–18, 97–112, 175–84,
237–46, 299–310
decimal places 13–15, 18
estimating 301–4, 310
exam practice 17, 111, 183,
245, 309
highest common factor 177–
9, 184
lowest common multiple
177–9, 184
order of operations 11–12, 18,
299
prime factors 175–7, 184
ratio 180–1, 184
revision exercises 15–16,
109–10, 182, 243–4, 308
rounding 13, 304–7, 310
significant figures 13–15, 18
standard form 97–103, 112
upper and lower bounds
304–7, 310
number lines, inequalities 119–
22, 125
numerator 3
OOlympic Games, London 2012
378–9
opposite side 213, 271
order of operations 11–12, 18,
299
outliers 163
Pparabolas 259
parallel lines, angles on 50
parallelogram 58
area of 248
per annum 237
percentages 103–9, 112, 237
change 104–5, 112
compound 238–40, 246
increase and decrease 106–9,
112
reverse 241–3, 246
x as a percentage of y 103,
237
x percent of y 103–4, 237
perpendicular bisector 70–1, 83
perpendicular lines 329–32, 337
pictograms 154, 172
pie charts 155, 172
Planck length 97
plotting straight-line graphs
37–42, 49
points on graphs 32
polio vaccine 126
polygons 61–5, 82
frequency polygons 156, 173,
226, 227
positive gradient
distance–time graphs 202
speed–time graphs 206
straight line 34
positive integer indices
rules of 118–19, 125
standard form 97–9
INDEX 451
powers
as decimals 100
raising to a power 118
simplifying algebraic
expressions 21
solving equations with 116–
17, 125
prime factors 175–7, 184
prime numbers 175
probability 357–71
experimental 357–60, 371
space 363, 371
theoretical 361–7, 371
pyramid, volume of 252
Pythagoras of Samos 137
Pythagoras’ Theorem 137–40,
149, 333–4, 337
Qquadratic curves 259
quadratic equations 311
problems leading to 321–2,
325
solving by factorisation 319–
21, 325
solving by graphs 265–6, 270
quadratic expressions,
factorising 316–19, 325
quadratic graphs 259–64, 270
quadrilaterals 57–61, 82
quartiles 286–90, 297
Rraising to a power 118
range 287, 288, 304
ratio 180–1, 184
readings 43
real-life graphs
quadratic graphs 260, 270
straight-line graphs 38–41, 49
reasons for geometrical
questions 141, 149
reciprocal 8
rectangle 58
reflections 341–4, 356
relative frequency 358–60
resultant vector 341
reverse percentages 241–3, 246
revision exercises
algebra 28–9, 122–3, 197–8,
254–6, 322–3
data handling 166–9, 230–3,
294–5, 367–9
graphs 46–7, 134, 209–10,
266–8, 335
number 15–16, 109–10, 182,
243–4, 308
sets 92–3
shape and space 78–80,
146–7, 220–1, 281–2, 351–4
rhombus 58
right-angled triangles 53
adjacent side 213, 271
area of 248
calculating angles 218–20,
275–8
calculating sides 215–17,
273–5
cosine ratio 271–2
hypotenuse 53, 137, 213
opposite side 213, 271
Pythagoras’ Theorem 137–40,
149
sine ratio 271–2
tangent ratio 214–23
rise 33, 126
roots, solving equations with
116–17, 125
rotational symmetry 51
rotations 341–4, 356
rounding 13, 304–7, 310
run 33, 126
Ssample space 363, 371
samples 150
scale drawings 65–7
scale factor 65, 344, 345
semicircles, angles in 140–2
sets 84–95
complement 88, 89
elements/members 84, 85
empty 85
equal 85
exam practice 94
intersection 88–91
list/rule 84, 85
notation 84–6, 95
revision exercises 92–3
subsets 87, 89
INDEX452
union of 91–2
universal 87, 89
Venn diagrams 87–92, 95, 178
shape and space 50–83, 137–
49, 213–23, 271–84, 338–56
circle theorems 140–5, 149
constructions 65–73, 83
different geometrical shapes
51–65
exam practice 81, 148, 222,
283, 355
reasons for geometrical
questions 141, 149
revision exercises 78–80,
146–7, 220–1, 281–2, 351–4
transformations 338–56
sigma 225, 227
significant figures 13–15, 18
similar triangles 73–8, 83
simplification
algebraic expressions 20–2,
31
algebraic fractions 113–16,
125, 186–7, 200
number fractions 3–5
simultaneous equations
solving by algebra 190–7, 200
solving by graphs 130–3, 136,
265–6, 270
sine ratio 271–2
sketching straight-line graphs
128–30, 136
SOHCAHTOA 284
solving equations
algebraic equations 22–8, 31
quadratic equations by
factorisation 319–21, 325
quadratic equations by graphs
265–6, 270
with roots and powers 116–
17, 125
simultaneous equations by
algebra 190–7, 200
simultaneous equations by
graphs 130–3, 136, 265–6,
270
solving inequalities 120–2, 125
speed, formula for 248
speed–time graphs 205–9, 212
square 58
standard form 97–103, 112
estimating using 302–4
negative indices 100
positive indices 97–9
statistical investigation 150–4,
172
straight line
angles on 50
gradient of 33–6, 49, 126
intersecting a circle 137
perpendicular bisector 70–1,
83
straight-line graphs
ax + by = c 41–2, 49
conversion graphs 42–5, 49
finding the equation of 126–8,
136
plotting 37–42, 49
real-life 38–41, 49
sketching 128–30, 136
y = mx + c 37, 38, 49, 126,
127
subsets 87, 89
substitution method 190–1, 200
subtraction
algebraic fractions 115–16
fractions 9–11
successive transformations 348
symmetry
axis of 53, 58
lines of 50
rotational 51
Ttables
frequency 225–30, 235
two-way 156, 172
tally charts 151–2, 224
tangent of a circle 137
tangent ratio 214–23
theoretical probability 361–7,
371
transformations 338–56
combined 348–51
enlargements 344–7, 356
inverse 348
reflections 341–4, 356
rotations 341–4, 356
successive 348
translations 339–41, 356
translations 339–41, 356
trapezium 58
INDEX 453
area of 248
travel graphs 201–12
distance–time 202–5, 212
speed–time 205–9, 212
trials 357
triangles 51–7, 82
angle sum 51–2, 54
constructing 68–9, 83
dividing polygons into 61, 62,
63
dividing quadrilaterals into 57
equilateral 51, 53, 54
exterior angle 51–2
interior angle 51–2
isosceles 51, 53, 54, 137
similar 73–8, 83
special 53–7
see also right-angled triangles
trigonometry 213–23, 271–84
calculating angles 218–20,
275–8
calculating sides 215–17,
273–5
cosine ratio 271–2
inverse functions 218, 275
sine ratio 271–2
tangent ratio 214–23
Turing, Alan 225
two-way tables 156, 172
Uunion of sets 91–2
unit ratios 180
universal set 87, 89
upper bounds 304–7, 310
upper quartile 286, 287, 288
Vvariables 38
vectors 339–41
Venn diagrams 87–92, 95, 178
volume
cylinder 247
pyramid 252
Xx-axis 32
x-intercept 265
Yy-axis 32
y-intercept 37, 38
ACKNOWLEDGEMENTS454
The publisher would like to thank the following for their kind permission to reproduce their photographs: (Key: b-bottom; c-centre; l-left; r-right; t-top) 123RF.com: 48cr, 93cr, 162t, 296cr, 361r, 369b, Aaron Amat 8c, 9br, Agnieszka Murphy 374 (fishing), 375 (fishing), Andrey Golubev 252, Andrey Pavlov 372, Brenken 295t, Corey A Ford 376, crisferra 241t, Dan Iacob 288b, Darko Novakovic 195cr, Eduard Kim 247, Ferli Achirulli 111b, gkuna 295b, greyjj 374 (mega-cities), 375 (mega-cities), homestudio 363l, Igor Shkvara 269cr, Ihor Obraztsov 374 (transport), Inspirestock International 232br, James Weston 375 (ozone layer), Joerg Hackemann 207cr, Kirill Cherezov 46br, Konstantin Shaklein 311tr, mocker 183l, myvector 374 (population), Oleksandr Galata 374 (water), Olexandr Moroz 109b, ozaiachin 294bl, photopiano 109t, rabbit75123 263cr, rioblanco 16t, Robert Nyholm 367tc, Sergey Leonov 374 (nuclear power), siraphol 242, Tatiana Mihaliova 246br, Tim Hester 368b, Tomas Marek 367tr, tomwang 164br, Tul Chalothonrangsee 374 (global warming), 375 (global warming), vasilevki 375 (species), Vladimir Yudin 375 (rainforests), vselenka 275cr, Yulia Kireeva 374 (computers); Alamy Images: Anna Curnow 182b, Blend Images 285b, Boaz Rottem 152cl, catherinka 288t, Cultura RM 7t, Enigma 228, epa european pressphoto agency b.v. 245tl, Ian Shaw 11, Jamie Pham Photography 131cr, Janine Wiedel Photolibrary 211br, Juniors Bildarchiv GmbH 96, Mauritius images GmbH 205tl, Paul Shawcross / LGPL 209tr, PCN Photography 308b, Pictorial Press Ltd 84t, World History Archive 259tr, ZUMA Press Inc 227b; Fotolia.com: Africa Studio 170b, baibaz 6c, 8tr, bennymarty 44, BillionPhotos.com 15, Boggy 42, Budimir Jevtic 163t, carballo 240b, chekky 133, Dariusz Kopestynski 241b, davehanlon 47b, dracozlat 113tr, DragonImages 135l, eagle20ita 50t, fotoliaxrender 102t, giulianax 292cl, Igor Mojzes 24, kletr 40t, lzf 289, Maksim Shebeko 90cr, Marco Tiberio 6t, 6b, markrhiggins 234cr, ndoeljindoel 209br, nobeastsofierce 102c, NOBU 158br, oles_photo 104b, pilipphoto 166, ray8 177, redche 229b, Stephanie Friedman 305, tilpich 355, winston 16b, Zarya Maxim 154tr; Getty Images: Andrew Holt 339tl, Apic 175, Asanka Brendon Ratnayake 296t, ChinaFotoPress 105br, Daryl Benson 2, Fred Stein Archive 238t, Gurpal Singh Dutta 225, Hemera Technologies 366br, Heritage Images 224tr, JEKESAI NJIKIZANA 286cr, Keith Ladzinski 93t, LOCOG 379, Miles Willis 41tr, Mouse-ear 224tl, Print Collector 240t, Science & Society Picture Library 299t, 357, SEBASTIEN BOZON 110, The Asahi Shimbun 33tc, ullstein bild 97l, UniversalImagesGroup 140cl; IOC Museums Collection © IOC : 378tr; Jacques Rodrigue: Living in the Spotlight 2013, acrylic on canvas, 40x60, George Rodrigue 174; Michael Poulton: Number 5 and Floating Stones. Installation on Grass Creek, by Michael Poulton, Museum of Temporary Art, Victoria Road, Ontario, CA. Photograph by the artist 298; Pearson Education Ltd: Studio 8 84b, Gareth Boden 171br, Trevor Clifford 338tl, Coleman Yuen. Pearson Education Asia Ltd 29; Press Association Images: Mike Derer / AP 106tr; Science Photo Library Ltd: Gwen Shockey 380, Martyn F. Chillmaid 39t, NASA / ESA / JPL-CALTECH 97r, Royal Astronomical Society 185t; Shutterstock.com: 85050 117, absolutimages 87b, Africa Studio 8br, Alica Q 48bl, Ander Dylan 41tl, Andrew Scherbackov 182t, Angel Simon 233b, AnnaDe 181b, Antonio Abrignani 150t, arek_malang 38, artpritsadee 286cl, baloon111 293tl, bibiphoto 9cr, bikeriderlondon 151, Bikeworldtravel 237tr, Breadmaker 245bl, BRG.photography 367bl, BUGNUT23 332cl, CandyBox Images 104t, cesc_assawin 98, Christian Kieffer 271tr, Daniel Prudek 210cr, Danin Tulic 47t, Dziurek 245tr, El Nariz 92cr, Eric Isselee 162b, 224c, 348t, 366tr, 366c, EurngKwan 65cr, Everett Historical 285t, Evgenyi 135r, Fisherss 99, FoodStocker 85, Georgios Kollidas 32, Hung Chung Chih 17l, Iasmina Calinciuc 9bl, icsnaps 259tl, Igor Kolos 152c, Irafael 245br, Jag_cz 7b, Jagodka 87t, Jan Martin Will 107br, Jennifer Gottschalk 338tr, Joggie Botma 367tl, Joshua Resnick 183r, katatonia82 169b, Kesu 181t, Kiev.Victor 290, Ksenia Palimski 108br, lexaarts 283br, liza1879 94cl, Ljupco Smokovski 210tr, LU JINRONG 341cr, Luis Fernando Curci Chavier 222tr, Malcolm Chapman 111t, Manfred Ruckszio 366tl, MARGRIT HIRSCH 39b, Matt Jones 17r, Microstock Man 86b, Milkovasa 243, Milles Studio 180, Molodec 86t, Monkey Business Images 126tr, Natali Glado 199, Nataliya Nazarova 244b, Nejron Photo 229t, nui7711 336, oksana2010 190b, Oleksiy Mark 130cr, Ondrej Prosicky 28, Pablo77 132, Pal2iyawit 234tr, Pamela D. Maxwell 89cr, patpitchaya 361l, Peter Bernik 309cr, PeterVrabel 236, Photosebia 211bl, Piti Tan 10, pkchai 198, Racheal Grazias 33tr, Rafa Irusta 8bl, Rahmo 19, rayjunk 268b, Reha Mark 46bl, Richard Griffin 3, Rido 89br, S.Borisov 179t, SergeyDV 201t, Skylines 5t, SpeedKingz 114, successo images 40b, suravid 152cr, TachePhoto 179b, Tyler Olson 9tr, unclepepin 383br, urosr 196, Vaclav Volrab 5b, Valentina Razumova 257r, vdLee 176b, Vitaliy Netiaga 238b, Vogel 33tl, Volodymyr Burdiak 222bl, Waj 217tr, Wasu Watcharadachaphong 226cr, wavebreakmedia 286t, Yingko 178cr, You Touch Pix of EuToch 102b Cover images: Front: Shutterstock.com: Filip FuxaInside front cover: Shutterstock.com: Dmitry Lobanov
All other images © Pearson Education
Glossary terms have been taken from The Longman Dictionary of Contemporary English Online.


EDEXCEL INTERNATIONAL GCSE (9 –1)
MATHEMATICS AStudent Book 1David Turner, Ian Potts 1• Written by highly-experienced International GCSE Mathematics teachers
and authors David Turner and Ian Potts• Integrated exam practice throughout, with differentiated revision exercises
and chapter summaries• Signposted transferable skills• Integrated Pearson Progression Scale• Reviewed by a language specialist to ensure the book is written in a clear
and accessible style for students whose fi rst language may not be English• Glossary of key mathematics terminology• Full answers included in the back of the book• eBook included• Interactive practice activities and teacher support provided online as part of
Pearson’s ActiveLearn Digital Service
For Edexcel International GCSE Mathematics specifi cation A (4MA1) Higher Tierfor fi rst teaching 2016.
Pearson Edexcel International GCSE (9–1) Mathematics A prepares students for the International GCSE (9–1) Mathematics A specifi cation.
Together, Student Books 1 and 2 provide comprehensive coverage of the Higher Tier specifi cation. This book is designed to provide students with the best preparation possible for the examination:
www.pearsonglobalschools.com
MATHEMATICS AStudent Book 2ISBN: 9780435183059