edelweiss investment research · indian metals & ferro alloys ltd. 2 gwm imfa is the most...
TRANSCRIPT

1 GWM
Edelweiss Investment Research
Tactical BUY: Indian Metals & Ferro Alloys Ltd.
Healthy cash flows and attractive valuations to unlock value
Indian Metals & Ferro Alloys Ltd (IMFA) is the largest ferrochrome producer in India; it has
capacity of 275,000 tpa in Odisha with a captive chrome ore mine and coal-based power
plant capacity of 258MW. We believe IMFA would best benefit from the healthy demand for
ferrochrome, the current high realisations and the ongoing auctioning of ferrochrome assets
of bankrupt competitors in India. We expect IMFA to maintain an EBIDTA/tonne of INR
20,000/tonne for FY19–20E compared with INR 21,000/tonne for 9MFY18 due to its balanced
mix of long-term (70%) and short-term contracts (30%). Healthy cash flow generation, limited
capex, is expected to pare net debt by over INR 600 cr to just INR 22 cr by FY20E. We factor in
only a marginal volume growth of 2% due to current capacity constraints. We expect IMFA’s
EBIDTA and PAT to remain flattish, close to INR 500 cr and INR 225 cr, respectively. We
recommend a ‘Tactical BUY’ on IMFA with a target price of INR 733/share, valuing the stock
at EV/EBIDTA of 4x on FY20E basis.
Ferrochrome demand – Related to healthy growth in stainless steel industry
The Indian ferrochrome industry bases its growth on the Indian and global (especially Chinese)
stainless steel (SS) industry. Over the past decade, the global SS industry expanded at a CAGR
of 5.4%, bolstered by a 13.6% growth in China and 6.2% growth in India. Steady investments in
construction, transportation and process industries and increasing consumerism are set to
maintain expansion in the global SS market at a 5% CAGR over FY17–22E. As a primary raw
material in SS with no substitute, worldwide ferrochrome demand in the next 5 years is
expected to rise at a 5% CAGR. President Trump’s protectionism of the US steel industry and
planned impetus for their infrastructure segment could further boost the demand for
ferrochrome in the global market.
Integrated play – Globally competitive, dominant edge
IMFA is the only Indian player with captive chrome ore mines and captive power. As it
depends on the export market for around 80% of its production material, IMFA has to
compete with South African and Chinese ferrochrome producers in terms of cost
effectiveness. With backward integration, IMFA’s production cost matches that of most of the
efficient players in South Africa and it is lower by vast margn as China lacks chrome ore mines.
Increasing power costs in South Africa and pollution concerns in China over ferrochrome
production makes IMFA even more competitive in the global market.
Consolidation in domestic industry could led to capacity expansion
IMFA’s strategy of steady backward integration over aggressive capacity addition helps it
maintain profitability, sometimes over growth. Now, following the rounds of NCLT and bank
auctions of assets of FACOR Alloys and Rohit Ferro, we believe IMFA has a chance to boost
ferrochrome capacity by at least 40% and thus capture global growth opportunities. We
believe it would be able to increase chrome ore mining capacity with the additions. If IMFA
fails to buy assets in these auctions, it alternatively plans brownfield capacity expansion in the
next 1–2 years.
Valuation & recommendation – Lower valuation; strengthening balance sheet to drive upside
Barring capacity additions through auctions or brownfield expansion, there would be a
marginal growth of 2% in volumes over FY17–20E. We also maintain EBITDA at INR 20,000/tonne,
less than the 9MFY18 EBITDA of INR 21,000/tonne. We believe healthy cash flows in the next 2
years would reduce net debt by INR 600 cr. We believe a further strengthening balance sheet
would account for a large part of stock upside. We value the stock at a 2-year forward
EV/EBITDA of 4x, arriving at a target price of INR 733/share.
Year to March FY16 FY17 FY18E FY19E FY20E
Revenues (INR Cr) 1,211 1,672 1,814 1,920 2,000
Rev growth (%) (9.9) 38.1 8.5 5.8 4.2
EBITDA (INR Cr) 123 513 526 480 500
Net Profit (INR Cr) (27) 249 276 215 232
P/E (x) (51.0) 5.7 5.2 6.6 6.1
EV/EBITDA (x) 18.5 4.0 3.6 3.5 3.0
RoACE (%) 0.6 26.9 27.3 23.5 24.7
RoAE (%) (3.1) 26.3 23.2 15.3 14.5
CMP INR: 528
Rating: BUY
Target Price INR: 733
Upside: 39%
Salil Utagi
Research Analyst
Harsh Vijay Shah
Research Analyst
Bloomberg: IMFA:IN
52-week
range (INR): 799/ 385
Share in issue
(cr): 2.70
M cap (INR cr): 1,415
Avg. Daily Vol.
BSE/NSE :(‘000): 92
Promoter
Holding (%) 58.69
Date: 10th April 2018
Indian Metals & Ferro Alloys Ltd.
2 GWM
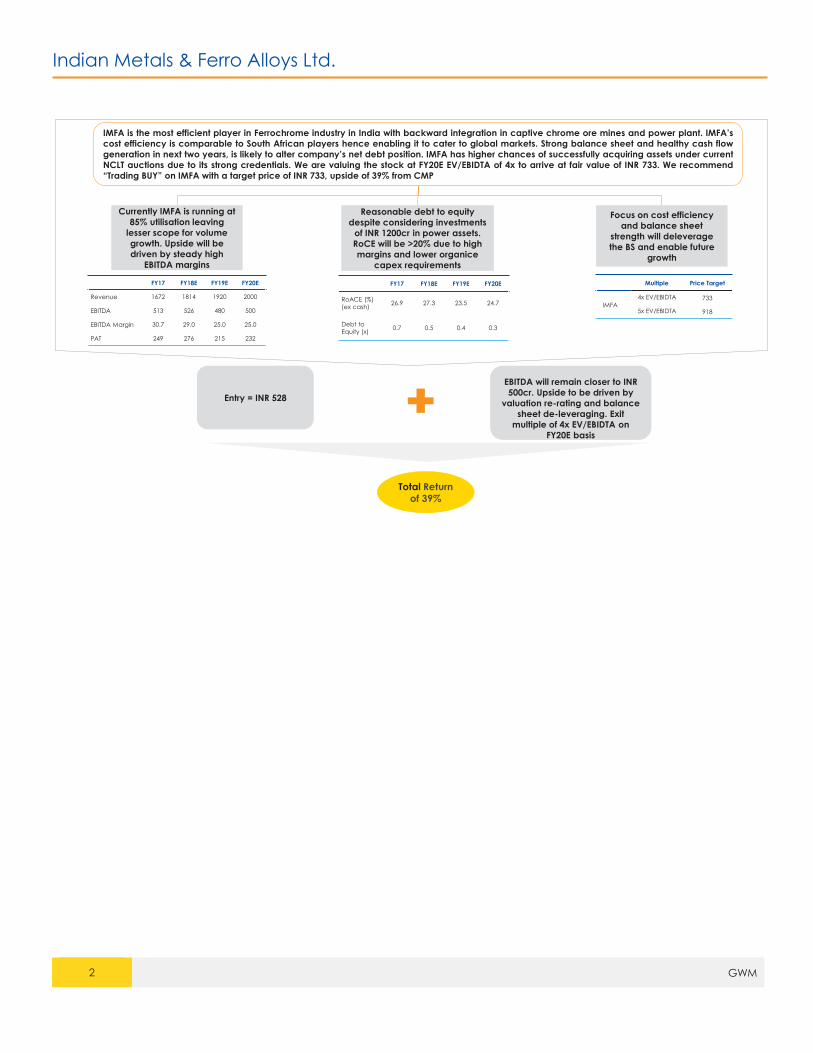
IMFA is the most efficient player in Ferrochrome industry in India with backward integration in captive chrome ore mines and power plant. IMFA’s
cost efficiency is comparable to South African players hence enabling it to cater to global markets. Strong balance sheet and healthy cash flow
generation in next two years, is likely to alter company’s net debt position. IMFA has higher chances of successfully acquiring assets under current
NCLT auctions due to its strong credentials. We are valuing the stock at FY20E EV/EBIDTA of 4x to arrive at fair value of INR 733. We recommend
“Trading BUY” on IMFA with a target price of INR 733, upside of 39% from CMP
Currently IMFA is running at
85% utilisation leaving
lesser scope for volume
growth. Upside will be
driven by steady high
EBITDA margins
Reasonable debt to equity
despite considering investments
of INR 1200cr in power assets.
RoCE will be >20% due to high
margins and lower organice
capex requirements
Focus on cost efficiency
and balance sheet
strength will deleverage
the BS and enable future
growth
FY17 FY18E FY19E FY20E
Revenue 1672 1814 1920 2000
EBITDA 513 526 480 500
EBITDA Margin 30.7 29.0 25.0 25.0
PAT 249 276 215 232
FY17 FY18E FY19E FY20E
RoACE (%)
(ex cash)26.9 27.3 23.5 24.7
Debt to
Equity (x)0.7 0.5 0.4 0.3
Multiple Price Target
IMFA
4x EV/EBIDTA 733
5x EV/EBIDTA 918
Entry = INR 528
EBITDA will remain closer to INR
500cr. Upside to be driven by
valuation re-rating and balance
sheet de-leveraging. Exit
multiple of 4x EV/EBIDTA on
FY20E basis
Total Return of 39%
Indian Metals & Ferro Alloys Ltd.
3 GWM
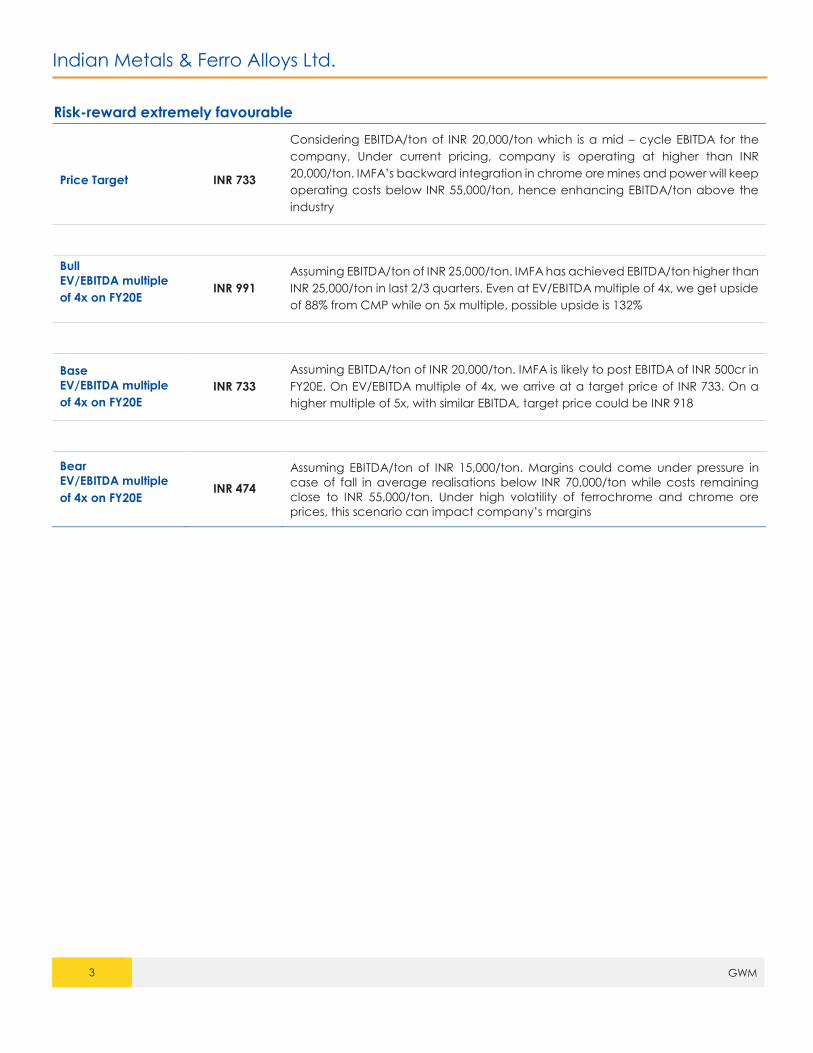
Risk-reward extremely favourable
Price Target INR 733
Considering EBITDA/ton of INR 20,000/ton which is a mid – cycle EBITDA for the
company. Under current pricing, company is operating at higher than INR
20,000/ton. IMFA’s backward integration in chrome ore mines and power will keep
operating costs below INR 55,000/ton, hence enhancing EBITDA/ton above the
industry
Bull
EV/EBITDA multiple
of 4x on FY20E INR 991
Assuming EBITDA/ton of INR 25,000/ton. IMFA has achieved EBITDA/ton higher than
INR 25,000/ton in last 2/3 quarters. Even at EV/EBITDA multiple of 4x, we get upside
of 88% from CMP while on 5x multiple, possible upside is 132%
Base
EV/EBITDA multiple
of 4x on FY20E
INR 733
Assuming EBITDA/ton of INR 20,000/ton. IMFA is likely to post EBITDA of INR 500cr in
FY20E. On EV/EBITDA multiple of 4x, we arrive at a target price of INR 733. On a
higher multiple of 5x, with similar EBITDA, target price could be INR 918
Bear
EV/EBITDA multiple
of 4x on FY20E INR 474
Assuming EBITDA/ton of INR 15,000/ton. Margins could come under pressure in
case of fall in average realisations below INR 70,000/ton while costs remaining
close to INR 55,000/ton. Under high volatility of ferrochrome and chrome ore
prices, this scenario can impact company’s margins

Indian Metals & Ferro Alloys Ltd.
4 GWM
Average Daily Turnover (INR cr) Stock Price (CAGR) Relative to Sensex, CAGR (%)
3 months 6 months 1 year 1 year 3 years 5 years Since Inception 1 year 3 years 5 years Since Inception
5.46 8.27 8.75 -33% 41% 17% 13% -47% 35% 4% -1%
Bu
sin
ess
Va
lue
Driv
ers
Nature of Industry The demand for ferrochrome largely depends on the global demand for SS. The Indian ferrochrome
industry is oligopolistic, with Balasore and IMFA controlling over one-third of this market. By far, IMFA is
the largest integrated ferrochrome manufacturer in India.
Opportunity Size
Global ferrochrome production was 12.03 mn tonnes in 2017; production is expected to grow at a
5.5% CAGR during 2017–21E to ~15 mn tonnes. Demand from China would be the key driver of the
global ferrochrome market. India as a country produced only 1.0–1.1 mn tonnes of ferrochrome, in
which IMFA produced 0.2 mn tonne in FY17, thus creating a huge opportunity for itself going ahead.
Capital Allocation IMFA has been prudent in capital allocation. The management considers both chrome ore mines
and power assets as key raw materials. IMFA will not add any ferrochrome capacity without
complete integration in mines and power
Predictability IMFA’s financials are highly related to the global SS and ferrochrome demand-supply scenario. We
believe that near-term demand from China and India would remain strong owing to visible capex
programs and consumer demand
Sustainability The global SS industry is cyclical in nature but IMFA would have sustainable demand as the
company enters into long term volume contracts for upto 70% of its production
Disproportionate
Future IMFA can achieve high growth in case of acquisition of NCLT assets at a bargain and/or further
sharp jump in average realisation of ferrochrome
Business Strategy &
Planned Initiatives IMFA is bidding for ferrochrome assets to be auctioned in NCLT. If company fails to purchase an
asset in this auction, they will incur capex for brownfield expansion
Near Term Visibility The demand for SS and ferrochrome is expected to remain strong in the near term due to strong
demand from China/India, the two largest global consumer, and one that remains a driver of the
global ferrochrome demand-supply balance.
Long-Term Visibility IMFA’s fortunes are linked to the SS industry cycle and more to the demand-supply balance of
ferrochrome. We believe the rising demand for ferrochrome is sustainable as China’s SS industry is
growing at a faster pace than the ferrochrome industry.

Indian Metals & Ferro Alloys Ltd.
5 GWM
Focus Charts – Story in a nutshell
Global Stainless Steel production forecast China remains global FeCr demand center
China overtakes South Africa as leading FeCr producer Ferrochrome prices – Benchmark up by 20% for Q2
Steady increase in average realisation and EBITDA/tonne
due to operational efficiency
Expect repayment of debt due to steady growth in OCF
Source: Edelweiss Investment Research
48,080
50,484
53,008
55,659
58,442
61,364
40,000
45,000
50,000
55,000
60,000
65,000
2017e 2018e 2019e 2020e 2021e 2022e
Pro
dn
(In
KT)
0
2
4
6
8
10
12
14
2013 2014 2015 2016 2017e 2018f
(In
mn
to
nn
e)
NAFTA European Union Japan
South Korea Others China
India Total
0.0
2.0
4.0
6.0
2008 2009 2010 2011 2012 2013 2014 2015 2016 2017e
In M
n T
on
ne
s
Brazil EURussia, Turkey & Albania IndiaKazakhstan South AfricaZimbabwe Others
-
0.20
0.40
0.60
0.80
1.00
1.20
1.40
1.60
1.80
De
c,2
010
Ap
r,201
1
Au
g,2
011
De
c,2
011
Ap
r,201
2
Au
g,2
012
De
c,2
012
Ap
r,201
3
Au
g,2
013
De
c,2
013
Ap
r,201
4
Au
g,2
014
De
c,2
014
Ap
r,201
5
Au
g,2
015
De
c,2
015
Ap
r,201
6
Au
g,2
016
De
c,2
016
Ap
r,201
7
Au
g,2
017
De
c,2
017
HC
Fe
Cr
Pric
e (
In U
S $
/Po
un
d)
South Africa(USD/pound Cr)- 50%India(USD/pound Cr)-62%Kazakhstan(USD/pound Cr)-70%EU Benchmark (USD/pound)
-
10,000
20,000
30,000
40,000
50,000
60,000
70,000
80,000
90,000
FY
10
FY
11
FY
12
FY
13
FY
14
FY
15
FY
16
FY
17
FY
18
E
FY
19
E
FY
20
E
Average Realisation (INR) EBITDA/Tonne (INR)
0
100
200
300
400
500
600
700
800
900
1,000
-
100
200
300
400
500
600
700
800
900
FY
08
FY
09
FY
10
FY
11
FY
12
FY
13
FY
14
FY
15
FY
16
FY
17
FY
18
E
FY
19
E
FY
20
E
INR
in c
rs
INR
in c
rs
Long Term Loans Short Term Loans
Net Debt- RHS

Indian Metals & Ferro Alloys Ltd.
6 GWM
Ferrochrome Industry – Value Chain
Ferrochrome, an alloy of chrome ore and iron ore, is a key raw material in SS production.
Ferrochrome strengthens SS, brings lustre and offers corrosion resistance. Ferrochrome is used in
varying proportions of 10.5–30.0% in SS, depending upon final applications. On average, 25%
ferrochrome is used by weight to make 1 tonne of SS.
Ferrochrome Value Chain
Ferrochrome is an alloy of chromium and iron containing 40–70% chromium by weight.
Ferrochrome is produced by electric arc carbothermic reduction of chromite using coke and
other reductants.
Ferrochrome manufacturing is power-intensive; approximately 2.5 tonnes of chrome ore are
reduced with an estimated 600 kg of met coke and 3,800–4,000 units of power.
The demand for ferrochrome (almost 85%) is highly related to the demand for SS.
1 Tonne of Ferrochrome
(FeCr)
600 Kgs of Met Coke
~2.50 tonnes of Chrome
Ore
3600-4000
units of Power
Stainless Steel
•Accounts for 85% of global ferrochrome end use
Specialised Steel
•Accounts for 10% of global ferrochrome end use
Nickel Alloy & Foundry Products
•Accounts for 5% of global ferrochrome end use
0.25 tonne of
Ferrochrome
1 tonne of Stainless steel
Indian Metals & Ferro Alloys Ltd.
7 GWM
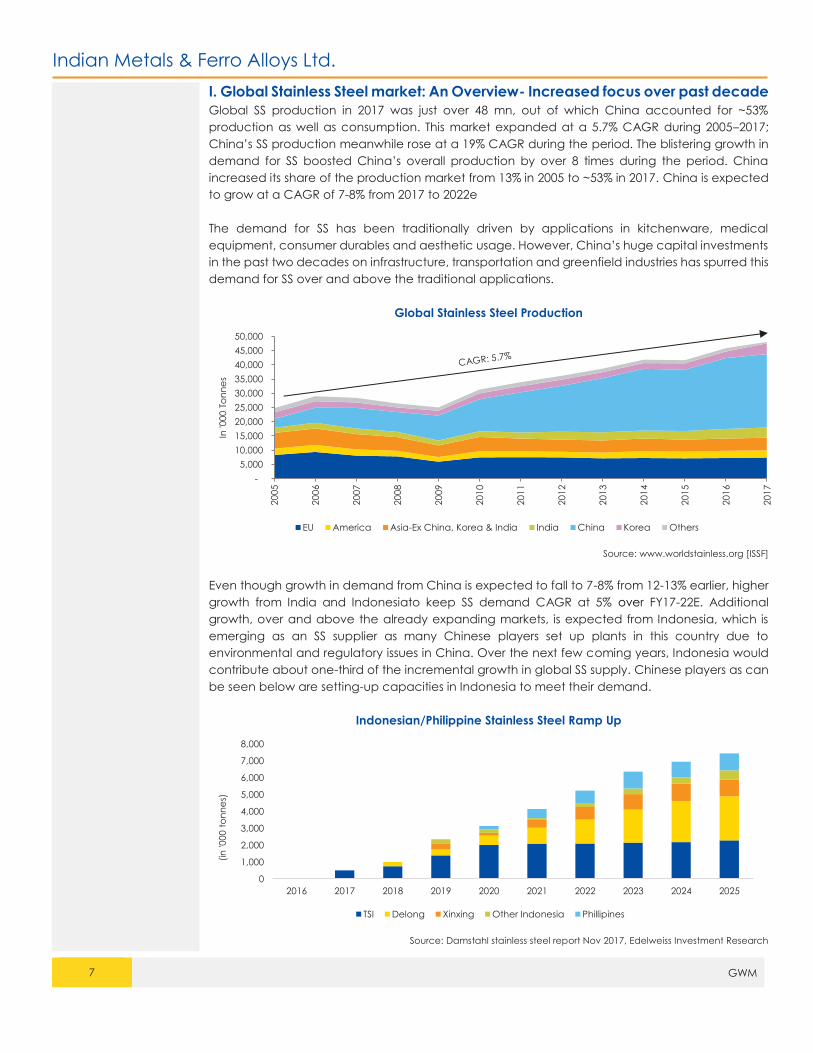
I. Global Stainless Steel market: An Overview- Increased focus over past decade
Global SS production in 2017 was just over 48 mn, out of which China accounted for ~53%
production as well as consumption. This market expanded at a 5.7% CAGR during 2005–2017;
China’s SS production meanwhile rose at a 19% CAGR during the period. The blistering growth in
demand for SS boosted China’s overall production by over 8 times during the period. China
increased its share of the production market from 13% in 2005 to ~53% in 2017. China is expected
to grow at a CAGR of 7-8% from 2017 to 2022e
The demand for SS has been traditionally driven by applications in kitchenware, medical
equipment, consumer durables and aesthetic usage. However, China’s huge capital investments
in the past two decades on infrastructure, transportation and greenfield industries has spurred this
demand for SS over and above the traditional applications.
Global Stainless Steel Production
Source: www.worldstainless.org [ISSF]
Even though growth in demand from China is expected to fall to 7-8% from 12-13% earlier, higher
growth from India and Indonesiato keep SS demand CAGR at 5% over FY17-22E. Additional
growth, over and above the already expanding markets, is expected from Indonesia, which is
emerging as an SS supplier as many Chinese players set up plants in this country due to
environmental and regulatory issues in China. Over the next few coming years, Indonesia would
contribute about one-third of the incremental growth in global SS supply. Chinese players as can
be seen below are setting-up capacities in Indonesia to meet their demand.
Indonesian/Philippine Stainless Steel Ramp Up
Source: Damstahl stainless steel report Nov 2017, Edelweiss Investment Research
-
5,000
10,000
15,000
20,000
25,000
30,000
35,000
40,000
45,000
50,000
20
05
20
06
20
07
20
08
20
09
20
10
20
11
20
12
20
13
20
14
20
15
20
16
20
17
In '0
00 T
on
ne
s
EU America Asia-Ex China, Korea & India India China Korea Others
0
1,000
2,000
3,000
4,000
5,000
6,000
7,000
8,000
2016 2017 2018 2019 2020 2021 2022 2023 2024 2025
(in
'000 t
on
ne
s)
TSI Delong Xinxing Other Indonesia Phillipines

Indian Metals & Ferro Alloys Ltd.
8 GWM
Source: Edelweiss Investment Research
Source: Bloomberg, Edelweiss Investment Research
-
1,000
2,000
3,000
4,000
5,000
6,000
7,000
8,000
1Q
CY
15
2Q
CY
15
3Q
CY
15
Q4C
Y15
1Q
CY
16
2Q
CY
16
3Q
CY
16
4Q
CY
16
1Q
CY
17
2Q
CY
17
3Q
CY
17
4Q
CY
17
In 0
00's
to
nn
e
Recent quarters' global stainless steel production
WESTERN EUROPE/AFRICA CENTRAL & EASTERN EUROPE THE AMERICAS
ASIA ( EXCLUDING CHINA ) CHINA OTHERS
0
500
1,000
1,500
2,000
2,500
3,000
3,500
4,000
4,500
Ma
y-0
9Se
p-0
9Ja
n-1
0M
ay-1
0Se
p-1
0Ja
n-1
1M
ay-1
1Se
p-1
1Ja
n-1
2M
ay-1
2Se
p-1
2Ja
n-1
3M
ay-1
3Se
p-1
3Ja
n-1
4M
ay-1
4Se
p-1
4Ja
n-1
5M
ay-1
5Se
p-1
5Ja
n-1
6M
ay-1
6Se
p-1
6Ja
n-1
7M
ay-1
7Se
p-1
7Ja
n-1
8
IN U
SD
/To
nn
e
Global Stainless Steel price (In USD/Tonne)
48,080
50,484
53,008
55,659
58,442
61,364
40,000
45,000
50,000
55,000
60,000
65,000
2017e 2018e 2019e 2020e 2021e 2022e
Pro
dn
(In
KT)
Global Stainless Steel production forecast

Indian Metals & Ferro Alloys Ltd.
9 GWM
II. Demand for Ferrochrome - China remains global demand center
Source: Merafe, Edelweiss Investment Research
As China’s SS production rose from 3.1 mn tonnes in 2005 to 25.7 mn tonnes in 2017, its consumption
of ferrocrhome simultaneously increased from 2.27 mn tonnes to ~7.30 mn tonnes, respectively.
China’s share of global ferrochrome consumption rose from ~29% in 2005 to ~61% in 2017. This
consumption is met through domestic production plus imports from countries such as South Africa,
India, Zimbabwe, etc. China imports the most quantity of ferrochrome; ~30% of global imports
during 3QCY17. The US, South Korea and the EU are other leading ferrochrome importers.
India ranks 6th worldwide in terms of ferrochrome demand due to its sizeable (~2.5mn tonne)
domestic SS production. Its annual demand for ferrochrome is ~500,000 tonnes, met by domestic
production plus imports (geography-specific). The Indian SS market is set to rise at an 8% CAGR,
which would lead to over 7-8% growth in the domestic demand for ferrochrome.
The EU’s import share is decreasing as the bloc has been building its own capacities for domestic
consumption. However, due to political and economic instability, the EU’s ferrochrome demand
decelerated at a 3.4% CARC [note: CAGR is the growth rate; CARC is the ‘de-growth’ rate] during
2007–2017. Meanwhile, China’s demand rose at over 12.7% CAGR.
Demand from the US is negligible right now, but could become significant if the Trump
administration invests more in infrastructure. The US lacks chrome ore mines and would thus
depend on the world market for SS and ferrchrome
Share of main importing countries in global HC FeCr
imports- 3QCY17.
Share of main importing countries in global HC FeCr imports
2010-2017
Source: Official customs data, Edelweiss Investment Research
-
2.0
4.0
6.0
8.0
10.0
2007 2008 2009 2010 2011 2012 2013 2014 2015 2016 2017e 2018fIn
Mn
to
nn
es
NAFTA European Union Japan South Korea Others China India
China, 30.1%
European
Union
6.1%
Japan, 8.1%South Korea,
9.9%
USA, 10.6%
India, 6.6%
Taiwan, 5.8%
Indonesia,
2.7%
Canada,
1.0%
Thailand,
0.9%Rest of the
World, 18.3%
0
5,00,000
10,00,000
15,00,000
20,00,000
25,00,000
Q12
010
Q32
010
Q12
011
Q32
011
Q12
012
Q32
012
Q12
013
Q32
013
Q12
014
Q32
014
Q12
015
Q32
015
Q12
016
Q32
016
Q12
017
Q32
017
In T
on
ne
s
China EU28 Japan South Korea USA Rest of the World
Indian Metals & Ferro Alloys Ltd.
10 GWM
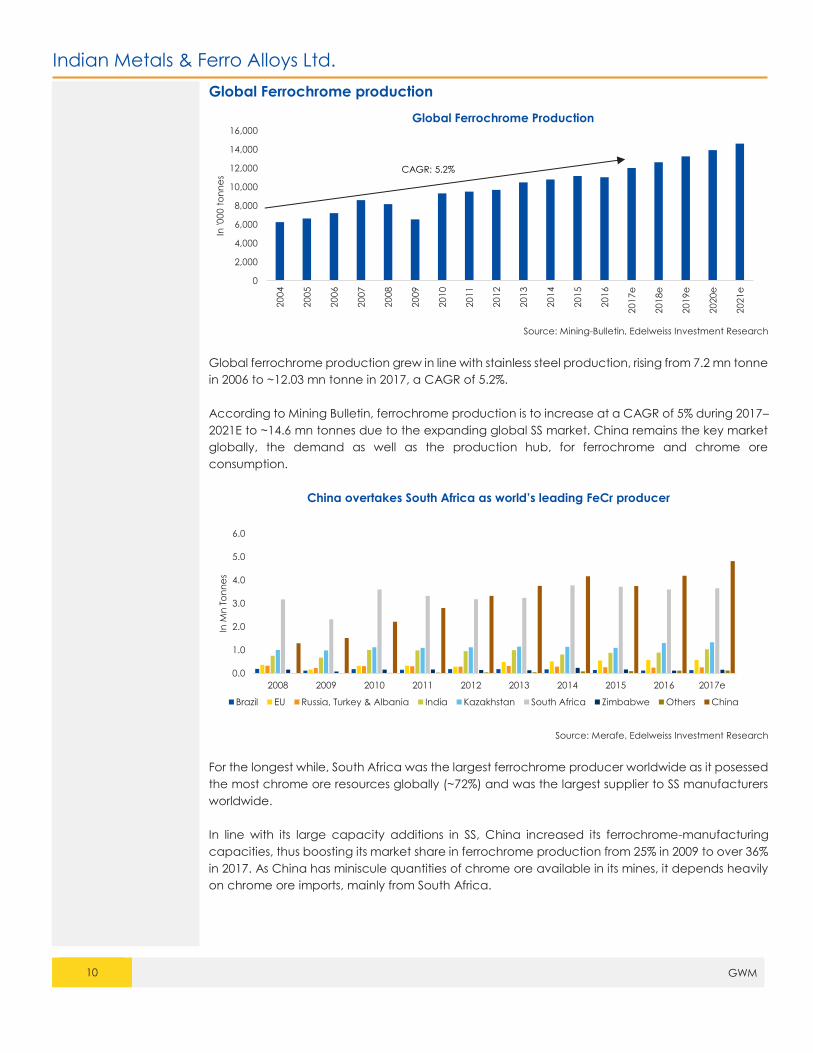
Global Ferrochrome production
Source: Mining-Bulletin, Edelweiss Investment Research
Global ferrochrome production grew in line with stainless steel production, rising from 7.2 mn tonne
in 2006 to ~12.03 mn tonne in 2017, a CAGR of 5.2%.
According to Mining Bulletin, ferrochrome production is to increase at a CAGR of 5% during 2017–
2021E to ~14.6 mn tonnes due to the expanding global SS market. China remains the key market
globally, the demand as well as the production hub, for ferrochrome and chrome ore
consumption.
China overtakes South Africa as world’s leading FeCr producer
Source: Merafe, Edelweiss Investment Research
For the longest while, South Africa was the largest ferrochrome producer worldwide as it posessed
the most chrome ore resources globally (~72%) and was the largest supplier to SS manufacturers
worldwide.
In line with its large capacity additions in SS, China increased its ferrochrome-manufacturing
capacities, thus boosting its market share in ferrochrome production from 25% in 2009 to over 36%
in 2017. As China has miniscule quantities of chrome ore available in its mines, it depends heavily
on chrome ore imports, mainly from South Africa.
0
2,000
4,000
6,000
8,000
10,000
12,000
14,000
16,000
20
04
20
05
20
06
20
07
20
08
20
09
20
10
20
11
20
12
20
13
20
14
20
15
20
16
20
17e
20
18e
20
19e
20
20e
20
21e
In '0
00 t
on
ne
s
Global Ferrochrome Production
CAGR: 5.2%
0.0
1.0
2.0
3.0
4.0
5.0
6.0
2008 2009 2010 2011 2012 2013 2014 2015 2016 2017e
In M
n T
on
ne
s
Brazil EU Russia, Turkey & Albania India Kazakhstan South Africa Zimbabwe Others China
Indian Metals & Ferro Alloys Ltd.
11 GWM
In the past decade, the ferroalloys industry of Kazakhstan vastly increased the mining and
processing of manganese and chrome ores, thus consolidating its position in the mining and
metallurgy sector. With chrome ore desposits of ~1 bn tonnes, Kazakhstan has sufficient mining
capacity for the next four or five decades. Kazakhstan also is one of the least producer of
ferrochrome globally. Its production rose from 0.9 mn tonnes in 2008 to ~1.3 mn tonnes in 2017.
India is ranked fourth in global ferrochrome production; production has been at 1.0–1.1mn tonnes
over the past 4–5 years. India consumes 15-30% of its production and exports the rest to countries
like China, South Korea and Japan. the domestic consumpion of ferrochrome has not grown for
two main reasons: a) except for the top three ferrochrome players – IMFA, Tata Steel and Balasore
Alloys – others are in financial difficulties; b) domestic SS production dependent on the Jindal
Stainless Group, which itself suffered during 2012–2015.
Zimbabwe, with the second highest worldwide reserves of chrome ore (~1.4 bn tonnes) after South
Africa (over 8.5 bn tonnes), is not able to produce and export ferrochrome chrome, largely
because of political tensions in the country. Zimbabwe has historically been a best-quality
ferrochrome producer. However, with a new president arriving, many regulatory changes are
imminent, such as verdicts on the top two bankrupt ferrochrome producers owning captive mines,
investment in physical infrastructure like railways/roads and facilitation of foreign direct investment
(FDI) in mining.
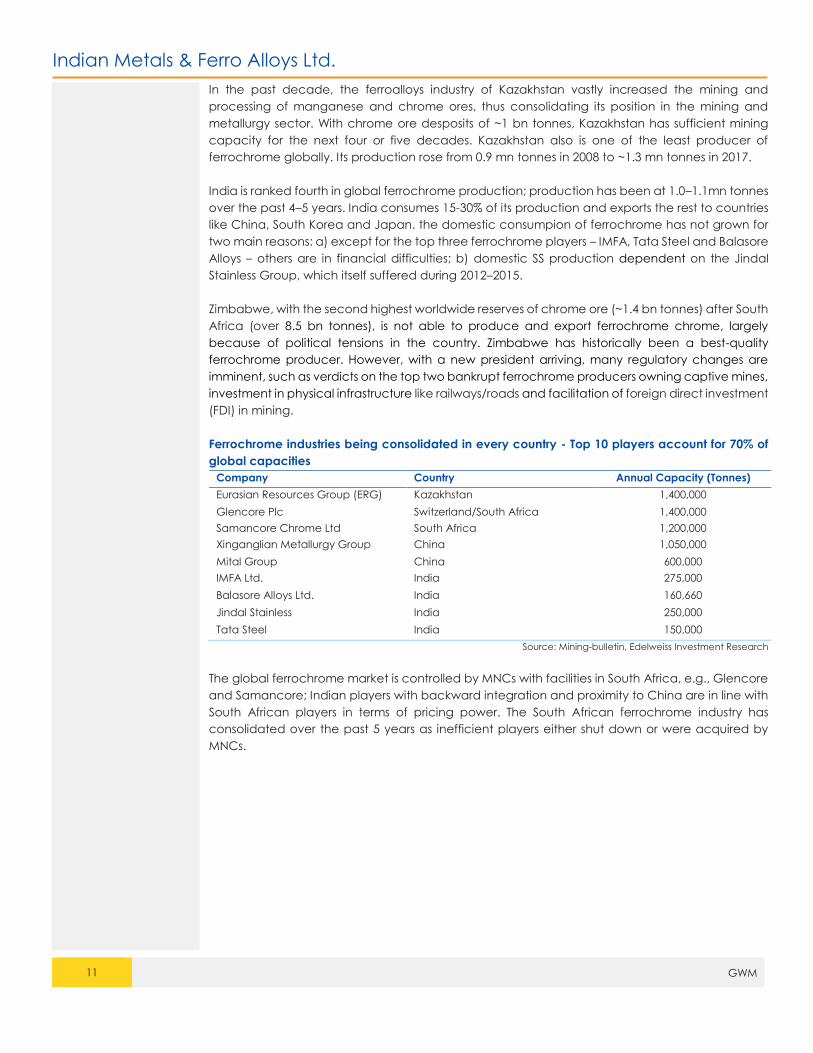
Ferrochrome industries being consolidated in every country - Top 10 players account for 70% of
global capacities
Company Country Annual Capacity (Tonnes)
Eurasian Resources Group (ERG) Kazakhstan 1,400,000
Glencore Plc Switzerland/South Africa 1,400,000
Samancore Chrome Ltd South Africa 1,200,000
Xinganglian Metallurgy Group China 1,050,000
Mital Group China 600,000
IMFA Ltd. India 275,000
Balasore Alloys Ltd. India 160,660
Jindal Stainless India 250,000
Tata Steel India 150,000
Source: Mining-bulletin, Edelweiss Investment Research
The global ferrochrome market is controlled by MNCs with facilities in South Africa, e.g., Glencore
and Samancore; Indian players with backward integration and proximity to China are in line with
South African players in terms of pricing power. The South African ferrochrome industry has
consolidated over the past 5 years as inefficient players either shut down or were acquired by
MNCs.
Indian Metals & Ferro Alloys Ltd.
12 GWM
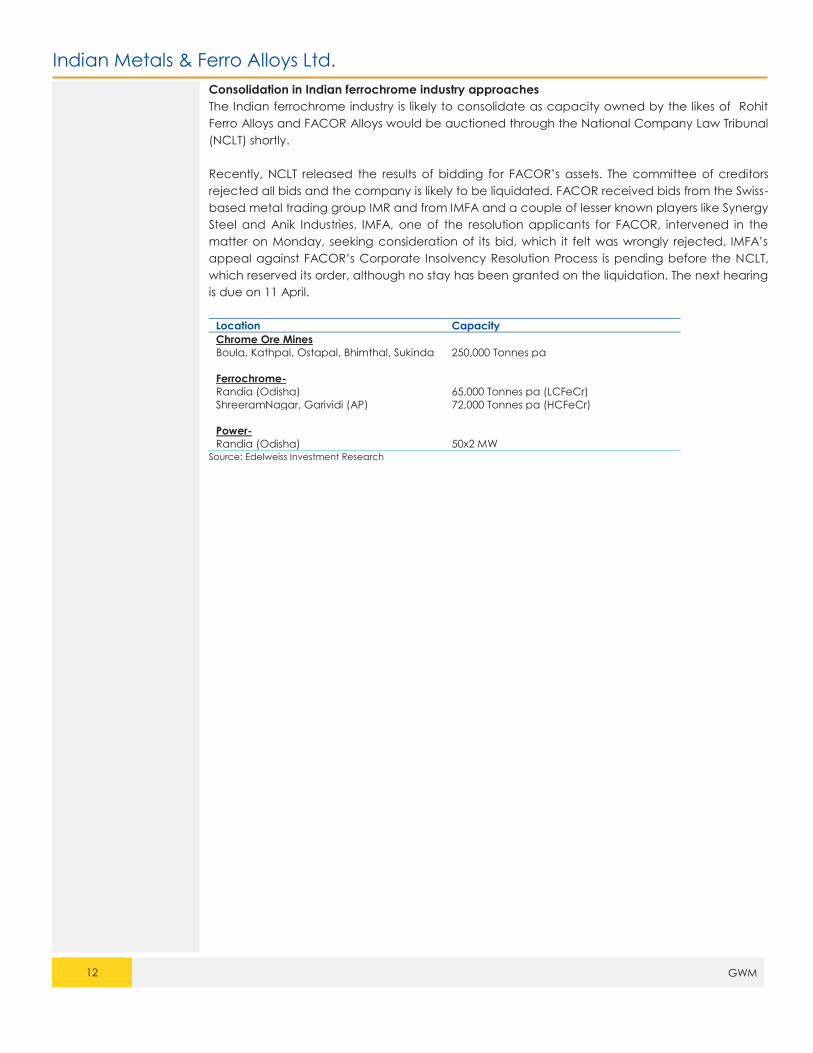
Consolidation in Indian ferrochrome industry approaches
The Indian ferrochrome industry is likely to consolidate as capacity owned by the likes of Rohit
Ferro Alloys and FACOR Alloys would be auctioned through the National Company Law Tribunal
(NCLT) shortly.
Recently, NCLT released the results of bidding for FACOR’s assets. The committee of creditors
rejected all bids and the company is likely to be liquidated. FACOR received bids from the Swiss-
based metal trading group IMR and from IMFA and a couple of lesser known players like Synergy
Steel and Anik Industries. IMFA, one of the resolution applicants for FACOR, intervened in the
matter on Monday, seeking consideration of its bid, which it felt was wrongly rejected. IMFA’s
appeal against FACOR’s Corporate Insolvency Resolution Process is pending before the NCLT,
which reserved its order, although no stay has been granted on the liquidation. The next hearing
is due on 11 April.
Location Capacity
Chrome Ore Mines
Boula, Kathpal, Ostapal, Bhimthal, Sukinda 250,000 Tonnes pa
Ferrochrome-
Randia (Odisha) 65,000 Tonnes pa (LCFeCr)
ShreeramNagar, Garividi (AP) 72,000 Tonnes pa (HCFeCr)
Power-
Randia (Odisha) 50x2 MW Source: Edelweiss Investment Research
Indian Metals & Ferro Alloys Ltd.
13 GWM
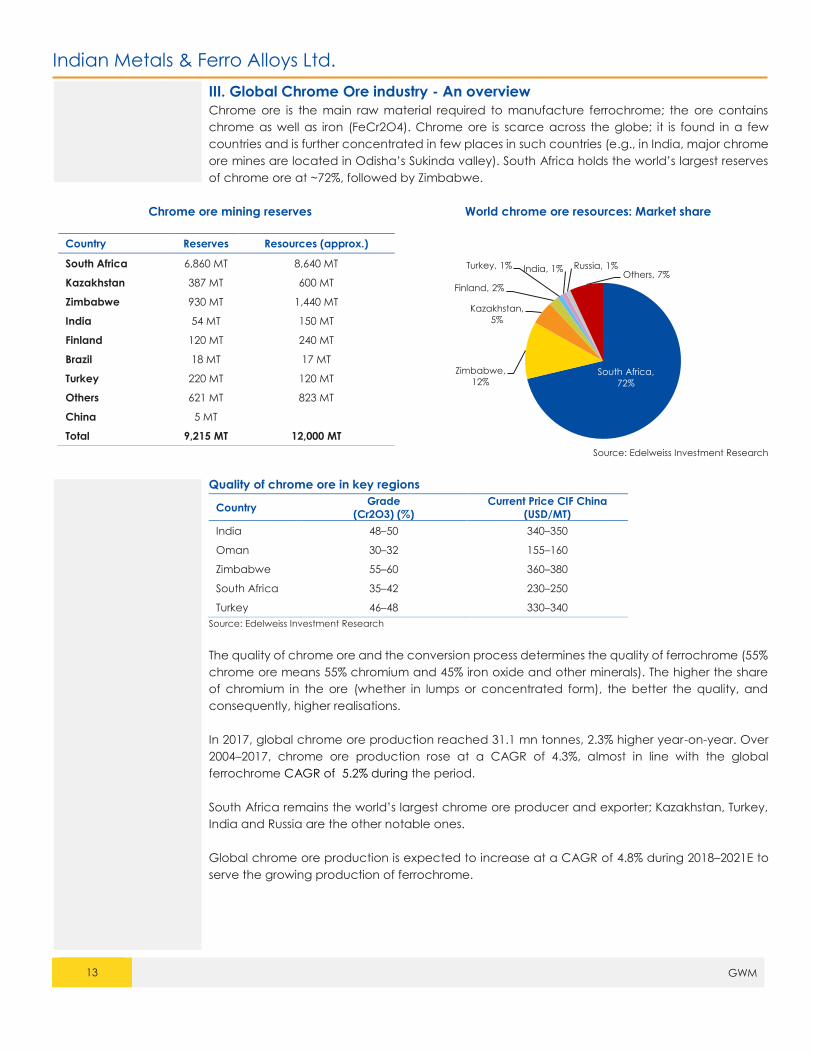
III. Global Chrome Ore industry - An overview
Chrome ore is the main raw material required to manufacture ferrochrome; the ore contains
chrome as well as iron (FeCr2O4). Chrome ore is scarce across the globe; it is found in a few
countries and is further concentrated in few places in such countries (e.g., in India, major chrome
ore mines are located in Odisha’s Sukinda valley). South Africa holds the world’s largest reserves
of chrome ore at ~72%, followed by Zimbabwe.
Chrome ore mining reserves World chrome ore resources: Market share
Country Reserves Resources (approx.)
South Africa 6,860 MT 8,640 MT
Kazakhstan 387 MT 600 MT
Zimbabwe 930 MT 1,440 MT
India 54 MT 150 MT
Finland 120 MT 240 MT
Brazil 18 MT 17 MT
Turkey 220 MT 120 MT
Others 621 MT 823 MT
China 5 MT
Total 9,215 MT 12,000 MT
Source: Edelweiss Investment Research
Quality of chrome ore in key regions
Country Grade
(Cr2O3) (%)
Current Price CIF China
(USD/MT)
India 48–50 340–350
Oman 30–32 155–160
Zimbabwe 55–60 360–380
South Africa 35–42 230–250
Turkey 46–48 330–340
Source: Edelweiss Investment Research
The quality of chrome ore and the conversion process determines the quality of ferrochrome (55%
chrome ore means 55% chromium and 45% iron oxide and other minerals). The higher the share
of chromium in the ore (whether in lumps or concentrated form), the better the quality, and
consequently, higher realisations.
In 2017, global chrome ore production reached 31.1 mn tonnes, 2.3% higher year-on-year. Over
2004–2017, chrome ore production rose at a CAGR of 4.3%, almost in line with the global
ferrochrome CAGR of 5.2% during the period.
South Africa remains the world’s largest chrome ore producer and exporter; Kazakhstan, Turkey,
India and Russia are the other notable ones.
Global chrome ore production is expected to increase at a CAGR of 4.8% during 2018–2021E to
serve the growing production of ferrochrome.
South Africa,
72%
Zimbabwe,
12%
Kazakhstan,
5%
Finland, 2%
Turkey, 1% India, 1% Russia, 1%Others, 7%
Indian Metals & Ferro Alloys Ltd.
14 GWM
Source: Mining-bulletin, Edelweiss Investment Research
Chrome ore imports market share, Q3CY2017 China’s chrome ore and concentrate imports by region
Source: Official customs data, Edelweiss Investment Research
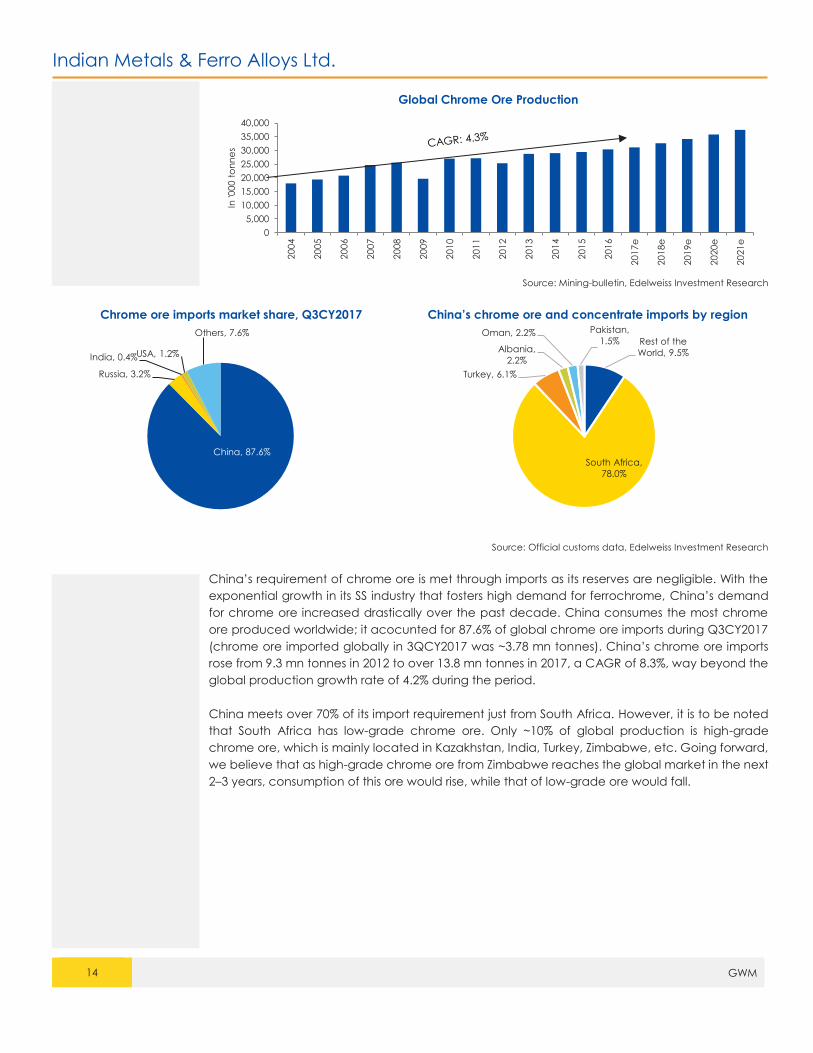
China’s requirement of chrome ore is met through imports as its reserves are negligible. With the
exponential growth in its SS industry that fosters high demand for ferrochrome, China’s demand
for chrome ore increased drastically over the past decade. China consumes the most chrome
ore produced worldwide; it acocunted for 87.6% of global chrome ore imports during Q3CY2017
(chrome ore imported globally in 3QCY2017 was ~3.78 mn tonnes). China’s chrome ore imports
rose from 9.3 mn tonnes in 2012 to over 13.8 mn tonnes in 2017, a CAGR of 8.3%, way beyond the
global production growth rate of 4.2% during the period.
China meets over 70% of its import requirement just from South Africa. However, it is to be noted
that South Africa has low-grade chrome ore. Only ~10% of global production is high-grade
chrome ore, which is mainly located in Kazakhstan, India, Turkey, Zimbabwe, etc. Going forward,
we believe that as high-grade chrome ore from Zimbabwe reaches the global market in the next
2–3 years, consumption of this ore would rise, while that of low-grade ore would fall.
0
5,000
10,000
15,000
20,000
25,000
30,000
35,000
40,000
20
04
20
05
20
06
20
07
20
08
20
09
20
10
20
11
20
12
20
13
20
14
20
15
20
16
20
17e
20
18e
20
19e
20
20e
20
21e
In '0
00 t
on
ne
s
Global Chrome Ore Production
China, 87.6%
Russia, 3.2%
India, 0.4%USA, 1.2%
Others, 7.6%Rest of the
World, 9.5%
South Africa,
78.0%
Turkey, 6.1%
Albania,
2.2%
Oman, 2.2% Pakistan,
1.5%

Indian Metals & Ferro Alloys Ltd.
15 GWM
IV. Supply demand mismatches and changes in currency rates cause price
fluctuations
Source: Mining-bulletin, Edelweiss Investment Research
China’s port inventory of chrome ore decreased from an average 2.5–3.0 mn tonnes per month
in 2013-14 to below 1 mn tonne in Q3 and Q42016 due to the consistently growing consumption
of chrome ore and supply issues in South Africa. Between January and November 2016, ore prices
jumped from USD90/tonne to ~USD400/tonne, nearing all-time high prices. With the resolution of
several supply issues in South Africa after Q2CY2017, chrome ore prices dropped to ~USD230–
240/tonne and have been hovering at that level since.
Source: Bloomberg, Edelweiss Investment Research
After years of depreciation, the rand started showing signs of appreciation recently (it
appreciated by ~40% between January 2016 and March 2018). One of the main reasons for this
strengthening was the election of Cyril Ramaphosa as the new president of South Africa. The jump
made the rand one of the fastest growing currencies in all emerging markets.
0
50
100
150
200
250
300
350
400
450
0
5,00,000
10,00,000
15,00,000
20,00,000
25,00,000
30,00,000
35,00,000
40,00,000
Ja
n-1
1
Ap
r-11
Ju
l-11
Oc
t-11
Ja
n-1
2
Ap
r-12
Ju
l-12
Oc
t-12
Ja
n-1
3
Ap
r-13
Ju
l-13
Oc
t-13
Ja
n-1
4
Ap
r-14
Ju
l-14
Oc
t-14
Ja
n-1
5
Ap
r-15
Ju
l-15
Oc
t-15
Ja
n-1
6
Ap
r-16
Ju
l-16
Oc
t-16
Ja
n-1
7
Ap
r-17
Ju
l-17
Oc
t-17
Ja
n-1
8
Shortage of port inventory led to chrome ore price rise
Chinese Port Inventory (In Tonnes) China Cr Ore price (In US$/Tonne)- RHS
0
20
40
60
80
100
120
140
160
01
-01
-20
08
01
-05
-20
08
01
-09
-20
08
01
-01
-20
09
01
-05
-20
09
01
-09
-20
09
01
-01
-20
10
01
-05
-20
10
01
-09
-20
10
01
-01
-20
11
01
-05
-20
11
01
-09
-20
11
01
-01
-20
12
01
-05
-20
12
01
-09
-20
12
01
-01
-20
13
01
-05
-20
13
01
-09
-20
13
01
-01
-20
14
01
-05
-20
14
01
-09
-20
14
01
-01
-20
15
01
-05
-20
15
01
-09
-20
15
01
-01
-20
16
01
-05
-20
16
01
-09
-20
16
01
-01
-20
17
01
-05
-20
17
01
-09
-20
17
01
-01
-20
18
Currency movements: China only country whose currency appreciated;
India, South Africa currency depreciated
Dollar Index INR-USD ZAR-USD CNY-USD
Indian Metals & Ferro Alloys Ltd.
16 GWM
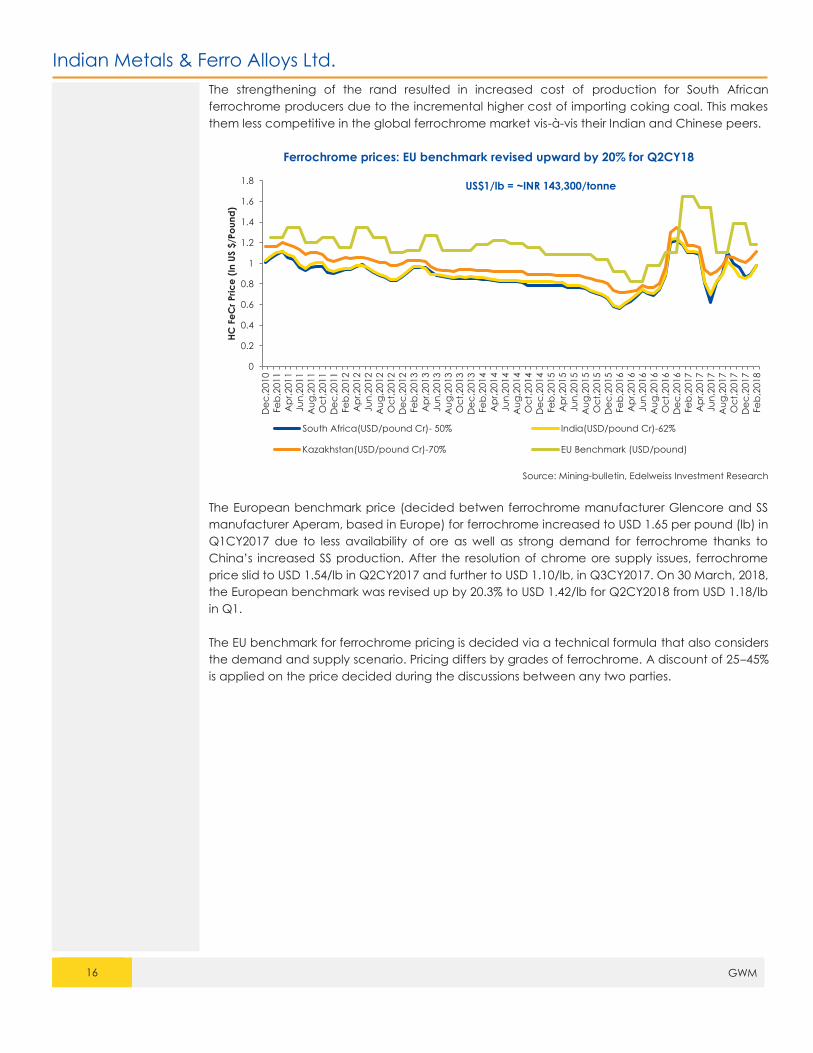
The strengthening of the rand resulted in increased cost of production for South African
ferrochrome producers due to the incremental higher cost of importing coking coal. This makes
them less competitive in the global ferrochrome market vis-à-vis their Indian and Chinese peers.
Ferrochrome prices: EU benchmark revised upward by 20% for Q2CY18
Source: Mining-bulletin, Edelweiss Investment Research
The European benchmark price (decided betwen ferrochrome manufacturer Glencore and SS
manufacturer Aperam, based in Europe) for ferrochrome increased to USD 1.65 per pound (lb) in
Q1CY2017 due to less availability of ore as well as strong demand for ferrochrome thanks to
China’s increased SS production. After the resolution of chrome ore supply issues, ferrochrome
price slid to USD 1.54/lb in Q2CY2017 and further to USD 1.10/lb, in Q3CY2017. On 30 March, 2018,
the European benchmark was revised up by 20.3% to USD 1.42/lb for Q2CY2018 from USD 1.18/lb
in Q1.
The EU benchmark for ferrochrome pricing is decided via a technical formula that also considers
the demand and supply scenario. Pricing differs by grades of ferrochrome. A discount of 25–45%
is applied on the price decided during the discussions between any two parties.
0
0.2
0.4
0.6
0.8
1
1.2
1.4
1.6
1.8
De
c,2
010
Fe
b,2
011
Ap
r,201
1
Ju
n,2
011
Au
g,2
011
Oc
t,2
011
De
c,2
011
Fe
b,2
012
Ap
r,201
2
Ju
n,2
012
Au
g,2
012
Oc
t,2
012
De
c,2
012
Fe
b,2
013
Ap
r,201
3
Ju
n,2
013
Au
g,2
013
Oc
t,2
013
De
c,2
013
Fe
b,2
014
Ap
r,201
4
Ju
n,2
014
Au
g,2
014
Oc
t,2
014
De
c,2
014
Fe
b,2
015
Ap
r,201
5
Ju
n,2
015
Au
g,2
015
Oc
t,2
015
De
c,2
015
Fe
b,2
016
Ap
r,201
6
Ju
n,2
016
Au
g,2
016
Oc
t,2
016
De
c,2
016
Fe
b,2
017
Ap
r,201
7
Ju
n,2
017
Au
g,2
017
Oc
t,2
017
De
c,2
017
Fe
b,2
018
HC
Fe
Cr
Pri
ce
(In
US $
/Po
un
d)
South Africa(USD/pound Cr)- 50% India(USD/pound Cr)-62%
Kazakhstan(USD/pound Cr)-70% EU Benchmark (USD/pound)
US$1/lb = ~INR 143,300/tonne

Indian Metals & Ferro Alloys Ltd.
17 GWM
V. Indian Ferrochrome & Chrome Ore Industry - Niche Businesses with Few
Players
The Indian ferrochrome industry is a niche business; annual production was ~1.1 mn tonne as of
2017, constituting 9% of the 12.03 mn-tonne global production. Domestic ferrochrome players can
be broadly classified as follows:
● Integrated players with captive chrome ore mines
● Producers who either buy chrome ore from the spot market or enter into conversion
agreement with merchant miners (non-integrated)
● Merchant miners
● SS manufacturers who produce ferrochrome for captive consumption
Integrated players with
captive chrome ore mines Non-integrated players Merchant miners SS producers
IMFA Vasavi Tata Steel Jindal Stainless
Balasore Alloys Nava Bharat Ventures OMC
FACOR Rohit Ferro-Tech BC Mohanty & sons
Visa Steel IDCOL
Source: Edelweiss Investment Research
Ferrochrome production in India has remained near stagnant at 1.0–1.1 mn tonnes for several
years due to multiple reasons. These include stressed balance sheets of several ferrochrome
producers, lack of mining licenses with all players and the smaller size of the Indian SS industry.
Apart from IMFA and Balasore Alloys in the integrated players and Visa Steel from the non-
integrated set, other players have consistently fallen back in increasing production over the past
decade.
India's FeCr production India consumes 15–30% of FeCr produced, exports rest
Source: Mining-bulletin, Edelweiss Investment Research
0
200
400
600
800
1000
1200
2009 2010 2011 2012 2013 2014 2015 2016 2017
In 0
00's
To
nn
es
Domestic
Consumption
25%
Exports
75%
Indian Metals & Ferro Alloys Ltd.
18 GWM
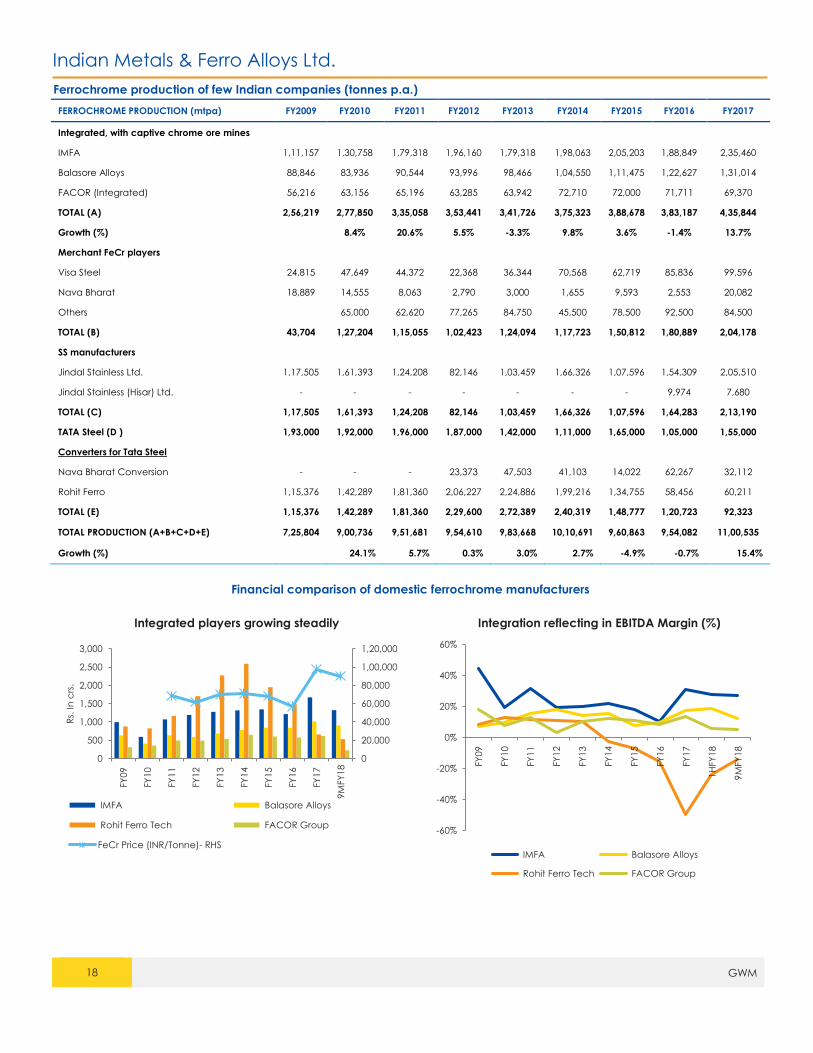
Ferrochrome production of few Indian companies (tonnes p.a.)
FERROCHROME PRODUCTION (mtpa) FY2009 FY2010 FY2011 FY2012 FY2013 FY2014 FY2015 FY2016 FY2017
Integrated, with captive chrome ore mines
IMFA 1,11,157 1,30,758 1,79,318 1,96,160 1,79,318 1,98,063 2,05,203 1,88,849 2,35,460
Balasore Alloys 88,846 83,936 90,544 93,996 98,466 1,04,550 1,11,475 1,22,627 1,31,014
FACOR (Integrated) 56,216 63,156 65,196 63,285 63,942 72,710 72,000 71,711 69,370
TOTAL (A) 2,56,219 2,77,850 3,35,058 3,53,441 3,41,726 3,75,323 3,88,678 3,83,187 4,35,844
Growth (%) 8.4% 20.6% 5.5% -3.3% 9.8% 3.6% -1.4% 13.7%
Merchant FeCr players
Visa Steel 24,815 47,649 44,372 22,368 36,344 70,568 62,719 85,836 99,596
Nava Bharat 18,889 14,555 8,063 2,790 3,000 1,655 9,593 2,553 20,082
Others 65,000 62,620 77,265 84,750 45,500 78,500 92,500 84,500
TOTAL (B) 43,704 1,27,204 1,15,055 1,02,423 1,24,094 1,17,723 1,50,812 1,80,889 2,04,178
SS manufacturers
Jindal Stainless Ltd. 1,17,505 1,61,393 1,24,208 82,146 1,03,459 1,66,326 1,07,596 1,54,309 2,05,510
Jindal Stainless (Hisar) Ltd. - - - - - - - 9,974 7,680
TOTAL (C) 1,17,505 1,61,393 1,24,208 82,146 1,03,459 1,66,326 1,07,596 1,64,283 2,13,190
TATA Steel (D ) 1,93,000 1,92,000 1,96,000 1,87,000 1,42,000 1,11,000 1,65,000 1,05,000 1,55,000
Converters for Tata Steel
Nava Bharat Conversion - - - 23,373 47,503 41,103 14,022 62,267 32,112
Rohit Ferro 1,15,376 1,42,289 1,81,360 2,06,227 2,24,886 1,99,216 1,34,755 58,456 60,211
TOTAL (E) 1,15,376 1,42,289 1,81,360 2,29,600 2,72,389 2,40,319 1,48,777 1,20,723 92,323
TOTAL PRODUCTION (A+B+C+D+E) 7,25,804 9,00,736 9,51,681 9,54,610 9,83,668 10,10,691 9,60,863 9,54,082 11,00,535
Growth (%) 24.1% 5.7% 0.3% 3.0% 2.7% -4.9% -0.7% 15.4%
Financial comparison of domestic ferrochrome manufacturers
Integrated players growing steadily Integration reflecting in EBITDA Margin (%)
0
20,000
40,000
60,000
80,000
1,00,000
1,20,000
0
500
1,000
1,500
2,000
2,500
3,000
FY
09
FY
10
FY
11
FY
12
FY
13
FY
14
FY
15
FY
16
FY
17
9M
FY
18
Rs.
In
crs
.
IMFA Balasore Alloys
Rohit Ferro Tech FACOR Group
FeCr Price (INR/Tonne)- RHS
-60%
-40%
-20%
0%
20%
40%
60%
FY
09
FY
10
FY
11
FY
12
FY
13
FY
14
FY
15
FY
16
FY
17
1H
FY
18
9M
FY
18
IMFA Balasore Alloys
Rohit Ferro Tech FACOR Group
Indian Metals & Ferro Alloys Ltd.
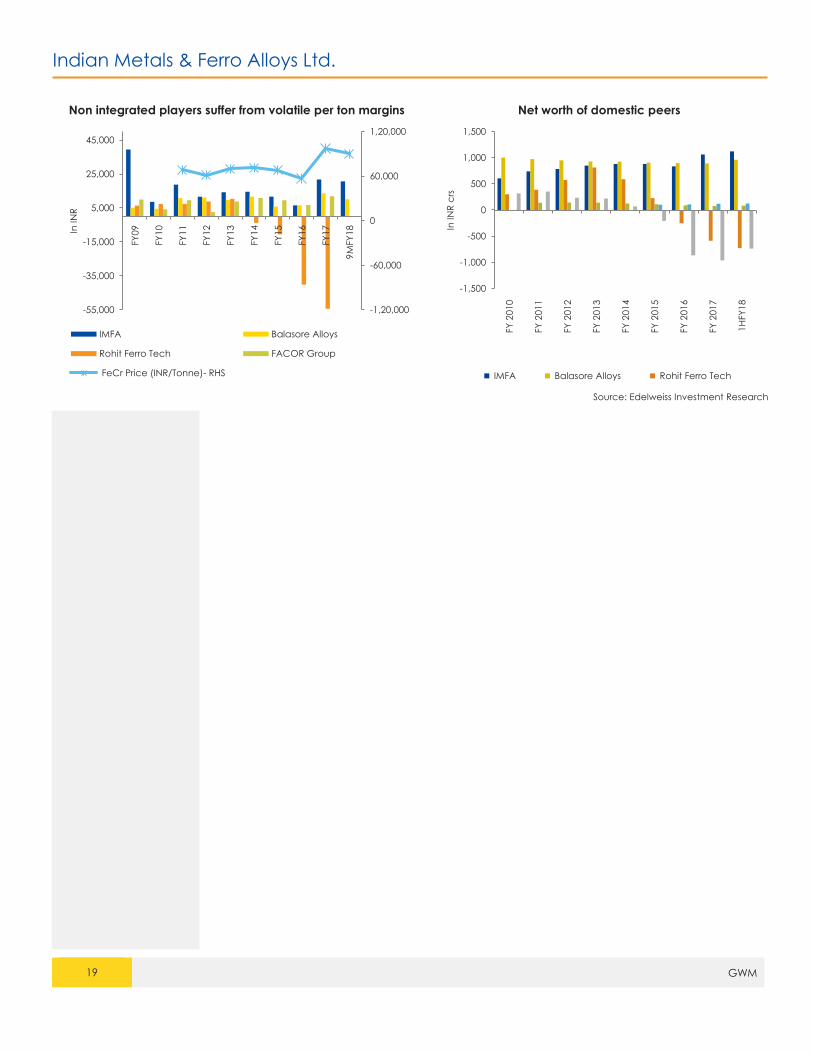
19 GWM
Non integrated players suffer from volatile per ton margins Net worth of domestic peers
Source: Edelweiss Investment Research
-1,20,000
-60,000
0
60,000
1,20,000
-55,000
-35,000
-15,000
5,000
25,000
45,000 F
Y09
FY
10
FY
11
FY
12
FY
13
FY
14
FY
15
FY
16
FY
17
9M
FY
18In IN
R
IMFA Balasore Alloys
Rohit Ferro Tech FACOR Group
FeCr Price (INR/Tonne)- RHS
-1,500
-1,000
-500
0
500
1,000
1,500
FY
2010
FY
2011
FY
2012
FY
2013
FY
2014
FY
2015
FY
2016
FY
2017
1
HFY
18
In IN
R c
rs
IMFA Balasore Alloys Rohit Ferro Tech
Indian Metals & Ferro Alloys Ltd.
20 GWM
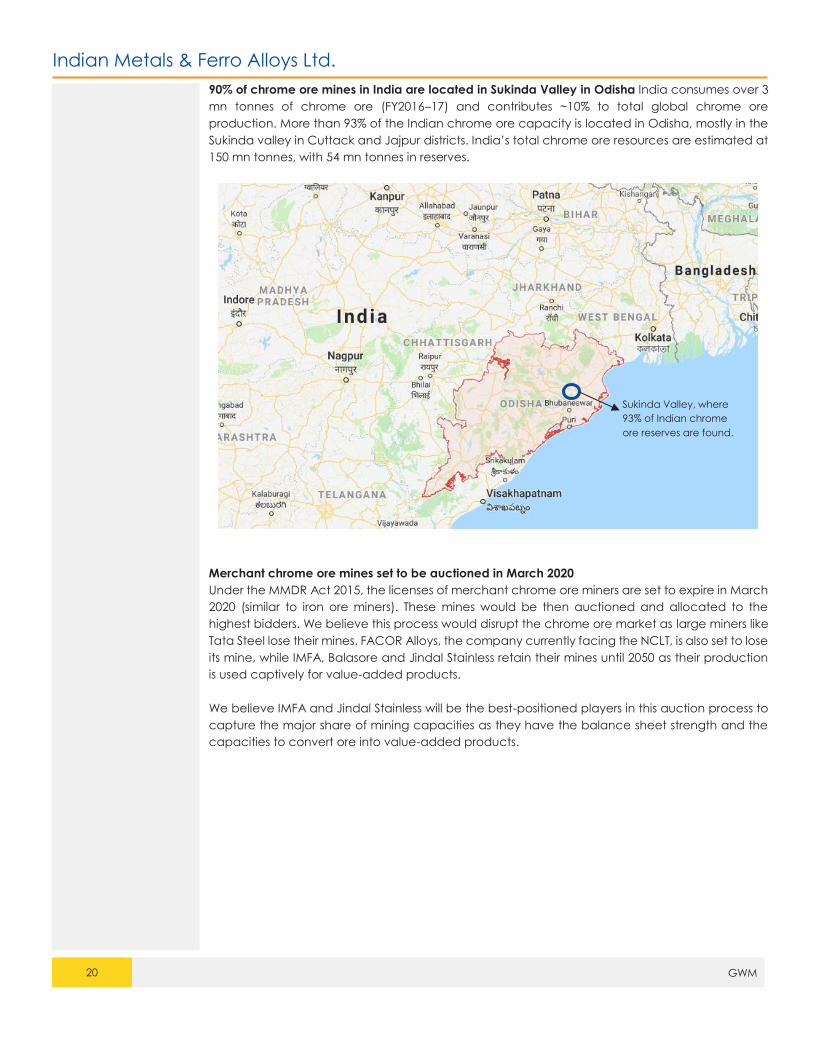
90% of chrome ore mines in India are located in Sukinda Valley in Odisha India consumes over 3
mn tonnes of chrome ore (FY2016–17) and contributes ~10% to total global chrome ore
production. More than 93% of the Indian chrome ore capacity is located in Odisha, mostly in the
Sukinda valley in Cuttack and Jajpur districts. India’s total chrome ore resources are estimated at
150 mn tonnes, with 54 mn tonnes in reserves.
Merchant chrome ore mines set to be auctioned in March 2020
Under the MMDR Act 2015, the licenses of merchant chrome ore miners are set to expire in March
2020 (similar to iron ore miners). These mines would be then auctioned and allocated to the
highest bidders. We believe this process would disrupt the chrome ore market as large miners like
Tata Steel lose their mines. FACOR Alloys, the company currently facing the NCLT, is also set to lose
its mine, while IMFA, Balasore and Jindal Stainless retain their mines until 2050 as their production
is used captively for value-added products.
We believe IMFA and Jindal Stainless will be the best-positioned players in this auction process to
capture the major share of mining capacities as they have the balance sheet strength and the
capacities to convert ore into value-added products.
Sukinda Valley, where
93% of Indian chrome
ore reserves are found.

Indian Metals & Ferro Alloys Ltd.
21 GWM
VI. Indian players have to be cost competitive versus South African and Chinese
players
Source: Edelweiss Investment Research
To manufacture 1 tonne of ferrochrome requires ~2.5 tonnes of chrome ore, 4,000 units of power
and 600 kg of coke along with a few other reductants and manpower.
In cost terms, players with captive chrome ore mines will always have the upper hand over players
buying ore from the market. Currently, IMFA’s chrome ore mining cost, including royalties/taxes, is
INR 5,500/tonne; the current price of 1 tonne chrome ore quoted by OMC is INR 13,000/tonne.
Similarly, the current cost for Chinese manufacturers is USD 220–240/tonne, increasing their cost of
chrome ore beyond that of Indian and South African integrated players.
Indian players, particularly IMFA, are among the world’s most cost-efficient producers of
ferrochrome. This is due to factors such as access to captive chrome ore mines and availability of
captive power. Thus, when ferrochrome prices fell to INR 62,000–65,000/tonne, the majority of
global players struggled to break even; but IMFA managed to post an EBITDA of INR 6,500/tonne.
Also, at least one-third of Chinese ferrochrome manufacturers are marginal players; they start
operations when ferrochrome prices move above INR 85,000/tonne.
Indian integrated players become more competitive vis-à-vis South African players
Chrome ore mining in South Africa is growing costlier with factors such as expensive labour and
the ever-increasing power cost. In South Africa, industries cannot set up captive power plants and
have purchase it from a single utility – Eskom – which virtually monopolises the power sector.
Eskom Average Tariff vs. Inflation (CPI)
Eskom drastically hike power costs after gaining a
monopoly during the power crisis in 2008. Power tariffs
rose by 356% during 2007–2017. Even in 2017, Eskom
recommended a further 19.9% per cent hike in tariff for
FY2018–2019, against which the National Energy
Regulator of SA (NERSA) approved an increase of only
5.23%. There are several news reports suggesting that
Eskom will further increase power cost in the coming
years
The current rate of power in South Africa is INR 4.7/unit
versus INR 3.5/unit for Indian players with captive power
plants and INR 5.7/unit for players dependent on the
grid.
Source: Eskom, Edelweiss Investment Research
13,200
38,250
12,500
18,000
18,800
19,050
5,000
5,500
5,150 9,750
9,555
9,945 8,000
8,000
8,000
-
20,000
40,000
60,000
80,000
1,00,000
IMFA CHINA SOUTH AFRICA
INR
/ To
nn
e
Cost Comparison between global peers
Chrome ore Power Reductants Coke Other cost
54,64553,950
80,105

Indian Metals & Ferro Alloys Ltd.
22 GWM
VII. Indian Metals and Ferro Alloys Ltd. (IMFA Ltd.): Company profile
A) Business description: Largest, only fully integrated player in India
Source: Company, Edelweiss Investment Research
Established in 1961, IMFA Ltd. is the largest integrated ferrochrome producer in india, with an
installed capacity of 275,000 tonnes per annum. It has three captive chrome ore mines (capacity
of 600,000 tonnes) at Sukinda, Mahagiri and Nuasahi; it also has a captive power plant (258 MW)
at its Choudwar manufacturing facility in Odisha.
As of FY2017, the company exported over 87% of its production to countries like China, Taiwan,
South Korea, Japan, etc. and sold the remaining domestically to customers like Jindal Stainless
Steel.
IMFA has three mines, of which Sukinda and Mahagiri are fully operational, while the Nuasahi mine
awaits environmental clearance. The Sukinda mines are completely opencast mines, the Mahagiri
mines are partially opencast, and the Nuasahi mines would be operated as completely
undergound mines. IMFA is now focusing on a capex of approximately INR 200 cr, specifically for
more underground mining, as it needs to ramp up production for future expansion.
SukindaMines
MahagiriMines
NuasahiMines
Choudwar, Odisha
Therubali, Odisha
FeCr
Domestic Sale 15%
Exports Sale 85%
80 km
500 km
100 km
520 km85 km
510 km

Indian Metals & Ferro Alloys Ltd.
23 GWM
B) Volume analysis: SS production demand drives growth
With the growin demand for SS, IMFA was able to raise its production of ferrochrome from 1.1 lakh
tonnes in FY2009 to 2.3 lakh tonnes in FY2017, a CAGR of 10%. We expect production to touch
250,000 tonnes in FY2020E, backed by the demand from its key customers in China and Taiwan.
Source: Edelweiss Investment Research
The majority of its production (~87% in FY2017) is exported, especially to regions like China and
Taiwan. IMFA has long-term contracts with POSCO (China), YUSCO (Taiwan) and Nisshin (Japan).
It supplied ~168,000 tonnes of ferrochrome to these three entities in FY2017 out of total sales of
233,698 tonnes.
Of IMFA’s total sales, 65–70% is in long-term volume contracts with the above mentioned clients.
Under these contracts, volumes are precided, while prices are re-negotiated every quarter. The
company sells the remaining 30–35% of the production via medium-term contracts or on spot basis
in Indian and international markets. IMFA would continue to export 80–90% of its production as
demand from the Indian market is yet insufficient to alter market dynamics.
C) Realisations remain strong due to healthy demand
Recently, the peak price of ferrochrome was upward of INR 110,000/tonne, mainly due to
increased demand for SS in China, coupled with lower inventory there, and a shortage of supply
from various regions. IMFA had an average realisation of INR 71,560/tonne in FY2017, its highest in
the past 7–8 years. For 9MFY2018, the company sold 173,405 tonnes at an average realisation of
INR 76,257/tonne.
Currently, prices of ferrochrome, realisation ex-India, are at INR 80,000–85,000/tonne, maintaining
a steady momentum. As on 01 April, 2018, Europenan benchmark prices were revised up by 20.3%
to USD 1.42/lb, implying a strong demand momentum. We believe that the steady demand for SS
would maintain the buoyancy in ferrochrome prices for another 2–3 years. For IMFA, we assume
a steady average realisation of INR 80,000/tonne for FY2019–2020E.
-
20.0
40.0
60.0
80.0
100.0
-
50,000
1,00,000
1,50,000
2,00,000
2,50,000
3,00,000
FY09 FY10 FY11 FY12 FY13 FY14 FY15 FY16 FY17 FY18E FY19E FY20E
Buoyancy in demand spurs higher production
Installed Capacity (In Tonnes) Ferro Chrome production (In Tonnes)
Capacity Utilisation (In %)- RHS

Indian Metals & Ferro Alloys Ltd.
24 GWM
Source: Edelweiss Investment Research
D) Backward integration with mines and power bring higher per unit EBITDA
With its access to chrome ore mines, IMFA’s cost of chrome ore procurement is ~INR 5,500/tonne
versus INR 12,000/tonne for any other company purchasing chrome ore from the open market.
This accords IMFA a huge advantage over competitors.
IMFA also gains a power cost advantage with its captive power plant of 258MW. While the cost
of power purchased from the grid is INR 5.5–6.0/unit, the cost for a company with a captive power
plant and coal mine should ideally be INR 3.8-4/unit. The company lost its coal mines during the
mine deallocation in 2014. Afterwards, IMFA obtained a coal linkage of 1 mn tonnes against its
requirement of 1.5mn tonnes, thus raising its average power cost to INR 4.0/unit. In FY2018, the
company’s power cost rose further to INR 4.5/unit as it had to purchase power from the grid at a
spot price of INR 6.2/unit due to a shortage of coal linkages caused by coal supply issues in Odisha.
FY07 FY08 FY09 FY10 FY11 FY12 FY13 FY14 FY15 FY16 FY17
Electricity generated (In Mn Units) 747 715 625 726 774 777 792 910 914 858 1,037
Electricity sold (In Mn Units) 187.4 47.0 3.4 26.1 54.8 18.0 - -
Source: Company, Edelweiss Investment Research
Source: Edelweiss Investment Research
The rise in prices of coking coal from a low of USD 140/tonne to the recent USD 397/tonne has
raised the company’s cost of operations as it requires 600 kg of coking coal per ton of ferrochrome
produced. This industry-wide cost increase has spiked the cost of production, which has been
passed on to customers. Any reduction in coking coal price would have a corresponding effect
on ferrochrome finished products.
-
10,000
20,000
30,000
40,000
50,000
60,000
70,000
80,000
90,000
1,00,000
0
50,000
1,00,000
1,50,000
2,00,000
2,50,000
3,00,000
FY09 FY10 FY11 FY12 FY13 FY14 FY15 FY16 FY17 FY18E FY19E FY20E
Sales volume vs average realisation
Sales Volume (In Tonnes) Average Realisation (In Rs.)- RHS
0
100
200
300
400
500
600
Ju
n-0
6
Oc
t-06
Fe
b-0
7
Ju
n-0
7
Oc
t-07
Fe
b-0
8
Ju
n-0
8
Oc
t-08
Fe
b-0
9
Ju
n-0
9
Oc
t-09
Fe
b-1
0
Ju
n-1
0
Oc
t-10
Fe
b-1
1
Ju
n-1
1
Oc
t-11
Fe
b-1
2
Ju
n-1
2
Oc
t-12
Fe
b-1
3
Ju
n-1
3
Oc
t-13
Fe
b-1
4
Ju
n-1
4
Oc
t-14
Fe
b-1
5
Ju
n-1
5
Oc
t-15
Fe
b-1
6
Ju
n-1
6
Oc
t-16
Fe
b-1
7
Ju
n-1
7
Oc
t-17
Fe
b-1
8
IN U
SD
/To
nn
e
Coking coal prices still holding high

Indian Metals & Ferro Alloys Ltd.
25 GWM
Significant increase in recent quarters' EBITDA/tonne Improving Realisation and EBITDA/Tonne in last 2 years
Source: Edelweiss Investment Research
-
20,000
40,000
60,000
80,000
1,00,000
1,20,000
(10,000)
-
10,000
20,000
30,000
40,000
50,000
60,0001Q
14
2Q
14
3Q
14
4Q
14
1Q
15
2Q
15
3Q
15
4Q
15
1Q
16
2Q
16
3Q
16
4Q
16
1Q
17
2Q
17
3Q
17
4Q
17
1Q
18
2Q
18
3Q
18
EBITDA/Ton (INR) FeCr Price (INR/Tonne)- RHS
0
20,000
40,000
60,000
80,000
1,00,000
1,20,000
-
5,000
10,000
15,000
20,000
25,000
30,000
35,000
40,000
45,000
FY
09
FY
10
FY
11
FY
12
FY
13
FY
14
FY
15
FY
16
FY
17
FY
18
E
FY
19
E
FY
20
E
EBITDA/Tonne (INR) FeCr Price (INR/Tonne)- RHS
Indian Metals & Ferro Alloys Ltd.
26 GWM
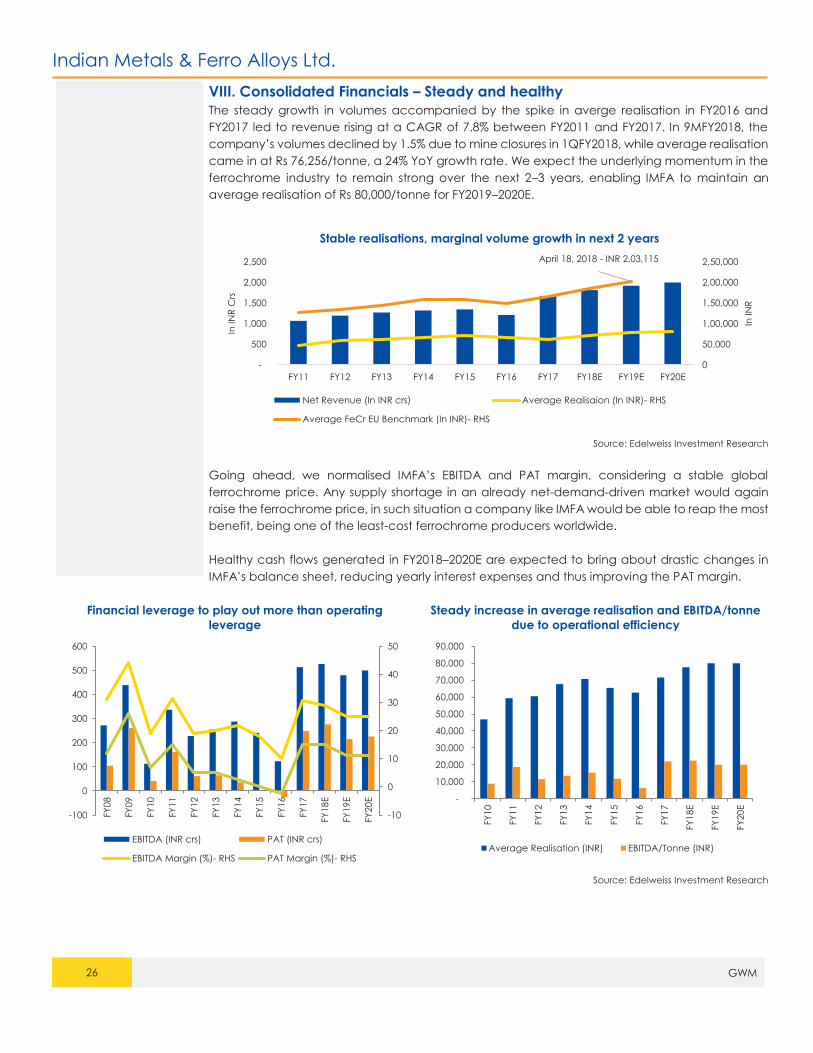
VIII. Consolidated Financials – Steady and healthy
The steady growth in volumes accompanied by the spike in averge realisation in FY2016 and
FY2017 led to revenue rising at a CAGR of 7.8% between FY2011 and FY2017. In 9MFY2018, the
company’s volumes declined by 1.5% due to mine closures in 1QFY2018, while average realisation
came in at Rs 76,256/tonne, a 24% YoY growth rate. We expect the underlying momentum in the
ferrochrome industry to remain strong over the next 2–3 years, enabling IMFA to maintain an
average realisation of Rs 80,000/tonne for FY2019–2020E.
Source: Edelweiss Investment Research
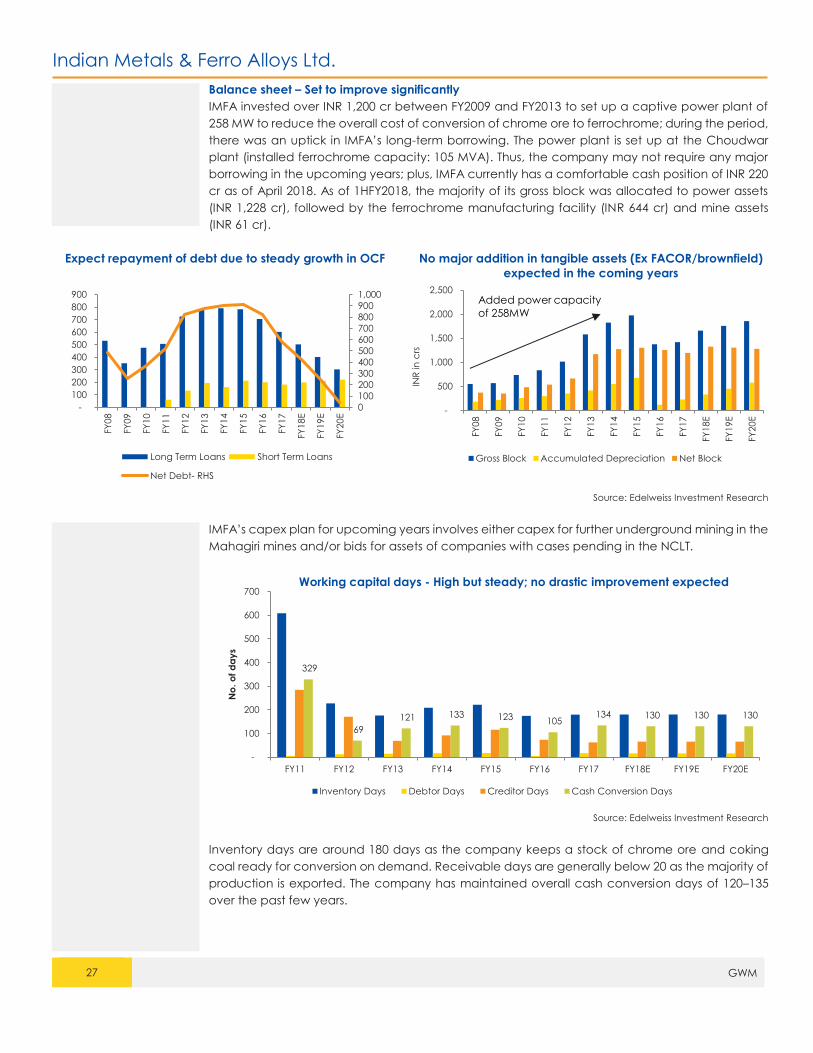
Going ahead, we normalised IMFA’s EBITDA and PAT margin, considering a stable global
ferrochrome price. Any supply shortage in an already net-demand-driven market would again
raise the ferrochrome price, in such situation a company like IMFA would be able to reap the most
benefit, being one of the least-cost ferrochrome producers worldwide.
Healthy cash flows generated in FY2018–2020E are expected to bring about drastic changes in
IMFA’s balance sheet, reducing yearly interest expenses and thus improving the PAT margin.
Financial leverage to play out more than operating
leverage
Steady increase in average realisation and EBITDA/tonne
due to operational efficiency
Source: Edelweiss Investment Research
April 18, 2018 - INR 2,03,115
0
50,000
1,00,000
1,50,000
2,00,000
2,50,000
-
500
1,000
1,500
2,000
2,500
FY11 FY12 FY13 FY14 FY15 FY16 FY17 FY18E FY19E FY20E
In IN
R
In IN
R C
rsStable realisations, marginal volume growth in next 2 years
Net Revenue (In INR crs) Average Realisaion (In INR)- RHS
Average FeCr EU Benchmark (In INR)- RHS
-10
0
10
20
30
40
50
-100
0
100
200
300
400
500
600
FY
08
FY
09
FY
10
FY
11
FY
12
FY
13
FY
14
FY
15
FY
16
FY
17
FY
18
E
FY
19
E
FY
20
E
EBITDA (INR crs) PAT (INR crs)
EBITDA Margin (%)- RHS PAT Margin (%)- RHS
-
10,000
20,000
30,000
40,000
50,000
60,000
70,000
80,000
90,000
FY
10
FY
11
FY
12
FY
13
FY
14
FY
15
FY
16
FY
17
FY
18
E
FY
19
E
FY
20
E
Average Realisation (INR) EBITDA/Tonne (INR)
Indian Metals & Ferro Alloys Ltd.
27 GWM
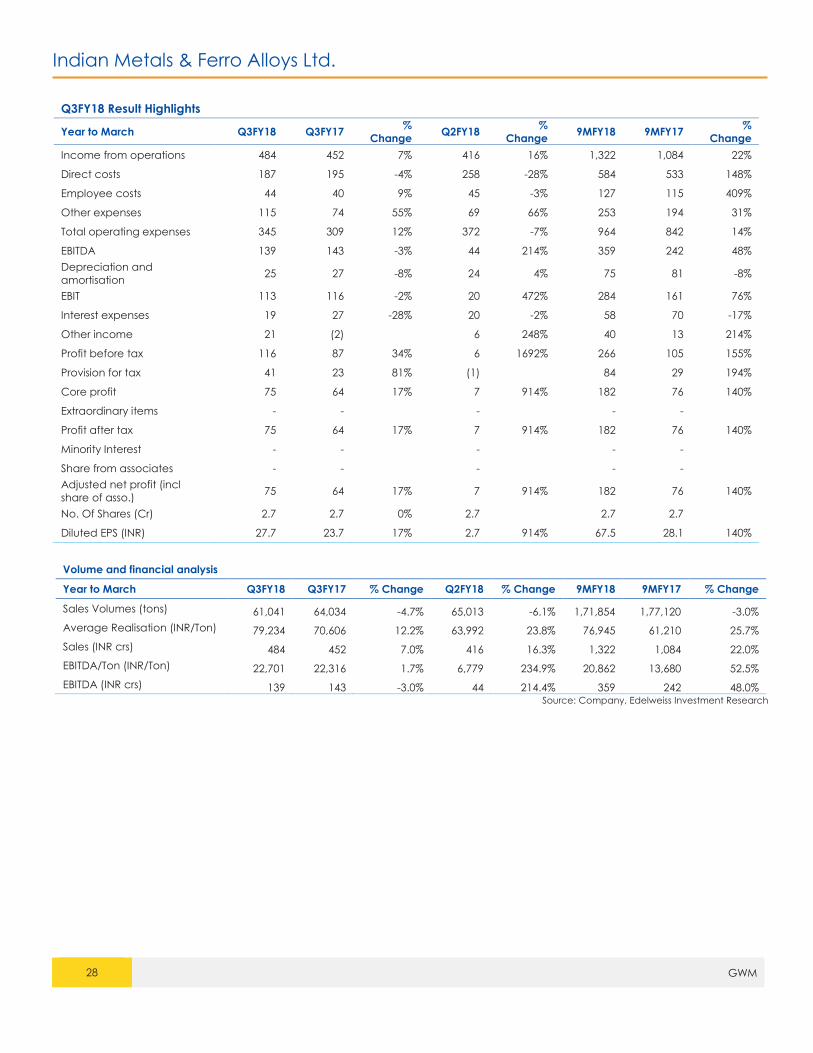
Balance sheet – Set to improve significantly
IMFA invested over INR 1,200 cr between FY2009 and FY2013 to set up a captive power plant of
258 MW to reduce the overall cost of conversion of chrome ore to ferrochrome; during the period,
there was an uptick in IMFA’s long-term borrowing. The power plant is set up at the Choudwar
plant (installed ferrochrome capacity: 105 MVA). Thus, the company may not require any major
borrowing in the upcoming years; plus, IMFA currently has a comfortable cash position of INR 220
cr as of April 2018. As of 1HFY2018, the majority of its gross block was allocated to power assets
(INR 1,228 cr), followed by the ferrochrome manufacturing facility (INR 644 cr) and mine assets
(INR 61 cr).
Expect repayment of debt due to steady growth in OCF No major addition in tangible assets (Ex FACOR/brownfield)
expected in the coming years
Source: Edelweiss Investment Research
IMFA’s capex plan for upcoming years involves either capex for further underground mining in the
Mahagiri mines and/or bids for assets of companies with cases pending in the NCLT.
Source: Edelweiss Investment Research
Inventory days are around 180 days as the company keeps a stock of chrome ore and coking
coal ready for conversion on demand. Receivable days are generally below 20 as the majority of
production is exported. The company has maintained overall cash conversion days of 120–135
over the past few years.
0
100
200
300
400
500
600
700
800
900
1,000
-
100
200
300
400
500
600
700
800
900
FY
08
FY
09
FY
10
FY
11
FY
12
FY
13
FY
14
FY
15
FY
16
FY
17
FY
18
E
FY
19
E
FY
20
E
Long Term Loans Short Term Loans
Net Debt- RHS
-
500
1,000
1,500
2,000
2,500
FY
08
FY
09
FY
10
FY
11
FY
12
FY
13
FY
14
FY
15
FY
16
FY
17
FY
18
E
FY
19
E
FY
20
E
INR
in c
rs
Gross Block Accumulated Depreciation Net Block
Added power capacity
of 258MW
329
69
121 133 123 105 134 130 130 130
-
100
200
300
400
500
600
700
FY11 FY12 FY13 FY14 FY15 FY16 FY17 FY18E FY19E FY20E
No
. o
f d
ay
s
Working capital days - High but steady; no drastic improvement expected
Inventory Days Debtor Days Creditor Days Cash Conversion Days
Indian Metals & Ferro Alloys Ltd.
28 GWM
Q3FY18 Result Highlights
Year to March Q3FY18 Q3FY17 %
Change Q2FY18
%
Change 9MFY18 9MFY17
%
Change
Income from operations 484 452 7% 416 16% 1,322 1,084 22%
Direct costs 187 195 -4% 258 -28% 584 533 148%
Employee costs 44 40 9% 45 -3% 127 115 409%
Other expenses 115 74 55% 69 66% 253 194 31%
Total operating expenses 345 309 12% 372 -7% 964 842 14%
EBITDA 139 143 -3% 44 214% 359 242 48%
Depreciation and
amortisation 25 27 -8% 24 4% 75 81 -8%
EBIT 113 116 -2% 20 472% 284 161 76%
Interest expenses 19 27 -28% 20 -2% 58 70 -17%
Other income 21 (2) 6 248% 40 13 214%
Profit before tax 116 87 34% 6 1692% 266 105 155%
Provision for tax 41 23 81% (1) 84 29 194%
Core profit 75 64 17% 7 914% 182 76 140%
Extraordinary items - - - - -
Profit after tax 75 64 17% 7 914% 182 76 140%
Minority Interest - - - - -
Share from associates - - - - -
Adjusted net profit (incl
share of asso.) 75 64 17% 7 914% 182 76 140%
No. Of Shares (Cr) 2.7 2.7 0% 2.7 2.7 2.7
Diluted EPS (INR) 27.7 23.7 17% 2.7 914% 67.5 28.1 140%
Volume and financial analysis
Year to March Q3FY18 Q3FY17 % Change Q2FY18 % Change 9MFY18 9MFY17 % Change
Sales Volumes (tons) 61,041 64,034 -4.7% 65,013 -6.1% 1,71,854 1,77,120 -3.0%
Average Realisation (INR/Ton) 79,234 70,606 12.2% 63,992 23.8% 76,945 61,210 25.7%
Sales (INR crs) 484 452 7.0% 416 16.3% 1,322 1,084 22.0%
EBITDA/Ton (INR/Ton) 22,701 22,316 1.7% 6,779 234.9% 20,862 13,680 52.5%
EBITDA (INR crs) 139 143 -3.0% 44 214.4% 359 242 48.0% Source: Company, Edelweiss Investment Research

Indian Metals & Ferro Alloys Ltd.
29 GWM
Return ratios – Best in the industry, attributed to backward integration
DuPont Analysis FY08 FY09 FY10 FY11 FY12 FY13 FY14 FY15 FY16 FY17 FY18E FY19E FY20E
Tax Burden (%) 48% 74% 71% 65% 66% 57% 70% 11% 48% 67% 68% 65% 65%
Interest Burden (%) 94% 87% 80% 85% 55% 66% 36% 21% -626% 91% 96% 92% 93%
EBIT Margin (%) 27% 40% 12% 28% 14% 14% 11% 9% 1% 24% 23% 19% 19%
Asset Turnover (x) 1.07 1.10 0.57 0.93 0.92 0.79 0.69 0.65 0.61 0.88 0.86 0.82 0.80
Equity Multiplier (x) 5.47 4.13 2.98 2.60 2.61 3.09 3.39 3.56 3.38 3.04 2.73 2.52 2.37
ROE (%) 71% 119% 12% 37% 12% 12% 6% 0% -5% 40% 36% 23% 21%
Source: Edelweiss Investment Research
IMFA’s backward integration into mines and power has enabled it to post margins higher than the
industry’s. We expect IMFA to maintain high margins in FY2018–2020E leading to an RoCE of over
20% for the company.
Valuation analysis: At a significant discount to historical ratios
Source: Edelweiss Investment Research
IMFA’s average EV/tonne from FY2008 to FY2017 stands at INR 120,008, which captures more than
one business cycle for the ferrochrome industry. At the CMP, the company’s EV/tonne on FY2018E
basis stands at INR 80,542. Thus, IMFA trades at a significant discount to the average ratio seen
over FY2008–2017. Healthy cash flows expected to be generated over the next 2 years would
significantly pare the company’s net debt, thus lowering its EV.
1,50,977
1,09,605
1,29,904 1,20,775
86,772 80,542
59,906
-
20,000
40,000
60,000
80,000
1,00,000
1,20,000
1,40,000
1,60,000
FY08 FY09 FY10 FY11 FY12 FY13 FY14 FY15 FY16 FY17 FY18E FY19E FY20E
EV/Tonne (In INR)

Indian Metals & Ferro Alloys Ltd.
30 GWM
IX. Valuation: 2-year forward EV/EBITDA and P/E chart
IMFA: 1-yr forward EV/EBITDA chart IMFA: 2-yr Forward EV/EBITDA chart
Source: Edelweiss Investment Research
0
1000
2000
3000
4000
5000
6000
Ma
r-1
1
Au
g-1
1
Ja
n-1
2
Ju
n-1
2
No
v-1
2
Ap
r-13
Se
p-1
3
Fe
b-1
4
Ju
l-14
De
c-1
4
Ma
y-1
5
Oc
t-15
Ma
r-1
6
Au
g-1
6
Ja
n-1
7
Ju
n-1
7
No
v-1
7
INR
in
crs
.
IMFA EV 3 5 7 9 10
0
1000
2000
3000
4000
5000
6000
Ma
r-1
1
Au
g-1
1
Ja
n-1
2
Ju
n-1
2
No
v-1
2
Ap
r-13
Se
p-1
3
Fe
b-1
4
Ju
l-14
De
c-1
4
Ma
y-1
5
Oc
t-15
Ma
r-1
6
Au
g-1
6
Ja
n-1
7
Ju
n-1
7
No
v-1
7
INR
in
crs
.
IMFA: 2-yr Forward EV/EBITDA chart
IMFA EV 3 5 7 9 10
-200
0
200
400
600
800
1000
1200
Ma
r-1
1
Ju
n-1
1
Se
p-1
1
De
c-1
1
Ma
r-1
2
Ju
n-1
2
Se
p-1
2
De
c-1
2
Ma
r-1
3
Ju
n-1
3
Se
p-1
3
De
c-1
3
Ma
r-1
4
Ju
n-1
4
Se
p-1
4
De
c-1
4
Ma
r-1
5
Ju
n-1
5
Se
p-1
5
De
c-1
5
Ma
r-1
6
Ju
n-1
6
Se
p-1
6
De
c-1
6
Ma
r-1
7
Ju
n-1
7
Se
p-1
7
De
c-1
7
Ma
r-1
8
INR
IMFA: 2-yr P/E chart
Price 2 4 6 8 10
Indian Metals & Ferro Alloys Ltd.
31 GWM
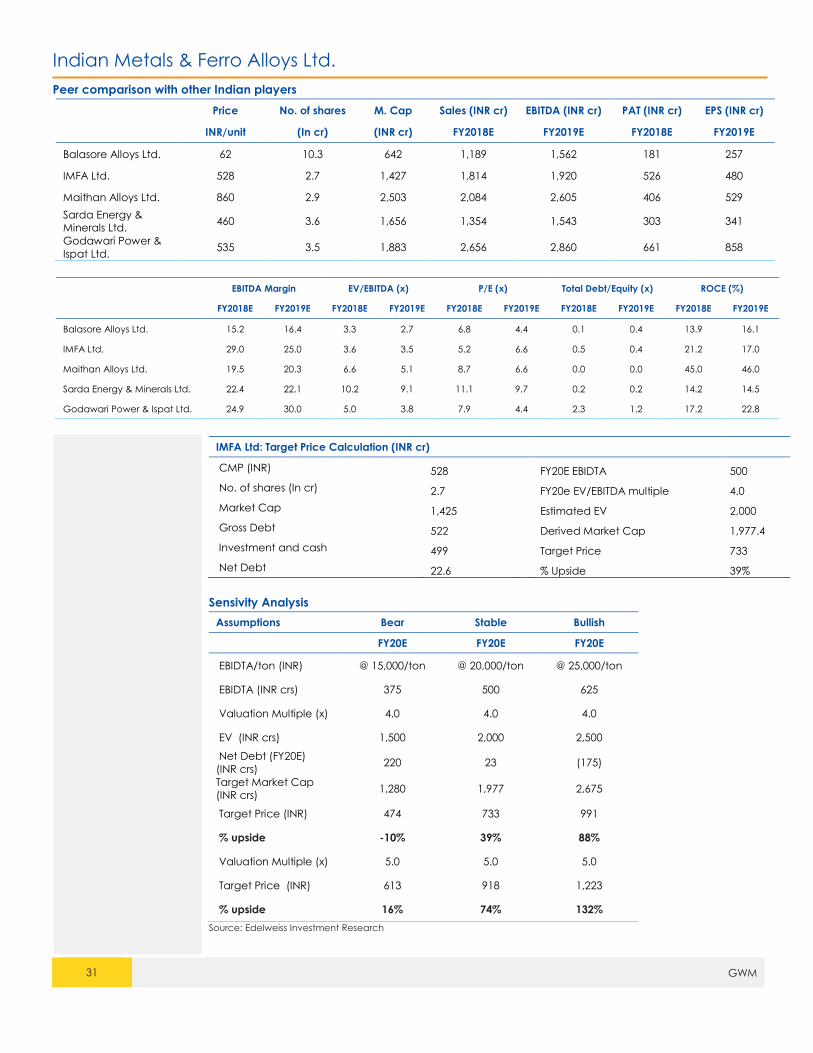
Peer comparison with other Indian players
Price No. of shares M. Cap Sales (INR cr) EBITDA (INR cr) PAT (INR cr) EPS (INR cr)
INR/unit (In cr) (INR cr) FY2018E FY2019E FY2018E FY2019E
Balasore Alloys Ltd. 62 10.3 642 1,189 1,562 181 257
IMFA Ltd. 528 2.7 1,427 1,814 1,920 526 480
Maithan Alloys Ltd. 860 2.9 2,503 2,084 2,605 406 529
Sarda Energy &
Minerals Ltd. 460 3.6 1,656 1,354 1,543 303 341
Godawari Power &
Ispat Ltd. 535 3.5 1,883 2,656 2,860 661 858
EBITDA Margin EV/EBITDA (x) P/E (x) Total Debt/Equity (x) ROCE (%)
FY2018E FY2019E FY2018E FY2019E FY2018E FY2019E FY2018E FY2019E FY2018E FY2019E
Balasore Alloys Ltd. 15.2 16.4 3.3 2.7 6.8 4.4 0.1 0.4 13.9 16.1
IMFA Ltd. 29.0 25.0 3.6 3.5 5.2 6.6 0.5 0.4 21.2 17.0
Maithan Alloys Ltd. 19.5 20.3 6.6 5.1 8.7 6.6 0.0 0.0 45.0 46.0
Sarda Energy & Minerals Ltd. 22.4 22.1 10.2 9.1 11.1 9.7 0.2 0.2 14.2 14.5
Godawari Power & Ispat Ltd. 24.9 30.0 5.0 3.8 7.9 4.4 2.3 1.2 17.2 22.8
IMFA Ltd: Target Price Calculation (INR cr)
CMP (INR) 528 FY20E EBIDTA 500
No. of shares (In cr) 2.7 FY20e EV/EBITDA multiple 4.0
Market Cap 1,425 Estimated EV 2,000
Gross Debt 522 Derived Market Cap 1,977.4
Investment and cash 499 Target Price 733
Net Debt 22.6 % Upside 39%
Sensivity Analysis
Assumptions Bear Stable Bullish
FY20E FY20E FY20E
EBIDTA/ton (INR) @ 15,000/ton @ 20,000/ton @ 25,000/ton
EBIDTA (INR crs) 375 500 625
Valuation Multiple (x) 4.0 4.0 4.0
EV (INR crs) 1,500 2,000 2,500
Net Debt (FY20E)
(INR crs) 220 23 (175)
Target Market Cap
(INR crs) 1,280 1,977 2,675
Target Price (INR) 474 733 991
% upside -10% 39% 88%
Valuation Multiple (x) 5.0 5.0 5.0
Target Price (INR) 613 918 1,223
% upside 16% 74% 132%
Source: Edelweiss Investment Research

Indian Metals & Ferro Alloys Ltd.
32 GWM
Claims with various entities: could become bonanza if received in next 1 year
Company/body
involved Matter Invested amount Claims Remarks
Utkal Coal Ltd
During the de-allocation of coal mines, IMFA
had to give up its mine under the subsidiary
Utkal Coal Ltd. The company filed a claim
following the de-allocation.
Equity: INR 111 cr
Loans: INR 262 cr INR 373 cr
Case pending with the
Supreme Court of India
Indmet Mining Pte.
Ltd.
Via its Singapore subsidiary, IMFA invested in
coal mines in Indonesia. However, due to
overlapping boundary issues, the concession
could not be operated until now. IMFA has
initiated arbitration proceedings against the
government of the Republic of Indonesia,
citing the bilateral treaty between India and
Indonesia.
INR 53 cr USD 50 mn Results expected by
September 2018
State Electricity
Board (Govt. of
Odisha)
Pursuant to the order of the Orissa High Court
dated 21 April, 2005, the company was paying
electricity duty at 6 paise/unit to the state
government and keeping the differential duty
of 14 paise/unit in a separate ‘no lien account’
until the final disposal of its writ petition. IMFA
then deposited the 14 paise with the state
exchequer and later in an escrow account. It
has filed for a refund of the entire amount.
Amount deposited - INR 100 cr.
INR 100 cr Case pending with the
Supreme Court of India
Source: Company, Edelweiss Investment Research
Key risks
a. Unfavourable Supreme Court verdicts on the mining cases (illegal as well as environmentally
detrimental mining) for various mining companies, including chrome ore miners like Balasore
Alloys, IMFA Ltd, etc.
b. Currency rate fluctuation
c. Raw material price fluctuation
d. Chinese stainless steel demand slowdown
Indian Metals & Ferro Alloys Ltd.
33 GWM
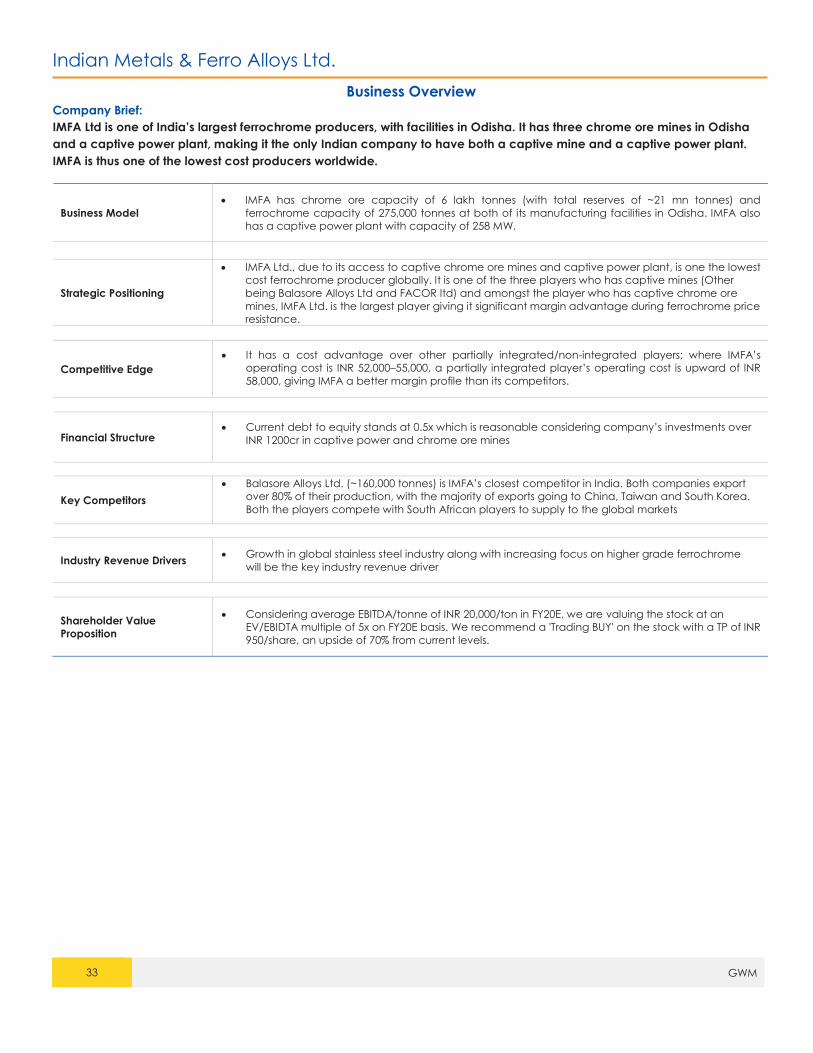
Business Overview
Company Brief:
IMFA Ltd is one of India’s largest ferrochrome producers, with facilities in Odisha. It has three chrome ore mines in Odisha
and a captive power plant, making it the only Indian company to have both a captive mine and a captive power plant.
IMFA is thus one of the lowest cost producers worldwide.
Business Model
IMFA has chrome ore capacity of 6 lakh tonnes (with total reserves of ~21 mn tonnes) and
ferrochrome capacity of 275,000 tonnes at both of its manufacturing facilities in Odisha. IMFA also
has a captive power plant with capacity of 258 MW.
Strategic Positioning
IMFA Ltd., due to its access to captive chrome ore mines and captive power plant, is one the lowest
cost ferrochrome producer globally. It is one of the three players who has captive mines (Other
being Balasore Alloys Ltd and FACOR ltd) and amongst the player who has captive chrome ore
mines, IMFA Ltd. is the largest player giving it significant margin advantage during ferrochrome price
resistance.
Competitive Edge
It has a cost advantage over other partially integrated/non-integrated players; where IMFA’s
operating cost is INR 52,000–55,000, a partially integrated player’s operating cost is upward of INR
58,000, giving IMFA a better margin profile than its competitors.
Financial Structure Current debt to equity stands at 0.5x which is reasonable considering company’s investments over
INR 1200cr in captive power and chrome ore mines
Key Competitors
Balasore Alloys Ltd. (~160,000 tonnes) is IMFA’s closest competitor in India. Both companies export
over 80% of their production, with the majority of exports going to China, Taiwan and South Korea.
Both the players compete with South African players to supply to the global markets
Industry Revenue Drivers Growth in global stainless steel industry along with increasing focus on higher grade ferrochrome
will be the key industry revenue driver
Shareholder Value
Proposition
Considering average EBITDA/tonne of INR 20,000/ton in FY20E, we are valuing the stock at an
EV/EBIDTA multiple of 5x on FY20E basis. We recommend a 'Trading BUY' on the stock with a TP of INR
950/share, an upside of 70% from current levels.

Indian Metals & Ferro Alloys Ltd.
34 GWM
SWOT ANALYSIS
• Fully integrated player with captive chrome ore
mines and captive power
• Chrome ore reserves of 21 mn tonnes (with current
capacity of 6 lakh tonnes); long-term visibility of
production
• Proximity to ports (lower freight cost for exports)
• 65-70% of volumes tied up in long-term contracts
providing stability
Strength Weakness
Opportunities: Threats
SWOT
ANALYSIS
• Volatility in raw material prices (chrome ore, coke,
etc.) as well as finished products (ferrochrome) price;
long-term contracts, at times, disable companies from
passing on costs, leading to lower EBITDA/tonne
• Current high level of debt
• If coal linkage supply issues still prevail, forcing the
company to buy power from the grid at spot prices,
EBITDA margin and EBITDA/tonne would be affected
greatly
• Growth in global SS demand (leading to higher demand for
chrome ore and ferrochrome)
• Significant inflows can be expected if pending claims are
settled by the respective authorities
• Supply tightness in South Africa due to ever-increasing power
cost coupled with increased labour cost
• Slowdown in SS demand, especially from China
• Strong supply from South African chrome ore miners backed
by the fact that Eskom does not raise power cost any further or
raises it marginally, thus affecting their EBITDA/tonne
• Stoppage of captive chrome ore mines

Indian Metals & Ferro Alloys Ltd.
35 GWM
Management Profile
Name Designation Profile
Dr. Bansidhar Panda Chairman
He has earned degrees from prestigious universities like the Benaras Hindu
University, Michigan Technological University and Harvard. With over 50 years
of experience in the ferro alloys industry, he is acknowledged as an authority
on the subject. He was former Chairman of the Board of Governors of NIT,
Rourkela and member of the governing Boards of IIT, Kharagpur and IIM,
Kolkata.
Mr. Baijayant Panda Vice Chairman
He graduated with a degree in Scientific and Technical Communication from
Michigan Technological University in 1985. He has rich experience in the ferro
alloys industry, besides having founded Ortel Communications Ltd. He was
active in organisations like the Confederation of Indian Industry (CII),
Federation of Indian Chamber of Commerce and Industry (FICCI) and the
International Chromium Development Association. After serving as an MP in
Rajya Sabha for nine years, he was elected to the Lok Sabha from
Kendrapara, Odisha in 2009 and 2014.
Mr. Subhrakant Panda Managing Director
He holds a BSc in Business Administration from the School of Management,
Boston University. He graduated with honours summa cum laude with a dual
concentration in finance and operations management. His current role in
IMFA includes defining broad strategic goals while independently supervising
the company’s daily management.
Mr. Jayanat Kumar Misra Director & COO
Mr J K Misra holds a degree in Electrical Engineering from the erstwhile
University of Roorkee (currently IIT, Roorkee) and MEP from IIM, Ahmedabad.
He headed the Therubali Manufacturing Complex and the Commercial
Division. His current role as the Chief Operating Officer is to look after the
company’s day-to-day management.

Indian Metals & Ferro Alloys Ltd.
36 GWM
Appendix:
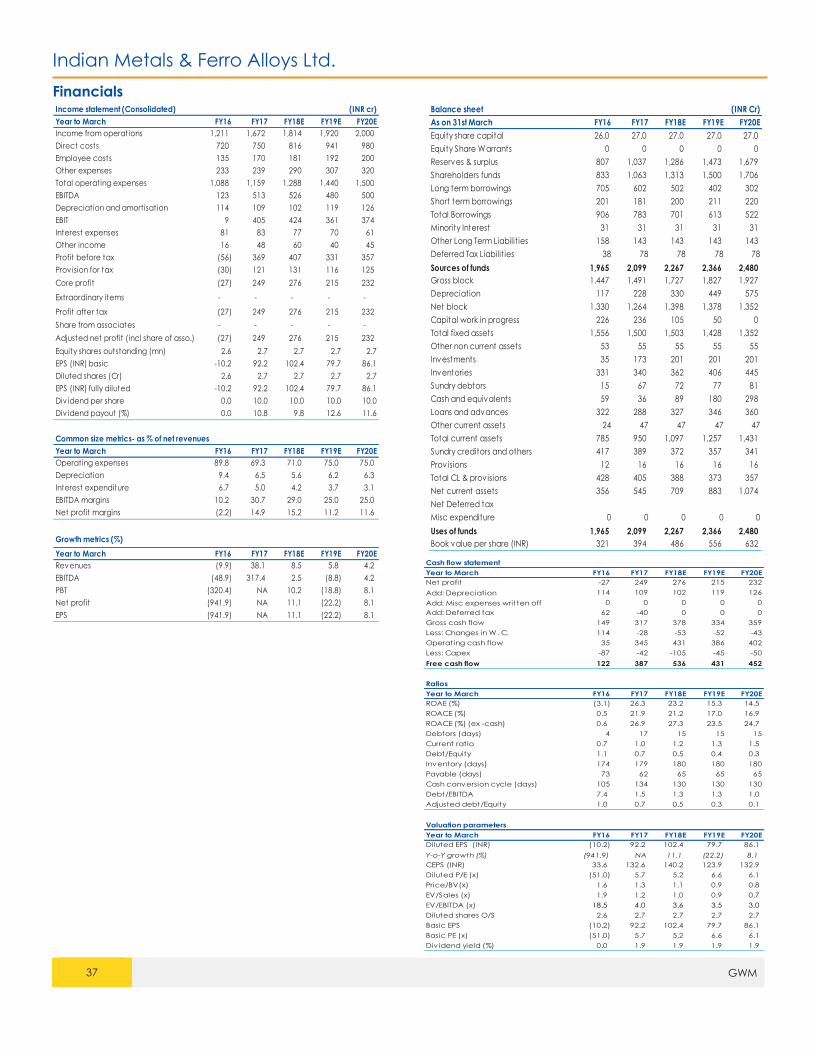
Indian Metals & Ferro Alloys Ltd.
37 GWM
Financials
Income statement (Consolidated) (INR cr)
Year to March FY16 FY17 FY18E FY19E FY20E
Income from operations 1,211 1,672 1,814 1,920 2,000
Direct costs 720 750 816 941 980
Employee costs 135 170 181 192 200
Other expenses 233 239 290 307 320
Total operating expenses 1,088 1,159 1,288 1,440 1,500
EBITDA 123 513 526 480 500
Depreciation and amortisation 114 109 102 119 126
EBIT 9 405 424 361 374
Interest expenses 81 83 77 70 61
Other income 16 48 60 40 45
Profit before tax (56) 369 407 331 357
Prov ision for tax (30) 121 131 116 125
Core profit (27) 249 276 215 232
Extraordinary items - - - - -
Profit after tax (27) 249 276 215 232
Share from associates - - - - -
Adjusted net profit (incl share of asso.) (27) 249 276 215 232
Equity shares outstanding (mn) 2.6 2.7 2.7 2.7 2.7
EPS (INR) basic -10.2 92.2 102.4 79.7 86.1
Diluted shares (Cr) 2.6 2.7 2.7 2.7 2.7
EPS (INR) fully diluted -10.2 92.2 102.4 79.7 86.1
Div idend per share 0.0 10.0 10.0 10.0 10.0
Div idend payout (%) 0.0 10.8 9.8 12.6 11.6
Common size metrics- as % of net revenues
Year to March FY16 FY17 FY18E FY19E FY20E
Operating expenses 89.8 69.3 71.0 75.0 75.0
Depreciation 9.4 6.5 5.6 6.2 6.3
Interest expenditure 6.7 5.0 4.2 3.7 3.1
EBITDA margins 10.2 30.7 29.0 25.0 25.0
Net profit margins (2.2) 14.9 15.2 11.2 11.6
Growth metrics (%)
Year to March FY16 FY17 FY18E FY19E FY20E
Revenues (9.9) 38.1 8.5 5.8 4.2
EBITDA (48.9) 317.4 2.5 (8.8) 4.2
PBT (320.4) NA 10.2 (18.8) 8.1
Net profit (941.9) NA 11.1 (22.2) 8.1
EPS (941.9) NA 11.1 (22.2) 8.1
Balance sheet (INR Cr)
As on 31st March FY16 FY17 FY18E FY19E FY20E
Equity share capital 26.0 27.0 27.0 27.0 27.0
Equity Share Warrants 0 0 0 0 0
Reserves & surplus 807 1,037 1,286 1,473 1,679
Shareholders funds 833 1,063 1,313 1,500 1,706
Long term borrowings 705 602 502 402 302
Short term borrowings 201 181 200 211 220
Total Borrowings 906 783 701 613 522
Minority Interest 31 31 31 31 31
Other Long Term Liabilit ies 158 143 143 143 143
Deferred Tax Liabilit ies 38 78 78 78 78
Sources of funds 1,965 2,099 2,267 2,366 2,480
Gross block 1,447 1,491 1,727 1,827 1,927
Depreciation 117 228 330 449 575
Net block 1,330 1,264 1,398 1,378 1,352
Capital work in progress 226 236 105 50 0
Total fixed assets 1,556 1,500 1,503 1,428 1,352
Other non current assets 53 55 55 55 55
Investments 35 173 201 201 201
Inventories 331 340 362 406 445
Sundry debtors 15 67 72 77 81
Cash and equivalents 59 36 89 180 298
Loans and advances 322 288 327 346 360
Other current assets 24 47 47 47 47
Total current assets 785 950 1,097 1,257 1,431
Sundry creditors and others 417 389 372 357 341
Provisions 12 16 16 16 16
Total CL & provisions 428 405 388 373 357
Net current assets 356 545 709 883 1,074
Net Deferred tax
Misc expenditure 0 0 0 0 0
Uses of funds 1,965 2,099 2,267 2,366 2,480
Book value per share (INR) 321 394 486 556 632
Cash flow statement
Year to March FY16 FY17 FY18E FY19E FY20E
Net profit -27 249 276 215 232
Add: Depreciation 114 109 102 119 126
Add: Misc expenses written off 0 0 0 0 0
Add: Deferred tax 62 -40 0 0 0
Gross cash flow 149 317 378 334 359
Less: Changes in W. C. 114 -28 -53 -52 -43
Operating cash flow 35 345 431 386 402
Less: Capex -87 -42 -105 -45 -50
Free cash flow 122 387 536 431 452
Ratios
Year to March FY16 FY17 FY18E FY19E FY20E
ROAE (%) (3.1) 26.3 23.2 15.3 14.5
ROACE (%) 0.5 21.9 21.2 17.0 16.9
ROACE (%) (ex -cash) 0.6 26.9 27.3 23.5 24.7
Debtors (days) 4 17 15 15 15
Current ratio 0.7 1.0 1.2 1.3 1.5
Debt/Equity 1.1 0.7 0.5 0.4 0.3
Inventory (days) 174 179 180 180 180
Payable (days) 73 62 65 65 65
Cash conversion cycle (days) 105 134 130 130 130
Debt/EBITDA 7.4 1.5 1.3 1.3 1.0
Adjusted debt/Equity 1.0 0.7 0.5 0.3 0.1
Valuation parameters
Year to March FY16 FY17 FY18E FY19E FY20E
Diluted EPS (INR) (10.2) 92.2 102.4 79.7 86.1
Y-o-Y growth (%) (941.9) NA 11.1 (22.2) 8.1
CEPS (INR) 33.6 132.6 140.2 123.9 132.9
Diluted P/E (x) (51.0) 5.7 5.2 6.6 6.1
Price/BV(x) 1.6 1.3 1.1 0.9 0.8
EV/Sales (x) 1.9 1.2 1.0 0.9 0.7
EV/EBITDA (x) 18.5 4.0 3.6 3.5 3.0
Diluted shares O/S 2.6 2.7 2.7 2.7 2.7
Basic EPS (10.2) 92.2 102.4 79.7 86.1
Basic PE (x) (51.0) 5.7 5.2 6.6 6.1
Div idend yield (%) 0.0 1.9 1.9 1.9 1.9
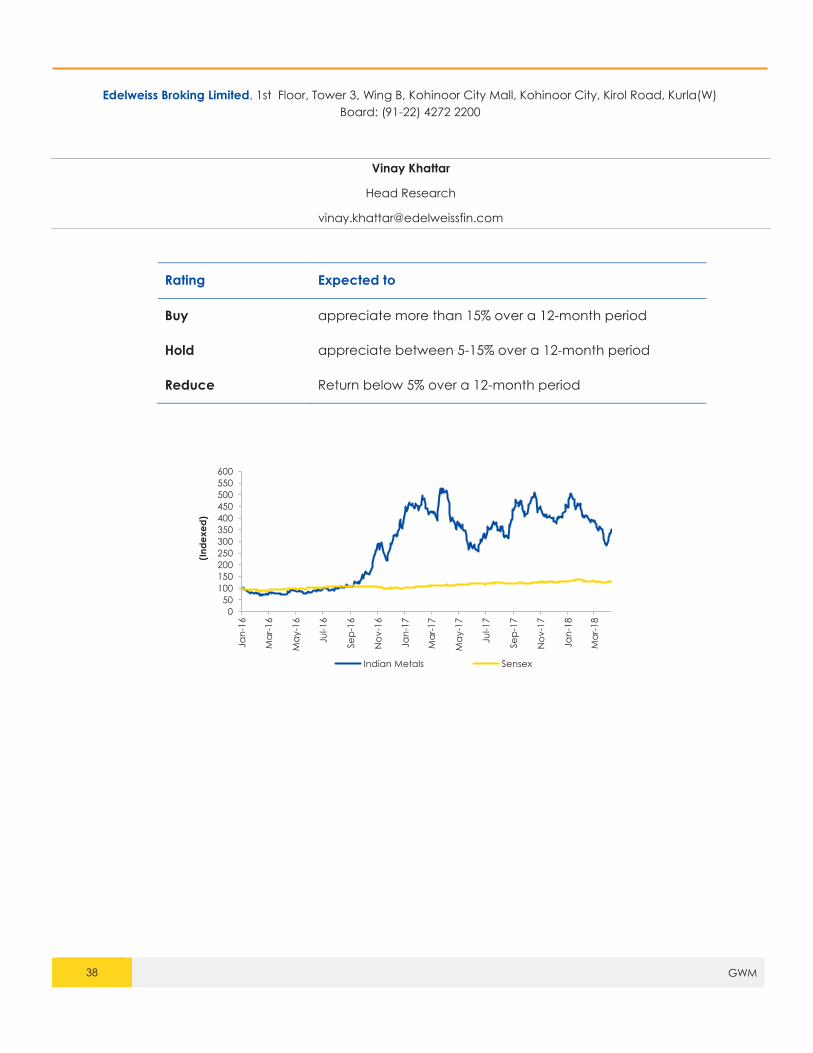
38 GWM
Edelweiss Broking Limited, 1st Floor, Tower 3, Wing B, Kohinoor City Mall, Kohinoor City, Kirol Road, Kurla(W)
Board: (91-22) 4272 2200
Vinay Khattar
Head Research
Rating Expected to
Buy appreciate more than 15% over a 12-month period
Hold appreciate between 5-15% over a 12-month period
Reduce Return below 5% over a 12-month period
0
50
100
150
200
250
300
350
400
450
500
550
600
Ja
n-1
6
Ma
r-1
6
Ma
y-1
6
Ju
l-16
Se
p-1
6
No
v-1
6
Ja
n-1
7
Ma
r-1
7
Ma
y-1
7
Ju
l-17
Se
p-1
7
No
v-1
7
Ja
n-1
8
Ma
r-1
8
(In
de
xe
d)
Indian Metals Sensex

Disclaimer
39 GWM
Edelweiss Broking Limited (“EBL” or “Research Entity”) is regulated by the Securities and Exchange Board of India (“SEBI”) and is licensed to carry on the business of broking, depository
services and related activities. The business of EBL and its Associates (list available on www.edelweissfin.com) are organized around five broad business groups – Credit including Housing
and SME Finance, Commodities, Financial Markets, Asset Management and Life Insurance.
Broking services offered by Edelweiss Broking Limited under SEBI Registration No.: INZ000005231; Name of the Compliance Officer: Mr. Brijmohan Bohra, Email ID:
[email protected] Corporate Office: Edelweiss House, Off CST Road, Kalina, Mumbai - 400098; Tel. 18001023335/022-42722200/022-40094279
This Report has been prepared by Edelweiss Broking Limited in the capacity of a Research Analyst having SEBI Registration No.INH000000172 and distributed as per SEBI (Research Analysts)
Regulations 2014. This report does not constitute an offer or solicitation for the purchase or sale of any financial instrument or as an official confirmation of any transaction. The information
contained herein is from publicly available data or other sources believed to be reliable. This report is provided for assistance only and is not intended to be and must not alone be taken
as the basis for an investment decision. The user assumes the entire risk of any use made of this information. Each recipient of this report should make such investigation as it deems necessary
to arrive at an independent evaluation of an investment in the securities of companies referred to in this document (including the merits and risks involved), and should consult his own
advisors to determine the merits and risks of such investment. The investment discussed or views expressed may not be suitable for all investors.
This information is strictly confidential and is being furnished to you solely for your information. This information should not be reproduced or redistributed or passed on directly or indirectly
in any form to any other person or published, copied, in whole or in part, for any purpose. This report is not directed or intended for distribution to, or use by, any person or entity who is a
citizen or resident of or located in any locality, state, country or other jurisdiction, where such distribution, publication, availability or use would be contrary to law, regulation or which would
subject EBL and associates / group companies to any registration or licensing requirements within such jurisdiction. The distribution of this report in certain jurisdictions may be restricted by
law, and persons in whose possession this report comes, should observe, any such restrictions. The information given in this report is as of the date of this report and there can be no
assurance that future results or events will be consistent with this information. This information is subject to change without any prior notice. EBL reserves the right to make modifications and
alterations to this statement as may be required from time to time. EBL or any of its associates / group companies shall not be in any way responsible for any loss or damage that may arise
to any person from any inadvertent error in the information contained in this report. EBL is committed to providing independent and transparent recommendation to its clients. Neither EBL
nor any of its associates, group companies, directors, employees, agents or representatives shall be liable for any damages whether direct, indirect, special or consequential including loss
of revenue or lost profits that may arise from or in connection with the use of the information. Our proprietary trading and investment businesses may make investment decisions that are
inconsistent with the recommendations expressed herein. Past performance is not necessarily a guide to future performance .The disclosures of interest statements incorporated in this
report are provided solely to enhance the transparency and should not be treated as endorsement of the views expressed in the report. The information provided in these reports remains,
unless otherwise stated, the copyright of EBL. All layout, design, original artwork, concepts and other Intellectual Properties, remains the property and copyright of EBL and may not be
used in any form or for any purpose whatsoever by any party without the express written permission of the copyright holders.
EBL shall not be liable for any delay or any other interruption which may occur in presenting the data due to any reason including network (Internet) reasons or snags in the system, break
down of the system or any other equipment, server breakdown, maintenance shutdown, breakdown of communication services or inability of the EBL to present the data. In no event shall
EBL be liable for any damages, including without limitation direct or indirect, special, incidental, or consequential damages, losses or expenses arising in connection with the data presented
by the EBL through this report.
We offer our research services to clients as well as our prospects. Though this report is disseminated to all the customers simultaneously, not all customers may receive this report at the
same time. We will not treat recipients as customers by virtue of their receiving this report.
EBL and its associates, officer, directors, and employees, research analyst (including relatives) worldwide may: (a) from time to time, have long or short positions in, and buy or sell the
securities thereof, of company(ies), mentioned herein or (b) be engaged in any other transaction involving such securities and earn brokerage or other compensation or act as a market
maker in the financial instruments of the subject company/company(ies) discussed herein or act as advisor or lender/borrower to such company(ies) or have other potential/material
conflict of interest with respect to any recommendation and related information and opinions at the time of publication of research report or at the time of public appearance. EBL may
have proprietary long/short position in the above mentioned scrip(s) and therefore should be considered as interested. The views provided herein are general in nature and do not consider
risk appetite or investment objective of any particular investor; readers are requested to take independent professional advice before investing. This should not be construed as invitation
or solicitation to do business with EBL.
EBL or its associates may have received compensation from the subject company in the past 12 months. EBL or its associates may have managed or co-managed public offering of
securities for the subject company in the past 12 months. EBL or its associates may have received compensation for investment banking or merchant banking or brokerage services from
the subject company in the past 12 months. EBL or its associates may have received any compensation for products or services other than investment banking or merchant banking or
brokerage services from the subject company in the past 12 months. EBL or its associates have not received any compensation or other benefits from the Subject Company or third party
in connection with the research report. Research analyst or his/her relative or EBL’s associates may have financial interest in the subject company. EBL, its associates, research analyst and
his/her relative may have other potential/material conflict of interest with respect to any recommendation and related information and opinions at the time of publication of research
report or at the time of public appearance.
Participants in foreign exchange transactions may incur risks arising from several factors, including the following: ( i) exchange rates can be volatile and are subject to large fluctuations; (
ii) the value of currencies may be affected by numerous market factors, including world and national economic, political and regulatory events, events in equity and debt markets and
changes in interest rates; and (iii) currencies may be subject to devaluation or government imposed exchange controls which could affect the value of the currency. Investors in securities
such as ADRs and Currency Derivatives, whose values are affected by the currency of an underlying security, effectively assume currency risk.
Research analyst has served as an officer, director or employee of subject Company: No
EBL has financial interest in the subject companies: No
EBL’s Associates may have actual / beneficial ownership of 1% or more securities of the subject company at the end of the month immediately preceding the date of publication of
research report.
Research analyst or his/her relative has actual/beneficial ownership of 1% or more securities of the subject company at the end of the month immediately preceding the date of publication
of research report: No
EBL has actual/beneficial ownership of 1% or more securities of the subject company at the end of the month immediately preceding the date of publication of research report: No
Subject company may have been client during twelve months preceding the date of distribution of the research report.
There were no instances of non-compliance by EBL on any matter related to the capital markets, resulting in significant and material disciplinary action during the last three years.
A graph of daily closing prices of the securities is also available at www.nseindia.com
Analyst Certification:
The analyst for this report certifies that all of the views expressed in this report accurately reflect his or her personal views about the subject company or companies and its or their securities,
and no part of his or her compensation was, is or will be, directly or indirectly related to specific recommendations or views expressed in this report.
Additional Disclaimer for U.S. Persons
Edelweiss is not a registered broker – dealer under the U.S. Securities Exchange Act of 1934, as amended (the“1934 act”) and under applicable state laws in the United States. In addition
Edelweiss is not a registered investment adviser under the U.S. Investment Advisers Act of 1940, as amended (the "Advisers Act" and together with the 1934 Act, the "Acts), and under
Disclaimer
40 GWM
applicable state laws in the United States. Accordingly, in the absence of specific exemption under the Acts, any brokerage and investment services provided by Edelweiss, including the
products and services described herein are not available to or intended for U.S. persons.
This report does not constitute an offer or invitation to purchase or subscribe for any securities or solicitation of any investments or investment services and/or shall not be considered as an
advertisement tool. "U.S. Persons" are generally defined as a natural person, residing in the United States or any entity organized or incorporated under the laws of the United States. US
Citizens living abroad may also be deemed "US Persons" under certain rules.
Transactions in securities discussed in this research report should be effected through Edelweiss Financial Services Inc.
Additional Disclaimer for U.K. Persons
The contents of this research report have not been approved by an authorised person within the meaning of the Financial Services and Markets Act 2000 ("FSMA").
In the United Kingdom, this research report is being distributed only to and is directed only at (a) persons who have professional experience in matters relating to investments falling within
Article 19(5) of the FSMA (Financial Promotion) Order 2005 (the “Order”); (b) persons falling within Article 49(2)(a) to (d) of the Order (including high net worth companies and
unincorporated associations); and (c) any other persons to whom it may otherwise lawfully be communicated (all such persons together being referred to as “relevant persons”).
This research report must not be acted on or relied on by persons who are not relevant persons. Any investment or investment activity to which this research report relates is available only
to relevant persons and will be engaged in only with relevant persons. Any person who is not a relevant person should not act or rely on this research report or any of its contents. This
research report must not be distributed, published, reproduced or disclosed (in whole or in part) by recipients to any other person.
Additional Disclaimer for Canadian Persons
Edelweiss is not a registered adviser or dealer under applicable Canadian securities laws nor has it obtained an exemption from the adviser and/or dealer registration requirements under
such law. Accordingly, any brokerage and investment services provided by Edelweiss, including the products and services described herein, are not available to or intended for Canadian
persons.
This research report and its respective contents do not constitute an offer or invitation to purchase or subscribe for any securities or solicitation of any investments or investment services.
Disclosures under the provisions of SEBI (Research Analysts) Regulations 2014 (Regulations)
Edelweiss Broking Limited ("EBL" or "Research Entity") is regulated by the Securities and Exchange Board of India ("SEBI") and is licensed to carry on the business of broking, depository services
and related activities. The business of EBL and its associates are organized around five broad business groups – Credit including Housing and SME Finance, Commodities, Financial Markets,
Asset Management and Life Insurance. There were no instances of non-compliance by EBL on any matter related to the capital markets, resulting in significant and material disciplinary
action during the last three years. This research report has been prepared and distributed by Edelweiss Broking Limited ("Edelweiss") in the capacity of a Research Analyst as per Regulation
22(1) of SEBI (Research Analysts) Regulations 2014 having SEBI Registration No.INH000000172.