ecor1 capital llc q4 2015 investor letter
DESCRIPTION
EcoR1 Q4 2015TRANSCRIPT

EcoR1 Capital, LLC ● 409 Illinois Street, San Francisco, CA 94158 ● p. 415-448-6534 ●f. 415-952-9412
January 28, 2016
Dear Limited Partners:
Reflexivity is a powerful force. The drawdown in the overall markets has had an amplified effect on the biotech sector. At the time of writing, the various biotech indexes are down 22-30% since the beginning of the year. These indexes are weighted by market cap so they understate the average 50% drawdown for many biotech stocks from their 52 week highs.i We are taking advantage of the current volatility to upgrade our portfolio, exit investments that may need capital in the next twelve months, and rebalance core positions. As we have been tracking a multitude of companies with 5-10X upside potential, now trading at or below their margin of safety, the challenge today is to decide which of these deserve our focus. In this environment dictated by fear and short-term orientation, incredible opportunities abound and we find ourselves significantly capital constrained. I plan to add to my own investment in the Fund on February 1st.
In light of the market’s activity over the last few weeks, analyzing 2015 seems academic relative to a discussion regarding 2016. We will spend most of this letter discussing the current environment, our view of the opportunity set, and an operational update. The Appendix is a data-rich novella with a write-up of a newish investment, EcoR1 Capital’s performance, and a review of 2015 biotech sector fundamentals.
A retrospective analysis of 2015 could easily conclude that every sell decision was brilliant and every decision to buy or hold was a mistake. Much more relevant is the process by which we find ideas, generate a variant perception, and construct the portfolio as we have discussed in previous letters. The majority of the drawdown for the Fund in the second half can be attributed to three investments. One of those investments changed fundamentally, leading to our exit near the end of last year. Another we have added to significantly as the stock came in 75% from its highs, with nothing fundamental having changed. A third we have traded around extensively, ending with a similar position size as Q2 2015 but at a much better cost basis (while helping to fix a funding gap at the company).
Despite being up for the year in 2015, there is no doubt that had we heeded our own advice – winter is coming – we could have played our hand much better. We constantly balance our roles ex-ante as nimble traders vs. long-term investors.

EcoR1 Capital, LLC ● 409 Illinois Street, San Francisco, CA 94158 ● p. 415-448-6534 ●f. 415-952-9412
Keep your helmet on and mouth guard in
The resemblance between Canadian Jean-Paul Rodrigue’s bubble model and a chart of NBI biotech sector performance is uncanny.ii Although we are starting to see fear permeate consensus views and drive investment decisions, we continue to think the opportunity set can get better if capitulation sets in. To be clear, we have no illusions that we can pick the bottom and strongly believe that the time to buy is when there is blood in the streets, as long as the bears aren’t out in the streets still mauling the other investors.
Fundamentals
As a reminder, the key signposts that we monitor in the biotech sector include fund flows, availability and cost of capital, M&A, regulatory and political developments and, of course,
EcoR1 Capital, LLC ● 409 Illinois Street, San Francisco, CA 94158 ● p. 415-448-6534 ●f. 415-952-9412
innovation. We remain puzzled as to how the price of oil or the strength of the yuan will dictate future therapies for cancer or Alzheimer’s in the United States.
The macroeconomic environment does directly dictate availability and cost of capital, however, and the biotech sector is an animal that needs prolific amounts of oxygen to survive and thrive. As we have noted in the past, the success we have seen in biotechnology since 2012 may have been as much the result of the quantities of capital entering the sector over the last three years as it was the result of scientific innovation. While it is true that many of the best companies are well-funded and do not need access to capital markets today, burn rates also are higher than ever. Even the best swimmers can only hold their breath for so long.
Outflows continue in the sector, with net $5.5B of outflows since August 2015, and almost $1B out so far in 2016.iii Most dedicated biotech mutual funds are down significantly, tracking with the indexes, with many sitting on as much cash as they can hold. An analysis of mutual fund holdings suggests that if outflows increase, many highly illiquid biotech names could have another leg down.
2015 was another epic year for M&A (see Appendix). There is enough purchase power at the large biotech and pharma companies to acquire most of the development and research stage companies in the sector. With 50-80% of innovation in late stage pharma pipelines coming from biotech, buying innovation has become integral to the business model. Based on conversations with our colleagues in pharma, M&A and deal making will continue in at a robust pace in 2016 which should provide a floor for the sector.
Despite the political rhetoric from both parties, drug pricing data suggests business as usual. As part of standard course of business many biotech and pharma companies increased drug prices at the beginning of 2016. Pfizer, for example, raised prices on over 100 drugs in January, including a 12.9% increase of erectile dysfunction drug Viagra, with no perceivable pushback.iv
Based on the data we constantly collect, we are operating under the following assumptions:
• The biotech sector may continue to experience a draw down for the foreseeable future • Access to capital may be limited/unavailable • Criticism of drug pricing will continue in a bi-partisan manner • Fundamentals of innovation, drug development and regulatory interaction remain
excellent
EcoR1 Capital, LLC ● 409 Illinois Street, San Francisco, CA 94158 ● p. 415-448-6534 ●f. 415-952-9412
Consequently the best opportunities may need to be bought on the way down when there is volume as we are unlikely to predict the bottom. Operational Update
Operationally the back office continues to go well as we approach the three year anniversary of the Fund. We are now dual primed, with prime brokerage relationships at Goldman Sachs and Wells Fargo. Our investment team consists of four dedicated professionals (Oleg, Joe, Caroline, and Scott). I am extremely proud of Joe, Caroline, and Scott who have been working tirelessly and travelling to medical meetings around the globe. Based on previous experience, this is the team I envisioned when I launched the Fund three years ago. We can easily scale to over $1B in assets. For the right type of athlete, though – contrarians with a propensity for science and value – there is still room on the roster.
We will hold our Annual Meeting on Thursday, March 3rd, in Boston. Our program this year will include a business session starting around 2 p.m., followed by cocktails and dinner at 6 p.m. Please keep an eye out for invitations, which we will be sending next month.
Thank you as always and please feel free to reach out if you have any questions.
Sincerely,
Oleg
EcoR1 Capital, LLC ● 409 Illinois Street, San Francisco, CA 94158 ● p. 415-448-6534 ●f. 415-952-9412
Appendix
I. Newish Idea – Five Prime Therapeutics (NASDAQ: FPRX) II. EcoR1 Performance Statistics III. EcoR1 Metrics Since Inception IV. 2015 Biotech Sector Review
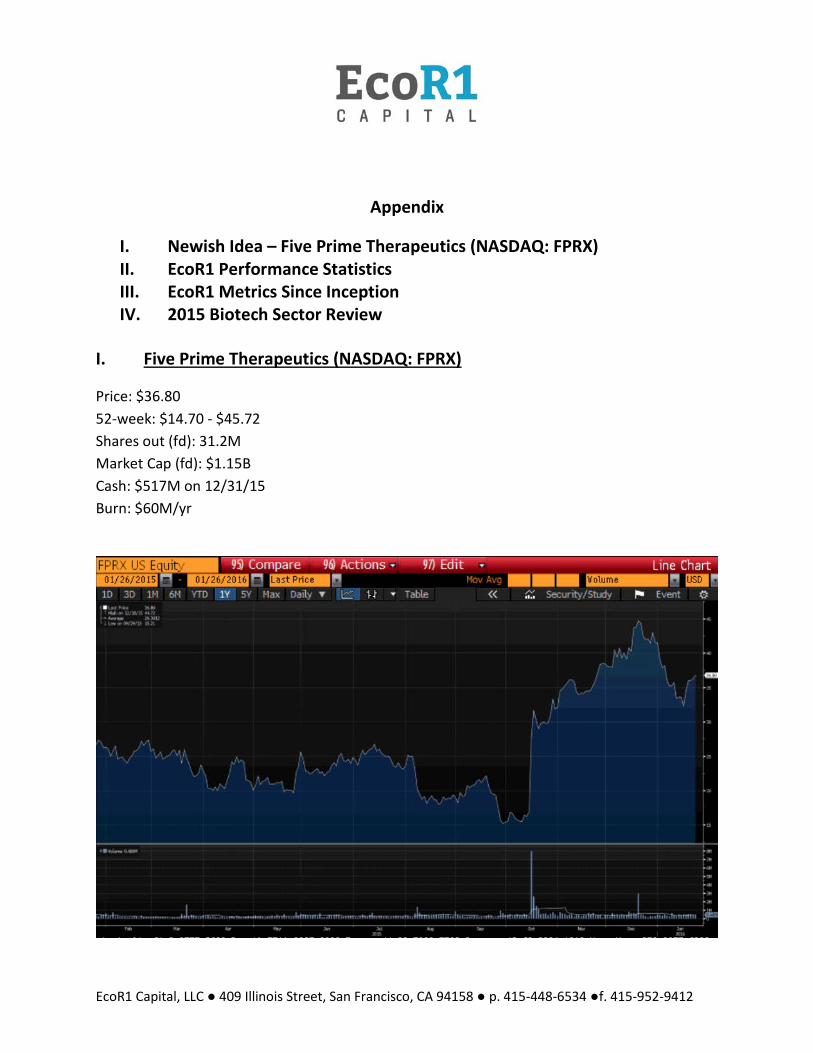
I. Five Prime Therapeutics (NASDAQ: FPRX)
Price: $36.80 52-week: $14.70 - $45.72 Shares out (fd): 31.2M Market Cap (fd): $1.15B Cash: $517M on 12/31/15 Burn: $60M/yr

EcoR1 Capital, LLC ● 409 Illinois Street, San Francisco, CA 94158 ● p. 415-448-6534 ●f. 415-952-9412
Over the last few months we turned Five Prime Therapeutics (NASDAQ: FPRX) into a core long position after the company signed a transformative collaboration potentially insulating itself from the capital markets through profitability.
Five Prime was founded in 2001 and went public in 2013 without much fanfare. Consensus view on the company is focused on the company’s expansive collaboration with Bristol-Myers Squibb to develop a scientifically promising immuno-oncology antibody. Milestones payable before the drug reaches the market exceed the company's current enterprise value. Five Prime is also eligible for royalties into the low 20% range on future sales of this compound. The economic potential for successful immuno-oncology assets is generally valued in the tens of billions, as they are the first new modality to increase cancer survival since targeted therapy (which created Genentech). Specifically for Five Prime, BMS is funding combination trials in 6 different solid tumor types, which should begin to read out in 2H16. We find this blue-sky opportunity very exciting, although we ascribe it minimal value in our current model due to its early stage.
Compounding the immune-oncology upside is Five Prime’s discovery engine, whose ability to generate additional relevant targets has been validated by several lucrative partnerships. Of course, this potential is not possible to quantify, so we view it as a free call option multiplier should the consensus view play out.
Our variant perception lies in a largely-ignored asset in Five Prime’s pipeline, an anti-FGFR2b antibody for stomach cancer. Last quarter, we saw a materially positive read-through from similar drug candidates at AstraZeneca and Novartis. Data presented at several oncology meetings indicate that both AZ and Novartis are seeing activity in stomach cancers harboring aberrations in FGFR2 expression. This was particularly interesting for Five Prime because these first-generation molecules bluntly inhibit all isoforms of FGFR, which has been associated with challenging toxicities. Last week, Five Prime presented initial human data with their own molecule at the ASCO GI meeting showing significant clinical activity in FGFR2-altered tumors, with a seemingly more benign safety profile than its competitors. We believe this drug represents an overlooked and significant value driver this year as data mature.
We see a margin of safety in Five Prime’s rare disease program with the same molecule that BMS has licensed for immune-oncology. This disease, called pigmented villonodular synovitis (PVNS), is an orphan indication too small for BMS, but could generate $100M per year for Five Prime. Our thesis here follows the same read-through theme as FGFR2; the Japanese pharma Daiichi Sankyo has shown remarkable activity with a less targeted molecule. Daiichi’s molecule was recently granted Breakthrough Designation by FDA in PVNS, a significant endorsement by

EcoR1 Capital, LLC ● 409 Illinois Street, San Francisco, CA 94158 ● p. 415-448-6534 ●f. 415-952-9412
regulatory authorities for probable and expedited approval. Five Prime’s program is likely more potent and less toxic than Daiichi’s against the same molecular target, and has been de-risked by an earlier trial in rheumatoid arthritis demonstrating its improved safety. We look forward to PVNS efficacy data this year.
II. EcoR1 Performance Statistics
2013 RETURNS (NET OF FEES)
in % Jan Feb Mar Apr May Jun Jul Aug Sep Oct Nov Dec YTD
EcoR1 - - 3.16 4.94 3.58 1.73 22.80 0.38 14.70 1.38 13.03 19.64 121.12
S&P 500 - - 3.75 1.93 2.34 (1.33) 5.09 (2.90) 3.14 4.60 3.05 2.52 24.19
Russell 2K - - 4.62 (0.37) 4.00 (0.51) 7.00 (3.18) 6.38 2.51 4.01 1.97 29.22
NBI Index - - 8.34 7.74 4.15 (3.11) 13.94 (2.04) 8.22 (2.05) 9.19 1.27 54.10
2014 RETURNS (NET OF FEES)
in % Jan Feb Mar Apr May Jun Jul Aug Sep Oct Nov Dec YTD
EcoR1 23.97 12.52 (8.48) (5.95) 2.70 2.19 (1.51) 1.25 4.84 13.58 8.37 (0.66) 61.09
S&P 500 (3.46) 4.57 0.84 0.74 2.35 2.07 (1.38) 4.00 (1.40) 2.44 2.69 (0.26) 13.68
Russell 2K (2.77) 4.71 (0.68) (3.88) 0.80 5.32 (6.05) 4.96 (6.05) 6.59 0.09 2.85 4.90
NBI Index 8.41 7.68 (10.70) (2.69) 4.26 7.32 (2.34) 10.31 (1.16) 8.52 2.52 (0.06) 34.40
2015 RETURNS (NET OF FEES)
in % Jan Feb Mar Apr May Jun Jul Aug Sep Oct Nov Dec YTD ITD
EcoR1 4.60 7.46 5.52 (2.85) 5.38 3.81 (4.44) (4.23) (2.63) (0.72) (2.98) (2.51) 5.48 275.70
S&P 500 (3.00) 5.75 (1.58) 0.96 1.29 (1.94) 2.10 (6.03) (2.47) 8.44 0.30 (1.59) 1.37 43.16
Russell 2K (3.22) 5.94 1.74 (2.55) 2.28 0.75 (1.16) (6.28) (4.91) 5.63 3.25 (5.02) (4.41) 29.55
NBI Index 5.90 4.94 1.93 (2.75) 9.29 1.17 3.58 (10.55) (11.43) 7.61 2.62 1.25 11.77 131.43

EcoR1 Capital, LLC ● 409 Illinois Street, San Francisco, CA 94158 ● p. 415-448-6534 ●f. 415-952-9412
Performance VAMI (lifetime)
III. EcoR1 Metrics Since Inception
EcoR1
NBI Index
S&P 500
Russell 2k

EcoR1 Capital, LLC ● 409 Illinois Street, San Francisco, CA 94158 ● p. 415-448-6534 ●f. 415-952-9412
IV. 2015 Biotech Sector Reviewv
a. M&A Activity
The aggregate transaction value for M&A deals completed in 2015 was $168B. The figure was far and away the largest amount seen for the industry over the past 16 years, but it does not indicate that the future of all biotechs is to get swallowed by bigger fish. Three deals in 2015 accounted for more than half the dollar value: the $66B takeout of Allergan Inc. by Actavis plc, now called Allergan plc (NYSE:AGN); the $21B takeout of Pharmacyclics Inc. by AbbVie Inc. (NYSE:ABBV); and the $11.4B takeout of Salix Pharmaceuticals Ltd. by Valeant Pharmaceuticals International Inc. (TSX:VRX; NYSE:VRX).
The pace of private company takeouts continued in 2015 with 66 deals — just shy of the record-breaking 67 private biotech acquisitions in 2014. For the 47 private deals in 2015 that disclosed financial terms, the aggregate value was $20.5B, up from $18.5B for the 46 deals with disclosed terms in 2014.
The data above include takeouts of therapeutic companies counted in the year the deals closed. Data exclude deals in the agbio, diagnostics, generics, supply/service and veterinary segments, as well as reverse mergers, acquisitions of big pharmas and acquisitions of divisions/subsidiaries. Deal values include milestones. Deal counts include deals with undisclosed values.
0
10
20
30
40
50
60
70
80
–
$50
$100
$150
$200
$250
$300
2000 2001 2002 2003 2004 2005 2006 2007 2008 2009 2010 2011 2012 2013 2014 2015
No.
of D
eals
Deal
val
ue $
B
Axis Title
M&A Activity over last 15 years
Value of Private Co Acqs Value of Public Co Acqs
No. of Private Co Acqs No. of Public Co Acqs
EcoR1 Capital, LLC ● 409 Illinois Street, San Francisco, CA 94158 ● p. 415-448-6534 ●f. 415-952-9412
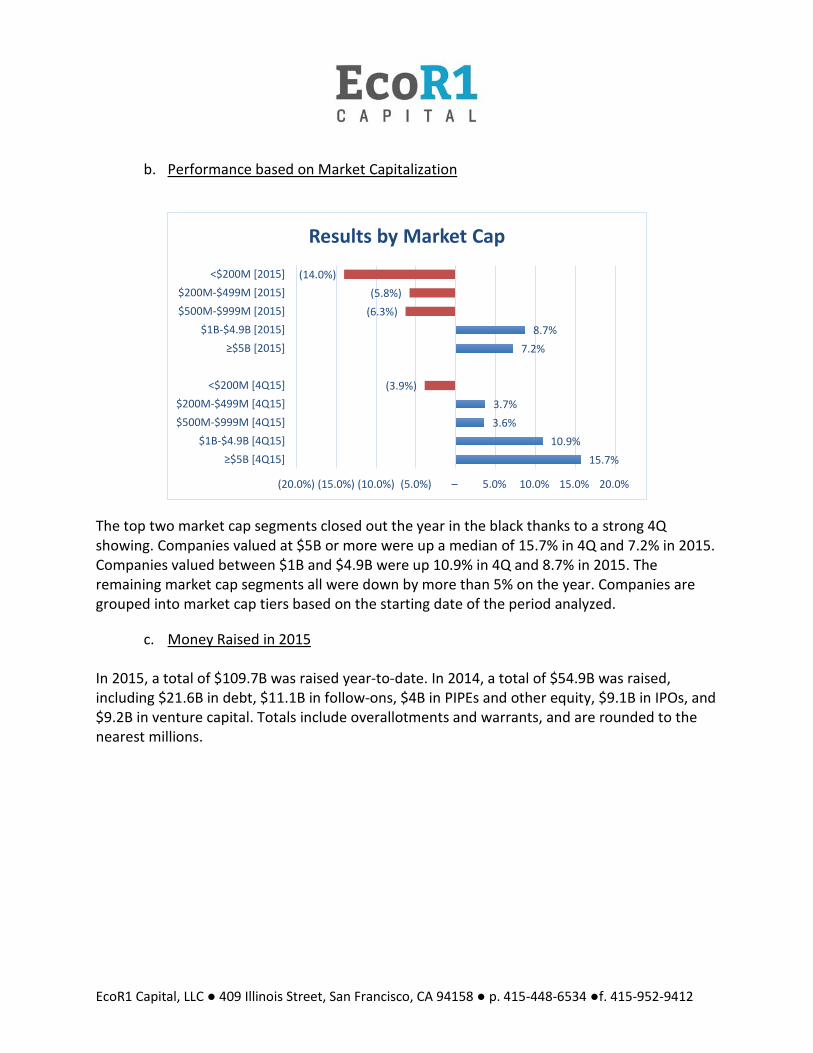
b. Performance based on Market Capitalization
The top two market cap segments closed out the year in the black thanks to a strong 4Q showing. Companies valued at $5B or more were up a median of 15.7% in 4Q and 7.2% in 2015. Companies valued between $1B and $4.9B were up 10.9% in 4Q and 8.7% in 2015. The remaining market cap segments all were down by more than 5% on the year. Companies are grouped into market cap tiers based on the starting date of the period analyzed.
c. Money Raised in 2015
In 2015, a total of $109.7B was raised year-to-date. In 2014, a total of $54.9B was raised, including $21.6B in debt, $11.1B in follow-ons, $4B in PIPEs and other equity, $9.1B in IPOs, and $9.2B in venture capital. Totals include overallotments and warrants, and are rounded to the nearest millions.
15.7% 10.9%
3.6% 3.7%
(3.9%)
7.2% 8.7%
(6.3%)(5.8%)
(14.0%)
(20.0%) (15.0%) (10.0%) (5.0%) – 5.0% 10.0% 15.0% 20.0%
≥$5B [4Q15]$1B-$4.9B [4Q15]
$500M-$999M [4Q15]$200M-$499M [4Q15]
<$200M [4Q15]
≥$5B [2015]$1B-$4.9B [2015]
$500M-$999M [2015]$200M-$499M [2015]
<$200M [2015]
Results by Market Cap

EcoR1 Capital, LLC ● 409 Illinois Street, San Francisco, CA 94158 ● p. 415-448-6534 ●f. 415-952-9412
d. Fund Flowsvi
Fund flows in and more recently out of biotech are a key metric. The first seven months of 2015 saw net inflows of $11.4B, but since mid-August there have been net outflows of $4.8B, $2.2B of which came in the fourth quarter.
Debt$56,285
Follow-On$29,346
Venture$12,335
IPO$8,036
PIPEs & other equity$3,697
Total YTD: $109.7B
$9.2 $9.1 $4.0
$11.1
$21.6
$12.3 $8.0
$3.7
$29.3
$56.3
–
$10.0
$20.0
$30.0
$40.0
$50.0
$60.0
Venture IPO PIPEs & otherequity
Follow-On Debt
2014 vs 2015:$54.9B vs $109.7B
2014 2015
EcoR1 Capital, LLC ● 409 Illinois Street, San Francisco, CA 94158 ● p. 415-448-6534 ●f. 415-952-9412
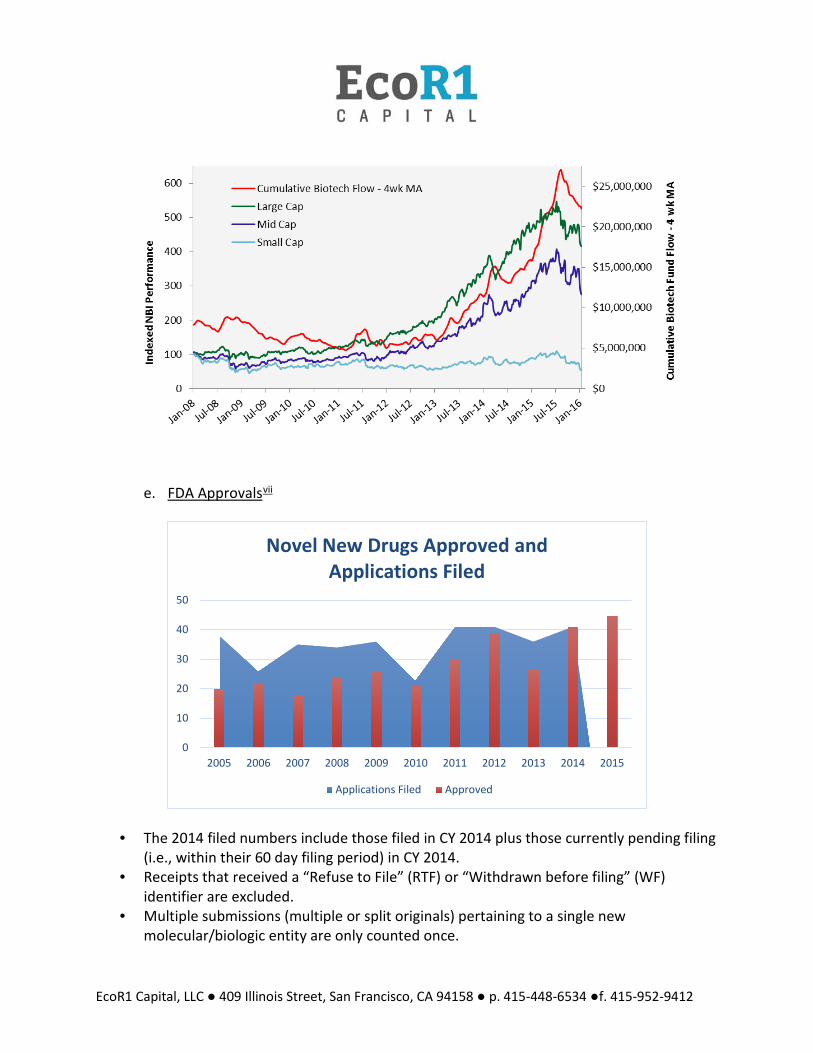
e. FDA Approvalsvii
• The 2014 filed numbers include those filed in CY 2014 plus those currently pending filing (i.e., within their 60 day filing period) in CY 2014.
• Receipts that received a “Refuse to File” (RTF) or “Withdrawn before filing” (WF) identifier are excluded.
• Multiple submissions (multiple or split originals) pertaining to a single new molecular/biologic entity are only counted once.
0
10
20
30
40
50
2005 2006 2007 2008 2009 2010 2011 2012 2013 2014 2015
Novel New Drugs Approved and Applications Filed
Applications Filed Approved
EcoR1 Capital, LLC ● 409 Illinois Street, San Francisco, CA 94158 ● p. 415-448-6534 ●f. 415-952-9412
• The filed number is not indicative of workload in the PDUFA V Program.
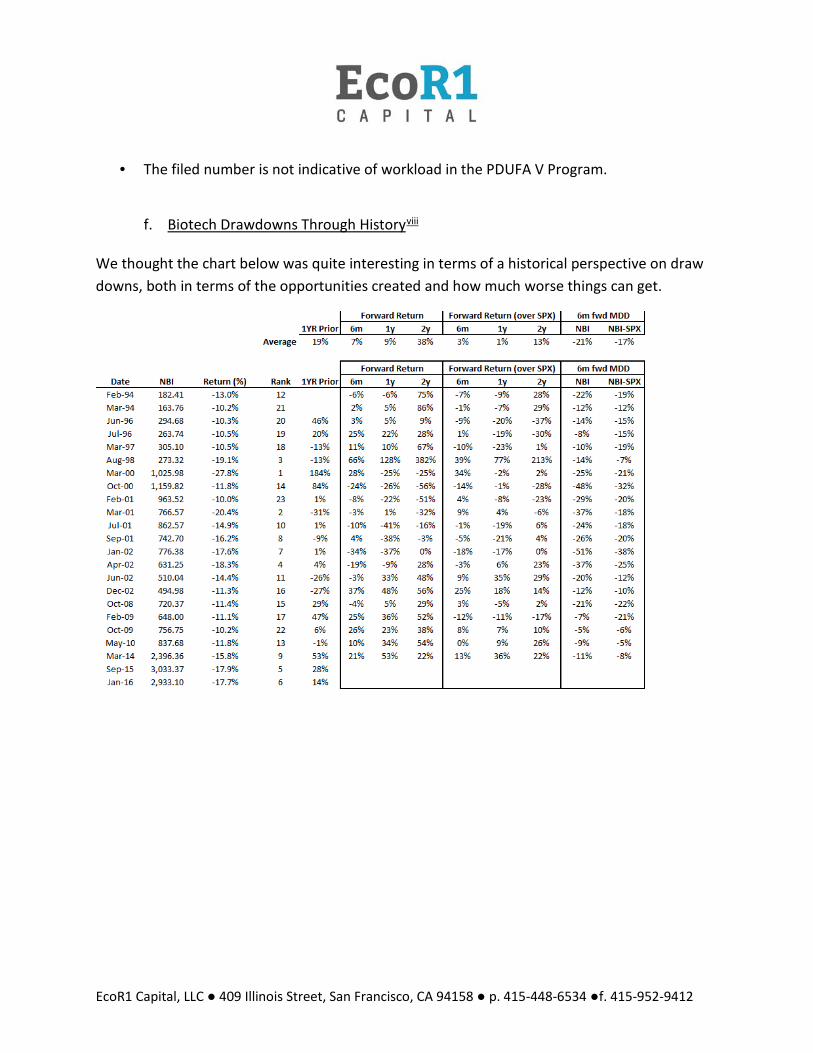
f. Biotech Drawdowns Through Historyviii
We thought the chart below was quite interesting in terms of a historical perspective on draw downs, both in terms of the opportunities created and how much worse things can get.

EcoR1 Capital, LLC ● 409 Illinois Street, San Francisco, CA 94158 ● p. 415-448-6534 ●f. 415-952-9412
Disclosure: EcoR1 Capital, LLC’s (“ERC”) analysis and projections regarding portfolio company operating and investment results are subject to many risks, uncertainties and assumptions that are difficult to predict. Therefore, actual returns from an investment in any such company could differ materially and adversely from those expressed or implied in any forward looking statements, as a result of those various factors. ERC's expected results and projections are provided for information regarding ERC's investment analysis, not as any guarantee or expectation of investment results for any fund's investment portfolio. No representation is made on the accuracy or completeness of the information contained in this report, and the sender does not accept liability for any errors or omissions in the contents of this report. ERC does not guarantee the appropriateness of any investment approach or security referred to for any particular investor. ERC, its affiliates and/or its clients may have an investment position in a security or strategy (or related or opposing security or strategy) discussed in this information, and may change that position without notice at any time. This material is provided for informational purposes only and is not investment advice or a recommendation for the purchase or sale of any security. The information in this document is furnished on a confidential basis exclusively for your use and retention and, by accepting this document, you agree not to transmit, reproduce or make available to any other person (other than your legal, tax, accounting and other advisers) all or any part of this document without the express written permission of ERC. This document is protected by copyright of ERC and other laws, all rights reserved. It is not intended as and does not constitute an offer to sell any securities to any person or a solicitation of any person of any offer to purchase any securities. Such an offer or solicitation can only be made by the confidential offering documents of the investment fund. This information omits most of the information material to a decision whether to invest in an investment fund. No person should rely on any information in this document, but should rely exclusively on the offering documents in considering whether to invest in an investment fund.
Performance Disclosure: The Fund’s changes in net book value are based on operations during a period of general market growth and extraordinary market volatility during part of the period, and are not necessarily indicative of results the Fund may achieve in the future. In addition, the foregoing results are based on the periods as a whole, but results for individual months or quarters within each period have been less favorable or more favorable than the average, as the case may be. The foregoing data has been prepared by the General Partner and has not been compiled, reviewed or audited by an independent accountant. The data from the current year is based on estimates by the General Partner. The results portrayed for the Fund reflect the reinvestment of dividends and other earnings and the deduction of costs, the Special Profit Allocation and the Management Fee charged by the General Partner at the 2% and 20% rates. The General Partner believes that the comparison of Fund performance to any single market index, is inappropriate. The Fund’s portfolio contains mostly biotechnology sector securities and may contain non-U.S. securities, options and other derivative securities, may include short sales of securities and margin trading and may not be as diversified as the market indices (as shown). The Russell 2000 Index is comprised of the smallest 2000 companies in the Russell 3000 Index and is generally representative of the small capitalization U.S. stock market. The Standard & Poor’s 500 Index contains 500 industrial, transportation, utility and financial companies regarded as generally representative of the large capitalization U.S. stock market. The NASDAQ Biotechnology Index, (“NBI Index”) is a modified market capitalization-weighted index designed to measure the performance of all NASDAQ stocks in the biotechnology sector. All indices are unmanaged, market weighted and reflect the reinvestment of dividends. Due to the differences among the Fund’s portfolio and the performance of the equity market indices shown above, however, the General Partner cautions potential investors that no such index is directly comparable to the investment strategy of the Fund. While the General Partner believes that in prior periods the Fund was managed with an investment philosophy and methodology similar to

EcoR1 Capital, LLC ● 409 Illinois Street, San Francisco, CA 94158 ● p. 415-448-6534 ●f. 415-952-9412
that described herein and that will be used to manage the Fund in the future, future investments will be made under different economic conditions and in different securities. The performance discussed herein does not reflect the General Partner's performance in all different economic cycles. It should not be assumed that investors will experience returns in the future, if any, comparable to those discussed above. The information given above is historic and should not be taken as any indication of future performance. Partners that do not participate in new issues would have achieved lower returns. The Fund invests in liquid and illiquid securities. Iliquid security investments generally are credited to side pockets. Generally, investors cannot withdraw any portion of their investment held in a side pocket. Also, investments in side pockets generally are excluded from Special Profit Allocation calculations until there is a liquidity event with respect to that security, the security is distributed in kind or such gains and losses are transferred to the investor’s Liquid Sub-Capital Account. Side pocket investments are difficult to value because there may not be an efficient market for those securities. The General Partner values those securities and all other Fund assets and liabilities in good faith at the end of each month, quarter and year, based on its fair value determination and analysis. The General Partner’s quarterly and annual valuation processes are more rigorous than its monthly process. This performance information includes performance for all side pockets that existed during the period shown, and assumes an investor has chosen to participate in the side pockets at up to 20% of that investor’s capital account balance. Each investor’s actual performance results may vary substantially from the performance results shown, depending, for example, on the timing of that investor’s investment, eligibility to receive new issue profits and losses, and participation in side pockets. The General Partner's analysis and projections regarding portfolio company operating and investment results are subject to many risks, uncertainties and assumptions that are difficult to predict. Therefore, actual returns from an investment in any such company could differ materially and adversely from those expressed or implied in any forward looking statements, as a result of those various factors. The General Partner's expected results and projections are provided for information regarding the General Partner's investment analysis, not as any guarantee or expectation of investment results for the Fund's investment portfolio. This document is not intended as and does not constitute an offer to sell any securities to any person or a solicitation of any person of any offer to purchase any securities. Such an offer or solicitation can only be made by the confidential Offering Circular of the Fund. This information omits most of the information material to a decision whether to invest in the Fund. No person should rely on any information in this document, but should rely exclusively on the Offering Circular in considering whether to invest in the Fund. The information in this document is furnished on a confidential basis exclusively for your use and retention and, by accepting this document, you agree not to transmit, reproduce or make available to any other person (other than your legal, tax, accounting and other advisers) all or any part of this document without the express written permission of the General Partner. This document is protected by copyright of the General Partner and other laws, all rights reserved.
i “Big Pharma’s Remedy for Beaten-Down Biotech Stocks,” Wall Street Journal, January 19, 2016. ii Hats off to Tom Roberts of Farallon for pointing out this similarity. http://canadianfinanceblog.com/is-the-current-market-a-return-to-normal/. iii Raymond James, Lipper, FactSet. iv Reuters, January 8, 2016. v Much of this content is directly from BioCentury Online Intelligence. They always have a well written summary. vi Raymond James, Lipper, FactSet.

EcoR1 Capital, LLC ● 409 Illinois Street, San Francisco, CA 94158 ● p. 415-448-6534 ●f. 415-952-9412
vii FDA Summary Report. viii Mark Schoenbaum, Evercore/ISI.