economy and labour market -...
TRANSCRIPT

www.aragon.es/iaest
ECONOMY AND LABOUR MARKET
› GDP, INCOME AND INTERNATIONAL TRADE
› ENTERPRISES
› LABOUR MARKET
› CONSUMER PRICES. CPI
› AGRICULTURE AND LIVESTOCK
› ENERGY
› INDUSTRY
› CONSTRUCTION
› SERVICES
› TRADE
› TOURISM
› TRANSPORT

ARAGON BASIC DATA, 2017 · Instituto Aragonés de Estadística
GDP, INCOME AND INTERNATIONAL TRADE
Gross domestic product (GDP) and Gross disposable income (GDI)GDP and GDI. Aragon.
Million euros
Variation rate* (%) Euros
Variation rate (%)
2014 32,737 1.10 24,646 0.93
2015 33,689 2.37 25,488 3.42
2016 34,687 2.72 26,328 3.30
* Volume variation rate.
Million euros
Variation rate (%) Euros
Variation rate (%)
2012 20,728 -3.19 15,461 -2.90
2013 20,443 -1.38 15,319 -0.92
2014 20,343 -0.49 15,315 -0.03
Aragon SpainEuropean
UnionGross domestic product (million euros), 2016*. 34,687 1,113,851 14,710,625
Gross domestic product per capita (euros), 2016*. 26,328 23,970 28,900
Gross disposable income (million euros), 2014. 20,343 658,097 -
Gross disposable income per capita (euros), 2014. 15,315 14,166 -
"-": non available data. "*" 2015Sources: Contabilidad Regional de España (base 2010) INE and IAEST according to data from Eurostat.
GDP and GDI. Aragon, Spain and European Union (EU-28).
GDP components. Aragon, 2016.
Gross domestic product
Gross disposable income
GDP components. Spain, 2016.
Gross disposable income: itmeasures the available income of aterritory residents to be devoted toconsumption or saving.
Gross domestic product per capita
Gross domestic product: economic activity indicator, it's the value of everyfinal goods produced in a region minusthe goods and services used toproduce them.
Gross disposable income per capita
Agriculture3%
Energy3%
Industry13%
Construction5%
Services67%
Taxes on products9%Agriculture
5%
Energy4%
Industry18%
Construction5%
Services59%
Taxes on products9%
www.aragon.es/iaest
66

ARAGON BASIC DATA, 2017 · Instituto Aragonés de Estadística
GDP, INCOME AND INTERNATIONAL TRADE
Gross domestic product
Activity rangesMillion euros
Share of total
Million euros
Share of total
Agriculture and fishing 1,790 5.2 26,028 2.3
Extraction industry; manufacture industry; electrical energy, gas, steam and air conditioning supply; water supply, sanitation activities, waste management and decontamination
7,605 21.9 179,527 16.1
Of which: Manufacture industry 6,187 17.8 142,968 12.8
Construction 1,824 5.3 56,540 5.1
Wholesale and retail trade; motor vehicles and motorbikes repair; transport and storage; hotel industry 6,389 18.4 236,475 21.2
Information and communications 815 2.3 41,962 3.8
Financial and insurance activities 1,134 3.3 39,618 3.6
Real estate 3,043 8.8 110,781 9.9
Professional, scientific and technical activities; administration and auxiliary services 1,688 4.9 88,380 7.9
Public administration and defense; mandatory social security; education; health care and social service activities 6,180 17.8 191,047 17.2
Artistic, recreational and leisure activities; domestic appliances repair and other services 1,016 2.9 40,648 3.6
Total gross value added 31,484 90.8 1,011,006 90.8
Net taxes over products 3,203 9.2 102,845 9.2
Gross domestic product at market prices 34,687 100.0 1,113,851 100.0Source: Instituto Aragonés de Estadística according to Contabilidad Regional de España (base 2010). INE.
Aragon sectorial share over Spain. 2016.
GDP at market prices by activity, 2016.
Aragon Spain
6,9%
3,9% 4,3%3,2% 2,7%
0%
1%
2%
3%
4%
5%
Agriculture Energy Industry Construction Services
Aragon represents 3,11% of Spanish GDP.
www.aragon.es/iaest
67

ARAGON BASIC DATA, 2017 · Instituto Aragonés de Estadística
GDP, INCOME AND INTERNATIONAL TRADE
Exports and expeditions Imports and introductions
Million euros Percentage Million euros Percentage
Total 10,865.82 100.00 Total 10,393.84 100.00
Europe 8,372.31 77.05 Europa 6,497.13 62.51
EU-28 7,786.18 71.66 UE28 5,598.45 53.86
France 1,814.85 16.70 Germany 1,551.56 14.93
Germany 1,606.24 14.78 Turkey 747.11 7.19
Italy 1,141.87 10.51 France 742.85 7.15
Asia 1,224.89 11.27 Asia 2,708.67 26.06
China 300.05 2.76 China 1,538.47 14.80
Saudi Arabia 164.42 1.51 South Korea 370.46 3.56
Africa 437.04 4.02 África 934.36 8.99
Morocco 175.59 1.62 Morocco 819.97 7.89
Algeria 143.21 1.32 Egypt 37.81 0.36
America 763.68 7.03 America 252.67 2.43
USA 293.47 2.70 USA 141.14 1.36
Mexico 126.43 1.16 Mexico 38.05 0.37
Other 67.90 0.62 Other 1.01 0.01
Main products. Aragon, 2016.Unit: million euros.
Source: Instituto Aragonés de Estadística with data from Cámara de Comercio and Agencia Tributaria.
Goods international tradeMain customers. Aragon, 2016.
Main suppliers. Aragon, 2016.
3.652
845
23
1.252
1.264
1.637
1.722
3.335
506
622
749
930
1.126
3.597
Rest of products
Knitwear clothes and accessories
Meat and edible offal
Clothes and accessories, except knitwear
Machinery and electrical devices
Machinery and mechanical devices, nuclearreactors, boilers
Motor cars, tractors, motorbikes
Exports Imports
www.aragon.es/iaest
68

ARAGON BASIC DATA, 2017 · Instituto Aragonés de Estadística
GDP, INCOME AND INTERNATIONAL TRADE
Unit: exports/imports*100
Unit: million euros.
Evolution of goods international trade. Aragon.
Coverage ratio by continents. Aragon, 2016.
Source: Instituto Aragonés de Estadística with data from Cámara de Comercio and Agencia Tributaria.
Goods international trade includes exclusively the intracommunity trade(European Union countries) and the extracommunity trade (rest of countries), butit excludes the operations between Aragon and other Spanish AutonomousCommunities (interregional trade).
Goods international trade
0
2.000
4.000
6.000
8.000
10.000
12.000
2000
2001
2002
2003
2005
2006
2007
2008
2008
2009
2010
2011
2012
2013
2014
2015
2016
Export Import
Coverage rate=100104,54128,86
45,22 46,77
302,24
Total Europe Asia Africa America
www.aragon.es/iaest
69

ARAGON BASIC DATA, 2017 · Instituto Aragonés de Estadística
ENTERPRISES
Enterprises
Unit: number of enterprises.
Activity branches according to CNAE-2009 TotalNo.
employees1
to 910
to 49 50
to 199
200andover
Total enterprises 90,325 48,641 37,553 3,496 520 115Industry and Energy 6,513 2,197 3,159 937 180 40Of which: Manufacture industry 5,630 1,798 2,746 878 170 38Food, beverages and tobacco 988 244 524 185 32 3Textile, manufacture, leather and footwear 499 236 196 65 2 0Wood and cork, paper and graphic arts 678 254 353 59 10 2Cokery and oil refinery; chemical and pharmaceutical industry 149 35 54 45 10 5
Rubber and plastic products and various non-metallic ore products 419 110 203 81 23 2
Manufacture of metal products, except machinery and equipment 1,318 382 727 179 27 3
Electrical, electronic, computer and optical material and equipment; machinery and mechanical equipment
522 122 228 131 31 10
Transport material 150 25 52 39 24 10Furniture and various manufacturing industries, repair and installation of machinery and equipment 907 390 409 94 11 3
Construction 12,422 7,831 4,188 370 33 0Services 71,390 38,613 30,206 2,189 307 75Wholesale trade and retail sale; vehicles and motorbikes repair 19,771 9,317 9,744 641 55 14
Transport and storage 5,883 3,546 2,064 229 35 9Hotel industry 7,727 2,577 4,923 197 26 4Information and communications 1,172 683 400 71 15 3Financial and insurance activities 2,157 1,580 555 18 1 3Real state activities 4,878 3,625 1,230 17 4 2Technical, scientific and professional activities; administrative and auxiliary activities 14,513 8,963 5,103 391 43 13
Education 2,820 1,644 985 134 46 11Healthcare ans social service activities 4,034 2,390 1,362 219 54 9Artistic, recreational and leisure activities; household appliance repair and other services 8,435 4,288 3,840 272 28 7
Source: Instituto Aragonés de Estadística, with data from Directorio Central de Empresas. Instituto Nacional de Estadística.
Enterprises by main activity and employees range. Aragon, 1st January 2016.
www.aragon.es/iaest
70

ARAGON BASIC DATA, 2017 · Instituto Aragonés de Estadística
ENTERPRISES
Enterprises
TotalNo.
employees1
to 910
to 49 50
to 199200
and overAragon 90,325 48,641 37,553 3,496 520 115
Huesca 16,396 8,401 7,260 660 68 7
Teruel 9,274 4,748 4,206 293 21 6
Zaragoza 64,655 35,492 26,087 2,543 431 102
Source: Instituto Aragonés de Estadística, with data from Directorio Central de Empresas. Instituto Nacional de Estadística.
TotalNo.
employees1
to 910
to 49 50
to 199200
and overTotal premises 103,558 56,067 42,273 4,401 665 152
Industry and Energy 7,613 2,742 3,568 1,039 210 54
Construction 13,501 8,663 4,435 374 28 1
Services 82,444 44,662 34,270 2,988 427 97
Source: Instituto Aragonés de Estadística, with data from Directorio Central de Empresas. Instituto Nacional de Estadística.
Unit: percentage.
Enterprises Premises
Source: Instituto Aragonés de Estadística, with data from Directorio Central de Empresas. Instituto Nacional de Estadística.
Enterprises and premises by legal condition. Aragon, 1st January 2016.
Enterprises by province and employees range. Aragon, 1st January 2016.
Premises by main activity and employees range. Aragon, 1st January 2016.
Unit: number of enterprises.
Unit: number of premises.
2.7%
33.3%
49.7%
14.4%
Public limited company
Private limited company
Physical persons
Other
6.2%
36.9%
43.5%
13.4%
agon.es/iaest
71

ARAGON BASIC DATA, 2017 · Instituto Aragonés de Estadística
LABOUR MARKET
Labour activity
Unit: 1,000 persons.
Public sector Employees (99.9)
(455.0) Private sector(355.1)
Unemployed who have worked previously (86.2)
First job seekers (9.6)
Students (68.7)
Retired (238.1)
Houseworkers (100.3)
Permanently disabled (33.7)
Other (4.3)
Source: Instituto Aragonés de Estadística with data from Encuesta de Población Activa. Instituto Nacional de Estadística.
Cooperatives' members and other(2.0)
Unemployed(95.8)
Percentage distribution. Aragon.
Inactive (445.2)
Populationa aged16 years old and over(1,094.9)
Percentage distribution. Spain.
Distribution of population aged 16 years old and over by activity. Aragon, annual mean 2016.
Employer(96.7)
Employed(553.9)
Self-employed (98.7)
Active (649.7)
Active59.3%
Inactive40.7%
Employed85.3%
Unemployed
14.7%
Active59.2%
Inactive40.8%
Employed80.4%
Unemployed
19.6%
www.aragon.es/iaest
72

ARAGON BASIC DATA, 2017 · Instituto Aragonés de Estadística
LABOUR MARKET
Active population
Unit: 1,000 persons and percentage.
Men % Women % Men % Women %Total 308.6 100.0 245.3 100.0 42.5 100.0 53.3 100.0 Agriculture 29.3 9.5 6.5 2.6 3.5 8.2 1.1 2.1 Industry 83.2 27.0 22.0 9.0 3.1 7.3 2.1 3.9 Construction 30.0 9.7 2.5 1.0 2.8 6.6 0.1 0.2 Services 166.1 53.8 214.3 87.4 9.4 22.1 18.6 34.9 No previous job - - - - 23.8 56.0 31.4 58.9
* Only the unemployed persons who lost their last job in the last 12 months are classified by economic sector.Source: Instituto Aragonés de Estadística with data from Encuesta de Población Activa. Instituto Nacional de Estadística.
Men % Women % Men % Women %Total 308.6 100.0 245.3 100.0 42.5 100.0 53.3 100.0 16 to 19 years old 1.4 0.5 1.3 0.5 1.9 4.5 1.6 3.0 20 to 24 years old 12.7 4.1 10.5 4.3 5.8 13.6 5.7 10.7 25 to 54 years old 237.3 76.9 190.9 77.8 30.0 70.6 39.8 74.7 55 years old and over 57.2 18.5 42.6 17.4 4.9 11.5 6.2 11.6 Source: Instituto Aragonés de Estadística with data from Encuesta de Población Activa. Instituto Nacional de Estadística.
Unit: percentage.
Aragon SpainEmployment rate 50.6 47.6 Unemployment rate 14.7 19.6 Juvenile unemployment rate 36.7 44.5 Long-term unemployed 53.7 57.3 Source: Instituto Aragonés de Estadística with data from EPA. INE.
Employment and unemployment rates.
Employed and unemployed by age group and sex.
Employed Unemployed
Employment rate: employed over population aged16 years old and over.Unemployment rate: unemployed over activepopulation.Juvenile unemployment rate: unemployment rateof those aged 15 to 24 years old.Long-term unemployed: percentage of thosewho've been unemployed for more than 12 monthsover total unemployed.
UnemployedEmployed
Active population features. Aragon, annual mean 2016.
Employed and unemployed by activity sector and sex.
Employed Unemployed*
Agriculture6.5%
Industry19.0%
Construction5.9%
Services68.7%
Agriculture3.9%
Industry4.9%
Construction2.1%
Services31.1%
No previous job
58.0%
www.aragon.es/iaest
73

ARAGON BASIC DATA, 2017 · Instituto Aragonés de Estadística
LABOUR MARKET
Labour activity and households income
Unit: 1,000 households.
Total Households 537.8
With income 523.3
No income 14.6
Active households 383.6
All members employed 301.7
At least 1 employed and 1 unempl. 53.1
All members unemployed 28.8
With income 19.3
No income 9.5
Inactive households 154.2
With income 149.2
No income 5.0
Households with no income. Aragon. Quarterly evolution.
Households with all active members unemployed. Aragon. Quarterly evolution.
Source: Instituto Aragonés de Estadística with data from Encuesta de Población Activa (EPA), INE.
Household: set of people who live in the same dwelling.Active household: household whose members are employed and/or unemployed. Inactive household: household with no employed nor unemployed members but at least one labourinactive (student, retired, etc)Income: flow of cash or cash-equivalents received from work (wage or salary), business income,retirement or disability pension and unemployment benefit.
Source: Instituto Aragonés de Estadística with data from Encuesta de Población Activa (EPA), INE.
Households according to the situation of their members regarding labour activity and existence of income. Aragon. Annual mean 2016.
All membersemployed56.1%
At least 1 employed and 1 unemployed9.9%
All members unemployed5.4%
Inactive households28.7%
17.611219.9507
16.884214.3017 16.2121 16.9529 16.3898
12.0753 12.8087
Q4 2014 Q1 2015 Q2 2015 Q3 2015 Q4 2015 Q1 2016 Q2 2016 Q3 2016 Q4 2016
35.9503 37.084031.7141 29.4085 28.5433
32.3699 28.9474 28.3112 25.6207
Q4 2014 Q1 2015 Q2 2015 Q3 2015 Q4 2015 Q1 2016 Q2 2016 Q3 2016 Q4 2016
www.aragon.es/iaest
74

ARAGON BASIC DATA, 2017 · Instituto Aragonés de Estadística
LABOUR MARKET
Household unemployment
Unit: 1,000 households and percentage.
Households with all active members unemployed 28.8
Percentage over total households (%) 5.36
Family unemployment incidence (1) 21.34
Family unemployment rate (2) 7.51
Family unemployment rate and incidence. Aragon. Quarterly evolution.Unit: percentage.
Source: Instituto Aragonés de Estadística with data from Encuesta de Población Activa (EPA), INE.
(1) Family unemployment incidence: Percentage of households with unemployed members (households with at least one unemployed + households with all active members unemployed) over total active households (households with at least one employed member + households with all active members unemployed).(2) Family unemployment rate: Percentage of households with all active members unemployed over total active households (households with at least one employed member + households with all active members unemployed).
Households with all active members unemployed, family unemployment incidence and family unemployment rate. Aragon. Annual mean 2016.
Source: Instituto Aragonés de Estadística with data from Encuesta de Población Activa (EPA), INE.
9.3873 9.7143 8.1899 7.6827 7.5014 8.4038 7.5704 7.3757 6.6872
25.6 26.0 24.322.2 21.6 21.7 22.0 21.5 20.1
Q4 2014 Q1 2015 Q2 2015 Q3 2015 Q4 2015 Q1 2016 Q2 2016 Q3 2016 Q4 2016
Family unemployment rate
Family unemployment incidence
www.aragon.es/iaest
75

ARAGON BASIC DATA, 2017 · Instituto Aragonés de Estadística
LABOUR MARKET
Registered unemployment
Registered unemployment by sex. Aragon. Unit: number of persons.
Total Men Women
Year 2016 (annual mean) 83,314 36,428 46,886
Registered unemployment by activity sector. Aragon. Unit: number of persons.
Total Agriculture Industry Construction ServicesNo previous
job (N.P.J.)
Year 2016 (annual mean) 83,314 5,212 9,691 7,124 53,850 7,437
Source: Servicio Público de Empleo Estatal.
Registered unemployment: people registered at public employment service as job seekers, meetingcertain features. This way, 'registered unemployment' data are the result of data-mining an administrativefile that includes these registered persons.
010,00020,00030,00040,00050,00060,00070,00080,000
2007
2008
2009
2010
2011
2012
2013
2014
2015
2016
Persons
Year
Agriculture Industry Construction Services N.P.J.
0
10,000
20,000
30,000
40,000
50,000
60,000
2007
2008
2009
2010
2011
2012
2013
2014
2015
2016
Persons
Year
Men Women
www.aragon.es/iaest
76

ARAGON BASIC DATA, 2017 · Instituto Aragonés de Estadística
LABOUR MARKET
Unit: affiliation.
Total GeneralSelf-
employedMining
industryTotal 534,589 428,769 105,575 244
Men 290,486 221,017 69,238 230
Women 244,103 207,752 36,337 13
Unit: percentage.
Unit: affiliation.
Total GeneralSelf-
employedMining
industryTotal 65,478 56,772 8,643 62
European Union 35,384 31,176 4,146 61
Other countries 30,094 25,596 4,497 1
Source: Instituto Aragonés de Estadística with data from Tesorería General de la Seguridad Social.
Unit: number of contracts and percentage.
Men % Women %Total contracts 313,457 100.0 252,214 100.0
Indefinite contract 25,791 8.2 21,647 8.6
Temporary contract 287,666 91.8 230,567 91.4
1 - 6 -
Source: Instituto Aragonés de Estadística with data from Instituto Aragonés de Empleo.
Registered contracts by duration and sex. Aragon, 2016.
Adscription in social collaboration
Affiliations to Social Security by affiliation regime and sex. Aragon. Annual mean 2016.
Affiliations to Social Security by type of contract, work day and sex. Aragon. Annual mean 2016.
Affiliation to Social Security
Contracts
The addition of percentages is not 100% because there're affiliated whose type of contract and/or work day were not registered.
Foreign affiliations by origin and affiliation regime. Aragon, annual mean 2016.
* Adscriptions in social collaboration are not considered as contracts, so they're not included in Total contracts.
8.4%
91.6%
Indefinite contract
Temporary contract
63.4%
28.9%
59.1%
29.1%
Indefinite
Temporary
78.0%
14.3%
52.3%
35.9%
Full workday
Part-timework day
Men Women
www.aragon.es/iaest
77

ARAGON BASIC DATA, 2017 · Instituto Aragonés de Estadística
LABOUR MARKET
Unit: persons and euros.
Total Men Women Unit: euros.
Employed 551,704 301,246 250,458
Annual average wage 19,041 21,444 16,150
Unemployed 127,640 68,969 58,671
Annual average benefit 3,074 3,164 2,968
Pensioner 324,679 169,063 155,616
Annual average pension 14,396 17,089 11,470
Source: Agencia Tributaria.
Unit: euros.
By workerand month % %
Total labour cost 2,522.24 100.0 20.41 100.0
Wage cost 1,911.01 75.8 15.46 75.7
Other costs 611.23 24.2 4.95 24.3
Source: Encuesta trimestral de coste laboral. Instituto Nacional de Estadística.
Unit: percentage.
Source: Encuesta anual de coste laboral. Instituto Nacional de Estadística.
Received wages. Aragon, 2015.
Labour cost structure. Aragon, 2015.
WagesAverage pensions. Aragon, 2015.
Byeffective
hour
Labour cost by worker and month and effective hour. Aragon, 4th quarter 2016.
Source: Ministerio de Empleo y Seguridad Social.
1,060
1,005
655
404
Retirement
Permanentdisability
Widowhood
Orphanedand Family…
Wages and salaries; 73.6
Compulsory contributions; 23.4
Other; 3.0
0.4
0.6
0.
0.2
0.1
0.1
0.7
Voluntary contributions
Direct corporate benefits
Compensation for dismissal
Expense in vocational training
Transport costs
Social expenses
Other
www.aragon.es/iaest
78
ARAGON BASIC DATA, 2017 · Instituto Aragonés de Estadística
LABOUR MARKET
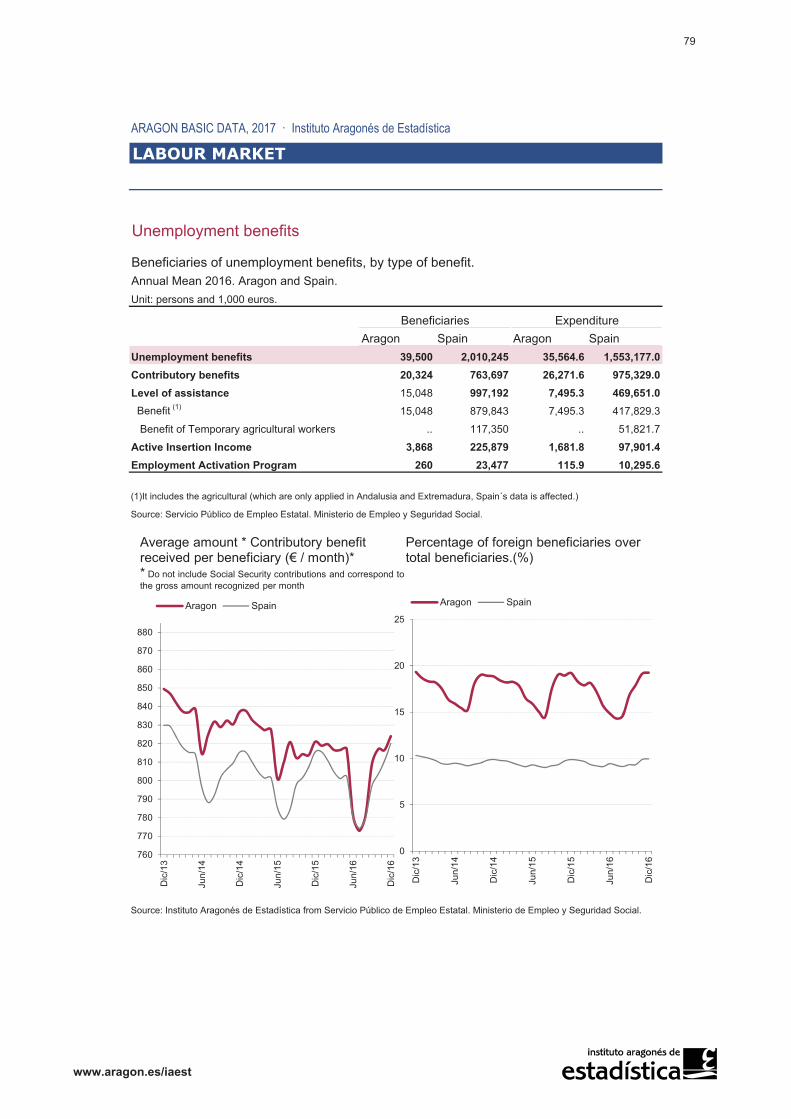
Unemployment benefits
Unit: persons and 1,000 euros.
Aragon Spain Aragon SpainUnemployment benefits 39,500 2,010,245 35,564.6 1,553,177.0Contributory benefits 20,324 763,697 26,271.6 975,329.0Level of assistance 15,048 997,192 7,495.3 469,651.0 Benefit (1) 15,048 879,843 7,495.3 417,829.3
Benefit of Temporary agricultural workers .. 117,350 .. 51,821.7
Active Insertion Income 3,868 225,879 1,681.8 97,901.4Employment Activation Program 260 23,477 115.9 10,295.6
Source: Servicio Público de Empleo Estatal. Ministerio de Empleo y Seguridad Social.
Source: Instituto Aragonés de Estadística from Servicio Público de Empleo Estatal. Ministerio de Empleo y Seguridad Social.
Annual Mean 2016. Aragon and Spain.
(1)It includes the agricultural (which are only applied in Andalusia and Extremadura, Spain´s data is affected.)
Beneficiaries of unemployment benefits, by type of benefit.
Beneficiaries Expenditure
760
770
780
790
800
810
820
830
840
850
860
870
880
Dic
/16
Jun/
16
Dic
/15
Jun/
15
Dic
/14
Jun/
14
Dic
/13
Aragon Spain
Average amount * Contributory benefit received per beneficiary (€ / month)** Do not include Social Security contributions and correspond to the gross amount recognized per month
0
5
10
15
20
25
Dic
/16
Jun/
16
Dic
/15
Jun/
15
Dic
/14
Jun/
14
Dic
/13
Aragon Spain
Percentage of foreign beneficiaries over total beneficiaries.(%)
www.aragon.es/iaest
79

ARAGON BASIC DATA, 2017 · Instituto Aragonés de Estadística
LABOUR MARKET
Labour accidents
Total Agriculture Industry Construction ServicesTotal accidents with leave 15,640 1,149 4,247 1,375 8,869
Slight 15,521 1,133 4,219 1,358 8,811
Serious 94 13 25 15 41
Deadly 25 3 3 2 17
Source: Instituto Aragonés de Seguridad y Salud Laboral. Dirección General de Trabajo
Labour market outflow
Unit: persons.
Number of affected workers 11,028
By expiry 624 xpiry
By suspension 10,094 nsion
By working day reduction 310 ction
504 2,200
225 22,356.6
19,794.1Agreed average amount (€)
Dismissal policy
Source: Boletín de Estadísticas Laborales. Ministerio de Empleo y Seguridad Social.
Dismissal policy
Recognized amount (1,000 €)Compromised dismissal
Completed judicial issues.Aragon, 2016.
Individual conciliations. Aragon, 2016.
Employment Regulation Orders. Aragon, 2016.
Accidents with leave evolution. Aragon.
Seriousness of labour accidents by activity sector. Aragon, 2016.
* Due to legal reguations, statistics about the number of authorized orders can no longer be offered.
0
5,000
10,000
15,000
20,000
2010 2011 2012 2013 2014 2015 2016
At workplace In itinere
Expiry5.7%
Suspension91.5%
Working day reduction2.8%
www.aragon.es/iaest
80

ARAGON BASIC DATA, 2017 · Instituto Aragonés de Estadística
CONSUMER PRICES. CPI.
Consumer Price Index. Base 2011.
Unit: percentage. Unit: percentage.Spain 1.4Euro area 1.1European Union 28 1.2
Source: Índice de Precios de Consumo. Base 2011. INE.
Unit: percentage.
Unit: percentage.Fresh potatoes and potatoes preparations 13.3 Heating, lighting and water supply -9.3Oils and fats 12.9 Recreational items -4.4Fresh and frozen fish 6.0 Milk -3.6Canned and dried fruit 4.3 Sheep meat -3.5Fresh fruits 4.1 Eggs -2.7Crustaceans, molluscs and fish based products 3.0 Poultry meat -2.0Communications 2.6 Maintenance of the dwelling -1.6Medical and a like services 2.2 Interurban public transport -1.4Repair of footwear 1.9 Bread -1.2Accessories and repairs of clothing 1.8 Sugar -0.9Source: Índice de Precios de Consumo. Base 2011. INE.
CPI headings with largest upward and downward variations. Aragon. Annual average 2016.
Overall, core and consumer groups inflation rate. Aragon. Annual average 2015.Annual average change of CPI.
Inflation context, 2016.Annual change of HICP at December.
Inflation evolution. Annual change of CPI at December.
Source: Índice de Precios de Consumo Armonizado. Base 2005. INE, Eurostat.
-0.30.7
1.40.4
0.7
-5.20.4
0.7
-1.22.6
-1.6
1.0
1.01.6
Overall Core
Food and non-alcoholic beverages Alcoholic beverages and tobacco
Clothing and footwear Housing Furniture and household equipment
Health Transport
Communications Recreation and culture Education
Restaurants, cafes and hotels Miscellaneous goods and services
0.2
-1.2-0.1
1.600
-01
0002
2013 2014 2015 2016
Aragón
España
www.aragon.es/iaest
81

ARAGON BASIC DATA, 2017 · Instituto Aragonés de Estadística
AGRICULTURE AND LIVESTOCK
Agriculture and livestock
Unit: million current euros.
2016 A 2015 P
Aragon Spain Aragon SpainTotal Agriculture output 3,861.9 46,807.2 3,521.1 45,490.8
Total external expense 2,209.1 21,310.3 1,915.6 21,495.5
Gross Value Added 1,652.8 25,496.9 1,605.5 23,995.3
Other subsidies* 383.3 5,804.7 382.9 5,673.2
Amortizations 256.6 5,251.5 280.7 5,281.4
Taxes 24.9 362.4 22.7 347.0
Net Value Added (Agriculture Income) 1,754.5 25,687.7 1,685.1 24,040.1A Advance data P Provisional data.
Source: Contabilidad Regional de España. INE. Advance data.
Fuente: Departamento de Desarrollo Rural y Sostenibilidad. Gobierno de Aragón.
Source: Encuesta sobre la estructura de las explotaciones agrícolas, 2013. Instituto Nacional de Estadística.
Agriculture and livestock main economic indicators.
Share of animal output on final agricultural output. Aragon.
Share on GDP. Aragon, 2016.
Source: Departamento de Desarrollo Rural y Sostenibilidad, Gobierno de Aragón. Ministerio deAgricultura, Alimentación y Medio Ambiente.
* Compensations to disadvantaged areas are included, and also incentives to certified baseseed production, compensations to compulsory slaughters, bonuses in interests for the firstfacility of young farmers, etc. Incentives to agrifood industries and dry fodders (lucerne) are notincluded.
0%
25%
50%
75%
100%
1990
1991
1992
1993
1994
1995
1996
1997
1998
1999
2000
2001
2002
2003
2004
2005
2006
2007
2008
2009
2010
2011
2012
2013
2014
2015
2016
948,868
49,059
Spain
Aragon
Number of agricultural holdings, 2013.
24.67
46.38
Spain
Aragon
Average utilised agricultural area in agricultural holdings, 2013.Unit: hectares.
Agriculture and livestock5.2%
Other94.8%
www.aragon.es/iaest
82

ARAGON BASIC DATA, 2017 · Instituto Aragonés de Estadística
AGRICULTURE AND LIVESTOCK
Agriculture and livestock
Types of livestock Aragon SpainPigs(1) 7,047,770 29,231,640Cattle(1) 345,830 6,254,500Sheep(1) 1,736,400 15,962,890Goats(1) 56,310 3,088,040Equine(2) 17,798 632,366Egg-laying chickens(3) 5,213,858 46,524,000Beehives(3) 114,144 2,775,149
Organic farming, 2015.Crops Tonnes Aragon SpainCereals 3,855,867 Number of operators 771 39,653
Forage plants 1,268,102 Growers 645 34,673Fruit trees 689,380 Manufacturers 106 3,539Horticultural 311,116 Importers/Exporters 4 238Industrial plants 200,053 Marketers 16 1,203Legumes and proteaginous 74,496 Total registered area (ha.) 51,832 1,968,570Olive 48,176 Qualified as organic farming 43,511 1,410,531Root vegetables 31,109 Qualified as in conversion 2,337 104,197Vineyard 16,432 Qual. as 1st year in practise 5,984 453,842A Advance data. Number of livestock holdings 29 7,553
Unit: 1,000 hectares.
A Advance data.Source: Departamento de Desarrollo Rural y Sostenibilidad. Gobierno de Aragón.
(1) Surveys at Nov 2016. (2) Data at Dec 1st 2016. (3) Data at 2015.Source: Ministerio de Agricultura, Alimentación y M. Ambiente.
Source: Ministerio de Agricultura, Alimentación y Medio Ambiente.
Livestock, 2016.Unit: number of heads.
Crops. Aragon, 2016A.Total area: 1,285,489 hectares.
Source: Ministerio de Agricultura, Alimentación y Medio Ambiente. Source: Ministerio de Agricultura, Alimentación y Medio Ambiente.
Irrigated area by category. Aragon.
Crop output. Aragon, 2016A.
Source: Departamento de Desarrollo Rural y Sostenibilidad. Gobierno de Aragón.
Agriculture on greenhouse gas emissions. Aragon. Average 1990-2015.
Cereals70.46%
Legumes and proteaginous2.18%
Industrial plants1.61%
Root-vegetables0.04%
Forage plants10.78%
Horticultural0.95%
Fruit trees7.78%
Vineyard2.66%
Olive3.54%
0100200300
2003
2004
2005
2006
2007
2008
2009
2010
2011
2012
2013
2014
2015
Gravity SprinklingAuto-motive Drip
Agriculture16.49%
Other83.51%
www.aragon.es/iaest
83

ARAGON BASIC DATA, 2017 · Instituto Aragonés de Estadística
ENERGY
Energy sector
Primary energy consumption. Aragon, 2015.
Consumption %
Interannualvariation (%)
2014-2015Total 4,903 100 -1.2
Natural gas 1,132 23.1 3.3
Oil products 1,588 32.4 2.5
Renewable energy 1,056 21.5 -3.4
Coal 1,128 23.0 -8.3Source: Contabilidad Regional de España. INE.
Primary energy consumption. Aragon.Unit: 1,000 tonnes of oil-equivalent (ktoe). Unit: percentage.
Source: Boletín de Coyuntura Energética en Aragón. Source: Ministerio de Industria, Turismo y Comercio, and Gobierno de Aragón.
Share of energy on GDP. Aragon, 2016.
Primary energy is the energy found in nature that has not been subjected to any conversion ortransformation process, for example, coal, oil, biomass, etc.
Unit: 1,000 tonnes of oil-equivalent (ktoe).
Source: Instituto Aragonés de Estadística with data from Boletín de CoyunturaEnergética en Aragón. Gobierno de Aragón.
External energy dependence degree.
0
1,000
2,000
3,000
4,000
5,000
6,000
7,000
2000
2001
2002
2003
2004
2005
2006
2007
2008
2009
2010
2011
2012
2013
2014
2015
Renewables (hydro, wind, biomass, other)
Coal
Natural gas
Oil products
50
75
100
2000
2001
2002
2003
2004
2005
2006
2007
2008
2009
2010
2011
2012
2013
2014
2015
Spain
Aragon
Energy4.1%
Other95.9%
www.aragon.es/iaest
84
ARAGON BASIC DATA, 2017 · Instituto Aragonés de Estadística
ENERGY
Energy sector
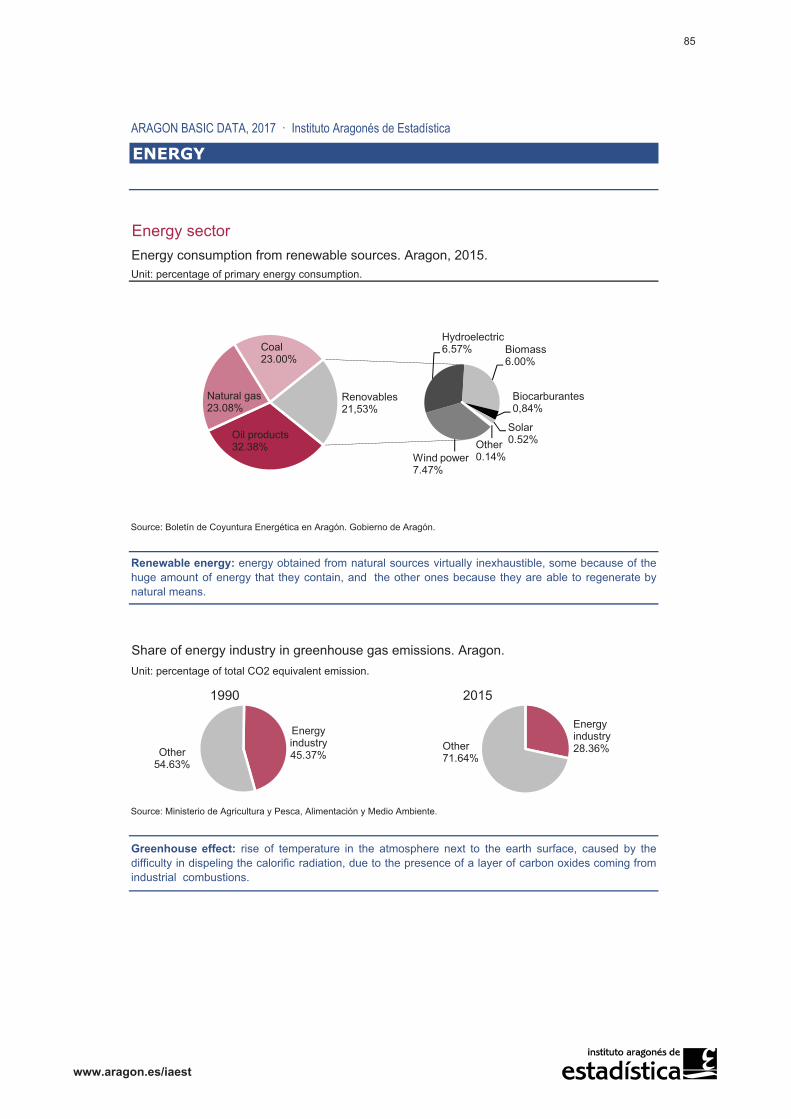
Unit: percentage of primary energy consumption.
Source: Boletín de Coyuntura Energética en Aragón. Gobierno de Aragón.
Unit: percentage of total CO2 equivalent emission.
1990 2015
Source: Ministerio de Agricultura y Pesca, Alimentación y Medio Ambiente.
Energy consumption from renewable sources. Aragon, 2015.
Renewable energy: energy obtained from natural sources virtually inexhaustible, some because of thehuge amount of energy that they contain, and the other ones because they are able to regenerate bynatural means.
Share of energy industry in greenhouse gas emissions. Aragon.
Greenhouse effect: rise of temperature in the atmosphere next to the earth surface, caused by thedifficulty in dispeling the calorific radiation, due to the presence of a layer of carbon oxides coming fromindustrial combustions.
Energy industry45.37%Other
54.63%
Oil products32.38%
Natural gas23.08%
Coal23.00%
Wind power7.47%
Hydroelectric6.57% Biomass
6.00%
Biocarburantes 0,84%
Solar0.52%Other
0.14%
Renovables21,53%
Energy industry28.36%Other
71.64%
www.aragon.es/iaest
85

ARAGON BASIC DATA, 2017 · Instituto Aragonés de Estadística
ENERGY
Energy consumption
Unit: 1,000 oil-equivalent tonnes. Unit: oil-equivalent tonnes.
Oil products consumption. Aragon.
Unit: tonnes. Unit: tonnes.
Final energy is primary energy and secondary or derived energy, once they arrive to the consumptionpoints, then they are named final energy. These consumption points are intregrated by every sectors:agriculture, industry and tertiary sector, including households and transport consumption.
Final energy consumption by economic sectors and type of fuel. Aragon, 2015.
Natural gas consumption. Aragon.
Source: Boletín de Coyuntura Energética en Aragón. Gobierno de Aragón.
LPGs, kerosenes and fuel oils.Petrols and diesels.
Source: Instituto Aragonés de Estadística with data from Ministerio de Industria, Energía y Turismo. Source: Comisión Nacional de la Energía.
0
250,000
500,000
750,000
1,000,000
1998 2007 2011 2013 2015
Petrols
Diesel type C (heating)
Diesel type A (transport)
Diesel type B (agriculture and fishing)
0
200
400
600
800
1,000
Industry Transport Households,commerce
and services
Agriculture
Heat
Biomass, thermo-solar,biofuels and othersCoal
Natural gas
Oil products
Electrical energy
872,660
1,013,983
1,626,765
1,403,238
1,217,6981,104,490
1,131,611
1998 2003 2007 2012 2013 2014 2015
0
20,000
40,000
60,000
80,000
100,000
2003 2011 2013 2015
Kerosenes
Fuel oils
LGPs (butane. propane)
www.aragon.es/iaest
86

ARAGON BASIC DATA, 2017 · Instituto Aragonés de Estadística
ENERGY
Electrical energyInstalled electrical power. Aragon.Unit: percentage over total power.
Total power at 2015P: 7,156 megawatts (MW)
Total power at 2014: 7,217 megawatts (MW)
P Provisional data.
Source: Informe del Sistema Eléctrico Español. Red Eléctrica Española (REE).
Unit: percentage over total power.
Total generated energy in 2015P: 15,496 gigawatts-hour (GWh)
Total generated energy in 2014: 16,534 gigawatts-hour (GWh)
P Provisional data.
Source: Informe del Sistema Eléctrico Español. Red Eléctrica Española (REE).
Generated electrical energy by technology. Aragon.
01
30
24
14
26
02
02
01
29
22
17
27
02
02
Combined cycle
Coal thermal power
Hydroelectric
Cogeneration and other
Wind power
Solar photovoltaic
Wastes and otherrenewable
2015
2014
26
15
22
08
25
02
01
26
15
22
08
25
02
01
Combined cycle
Coal thermal power
Hydroelectric
Cogeneration and other
Wind power
Solar photovoltaic
Wastes and otherrenewable
2015
2014
www.aragon.es/iaest
87

ARAGON BASIC DATA, 2017 · Instituto Aragonés de Estadística
INDUSTRY
Industry sector
Industry main economic variables. Aragon, 2014.
Interannual variation (%)
Number of companies 6,677
Financial turnover 24,645,037
Gross value added (bp) 5,703,555
Gross operating surplus 2,602,483
Personnel expenses 3,101,073
Employed persons 85,099Regional de España. INE.
Companies by sectors. Aragon, 2014.
Employed
personsFinancialturnover
Grossvalue
added (bp)Total 85,099 24,645,037 5,703,555
Extractive industries, energy, water and waste 7,169 3,589,567 1,204,203
Food, beverages and tobacco 11,041 3,776,350 608,567
Textile, manufacture, leather and footwear 2,945 252,738 81,717
Wood and cork, paper and graphic arts 6,103 1,894,151 518,812
Chemical and pharmaceutical industry 4,703 1,686,499 417,569
Rubber and plastic products 3,332 604,123 170,249
Various non-metallic ore products 2,840 426,901 138,006
9,530 1,746,558 465,794
8,531 2,210,643 492,991
Machinery and mechanical equipment 7,230 1,273,317 486,943
Transport material 14,543 6,269,501 786,186
7,133 914,688 332,519
Source: DIRCE (01/01/2015). INE.
Economic data in 1,000 euros.Source: Cuentas de la industria aragonesa, IAEST.
Industry main economic variables by sectors. Aragon, 2014.
Electrical, electronic and optical material and equipment
Share of industry on GDP. Aragon, 2016.
Economic data in 1,000 euros.Source: Cuentas de la industria aragonesa, IAEST.
Various manufacturing industries, repair and installation of machinery and equipment
Metallurgy and manufacture of metallic products, except machinery and equipment
Industry17.8%
Other82.2%
900
983
513
706
148
175
254
1,386
229
300
149
934
-3.2
-0.1
1.9
5.7
-1.1
-1.9
www.aragon.es/iaest
88

ARAGON BASIC DATA, 2017 · Instituto Aragonés de Estadística
INDUSTRY
Industry products and indicatorsIndustry main products. Aragon, 2015.
Value(1,000 €)
Percentageof total
Industry products total value 19,150,700 100%
1 Motor vehicles 3,597,345 18.78%
2 Farm animal feed 1,032,837 5.39%
3 Paper and cardboard 862,391 4.50%
4 Electrical energy production services 771,998 4.03%
5 Other components, parts and accessories for motor vehicles 545,503 2.85%
6 Elaborated and canned meat 499,031 2.61%
7 Cable sets for spark plugs and other cable sets used in cars, aircrafts or ships 464,318 2.42%
8 Seat belts, airbags and bodies' parts and accessories 420,976 2.20%
9 Elevation and manipulation machinery 389,885 2.04%
10 Electrical appliances 353,201 1.84%
Source: Productos industriales de Aragón. Instituto Aragonés de Estadística.
Aragon Spain
Industrial production index (Annual variation %) 9.60 3.10
Financial turnover per employed person (euros) 289,603 296,030
Personnel expense per employed person (euros) 36,441 36,056
Source: Instituto Aragonés de Estadística.
Industry main indicators, 2014.
1
2
3
45
678910
Resto de productos
www.aragon.es/iaest
89

ARAGON BASIC DATA, 2017 · Instituto Aragonés de Estadística
CONSTRUCTION
Construction sector
Interannualvariation (%)
Number of companies 12,422
GVA at basic prices 1,748,586
Gross Profit Margin 836,100
Wage earners 32.1
Economic data in 1,000 euros and 1,000 persons.Source: Contabilidad Regional de España. INE.
Construction sector indicators, 2016.
TotalInterannual variation Total
Interannualvariation
Housing starts (number of dwellings) 2,819 2.14 92,135 20.37
Housing completions (number of dwellings) 1,695 37.58 40,119 -11.15
Total official licitation (1,000 euros) 267,862 -18.96 7,404,202 -4.08
House Price Index (annual average) 57.7 1.9 70.0 4.7
Source: Ministerio de Fomento and Instituto Nacional de Estadística.
Housing starts are professional project orders for a building planning, which not always end up in theconstruction of a house.
Aragon Spain
Share of construction on GDP. Aragon, 2016.
Main economic variables in construction. Aragon, 2015.
Source: Directorio Central de Empresas and Contabilidad Regional de España. INE.
Annual variation of municipal planning permissions. Total dwellings. Aragon.
Annual variation of housing starts and completions. Aragon.
Construction; 5,4%
Other; 94.7%
-1.38
0.52
-3.39
4.90
-100
-50
0
50
100
2006
2007
2008
2009
2010
2011
2012
2013
2014
2015
%
-100
-50
0
50
100
2007
2008
2009
2010
2011
2012
2013
2014
2015
2016
%visados
certificaciones fin de obra
www.aragon.es/iaest
90

ARAGON BASIC DATA, 2017 · Instituto Aragonés de Estadística
SERVICES
Services sector
Share of services on GDP. Aragon, 2016.
Interannual variation (%)
Premises 56,347
Financial turnover 25,255,444
GVA at factor cost 6,361,706
Gross operating surplus 2,393,872
Personnel expenses 3,967,834
Employed persons 206,239
Enterprises by sectors.Aragon, 2016.
Employedpersons
Financialturnover
GVA at factor cost
Total 207,106 25,210,448 6,335,255
Trade 80,075 17,169,741 2,475,595
Transport and storage 25,655 2,640,045 1,137,267
Hotel industry 34,397 1,411,297 571,808
Information and communications 8,037 1,125,057 596,536
Real state activities 4,248 596,094 224,435Technical, scientific and professional activities 21,098 1,170,905 671,803
Administrative and auxiliary act. 32,199 1,043,906 627,667
Other services (cnae 95) 1,396 53,403 30,144Source: DIRCE (01/01/2016). INE.
* The Encuesta Anual de Servicios investigates the enterprises devoted to market services, leaving outcertain market services: education and healthcare, association activities, public sanitation and financialactivities; artistic, recreational and other personal services are not included either.
Main economic variables in market services. Aragon, 2014.
Source: Cuentas del sector servicios en Aragón according to data from Encuesta Anual de Servicios (INE)*. Instituto Aragonés de Estadística.
Economic data in 1,000 euros.Source: Contabilidad Regional de España. INE.
Main economic variables in market services by sectors. Aragon, 2014.
Economic data in 1,000 euros.Source: Cuentas del sector servicios en Aragón. Instituto Aragonés de Estadística.
19,771
5,883
7,727
1,172
4,878
9,746
4,767
897
Services58%
Other42%
-0.6
-0.2
-0.4
-4.1
1.8
0.4
www.aragon.es/iaest
91

ARAGON BASIC DATA, 2017 · Instituto Aragonés de Estadística
TRADE
TradeShare of trade, transport and hotel industry on GDP. Aragon, 2016.
Interannual variation (%)
Premises 22,918
Financial turnover 17,169,741
Wages 1,232,087
Tangible assets investment 249,966
Employees 80,075
Unit: percentage.
Financial turnover: 17,169,741 thousands of euros Employees: 80,075
Aragón Spain3.5 3.5
Financial turnover per employee (euros) 214,421 224,930
Average salary: salary per employee (euros) 15,387 16,030
Trade main indicators, 2014.
Premises average size: employees per premise (number)
Source: Cuentas del sector comercio en Aragón. Instituto Aragonés de Estadística.
Source: Contabilidad Regional de España. INE.
Distribution of financial turnover and employment in trade. Aragon, 2014.
Main economic variables in trade. Aragon, 2015.
Source: Cuentas del sector comercio en Aragón. Instituto Aragonés de Estadística.
Economic data in 1,000 euros.
Trade, transport andhotel industr…
Other82%
7.9%
58.5%
33.6%
Motor vehicles sale and repair
Wholesale trade
Retail trade
8.6%
35.4%56.0%
-2.0
0.2
2.2
3.7
-1.9
www.aragon.es/iaest
92

ARAGON BASIC DATA, 2017 · Instituto Aragonés de Estadística
TOURISM
TourismShare of trade, transport and hotel industry on GDP. Aragon, 2016.
Premises 8,237
Financial turnover 1,411,297
Wages 333,495
Tangible assets investment 43,418
Employees 34,397
Oferta turística. Aragón. Año 2016.
Establishments BedplacesTotal 3,773 106,574
Hotels and similar 970 44,772
Holiday dwellings 418 6,701
Camping sites 105 33,563
Rural tourism 1,491 11,319
Hostels and shelters 151 6,309
Tourist dwellings 638 3,910
Aragon% Aragon/
SpainTotal 7,301,016 1.6
Hotels and similar 5,180,856 1.6
Holiday dwellings 542,766 0.7
Camping sites 1,084,863 2.9
Rural tourism 492,530 5.0
Hostels 95,601 4.0 - PProvisional data. 1 The Occupancy Survey in Hostels does not disaggregate at the Pirineo Aragonés level.
Source: Instituto Aragonés de Estadística según la Encuesta de Ocupación en Alojamientos Turísticos, INE.
Source: Contabilidad Regional de España. INE.
Economic data in 1,000 euros.Source: Cuentas del sector servicios en Aragón. IAEST.
Distribution of hotel bedplaces by categories.
Source: Instituto Aragonés de Estadística según Anuario Estadístico de Turismo. Dirección General de Turismo. Gobierno de Aragón.
Tourist occupancy. Aragon. Overnight stays, 2016P.
Share of Aragonese Pyrenees on Aragon.
Main economic variables in hotel industry. Aragon, 2014.
Variación interanual (%)
Hotel 4 and 5*26.8%
Hotel 3*26.8%
Hotel 1 and 2*22.2%
Guesthouse24.3%
42.0%
32.8%
49.5%
74.7%
58.4%
-3.1
5.0
4.2
2.1
68,8
www.aragon.es/iaest
93

ARAGON BASIC DATA, 2017 · Instituto Aragonés de Estadística
TOURISM
Tourist occupancy
Unit: number of overnight stays.
Aragon Spain Aragon Spain Aragon Spain
Hotels and similar 37.15 59.91 1.93 3.32 80.48 34.45
Holiday dwellings 22.33 42.39 3.34 6.38 83.20 24.17
Camping sites* 26.96 38.78 3.09 4.98 66.29 51.56
Rural tourism 13.96 17.95 2.94 2.74 88.45 73.94
Hostels 16.64 28.09 2.96 2.52 92.80 68.71P Provisional data.
* Occupancy rate per plots.
Source: Instituto Aragonés de Estadística with data from Encuesta de Ocupación en Alojamientos Turísticos. INE.
Hotel monthly stationarity by zones, 2016.
Occupancy rate by bedplaces (%)
Tourist occupancy, 2016P.
Overnight stays (%)Spaniards/total
Average stay (number of days)
050,000
100,000150,000200,000250,000300,000350,000400,000450,000500,000550,000600,000650,000700,000
Janu
ary
Febr
uary
Mar
chA
pril
May
June
July
Aug
ust
Sep
tem
ber
Oct
ober
Nov
embe
rD
ecem
ber
Janu
ary
Febr
uary
Mar
chA
pril
May
June
July
Aug
ust
Sep
tem
ber
Oct
ober
Nov
embe
rD
ecem
ber
2015 2016
Aragon
Province of Huesca
Province of Teruel
Province of Zaragoza
Zaragoza city
Aragonese Pyrenees
www.aragon.es/iaest
94

ARAGON BASIC DATA, 2017 · Instituto Aragonés de Estadística
TRANSPORT
See also: infrastructures.
Transport
Source: Contabilidad Regional de España. INE. Source: Ministerio de Agricultura, Ganadería y Medio Ambiente.
Main economic variables in transport and storage sector. Aragon, 2013.Number of premises 6.369 Output value 2.033.157
Number of employed persons 26.020 Intermediate consumption 1.006.419
Number of employees 20.948 Gross value added at market prices 1.026.738
Financial turnover 2.856.549 Taxes net from subsidies -96.518
Wages 500.663 Gross value added at factor cost 1.123.256
147.179 Personnel expenses 655.079
Gross operative surplus 468.177
Freight transportation. Aragon. Passenger transportation. Aragon.Unit: 1,000 tonnes. Unit: 1,000 passengers.
2005 2015 2005 2010 2015Rail City transport
Domestic Origin 1,590 1,308 Bus 120,593 123,551 119,868
Domestic Destination 2,834 1,701 Suburban train 0 252 590
Road Inter-city transport
Domestic Origin 98,378 61,848 Road (coach)* 6,960 5,870 6160*
Domestic Destination 96,560 62,433 Rail (origin and dest.) 3,012 4,140 4,584
Air Air (domestic) 157 240 101
Domestic 0.6 0.28 International transport
International 3.2 85.5 Air 219 369 322
Energy consumption in transport.Unit: oil-equivalent tonnes.
2000 2010 2012 2013 2014 2015
Aragon 952,046 1,231,598 1,183,870 1,184,458 1,210,916 2.43
Source: Boletín de Coyuntura Energética de Aragón. Departamento de Industria e Innovación.
1,240,325
Variation2013/2015 (%)
Economic data in 1,000 euros.Source: Cuentas del sector servicios en Aragón. Instituto Aragonés de Estadística.
Source: Ministerio de fomento; RENFE; Instituto Aragonés de Estadística. (*) Data at 2013.
Source: Ministerio de Fomento; RENFE.
Share of transport on greenhouse gas emissions. Aragon. Average 1990-2015.
Share of trade, transport and hotel industry on GDP. Aragon, 2016.
Gross investment on material goods
Trade, transport and hotel industry
18%
Other82%
Transport13.5%Other
86.5%
www.aragon.es/iaest
95

ARAGON BASIC DATA, 2017 · Instituto Aragonés de Estadística
TRANSPORT
Vehicles and drivers
Totalvehicles
Passenger cars
Total pass. cars
Aragon 638 438 Aragon 573,236 58
Spain 675 481 Spain 22,355,549 57
Source: IAEST with data from DGT and INE. Source: Dirección General de Tráfico.
Vehicles stock by type, 2015.Unit: number of vehicles.
Aragon SpainTotal 884,220 33,412,894
Lorries and vans 144,648 4,851,518
Buses 1,506 60,252
Passenger cars 573,236 22,355,549
Motorbikes 69,435 3,079,463
Industrial tractors 8,503 195,657
Trailers and semi-trailers 18,957 426,510
Mopeds 50,347 2,023,211
Other vehicles 17,588 420,734
2013 2014 2015 2013 2015Aragon 19,805 25,114 32,433 63.76 Aragon 54.9 58.0
Spain 949,015 1,146,125 1,417,173 49.33 Spain 54.8 56.0
% Aragon/Spain 2.09 2.19 2.29 - Source: Dirección General de Tráfico.
Source: Dirección General de Tráfico.
Taxi licenses in provincial capitals, 2015. Taxi licenses.1994 2015
Aragon 2,160 2,288
Spain 72,071 70,509Source: INE.
Variation2013/15 (%)
Diesel passenger cars over total pass. cars.Unit: percentage.Registered vehicles per year.
Total number of vehicles per 1,000 inhabitants, 2015.
Source: Dirección General de Tráfico.
Passenger cars' stock age, 2015.
Pass. cars aged 10 and over (%)
Men; 454,409;
62%
Women; 283,923;
38%
Drivers by sex. Aragon, 2015.
Men; 15,362,190; 58%
Women; 10,987,846; 42%
Drivers by sex. Spain, 2015.
1,77750
16445
ZaragozaHuescaTeruel
Rest of Aragon
www.aragon.es/iaest
96