economics economics seeks to understand the functioning of market places. an area of the subject...
TRANSCRIPT

Economics Economics seeks to understand the
functioning of market places. An area of the subject known as microeconomics examines consumers, firms and workers within markets, seeking to understand why prices change for particular products, what influences the costs of firms and in particular what will influence a firm’s of profitability.

Economics as a ScienceEconomics is a study of how society
decided what, how and for whom to produce.
Being a social science that studies the relationship between ends and scarce means which have alternative uses.

MacroeconomicsThe study of how the entire economy
works.
Examines the whole economy as one very large market. Macroeconomics looks to address how the government might manage the entire economy to deliver stable economic growth.

Microeconomics The study of how individuals make economic
decisions within an economy. Businesses operate within an economic environment.
The revenue they receive from selling a product is determined within a market. In addition to this, the cost that the firm has to pay for its labour, raw materials and equipment are also priced within separate markets. Microeconomics address the various influences at the market level that will impact upon a business’s revenues and costs. Macroeconomics address the issues at a economy level which will similarly effect a business’s revenues and costs. Comprehending, reacting to and possibly even controlling micro and macroeconomic influences on the business are crucial business skills.

Factors of productionThese are grouped into four categories:LandLabourCapitalEnterprise

Land, labour,capital and enterprise
Land. This is where your raw materials come from: oil, gas, base metals and other minerals.
Labour. This is the ability of individuals to work.
Capital is production machinery, computers, office space or retail shops.
Enterprise is the final factor of production that brings land, labour and capital together and arranges them into units that can produce products in the pursuit of profit.

Opportunity costsThese are the benefits forgone from the
next best alternative.The cost of a good is the quantity of
other goods which must be sacrificed to obtain another unit of that good.

Beer Z
A Y1
1000 litres Yof beer
500 litres Y2Of beer
500 1000 B Pizzapizzas pizzas
Figure 1

Production possibility frontier Figure 1 shows the maximum amounts of beer
and pizza that can be produced with a fixed amount of resources. At Y 1000 litres of beer and 1000 pizzas can be produced. At Y1 more beer can be produced but some pizza production has to be sacrificed, while a Y2 beer can be sacrificed in order to produce more beers. Z cannot be achieved with current resource levels and X represents unemployment with production of beer and pizzas below the optimal levels attainable on the frontier, such as Y, Y1 and Y2.

Production possibility frontier Shows the maximum amount of one good
that can be produced fro each given level of output of the other good. Showing the trade off or menu of choices that society must make in deciding what to produce. Resource are scarce and points outside the frontier are unattainable. It is efficient to produce within the frontier. Moving on to the frontier, society could have more of some good without having less of any good.

A production possibilities curve for the Wild Coast community

The production possibilities curve once again

Improved technique for producing capital goods

Improved technique for producing consumer goods

Increase in the quantity or productivity of the available resources

THE INTERDEPENDENCE BETWEEN THE MAJOR SECTORS, MARKETS AND FLOWS IN THE MIXED ECONOMY

The Role of the market and the allocation of resources in various economic systems
A market is a shorthand expression for the process by which household decisions about consumption of alternative goods, firms’ decisions about what and how to produce, the workers decisions about how much and for whom to work are all reconciled by adjustment of prices.

A command Economy In a command economy, decisions on
what, how and for whom are made in a central planning office. No economy relies entirely on command.

A Free Market Economy This has no obvious government intervention.
Resources are allocated entirely through markets in which individuals pursue their own self-interest.
Modern economies in the West are mixed, relying mainly on the market but with a large dose f government intervention.

The three major flows in the economy

The circular flow of goods and services

The circular flow of income and spending

The government in the circular flow of production, income and spending

The foreign sector in the circular flow of income and spending

Financial institutions in the circular flow of income and spending

The major elements of the circular flow of income and spending

Box 3-3 The Public Sector in South Africa

MEASURING THE PERFORMANCE OF
THE ECONOMY

A Lorenz curve

THE ECONOMIST’S ANALYTICAL
TOOLKIT

The basic elements of a graph

Plotting points on a graph

A graphical presentation of the relationship between maize production and rainfall

Some possible relationships in economics
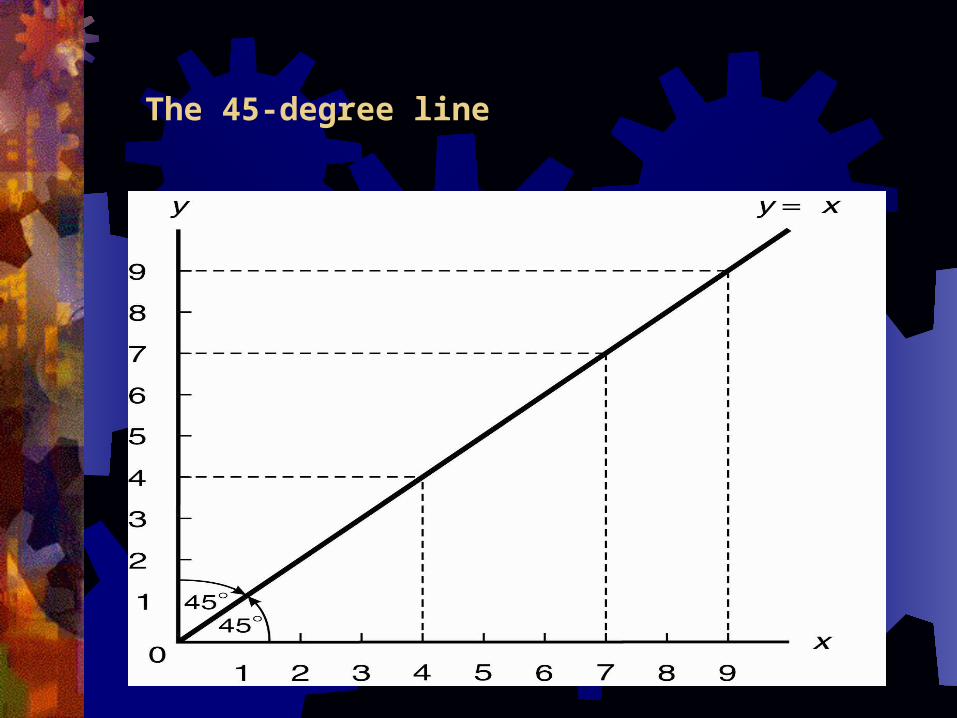
The 45-degree line
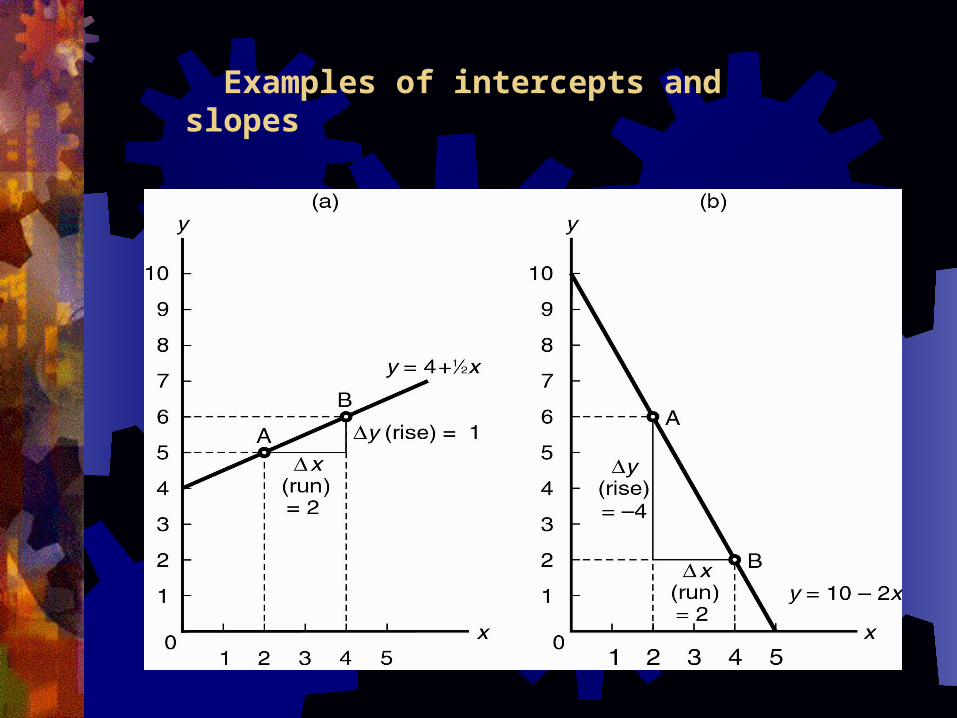
Examples of intercepts and slopes

DEMAND, SUPPLY AND
PRICES

Demand, Supply and Market Equilibrium PriceDemand is the quantity that buyers wish
to buy at each price. Other things equal the lower the price, the higher the quantity demanded. Demand curves slope downwards.

SupplyThe supply is the quantity of a good
sellers wish to sell at each price. Other things equal, the higher the price, the higher the quantity. Supply curves slope upwards.

The interaction between households and firms

Anne Smith’s weekly demand for tomatoes

The market demand curve

A movement along a demand curve

Two substitutes: butter and margarine

Two complements: video cassette recorders (VCRs) and video cassettes

A change in the quantity demanded versus a change in demand

Johnny’s annual supply of tomatoes

A movement along a supply curve: a change in the quantity supplied

Shifts of the supply curve: changes in supply

Demand, supply and market equilibrium

The consumer surplus

Concepts and Application of Elasticity Price elasticity of demand measure the
sensitivity of quantity demanded to changes in the own price of a good, holding constant the prices of other goods and income. Demand elasticity is negative since demand curves slope down. Generally, the demand elasticity changes with the movement along a given demand curve, elasticity falls as price falls.
Demand This is elastic if the price elasticity is more
negative than –1 (for example –2). Price cuts then increase total spending on the good. Demand is inelastic if the demand elasticity lies between –1 and 0. Price cut then reduces total spending on the good. When demand I unit elastic, the demand elasticity is –1 and price changes have no effect on total spending on the good.

Cost price elasticity f demandThis measures the sensitivity of quantity
demanded of one good to changes in the price of a related good. Positive cross elasticity tends to imply that goods are substitutes. Negative cross-elasticity tends to imply that goods are substitutes.

Income Elasticity of Demand This measures the sensitivity of quantity
demanded to changes in income, holding constant the prices of all goods.
Inferior goods have negative income elasticity of demand. Higher incomes reduce the quantity demanded and the budget share of such goods. Luxury goods have income elasticity larger than 1.
Higher incomes raise the quantity demanded and the budget share of such goods

Price elasticity of demand at different points along a linear demand curve

The relationship between price elasticity of demand and total revenue

Assignment

Question