economics 448: lecture 12 measures of...
TRANSCRIPT
OutlineIntroduction
What is economic inequality?Measuring economic inequality
Summary
Economics 448: Lecture 12Measures of Inequality
October 11, 2012
Lecture 12
OutlineIntroduction
What is economic inequality?Measuring economic inequality
Summary
Introduction
What is economic inequality?The contextEconomic inequality: Preliminary observations
Measuring economic inequalityIntroductionFour criteria for inequality measurementThe Lorenz curveComplete measures of inequality
Summary
Lecture 12
OutlineIntroduction
What is economic inequality?Measuring economic inequality
Summary
Inequality
Economic growth affects the level of income, wealth, well–being.
Also want to study the distribution of income, wealth, well–being.
Two dimensions:
I efficiency—for a given level of output, product at lowest cost.
I equity—distribution who receives what? Winners and losers.
Lecture 12
OutlineIntroduction
What is economic inequality?Measuring economic inequality
Summary
Equity: Social Justice
In courses we spend probably 80–90% of time thinking(characterizing) economic efficiency. (Positive Economics; what is)
Equity involves notions of justice — what is a fair distribution ofresources? (Normative economics; what should be)
Have mentioned Pareto Optimality Criterion: no one can be madebetter off without some else being made worse off.
Competitive equilibrium yields a Pareto outcome. But every pointon the production possibility curve can support a competitiveequilibrium.
Pareto optimality is a weak criterion need additional tools to makeprogress.
Lecture 12

OutlineIntroduction
What is economic inequality?Measuring economic inequality
Summary
Two motivations to study equity
I Social Justice — philosophy. Rawls: veil of ignorance.
I Functional level — how the distribution of resources affectseconomic growth.
In Chapter 6 only study the measurement of inequality.
In chapter 7 studies functional level; consequences of inequality.
Lecture 12

OutlineIntroduction
What is economic inequality?Measuring economic inequality
Summary
The contextEconomic inequality: Preliminary observations
Context
Inequality is the fundamental disparity that permits one individualcertain material choices, while denying another individual thosevery same choices.
Will not spend much time on notions of social justice (what isfair?).
Sen: Commodities and Capabilities. Oxford University Press. 1985.
Lecture 12

OutlineIntroduction
What is economic inequality?Measuring economic inequality
Summary
The contextEconomic inequality: Preliminary observations
Preliminary Observations
Distinguish stocks and flows.
I Income is a flow (per unit of time).
I Asset is a stock (at a point in time).
Assets the accumulation of past income flows.
Economic Mobility important. Can measure dispersion of incomeat point in time. But is there any churning in the distribution.“Musical chairs”? or “Make like a statue”?
Lecture 12

OutlineIntroduction
What is economic inequality?Measuring economic inequality
Summary
The contextEconomic inequality: Preliminary observations
Functional and Personal Distribution of Income
Functional income distribution — the returns to different factors ofproduction (labor, capital, land).
Need to know who owns the different factors. Would like to knowfor each individual income from labor, profits from capital, landrents.
Understanding sources may affect how we judge the outcome.
Functional distribution income informative on features ofdevelopment.
Lecture 12

OutlineIntroduction
What is economic inequality?Measuring economic inequality
Summary
IntroductionFour criteria for inequality measurementThe Lorenz curveComplete measures of inequality
Challenge
How to compare many alternative distributions of income acrossmany people?
I Pareto criterion gives us a partial ordering. May be able torank order some distributions.
I But even that criterion does not offer much guidance.
I Will develop inequality indexes that collapse the distribution(income, assets, etc.) into a single number. Scalar measureseasy to report and understand. And offers a completeordering.
Lecture 12

OutlineIntroduction
What is economic inequality?Measuring economic inequality
Summary
IntroductionFour criteria for inequality measurementThe Lorenz curveComplete measures of inequality
Criteria
The inequality measures are each a scalar x . But many scalarinequality measures exist and can and do give conflicting results.
Consider a set of four criteria of desirable properties of inequalitymeasures.
Each criteria relates to ethical judgement. Need to be cognizant ofthe relationship.
Lecture 12
OutlineIntroduction
What is economic inequality?Measuring economic inequality
Summary
IntroductionFour criteria for inequality measurementThe Lorenz curveComplete measures of inequality
Setup
Society has n individuals.
Index i stands for a generic individual, i = 1, 2, . . . , n.
An income distribution is a description of how much income y isreceived by individual i : (y1, y2, . . . , yn).
Compare relative “inequality” of two income distributions.
Lecture 12

OutlineIntroduction
What is economic inequality?Measuring economic inequality
Summary
IntroductionFour criteria for inequality measurementThe Lorenz curveComplete measures of inequality
Anonymity principle
It does not matter who earns the income. Anonymity because wecare about the ordering but not the identity of each earner.All that matters is the ranking from lowest to highest:
y1, y2, . . . , yn → y(1), y(2), · · · , y(n) order statistics
y(1) ≤ y(2) ≤ y(3) ≤ · · · ≤ y(n)
Since identity of person doesn’t matter we can dispense with theorder statistic notation y(k) and use the simpler notation where
index i represents the level of the i th income level in the society.
y1 ≤ y2 ≤ y3 ≤ · · · ≤ yn
Lecture 12
OutlineIntroduction
What is economic inequality?Measuring economic inequality
Summary
IntroductionFour criteria for inequality measurementThe Lorenz curveComplete measures of inequality
Population Principle
If we compare an income distribution over n people and anotherpopulation with 2n people with the same income pattern repeatedtwice, there should be no difference in inequality among the twoincome distributions.
Anonymity states that no information is lost by retaining only thesequence of individual incomes (and not the identities of each)
The population principle states it doesn’t matter how large thepopulation is, we can convert everything to percentiles (bottom1%, lowest 20%, top 25%)
Lecture 12

OutlineIntroduction
What is economic inequality?Measuring economic inequality
Summary
IntroductionFour criteria for inequality measurementThe Lorenz curveComplete measures of inequality
Relative Income Principle
Only the relative incomes should matter and the absolute levels ofthese incomes should not.
Thus if we transform one distribution by multiply by a positiveconstant (e.g., Y 1 = λY 0) then inequality should be the same forthe two distributions.
Income levels have no meaning for inequality measurement.Absolute measure matters for assessing economic development.We will see that level matters for the measurement of poverty.
Roughly think of poverty as a measure of location (level) andinequality as a measure of dispersion.
Lecture 12

OutlineIntroduction
What is economic inequality?Measuring economic inequality
Summary
IntroductionFour criteria for inequality measurementThe Lorenz curveComplete measures of inequality
Parsimony
Relative income principle means that data can be further collapsed.
Population and income can be expressed as shares of the total.
This means we can compare income distributions for countries withdifferent average income levels.
Need to record only income shares to measure inequality. Orderedincomes from poorest to riches. So if put into five incomecategories (quintiles) report the share of income by each fifth ofthe population.
For example, Figure 6.3 (p. 177) graphs the share of income of the(richest) fifth quintile (31%), share of the fourth quintile (25%),share of the third quintile (20%), share of the second quintile(15%), and first quintile (poorest) (9%).
Lecture 12

OutlineIntroduction
What is economic inequality?Measuring economic inequality
Summary
IntroductionFour criteria for inequality measurementThe Lorenz curveComplete measures of inequality
Dalton Principle
The two principles not controversial, third more difficult(well–being is proportional to income). This is fundamental to theconstruction of inequality measures.
Let (y1, y2, . . . , yn) be an income distribution and consider twoincomes yi and yj with yi ≤ yj .
A transfer of income from individual i to individual j is called aregressive transfer.
If inequalities is strict yi < yj the regressive transfer is from thepoorer individual to the richer individual.
With weak inequality (≤) use the language “not richer” to “notpoorer”
Lecture 12

OutlineIntroduction
What is economic inequality?Measuring economic inequality
Summary
IntroductionFour criteria for inequality measurementThe Lorenz curveComplete measures of inequality
Dalton Principle
Our inequality index as a function of the form:
I = I (y1, y2, . . . , yn)
with I defined over all conceivable distributions of income(y1, y2, . . . , yn).
Dalton principle: if one income distribution can be achieved fromanother by constructing a sequence of regressive transfers, then theformer distribution must be deemed more unequal than the latter.
If for every income distribution (y1, y2, . . . , yn) and every transferδ > 0,
I (y1, . . . , yi , . . . , yj , . . . , yn) < I (y1, . . . , yi − δ, . . . , yj + δ, . . . , yn)
Lecture 12

OutlineIntroduction
What is economic inequality?Measuring economic inequality
Summary
IntroductionFour criteria for inequality measurementThe Lorenz curveComplete measures of inequality
The Lorenz Curve
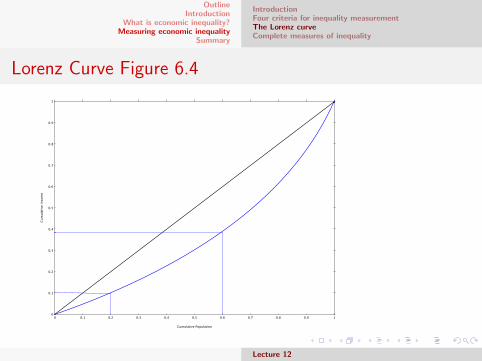
Lorenz curve is a simple diagrammatic way to depict thedistribution of income.
On the horizon axis we list the cumulative percentage of thepopulation arranged in increasing order of income.
Thus point on the axis refer to the poorest 20% of the population,the poorest half, etc.
On the vertical axis we measure the percentage of the nationalincome accruing to any particular fraction of the population thusarranged.
The diagonal line (45◦) represents equal distribution income.
Lecture 12

OutlineIntroduction
What is economic inequality?Measuring economic inequality
Summary
IntroductionFour criteria for inequality measurementThe Lorenz curveComplete measures of inequality
Lorenz Curve Properties
The slope of the Lorenz curve is the contribution of the person atthat point to the cumulative share of national income.
Ordered from poorest to richest the “marginal contribution” cannever fall.
Equivalently, the Lorenz curve can never get flatter as we movefrom left to right.
Lecture 12
OutlineIntroduction
What is economic inequality?Measuring economic inequality
Summary
IntroductionFour criteria for inequality measurementThe Lorenz curveComplete measures of inequality
Lorenz Curve
The overall distance between the 45◦ and the Lorenz curverepresents the amount of inequality present in the society.
Lecture 12
OutlineIntroduction
What is economic inequality?Measuring economic inequality
Summary
IntroductionFour criteria for inequality measurementThe Lorenz curveComplete measures of inequality
Lorenz Curve Figure 6.4
10 0.1 0.2 0.3 0.4 0.5 0.6 0.7 0.8 0.9
1
0
0.1
0.2
0.3
0.4
0.5
0.6
0.7
0.8
0.9
Cumulative Population
Cum
ulat
ive
Inco
me
Lecture 12

OutlineIntroduction
What is economic inequality?Measuring economic inequality
Summary
IntroductionFour criteria for inequality measurementThe Lorenz curveComplete measures of inequality
Lorenz Curve Comparisons 6.5
10 0.1 0.2 0.3 0.4 0.5 0.6 0.7 0.8 0.9
1
0
0.1
0.2
0.3
0.4
0.5
0.6
0.7
0.8
0.9
Cumulative Proportion of Population
Cum
ulat
ive
Prop
ortio
n of
Inco
me
L(2)
L(1)
Lecture 12
OutlineIntroduction
What is economic inequality?Measuring economic inequality
Summary
IntroductionFour criteria for inequality measurementThe Lorenz curveComplete measures of inequality
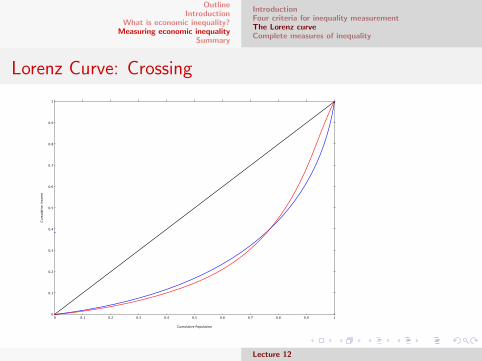
Lorenz Curve: Crossing
10 0.1 0.2 0.3 0.4 0.5 0.6 0.7 0.8 0.9
1
0
0.1
0.2
0.3
0.4
0.5
0.6
0.7
0.8
0.9
Cumulative Population
Cum
ulat
ive
Inco
me
Lecture 12
OutlineIntroduction
What is economic inequality?Measuring economic inequality
Summary
IntroductionFour criteria for inequality measurementThe Lorenz curveComplete measures of inequality
Complete Measures of Inequality
Lorenz curves offer a visual representation of inequality.
But the curves offer only a partial ranking: when Lorenz curvescross they offer no additional information to prefer one distributionover another.
The (scalar) numerical measures provide a complete ranking ofalternative distributions.
However, these quantitative measures sometimes disagree.
Lecture 12

OutlineIntroduction
What is economic inequality?Measuring economic inequality
Summary
IntroductionFour criteria for inequality measurementThe Lorenz curveComplete measures of inequality
Scalar Measures of Inequality: Setup
Assume we have a population census.
There are N units (households or individuals) in the population.
Let there be m income groups, e.g., [10000, 20000) withrepresentative value yg for group g .
yg could be the mean income (within the interval), or the median,or the interval midpoint.
Define the mean as
µ =1
N
m∑g=1
yg
Will divide by µ to make the inequality measures independent ofthe units of income.
Lecture 12
OutlineIntroduction
What is economic inequality?Measuring economic inequality
Summary
IntroductionFour criteria for inequality measurementThe Lorenz curveComplete measures of inequality
Three simple measures of Inequality
Range R = µ−1(yG − y1), crude but sometimes useful.
Kuznets Ratio Richest x% to the poorest y% where x and y standfor numbers such as 10, 20, or 40. Also crude,focuses on ends of distribution.
Mean Absolute Deviation M = 1Nµ
∑mg=1 ng |yg − µ|. Do not use.
Lecture 12
OutlineIntroduction
What is economic inequality?Measuring economic inequality
Summary
IntroductionFour criteria for inequality measurementThe Lorenz curveComplete measures of inequality
Three Measures that Satisfy all Four Principles
Coefficient of Variation C =
√∑mg=1
ngN
(yg−µµ
)2.
Gini Coefficient G = 12n2µ
∑mj=1
∑mk=1 njnk |yj − yk |.
Theil Index T = 1Nµ
∑mg=1 yg ln (yg/µ)
Lecture 12
OutlineIntroduction
What is economic inequality?Measuring economic inequality
Summary
IntroductionFour criteria for inequality measurementThe Lorenz curveComplete measures of inequality
Comments on Measures
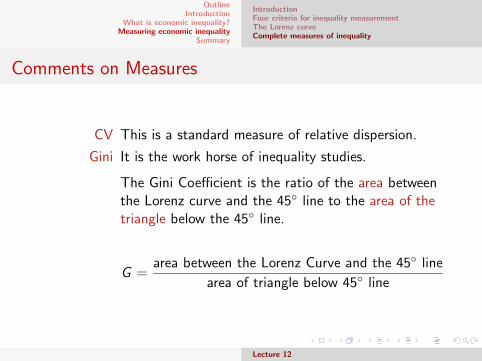
CV This is a standard measure of relative dispersion.
Gini It is the work horse of inequality studies.
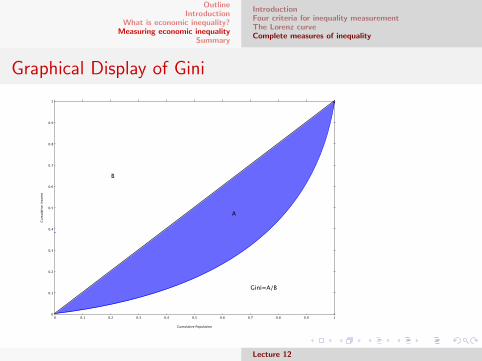
The Gini Coefficient is the ratio of the area betweenthe Lorenz curve and the 45◦ line to the area of thetriangle below the 45◦ line.
G =area between the Lorenz Curve and the 45◦ line
area of triangle below 45◦ line
Lecture 12
OutlineIntroduction
What is economic inequality?Measuring economic inequality
Summary
IntroductionFour criteria for inequality measurementThe Lorenz curveComplete measures of inequality
Graphical Display of Gini
10 0.1 0.2 0.3 0.4 0.5 0.6 0.7 0.8 0.9
1
0
0.1
0.2
0.3
0.4
0.5
0.6
0.7
0.8
0.9
Cumulative Population
Cum
ulat
ive
Inco
me
A
B
Gini=A/B
Lecture 12
OutlineIntroduction
What is economic inequality?Measuring economic inequality
Summary
IntroductionFour criteria for inequality measurementThe Lorenz curveComplete measures of inequality
Comments on Measures
Theil The Theil Index can be used to exactly decomposeoverall inequality into between–group andwithin–group components.
Useful for descriptive studies to disaggregateinequality by race, gender, education, etc.
Lecture 12

OutlineIntroduction
What is economic inequality?Measuring economic inequality
Summary
Measures from World Bank Report
Will put on course web page for your review.
Lecture 12