economic & social af fairs world economic situation and ... economic situation and prospects...
TRANSCRIPT
World Economic Situation and
Prospects 2001
DEPARTMENT OF ECONOMIC AND SOCIAL AFFAIRS AND
UNITED NATIONS CONFERENCE ON TRADE AND DEVELOPMENT
Economic &So
cial A
ffairs
UNITED NATIONS


CONTENTS
Chapter Page
I. GLOBAL OUTLOOK . . . . . . . . . . . . . . . . . . . . . . . . . . . . . . . . . . . . . . . . . . . . . . . . . . . . . . . . . . . . . . . . . . . . . . . . . . . .1The state of the world economy at the beginning of 2001 . . . . . . . . . . . . . . . . . . . . . . . . . . . . . . . . . . . . . . . . . . . . . . .1Uncertainties and risks in the outlook . . . . . . . . . . . . . . . . . . . . . . . . . . . . . . . . . . . . . . . . . . . . . . . . . . . . . . . . . . . . . . .5
The danger of a hard landing for the United States . . . . . . . . . . . . . . . . . . . . . . . . . . . . . . . . . . . . . . . . . . . . . . . . .5Oil prices . . . . . . . . . . . . . . . . . . . . . . . . . . . . . . . . . . . . . . . . . . . . . . . . . . . . . . . . . . . . . . . . . . . . . . . . . . . . . . . . . .5Managing fiscal imbalances . . . . . . . . . . . . . . . . . . . . . . . . . . . . . . . . . . . . . . . . . . . . . . . . . . . . . . . . . . . . . . . . . . .6An ICT cyclical correction . . . . . . . . . . . . . . . . . . . . . . . . . . . . . . . . . . . . . . . . . . . . . . . . . . . . . . . . . . . . . . . . . . . . .6The potential of ICT . . . . . . . . . . . . . . . . . . . . . . . . . . . . . . . . . . . . . . . . . . . . . . . . . . . . . . . . . . . . . . . . . . . . . . . . .8
II. INTERNATIONAL TRADE AND FINANCE . . . . . . . . . . . . . . . . . . . . . . . . . . . . . . . . . . . . . . . . . . . . . . . . . . . . . . . . . .9A strengthening and broadening expansion in international trade . . . . . . . . . . . . . . . . . . . . . . . . . . . . . . . . . . . . . . . . .9
Main features of the current recovery in international trade . . . . . . . . . . . . . . . . . . . . . . . . . . . . . . . . . . . . . . . . . . .9Factors affecting trade in main world regions . . . . . . . . . . . . . . . . . . . . . . . . . . . . . . . . . . . . . . . . . . . . . . . . . . . . .11The prospects for world trade in 2001 . . . . . . . . . . . . . . . . . . . . . . . . . . . . . . . . . . . . . . . . . . . . . . . . . . . . . . . . . . .12
Developments in commodity markets . . . . . . . . . . . . . . . . . . . . . . . . . . . . . . . . . . . . . . . . . . . . . . . . . . . . . . . . . . . . . .13Developments in the multilateral trading system . . . . . . . . . . . . . . . . . . . . . . . . . . . . . . . . . . . . . . . . . . . . . . . . . . . . .15
The trading system and development . . . . . . . . . . . . . . . . . . . . . . . . . . . . . . . . . . . . . . . . . . . . . . . . . . . . . . . . . . .16Institutional development of the trading system . . . . . . . . . . . . . . . . . . . . . . . . . . . . . . . . . . . . . . . . . . . . . . . . . . .16Regional integration agreements and trade preferences . . . . . . . . . . . . . . . . . . . . . . . . . . . . . . . . . . . . . . . . . . . . .17
Financial flows to developing and transition economies and main policy developments . . . . . . . . . . . . . . . . . . . . . . . .18Private financial flows . . . . . . . . . . . . . . . . . . . . . . . . . . . . . . . . . . . . . . . . . . . . . . . . . . . . . . . . . . . . . . . . . . . . . . .18Official financial flows . . . . . . . . . . . . . . . . . . . . . . . . . . . . . . . . . . . . . . . . . . . . . . . . . . . . . . . . . . . . . . . . . . . . . .20Debt relief and debt sustainability of poor countries . . . . . . . . . . . . . . . . . . . . . . . . . . . . . . . . . . . . . . . . . . . . . . . .20
Flows of foreign direct investment (FDI) in 2000 . . . . . . . . . . . . . . . . . . . . . . . . . . . . . . . . . . . . . . . . . . . . . . . . . . . . . .21Developed economies . . . . . . . . . . . . . . . . . . . . . . . . . . . . . . . . . . . . . . . . . . . . . . . . . . . . . . . . . . . . . . . . . . . . . . .22Developing countries . . . . . . . . . . . . . . . . . . . . . . . . . . . . . . . . . . . . . . . . . . . . . . . . . . . . . . . . . . . . . . . . . . . . . . . .23Central and Eastern Europe . . . . . . . . . . . . . . . . . . . . . . . . . . . . . . . . . . . . . . . . . . . . . . . . . . . . . . . . . . . . . . . . . . .24
Recent features of cross-border mergers and acquisitions . . . . . . . . . . . . . . . . . . . . . . . . . . . . . . . . . . . . . . . . . . . . . .24Impact of cross-border mergers and acquisitions and policy options . . . . . . . . . . . . . . . . . . . . . . . . . . . . . . . . . . . . . . .25
III. REGIONAL DEVELOPMENTS AND OUTLOOK . . . . . . . . . . . . . . . . . . . . . . . . . . . . . . . . . . . . . . . . . . . . . . . . . . . . .27Developed economies . . . . . . . . . . . . . . . . . . . . . . . . . . . . . . . . . . . . . . . . . . . . . . . . . . . . . . . . . . . . . . . . . . . . . . . . . .27
Labour markets . . . . . . . . . . . . . . . . . . . . . . . . . . . . . . . . . . . . . . . . . . . . . . . . . . . . . . . . . . . . . . . . . . . . . . . . . . . .28Inflation: rising but basically under control . . . . . . . . . . . . . . . . . . . . . . . . . . . . . . . . . . . . . . . . . . . . . . . . . . . . . . .28Macroeconomic policy stances . . . . . . . . . . . . . . . . . . . . . . . . . . . . . . . . . . . . . . . . . . . . . . . . . . . . . . . . . . . . . . . .29
Economies in transition . . . . . . . . . . . . . . . . . . . . . . . . . . . . . . . . . . . . . . . . . . . . . . . . . . . . . . . . . . . . . . . . . . . . . . . . .31Unemployment and inflation trends . . . . . . . . . . . . . . . . . . . . . . . . . . . . . . . . . . . . . . . . . . . . . . . . . . . . . . . . . . . .32Macroeconomic policy stances . . . . . . . . . . . . . . . . . . . . . . . . . . . . . . . . . . . . . . . . . . . . . . . . . . . . . . . . . . . . . . . .33
Developing countries . . . . . . . . . . . . . . . . . . . . . . . . . . . . . . . . . . . . . . . . . . . . . . . . . . . . . . . . . . . . . . . . . . . . . . . . . .34Inflation trends . . . . . . . . . . . . . . . . . . . . . . . . . . . . . . . . . . . . . . . . . . . . . . . . . . . . . . . . . . . . . . . . . . . . . . . . . . . .38Macroeconomic policy stances . . . . . . . . . . . . . . . . . . . . . . . . . . . . . . . . . . . . . . . . . . . . . . . . . . . . . . . . . . . . . . . .38

Page
BOXES
I.1. Assumptions of the forecast . . . . . . . . . . . . . . . . . . . . . . . . . . . . . . . . . . . . . . . . . . . . . . . . . . . . . . . . . . . . . . . . . . . . . .7II.1. Argentina: Overcoming the payments crisis . . . . . . . . . . . . . . . . . . . . . . . . . . . . . . . . . . . . . . . . . . . . . . . . . . . . . . . . .19II.2. The driving forces for cross-border mergers and acquisitions . . . . . . . . . . . . . . . . . . . . . . . . . . . . . . . . . . . . . . . . . . . .22II.3. Problems of cross-borders mergers and acquisition data . . . . . . . . . . . . . . . . . . . . . . . . . . . . . . . . . . . . . . . . . . . . . . .22
FIGURES
I.1. Selected bilateral Euro exchange rates, January 1999-November 2000 . . . . . . . . . . . . . . . . . . . . . . . . . . . . . . . . . . . . .4II.1. Growth of world output and trade, 1991-2001 . . . . . . . . . . . . . . . . . . . . . . . . . . . . . . . . . . . . . . . . . . . . . . . . . . . . . . . .9II.2. Prices of primary commodities and manufactures, 1995-2000 . . . . . . . . . . . . . . . . . . . . . . . . . . . . . . . . . . . . . . . . . . . .14II.3. Prices of non-fuel primary commodities, 1995-2000 . . . . . . . . . . . . . . . . . . . . . . . . . . . . . . . . . . . . . . . . . . . . . . . . . . .14II.4. Net financial flows to developing and transition economies, 1999-2000 . . . . . . . . . . . . . . . . . . . . . . . . . . . . . . . . . . . .18II.5. Yield spreads on emerging market bonds, 2 January 1998 to 28 November 2000 . . . . . . . . . . . . . . . . . . . . . . . . . . . . .18II.6. Share of developing countries in world FDI inflows, 1980-2000 . . . . . . . . . . . . . . . . . . . . . . . . . . . . . . . . . . . . . . . . . .23
III.1. Interest rates and annual rate of change in consumer price index in the Euro zoneand the United States, January 1999-October 2000 . . . . . . . . . . . . . . . . . . . . . . . . . . . . . . . . . . . . . . . . . . . . . . . . . .29
TABLES
I.1. Growth of world output and trade, 1981-2001 . . . . . . . . . . . . . . . . . . . . . . . . . . . . . . . . . . . . . . . . . . . . . . . . . . . . . . . .2I.2. Developing countries: Growth of per capita GDP by region, 1998-2001 . . . . . . . . . . . . . . . . . . . . . . . . . . . . . . . . . . . . . .3II.1. Growth of world merchandise trade by broad commodity group, 1999-2001 . . . . . . . . . . . . . . . . . . . . . . . . . . . . . . . . .10
III.1. Central government fiscal balances of selected developing countries, 1996-2000 . . . . . . . . . . . . . . . . . . . . . . . . . . . .36
ANNEX TABLES . . . . . . . . . . . . . . . . . . . . . . . . . . . . . . . . . . . . . . . . . . . . . . . . . . . . . . . . . . . . . . . . . . . . . . . . . . . . . . .41
EXPLANATORY NOTES
The following symbols have been used in the tablesthroughout the report
.. Two dots indicate that data are not available or are notseparately reported.
– A dash indicates that the amount is nil or negligible.- A hyphen (-) indicates that the item is not applicable.- A minus sign (-) indicates deficit or decrease, except as
indicated.. A full stop (.) is used to indicate decimals./ A slash (/) between years indicates a crop year or
financial year, for example, 1990/91.- Use of a hyphen (-) between years, for example, 1990-1991,
signifies the full period involved, including the beginning and end years.Reference to “dollars” ($) United States dollars, unless otherwise stated.Annual rates of growth or change, unless otherwise stated, refer to annual compound rates.In most cases, the growth rate forecasts for 2001 are rounded to the nearest quarter of a percentage point.Details and percentages in tables do not necessarily add tototals, because of rounding.
The following abbreviations have been used:
ACP African, Caribbean and Pacific (Group of) States ADB Asian Development BankADF Asian Development FundBIS Bank for International Settlements (Basel)bpd barrels per daybps basis pointsCIS Commonwealth of Independent StatesCPA Cotonou Partnership AgreementCPI consumer price indexDAC Development Assistance Committee (of OECD)ECB European Central Bank
EMU European Economic and Monetary UnionEU European UnionFDI foreign direct investmentf.o.b. free on boardGATT General Agreement on Tariffs and TradeGDP gross domestic productGNP gross national productGWP gross world productHICP Harmonized Index of Consumer PricesHIPC heavily indebted poor countriesIBRD International Bank for Reconstruction
and DevelopmentICT information and communications technologyIDA International Development AssociationIFC International Finance Corporation (World Bank)IMF International Monetary FundIT information technologyM&As mergers and acquisitionsMFN most-favoured nationNAFTA North American Free Trade AgreementNPL non-performing loanODA official development assistanceOECD Organisation for Economic Cooperation
and DevelopmentOPEC Organization of the Petroleum
Exporting Countriespb per barrelProject LINK international collaborative research group for
econometric modelling, coordinated jointly by the Development Policy Analysis Division of the United Nations Secretariat, and the University of Toronto
PRSP Poverty Reduction Strategy Paper (IMF and World Bank)
SDRs special drawing rights (IMF)SOE State-owned enterpriseTNC transnational corporationUNCTAD United Nations Conference on Trade
and DevelopmentUN/DESA Department of Economic and Social Affairs of the
United Nations SecretariatWTO World Trade Organization


The world economic recovery that started in 1999reached its peak before the close of 2000 but is expectedto continue at least until the end of 2001, albeit at aslightly slower pace. The outlook is for global economicgrowth to moderate from 4 per cent in 2000 to 3.5 percent in 2001, with the slowdown expected to be limitedin extent and geographic scope (see table I.1).
Among the developed countries, the outlook for eco-nomic growth in the United States of America is less san-guine than in 2000, the expansion in Europe is slowingand expectations for Japan, although improved, continueto be modest. The overall result will be an easing of thehigh rate of growth achieved by the developed countriesin 2000. On the other hand, the developing countries as agroup are expected to sustain the momentum that theyreacquired in 2000 and which is on a par with that of themid-1990s. Within the group, it is expected that growth inEast Asia will decline in 2001 as the high rate achievedby a number of countries in the region in 2000 returns tomore sustainable levels. In other developing regions,growth is expected to be similar to, or better than, theimproved level attained in 2000. It is therefore anticipat-ed that, barring unforeseen shocks, the developing coun-tries will play an important role in underpinning globalgrowth in 2001. The forecast also points to some consol-idation in the rapid growth that the economies in transi-tion as a group achieved in 2000, but their collective per-formance is nevertheless expected to remain strong and tocontribute to the resilience of the world economy (seechapter III).
There are a number of potential threats to thisfavourable outlook, including fragile current-accountimbalances, higher oil prices, instabilities in financial andforeign exchange markets and excessively tight monetarypolicies. Any of these could lead to a more abrupt declinein economic activity, particularly in the major countries.At the same time, as reflected by the experiences ofArgentina and Turkey at year-end, developing countriescontinue to be subject to the vagaries of the internationalfinancial system and these two cases could portend morewidespread problems for developing countries and transi-tion economies in the year ahead, particularly if any ofthe other threats materialize.
Economic growth in 2000 was unexpectedly and unusu-ally high and widespread. The increase in gross world prod-
uct (GWP) exceeded the earlier forecast of 3.5 per cent1 andwas the strongest in more than a decade. This outcome wasthe result of improvements in all major regions of the worldand was associated with double-digit growth in the volumeof international trade. There were only four countries (Côted’Ivoire, the Democratic Republic of the Congo, theRepublic of Moldova and Zimbabwe) that experienced afall in gross domestic product (GDP) in 2000, by far thelowest number for more than a decade. Compared to 104 in1999, 121 countries increased per capita GDP in 2000 (seetable I.2). Of these, 73 were developing countries, com-pared to 60 the previous year.
THE STATE OF THE WORLD ECONOMY AT THEBEGINNING OF 2001
Following the sharp declines in output and trade result-ing from the financial crises of 1997-1998, there wasconcern that the recovery might take a considerabletime. However, the downturn was surprisingly short-lived as continuing vitality in North America and, to alesser extent , Western Europe underpinned worlddemand. Once under way, the recovery in the crisis-affected countries unfolded quickly, although unevenly,in 1998 and 1999.
As the world entered 2000, the quickening revival inactivity and trade continued. The improvements in growthduring 2000 were widespread, but particularly marked ina number of developing countries and economies in tran-sition. This vigorous performance was associated with amarked acceleration in the growth of international trade,but was also accompanied by a further widening in theexternal imbalances among the major economies. In con-trast with the expansion in trade, capital flows to devel-oping countries declined in 2000. Oil prices, which hadmore than doubled over the course of 1999, continued toclimb in 2000. Some non-oil commodity prices, whichhad suffered precipitous declines in 1998 and 1999, alsobegan to rise.
The continued buoyancy of the economies of NorthAmerica and the unexpectedly strong recovery in many
1G L O B A L O U T L O O K
CHAPTER I: GLOBAL OUTLOOK
1 See World Economic and Social Survey 2000 (United Nations publication, SalesNo. E.00.II.C.1), p. 3.

other developed market economies were importantsources of the good performance in 2000. Most developedeconomies experienced an acceleration in economicgrowth in 2000. Robust consumption spending, growth ininvestment in information and communications technolo-gy (ICT) and related processes, and a rebound in exportsbolstered economic performance in many of theseeconomies. Unemployment rates fell, generally to thelowest level in many years, although they neverthelessremained above 10 per cent in France and Germany.Because of higher energy prices and, in certain cases, thebuild-up of pressure in labour markets and industrialcapacity, consumer price indices rose in most developedmarket economies, but only to an average of 2 per cent(see table A.1).
The economic performance of the developing coun-tries improved significantly in 2000, even though many ofthese countries experienced difficulties with their bal-
ances of payments as a result of higher oil prices.Aggregate output rose at a sharply higher pace than in1999 in all main developing country regions exceptAfrica, where the improvement was modest and thegrowth rate achieved was low, particularly in sub-SaharanAfrica. This weak performance was attributable to,among other factors, adverse weather conditions, furtherdeclines in the prices of some agricultural commodities,and less progress in reducing conflict and political strifethan anticipated. The overall upswing in the developingcountries owed much to the recovery of severaleconomies in Latin America from low or negative growthin 2000. The economies of West Asia, fuel-importing aswell as fuel-exporting, also rebounded strongly while theEast Asian countries that had been affected most by thefinancial crises in 1997-1998 reinforced their strongrecovery. Demand for ICT-related exports from several ofthese countries by developed market economies, as well
W O R L D E C O N O M I C S I T U A T I O N A N D P R O S P E C T S 2 0 0 12
Table I.1.GROWTH OF WORLD OUTPUT AND TRADE, 1981-2001
1981-1990 1991 1992 1993 1994 1995 1996 1997 1998 1999 2000a 2001b
World outputc 2.9 1.0 1.8 1.4 3.0 2.7 3.5 3.4 2.0 2.8 4.0 3½of which:
Developed economies 2.9 1.1 1.8 0.9 2.8 2.3 3.1 3.0 2.2 2.6 3.5 3Economies in transition 1.8 -8.0 -11.8 -6.7 -7.2 -0.6 -0.1 2.2 -0.7 2.1 5.3 4Developing economies 2.3 2.9 4.8 5.2 5.5 5.0 5.6 5.4 1.6 3.4 5.6 5½
World traded 4.5 4.3 5.7 4.6 10.5 8.6 5.5 9.2 3.3 5.8 10.7 8½
Memo items:
World:Number of countries with
rising per capita output .. 74 74 67 100 111 122 122 104 104 121 135Number of countries
in sample .. 129 140 145 145 145 145 145 145 145 145 145
Developing economies:Number of countries with
rising per capita output .. 58 57 54 65 73 81 77 62 60 73 86Number of countries
in sample .. 95 95 95 95 95 95 95 95 95 95 95
World output growth withPPP-based weightse 3.0 1.0 1.9 1.8 3.8 3.5 4.1 4.1 2.5 3.4 4.8 4½
Annual percentage change
Sources: UN/DESA.a Estimates.b Forecast, based in part on Project LINK. c Calculated as a weighted average of individual country growth rates of gross domestic product (GDP), where weights are annual GDP valued at 1995 prices and
exchange rates.d Average of the growth rates of the volume of exports and imports for historical data.Only volume of exports data are used for estimate and forecast.e Employing an alternative scheme for weighting national growth rates of GDP, based on purchasing power parity (PPP) conversions of national currency GDP into
international dollars.

as the mutual reinforcement of growth via trade linkagesamong these countries, played a major role. Chinareturned to a growth rate of over 8 per cent whereasgrowth in India declined somewhat. Nevertheless, itremained sufficient to provide the Indian population withanother annual increase in output per capita of over 3 percent (see table A.5).
Despite the overall progress in the developing world in2000, recovery from the setbacks in 1997-1999 remainsincomplete: employment and real wages are recoveringbut have returned to pre-crisis levels in relatively fewcases. It will also take some time before the broader neg-ative social consequences of the crisis are fully corrected.
Growth in the economies in transition increasedsharply in 2000. The strong recovery in the RussianFederation exerted beneficial effects on many of theneighbouring countries that continue to depend on theRussian economy for a substantial proportion of theirtrade. Similarly, the economic acceleration in WesternEurope contributed to the improvement in growth in many
European economies in transition, especially the ten thathave been negotiating for accession to the EuropeanUnion. The high rates of inflation in a number of CIScountries were reduced in 2000 but average price increas-es accelerated somewhat in Eastern Europe and the BalticStates. Discouragingly, the improvement in the growth ofoutput was not accompanied by any significant inroadsinto the high levels of unemployment that characterizemost of these countries (see table A.3).
Two supply-side factors played an important role inmoulding global economic performance in 2000. The firstwas the negative supply shock stemming from theincrease in oil prices to levels not observed for a decade.This had significant negative effects for net fuel-import-ing countries.
Oil prices were particularly volatile in the second halfof 2000 and reached about $38 per barrel (pb) inSeptember 2000. On average for the year, pricesincreased by about 60 per cent from 1999 to 2000. As aresult, the total bill for oil imports in the net fuel-import-
3G L O B A L O U T L O O K
Table I.2.DEVELOPING COUNTRIES: GROWTH OF PER CAPITA GDP BY REGION, 1998-2001
Number of Growth of GDP per capitacountries Decline in GDP per capita exceeding 3 per centmonitored 1998 1999 2000a 2001b 1998 1999 2000a 2001b
Frequency of high and low growth of per capita output (number of countries)
Developing countries 95 33 35 22 9 28 23 26 39of which:
Latin America 24 8 12 6 1 7 5 5 4Africa 38 11 13 9 3 11 6 8 16Eastern and Southern Asia 18 9 2 1 1 7 10 11 15Western Asia 15 5 8 6 4 3 2 2 4
Memo items:Least developed countries 40 14 15 10 8 10 5 6 10Sub-Saharan Africa 31 8 11 8 3 8 4 6 11
Percentage of population
Developing countries 95 23.1 20.5 6.3 2.4 63.1 59.8 62.0 71.8of which:
Latin America 24 55.5 69.0 13.6 1.1 24.3 5.9 26.4 7.0Africa 38 44.9 37.7 23.5 8.6 27.0 14.8 14.6 37.9Eastern and Southern Asia 18 13.5 6.6 0.0 0.0 81.0 82.6 82.7 92.6Western Asia 15 14.5 50.0 21.9 17.9 16.6 9.9 10.0 38.9
Memo items:Least developed countries 40 29.7 30.5 16.7 13.0 42.4 32.3 38.4 51.3Sub-Saharan Africa 31 39.4 44.4 30.0 11.7 20.9 7.2 15.9 31.0
Source: UN/DESA, including population estimates and projections from World Population Prospects: The 1998 Revision (United Nations publication, Sales No. E.99.XIII.9).a Preliminary estimates.b Forecast, based in part on Project LINK.

ing developing countries2 increased from some $100 bil-lion in 1999 to almost $160 billion in 2000. This increaseis equivalent to about 1.3 per cent of the GDP for thisgroup. With net capital flows to all developing countriesdecreasing in 2000 (see chapter II), the majority of fuel-importing developing countries had to meet this increasedcost either by using foreign exchange reserves or byreducing other imports. The resulting crowding-out ofconsumption and investment represents the welfare lossto these countries of the increase in the oil price.
As discussed in detail below, the second supply-sidefactor that played a role in 2000 was the continuingimpetus of investment and expenditure on ICT innova-tions and products, particularly in the United States butalso in a number of other developed and developingcountries. One result, especially for the developed coun-tries, was to raise the potential rate of sustainable growthby increasing productivity growth. For the developingcountries, notably the more advanced countries of Southand East Asia, the primary benefit was the export oppor-tunity that this created. This served as a beneficial post-crisis boost to demand, although it had lost its momen-tum by the end of 2000.
A further major characteristic of 2000 was the instabil-ity in foreign exchange markets for major currencies, withthe erosion of the value of the euro being the most notabledevelopment. At the beginning of 2000, the United Statesdollar, which had been appreciating with respect to mostother currencies since the Asian financial crises, wasexpected to soften as a result of the large current-accountdeficit of the United States and the expectation of a “softlanding” of the United States economy. However, the dol-lar continued to appreciate vis-à-vis other major curren-cies, with the exception of the yen, during 2000.
The appreciation of the dollar intensified in the thirdquarter. The threats posed by increasing oil prices anddoubts about the ability to control inflation in Europewithout jeopardizing growth caused a mini currency cri-sis in September. When the euro slumped to around $0.85in mid-September, several major central banks, includingnotably the Federal Reserve of the United States, under-took a joint intervention in currency markets on the ini-tiative of the European Central Bank (ECB). For a shortwhile, the euro improved against the United States dollar.Subsequently, however, it slumped again (see figure I.1).This renewed weakness did not elicit another coordinatedintervention, although the ECB intervened in foreignexchange markets on its own three times in earlyNovember 2000. There was also an appreciable erosion in2000 in the value vis-à-vis the dollar of a number of othercurrencies, notably those of Australia, New Zealand and afew other Asian countries.
Although earlier forecasts for a recovery of the euroagainst the United States dollar have proven wrong, arebound of the euro continues to be deemed likely forseveral reasons. First, the gaps between the United Statesand the euro area in both growth rates and expected yieldsare forecast to narrow, causing capital outflows fromEurope to the United States to decline. Second, corporaterestructuring has gathered pace in Western Europe andvarious reforms and deregulations, including in labourmarkets and pension arrangements, have been ongoing. Intime, these measures should improve Europe’s competi-tive position and benefit the euro. Finally, inflation dif-ferentials between the United States and the euro area areexpected to be in favour of the euro.
Higher energy prices contributed to a build-up in infla-tionary pressures in some countries, as manifested in a pick-up in “headline inflation rates”. In order to avoid a resur-gence of underlying (or “core”) inflation rates, monetaryauthorities in North America and Europe continued tighten-ing of monetary policy by increasing short-term interestrates further during 2000. The year ended with few signs ofmajor acceleration in the underlying pace of inflation.
In spite of the global economic expansion and the sub-stantial economic recovery in emerging market economies,private international financial flows have not revived.Investors continue to be hesitant, as reflected in the factthat risk premia on developing country borrowing remainhigher than prior to 1998 (see chapter II). In addition,although global foreign investment flows continued toincrease rapidly, those to developing countries stagnated in2000. As the year progressed, there were signs of financialinstability in some emerging market economies and greaterrisk averseness on the part of international investors.Notably, despite financial restructuring and reform, there
W O R L D E C O N O M I C S I T U A T I O N A N D P R O S P E C T S 2 0 0 14
2 Excluding China (which has recently changed from being a net fuel-exportingcountry to a net importing country).
Pounds per euroa
Yen per eurob
Dollar per euroa
Daily averages
0.5
0.6
0.7
0.8
0.9
1.0
1.1
1.2
1.3
Jan-99 Mar-99 May-99 Jul-99 Sep-99 Nov-99 Jan-00 Mar-00 May-00 Jul-00 Sep-00 Nov-0080
90
100
110
120
130
140
Source: Eurostat.a Left axis.b Right axis.
Figure I.1.SELECTED BILATERAL EURO EXCHANGE RATES,JANUARY 1999-NOVEMBER 2000

continued to be weaknesses in the financial sector and inthe balance sheets of corporations in some East Asiancountries. At the same time, concerns also arose about cor-porate-sector debt in some developed countries, particular-ly the United States, and the risk premium in corporatefinancing in those countries also increased.
As 2000 progressed, the anti-inflationary policy actions,higher oil prices and unsettled financial markets slowed themomentum of the expansion. By the end of 2000, therewere signs that the growth of production and spending inthe developed countries was levelling off: industrial pro-duction slackened somewhat and corporate earnings, espe-cially in the “new economy” sectors of high technology,proved to be disappointing. The climate for investmentbecame less favourable as interest rates rose, equity pricesreversed their extraordinary rise, and corporate and house-hold balance sheets began to reflect the more restrictivemonetary policy introduced previously.
At the start of 2001, there are signs that the accelera-tion phase of the upswing is coming to an end. In theevent that there is an unduly rapid reversal, conditionsallow for an easing of fiscal and monetary policy stancesin most developed economies: core inflation rates andinflationary expectations are low, labour market condi-tions are becoming less tight in North America andremain so in Europe, there is continued strong underlyingproductivity growth in many countries, and less strain oncapacity. In 2001, there would be little risk in looseningtax and public spending measures and monetary and cred-it conditions if necessary to maintain a high level of out-put. Despite the scope for relaxing policies, only minorchanges in the policy stances in major countries andregions of the world economy were assumed in makingthe forecast for 2001 (see box I.1).
UNCERTAINTIES AND RISKS IN THE OUTLOOK
Within the optimistic outlook, financial markets andoil prices present the greatest downside risks. There arealso upside risks that revolve around the intensificationand spreading of the productivity gains from ICT. If,however, the productivity impetus attributed to ICT hasbeen largely pro-cyclical and due to rapid capital deepen-ing, a slowdown in economic activity, together with adownturn in investment, might be aggravated by a rever-sal in the ICT sector.
The danger of a hard landing for the United States
The increasingly large trade and current-account imbal-ances among major countries are not sustainable and, atsome stage, will be unwound. It would be preferable if thiswere achieved in an orderly, rather than precipitous man-ner, thus leading to a “soft landing”. However, in 2000, thedeficit of the United States widened further. In addition to
being a risk to global economic stability, this deficit isfinanced by global savings, reducing the access of othercountries to international finance.
A loss of confidence in the United States economy ora similar source of turmoil in financial markets couldreduce or even reverse the capital flows that are financingthe country’s trade deficit. Such a “hard landing” for theUnited States would affect the global economy throughvarious channels. By cutting United States’ importdemand, it would reduce export opportunities and thuscurtail effective demand in other countries. Secondly, theUnited States dollar would depreciate and, since a largeproportion of international financial assets are dollar-denominated, this would have a disruptive effect on inter-national financial markets. Any turmoil on global finan-cial markets would adversely affect almost all economies,either directly or indirectly. Within the United States, adecline in capital inflows, particularly if combined withhigher market interest rates, could produce a creditcrunch. Finally, private sector savings in the UnitedStates, especially by households, has reached a very lowlevel while household and corporate sector indebtednesshas become high. If a loss of confidence caused econom-ic actors in the United States to rebuild their savings,domestic demand would be further curtailed, with rippleeffects for other countries.
Related to the “hard landing” scenario, previous fore-casts have referred to the possibility of a major correc-tion in world equity markets, particularly in the UnitedStates, as an important downside risk.3 There was a cor-rection in 2000, albeit not of the magnitude that wasvisualized in the earlier analysis. A continuation of thisdownward trend in 2001 remains a possibility, but itsmagnitude and consequences seem likely to be less thanearlier feared. The correction during 2000 has shakenmany excesses out of equity prices while at the sametime the economy has recorded another year of highgrowth, providing a firmer foundation for the lowerprices. Nevertheless, a further deterioration in percep-tions regarding prospects would aggravate the downturnin equity markets and would accelerate the slowdown inglobal growth. While growth in developing countrieswould be adversely affected, the improvements in theireconomies and in their financial sectors would makemost developing countries somewhat less vulnerable—although not impervious—to such a shock than theywould have been one or two years ago.
Oil prices
One uncertainty at the global level for the outlook for2001 is the price of oil. A major downside risk is that oil
5G L O B A L O U T L O O K
3 See World Economic and Social Survey, 1999 (United Nations publication, SalesNo. E.99.II.C.1), pp. 12-13.

prices will be higher than anticipated in the outlookwhich, taking into account OPEC’s declared price targetrange of $22 to $28 pb, assumes that there will be adecline in average oil prices in 2001 compared to 2000,followed by stability (see box I.1).
Nevertheless, it has to be recalled that all three previ-ous major oil shocks (1973-1974, 1979-1980 and 1990)led to a marked slowdown in global economic growth;some even induced recessions in some developedeconomies. If there is a sustained increase in the price ofoil, many of the mechanisms that produced these out-comes can be expected to operate in a similar fashiontoday, but there would be differences in the magnitudesand distribution of the effects.
In the first instance, there will be a difference in theimpact of an oil price shock on various country groups.The direct welfare loss from the income effects ofincreased oil prices for net fuel-importing countries, asdescribed above, differs from country to country anddepends on the share of oil in total consumption. Energy-saving measures undertaken in many developedeconomies in the wake of earlier oil shocks and changesin the structure of production, towards service sectors inparticular, have made output in these countries less ener-gy-intensive and will correspondingly reduce the adversedirect impact of any oil shock. In contrast, the industrialexpansion in many developing countries during the pastdecade has been energy-intensive. As a result, for anygiven oil-price shock, these countries will experience alarger adverse effect than during earlier episodes.4
As a result of these developments, the geographicaldistribution of oil consumption has undergone majorchanges. Oil consumption in developing countries and ineconomies in transition has grown significantly, whereasthe level of oil consumption in developed economies hasremained at a relatively stable level (although it continuesto account for a major share of the total). The UnitedStates is still the largest per capita consumer of oil and, inabsolute terms, will be the most affected by increasedenergy prices. However, per capita consumption in Asiandeveloping economies has increased significantly, mak-ing them more vulnerable than previously to increases inprices and, in several cases, more affected than othercountries in relative terms.
A review of the past three large oil shocks suggeststhat the negative indirect consequences are likely to belarger than the direct effects. The indirect effects stemfrom a sharp collapse of consumer and business confi-dence brought about by the higher prices. In both 1973and 1979, the index of consumer confidence in the UnitedStates dropped by more than 50 per cent when oil pricesstayed at their peak levels for about 6 to 12 months. In
both instances, this loss of confidence resulted in a reces-sion in the United States, to the detriment of growth in theworld economy as a whole. 5 For some net fuel-importingdeveloping countries, higher oil prices might also triggerfinancial instability, for example a currency crisis, severe-ly damaging short-term prospects.
If oil prices average above $30 pb in 2001, such indi-rect mechanisms would reduce world economic growthbelow the forecast. However, in the light of their behav-iour in the final weeks of 2000, oil prices seem unlikelyto increase to such an extent or for such a long period oftime in the near future. The prospect of lower oil prices isboosted by the slowing world economy, particularly sinceit is centred in the United States, the major oil-consumingcountry; slower growth will moderate demand for oil,including speculative purchases in anticipation of furtherprice rises. In addition, governments in developed coun-tries have shown a willingness to release oil suppliesfrom strategic reserves in order to contain an excessiverun-up in prices.
Managing fiscal imbalances
Fiscal deficits and public debts accumulated by Japanand several developing countries and economies in tran-sition to expedite their recovery from the consequencesof the financial crises need to be corrected, preferablywhen increases in domestic demand, business investmentand consumer spending, rather than policy measures andexport growth, underlie economic activity. Such a transi-tion is important in order to avoid aborting the recoveryin these countries, but also to sustain global growth.
However, it is a challenge for economic policy makerswho have taken measures to stimulate their countries’economic recovery to determine the timing for changingthese policies to a neutral, or even restrictive, stance, inorder to address the large fiscal imbalances. Withdrawingthe stimulus policies too soon may impede recovery inemployment and private consumption, which usually lagthe recovery part of the cycle. On the other hand, main-taining such policies for too long can lead to economicoverheating and growing budget deficits, creating infla-tionary pressures. Such developments in turn would needto be countered through monetary tightening and/or fiscalconsolidation, exacerbating any downturn.
An ICT cyclical correction
Another risk is the possibility of a cyclical downturn inICT-related investment. All types of fixed investment
W O R L D E C O N O M I C S I T U A T I O N A N D P R O S P E C T S 2 0 0 16
4 See also World Economic and Social Survey 2000 (United Nations publication,Sales No. E.00.II.C.1), box II.2, p. 48.
5 A DESA simulation suggests that, if there were the same decline in consumersentiment today, growth in the United States would decline by more than 2.5 per-centage points from the baseline, verging on a recession. The ripple effectsthroughout the world economy would reduce global GDP growth by two percent-age points.

tend to be pro-cyclical and ICT-related investment isunlikely to be an exception. It must therefore be expect-ed to fluctuate over the full business cycle and, given itswidespread and growing role, this could result in short-term cyclical turns for the global economy.
While the ICT revolution holds substantial potential forlonger-term growth, expectations in the recent past havebeen over-optimistic, resulting in ICT-related “bubbles”.The large correction in the value of many ICT stocks inworld equity markets since the spring of 2000 has alreadydampened the earlier optimism about the potential of ICTand ICT-related investment is likely to slow accordingly.
Nevertheless, such investment has been running at veryhigh levels for the past few years and the general econom-ic slowdown is likely to reduce this to more moderate—but not low—levels. In an increasingly competitive envi-ronment—which is likely to become more competitive ina slowing world economy, ICT-related investment plays acrucial role in raising productivity and must therefore beexpected to continue. At the same time, even a slowdownin the rate of growth of such investment could result inshort-run overcapacity in the sector, as indicated, forexample, by the large fluctuations in the prices of semi-conductor products. If these prices were to drop even fur-
7G L O B A L O U T L O O K
The preliminary results for 2000 and forecasts for 2001 are based on country monitoring by the Secretariat, as well as the consistent setof data emerging from the Project LINK forecasting exercise. The latter’s outcome depends on assumptions regarding key policy meas-ures; these in turn are based on the broader monitoring by the Secretariat. The detailed country-specific assumptions made to generatethe LINK forecasts are available from the web site (www.un.org/esa/analysis/link), but the most important are as follows:
1. Monetary policy• Monetary policy in most developed countries will be kept at the stance prevailing at the end of 2000. The Federal
Reserve of the United States will hold interest rates steady throughout the forecast period;• The European Central Bank (ECB) is assumed to raise its policy rates by 25 basis points (bps) in the first quarter of 2001 and
thereafter hold rates steady.• The Bank of Japan is anticipated to raise its rates by 25 bps in the first half of 2001.• Monetary policy in developing countries and economies in transition that still had high interest rates in 2000 and only a tenta-
tive economic recovery will be further eased. For countries of this group with strong economic growth in 2000, especially thosethat target inflation or peg their exchange rate, interest rates are expected to be increased.
2. Fiscal policy• Japan: the baseline assumes that Japan will not introduce another policy stimulus package.• Other developed countries: because of increased budget surplus, fiscal policy in most developed countries is expected to be
mildly expansionary as various tax cuts and some incremental spending plans have been proposed or already approved in sev-eral countries.
• Developing countries and economies in transition: assumptions vary from country to country, depending upon recent fiscal per-formance and growth outlook, but mild restraining or less stimulus should be the general trends, given that the majority of theseeconomies are facing budget deficits, which need to be reduced through fiscal consolidation.
3. Exchange rates• United States dollar vs. euro: given expected growth and interest rate differentials, the euro is expected to start to appreci-
ate at the beginning of 2001 to reach $1.14 by the end of 2002. • United States dollar vs. the yen: the rate is assumed to remain steady on average at 107 yen to the dollar throughout the
forecast period. • Developing countries and economies in transition: those with a fixed exchange rate regime are assumed to preserve nominal
rates while those with a flexible exchange rate regime are assumed to maintain real exchange rates throughout the forecastperiod, with some variations depending on individual country situations.
4. Oil and non-oil commodity prices• Oil prices: will stay at $30 pb until the spring of 2001 and thereafter decrease gradually to $27-$28 pb by the end of 2001.• Metals and industrial raw materials: prices will remain flat at levels observed in late 2000.• Foodstuffs and agricultural products: prices remain at the average levels observed for 2000.
5. Capital flows to Emerging Market Economies• The baseline forecast assumes that such capital flows will increase modestly in 2001. External financing conditions for emerg-
ing market economies will remain as constrained as recently observed. However, the foreign debt situation of these economiesis expected to improve further. Net foreign direct investment inflows will remain the dominant financing instrument.
BOX I.1: ASSUMPTIONS OF THE FORECAST

ther because of excess capacity created during the recentICT “bubble period” or because of a fall in demand withthe economic downturn, the impact on economies thatdepend heavily on exports of such products, notably thosein East Asia, would be considerable.
The potential of ICT
Investment spending on computer equipment and soft-ware, the Internet, and telecommunications is expectedto continue and to provide a stimulus to the global econ-omy over the next few years, although not on the scale ofthe recent past. So far the bulk of total ICT-relatedinvestment has been concentrated in developedeconomies, where it has been growing at a double-digitrate, but more and more developing economies andeconomies in transition have also been speeding up theirinvestments in these activities.
Whether the recent changes in computers, softwareand the internet amount to a true “industrial revolution”with a “new economy” is a hotly debated topic, includ-ing among economic specialists.6 Nevertheless, themost recent measurements provide additional evidenceof the continued rise in productivity growth in theUnited States, with a growing, if still small, componentattributed to the ICT “productivity revolution.” The risein the trend of productivity growth implies that, withappropriate policies, the United States economy cannow be sustained along a growth trajectory that is morethan one percentage point above that observed duringthe preceding two decades without igniting any signifi-cant inflation.7
A similar acceleration in productivity growth has notyet been measured in official aggregate statistics for otherdeveloped economies, largely because both the develop-ment and application of ICT have been lagging that of theUnited States by several years. However, some recentstudies indicate that, if the latest revision in statisticalmethodology of the United States is applied to majorWestern European economies, such as Germany, a rise inproductivity growth due to ICT is evident.8 There are alsotentative signs of similar gains for Australia and New
Zealand and perhaps Japan. Generally, the difference inproductivity growth between Western Europeaneconomies and the United States is probably narrowerthan the official data suggest.
With appropriate policies, these gains should in timealso spread to developing economies, in the first instancethose most advanced in their level of technologicalsophistication. The East Asian economies have alreadybeen benefiting from ICT exports in their economicrecovery, but productivity gains beyond the ICT-produc-ing sectors have not yet been documented.
In the optimistic scenario of the “new economy,” thefurther diffusion of the ICT revolution will improve theway in which economic resources can be utilized.Extending the productivity boost from the ICT revolutionto a broader range of countries would increase the poten-tial non-inflationary growth of the world economy forsome time to come. Further productivity and trade gainsfrom ICT for a growing number of countries are an ele-ment in the optimistic outlook for the near term.Nevertheless, various factors have to coalesce for othercountries, including other developed countries, to emu-late the recent improvement of productivity growth in theUnited States. The spread of ICT-led technological inno-vation to more countries depends on sustained capitaldeepening through increased investment. Technologicalinnovation and assimilation are also contingent on steadyimprovements in the quality of labour through educationand training. At the global level, the efficiency gains fromfurther global economic integration need to be capturedby a larger set of countries.
Despite its potential, ICT is not a panacea and will haveto be complemented with sound policies and continuedeconomic reform. Sustaining structural reforms in some ofthe emerging market economies that were most affectedby the financial crises of 1997-1998 has been difficult, butpersistence with these efforts, as well as structural reformsin a wide swathe of other countries at various levels ofeconomic development, continues to be needed. A largenumber of countries, especially in sub-Saharan Africa,continue to lag in their economic modernization and struc-tural change. How to pull them into the mainstream of sus-tainable growth so that they can contribute to and benefitfrom global economic expansion, including the ICT-revo-lution, remains a challenge to and obligation for the inter-national community. Nevertheless, with adequate interna-tional cooperation, continued economic reforms and high-er productivity growth spreading through the world econ-omy, the improved rate of growth envisaged for 2000-2001 might be feasible for some time to come. If realized,global economic performance in the new decade would besome 0.50 to 0.75 percentage points above the averagegrowth observed in the 1980s and 1990s, albeit still belowthe averages of the 1950s and 1960s.
W O R L D E C O N O M I C S I T U A T I O N A N D P R O S P E C T S 2 0 0 18
6 For different views in the debate, see, for example, Robert J. Gordon, “Does the‘new economy’ measure up to the great inventions of the past?” (Cambridge,Massachusetts: National Bureau of Economic Research, Working Paper 7833,August 2000); Stephen D. Oliner and Daniel E. Sichel, “The resurgence of growthin the late 1990s: is information technology the story?” Journal of EconomicPerspectives, Vol. 14, No. 4 (2000), pp. 3-22.
7 See World Economic and Social Survey 2000, op. cit., p.26.8 Two recent studies have reported the “arrival of the new economy in Germany.”
See Deutsche Bank, Economics Weekly, 8 September 2000, pp. 8-13, whichreports on an investigation by Deutsche Bank; and Ibid., 25 August 2000, p. 5,which summarizes a study undertaken by the Bundesbank. Also the EuropeanCommission recently reported the impact of ICT on productivity growth, albeitwith great variations among the 15 member States (European Economy, No. 71,2000 (Luxembourg: Office for Official Publications of the EC, 29 November2000).

As the tempo of world production accelerated in 2000,exports and imports of all groups of countries increasedat significantly faster rates and the pattern of world tradebecame more balanced among countries. Developingcountries’ trade rose significantly faster than that of thedeveloped economies and the economies in transitionand helped support the current global expansion. In thisregard, developing countries served both as a strong mar-ket for rising exports and as a prime source for importsof primary products and final manufactures. The world-wide rise in production and trade strengthened primarycommodity markets, with increases in the value and vol-ume of exports of non-fuel primary products; prices forpetroleum, which had increased substantially in 1999,continued to climb in 2000 but retreated towards the endof the year. Net financial flows to developing and transi-tion economies fell in 2000, but official flows increasedmoderately and there were higher, if small, net inflowsof portfolio investment. Progress on debt relief was lim-ited. Foreign direct investment flows reached a newrecord in 2000, but the increase was fully accounted forby flows to developing countries, with the surge in merg-ers and acquisitions serving as the driving force.
The more rapid and even expansion of trade improvedthe prospects for continued world economic growth in2001. However, continuing large payments imbalancesamong major trading countries and the difficulties experi-enced by some developing countries in obtaining financeon world markets despite their improved economic fun-damentals highlight the need for further action to ensurethat international financial markets support the long-termdevelopment of the world economy. Similarly, the declinein exports and the slow growth in imports of the leastdeveloped countries (LDCs) in 2000 point to the impor-tance of improved access to markets and enhanced assis-tance to address the special trade problems of these coun-tries, as well as further policy measures in the countriesthemselves.
A STRENGTHENING AND BROADENINGEXPANSION IN INTERNATIONAL TRADE
Main features of the current recovery ininternational trade
The growth of international trade accelerated and broad-ened in 2000 from the uneven recovery that had takenplace in 1999. The volume of world merchandise importssurged almost 11 per cent in 2000, the highest raterecorded in the past decade (see figure II.1). Importdemand remained exceptionally robust in North America,strengthened among the developed economies andincreased rapidly across the developing countries and theeconomies in transition. The rise was particularly strongin Latin America and the Caribbean and in the RussianFederation, where imports had declined significantly in1999, and in South and East Asia, where economic activ-ity and international trade continued to recover from theeffects of the financial crisis of 1997.
9I N T E R N A T I O N A L T R A D E A N D F I N A N C E
CHAPTER II: INTERNATIONAL TRADE AND FINANCE
0
2
4
6
8
10
12
Growth of world tradeGrowth of gross world product
2001f2000p199919981997199619951994199319921991
Annual percentage change
Figure II.1.GROWTH OF WORLD OUTPUT AND TRADE, 1991-2001
Source: UN/DESA.

In terms of exports, the main beneficiaries of thestrengthened revival in world trade were South and EastAsia and China, where the volume of merchandiseexports increased by 13½ and 21½ per cent respectively,and North America, Western Europe and Central andEastern Europe, all regions where exports rose more than10 per cent in 2000. Exports from North Africa and theRussian Federation recovered from the declines in 1999,while Latin America maintained the previous pace ofexport expansion. Export growth in Africa, however,remained slow, especially in sub-Saharan Africa, wherethe increase in exports was only 2 per cent in 2000, lessthan in 1999 (see table A.7).
The expansion of the volume of world trade encom-passed primary commodities as well as manufactures,with exports of agricultural commodities rising over 10
W O R L D E C O N O M I C S I T U A T I O N A N D P R O S P E C T S 2 0 0 110
Table II.1.GROWTH OF WORLD MERCHANDISE TRADE BY BROAD COMMODITY GROUP, 1999-2001
1999 2000p 2001f
Value of trade
Food, beverages and tobacco -1.4 9.2 7.6
Raw materials 1.6 11.1 7.3
Mineral fuels 31.3 58.1 -3.5
Manufactures 2.7 8.4 12.5
World merchandise trade 3.8 12.1 11.5
Volume of trade
Food, beverages and tobacco 16.2 10.5 3.0
Raw materials 7.6 8.0 4.9
Mineral fuels -6.2 1.5 1.5
Manufactures 5.8 11.6 8.6
World merchandise trade 5.8 10.7 8.4
Unit value of trade
Food, beverages and tobacco -14.8 -1.1 4.5
Raw materials -5.6 2.7 2.3
Mineral fuels 40.0 56.5 -5.0
Manufactures -3.0 -2.9 3.6
World merchandise trade -1.9 1.3 2.9
Annual percentage change
Source: UN/DESAp Preliminary.f Forecast.
per cent in 2000 and the volume of metals, minerals, andother kinds of crude materials increasing 8 per cent (seetable II.1). Countries in which manufactures provided amajor share of exports benefited most from the morebuoyant international economy as trade in those productssurged over 11½ per cent in 2000. Prices in the petrole-um sector continued to climb sharply as the volume of oiltraded on international markets grew only slowly.
The general level of prices of all traded goods onworld markets in 2000 rose less than 1½ per cent. Thiswas mainly attributable to a continued softening of aver-age prices when denominated in United States dollars ofnon-fuel internationally traded goods. Among non-fuelprimary commodities, however, the index of average dol-lar prices for broad categories of non-fuel primary com-modities masked marked differences in trends in the priceof individual basic commodities (see table A.8). Dollarprices for such metals as nickel, aluminium and copper,for example, continued to strengthen in 2000; similarly,those for some foods and raw materials (such as sugar,soya bean meal and groundnuts, and cotton, rubber andwood), which had fallen in 1999, responded to theupswing in world economic activity with large increases.Prices of other non-fuel primary commodities, such ascoffee, rice and various animal and vegetable oils, con-tinued to fall on world markets in 2000, in some cases by10 per cent or more. Reflecting continued decline in thecosts of producing computer, telecommunications andother kinds of equipment, the average dollar price ofmanufactured goods exported by developed countries fell3 per cent in 2000, the same as in 1999. These variedchanges in the prices of different categories of tradedgoods led to significant changes in the terms of trade ofdifferent groups of countries classified by export orienta-tion and geographic area.
As a result of the more even distribution of worldexport growth over countries and regions and improve-ments in the terms of trade of some developing countries,the purchasing power of exports and the pattern of worldimport absorption became more balanced in 2000between the developed and the developing countries.Measured in current prices and exchange rates, the shareof the value of world imports accounted for by develop-ing countries rose 1 percentage point in 2000 to about 29per cent. Much of the increase occurred in South and EastAsia and in China, where continuing strong thrusts ofexport expansion more than compensated for smalldeclines in the terms of trade. These countries raised theirshares of both world exports and world imports to about15 per cent. In the petroleum- and mineral-exportingcountries of Latin America, Africa and West Asia, signif-icant increases in the purchasing power of exports werethe result of more modest increases in export quanta butlarge increases in the average unit values for their

exports. In these regions, however, import demand laggedbehind the rise in purchasing power, and larger trade sur-pluses or smaller trade deficits emerged in these countriesin 2000.
The trade surpluses of the fuel-exporting countries,including the Russian Federation and Norway, widened in2000 as a result of further increases in oil prices. Similarly,the strengthening in prices for some food and other agri-cultural products reduced trade deficits or enlarged tradesurpluses in a number of developing countries. In contrast,the continuing decline in the unit value of manufacturestraded on world markets has reduced both the terms oftrade of many countries in South and East Asia that exportthese goods as well as their trade surpluses.
On balance, the growth and change in the commoditycomposition and pricing of merchandise trade in 2000raised the global trade surplus of developing countriesand economies in transition from less than 1 per cent ofworld exports in 1999 to almost 2½ per cent in 2000. TheUnited States market absorbed much of the increase in netexports as the appreciation of the dollar and a rapid risein its economic activity led to an extraordinary increase inits imports, with its trade deficit widening to account forover 7 per cent of the value of world exports.
The depreciation of the euro dampened import growthand reduced the dollar value of the trade of countrieswhose currency fell in value with respect to the UnitedStates dollar. For this reason, when measured in dollars,the nominal increases in exports and imports of theEuropean Union were less than their volume increases,and the overall trade balance of these countries remainedin surplus as the volume of their exports was boosted bythe depreciation of their currency.
Factors affecting trade in main world regions
Contrasting rates of domestic economic growth, changesin exchange rates and changes in the relative prices ofinternationally-traded goods led to contrasting rates ofexport and import growth among the main regions of theworld (see table A.7). Moreover, the large trade imbal-ances among major groups of countries continued towiden in 2000.
The growth in the volume of merchandise imports ofthe developed market economies increased to almost 9per cent in 2000. The increase in volume of real exportsof these countries accelerated even more rapidly, almostdoubling the 5.3 per cent increase recorded for 1999.Measured in current United States dollars, the share ofthis group of countries in total world imports fell one per-centage point to 68 per cent. Sales to the United Statesprovided the most dynamic export opportunities, with astrong dollar and robust domestic demand driving up thevolume of imports substantially in 2000. By comparison,
the growth in import demand in Europe was moderate,largely because the weak euro dampened demand forproducts from outside the euro area. With full economicrecovery proving elusive, imports into Japan increasedless rapidly than in any other major economic area.
Import demand and export deliveries in the economiesin transition in 2000 recovered sharply from the declinesin trade in 1999 following the Russian financial crisis. Anotable feature of the trade of Central and EasternEuropean countries was the increase in their exports as aresult of the acceleration in growth in the EuropeanUnion in 2000. The Czech Republic, Hungary, Poland andSlovakia, in particular, have benefited from increaseddemand from Austria, France and Germany, while coun-tries in southeastern Europe benefited from expandingtrade with Greece and Italy. Foreign-owned companies inthe economies in transition have played an important rolein promoting exports to their home countries, resulting insubstantial gains in intra-industry trade. In the case of theRussian Federation and several other CIS countries,export receipts swelled in 2000 owing to higher prices forpetroleum. The improvement in the export earnings of theeconomies in transition, especially of those countries forwhom petroleum is a major export, bolstered their pur-chasing power on world markets and their import demandincreased by more than the world average.
Import demand in many developing countriesremained stagnant or declined until late 1999 in thewake of the earlier financial crises. The early recoveryin aggregate output in developing countries relied over-whelmingly on exports to developed countries and ondomestic policy measures designed to stimulate theeconomy, and was usually accompanied by pressures toreduce any current-account imbalances and to replenishforeign exchange reserves. Since early 2000, when therecovery firmed and spread to domestic demand, importdemand has begun to recover in response to the acceler-ation in domestic investment and private consumption.Strong export volume growth and an improvement in theterms of trade allowed many of these countries both toincrease imports and to continue to replenish foreignreserves in 2000.
Within the developing world, countries in Asia andLatin America and the Caribbean provided the strongestexport drive and import absorption. Imports into Southand East Asia and into China in 2000 surged at rates inexcess of 15 per cent and 25 per cent, respectively, as therecovery phase of these economies matured and theirexport expansion accelerated in response to the improv-ing international economic environment. In West Asia,export values and volumes of both fuel-exporting andfuel-importing countries rose strongly in response,respectively, to the improvements in their terms of tradeand to rising levels of economic activity in their main
11I N T E R N A T I O N A L T R A D E A N D F I N A N C E

markets. Similarly, imports into Latin America turnedfrom a decline of over 3 per cent in 1999 to an expansionof over 9 per cent in 2000, while strong increases inexports remained a main engine of growth in the region,especially in Mexico.
In contrast, the growth of exports and imports in Africawas moderate, reflecting generally slower rates of eco-nomic growth and more limited access to external financ-ing. Measured in real terms, the rate of increase in bothexports and imports was less than the correspondingincreases in world trade. In sub-Saharan Africa, exportsrose only 2¼ per cent in 2000, following a rise of less than3½ per cent in 1999. The value of exports from the region,in contrast, rose 30 per cent in 2000, owing to the rela-tively high proportion of petroleum and the upswing in oilprices; an upturn in some non-fuel commodity markets,notably those for metals and minerals, also contributed tothe increase in export value. On average, real imports intoAfrica are estimated to have increased over 7 per cent in2000, compared to about 4 per cent in 1999. However,imports into sub-Saharan Africa rose only 2 per cent in2000 in real terms, after falling 1½ per cent in 1999.
In spite of the recovery in world trade, large tradeimbalances remain and, in the case of some major tradingcountries, increased in 2000. The trade deficit of theUnited States, in particular, continued to swell during2000, reaching an estimated $440 billion—some 4½ percent of the country’s GDP—compared to $340 billion in1999. On the other hand, the large trade surpluses ofJapan and Western Europe declined somewhat. In the caseof developing countries, surpluses in net fuel-exportingcountries widened by about $100 billion in 2000, but thetrade account of other developing countries, which hadregistered a surplus in 1999, went into deficit. A similardevelopment occurred in the group of economies in tran-sition, where a growing trade surplus of the RussianFederation was partially offset by a deficit in Central andEast Europe.
The changing pattern of trade balances in 2000 stemsin part from conditions that have shaped the internationaleconomy in recent years and developments during thecourse of the year. Factors that have widened the tradeimbalance of the United States during the past few yearsinclude the differential in the pace of economic growthbetween the United States and other developedeconomies; a strong United States dollar owing in part tointerest-rate differentials in favour of the United States;and buoyant capital inflows, including into equity mar-kets, in the United States. Especially important in 2000was the surge in prices for fuels, compared to magnitudesprevailing during the past two to three years. It is esti-mated that some $60 billion, or two-thirds, of the rise inthe United States import bill is accounted for by theincrease in the cost of imported oil.
Higher oil prices in 2000 also led to changes in the nettrade balance of other countries. As indicated in chapter I,they resulted in a transfer of purchasing power from fuel-importing economies to fuel-exporting economies, reduc-ing the availability of resources that could otherwise havebeen mobilized for investment or higher consumption inthe former group of countries; correspondingly, the gainfrom the change in the terms of trade in the latter countriesprovided expanded opportunities for growth and increasedconsumption. In the case of the net fuel-exporting devel-oping countries, the net trade balance is estimated to haveincreased by $90 billion in 2000. Similarly, the RussianFederation and several other CIS countries (such asAzerbaijan and Turkmenistan) also benefited from higheroil prices: the doubling of the trade surplus of the RussianFederation in the first half of 2000 stemmed largely fromthe rise in oil prices and its trade surplus for all of 2000 isestimated at almost $60 billion. The accrued purchasingpower of these economies on world markets is expected tobolster international trade in the next several years.
The prospects for world trade in 2001
The upswing in world merchandise trade over the pasttwo years is expected to moderate in 2001 along with theanticipated deceleration in world economic growth. Themore subdued pace of economic growth in NorthAmerica and Europe and in those developing countriesthat have served as an engine of import demand duringthe current expansion is the proximate reason for theslowdown in world trade. Leading indicators of industri-al production point to weaker growth ahead in Europeand emerging economies in Asia and Latin America.Export orders received by United States manufacturersand merchandise export volumes from Japan both weak-ened towards the end of 2000. World manufacturing pro-duction appears to be losing momentum. Given theimportance of manufactures for world trade, any sus-tained slowdown in industrial production in general andmanufacturing in particular points to slower world tradegrowth in the year ahead. The large trade imbalances andthe instabilities in the exchange rates among the majorcurrencies are also likely to have a dampening effect oninternational trade.
The expected slowdown in some rapidly growingeconomies to a more sustainable pace is likely to beaccompanied by a parallel reduction in the rates ofincrease in imports. The extraordinary growth in theimport demand of the United States since 1997 is forecastto decelerate to 4½ per cent in 2001 as the growth of theUnited States economy moderates. Notwithstanding theslowdown in import absorption, the United States tradedeficit is forecast to stay around 4 per cent of GDP, pos-ing the risk of an abrupt adjustment in world trade if its
W O R L D E C O N O M I C S I T U A T I O N A N D P R O S P E C T S 2 0 0 112

foreign capital inflows decline unexpectedly. Australia and New Zealand also have large current-
account deficits, reaching 5 and 8 per cent of GDP,respectively. These are unlikely to be sustainable andtheir previous pace of import growth is also expected todecrease in response to slower overall growth but also tothe currency depreciations that have already taken place.The forecast declines in import volume growth areexpected to be offset to some degree by a pickup in realimport demand in Europe. On the other hand, foreigndemand is not expected to increase in Japan, despite aforecast pickup in growth, as exports are being damp-ened by an appreciation of the yen and a slowdown in thecountry’s major markets in North America and South andEast Asia.
Among the factors leading to a restrained increase inimports into almost all developing country regions are ahigher oil import bill, limited foreign exchange reservesand falling revenues from exports of electronic compo-nents by countries in South and East Asia. In response tothe changed situation, the increase in the nominal importdemand of the developing countries that took place in2000, estimated at almost $260 billion in current pricesand exchange rates, is seen as tapering off by $20 billionin 2001. This anticipated falloff is associated mainly witha slowdown in the value and volume of imports into Southand East Asia and China, where it at once reflects and con-tributes to the outlook for more moderate rates of increasein production in the year ahead. The Latin American andCaribbean region is also forecast to experience a slowerrate of nominal and real import growth in 2001. In con-trast, nominal imports are expected to rise in 2001 in thecase of Africa and West Asia, but a forecast decline in theterms of trade in these regions is expected to lead to areduction in the rate of growth of import volume.
Import demand in Central and Eastern Europe and theCommonwealth of Independent States is expected toincrease rapidly in both nominal and real terms in 2001.In the case of the CIS, the large changes that took placein its terms of trade in 2000 are expected to bolster itsnominal demand for imports in 2001, despite a forecast ofslower economic growth.
While slower, the expansion in world imports forecastfor 2001 is expected to provide a generally buoyant exter-nal environment for developing countries, with thedecline in export growth being concentrated in the devel-oped economies. Although the forecast slowdown inexport growth is most marked in the case of WesternEurope, the region’s exports are still expected to increaseby 6¾ per cent in 2001. For the developing countries,forecast growth for the volume of exports remains above10 per cent, with exports from countries in South and EastAsia and from China expected to increase at rates wellabove this average. On the other hand, exports from
Africa are not expected to rise significantly faster in 2001than they did in 2000. The expansion of exports of thecountries of East Europe is expected to continue at therapid pace of recent years.
DEVELOPMENTS IN COMMODITY MARKETS
Although, over the longer term, world trade has providedstronger opportunities for countries that export manufac-tures, the aggregate value of commodity exports hasgrown faster than that of manufactures in recent years asthe world recovery has given a stimulus to commoditydemand. Only a few primary commodities have benefitedfrom this upturn, however, and there were sharp diver-gences in the movements of prices of various groups ofprimary commodities in 2000. Prices for tropical bever-ages and vegetable products weakened further, those forfood and agricultural raw materials firmed and those forminerals and metals and crude petroleum continued tosurge. On average, the combined index of non-fuel com-modity prices rose 4½ per cent when measured in UnitedStates dollars and by almost 9 per cent when measured inSpecial Drawing Rights (SDRs) by the end of the thirdquarter of 2000 when compared with the same quarter ofthe previous year. In terms of real prices (that is, thecomposite dollar price index for non-fuel commoditiesdeflated by an index of prices of manufactures exportedby developed countries), non-fuel commodities increasedin purchasing power in 2000 through the third quarter.
This upturn in the composite indices for non-fuel com-modities is the first since the mid-1990s, when a cyclicalupswing in prices was cut short in 1997 by the downturnin world economic activity brought about by the Asianfinancial crisis. The current strengthening in a broadarray of non-fuel commodity prices was preceded by thereactivation of the world economy in 1999 and accompa-nied by much larger increases in the price of petroleum(see figure II.2). However, the revival of commodityprices has not been as strong or as broad-based as themid-decade upswing, and, despite the upturn, the outlookis for the share of primary commodities to continue itsdecline relative to trade in manufactures and non-com-mercial services in 2001.
In the petroleum sector, the price of a barrel of oilclimbed steadily from a trough in February 1999 of $10per barrel to a peak of $38 per barrel in September 2000,the highest level in nominal terms in 10 years. The rise inoil prices stemmed from strong demand (driven by a fasterpace of world economic growth), a slow supply responseand low inventories that enhanced supplying countries’ability to control marginal supply in the short term.
Responding to concerns over the effect of increased oilprices on the world economy, in March 2000 OPEC adopt-ed an informal target range of between $22 and $28 per bar-
13I N T E R N A T I O N A L T R A D E A N D F I N A N C E

rel for its basket price of oil. OPEC subsequently increasedproduction quotas four times with the aim of bringingprices back into the target zone. In addition, the UnitedStates decided to sell 30 million barrels of crude oil from itsStrategic Petroleum Reserve to help reduce imbalances inworld oil markets. By the end of 2000, crude oil prices hadweakened to within the range targeted by OPEC.
Oil prices in 2001 are expected to remain somewhatbelow the average of the past year. Nevertheless, thepotential for higher prices exists. First, present assess-ments imply suppliers will have to operate near capacity.
A colder winter than expected or faster than anticipatedgrowth in the world economy could push prices upbecause the capacity to satisfy stronger than expecteddemand is limited in the short- to medium-term. Second,oil prices will continue to be affected by political devel-opments in key producing regions, and there is a possi-bility of interruptions in supply. In this regard, Iraqremains an important source of uncertainty. Alternatively,a stronger slowdown than forecast in the United Statesand Europe could contribute to a more significant drop inprices than is foreseen. Moreover, recent increases inspending on capacity expansion should increase supply.
The rise in oil prices since early 1999 has had a pro-found effect on the world economy. Large changes in oilprices imply a substantial transfer of resources from oilconsumers to oil producers. For fuel-exporting countries,the windfall revenues have alleviated—at least in theshort term—financial constraints and allowed increases inconsumption and investment. For fuel-importing coun-tries, on the other hand, the increase in oil prices hasreduced the domestic supply of goods and services,heightened inflationary pressures, and widened the tradedeficit. Petroleum-importing developing countries areparticularly vulnerable to a sustained high level of oilprices since their economies rely heavily on oil, and eco-nomic growth is concentrated in more energy-intensivesectors than is the case for fuel-importing developedeconomies. In addition, they are exposed to indirecteffects if an oil price hike results in higher interest ratesin world financial markets because this increases debt-service burdens, necessitating further cuts in imports (seechapter III).
In the case of some soft commodities such as basicfoods and agricultural raw materials, prices have risenduring the past year and are expected to remain firm orshow positive growth in 2001. After falling for over threeyears, for example, the price index for food commoditiesbegan to gain ground during the second quarter of 2000,and on a quarter-to-quarter basis rose some 10 per cent inthe third quarter of 2000. This was largely attributable tohigher prices for sugar, which rose sharply in response toheavy buying by the Russian Federation, the world’sbiggest importer of sugar, and to a drought in Brazil, amajor supplier whose production and exports are expect-ed to fall significantly in 2000/2001. In addition, globaldemand for sugar has been rising at a rate of 2 per cent inrecent years. Given these developments and lower stocks,world sugar prices are likely to be higher in 2001 than in2000. In markets for grains, surpluses in recent yearshave led to sharp declines in prices for wheat, maize, riceand barley. However, forecasts by the Food andAgriculture Organization of world cereal output indicatethat, while production in developed economies will risealmost 4 per cent in 2000, output in developing countrieswill fall. Prices began to firm in 2000, and increased con-
W O R L D E C O N O M I C S I T U A T I O N A N D P R O S P E C T S 2 0 0 114
0
50
100
150
200Non-fuel primary commoditiesManufactures
Q3Q2Q1Q4Q3Q2Q1Q4Q3Q2Q1Q4Q3Q2Q1Q4Q3Q2Q1Q4Q3Q2Q10
10
20
30
40Petroleum
1995 1996 1997 1998 1999 2000
Price index, 1985 = 100 Dollar price of petroleum
Figure II.2.PRICES OF PRIMARY COMMODITIES AND MANUFACTURES, 1995-2000
50
100
150
200
Minerals, ores and metalsAgricultural raw materialsVegetable oilseeds and oilsFood and tropical beverages
Q3Q2Q1Q4Q3Q2Q1Q4Q3Q2Q1Q4Q3Q2Q1Q4Q3Q2Q1Q4Q3Q2Q1
Price index, 1985 = 100
1995 1996 1997 1998 1999 2000
Figure II.3.PRICES OF NON-FUEL PRIMARY COMMODITIES, 1995-2000
Sources: UNCTAD, Monthly Commodity Price Bulletin, United Nations MonthlyBulletin of Statistics and OPEC Bulletin.
Source: UNCTAD.

sumption of wheat, rice and barley and a fall in produc-tion of maize and rice are expected to lead to furtherincreases in grain prices in 2001. Prices for bananas, aproduct of particular importance to some developingcountries, rose by over 4 per cent in 2000, and are fore-cast to increase by another 6 per cent in 2001.
Prices of tropical beverages have been decliningsteadily since early 1998 and there was another drop in2000. The demand for coffee and cocoa has grown slow-ly, despite the drop in prices, but supply increased byalmost 8 per cent in 1999/2000, after a slight decline in1998/1999. A frost in Brazil in July 2000 and plans byproducers to hold back coffee exports in 2000/2001should, however, stabilize coffee prices in the short term.The oversupply that has characterized the market forcocoa brought its price to a 27-year low in February 2000.Prices recovered somewhat in mid-year but then softenedagain in the latter half. Some producers plan to hold backsupplies of low-quality cocoa in 2001, and this could leadto higher prices. The cost and difficulties of implement-ing this plan, however, are significant, and there could belittle change in market conditions in 2001. In contrast toother beverage crops, prices for tea held up in 1999 and2000, although at a lower average level than previously.However, the possibility of large increments in supply,given normal weather conditions, due to crop develop-ment in the main growing areas, may act as a drag onprices for 2001. For tropical beverages as a whole, pricesare expected to fall further in 2001.
Prices of vegetable oilseeds and oils fell more than 23per cent in 1999 and, with the exception of a short-termspike in palm oil prices, the downward trend persisted, ifat a slower rate, in 2000. This decline is expected to leveloff in 2001 but prices in general remain weak. Similarly,prices for lauric oils such as copra, palm kernel oil andcoconut oil fell in 2000, after having firmed in 1999. Inthe case of soybeans, consumption and import demandgrew almost 5 per cent in 1999/2000, and have remainedhigh in recent months. In response, prices rose during thefirst half of 2000 but slackened thereafter. The outlook isfor a further weakening in 2001, but the impact of adrought in the United States on the market is unknown atthis time. Strong increases in oilmeal consumption in2000, especially in China where rising incomes and agrowing consumer preference for meat help stimulatedemand, led to a sharp increase in soybean meal pricesduring the first half of the year and expectations of con-tinued strong demand point to firm prices for this com-modity. Overall, a tighter market in terms of the demandand supply for oilseeds and a somewhat lower balance inthe case of edible oils should support prices of vegetableoilseeds and oils in 2001.
After falling at about 10 per cent a year since 1996,prices of agricultural raw materials generally firmed in
2000, and rose on average during the last few months ofthe year. Cotton prices, for example, had been falling forfive years, dropping almost 20 per cent in 1999 to reach alow of 44 cents a pound in December. The decline in theprice helped strengthen consumption, and prices in 2000are estimated to have recovered 8 per cent during theyear, with further increases expected in 2001 as forecastworld consumption continues to increase while worldproduction is seen as remaining flat. Because stocks inthe cotton market remain high outside China, however,the upturn in prices is likely to be limited. In the case ofwool, stocks fell markedly in 2000 as China, the world’slargest buyer of wool, made large purchases. Prices areexpected to rise 10 per cent in 2000 and those for appar-el and carpet wools are seen as rising further in 2001.Prices for natural rubber also improved in 2000 asdemand increased in North America, China and India.While sales from stocks should limit prices for this prod-uct, the high cost of crude oil has raised prices for syn-thetic rubber and higher demand from automotive tyremakers in 2001 is expected to contribute to a continuedrevival in prices for natural rubber.
Of all commodities, minerals, ores and metals as agroup experienced the largest price increases during therecent recovery in non-fuel commodity prices as marketsfor a broad array industrial raw materials began tostrengthen, notably in the third quarter of 1999. The mainfactor supporting this upturn in prices is the revival ofworld economic growth, especially the rise in world man-ufacturing production that began to accelerate towards theend of 1999. In the face of strong demand, stocks of alu-minium, copper, nickel and zinc were drawn down in2000 and, in the tighter market, prices rose significantly.Price increases for iron ore and tin lagged behind the gen-eral recovery in prices; in the case of lead, prices onlybegan to firm in the third quarter of 2000 after warehousestocks dropped. In contrast, gold registered its lowestprice for over a year towards the end of 2000. In 2001, inview of the generally low stocks, prices of industrial rawmaterials are expected to continue to recover, but at aslower pace than in 2000.
DEVELOPMENTS IN THE MULTILATERALTRADING SYSTEM
In addition to the commencement of the mandatednegotiations on services, agriculture and the Agreementon Trade Related Intellectual Property,1 three issueshave been prominent in trade policy during the pastyear and have implications for the development of the
15I N T E R N A T I O N A L T R A D E A N D F I N A N C E
1 The year was spent with WTO members submitting proposals for negotiations,which will commence in 2001.
multilateral trading system in 2001 and beyond. Theseare the governance of the multilateral trading systemand its relationship to the process of development; thegrowing membership the World Trade Organization(WTO) and the need to account for the special circum-stances of the developing countries; and the role ofregional integration and trade preferences in the multi-lateral trade system.
The trading system and development
The principal policy development in the trading systemduring 2000 was the response to the outcome of the ThirdMinisterial Conference of the World Trade Organizationheld in Seattle from 30 November to 3 December 1999.The meeting had held promise for both developed anddeveloping countries that progress could be made onissues that would encourage the trend towards a moreefficient and equitable multilateral trading system. Thecontestations around and at that Conference, however,raised the question of whether globalization and anemphasis on economic growth alone could form anacceptable basis for the international trading system. Atthe meeting, the developing countries expressed theirconcerns about further trade liberalization, labour stan-dards, human rights, and environment precepts on theexisting framework governing international trade, andargued that such issues as obtaining wider market accessfor the products in which developing countries have acomparative advantage, including foodstuffs, clothing andtextiles, and footwear, should be given priority.
The failure to agree on a new round of multilateraltrade discussions represented a loss of momentumtowards the continued opening of markets and the gener-al reduction of trade barriers that underlay past efforts toliberalize world trade in goods and services. The effect ofthis on the long-term development of the trading systemis unknown, but discussions of trade policy during 2000focused on fundamental issues relating to the laws andregulations governing the system, rather than operationalproblems of the extension and application of existingrules and processes to all countries.
For development policy, the failure in Seattle and theprevious financial crises in East Asian and LatinAmerican countries have significant implications for thearrangements that govern the multilateral trading system.Some of the countries engulfed by the financial criseswere viewed in many quarters as models for development,reflecting the benefits that could be derived from outwardorientation and macroeconomic policies that focused oneconomic fundamentals in the domestic economy. Theunexpected and sharp downturn that these countries expe-rienced in 1997 and 1998 revived the debate not only onthe appropriate design and implementation of trade poli-
cy to achieve development objectives but also on the lawsand regulations that govern the exchange of goods, serv-ices and capital among countries. These questions aremade even more important by the lagging developmentperformance of many LDCs, and the problems of inte-grating these countries into the world economy. During2000, the problems of addressing the specific needs andconcerns of developing countries, particularly the leastdeveloped among them, in the context of the institutionalstructures of the WTO became a topic of increasing con-cern to the world community.
The Plan of Action adopted by the Tenth UnitedNations Conference on Trade and Development2 held inBangkok in February 2000 called for new multilateralnegotiations to give special attention to the provision ofassistance to developing countries so that they could ben-efit from the opportunities offered by a multilateral trad-ing system. More specifically, it called for market accessconditions for agriculture and industrial products ofexport interest to LDCs to be improved and for consider-ation to be given by developed economies to grantingduty-free and quota-free access for essentially all exportsoriginating from LDCs.
Institutional development of the trading system
One of the principal concerns of developing countriesduring the preparatory process for the Seattle MinisterialConference was the difficulty that many of them werehaving in implementing the Uruguay Round Agreement.Some developing countries took the position that pro-ceeding with further trade negotiations would not be pru-dent before the start of a new round of negotiations. TheWTO General Council decided on 3 May 2000 to exam-ine implementation issues and initiate a number of spe-cial sessions. These discussions culminated in a decisionby the Council on Implementation Issues and RelatedConcerns. 3 The decision covered seven areas: theAgreement on Agricul ture; Agreement on theApplication of Sanitary and Phytosanitary Measures;Agreement on Technical Barriers to Trade; Agreement onthe Implementation of Article VII of the GATT 94;Agreement on Rules of Origin; Agreement on Subsidies;and Countervail Measures and further work.
The number of countries encompassed by the existingset of internationally-agreed rules and regulations gov-erning the multilateral trading system of the World TradeOrganization rose to 140 in November 2000. Members ofthe WTO now account for almost 90 per cent of worldmerchandise trade. Another 28 countries, including
W O R L D E C O N O M I C S I T U A T I O N A N D P R O S P E C T S 2 0 0 116
2 United Nations Conference on Trade and Development, "Plan of Action", TD/386,18 February 2000.
3 WT/L/384, 15 December 2000.

China,4 are engaged in accession negotiations. China’sbilateral agreement with the United States in 2000, fol-lowed by that with the European Union, set the stage forits accession to the WTO after 14 years of negotiations.
In the discussions taking place during the year aboutthe multilateral trading system, a key question was theprocess of accession to the WTO by developing countriesand economies in transition. These countries, especiallythe LDCs, face difficulties when joining and participatingfully in the WTO. Major concerns are that acceding coun-tries are called on to accept higher levels of obligationsthan existing WTO members and that developing coun-tries are called upon to forgo benefits from the specialand differential treatment incorporated in WTO multilat-eral trade agreements.
During 2000, there were also a number of effortsaimed at enhancing both the internal and external trans-parency of WTO. Transparency in the WTO was identi-fied as one of the priorities after the Seattle meetingwhere internal transparency and the effective participa-tion of members was emphasized as an important aspectof the legitimacy of the institution. Some progress onenhancing internal transparency was made in 2000,5
including a number of meetings aimed at confidence-building and transparency. The general conclusion ofthese meetings was that there was no need for a radicalreform of the Organization, but that there was a need toenhance the process of consultation, especially in theareas of inclusiveness and transparency.
Regional integration agreements and trade preferences
Interest in and proposals for regional trading arrange-ments both increased in 2000. Although there is evidencethat regional integration agreements can contribute to theeconomic development of some countries and increasetrade flows among participating countries, the questionremains as to whether these agreements are a “buildingblock” or a “stumbling block” for the greater long-termbenefits that can be derived from multilateralism. If themultilateral trade agenda stalls for a sufficient period oftime, the growing propensity for regionalism and bilater-alism could increase further and lead to greater discrimi-nation towards countries outside regional blocs.
There is already some evidence that this is the case,especially in the Asia region, where such countries as
Australia, Japan and New Zealand, formerly staunchdefenders of the most favoured nation principle, are nownegotiating free trade agreements. One estimate is that,since 1 January 2000, discussions on approximately 20new preferential trade agreements have commenced toadd to the existing total of 214 agreements.6 There arenow only five WTO members that are not members of aregional integration agreement: China; Hong Kong SARof China; Japan; Macao, China; Mongolia and Republicof Korea.
Regionalism offers some development advantages. Itenables developing countries to phase in their integrationinto global markets. Market access for goods is at thecore of the trade programmes contained in most regionalintegration efforts, and there is evidence that these pro-grammes tend to be effective in stimulating trade andindustrial change if they enable smaller and less econom-ically advanced economies to have a strong link to amajor economy or wider market. In this regard, efforts bydeveloping countries to create South-South agreementscontinued in 2000. For example, nine African countriesagreed to establish a free trade area, as did the 14 islandnations of the South Pacific Forum.
In the area of trade preferences, in May 2000 theUnited States enacted the Trade and Development Act of2000, which contains the African Growth andOpportunity Act and the United States/Caribbean BasinTrade Partnership Act. This legislation reduces tariffs ona list of products, including textiles and apparel, for 48sub-Saharan African and 25 Caribbean countries. Inaddition, the Cotonou Partnership Agreement (CPA)between the African, Caribbean and Pacific (ACP) Statesand the European Union was signed in June 2000.7 Thisagreement provides for a preparatory period of eightyears within which the EU will continue to provide pref-erential treatment equivalent to the Lomé Convention forproducts originating in ACP countries. Following thisperiod, new WTO-compatible trading arrangements willbe instituted. In preparation for this transition from basi-cally non-reciprocal trade preferences to reciprocal traderelations, the CPA requires the ACP States and the EU tobegin to examine and negotiate as of September 2002 thevarious options available. More than half of the ACPcountries are classified as least developed. A number ofcountries, including Japan and Canada, have alsopledged specific market access commitments for leastdeveloped countries.
17I N T E R N A T I O N A L T R A D E A N D F I N A N C E
4 China is the world's fifth largest trading country. If intra-EU trade is included, itis the ninth largest exporter and eleventh largest importer in terms of merchan-dise trade.
5 See World Trade Organization (2000), "Internal transparency and the effectiveparticipation of Members", 22 November 2000, available on the Internet atwww.wto.org.
6 Some of the more notable developments include the United States’ agreementwith Jordan that includes provisions on internationally-recognized worker rightsand environmental standards (see www.ustr.gov, 31 October 2000).
7 See also World Economic and Social Survey 2000 (United Nations publication,Sales No. E.00.II.C.1), box II.1, "The post-Lomé Convention PartnershipAgreement between the African, Caribbean and Pacific States and the EuropeanCommunity and its member States", pp. 38-40.

FINANCIAL FLOWS TO DEVELOPING AND TRANSITION ECONOMIES AND MAIN POLICY DEVELOPMENTS
Net financial f lows to developing and t ransi t ioneconomies in 2000 fell to their lowest levels in morethan a decade, mainly owing to strong net outflows in thebanking sector (see figure II.4). There were increased,but still small, net inflows of portfolio investment andalmost stagnant, but still large, inflows of foreign directinvestment (FDI). Official flows increased moderately,but were well below the levels of the immediate post-cri-sis years. Net capital flows are expected to increase in2001, mainly owing to the beginning of a recovery in netprivate capital flows.
Private financial flows
International investor sentiment towards emerging mar-ket economies was volatile in 2000, improving signifi-cantly in early 2000 but deteriorating rapidly late in theyear. Towards the end of the year, foreign investors lostconfidence in Argentina, which raised concern aboutfinanc ia l contag ion in o ther emerging marke teconomies.
In the earlier part of 2000, the upgrading of risk ratingson sovereign debt of a number of countries improved theterms of their external financing. The perceived increasein creditworthiness reflected the strengthening macroeco-
nomic performance in many developing and transitioneconomies. This was the case for some of the largeeconomies of Latin America (Brazil, Chile and Mexico)and particularly pronounced for the Russian Federation,where economic growth, as well as fiscal and current-account balances, benefited from higher oil prices and thesuccessful restructuring of external debt. In addition, theconcerted restructuring of international bond payments ofEcuador, Pakistan and the Russian Federation in 1999 andearly 2000 were completed smoothly, which contributedto the reduced risk perception of emerging market debt.
However, financial developments in developed coun-tries in 2000—the tightening of monetary policy and thelarge gyrations in the equity markets after March—raisedthe cost of funds globally. This tended to offset the gainsfrom improved economic conditions in developing andtransition economies. International investors sought torebalance their overall risk exposure by requiring a high-er expected return as a premium for investment in high-risk instruments, including emerging market bonds. As aresult, there was a widening in “spreads”—the differencebetween the yield on bonds of developing and transitioneconomies and that on the standard risk-free benchmarkinstrument, United States Treasury bonds (see figureII.5). International investors in emerging market stocksalso retreated, resulting in a substantial decline in thosestock prices in the year.8
There was also increasing differentiation in the yieldspreads of emerging market bonds in the second half of
W O R L D E C O N O M I C S I T U A T I O N A N D P R O S P E C T S 2 0 0 118
1990 1991 1992 1993 1994 1995 1996 1997 1998 1999
0
50
100
150
200
250
300
-50
-100
-150
Net official flowsOther net investmentb
Net portfolio investmenta
Net direct investmentTotal net flow
Annual percentage change
2000c
Figure II.4.NET FINANCIAL FLOWS TO DEVELOPING ANDTRANSITION ECONOMIES, 1999-2000
Source: International Monetary Fund, World Economic Outlook Database (on-line),September 2000.a Including portfolio debt and equity flows.b Including primarily short- and long-term bank lending. It may include some official
flows owing to data limitations.c Projected.
0
2
4
6
8
10
12
14
16
18
Jan M ar M ay Ju l S ep N ov Jan M arM ay Ju l S ep N ov Jan M ar M ay Ju l S ep N ov0
10
20
30
40
50
60
70
1998 1999 2000
Russian Federation (right axis)
Latin America (left axis)
Asia (left axis)
Percentage points
Figure II.5.YIELD SPREADS ON EMERGING MARKET BONDS,2 JANUARY 1998 TO 28 NOVEMBER 2000
Source: Data of J.P. Morgan Co., New York.
8 The International Finance Corporation composite index (IFCI Investable) of emerg-ing stock market prices declined 28.5 per cent for the year by end-October 2000(see http://www.spglobal.com/ssindexmainifci.html).

2000, both among regions and among countries withinregions. On the one hand, the yield spreads on interna-tional bonds of the Russian Federation narrowed signifi-cantly in 2000. Spreads were in the neighbourhood of 10percentage points in the second half of the year, still con-siderably above Asian and Latin American averages. Onthe other hand, yield spreads on bonds of Latin Americanand Asian countries followed a general widening trend inthe second half of the year, with deteriorating economicprospects and political uncertainty in individual coun-tries, such as Argentina, Indonesia and the Philippines,having a significant effect.
Poor economic performance in Argentina was com-pounded by growing uncertainty about the direction of eco-nomic policies late in 2000. These developments causedinvestor concern about the country’s capacity to finance itsgrowing debt to grow, heightening investors’ perception ofrisk of lending to the country (see box II.1). As a result,
yield spreads on the country’s international bonds surged inOctober as investors lost interest in taking up new issuesthat were needed to cover the external financing gap.Foreign currency borrowing in Argentina also became dif-ficult. One-year Treasury bills auctioned in early Novembercarried an interest rate of 16 per cent, almost double therate on similar bills auctioned in July.
The Argentine difficulties were quickly reflected inthe yield spreads on Brazilian bonds, which widenedsharply. Moreover, because the outstanding stock ofArgentinian bonds accounts for almost a quarter of out-standing bonds from emerging markets, a crisis in thatcountry would have far-ranging financial ramifications,with particularly damaging effects on access to financingby developing and transition economies. Thus, therestoration of confidence induced by the IMF-led finan-cial support programme had positive effects that extend-ed beyond one country.
19I N T E R N A T I O N A L T R A D E A N D F I N A N C E
In the second half of 2000, there were growing concerns that the Government of Argentina might find it difficult to make pay-ments on its foreign debt in 2001. Argentina would have to raise around $20 billion at a time when the country’s ability to secureaffordable financing in the international capital markets could not be assured. The negative mood of the markets could be attrib-uted to a general deterioration of investor attitude towards high-risk lending, including that to emerging markets, as well as thecountry’s poor growth record, weakening fiscal position and unstable political environment. This had led to a sharp increase inthe risk premium on Argentine debt (both domestic and foreign) and an unwillingness among creditors to maintain exposure tothe country.
Negative sentiment in financial markets forced Argentina to seek a new lifeline in the form of an emergency financing pack-age, that reached almost $40 billion, with the IMF and other multilateral and bilateral official creditors. The local banks and pen-sion funds agreed to provide the balance of the necessary financing. For its part, on 10 November 2000, the governmentannounced a new economic plan featuring a government spending freeze and lower taxes.
The new financial package could be seen as a cooperative crisis-prevention arrangement involving both official and privatesectors. The major goal of such an arrangement was to ease fears about the government’s ability to meet its borrowing require-ments and to secure bridge financing until the economy and government finances showed signs of improvement and the countryregained access to international financial markets. The government did not seek funding from international financial markets inthe short term, as it did not expect that their sentiment would turn around quickly.
The adjustment programme and financing were needed to ease concerns about Argentina’s fiscal solvency, which had beenundermined by the 1998-1999 recession, itself triggered by adverse exchange-rate movements, low commodity prices andunfavourable developments in international capital markets. The austerity measures implemented early in 2000 to cut the fiscaldeficit had led to the spiral of falling business and investor confidence, declining investment and higher interest rates, furtherslowing economic growth and postponing recovery. The new programme appears more realistic and politically feasible. Whilethe medium-term objective of fiscal balance is reaffirmed (although the target date has been extended from 2003 to 2005), theannounced measures highlight the shift in short-term priorities. The new programme is focused on economic recovery and aimsat “growing out” of the deficit, supported by less restrictive fiscal policy. In the short term, the fiscal deficit is expected to belarger with a decline in tax revenues due to lower than previously projected economic growth in 2000 and 2001. This cyclicalwidening of the deficit will not be offset by an increase in tax rates.
This support package for Argentina marked a departure from traditional adjustment programmes in two respects. It placedmore emphasis on growth as the major precondition for the successful resolution of financial problems. In the past, interna-tionally-supported adjustment programmes were often criticized for setting contractionary macroeconomic targets for crisiseconomies. Secondly, the programme appeared to be pre-emptive, as its initiation had not been preceded by massive outflowof funds.
BOX II.1. ARGENTINA: OVERCOMING THE PAYMENTS CRISIS

Private creditThe net outflow of bank credit from developing and tran-sition economies in 2000 (see figure II.4) resulted main-ly from large repayments from some of the Asian crisiscountries. Robust growth of exports in Eastern andSouthern Asian countries generally enabled imports togrow without requiring increased financing by tradecredits. Although net bank lending to countries outsideAsia increased somewhat, it remained far below levelsprior to the Asian financial crisis. These developmentsreflect, on the one hand, the continuing efforts by inter-national banks to reduce loan exposure to developing andtransition economies and, on the other hand, the lowlevel of financing demand from some of these countriesowing to their improving external account balances orlarge surpluses and their increased use of alternativesources of funds, such as international and domesticbond markets.
Net capital flows from the issuance of bonds by devel-oping and transition economies remained limited in 2000.Although gross bond issuance rose from 1999 levels,there was an increase in repayments, owing mainly to theearly retirement of Brady Bonds by Latin American coun-tries. Latin American countries, primarily Argentina,Brazil and Mexico, continued to account for the majorityof bond issuance. In contrast, bond issuance by Asiancountries remained low, as the persistence of substantialexternal surpluses limited their external borrowing needs.
Equity investmentNet portfolio equity investment flows to developing andtransition economies rebounded substantially in 2000 asa whole but suffered from increasing volatility in stockprices during the year. There was a surge in internationalinvestment in stock issuance by companies in the ICTsector in some Asian and Latin American countries andfrom the privatization of communications and naturalresource enterprises in some countries, such as China,Brazil and Turkey, earlier in the year (see below).Increased foreign purchases of stocks in the secondarymarkets of some countries, such as the Republic ofKorea, as macroeconomic performance improved, wasalso a factor. However, these positive developments werefollowed by declines in flows later in the year as interna-tional investor sentiment deteriorated, particularlytowards investment in the ICT sector. Growing uncer-tainty about the sustainability of the economic recoveryin a number of developing countries also contributed.
In contrast, the net flow of FDI to developing and tran-sition economies changed only marginally in 2000 andremained the largest and most stable source of net privatecapital flow (see next section).
Official financial flows
Net official flows to the developing and transitioneconomies increased in 2000 from 1999 levels butremained sharply lower than the highs in the aftermath ofthe financial crises. While there continued to be substan-tial repayments on emergency loans by countries affectedby the financial crisis, there was a larger rise in disburse-ments on new loans and grants.
Net lending by the World Bank rose sharply while netflows from the regional development banks are estimatedto have increased moderately for the year. Concessionallending expected from the Asian Development Bank for2001 received a boost from the successful completion ofnegotiations in September 2000 to replenish the AsianDevelopment Fund (ADF). Pledges to ADF VIII, which isto provide financing for the period 2001-2004, totaled$5.6 billion, and compare favourably with the estimated$5.1 billion in loans made under ADF VII.
There was a net return of funds to the InternationalMonetary Fund ($11.2 billion) in the first eight months of2000, as loans extended to the crisis-affected countriescontinued to be repaid. The Fund also received net flowsof $3.3 billion from the transition economies. Total Fundcommitments to the developing economies for the firstthree quarters of 2000 reached $14.3 billion compared to$6.1 billion for the same period in 1999, as large stand-byloans were extended to several countries, includingArgentina, Indonesia and Nigeria. Commitments to thetransition economies dropped from $5.0 billion to only$122 million in 2000 as only two stand-by loans wereapproved.
Net official development assistance (ODA) flowsincreased in 1998 and 1999, but their continued growth in2000-2001 remains uncertain because of the end of thesurge in emergency assistance to crisis-impacted coun-tries and the different prospects for a sustained rise inODA levels by individual donor countries. Some coun-tries (Canada, Denmark, Italy, the Netherlands, Norway,and Sweden) are set to raise their ODA flows, while othercountries (Finland, New Zealand, Spain) seem likely tomaintain current levels; other countries (France, UnitedStates) may reduce their ODA expenditures in 2000.Moreover, prospects for contributions from Japan areuncertain since a review of ODA spending is to be under-taken with a view to reducing it as part of efforts to con-solidate public expenditures in the 2001 fiscal year.
Debt relief and debt sustainability of poor countries
The revised target for the Enhanced Heavily IndebtedPoor Countries (HIPC) Initiative as of October 2000 wasto have 20 countries (down from the original 24) reach
W O R L D E C O N O M I C S I T U A T I O N A N D P R O S P E C T S 2 0 0 120
the “decision point” by the end of the year.9 As of themiddle of November, only 12 countries10 had done so,receiving total debt relief commitments of $19.1 billion.Twelve other countries were under preparation11 andwere expected to result eventually in a further $14.7 bil-lion of debt relief. Consideration of nine other countrieshad not advanced, as they were affected by conflict, civilunrest or governance problems.12
There have been two main constraints on the pace ofthe process: the availability of funding and the conditionsrequired of recipients. Prospects for the former improvedwith the approval by the United States Congress at theend of October 2000 of a $435 million contribution to theHIPC Trust Fund, as well as of IMF’s gold revaluation tofinance its share of debt relief.13 Nevertheless, as of earlyNovember, only $854 million of the $2,188 millionpledged by donor countries had been disbursed to theTrust Fund.
Conditions for recipients to receive relief became morecumbersome with the introduction by IMF and the WorldBank of the poverty reduction strategy papers (PRSPs) inlate 1999. PRSPs entail significant analysis and publicconsultation by recipient Governments, in particular onpoverty reduction strategies. However, owing in part tothe introduction of the use of interim PRSPs, a simplerdocument that sets out governments’ commitment to andplans for developing a PRSP, progress in moving coun-tries through the HIPC process should not be furtherdelayed. Also, the launch of “floating” completion pointsin the Enhanced Initiative provides some flexibility inassessing countries’ policy track records, allowing debtrelief to be activated by evidence of good performancerather than being bound by a strict time requirement. Inaddition, the large amount of documentation and datarequired by the Initiative is complex and burdensome andstretches the capacity of debtor country administrations.The establishment in April 2000 of the JointImplementation Committee, to enhance the partnershipbetween IMF and the World Bank in this area, was intend-ed to mitigate additional delays resulting from these dif-ficulties.
Despite the several enhancements of the Initiativesince its inception, two broad concerns remain. First, thegroup of countries who may qualify (currently 33 out of
the original 41) might not include all countries in need ofrelief, owing, among other factors, to the nature of thesustainability analysis on which the determination ofrelief is calculated. To allow additional countries to par-ticipate, particularly those emerging from conflict, the“sunset clause”—that is, the deadline for HIPC candi-dates to meet the entry requirements—was extended fortwo years, until end-2002. Meanwhile, the Gambia wasadded to the list of HIPCs in 2000.
Second, it is unclear whether countries will achievedebt sustainability when the Programme has been com-pleted. The debt service reduction is only modest in somecases and the sustainability analysis is based on severalassumptions, including on export and import prices,growth rates of trade and overall economic growth, thatmight not materialize. As the swings in commodity pricesin 2000 suggest, there is a risk that HIPC relief might notbe sufficient and that additional measures might be neces-sary, even beyond those covered by the clause in theInitiative that allows for additional measures in the eventof extraordinary external shocks at the “completion point”.
FLOWS OF FOREIGN DIRECT INVESTMENT (FDI) IN 2000
FDI flows reached a record level in 2000, estimated at$1.1 trillion, 14 per cent higher than in 1999 (seetable A.9). FDI flows were in the order of only $200 bil-lion one decade ago and have doubled in the past threeyears alone. The recent increase has been primarilyattributable to the growth of cross-border mergers andacquisitions (M&As). Behind this growth were both gov-ernment-related and firm-related factors, such as the lib-eralization of FDI regimes and strategies adopted byfirms in order to benefit more from a globalizing worldeconomy (see box II.2). The value of completed cross-border M&As during January-November 2000 was$1,076 billion,14 some 25 per cent higher than for thewhole of the previous record year. This growth is gener-ally reflected in FDI flows, although each region hasshown a different pattern.
FDI can be undertaken in the form of either a “green-field” investment or a merger or acquisition. GreenfieldFDI is new or additional investment associated with set-ting up or expanding a foreign affiliate, whereas M&Asinvolve the purchase of an existing company in a countryother than that of the acquirer (which becomes a new for-eign affiliate in the case of acquisitions or a new legalentity in the case of mergers).15 Both forms of investmentlead to domestic assets in the ‘host’ country coming under
21I N T E R N A T I O N A L T R A D E A N D F I N A N C E
9 For a definition of the terms and background on the HIPC initiative, see "DebtInitiative for the Heavily Indebted Poor Countries", International Monetary Fund,September 2000, available at: http://www.imf.org/external/np/hipc/hipc.htm.
10 Benin, Bolivia, Burkina Faso, Cameroon, Guyana, Honduras, Mauritania, Mali,Mozambique, Senegal, Tanzania and Uganda.
11 Chad, Ethiopia, The Gambia, Guinea, Guinea-Bissau, Madagascar, Malawi,Nicaragua, Niger, Rwanda, Sao Tome and Principe and Zambia.
12 Burundi, Central African Republic, Democratic Republic of the Congo, Liberia,Myanmar, Republic of the Congo, Sierra Leone, Somalia and Sudan.
13 Release of the final share of the investment income on the profits from the reval-uation of the gold required the approval of the United States.
14 M&As data reported in this section do not exclude portfolio investment.15 For details on the definition and concept of cross-border M&As, see World
Investment Report 2000, op.cit., chapter IV.

the governance of a TNC based elsewhere and both resultin international production, but they differ in the mode ofentry and economic impact and their effects can be dif-ferent. From a statistical point of view, a comparison ofthe magnitude of these two types of investment is fraughtwith methodological problems (see box II.3).
Developed economies
More than four-fifths of FDI inflows in 2000 took placeamong developed economies (see table A.9). Such flowsincreased by one-sixth in 2000, with the increase result-ing mostly from M&As. Western Europe continued to bethe largest host region for FDI in 2000, receiving about$600 billion. FDI inflows to Germany in 2000 were arecord high, reaching almost a quarter of a trillion dol-lars and rivaling those of the United States.16
Western European firms were the most active in cross-border M&A activity, totalling $593 billion of sales dur-ing the first 11 months of 2000. Germany and the UnitedKingdom were by far the largest target countries. In par-ticular, M&A sales in Germany more than quadrupled in2000, to over $230 billion, with the $180 billion purchaseof Mannesmann (Germany) by Vodafone AirTouch(United Kingdom) accounting for the bulk of theincrease. Sales of German firms are likely to increase fur-ther in the light of the abolition of taxes on the sales ofcross-holdings among firms, starting from 2001. TheUnited States continued to be the single largest targetcountry in cross-border M&As.
The decline in FDI inflows in some developed coun-tries largely reflected the fact that they were not party to
W O R L D E C O N O M I C S I T U A T I O N A N D P R O S P E C T S 2 0 0 122
Although M&A data are compiled and reported by a number of database companies, investment banks and consulting firms, thereis no common definition of M&As and the nature and type of data collected are different. There are differences in the timing ofthe recording of the transaction (e.g., at the announcement of a deal or at the final agreement between the two parties), in theforms of M&As that are included (e.g., management buy-outs, acquisition of property, acquisition of convertible stocks that donot have voting control) and in the treatment of additional acquisitions (e.g., further increases in stock holdings by investors whoown already more than 50 per cent, increases in stakes in joint ventures in which one party already owns a certain share).
Data on cross-border M&As include portfolio investment, making it necessary to extract transactions that correspond to thecriteria for FDI (i.e., that involve 10 per cent or more foreign control) from the reported data on M&As.a Furthermore, purchasesfinanced from domestic and international capital markets which are not categorized as FDI also have to be excluded.
FDI flows are a balance-of-payments concept, i.e. are reported on a net basis, with new inflows being netted out by disin-vestment. On the other hand, M&A data capture the total value of a particular transaction, that is, without subtracting the deb-its received from the sale of foreign affiliates. Transaction amounts recorded in M&A statistics are those at the time of theannouncement or closure of the deal and are therefore not necessarily those undertaken in a single year.
a Data on M&As published in UNCTAD’s World Investment Report 2000 exclude such portfolio M&As and therefore conform to the FDI definition as far as the equity sharecriterion is concerned. In 1999, about 13 per cent of cross-border M&As involved the acquisition of an equity share of less than 10 per cent.
BOX II.3. PROBLEMS OF CROSS-BORDER MERGERS AND ACQUISITION DATA
16 The record FDI inflows of $187 billion in the first eight months of 2000 inGermany was due almost solely to the takeover of Mannesmann by VodafoneAirTouch, which was settled by exchanging shares of the former for those of thelatter. This was accompanied by an equivalent volume of capital exports in theportfolio account in the balance of payments.
The current wave of cross-border M&As reflects an interac-tion between corporate factors that motivate firms to under-take M&As and changes in the global economic environ-ment. The corporate factors include: increased market powerand market dominance; access to strategic proprietaryassets; efficiency gains through synergies; expansion of thesize of the firm; diversification and spreading of risks; finan-cial motivations; and managers’ personal motivations. Inaddition, speed is a crucial factor: M&As provide firms withthe fastest way of acquiring assets in different countries.
These factors motivating firms are interacting withchanges in the global economic environment which encour-age or provide opportunities to undertake M&As. Suchchanges are related to technology (the rising costs and risksin research and development (R&D), new information tech-nologies etc.); the policy and regulatory environment (the lib-eralization of trade and FDI, regional integration, deregula-tion and privatization programmes); and the improvementand expansion of capital markets.
BOX II.2. THE DRIVING FORCES FOR CROSS-BORDERMERGERS AND ACQUISITIONS

any large M&As activity in 2000. Thus, in Belgium,inflows in 2000 amounted to only about 40 per cent of theprevious year’s record figure of $102 billion.17 Inflows toSweden in 2000 were only about half the amount for1999, when several large M&A deals took place. Cross-border M&A sales in Japan also declined somewhat, butremained high. FDI in Japan has reflected a shift from theearlier longstanding preference for greenfield investmentto cross-border M&As, starting in 1997. The value ofacquisitions of Japanese firms by foreign firms has beenhigher than that of foreign firms by Japanese firms.18
The United Kingdom continued to be the largestsource of outward FDI flows in 2000. Large investmentsby United Kingdom firms included the acquisition ofMannesmann by Vodafone AirTouch referred to aboveand that of Atlantic Richfield Company (United States)by BP Amoco for $28 billion. In general, investments byEuropean firms in the United States increased further, asa result of such M&As as the $54.8 billion acquisition ofVoiceStream Wireless by Deutsche Telekom, the UBS’$16.5 billion bid for PaineWebber Group and the $13.5billion bid for Donaldson, Lufkin & Jenrette by CreditSuisse First Boston. Japanese FDI outflows would recorda significant increase in 2000 if the acquisition of a 16 percent share of AT&T Wireless (United States) by NTTDoCoMo with an estimated value of $9.8 billion—thelargest investment by a Japanese firm—were completedby the end of the year.
Developing countries
FDI inflows to developing countries in 2000 remainedthe same as in the previous year ($190 billion), but theirshare in the world total continued to decline, falling to17 per cent (see table A.9 and figure II.6). Although part-ly explained by the low level of M&As (including priva-tization transactions), the stagnation of FDI inflows andthe decline in the share of developing countries alsorevealed the difficulties they faced in attracting FDIflows. Greenfield FDI (estimated as the differencebetween FDI inflows and cross-border M&As) in 2000remained at the same level (see table A.9).
While FDI flows to the developing world generallystagnated, there were higher flows to many individualeconomies, such as Egypt and Tunisia in Africa, Mexicoand Venezuela in Latin America, and Malaysia andTaiwan Province of China in Asia. Flows into China andBrazil—the largest recipients of FDI among developingcountries—were almost at the same level or declined
slightly. However, partly in expectation of its entry intothe WTO, FDI flows to China are projected to rebound tothe 1997-1998 level (about $44 billion) in 2001.19 Thelargest decline in FDI flows in 2000 (about $15 billion)was observed in Argentina, as large-scale privatization(transactions such as the $15 billion acquisition of YPFby Repsol) had contributed to a surge in FDI inflows in1999. FDI flows to the Islamic Republic of Iran andJordan increased in 2000 and West Asia is likely to regainits position as a sizeable recipient of FDI inflows. FDI toAfrica increased more than 10 per cent over the amount inthe previous year, but remained small.
Cross-border M&A sales in developing countries alsoremained at almost the same level as in 1999. Such activ-ity has been on the rise in Asia, in particular after thefinancial crisis, reflecting further liberalization in thelegal framework for M&As and sales of firms affected bythe crisis. This effect, however, tapered off in 2000.M&As in South and East Asia declined in 2000.Acquisitions of firms based in the Republic of Korea byforeign firms exceeded $11 billion (including portfolioM&As) in 1999, but declined to $6.7 billion in 2000(January-November), still the largest amount of M&As indeveloping Asia.
Firms in Latin America and the Caribbean have beenthe leading targets for cross-border M&A activities indeveloping countries. In 1998, Brazilian firms were themost sought-after in terms of M&A sales, while in 1999firms from Argentina assumed this position. In 2000,
23I N T E R N A T I O N A L T R A D E A N D F I N A N C E
Percentage
10
15
20
25
30
35
40
45
50
20001998199619941992199019881986198419821980
Figure II.6.SHARE OF DEVELOPING COUNTRIES IN WORLD FDI INFLOWS, 1980-2000
Source: UNCTAD FDI/TNC database.
17 There was a major transaction in the telecommunications sector in 1999 that wasincluded in the country's FDI statistics in 2000.
18 FDI into Japan has never been higher than that country's outward investment.This reflects the fact that greenfield FDI is still dominant in outward FDI, eventhough FDI through M&As has been on the rise.
19 James Kynge, "The lean years come to an end", Financial Times Survey: WorldEconomy, 22 September 2000, p. XI.

Brazilian firms again accounted for the largest amount ofM&As with a value of $26 billion, followed by Mexico($7 billion). In the former two countries, privatizationwas the main source of such sales.20 Spanish firms wereactive in acquiring interests in Mexico (e.g. Telefonica intelecommunications and Fenosa and Iberdrola in electric-ity generation). In 2000, Peru ranked among the leadcountries in M&A activity with the relaunching of its pri-vatization programme, which is expected to raise $3 bil-lion in revenues in the next three to four years.21
In Africa and West Asia, the recent level of M&As hasreflected the small size of privatization programmes, withthe exceptions of Egypt, the Republic of South Africa andTurkey. Relatively large M&A activity was recorded inthe United Republic of Tanzania in 2000.
Central and Eastern Europe
FDI inflows to Central and Eastern Europe increased to$30 billion in 2000, supported by increasing political sta-bility and lower country risks, as well as relatively highlabour skills. FDI flows to the Czech Republic, Hungary,Poland and the Russian Federation are on the rise.Investments by European firms are growing as this regionis increasingly recognized as a production site forEuropean markets, partly in expectation of membershipof the European Union for several Eastern Europeancountries. Privatization, together with generous tax incen-tives in some countries, have contributed to the increasesin FDI inflows recently. FDI flows to Hungary appear tohave reached a plateau, but those to the Czech Republicin 2000 remained as high as in the previous year.
The cost of firms in Central and Eastern Europebought by foreign buyers almost doubled in 1999 andincreased by one third in 2000 (see table A.9). Theseincreases, however, were essentially limited to Poland,where they doubled to $10 billion following the sale ofTelekomunikacja Polska to France Telecom for $4.2 bil-lion. The Czech Republic and Hungary were also majortarget countries for M&As by foreign firms. M&A salesin the Russian Federation were below $1 billion in 2000.
RECENT FEATURES OF CROSS-BORDER MERGERS AND ACQUISITIONS
The share of cross-border M&As in all M&As wasalmost constant at about one quarter in terms of bothvalue and number of deals until 1998. In 1999 and 2000,both shares exceeded 30 per cent, the highest since 1990.
The value of worldwide cross-border M&As as a shareof GWP increased from 0.5 per cent to 2-3 per cent dur-ing the past decade.22 The recent wave of cross-borderM&As is characterized by large-scale deals that havesignificantly increased the volume and changed thedirection of FDI flows. The number of mega deals (thosewith a t ransact ion value of more than $1 bi l l ion)increased to 109 in 1999 and represented some 70 percent of the total value of cross-border M&As.23
Industries that have displayed high levels of cross-border M&A activity include automobiles, pharmaceuti-cals, chemicals, food, drink and tobacco in the manufac-turing sector, and telecommunications, energy and finan-cial services in the services sector. All these sectors havelong attracted large-scale cross-border M&As, partly forstrategic reasons and partly because of liberalization andderegulation in these industries. As is reflected in thisindustry pattern, compared with cross-border M&As dur-ing the boom in the late 1980s, most cross-border M&Asin the current period have strategic and operational,rather than financial, objectives.24 At the more detailedindustry level, M&A activity was by far most prevalentin radiotelephone communications in recent years, fol-lowed by life insurance (under the finance sector), tele-phone communications (except radiotelephone) and elec-tric services.
In some of these industries, in particular such infra-structure areas as telecommunications and utilities thatrequire large investments, privatization has played animportant role. The privatization process involves firms—domestic, foreign, or both—acquiring all or a part of theequity in formerly privatized firms. Most of the cross-border mega deals involving developing countries are pri-vatization-related M&As. In Latin America and Centraland Eastern Europe, privatization has been an importantmeans to attract foreign capital and the share of privati-zation-related investment in total FDI has been signifi-cant in a number of these countries. In Brazil, all megadeals, except one case involving the acquisition of abank,25 were related to the privatization of the telecom-
W O R L D E C O N O M I C S I T U A T I O N A N D P R O S P E C T S 2 0 0 124
20 The privatizations of Telebras in Brazil (1998) and YPF in Argentina (1999) weretypical examples.
21 Marco Aquino, "Peru to boost privatization programme", Reuters, 5 September2000.
22 Even though it is growing dramatically, recent M&A activity is not large by his-torical standards when compared with the size of economies. Even the largestM&A deal, the takeover of Mannesmann by Vodafone AirTouch in 2000, had avalue of only 5 per cent of the combined GDP of the two countries concerned. Incomparison, the creation of US Steel in the final years of 1890s involved theequivalent of 7 per cent of United States GDP, and would have a value of around$600 billion in today's prices.
23 These mega deals are facilitated by the options provided by stock exchanges.Deals that do not require cash have increased over the years. In 1999, stock-swapdeals accounted for more than one third of the total value of cross-border M&As(see UNCTAD, op.cit., p.239).
24 This also may explain why the overwhelming number of cross-border M&As arefriendly. There were only 10 hostile cross-border takeovers out of some 6,000deals in 1999, compared with 15 out of some 1,500, all of which were concludedin developed countries (UNCTAD, op.cit., p.233).
25 See World Investment Report 1999 (United Nations publication, Sales No.E.99.II.D.3).

munications industry, notably the $19 billion sale ofTelebras. More than half the privatization of Telebras(about $11 billion) involved cross-border acquisitions.Privatization is also emerging in developing Asia.
IMPACT OF CROSS-BORDER MERGERS ANDACQUISITIONS AND POLICY OPTIONSBearing in mind the caveats mentioned above concerningthe statistical comparison between M&As and FDI, in2000 the ratio of total cross-border M&As (at face value)to worldwide FDI flows was about four-fifths.26 Thisratio is higher in developed countries, but M&As are alsobecoming more important in developing countries. Theaccelerating pace of M&As has raised concerns abouttheir impact on host country economies. At the heart ofthese concerns is that, in contrast with greenfield FDI,cross-border M&As transfer the ownership and controlof existing assets from domestic to foreign hands. In nor-mal circumstances, greenfield investment not only bringsa package of resources and assets but simultaneouslycreates additional productive capacity and employment;cross-border M&As may bring the same financialresources but do not create immediate additional capaci-ty. Furthermore, certain types of cross-border M&Asinvolve a number of risks at the time of entry, fromreduced employment to asset-stripping to the slowerupgrading of domestic technological capacity. WhenM&As involve competing firms, there are also possiblenegative impacts on market concentration and competi-tion, which are likely to persist beyond the entry phase.
However, these differences in impact between cross-border M&As and greenfield FDI, except for the impacton market concentration and competition, tend to disap-pear in the longer run. Furthermore, under exceptionalcircumstances arising from the risk of bankcruptcy duringfinancial crisis or the need for rapid restructuring underconditions of intense competitive pressures, cross-border
M&As may be an appropriate means of achieving thenecessary objective within a short time frame.
National policy and measures with respect to cross-border M&As need to compensate for any negativeeffects, e.g., as regards employment and resource utiliza-tion.27 For example, incentives, taxation or other proac-tive measures (such as assistance to local partners innegotiating the best price, providing social safety netsand training programmes) may be used to encouragesequential investment and to create additional productivecapacity following a M&A, to promote local diffusion oftechnology, to mitigate adverse effects on employmentand to relocate workers. In addition, FDI policies in gen-eral can be used to maximize the benefits and minimizethe costs of cross-border M&As, through sectoral reser-vations, ownership regulations, size criteria, screeningand incentives. Specific cross-border M&A policies canalso be used for some of the same purposes, e.g. thescreening of cross-border M&As to ensure that they meetcertain criteria.
One important policy instrument is competition policy.As FDI restrictions are liberalized worldwide, it becomesall the more important that regulatory barriers to FDI arenot replaced by anticompetitive practices by firms. In thecontext of cross-border M&As, this requires the adoptionof competition laws and their effective implementation,paying full attention not only to domestic but also tocross-border M&As, both at the entry stage and subse-quently. M&A reviews are a principal interface betweenFDI and competition policy. Increasingly, however, com-petition authorities need to put in place cooperationmechanisms among themselves at the bilateral, regionaland multilateral levels because, by their very nature,cross-border M&As involve more than one nation.International action is particularly important when deal-ing with cross-border M&As at the global level, especial-ly for smaller countries that lack the resources to mountand implement such policies on their own.
25I N T E R N A T I O N A L T R A D E A N D F I N A N C E
26 This means that, if all M&As were financed by FDI, four-fifths of world FDI flowstook the form of M&As. For details, see box II.3.
27 For a detailed description of these sectoral policies, see World Investment Report2000, op.cit., Chapter VI, pp. 159-209.


Performance in all the major regions of the world econo-my improved in 2000, but unevenly. Within the variousregions, some countries did very well while otherslagged and a few deteriorated further. The rates ofgrowth that are anticipated to prevail in the near-term aremore evenly distr ibuted among the various majorregions, but significant differences among country per-formances will remain.
DEVELOPED ECONOMIES
In the recent global economic expansion, the developedeconomies, particularly the economy of the UnitedStates, continued to function as the engine of globalgrowth. Growth in gross domestic product (GDP) for thisgroup as a whole was 3.5 per cent for 2000, up substan-tially from the 2.6 per cent recorded in 1999. In the out-look, growth is forecast to stabilize at around 3 per centfor 2001 (see table A.1). As mentioned in chapter I, thecommon feature of strong ICT-related investment, alongwith the ongoing economic restructuring in many ofthese economies, is likely to sustain a fairly robust paceof further economic expansion.
Once again, the economy of the United States ofAmerica surpassed by a wide margin most forecasts madein early 2000. Robust business investment and solid con-sumer spending, plus a rebound in the demand from the restof the world, supported this stronger pace of expansion.Also labour productivity gains of about 5 per cent in 2000exceeded significantly the pace of previous years. To manyobservers, this continuation of strong productivity growthprovides additional evidence in support of the view thatthere has been a shift in the trend of productivity growthand that this is largely related to the broader application ofcumulative ICT innovation. However, others questionwhether there has been a longer-term shift on account ofICT, beyond the gains that can be imputed to capital deep-ening and the pro-cyclicality of productivity trends. To theextent that there has been such a positive shift, the pace ofexpansion at which demand and supply match withoutexacerbating the pace of inflation has been lifted to about3.5-4 per cent, or at least one percentage point over thetrend observed during the last two decades.
However, a moderation in both consumer spendingand business investment became evident from mid-2000
on. This slowdown resulted from the effects of tighteningmonetary policy (see below), the surge in energy prices,and the poor performance of equity markets. The lastmay have reduced some of the positive effects on con-sumption that, in the past several years, accrued from thelarge appreciation of wealth portfolios, notably wealthheld in equity. In the outlook, growth of GDP is forecastto be around 3½ per cent for 2001. Such a “soft landing”would be highly desirable to secure buoyancy and stabil-ity in the global economy. However, as indicated in chap-ter I, there are several downside risks to this outlook forthe United States.
Economic performance for many other developedeconomies was also more robust than anticipated. GDPgrowth for the economies belonging to the EuropeanUnion was about 3.4 per cent in 2000. This is expected tomoderate to around 3 per cent in 2001 (see table A.1).Comparable but slightly higher magnitudes apply to the11 members of the euro area, where both investment andconsumer spending have been growing solidly, supportedby high levels of business sentiment and consumer confi-dence. A large increase in exports, partly resulting fromthe weak euro and strong external demand, also con-tributed to the economic acceleration in 2000. Despite theexpected recovery of the euro in terms of the UnitedStates dollar (see chapter I) and the slowdown of externaldemand in 2001, exports will continue to provide animportant support to growth in the region. However, thetightening of monetary policy to curb inflationary pres-sures, as discussed below, and the negative effects of thehigher oil prices will moderate growth in 2001 for theeuro area.
Among the large economies in the euro area, Germanyexperienced a strong growth impulse from the externalsector in 2000 while domestic demand, which had beenconstraining economic buoyancy, recovered, in part dueto lower taxes and social insurance contributions from thebeginning of 2000. Whereas economic growth of above 3per cent is expected to continue for France and Spain,growth in Italy is expected to remain sluggish, because ofthe continuing effects of its fiscal consolidation in therun-up to the inception of European Economic andMonetary Union in 1999. The volume and range of pent-up structural reforms that await implementation have alsobeen holding down economic expansion in Italy.
27R E G I O N A L D E V E L O P M E N T S A N D O U T L O O K
CHAPTER III: REGIONAL DEVELOPMENTS AND OUTLOOK

Some of the smaller euro members continued to per-form well in 2000. For example, Ireland bettered the near9 per cent average growth it has recorded in the last fewyears and Finland grew by almost 5 per cent in 2000. Inboth countries, considerable impetus to this performancewas imparted by ICT production, in Finland telecommuni-cations technology and in Ireland software, for which theyhave carved out strong niches in world markets. The eco-nomic momentum in these smaller countries is likely tocontinue for the next few years, provided buoyant globaldemand for ICT-related products can be maintained.
Economic growth for European developed economiesoutside the euro area is expected to continue in 2001. Inthe United Kingdom of Great Britain and NorthernIreland, consumption demand, supported by the apprecia-tion of real estate and the strength in labour markets, wasthe main driving force of GDP growth. In Norway, higheroil prices benefited economic growth: its GDP increased2.7 per cent in 2000, up from 0.9 per cent in 1999, whilethe budget surplus rose substantially. Greece’s GDP in2000 expanded by 3.8 per cent. This pace is likely toaccelerate in 2001 on the strength of expanding invest-ments as the economy is well on the way to euro conver-gence; it is slated to join the euro zone in 2001.
Japan remains the laggard among the developedeconomies. However, a cyclical recovery has been inprogress. After the recovery in 1999 faltered, growth for2000 was some 1.4 per cent. This ongoing recovery con-tinued to be driven by public investment resulting fromthe implementation of the stimulus package approvedtowards the end of 1999. Business investment, especiallyspending on ICT, was also pronounced in 2000. Privateconsumption finally started to show some recovery andexports remained on an upward trend during the year. Afurther impetus from the public sector might be providedif the new stimulus package agreed upon in late 2000 issubstantially implemented, mainly in 2001. Business sen-timent has been improving, and so are corporate profits,along with the rise in industrial production. Nevertheless,growth is expected to remain tepid. The slow pace of thecorporate restructuring needed to restore the soundness ofthe financial system and reduce structural excess capaci-ty will continue to impede stronger growth in incomes,hence in private consumption demand, over the near-term. Also the fiscal consolidation expected in the yearsahead to reduce the mounting public debt will dampengrowth. GDP growth is forecast to increase in 2001, butonly to 2 per cent.
Elsewhere among the developed economies, economicperformance in Australia, Canada and New Zealand wasrobust in 2000. Some moderation is expected for all ofthem in 2001. In Canada, ICT-related investment spend-ing was booming and exports, mainly to the UnitedStates, were strong. As in the United States, growth in
labour productivity was substantial. With less tight capac-ity utilization than in the United States, the growth out-look for Canada remains optimistic. There will, however,be a slowdown—to around 3 per cent—mostly because ofthe expected deceleration in the United States. Sustainingthis pace depends critically on engineering a soft landingin the United States, because the latter is Canada’s majortrading partner by a wide margin. There are more uncer-tainties in the outlook for Australia and New Zealand,however: both economies are facing weakening curren-cies, increasing concern about rising inflation, largeexternal deficits, and tightening monetary policy, withNew Zealand the more vulnerable because of its deterio-rating terms of trade.
Labour markets
Labour markets have been strong, particularly in theUnited Kingdom and the United States (see table A.1).The latter’s rate of unemployment has been hoveringaround the record low of 4 per cent for more than a year,whereas the claimant unemployment rate for the UnitedKingdom has been even lower, though standardizedlabour force surveys suggest an unemployment rateabove 5 per cent. In the other developed countries ofEurope, a significant improvement in labour markets hasoccurred in 2000. For example, the average unemploy-ment rate in the euro area dropped below 9 per cent fromthe two-digit level observed since the early 1990s.Further improvement is expected in conjunction with thecontinued growth in the outlook. However, persistencewith labour-market reforms in countries with high ratesof unemployment will be more important in resolving thestructural problems at the root of their unemploymentsituation than the upturn in the cycle.
In Japan, a mild improvement in employment hasfinally begun to appear, as illustrated by the rising ratio ofjob offers to applicants and the stabilization of the unem-ployment rate. However, ongoing corporate restructuringand the moderate rate of economic growth foreseen in theoutlook suggest that Japan will not experience anymarked improvement in its employment situation in thenear future.
Inflation: rising but basically under control
The headline inflation rates in many developedeconomies rose in 2000 by about one percentage pointover levels registered in 1999 (see table A.1), mainly onaccount of higher fuel prices. Pressure on the pace ofinflation built up gradually in the course of 2000 in mostdeveloped economies (see table A.2). In many countries,inflation rates rose from around 2 to about 3 per cent,which is near or above the inflation target set by the cen-tral banks in many of these economies. Japan has been an
W O R L D E C O N O M I C S I T U A T I O N A N D P R O S P E C T S 2 0 0 128

exception to the general inflation trend in developedeconomies, with the economy still encountering con-sumer price deflation at the end of 2000. None the less,producer prices have started to record a slight rebound.
While higher oil prices were the main cause for theprice upswing, strong economic growth and weakeningcurrencies in many developed economies exacerbated thesituation. This was particularly significant for countries inthe euro area and for Australia and New Zealand, whosecurrencies depreciated considerably against the UnitedStates dollar in 2000. Nevertheless, when the directimpact of the volatile prices of energy and foodstuffs iseliminated and other factors such as changes in taxes ongoods and services are taken into account, the rise in thecore inflation rates was much milder than that in the head-line inflation rates (see figure III.1). This implies thatthere was no significant pass-through of the higher energyprices to other sectors of the economy. If oil prices mod-erate in 2001, so should headline inflation rates.
Several other positive factors are likely to keep infla-tion in these economies from escalating. First, the upwardmovement in inflation rates in developed economiesoccurred after a decade-long effort at disinflation whichhad reduced inflation rates to record lows. Therefore, theinflation expectations of economic agents in theseeconomies should remain low. Second, the rise in produc-tivity in the United States and the possibility that morecountries will be benefiting from similar gains in produc-tivity in the near future is likely to limit any increase inunit labour costs to amounts that can be accommodatedby the gains in labour productivity; rising unit labourcosts are usually the key driving force behind the acceler-ation of inflation. Third, central banks in most developed
economies have been tightening monetary policy vigi-lantly and fiscal positions in most of these economies,except notably in Japan, have been improving (seebelow). This augurs well for a benign macroeconomicenvironment in configuring the inflation outlook. Finally,increasing international competition continues to putpressure on the pricing power for firms. This limits theirability to pass through increased costs, forcing them tocontinue to rationalize production, distribution and mar-keting, or risk narrower profit margins with repercussionsfor their equity values.
Macroeconomic policy stances
Central banks in many developed economies startedtightening their monetary policy in mid-1999 (see figureIII.1). The United States led the shift in policy orienta-tion due to concerns about overheating of the economyand its negative implications for inflation. Other centralbanks soon followed the Federal Reserve’s action.Developed countries continued with their monetary tight-ening in 2000, some (such as Austral ia and NewZealand) rather aggressively. Central banks’ actions inmany countries went beyond reversing previous loosen-ing: by year-end, interest rates were higher than in thefall of 1998 when the move towards the easing of mone-tary policy began. The Bank of Japan abandoned itszero-interest rate policy and raised interest rate by 0.25per cent in August 2000—the first monetary tightening inten years. As signs of moderation in the pace of globaleconomic growth began to surface in mid-2000, the paceof tightening was lowered and some central banks heldtheir policy interest rates steady. The tightening cycle
29R E G I O N A L D E V E L O P M E N T S A N D O U T L O O K
0.0
0.5
1.0
1.5
2.0
2.5
3.0
3.5
4.0
4.5
5.0
CoreHICPInterest rate
OctSepAugJulJunMayAprMarFebJanDecNovOctSepAugJulJunMayAprMarFebJan
Euro zone
1999 2000
0.0
1.0
2.0
3.0
4.0
5.0
6.0
7.0
CoreCPIInterest rate
OctSepAugJulJunMayAprMarFebJanDecNovOctSepAugJulJunMayAprMarFebJan
United States
1999 2000
Figure III.1.INTEREST RATES AND ANNUAL RATE OF CHANGE IN CONSUMER PRICE INDEX IN THE EURO ZONE AND IN THE UNITED STATES, JANUARY 1999-OCTOBER 2000
Sources: Organisation for Economic Cooperation and Development (OECD), Eurostat, and United States Department of Labor.

appears to have come to an end for many developedeconomies, as the moderation in the pace of global eco-nomic growth to a more sustainable level begins to mani-fest itself. Policy interest rates are thereafter expected toremain at long-term neutral levels in these economies.
Fine-tuning monetary policy has always been a verycomplex task. Policy makers are constantly faced with thepossibility that their actions may provoke negative out-comes: higher inflation if monetary policy turns out to betoo loose or an unwarranted economic recession if it is tootight. Thus, it can be argued that the pause in the monetarytightening by the United States Federal Reserve is not onlyon account of the observed moderation in private con-sumption growth but also because of broader concernsabout the robustness of the economy, beyond the problemof the widening current-account deficit. Some signs ofincreasing financial constraints for business investment inthe United States have materialized towards the end of2000: credit conditions for businesses tightened, with cor-porate bond spreads rising; technology equity prices hadexperienced a large correction that was impeding corporatefinancing; and the expected pace of expansion for corpo-rate profit levels had been revised downwards. Furtherincreases in interest rates could intensify these trends. Thiscould provoke a substantial adverse impact on the highlyindebted corporate sector with ripple effects throughout theeconomy. For these reasons, it was assumed when the out-look was prepared that the United States Federal Reservewould hold interest rates steady (see box I.1).
In the euro area, the European Central Bank (ECB) hasbeen confronted with a difficult situation. Inflation, asmeasured by the harmonized index of consumer prices(HICP), has moved up significantly since 1999. Most ofthis acceleration stems from higher oil prices, whose effecton inflation has been exacerbated by the erosion of the euroagainst the United States dollar. Core inflation remainslow, though it has also been increasing as some of the infla-tionary impulses from oil prices and the exchange rate passthrough the economic system (see figure III.1). The ques-tion is how much of the current price impulse will in timefeed through into consumer prices and, more importantly,how much will become embodied in inflationary expecta-tions. There are also uncertainties about whether theseprice impulses are temporary or more permanent in nature.The ECB has expressed its concerns about the possibilityof second-round effects, that is, the extent to which higheroil prices and higher core inflation will eventually bepassed on, especially into wage agreements. The ECB’sconcerns are further aggravated by the maturing economicexpansion in Western Europe and the consequent narrow-ing of the output gap. While these factors might argue foradditional monetary tightening, an overly aggressive movewould risk eroding the economic buoyancy and dampengrowth. In the outlook, a limited further tightening was
assumed in 2001 for the euro zone (see box I.1).Fiscal positions in most developed economies contin-
ued to strengthen in 2000 for a variety of reasons otherthan the shared cyclical improvement due to buoyantgrowth. Except for the larger fiscal deficit in Japan, mostdeveloped economies registered an improvement in theirfiscal positions in 2000. In the outlook, fiscal policy inmost of these countries is expected to be mildly expan-sionary as various tax cuts and some incremental spend-ing plans have been proposed or already approved in sev-eral countries.
In Western Europe, substantial progress in reducingbudget deficits over the recent past, together withstronger revenues from the improved growth profile andlower outlays as unemployment declines, have taken thepressure off fiscal retrenchment. The ratio of public debtto GDP, however, remains high in many countries. Majortax reform programmes have either been passed, as inGermany, or are being proposed, as in France and Italy.These encompass to varying degrees reduced taxes, bothpersonal income and corporate taxes. In Germany, theelimination of the corporate capital-gains tax should giveimpetus to economic restructuring, as cross-holdingsunwind. However, the supply side benefits from lowertaxes and from the elimination of various distortions tothe region’s economy must be balanced with short-termcyclical considerations. Many of the proposed budgetshave become pro-cyclical in nature, which can be desta-bilizing. In addition, budgets would need to yield positiveresults over the expansion phase of the economic cycle toensure that countries do not exceed the Stability andGrowth Pact guidelines during cyclical downturns. ThePact expects countries to adhere to a medium-term objec-tive of budgets close to balance or in slight surplus.
In Japan, public spending has played a major role insustaining economic growth, but has not yet succeeded ininducing a sustainable recovery. The sequence of fiscalstimulus packages, however, has left Japan facingincreased fiscal deficits and a very large public debt,which prompted international credit-rating agencies todowngrade Japan’s public-debt instruments. Since theeconomy was still on a tentative recovery, as the imple-mentation of the 1999-2000 stimulus package approachedits end, policy makers opted for yet another such packagein fiscal 2001. However, fiscal policy in Japan is expect-ed to be, on balance, less of a stimulus in the outlook: thepresent large fiscal imbalance implies a major fiscal con-solidation in the future.
Strong economic growth has led to a government sur-plus in the Unites States estimated at over $250 billion in2000. Budget guidelines now anticipate a modest increasein federal spending through 2001, with some small taxcuts likely. In the medium to long run, the fiscal policystance will depend on the outcome of negotiations
W O R L D E C O N O M I C S I T U A T I O N A N D P R O S P E C T S 2 0 0 130
between the new Administration and Congress. Thenewly elected President had proposed a large tax reduc-tion and a small increase in spending. These proposals areestimated to cost about $2 trillion over ten years, whichwill exhaust most of the budget surpluses that had earlierbeen projected.
ECONOMIES IN TRANSITION
Economic growth in almost all economies in transitionwas generally better than had been anticipated and alsowell above 1999 levels. The outlook for the group as awhole for 2001 is for continued strong performance,albeit at a lower level than in 2000 (see table A.3). Theseeconomies have been benefiting to varying degrees fromsuch favourable external factors as high oil prices, buoy-ant growth in Western Europe, continued foreign invest-ment, as well as the strong pace of the economic recov-ery in the Russian Federation itself. Many of these cir-cumstances, however, are likely to be less positive in thenear future
GDP growth in the Commonwealth of IndependentStates (CIS) accelerated to above 6 per cent in 2000,more than double the rate achieved in 1999. This was thebest performance of the region since transition began.This economic recovery was led by a surge in export rev-enues due to soaring oil prices and gains from the import-substitution brought about by the devaluations in 1998-1999. The broad economic recovery of the CIS regionshould continue in 2001, although the high growthobserved in 2000 cannot be sustained as the environmentfor export-led expansion is expected to weaken while theimpetus from domestic demand remains subdued andskewed.
The Russian Federation’s 7 per cent growth estimatedfor 2000 owes much to oil and gas, which account forhalf of exports. Russian oil export revenues doubled,despite the comparatively smaller increase in volumeexported, and had strong ripple effects throughout theeconomy: improved government revenues, rising corpo-rate sector profits and business investment, and recoveryin consumption. The real depreciation of the rouble pro-vided powerful incentives for import substitution, whichled to strong industrial performance and helped to sup-port domestic demand as unemployment started todecline. This in turn created favourable production con-ditions for such sectors as light manufactures and food-stuffs, and increasingly, because of the revival in invest-ment, for machinery, chemicals and armaments. Similardevelopments in the wake of the hryvnia’s devaluationled to the recovery of the Ukrainian economy, the secondlargest in the region. The country recorded its first posi-tive growth since independence. None the less, due to itsnarrow export base, weak energy sector, and limited eco-
nomic restructuring to date, the Ukrainian recovery con-tinues to be more fragile than the Russian Federation’s(see table A.4) 1.
Increased oil prices and progress in implementing thelarge-scale oil and gas pipeline networks in the Caspianregion bolstered growth for Azerbaijan, Georgia,Kazakhstan and Turkmenistan. The smaller CIS non-oileconomies fared moderately, except for the agriculture-dominated Republic of Moldova, which was adverselyaffected by severe drought. At the same time, signs of fal-tering growth could be observed in Belarus andUzbekistan. These two countries have sheltered theireconomies by supporting existing, unprofitable economicstructures and resisting or delaying economic reforms.While such policies can stave off a marked economic con-traction in the short run, they have negative consequencesin the medium to long term, if only because resources con-tinue to be allocated to existing structures rather than tomore competitive new activities. The signs of a slowdown,which also stem from adverse agricultural performances,may signal the limits of the strategy chosen.
Although the Russian Federation launched a reformprogramme and some of the slowly reforming countriesof the CIS have been adopting market-friendly policies,faster growth in 2000 brought some complacency in sus-taining the impetus of reform in some countries. Theprospect of sustained growth for the CIS countriesremains predicated on the extent to which countries withslower structural and market reforms accelerate thosereforms, taking advantage of the present favourablemacroeconomic environment. Due to large market distor-tions, relatively modest changes in the right direction canimprove economic performance. A comfortable balance-of-payments situation and the substantial accumulation offoreign reserves in such key economies as Kazakhstanand the Russian Federation offer an opportunity to accel-erate structural reforms that should pay off in the mediumto long term.
Although a favourable external environment and areversal of the setbacks in agriculture should benefitfuture economic buoyancy, a moderation in the growth ofGDP to 4 per cent is expected for the region in 2001.Weak private consumption, the multiple challenges ofeconomic and broader societal restructuring, and financ-ing constraints in many economies of the region willdampen the feasible rate of growth in the near-term.
In all three Baltic countries, the recovery from thesteep recession induced by the Russian Federation’s cur-rency crisis of 1998 gained further momentum in 2000(see table A.3). In addition to the external sector, domes-
31R E G I O N A L D E V E L O P M E N T S A N D O U T L O O K
1 Quarterly rates of GDP growth are not always seasonally adjusted. This compli-cates not only comparisons across countries, but also the tracking of economicturning points.

tic consumption and investment, aided by low and stableinterest rates, picked up in Estonia and Latvia. Alsoemployment and inflows of foreign direct investment(FDI) recovered in 2000. Among the three economies,Lithuania’s economic recovery has been the most fragiledue to sluggish domestic demand, which is being furtherconstrained by the need for sharper fiscal adjustments.Furthermore, the continued weakness of the euro hasbeen exerting a dampening effect on Lithuanian exportsto markets in the European Union as the lita is pegged tothe United States dollar.
The prospect of accession to the European Union andthe commitment to currency board or quasi-currencyboard arrangements assured a stable economic environ-ment in 2000 and will support continued improvements ineconomic performance in all three countries in the near-term. Economic growth in the Baltic region is expected toaccelerate in 2001. Demand from the European Union,continued reorientation of trade towards western markets,further recovery in the Russian Federation’s transit trade,and the expected strengthening of domestic demand,including investments financed by FDI, are the underly-ing factors. However, the short-term challenge of revers-ing the fiscal slippage of 1999 is being met with varyingdegrees of success and represents one of the major chal-lenges confronting these countries.
Following the acceleration in economic recovery inthe European Union, almost all economies of Centraland Eastern Europe experienced faster growth in 2000,although the pace of economic expansion remained slug-gish in some countries (see table A.3). Sharply increasedexport demand provided a favourable impetus to indus-trial production and continuing inflows of FDI promotedfurther economic modernization. Domestic demand,however, remained subdued in most countries.Agriculture in many countries was affected by adverseweather conditions, with negative repercussions for theircurrent accounts. All countries of the region registeredpositive economic growth in 2000, on average exceeding4 per cent.
Growth will slow in 2001 as external demand isexpected to decelerate. Furthermore, several countries,particularly Hungary and Poland, face the risk of over-heating and are expected to tighten further their macro-economic policies and to continue to combat inflation(see table A.4). Especially Romania and Slovakia willachieve only modest growth as strong recovery continuesto hinge on enterprise restructuring in particular.
As in the previous year, the economic performance ofthe region remained diverse in 2000. In Central Europe,economic growth gained momentum in Hungary due toincreased exports to the European Union, while strongFDI inflows and investment-led domestic demand pulledthe Czech Republic out of its three-year-long recession.
The Polish economy grew rapidly during the first twoquarters of the year, but decelerated sharply thereafterdue to tight monetary policy (see below). Domesticdemand fell but the current-account deficit remained sub-stantial. GDP growth in Slovakia decelerated further asthe economy operated under the constraints emanatingfrom austerity measures and economic restructuring, withfragile corporate and financial sectors.
Economic performance in the countries of South-eastern Europe continues to depend on structuralchanges in a number of sectors and areas of economicactivity. This region benefited from the increaseddemand for their exports, which bolstered economicgrowth in Bulgaria and ended the economic recession inRomania. Most of the successor States of the formerYugoslavia also benefited from the increase in externaldemand. Because of the trade embargo, which continuedthrough mid-October, Yugoslavia was a major exception.Although the country was able to grow in 2000, this wasfrom a very low base due to the adversities of the pastdecade, including the heavy toll the Kosovo conflictimposed on the economy.
The restoration of regional trade and the revival oftourism in South-eastern Europe continue to depend high-ly on international assistance. Disbursement of suchassistance has lagged the expectations engendered by theStability Pact signed in mid-1999. None the less, the nor-malization of Yugoslavia’s external relations will play afavourable role for the region as a whole: it should changeforeign investors’ perceptions; facilitate privatisation; andstimulate financial inflows, including from the privatesector. First, however, public funds may be required toencourage economic recovery and restore public infra-structure.
Unemployment and inflation trends
Unemployment rates in most economies in transitioncontinue to be very high. In some countries, they rosefurther in 2000 on account of corporate restructuring.However, there was a marked decline, for the first timein many years, in the Russian Federation’s unemploy-ment rate to about 10 per cent in 2000. Ukraine alsoreported a significant reduction in registered unemploy-ment, but there was no sign of any appreciable improve-ment in most other CIS economies: in many, there con-tinues to be large excess employment in partially restruc-tured enterprises. While unemployment was also fallingin Estonia and Latvia from the highs reached in 1999, itremained above the level observed prior to the RussianFederation’s financial crisis. The employment situationin most countries of Central and Eastern Europe is notpromising for the near-term. Hungary has recentlyreported a slight improvement in its unemployment rate
W O R L D E C O N O M I C S I T U A T I O N A N D P R O S P E C T S 2 0 0 132

(see table A.3). Elsewhere, increasing employmentremains a daunting policy challenge: unemployment lev-els of 12 to 40 per cent pers is t in Bosnia andHerzegovina, Bulgaria, Croatia, the Former YugoslavRepublic of Macedonia, Poland, Slovakia, Slovenia andYugoslavia. There are presently no signs of a rapidabatement.
Inflation in the economies in transition fell in 2000,largely reflecting developments in CIS countries since thepace picked up elsewhere. Having accelerated sharply inthe CIS in 1999 due to the substantial devaluation of therouble and currency adjustments elsewhere, inflation wassuccessfully contained: in 2000, it fell substantially (seetable A.3), although, in Belarus, it was still at the three-digit level. Nevertheless, the disinflation trend slowed inthe second half of 2000 due to higher energy and otherimport prices. Inflation remained low in the Baltic coun-tries, but is expected to edge up to around 4 per cent in2001 due to the pass-through of higher producer prices.
Inflation accelerated somewhat in most Central andEastern European countries. While supply shocks partial-ly explain this outcome, domestic policies also had animpact. Inflation remained high in Romania due to laxfiscal policies and the depreciation of the currency tomaintain export competitiveness. It accelerated inYugoslavia due to expansionary monetary policy.Additionally, the depreciation of the euro, to which sev-eral economies of the region peg their currencies, exacer-bated inflationary pressures in the region. Inflation isexpected to slow down in 2001, but much depends on thebehaviour of international commodity prices and mone-tary and fiscal policies in the region.
Macroeconomic policy stances
While some countries, particularly the Czech Republicand Slovenia, moved towards a more neutral monetarypol icy in la te 1999 and ear ly 2000, most of theeconomies in transition kept a relatively tight stance dur-ing the year. Belarus, Kazakhstan and Turkmenistanwere except ions among the CIS countr ies , whileYugoslavia’s expansionary monetary policy was theexception in Central and Eastern Europe. In the Balticeconomies, monetary conditions are largely the result ofchanges in the level of international reserves since thesecountries all adhere either de jure or de facto to currencyboard monetary arrangements. Loosened monetary andcredit conditions in the region therefore reflect theresumption of capital inflows.
In the Central and Eastern European economies intransition, however, further interest rate cuts are unlikelydue to growing inflationary pressures, as well as centralbanks’ concerns about the possibility of increased fiscalspending on the eve of elections. Monetary tightening by
the ECB is also a factor for those countries whose cur-rencies are pegged to the euro under various arrange-ments. Central banks are likely to follow the ECB’s leadin order to maintain the parity of their currency vis-à-visthe euro. Furthermore, many of these countries aim tomaintain an interest rate differential with the euro zonethat is conducive to attracting the capital inflows requiredto finance their external positions. Accordingly, Polandincreased interest rates sharply at the end of 1999 andtwice during 2000 in an effort to slow down the rapidexpansion of domestic consumption and contain theresulting large current-account deficit.
Fiscal balances improved in most CIS economies in2000 due to the recovery of economic activity, the posi-tive impact of higher oil prices in energy-exporters, andfiscal consolidation efforts. The Russian Federation andUkraine, which previously suffered severe financial crisestriggered by fiscal problems, shifted from deficit to sur-plus. In the Baltic countries, where the 1999 economicrecession entailed a sharp deterioration of their fiscalpositions, policies were set in motion in 2000 to reducethe public deficit. The problem is particularly acute inLatvia and Lithuania where the absence of political con-sensus over the pace of fiscal consolidation has delayedimplementation. Such delays, however, are likely to affectinvestor confidence and may compromise the financing ofthe current-account deficits (about 8-9 per cent of GDP)of these countries. Fiscal consolidation proceeded fasterin Estonia, supported by its earlier and stronger econom-ic recovery. Conversely, faster economic growth did notlead to improvements in the fiscal position of mostCentral and Eastern European countries.
Most of these Governments have attempted to use thecurrent economic upturn, as well as the proceeds fromprivatization, to improve their fiscal balances in order tomeet established targets, but neglected the implementa-tion of structural reforms, particularly of social securityarrangements. However, in some instances fiscal consoli-dation was not as strong as expected due to unanticipateddevelopments. For example, unplanned expendituresassociated with the recapitalization of the banking sectorin the Czech Republic, increased social security pay-ments due to the social costs of transition, attempts toclose the wage gap between the private and public sectorsin the Czech Republic and Hungary, as well as tax arrearsin some countries, rendered it impossible to deliver onbudget forecasts.
Fiscal consolidation efforts are likely to continue amongthe economies in transition in 2001. Further fiscal improve-ment is still a priority in most CIS countries as the revenuegains from commodity exports are likely to be temporary.For the economies in transition that are candidates to jointhe European Union and eventually the EuropeanEconomic and Monetary Union (EMU), efforts to make fis-
33R E G I O N A L D E V E L O P M E N T S A N D O U T L O O K

cal positions compatible with directives of the EuropeanUnion will continue. None the less, in countries withupcoming elections, it will be difficult to enact any signif-icant fiscal tightening and some slippage may take place.
DEVELOPING COUNTRIES
Economic growth for the developing economies as agroup continued to accelerate in 2000 to an estimated 5.6per cent—much better than the 3.5 per cent attained theprevious year (see table A.5). This is roughly the pace ofgrowth that these countries had reached prior to the1997-1998 Asian financial crises. But the economic per-formance across nations in the group was far fromhomogenous, with the poorest continuing to trail behind.Among the 40 of the 48 Least Developed Countries mon-itored by UN/DESA, only six (half of them oil exporters)recorded per capita GDP growth above 3 per cent in2000, which is widely held to be the minimum rate to besustained over time in order to make a dent in poverty(see table I.2).
The sharp rise in oil prices in 2000, on average by 60per cent relative to 1999 levels, had significantly diver-gent impacts on net fuel exporters and fuel importers. Forthe former, the run-up in price provided an unexpectedboom in export and fiscal revenues. For net fuelimporters, however, the increased prices gave rise to asharp adverse shift in the terms of trade and a rapid esca-lation in the import bill. As indicated in chapter I, thisamounted to some $56 billion for this group withoutChina, which is equivalent to some 1.3 per cent of thesecountries’ GDP. Inasmuch as there was no net increase infinancial inflows from abroad, these countries had to dipinto their reserves or compress other imports. The amountof consumption of other goods and services thus crowdedout is the welfare loss caused by the increase in oil prices.There are limits to the length of time during which thehigher oil import bill can be financed and the economicbuoyancy of fuel-importing countries sustained.Moreover, as international interest rates have increasedsince mid-1999, the cost of financing external debt con-tracted at variable interest rates has increased, therebyimposing an additional burden on the developingeconomies.2
Although growth in 2000 was an improvement on thatreported for the previous year, the economic expansionfor Africa as a whole in 2000 was only 3.2 per cent. This
was the slowest pace among the major developingregions. Africa was also the only region where perform-ance in 2000 failed to meet earlier expectations. Therewere wide divergences in growth across countries, how-ever. Some benefited from the recovery of oil prices aswell as prices for some non-fuel commodities that areamong Africa’s main exports. On the negative side, manycountries were adversely affected by domestic and exter-nal shocks.
Higher oil prices had a significant impact on allAfrican countries in 2000. Oil exporters improved theirmacroeconomic balances during the year. In the large gasand oil exporters—Algeria, Angola, Libyan ArabJamahiriya and Nigeria—GDP growth acceleratedbecause of increased production and investment in thehydrocarbon sector, higher public spending, andincreased private consumption. Conversely, the majorityof oil importers sustained a deterioration of their externalbalances, energy shortages, higher inflation, and con-strained output growth.
Higher oil prices, however, were not the only factorbehind the weak performance of fuel-importing countriesin Africa. Adverse weather conditions reduced agricultur-al output in several countries, particularly in the first halfof 2000. Heavy rains and floods caused severe damage inMadagascar, Mozambique, South Africa and other coun-tries in southern Africa. Drought affected agriculturaloutput in Morocco and Tunisia in northern Africa andpersisted throughout the year in several countries in east-ern Africa. Low international prices for coffee, cocoa andother agricultural commodities depressed export earningsand slowed growth in most countries in western Africa.
Armed conflicts and civil and political disturbancescontributed to poor economic performances in the region.The Eritrean-Ethiopian border war severely damaged theEritrean economy, with all formal productive economicactivity coming to a halt during the most intensive phaseof the conflict in May-June 2000. Long-running disputesand conflicts in Sierra Leone, the Sudan, Uganda andseveral other countries and religious violence in Nigeriaalso affected economic performance in those countries.The slow progress in the implementation of international-ly-sponsored peace agreements in Angola and theDemocratic Republic of the Congo further delayed andset back post-conflict reconstruction of those war-torneconomies. In Côte d’Ivoire, economic difficulties wereexacerbated by the military coup in December 1999,which led to the suspension of most external assistance.
The Zimbabwean economy slipped into recession—with a 6 per cent contraction—as a result of large budgetdeficits and a land reform policy that led to civil andpolitical disturbances and cut off the country’s access tointernational finance. These difficulties also precipitatedlarge outflows of portfolio capital and currency deprecia-
W O R L D E C O N O M I C S I T U A T I O N A N D P R O S P E C T S 2 0 0 134
2 For every increase of 25 basis points in international interest rates, developingcountries have to disburse an additional $2.5 billion in interest payments on theirlong-term external debt. These estimates are based on the 1998 stock of long-term external debt contracted at floating interest rates and do not include short-term debt. They also exclude the additional costs of interest payments on exter-nal loans contracted after 1998.

tion in the Republic of South Africa, although FDIinflows remained positive and reserves were further bol-stered by large gains in export growth.
Average unemployment rates in North Africa contract-ed modestly, a development that is expected to gatherstrength in 2001. However, unemployment remains high,mostly due to structural weaknesses in many sectors andrapid labour force growth. Elsewhere in Africa, the urbanunemployment rate in Zimbabwe rose to over 50 per centdue to the economic contraction. In the Republic of SouthAfrica, urban unemployment increased in the first half of2000 because of continuing job losses in the non-agricul-tural formal sector, as well as in the public sector.
Economic growth in Africa in 2001 will be supportedby a rebound of agriculture in drought-hit countries,while the momentum of increased aggregate demand infuel-exporting countries, through public and private con-sumption, as well as increased foreign and domesticinvestment, is expected to continue. Exports will alsocontribute to growth as the price of several commoditiesis expected to stabilize (see chapter II). Africa’s econom-ic performance, however, continues to be vulnerable tothe destabilizing effects of wars, civil strife and naturaldisasters. Overall, the outlook is for GDP growth inAfrica to accelerate to around 4 per cent in 2001.
East Asia’s economic recovery, which began in early1999, continued into 2000. Economic growth, however,slowed in several countries in the second quarter witherratic quarterly movements since (see table A.6).3 For theyear as a whole, the region’s aggregate real GDP growth(excluding China) is estimated at about 7 per cent—muchfaster than was anticipated at the beginning of the year.Despite the economic recovery, real GDP per capita inIndonesia and Thailand are still below their pre-crisis lev-els. The outlook for 2001 continues to be favourable (seetable A.5), though growth is expected to decelerate in linewith the slowdown of external demand and the delays anddifficulties in the implementation of structural reforms.
Strong exports (particularly of ICT-related products)and buoyant private consumption led the recovery in theregion. Exports were supported by rising regionaldemand,4 sustained import demand from the UnitedStates, and the world boom in electronics. Export growth,however, began to be outpaced by surging imports. As aresult, the contribution of net exports to growth wanedtowards the end of the year. Private consumption recov-ered in several countries, but softened in the second halfof 2000 due to the fall in equity values, in part in conse-quence of price declines observed in the United Statesstock markets, and/or political uncertainty in some coun-
tries. Private fixed investment remained weak, but itshowed some sign of recovery in some countries, particu-larly in Hong Kong SAR. On the supply side, perform-ance in all sectors, except construction, was favourable,with manufacturing making a major contribution to theacceleration in economic growth.
Unemployment continued to fall as the economicrecovery intensified and spread. The Philippines andSingapore are exceptions to this trend due to weak eco-nomic growth in the former and the contraction oflabour-intensive activities in the latter. In crisis-hitcountries, labour market conditions have improved, butunemployment rates remain significantly above the pre-crisis levels. Moreover, the pace at which unemploy-ment has been lowered has recently stagnated or tem-porarily been reversed in some countries, reflecting theongoing restructuring and the phasing-out of publicworks programmes.
In crisis-hit Asian countries, the strong economicrecovery has led to some complacency in the pursuit ofnecessary further structural reforms.5 The financial sectoris still burdened by sizeable low-quality loans and the cor-porate sector remains heavily indebted. Local financialmarkets and the corporate sector are still fragile. Thesecountries therefore remain vulnerable to capital move-ments and other exogenous shocks. These tend to discour-age foreign investment. Domestic bank lending is also stillfar from normal, thus constraining domestic demand.Additionally, in Taiwan Province of China the bankingsector started to face difficulties in part due to the collapseof the stock markets during the year. Some loans are col-lateralised by shares and the quality of banks’ portfolioshas therefore deteriorated. The fact that the authoritiesdecided to raise the banks’ stock investment ceiling willamplify vulnerability to market volatility and may lead toan increase in non-performing loans.
The expected slowdown in the region’s growth in 2001stems from several factors. Externally, high oil prices, adeceleration in growth of international trade, and a slow-down in the demand for semiconductors will exert somepressure on the balance of payments and restrain domes-tic demand. Domestically, the reduced maneuverability offiscal policy (see below), cautious bank lending, negativedevelopments in local stock markets, and political uncer-tainties will adversely affect both private consumptionand investment activity. Additionally, increased exchangerate volatility, erratic capital inflows, and weak corporateand financial sectors could prevent many countries fromachieving higher rates of growth.
Economic growth in China of 8.2 per cent in 2000 was
35R E G I O N A L D E V E L O P M E N T S A N D O U T L O O K
3 See footnote 1.4 Intraregional trade is about 40-50 per cent of their trade.
5 See World Economic and Social Survey, 2000 (United Nations publication, SalesNo. E.00.II.C.1), pp. 98-101.

supported by strong exports. Domestic demand, whichhad been weak since the Asian financial crises, started torecover. This was especially the case for fixed investmentin housing and equipment. Growth of private consump-tion demand, however, continued to be less robust, as thelarge number of layoffs from state-owned enterprises(SOEs) lowered the income-propensity to consume.Additionally, excess capacities remain in many sub-sec-tors of manufacturing, although the high levels of inven-tory built up in recent years have been declining.Meanwhile, economic efficiency has improved noticeablyin many sectors, including in many SOEs, as indicated bythe doubling of profits for the industrial sector as a wholein the first half of 2000.
GDP growth for the Chinese economy is expected to beabove 8 per cent in 2001. However, macroeconomic poli-cies need to remain accommodative if domestic demand isto be further strengthened. Furthermore, the reform agen-da continues to pose daunting challenges. The balancebetween the short-run goal of stimulating domesticdemand and the long-run goal of reforming the economy’sstructure poses delicate tradeoffs for Chinese policy mak-ers. Reforms inevitably have some adverse effects forshort-run growth. Over time, however, they will enablemacroeconomic policies to become more effective andefficient in minimizing cyclical fluctuations. Additionalreforms are expected in the next few years as a result ofincreased international competition for the Chinese econ-omy once the country enters the World Trade Organization
(WTO), possibly in early 2001. GDP growth in South Asia reached 6 per cent in 2000
and, as in the other regions discussed above, was sup-ported by strong exports. Weather conditions in themajority of countries were normal, which favoured agri-culture. However, increased political uncertainties, bot-tlenecks in infrastructure, and large fiscal deficits con-strained economic activity in some countries (see tableIII.1). In India, the largest economy of the sub-region,economic growth moderated in 2000 due to a slowdownin industrial output and the impact of adverse weatherconditions on agriculture. The service sector performedwell, supported by the ICT boom and favourable govern-ment policies.
The near-term prospects for South Asia remain posi-tive. Barring bad weather, worsening oil prices, a deterio-ration of political uncertainties, and, in the case ofPakistan, the re-emergence of balance-of-payments diffi-culties, growth in GDP is expected to accelerate modestlyfor most countries and to be more broad-based. Robustexports, normal agricultural output in the countries thatsuffered from adverse weather conditions in 2000, and therecovery in industrial output will underpin growth.
Higher oil prices and increased output, in line withthe successive agreements among members of theOrganization of Petroleum Exporting Countries (OPEC)in 2000 (see chapter II), boosted economic activity inmany fuel-exporting countries in Western Asia and con-tributed to the acceleration of economic growth in the
W O R L D E C O N O M I C S I T U A T I O N A N D P R O S P E C T S 2 0 0 136
Table III.1.CENTRAL GOVERNMENT FISCAL BALANCES OF SELECTED DEVELOPING COUNTRIES, 1996-2000
1996 1997 1998 1999 2000a
Argentinab -3.6 -2.0 -2.1 -4.1 -2.8Brazilc -0.1 -0.9 0.0 3.1 3.4d
Hong Kong, SAR 2.2 6.6 -1.8 -0.1 -0.5Indiae -1.2 -4.8 -5.0 -5.6 -5.1Indonesia 0.2 0.0 -3.7 -2.3 -5.0Korea, Republic of 0.3 -1.5 -4.2 -2.9 -2.8 Malaysia 0.7 2.5 -1.9 -4.9 -2.0Mexico 1.3 -1.2 -1.3 -1.0 -1.1Pakistane -7.0 -6.3 -5.6 -3.7 -3.7Philippines 0.3 0.1 -1.8 -3.6 -1.8Singapore 8.6 9.6 1.6 2.5 3.0Sri Lanka -9.4 -7.9 -9.2 -8.0 -7.6Thailand 2.4 -0.9 -3.4 -3.0 -3.0Venezuela 0.6 1.9 -4.1 -2.6 -1.0
Percentage of GDP
Sources: UN/DESA, based on Asian Development Bank (ADB), International Monetary Fund (IMF) and national sources.a Projections or preliminary estimates.b Consolidated public sector.c Consolidated public sector primary balance; it excludes interest payments on the public debt.d 12 months to September 2000.e Fiscal year.

region as a whole (see table A.5). Additionally, agricul-ture recovered in most countries (except notably theIslamic Republic of Iran) from the drought of 1999. Inmany countries, industrial production increased owingto fiscal relaxation (see below), while the recovery ofexport markets in South and East Asia benefited somecountries in the region. Similarly, growth acceleratedamong the major fuel-importing economies of theregion. The economic recovery in Israel was mostlyexport-led, particularly on account of high-tech indus-try, although strong domestic consumption and invest-ment demand contributed to the economic expansion aswell. The Turkish economy recovered sharply in 2000.Growth was driven by post-earthquake reconstructionand increased investment demand accommodated bylower real interest rates. However, by year-end Turkeywas facing a severe banking crisis. Interest rates sky-rocketed, the stock market plunged, capital left thecountry, and a serious liquidity crisis emerged. A rescuepackage amounting to $7.5 billion was negotiated withthe IMF, in addition to the $2.9 billion outstandingunder the previous stand-by agreement.
The prospects for further expansion in the regionremain strong. High oil-export revenues are expected toboost government spending on infrastructure, educationand health care, thus benefiting overall growth. Fuel-importing countries will sustain their economic recovery,with the possible exception of Turkey. GDP growth in theregion as a whole is expected to be over 5 per cent in2001 but unemployment is projected to remain high insome countries and decline only marginally in others. Thepersistence of hostilities in the region represents a majordownside risk to the outlook for the region.
Economic growth in Latin America and theCaribbean improved on average in 2000, supported bystrong external demand and a recovery of domesticabsorption in some of the large economies that facedrecession or severe slowdown in 1999. The GDP growthrate for the region is estimated to have reached 3.9 percent in 2000, but with considerable variations. It willremain around that level in 2001. Prudent fiscal and mon-etary policies followed in the region (see below) will notbe conducive to faster growth in domestic absorption,while external demand may slow down. Growth, howev-er, will be more evenly distributed across the region, ascountries coming out of recession solidify their recoverywhile those experiencing fast economic growth will guidethe pace of growth of their economy onto a more sustain-able path.
Brazil’s economic performance in 2000 was strong andbroad-based. Faster growth of exports and improved cred-it conditions supported domestic demand. Chile benefitedfrom much firmer copper prices in 2000, improved exter-nal demand, and increased investment by the public sec-
tor, particularly in mining and infrastructure. Economicrecovery in the other Andean economies was uneven andthe outlook, though fairly positive, remains uncertain forsome of the economies of the subregion due to politicalconsiderations. In addition, the possibility of negativeeconomic consequences emanating from the anti-drugeffort in Colombia weighs on the outlook. In Peru, polit-ical uncertainties have been compromising growthprospects since the latter part of 2000; this has been inmarked contrast to the strong growth reported in the firsthalf of the year. Bolivia recorded modest growth in 2000with domestic demand remaining depressed. Ecuador andVenezuela emerged from their severe recessions of 1999thanks to higher oil prices.
Mexico, the second largest economy of the group, hascontinued to benefit from the strong import demand bythe United States economy. Domestic demand alsostrengthened, giving an additional impetus to GDPgrowth in 2000. Strong economic growth in CentralAmerica and the Caribbean continued, led by theDominican Republic, on account of loose credit condi-tions and an expansionary fiscal stance, and, to a lesserextent, Honduras, whose economy is only now recoveringfrom the aftermath of hurricane Mitch in late 1998.Jamaica, however, continued to face stagnation under aheavy public-debt burden and high interest rates. The lat-ter also constrained economic activity in Haiti, whereeconomic growth was modest in 2000.
Despite positive signs at the end of 1999, economicrecovery in Argentina is still tentative. Lower commodityprices and the strong United States dollar, to which thepeso is pegged, had negative effects for the buoyancy ofthe economy. Tight fiscal measures at the beginning of2000, including wage cuts in the public sector, andincreased unemployment reduced domestic demand. Byyear-end, Argentina was facing a severe confidence crisisdue to growing expectations of sluggish growth in thenear-term and difficulties around enacting fiscal consoli-dation. Despite renewed commitment by the Governmentto the currency board arrangement, these factors haveintensified concerns about the sustainability of the cur-rent approach to economic policy-making. Economicagents became more apprehensive about theGovernment’s ability to service the country’s externaldebt and signs of a liquidity crisis started to emerge inearly November, which prompted the Government tonegotiate a rescue package with the international finan-cial institutions and the private sector (see box II.1).
Labour market conditions were mixed in LatinAmerica in 2000, but are expected to improve somewhatin 2001. Open urban unemployment rates continued tofall and reached very low levels in Mexico (around 2 percent), thus indicating a possible overheating of the econ-omy. Although still high, unemployment rates receded in
37R E G I O N A L D E V E L O P M E N T S A N D O U T L O O K

Brazil, Ecuador, Peru and Venezuela, but labour incomeshave not yet recovered. Unemployment rates inArgentina, Chile, Colombia and Uruguay, among others,have been increasing, even though they are already high,thus depressing consumer confidence, private consump-tion and investment.
Because of its substantial dependence on foreignfinance, the major risk to the region’s growth outlook in2001 is the external environment. Trade surpluses usuallydisappear with fast growth in the region. Any deteriora-tion in investor sentiment towards these countries and/ora severe slowdown of external demand could derail therecovery the region experienced in 2000. Much of therecent inflows of capital into the region have been in theform of FDI, owing to continuing privatization in themajor economies in the region, as well as the consolida-tion of operations by large transnational companiesthrough mergers and acquisitions (see chapter II). Thisprocess will eventually end. It is not yet clear whether theregion will be able to attract other forms of externalfinance to support imports, external debt service, andprofit repatriation.
Inflation trends
Despite higher oil prices and other supply shocks, aswell as improved demand conditions in several countries,prudent macroeconomic policies kept inflation undercontrol in most developing countries in 2000 (seebelow). Some countries even lowered inflation in 2000.None the less, the disinflation process that had been tak-ing place seemed to come to a halt in some countries byyear-end. Accordingly, some regions ended up with high-er average inflation in 2000 than in 1999 (see table A.5).In Africa, for instance, the higher cost of oil imports,significant currency depreciation in some economies,and food shortages in countries hit by adverse weatherconditions contributed to higher inflation in 2000.Inflation bursts were observed elsewhere as well, such asin Ecuador due to the sharp depreciation of its currencyon the eve of the adoption of the dollarization pro-gramme. In Western Asia, average inflation fell furtherduring the year, largely because of lower inflation inTurkey, in Israel and, to a lesser extent, in the IslamicRepublic of Iran. Inflationary pressures re-emerged inWestern Asia in 2000 due to increased aggregate demandand a gradual removal of subsidies in most fuel-export-ing countries.
Inflationary pressures will abate in 2001 as oil pricesare expected to recede somewhat, readjustments ofadministered prices will most likely slow down, andexcess capacities in labour markets and in the productivesectors remain in several countries. The outlook for infla-tion in 2001 is therefore positive, with annual average
inflation rates remaining under control in most regions. InEast Asia, however, inflation will accelerate in 2001 dueto the lagged impact of higher oil prices.
Macroeconomic policy stances
Developing countries followed diverse paths with theirmonetary policy in 2000. It remained tight in most coun-tries during the year. In China and South and East Asia,it was largely accommodative. However, it was less tightin Latin America than in 1999 and particularly in thefirst half of 2000.
In Latin America, the change of exchange rate policy inmany countries was an additional factor behind lowerinterest rates. Because of their adoption of floatingexchange rates, many countries have been able to free theirmonetary policy from defending the currency. However,this strategy has not been fully tested in the region andLatin American countries may decide to increase interestrates in order to maintain their currencies within somedesirable range. Asian countries with floating exchangerates, for instance India and the Philippines, increasedinterest rates to defend their currencies when they startedto depreciate in the second half of the year.
As the developed market economies eased up on tight-ening their monetary policy towards the end of 2000, theearlier trend that had brought down interest rates in devel-oping countries seemed to have come to a halt. Severalcountries in East and South Asia began to raise theirinterest rates either to match the United States interestrate hikes, to discourage speculation on their currencies,to counter accelerating inflation, and/or to avoid over-heating of the economy. In Latin America, Brazil’s policyinterest rates were progressively cut from 19 per cent atthe beginning of the year to 16.5 per cent in July.Concerns about oil prices and their negative impact on theconsumer price index prevented the monetary authoritiesfrom cutting interest rates further, while fears of over-heating led the Mexican Central Bank to tighten monetaryconditions in the third quarter of 2000. Naturally, therehave been exceptions to this tightening trend: Chile andIsrael lowered interest rates in the second half of the yearbecause of weak growth and low inflation, respectively.The developing countries’ prudence in monetary policy isexpected to continue in 2001.
Fiscal policies in 2000 were influenced by the run-upin oil prices and the needs of specific economies. Thisallowed oil exporters to increase expenditures withoutcompromising their fiscal positions; some even recordeda surplus for the first time in many years. But it proved tobe an additional burden for oil importers.
In general, most fuel exporters had framed their 2000budget on the assumption of oil prices of around $12 to$18 per barrel. The unexpected rise in oil revenues led to
W O R L D E C O N O M I C S I T U A T I O N A N D P R O S P E C T S 2 0 0 138

a shift in policy stance: many countries moved away inearly 2000 from a restrictive to an expansionary fiscalpolicy. In Western Asia, government spending increasedas many large-scale investment projects—mainly down-stream activities such as refining, gas liquefaction, andpetrochemicals—that had earlier been frozen, were reac-tivated in 2000. Most Latin American and some of theAfrican oil exporters allocated part of this windfall gainto stabilization funds or accounts to be drawn upon whenoil prices recede to more normal levels. For 2001, with oilprices expected to decline somewhat, a more restrainedstance is expected from fuel exporters.
Fiscal positions were also influenced by domestic fac-tors. One group of countries continued the expansionarypolicy stance of 1998-1999 to revive domestic demandand support economic activity. China and East Asia arecases in point. Most countries in the region maintainedtheir expansionary fiscal policy to support recovery. As aresult, their fiscal positions deteriorated and public debtincreased, signalling the limits of this strategy and itsunsustainability in the near future (see table III.1). Someof these countries, such the Republic of Korea, thePhilippines and Singapore, have begun to shift their fiscalpolicy to a more neutral stance. In Malaysia andThailand, however, fiscal policies remain supportive ofgrowth. Similarly, in China, no change in its expansion-ary policy stance is expected in the near-term.
Another group of countries adopted austerity in view
of the need to correct unsustainable fiscal deficits. Thisapplied to many countries in Africa and Latin America aswell as the oil importers of Western Asia. Some progresstowards lower deficits was achieved during the year.Among the large developing economies, Argentina,Brazil and Turkey implemented austere and ambitious fis-cal consolidation programmes, albeit with differentdegrees of success. While the Brazilian and Turkishefforts have so far been successful due to lower domesticinterest rates and the economic recovery, in Argentina fis-cal austerity proved to be too severe and choked the nas-cent economic recovery, thus compromising the very fis-cal consolidation the authorities had targeted. WhereasBrazil relaxed its fiscal stance during the second half ofthe year, Argentina had to assemble another fiscal adjust-ment programme. Fiscal consolidation efforts are expect-ed to continue in these countries in 2001.
Finally, some countries did not address their fiscalimbalances or did not implement sufficiently austere poli-cies. For example, several of the countries of South Asiacontinued to face unsustainable fiscal deficits and largepublic debts. In the case of South Asian countries, sever-al factors were responsible for the limited progresstowards fiscal consolidation in 2000. These includeincreases in domestic fuel subsidies due to higher oilprices, costs related to reconstruction and rehabilitationfrom heavy flood damage, increased military expendi-tures and additional spending for electoral purposes.
39R E G I O N A L D E V E L O P M E N T S A N D O U T L O O K


41A N N E X T A B L E S
ANNEX TABLES*
* More extensive time series of the data in this annex, together with definitions of the country groupings and explanatory notes, are contained in World Economic andSocial Survey 2000 (United Nations publication, Sales No. E.00.II.C.1).

LIST OF TABLES
Page
A.1. Developed market economies: rates of growth of real GDP and rates of inflation and unemployment, 1999-2001 . . . . . . . . . . . . . . . . . . . . . . . . . . . . . . . . . . . . . . . . . . . . . . . . . . . . . . . . . . . . . . . . . . . . .43
A.2. Major industrialized countries: quarterly indicators, 1998-2000 . . . . . . . . . . . . . . . . . . . . . . . . . . . . . . . . . . . . . . . . . . . . . . . . . . . .44
A.3. Economies in transition: rates of growth of real GDP and rates of inflation and unemployment, 1999-2001 . . . . . . . . . . . . . . . . . . . . . . . . . . . . . . . . . . . . . . . . . . . . . . . . . . . . . . . . . . . . . . . . . . . . .45
A.4. Economies in transition: quarterly indicators, 1998-2000 . . . . . . . . . . . . . . . . . . . . . . . . . . . . . . . . . . . . . . . . . . . . . . . . . . . . . . . . .46
A.5. Developing countries: rates of growth of real GDP and rates of inflation, 1999-2001 . . . . . . . . . . . . . . . . . . . . . . . . . . . . . . . . . . .47
A.6. Major developing countries: quarterly indicators, 1998-2000 . . . . . . . . . . . . . . . . . . . . . . . . . . . . . . . . . . . . . . . . . . . . . . . . . . . . . .48
A.7. World trade: rates of growth of volumes, 1999-2001 . . . . . . . . . . . . . . . . . . . . . . . . . . . . . . . . . . . . . . . . . . . . . . . . . . . . . . . . . . . .49
A.8. Commodity prices, 1998-2000 . . . . . . . . . . . . . . . . . . . . . . . . . . . . . . . . . . . . . . . . . . . . . . . . . . . . . . . . . . . . . . . . . . . . . . . . . . . . .50
A.9. Foreign direct investment inflows and cross-border mergers and acquisitions, by region: 1999 and 2000 . . . . . . . . . . . . . . . . . . . .51
42 W O R L D E C O N O M I C S I T U A T I O N A N D P R O S P E C T S 2 0 0 1

43A N N E X T A B L E S
Table A.1.DEVELOPED MARKET ECONOMIES: RATES OF GROWTH OF REAL GDP AND RATES OF INFLATION AND UNEMPLOYMENT, 1999-2001
Growtha Inflationb Unemploymentc,d,e
1999 2000f 2001g 1999 2000f 2001g 1999 2000f 2001g
AAllll ddeevveellooppeedd eeccoonnoommiieess 2.6 3.5 3 1.2 2.0 1¾ 6.6 6.1 6
United States 4.2 5.0 3½ 2.2 3.4 2¾ 4.2 4.1 4¼Canada 4.5 4.6 3 1.7 2.8 2½ 7.6 6.8 6¾Japan 0.2 1.4 2 -0.3 -0.7 0 4.7 4.5 4Australia 4.4 3.8 2¼ 1.5 4.6 4 7.2 6.7 7New Zealand 2.5 4.3 3½ 1.4 1.7 2½ 6.8 6.3 6
EEUU--1155 2.4 3.4 3 1.2 2.2 2 9.2 8.4 8
EEUU--1111 2.4 3.5 3¼ 1.1 2.1 2 10.0 9.2 8½Austria 2.3 3.4 3 0.6 1.8 1¾ 3.8 3.2 3Belgium 2.6 4.1 2½ 1.1 2.4 2 9.1 8.6 8½Finland 3.5 4.9 4 1.2 2.9 2 10.2 10.1 9France 2.9 3.4 3¼ 0.5 1.5 1¼ 11.3 10.0 9¼Germany 1.5 3.0 3 0.6 1.9 1¾ 8.8 8.4 8Ireland 9.8 10.2 7½ 1.6 4.3 3½ 5.7 4.7 4Italy 1.4 2.8 2¾ 1.7 2.3 2 11.3 10.9 10½Luxembourg 4.2 4.5 4 1.0 3.0 2½ 2.3 2.2 2Netherlands 3.9 4.5 4 2.2 2.5 3½ 3.3 2.8 2¼Portugal 2.9 3.3 3 2.3 2.5 2½ 4.5 4.0 4Spain 4.0 4.1 3¼ 2.3 3.2 2¾ 15.9 13.4 11¾
OOtthheerr EEUU 2.4 3.2 2¾ 1.6 2.7 2 6.6 6.1 6Denmark 1.6 2.0 1¾ 2.5 3.0 2 5.2 4.9 5Greeceh 3.5 3.8 4½ 2.6 2.8 2¾ 10.2 10.0 9½Sweden 3.8 4.4 3½ 0.5 1.0 2 7.2 6.2 5½United Kingdom 2.2 3.1 2¾ 1.6 3.0 2 6.1 5.6 5½
OOtthheerr EEuurrooppee 1.3 2.1 2 3.2 2.7 2¾Iceland 4.4 4.0 2½ 3.2 5.4 4¼ 3.3 2.7 3Malta 4.1 1.8 2 2.1 3.4 3 5.3 4.5 4½Norway 0.9 2.7 1½ 2.3 3.0 2¼ 3.2 3.3 3¼Switzerland 1.5 2.5 1¾ 0.7 1.6 2 3.1 2.3 2¼
MMeemmoo iitteemm::Major industrialized countries 2.5 3.5 3 1.1 1.8 1½ 6.2 5.8 6
Source: UN/DESA, based on IMF, International Financial Statistics and OECD.a Data for country groups are weighted averages, where weights for each year are the previous year's GDP valued at 1995 prices and exchange rates in United States dollars.b Data for country groups are weighted averages, where weights for each year are 1995 GDP in United States dollars.c Unemployment data are standardized by OECD for comparability among countries and over time in conformity with the definitions of the International Labour Office
(see OECD, Standardized Unemployment Rates: Sources and Methods (Paris, 1985)).d Data for country groups are weighted averages, where labour force is used for weights.e Greece and Malta are not standardized.f Partly estimated.g Forecast, partly based on Project LINK.h Though Greece will enter the euro area on 1 January 2001, for the sake of comparability, it is not included in EU-11 estimates for 2001.
Annual percentage change
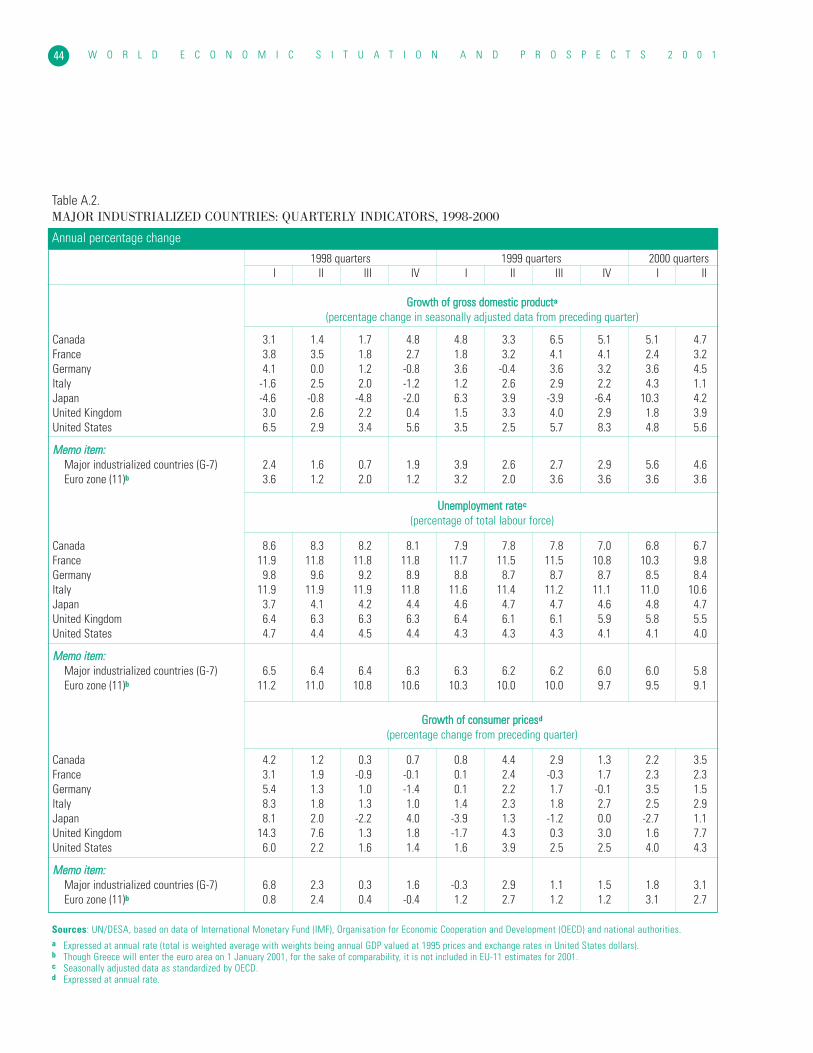
W O R L D E C O N O M I C S I T U A T I O N A N D P R O S P E C T S 2 0 0 144
Table A.2.MAJOR INDUSTRIALIZED COUNTRIES: QUARTERLY INDICATORS, 1998-2000
1998 quarters 1999 quarters 2000 quartersI II III IV I II III IV I II
GGrroowwtthh ooff ggrroossss ddoommeessttiicc pprroodduucctta
(percentage change in seasonally adjusted data from preceding quarter)
Canada 3.1 1.4 1.7 4.8 4.8 3.3 6.5 5.1 5.1 4.7France 3.8 3.5 1.8 2.7 1.8 3.2 4.1 4.1 2.4 3.2Germany 4.1 0.0 1.2 -0.8 3.6 -0.4 3.6 3.2 3.6 4.5Italy -1.6 2.5 2.0 -1.2 1.2 2.6 2.9 2.2 4.3 1.1Japan -4.6 -0.8 -4.8 -2.0 6.3 3.9 -3.9 -6.4 10.3 4.2United Kingdom 3.0 2.6 2.2 0.4 1.5 3.3 4.0 2.9 1.8 3.9United States 6.5 2.9 3.4 5.6 3.5 2.5 5.7 8.3 4.8 5.6
MMeemmoo iitteemm::Major industrialized countries (G-7) 2.4 1.6 0.7 1.9 3.9 2.6 2.7 2.9 5.6 4.6Euro zone (11)b 3.6 1.2 2.0 1.2 3.2 2.0 3.6 3.6 3.6 3.6
UUnneemmppllooyymmeenntt rraatteec
(percentage of total labour force)
Canada 8.6 8.3 8.2 8.1 7.9 7.8 7.8 7.0 6.8 6.7France 11.9 11.8 11.8 11.8 11.7 11.5 11.5 10.8 10.3 9.8Germany 9.8 9.6 9.2 8.9 8.8 8.7 8.7 8.7 8.5 8.4Italy 11.9 11.9 11.9 11.8 11.6 11.4 11.2 11.1 11.0 10.6Japan 3.7 4.1 4.2 4.4 4.6 4.7 4.7 4.6 4.8 4.7United Kingdom 6.4 6.3 6.3 6.3 6.4 6.1 6.1 5.9 5.8 5.5United States 4.7 4.4 4.5 4.4 4.3 4.3 4.3 4.1 4.1 4.0
MMeemmoo iitteemm::Major industrialized countries (G-7) 6.5 6.4 6.4 6.3 6.3 6.2 6.2 6.0 6.0 5.8Euro zone (11)b 11.2 11.0 10.8 10.6 10.3 10.0 10.0 9.7 9.5 9.1
GGrroowwtthh ooff ccoonnssuummeerr pprriicceessd
(percentage change from preceding quarter)
Canada 4.2 1.2 0.3 0.7 0.8 4.4 2.9 1.3 2.2 3.5France 3.1 1.9 -0.9 -0.1 0.1 2.4 -0.3 1.7 2.3 2.3Germany 5.4 1.3 1.0 -1.4 0.1 2.2 1.7 -0.1 3.5 1.5Italy 8.3 1.8 1.3 1.0 1.4 2.3 1.8 2.7 2.5 2.9Japan 8.1 2.0 -2.2 4.0 -3.9 1.3 -1.2 0.0 -2.7 1.1United Kingdom 14.3 7.6 1.3 1.8 -1.7 4.3 0.3 3.0 1.6 7.7United States 6.0 2.2 1.6 1.4 1.6 3.9 2.5 2.5 4.0 4.3
MMeemmoo iitteemm::Major industrialized countries (G-7) 6.8 2.3 0.3 1.6 -0.3 2.9 1.1 1.5 1.8 3.1Euro zone (11)b 0.8 2.4 0.4 -0.4 1.2 2.7 1.2 1.2 3.1 2.7
Annual percentage change
Sources: UN/DESA, based on data of International Monetary Fund (IMF), Organisation for Economic Cooperation and Development (OECD) and national authorities.a Expressed at annual rate (total is weighted average with weights being annual GDP valued at 1995 prices and exchange rates in United States dollars).b Though Greece will enter the euro area on 1 January 2001, for the sake of comparability, it is not included in EU-11 estimates for 2001.c Seasonally adjusted data as standardized by OECD.d Expressed at annual rate.

45A N N E X T A B L E S
Table A.3.ECONOMIES IN TRANSITION: RATES OF GROWTH OF REAL GDP AND RATES OF INFLATION AND UNEMPLOYMENT, 1999-2001
Growtha Inflationb Unemploymentc,d
1999 2000e 2001f 1999 2000e 2001f 1999 2000e 2001f
EEccoonnoommiieess iinn ttrraannssiittiioonn 2.1 5.3 4 50.7 19.6 16 .. .. ..
CCeennttrraall aanndd EEaasstteerrnn EEuurrooppee aanndd BBaallttiicc SSttaatteess 1.3 4.2 3¾ 11.6 12.2 9 .. .. ..
CCeennttrraall aanndd EEaasstteerrnn EEuurrooppee 1.5 4.2 3¾ 12.0 12.6 9½ .. .. ..
Albania 7.3 7.0 7 0.4 0.8 4 18.2 17.1 16Bulgaria 2.4 4.0 4 0.4 9.7 6¾ 16.0 18.2 16¾Croatia -0.3 4.0 4 4.2g 6.2g 5¾g 20.8 20.5 20Czech Republic -0.2 2.7 3 2.1 4.3 5 9.4 9.0 8¾Hungary 4.5 5.5 4½ 10.0 9.5 8 9.6 8.6 8Poland 4.1 5.0 4 7.3 10.2 7¼ 13.0 13.3 13Romania -3.2 1.5 2¾ 45.8 45.0 30 11.5 11.0 10¾Slovakia 1.9 1.6 2½ 10.6 12.3 8½ 19.2 18.8 17¾Slovenia 4.9 4.6 4 6.2 8.7 6½ 13.0 12.0 11½The former Yugoslav
Republic of Macedonia 2.7 6.0 5 -1.0g 10.0g 5g 47.0 40.0 35Federal Republic of Yugoslavia -19.3 5.0 5 45.0 60.0 25 27.4 26.5 26¾
BBaallttiicc SSttaatteess -2.1 3.8 4¼ 2.2 2.9 4¼ .. .. ..
Estonia -1.1 5.0 5½ 3.3 3.8 4¾ 10.3 10.0 9¾Latvia 0.1 4.0 4½ 3.2 3.5 4 9.1 8.4 7½Lithuania -4.2 3.0 3½ 0.8 2.0 4 10.0 11.5 10½
CCoommmmoonnwweeaalltthh ooff IInnddeeppeennddeenntt SSttaatteess 2.9 6.4 4 79.2 24.8 20¾ .. .. ..
Armenia 3.3 3.0 6½ 0.7 2.5 5 .. .. ..Azerbaijan 7.4 8.0 8½ -8.5 3.0 4½ .. .. ..Belarus 3.4 2.5 2 293.8 150.0 150 .. .. ..Georgia 2.9 4.0 7 19.1 6.0 5 .. .. ..Kazakhstan 1.7 7.0 7½ 8.4 15.0 6 .. .. ..Kyrgyzstan 3.6 3.2 5¾ 39.8 15.0 14 .. .. ..Republic of Moldova -4.4 -1.5 3 39.3 35.0 20 .. .. ..Russian Federation 3.2 7.0 4 85.9 22.0 18 .. .. ..Tajikistan 3.7 4.0 5 27.6 15.0 17 .. .. ..Turkmenistan 16.0 18.0 12 23.5 7.0 14 .. .. ..Ukraine -0.4 3.0 2 22.7 20.0 15 .. .. ..Uzbekistan 4.4 3.2 1 29.1 36.0 35 .. .. ..
Source: UN/DESA and ECE.a Data for country groups are weighted averages, where weights for each year are the previous year's GDP valued at 1995 prices and exchange rates in United States dollars.b Data for country groups are weighted averages, where weights for each year are 1995 GDP in United States dollars.c Unemployment data are standardized by OECD for comparability among countries and over time in conformity with the definitions of the International Labour Office
(see OECD, Standardized Unemployment Rates: Sources and Methods (Paris, 1985)).d Because of comparability problems, data for the Commonwealth of Independent States are not given.e Partly estimated.f Forecast, partly based on Project LINK.g For Croatia and the former Yugoslav Republic of Macedonia: retail prices.
Annual percentage change

W O R L D E C O N O M I C S I T U A T I O N A N D P R O S P E C T S 2 0 0 146
Table A.4.ECONOMIES IN TRANSITION: QUARTERLY INDICATORS, 1998-2000
1998 quarters 1999 quarters 2000 quartersI II III IV I II III IV I II
RRaatteess ooff ggrroowwtthh ooff ggrroossss ddoommeessttiicc pprroodduucctta
Belarus 12.6 12.2 5.6 4.7 1.4 3.4 2.4 6.4 6.4 1.8Czech Republic -1.1 -1.8 -2.5 -3.3 -3.3 0.1 1.0 1.0 4.4 1.9Hungary 4.4 4.9 5.4 4.7 3.5 3.9 4.5 5.9 6.6 5.8Kazakhstan 1.9 1.4 -7.8 -3.5 -3.6 -3.4 7.0 5.8 9.1 0.0Poland 6.5 5.3 4.9 3.0 1.6 3.1 5.0 6.2 6.0 5.2Romania -6.4 -3.8 -3.4 -5.4 -4.5 -4.2 -3.0 -3.2 0.9 3.5Russian Federation -1.3 -1.0 -8.1 -8.2 -2.7 1.2 6.7 7.3 8.4 6.7Ukraine -0.3 0.6 -0.4 -5.7 -4.7 -1.6 0.2 3.1 5.5 0.0
GGrroowwtthh ooff ccoonnssuummeerr pprriicceessa
Belarus 46.7 42.7 51.5 137.7 248.4 311.7 344.9 275.4 227.4 195.8Czech Republic 13.3 12.7 9.5 7.5 2.9 2.4 1.2 1.9 3.7 3.8Hungary 17.0 15.3 13.3 11.2 9.5 9.1 10.6 10.8 9.8 9.2Kazakhstan 10.3 9.1 6.4 3.0 -0.2 5.5 12.0 16.2 20.1 13.4Poland 13.8 13.0 11.1 9.2 6.2 6.3 7.4 9.3 10.3 10.1Romania 97.4 57.0 52.8 43.7 35.4 43.3 49.5 53.1 53.7 44.4Russian Federation 9.4 7.3 22.4 70.1 102.6 116.7 98.2 47.4 25.4 19.8Ukraine 8.5 7.4 6.3 17.7 21.2 25.4 26.0 18.7 25.1 27.4
Annual percentage change
Sources: IMF, International Financial Statistics and ECE.a Percentage change from the corresponding period of the preceding year.

47A N N E X T A B L E S
Table A.5.DEVELOPING COUNTRIES: RATES OF GROWTH OF REAL GDP AND RATES OF INFLATION, 1999-2001
Growtha Inflationb,c
1999 2000d 2001e 1999 2000d 2001e
DDeevveellooppiinngg ccoouunnttrriieessf 3.5 5.6 5½ 6.5 6.1 6¼of which:LLaattiinn AAmmeerriiccaa aanndd tthhee CCaarriibbbbeeaann 0.3 3.9 3¾ 7.5 7.6 6¼
Net fuel exporter 0.4 5.3 4 .. .. ..Net fuel importer 0.2 3.3 3½ .. .. ..
AAffrriiccaa 2.8 3.2 4½ 5.5 6.7 6½Net fuel exporter 4.4 4.6 5 .. .. ..Net fuel importer 1.8 2.3 4¼ .. .. ..
WWeesstteerrnn AAssiiaa 0.9 4.9 5½ 22.6 21.1 18½Net fuel exporter 2.9 5.3 5¾ .. .. ..Net fuel importer -2.1 4.4 4¾ .. .. ..
EEaasstteerrnn aanndd SSoouutthheerrnn AAssiiaa 6.2 7.2 6¾ 2.4 1.8 3¾Region excluding China 5.9 6.8 6 .. .. ..of which:
East Asia 5.9 7.2 5¾ 3.4 1.4 3¾South Asia 5.9 5.7 6¼ 4.7 4.3 7
MMeemmoo iitteemmss::Sub-Saharan Africa (excluding Nigeria and South Africa) 2.6 2.7 4 9.8 10.6 9½Least developed countries 3.0 4.4 4¾ 11.0 7.9 10¾
MMaajjoorr ddeevveellooppiinngg eeccoonnoommiieessArgentina -3.0 0.7 2 -1.2 -1.0 -¾Brazil 1.0 4.0 4 4.9 7.3 5¾Chile -1.1 5.6 5¾ 3.3 3.6 3¾China 7.1 8.2 8½ -1.4 0.8 1½Colombia -4.5 3.0 3 11.2 9.3 9½Egypt 6.0 3.9 5 3.1 3.0 5Hong Kong SARg 3.0 8.2 5¾ -4.0 -4.3 1½India 6.4 6.0 6½ 4.7 4.5 7Indonesia 0.3 4.4 5½ 20.5 2.1 5¼Iran (Islamic Republic of) 2.5 4.0 3¾ 20.1 15.2 32Israel 2.2 4.5 4¼ 5.2 1.5 3½Korea, Republic of 10.7 9.0 5¾ 0.8 2.1 3¼Malaysia 5.6 8.7 7¼ 2.7 1.5 3Mexico 3.7 6.5 4½ 16.6 9.7 8Nigeria 2.5 3.8 4 6.6 5.5 7½Pakistan 3.9 4.7 4¾ 4.1 4.0 6¼Peru 1.4 4.0 2 3.5 3.7 3½Philippines 3.3 3.6 3½ 6.6 3.7 7¾Saudi Arabia 0.5 2.8 3 -1.4 -0.7 2½Singapore 5.4 9.8 6¾ 0.0 1.1 2South Africa 1.3 2.4 3 5.2 7.5 6Taiwan Province of China 5.4 6.5 6¼ 0.2 2.0 2½Thailand 4.2 5.5 5½ 0.3 1.5 5Venezuela -7.2 3.5 4 23.6 16.9 21
Source: UN/DESA, based on IMF, International Financial Statistics.a Data for country groups are weighted averages, where weights for each year are the previous year's GDP valued at 1995 prices and exchange rates in United States dollars.b Data for country groups are weighted averages, where weights for each year are 1995 GDP in United States dollars.c For Africa and sub-Saharan Africa, the Democratic Republic of the Congo is excluded.d Partly estimated.e Forecast, partly based on Project LINK.f Covering countries that account for 98 per cent of the population of all developing countries.g Special Administrative Region of China.
Annual percentage change

W O R L D E C O N O M I C S I T U A T I O N A N D P R O S P E C T S 2 0 0 148
Table A.6.MAJOR DEVELOPING COUNTRIES: QUARTERLY INDICATORS, 1998-2000
1998 quarters 1999 quarters 2000 quartersI II III IV I II III IV I II
RRaatteess ooff ggrroowwtthh ooff ggrroossss ddoommeessttiicc pprroodduucctta
Argentina 6.4 6.7 3.3 -0.6 -2.7 -5.2 -5.1 -0.5 0.5 0.8Brazil 1.4 1.4 0.0 -1.4 0.0 0.0 0.5 3.4 3.7 3.4Chile 8.8 6.3 3.4 -2.5 -2.8 -3.7 -1.8 4.0 5.4 6.1China 7.2 7.0 7.2 7.8 8.3 7.6 7.4 7.1 8.1 8.3Colombia 4.9 1.8 -0.6 -3.9 -5.6 -6.8 -3.6 -1.0 2.2 3.5Ecuador 1.6 0.2 0.1 -0.1 -5.4 -7.3 -8.0 -8.3 -1.7 2.6Hong Kong SARb -2.8 -5.3 -7.0 -5.7 -2.9 1.1 4.4 9.2 14.2 10.9India 2.0 5.8 8.3 6.1 7.2 6.9 5.7 5.8 7.2 ..Indonesia -6.4 -15.8 -14.5 -18.7 -4.8 3.8 1.1 5.2 3.2 4.1Israel 4.0 3.2 3.7 4.6 0.9 2.0 2.3 3.1 5.6 5.6Korea, Republic of -3.6 -7.2 -7.1 -5.3 5.4 10.8 12.8 13.0 12.8 9.6Malaysia -2.8 -6.8 -8.6 -10.3 -10.3 5.0 8.2 10.8 11.9 8.8Mexico 7.5 4.2 5.2 2.6 1.8 3.1 4.3 5.2 7.9 7.6Philippines 1.2 -1.0 -0.1 -2.0 1.2 3.6 3.4 4.6 3.8 4.7Singapore 4.7 0.4 -1.9 -1.2 0.8 6.6 6.9 7.1 10.1 9.0South Africa 1.4 1.0 0.1 0.0 0.1 0.5 1.8 2.5 2.4 2.3Taiwan Province of China 5.7 5.2 4.2 3.4 4.2 6.4 4.7 6.4 7.9 5.4Thailand -7.5 -13.7 -12.8 -6.8 0.2 2.5 7.8 6.5 5.3 6.6Turkey 9.2 3.3 2.7 -1.2 -0.1 -1.7 -6.0 -3.4 5.5 6.0Venezuela 9.4 1.7 -5.3 -4.9 -9.3 -8.9 -5.8 -4.5 0.3 2.6
GGrroowwtthh ooff ccoonnssuummeerr pprriicceessa
Argentina 0.6 1.2 1.1 0.8 0.0 -1.1 -1.8 -1.8 -1.3 -1.0Brazil 4.7 3.7 2.6 1.8 2.3 3.3 5.5 8.4 7.9 6.6Chile 5.6 5.4 5.1 4.4 3.8 3.9 3.2 2.5 3.2 3.6China 0.3 -0.9 -1.4 -1.1 -1.4 -2.2 -1.2 -0.8 0.1 0.1Colombia 19.5 23.5 20.8 17.8 16.7 9.9 9.1 9.6 9.0 10.6Ecuador 29.1 34.5 35.4 44.1 45.6 54.6 54.0 53.8 83.2 96.5Hong Kong SARb 5.0 4.4 2.8 -0.8 -1.8 -4.0 -5.9 -4.1 -5.1 -4.4India 9.0 10.4 15.4 17.9 9.0 7.1 2.8 0.5 3.7 5.3Indonesia 27.2 49.5 74.5 77.5 55.9 30.9 6.6 1.7 -0.6 1.1Israel 5.6 4.7 3.6 7.8 7.3 5.9 6.0 1.9 1.5 2.0Korea, Republic of 8.9 8.2 7.0 6.0 0.7 0.6 0.7 1.3 1.5 1.4Malaysia 4.3 5.7 5.7 5.4 4.0 2.7 2.3 2.1 1.5 1.4Mexico 15.3 15.1 15.6 17.6 18.6 17.9 16.5 13.7 10.5 9.5Philippines 7.9 9.9 10.4 10.5 10.0 6.8 5.5 4.5 3.0 3.9Singapore 1.2 0.1 -0.9 -1.5 -0.7 0.0 0.3 0.5 1.1 0.8South Africa 5.5 5.1 7.8 9.1 8.5 7.3 3.3 2.0 2.8 5.2Taiwan Province of China 1.6 1.7 0.6 2.9 0.7 -0.1 0.3 0.0 0.9 1.4Thailand 9.0 10.3 8.1 5.0 2.7 -0.4 -1.0 0.1 0.8 1.6Turkey 99.3 91.8 82.3 72.9 64.4 63.7 64.9 66.1 68.8 61.7Venezuela 37.3 39.4 36.2 31.2 29.1 23.9 22.2 20.1 18.2 17.1
Annual percentage change
Source: IMF, International Financial Statistics and national authorities.a Percentage change from the corresponding quarter of the previous year.b Special Administrative Region of China.

49A N N E X T A B L E S
Table A.7.WORLD TRADE: RATES OF GROWTH OF VOLUMES, 1999-2001
Volume of exportsa Volume of importsa
1999 2000b 2001c 1999 2000b 2001c
World 5.8 10.6 8 5.8 10.8 8¾
Developed economies 5.3 10.2 7 6.4 8.8 7¾of which:North America 6.4 10.6 9 10.9 13.1 7Western Europe 5.2 10.8 6¾ 4.1 6.8 8½Japan 2.8 8.6 4¾ 5.9 6.4 6½
Economies in transition 0.1 8.3 6½ -3.6 11.8 8¼Central and Eastern Europe 7.0 10.5 10 0.2 12.1 7¾Commonwealth of Independent States -8.1 5.3 1¼ -19.2 10.2 11¼
Developing countries 7.8 11.9 10½ 5.3 15.7 11½Latin America and the Caribbean 6.7 6.4 7¼ -3.3 9.2 8½Africa -1.7 4.7 3¾ 4.1 7.1 5¼Western Asia -1.3 8.8 9½ 4.2 7.4 3½East and South Asia 11.7 13.5 11½ 7.9 15.1 14China 7.5 21.6 15¾ 15.7 45.3 16
Memo items:Fuel exporters 6.9 12.9 11 8.3 23.4 11¾Non-fuel exporters 8.3 11.3 10 3.7 11.5 11¼
Annual percentage change
Sources: United Nations and IMF.a Growth for country groups are weighted average, where weights for each year are the previous year's trade valued at 1995 prices and exchange rates in United States
dollars.b Partly estimated.c Forecast, partly based on Project LINK.

W O R L D E C O N O M I C S I T U A T I O N A N D P R O S P E C T S 2 0 0 150
Table A.8.COMMODITY PRICES, 1998-2000
1998 1999 quarters 2000 quartersI II III IV I II III
CCoommbbiinneedd iinnddeexx,, nnoonn--ffuueellDollar -13.0 -16.8 -17.4 -12.4 -7.7 -1.9 2.6 5.3SDR -11.8 -19.6 -17.9 -13.4 -6.5 -0.4 3.9 8.8
FFoooodd aanndd ttrrooppiiccaall bbeevveerraaggeess -14.3 -21.9 -22.7 -16.6 -10.8 -7.3 2.3 6.8TTrrooppiiccaall bbeevveerraaggeess -17.3 -29.9 -20.2 -21.8 -6.6 -9.2 -11.7 -7.7
Cocoa 3.7 -16.9 -34.9 -36.4 -40.4 -35.1 -19.0 -16.5Coffee -28.5 -37.0 -22.4 -23.3 -3.3 -2.6 -14.1 -11.3
FFoooodd -13.8 -19.4 -23.3 -15.8 -12.0 -6.9 6.1 10.1Bananas -3.1 13.5 -21.7 -10.8 -16.1 1.3 -2.1 -11.7Maize -13.4 -13.7 -6.1 1.6 -2.2 1.5 3.2 -9.9Rice 1.3 -5.4 -23.5 -23.6 -20.6 -14.2 -16.5 -24.9Sugar -21.2 -35.6 -36.3 -26.9 -18.3 -23.5 23.8 69.1Wheat -19.9 -14.2 -11.3 -1.4 -16.2 -7.2 0.6 2.9
VVeeggeettaabbllee ooiillsseeeeddss aanndd ooiillss 7.1 -12.0 -22.4 -30.8 -30.7 -24.2 -20.6 -19.0Palm oil 22.9 -13.4 -32.1 -47.9 -45.8 -39.1 -26.5 -14.6Soybeans -17.6 -22.2 -19.2 -12.5 -12.7 1.9 11.5 2.5
AAggrriiccuullttuurraall rraaww mmaatteerriiaallss -10.8 -6.5 -10.2 -12.2 -11.7 -7.6 -3.5 5.0Cotton -17.6 -19.2 -10.8 -23.9 -20.6 -5.8 1.3 16.9Rubber -29.8 -10.7 -18.5 -18.2 -3.0 6.3 14.7 17.7Tropical logs -1.2 0.8 -6.4 -8.7 -14.0 -12.1 -9.8 4.1
MMiinneerraallss,, oorreess aanndd mmeettaallss -16.0 -12.9 -8.0 3.1 11.8 24.6 15.5 9.2Aluminum -15.1 -18.3 -4.2 9.2 17.0 37.4 13.1 8.4Copper -27.3 -17.3 -15.3 2.4 12.6 27.6 18.6 11.5Iron ore 2.8 -9.2 -9.2 -9.2 -9.2 2.6 2.6 2.6Lead -15.3 -5.9 -5.3 -6.1 -2.3 -9.8 -19.5 -6.3Nickel -33.2 -14.6 5.4 53.3 96.6 103.1 80.1 29.4Phosphate rock 2.4 6.5 7.3 2.3 2.3 0.8 0.0 0.0Tin -1.9 -1.2 -7.1 -6.2 5.1 8.2 -0.1 2.1Zinc -22.2 -6.5 -3.4 10.6 21.4 13.8 11.2 3.9
MMeemmoo iitteemm::Manufactured export prices
of developed economies -2.0 -1.0 -2.1 -3.2 -4.1 -3.2 0.0 0.5Real prices, non-fuel -11.2 -16.0 -15.6 -9.6 -3.7 1.3 2.6 4.1Crude oil -31.8 -16.4 22.6 58.9 100.3 125.7 63.8 44.4
Annual percentage change
Source: UNCTAD, Monthly Commodity Price Bulletin.

51A N N E X T A B L E S
Table A.9.FOREIGN DIRECT INVESTMENT INFLOWS AND CROSS-BORDER MERGERS AND ACQUISITIONSa, BY REGION, 1999 AND 2000
1999 2000Foreign direct Cross-border Foreign direct Cross-border
investment mergers and investment mergers andinflowsb acquisitionsa inflowsc acquisitionsa,d
Developed countries 770.0 753.6 898.5 973.5of which:
Western Europe 449.0 417.6 597.3 593.1European Union 432.1 403.4 588.2 567.9United States 275.5 266.5 259.0 304.1Japan 12.3 17.5 5.7 15.6
Developing countries 190.3 92.6 189.9 86.7Africae 8.1 1.2 9.3 2.0Latin America and the Caribbean 86.0 53.9 71.4 57.9Asia 93.5 35.8 107.1 26.7
South, East and South-East Asia 90.8 35.4 100.3 25.8West Asia - 0.3 3.3 0.8Central Asia 2.7 0.1 3.5 0.1
The Pacific 0.3 0.2 0.3 -
Central and Eastern Europef 21.2 11.2 30.0 15.5
World 981.5 859.4 1118.3 1075.7
Billions of dollars
Source: UNCTAD, FDI/TNC database and cross-border mergers and acquisitions database.a By sales. Includes portfolio cross-border mergers and acquisitions (i.e., the acquisition of less than 10 per cent equity share).b Revised.c Preliminary estimates.d January-November only.e Excludes South Africa (which is included under developed countries).f Includes the countries of the former Yugoslavia.
