economic security of older persons in japan 3 oct. 2002 michiko mukuno cabinet office, japan
TRANSCRIPT

Economic Security of Older Economic Security of Older Persons in JapanPersons in Japan
3 Oct. 20023 Oct. 2002
Michiko MukunoMichiko Mukuno
Cabinet Office, JapanCabinet Office, Japan
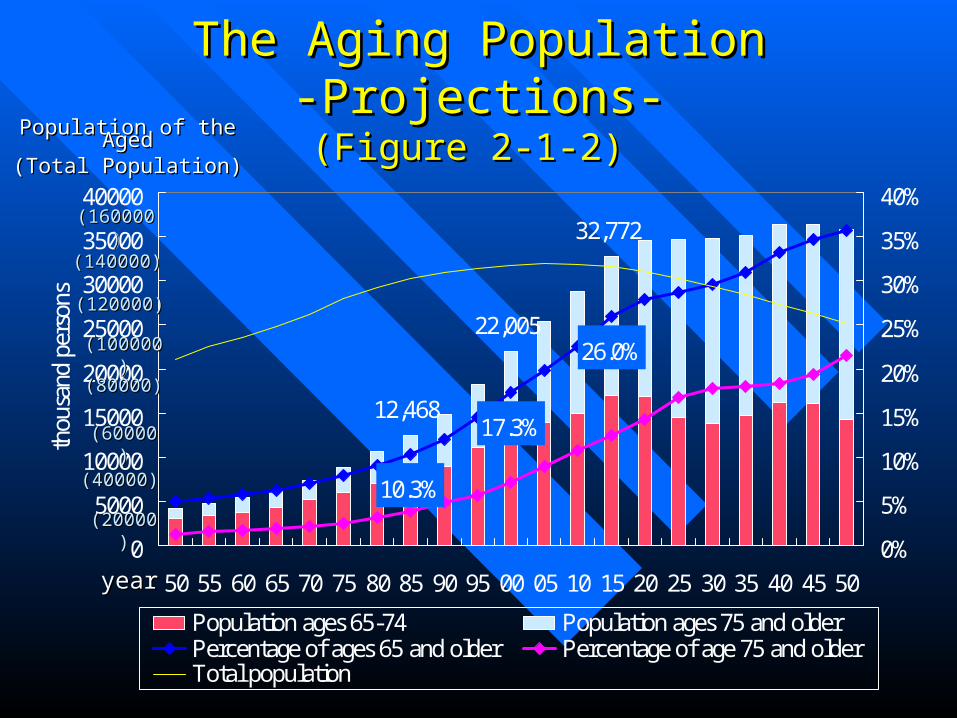
The Aging PopulationThe Aging Population-Projections--Projections-(Figure 2-1-2) (Figure 2-1-2)
10.3%
26.0%
17.3%
32,772
22,005
12,468
0
5000
10000
15000
20000
25000
30000
35000
40000
50 55 60 65 70 75 80 85 90 95 00 05 10 15 20 25 30 35 40 45 50
thou
sand
per
sons
0%
5%
10%
15%
20%
25%
30%
35%
40%
Population ages 65-74 Population ages 75 and olderPercentage of ages 65 and older Percentage of age 75 and olderTotal population
(160000)(160000)
(140000)(140000)
(120000)(120000)
(100000)(100000)
(80000)(80000)
(60000)(60000)
(40000)(40000)
(20000)(20000)
Population of the AgedPopulation of the Aged(Total Population)(Total Population)
yearyear

Average annual income (thousand of yen)Average annual income (thousand of yen)
Per householdPer household
(1999)(1999)
Per household memberPer household member
(Average number of (Average number of household members)household members)
Households of Households of elderly personselderly persons
3,2893,289 2,1872,187 (1.50 person) (1.50 person)
Total Total householdshouseholds
6,2606,260 2,1982,198 (2.85 person) (2.85 person)
Income of Households of Aged Persons Income of Households of Aged Persons (Chart 2-2-12)(Chart 2-2-12)

Percentage of Elderly who are in Work ForcePercentage of Elderly who are in Work Force (Figure 1-1-17)(Figure 1-1-17)
41.9
16.013.8
20.4
5.9
32.9(21.8)
(30.5)
(9.5)
05
101520253035404550
65 years orolder
65-74 years old 75 years orolder
(%)MaleFemale(Total)

Elderly Woman Working in a FactoryElderly Woman Working in a Factory
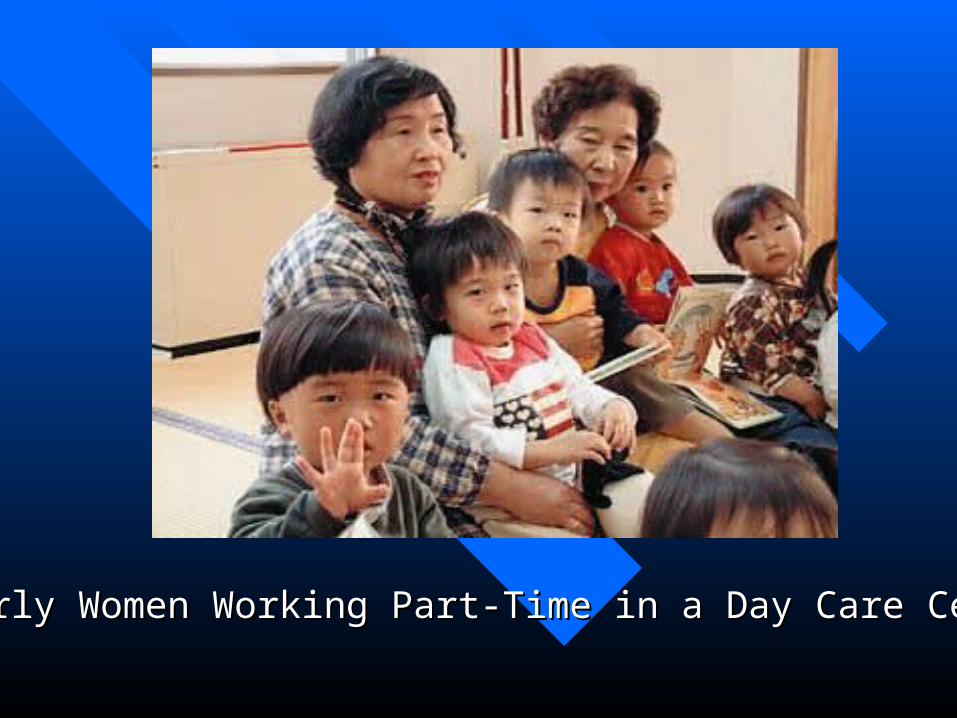
Elderly Women Working Part-Time in a Day Care CenterElderly Women Working Part-Time in a Day Care Center

Group of Elderly Men Who Started a New Group of Elderly Men Who Started a New Business in the Area of Care TechnologyBusiness in the Area of Care Technology

Elderly Men Enjoying Making CeramicsElderly Men Enjoying Making Ceramics
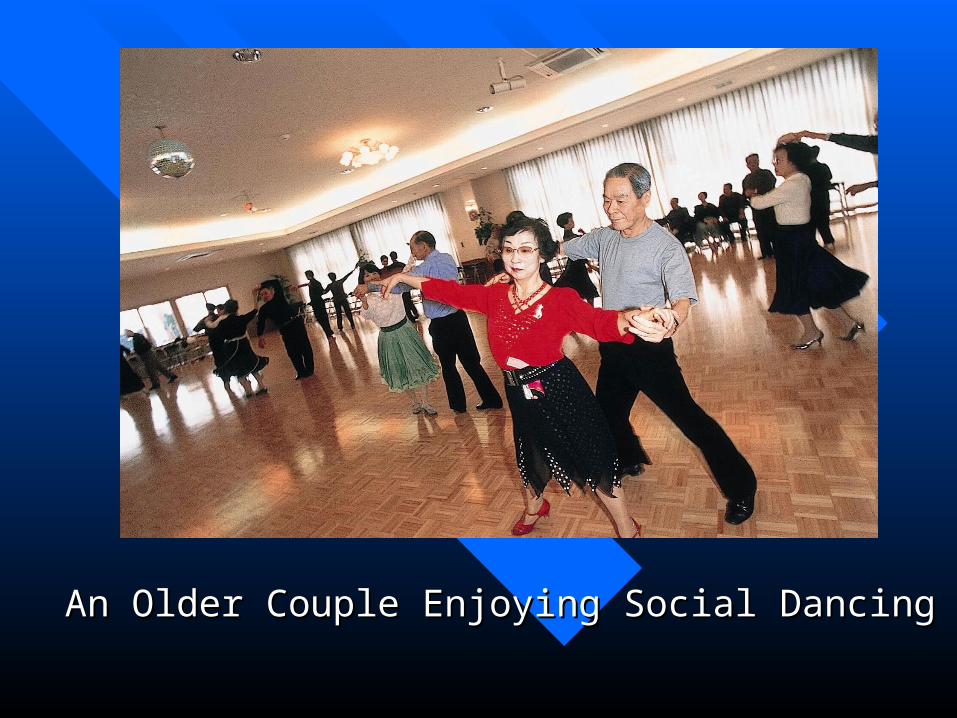
An Older Couple Enjoying Social DancingAn Older Couple Enjoying Social Dancing

Elderly Income Level by Income Category Elderly Income Level by Income Category (Figure 1-1-9)(Figure 1-1-9)
1,145 1,425584
1,7291,809
1,569
766 800 721
140282221
(3,164 )(3,546 )
(2,400 )
(1,078 ) (1,175 ) (946 )
0500
1,0001,5002,0002,5003,0003,5004,000
65 yearsor older
65-74yearsold
75 yearsor older
65 yearsor older
65-74yearsold
75 yearsor older
Male Female
thou
sand
yen
Earned income Income from propertySocial security benefits Other income(Total)
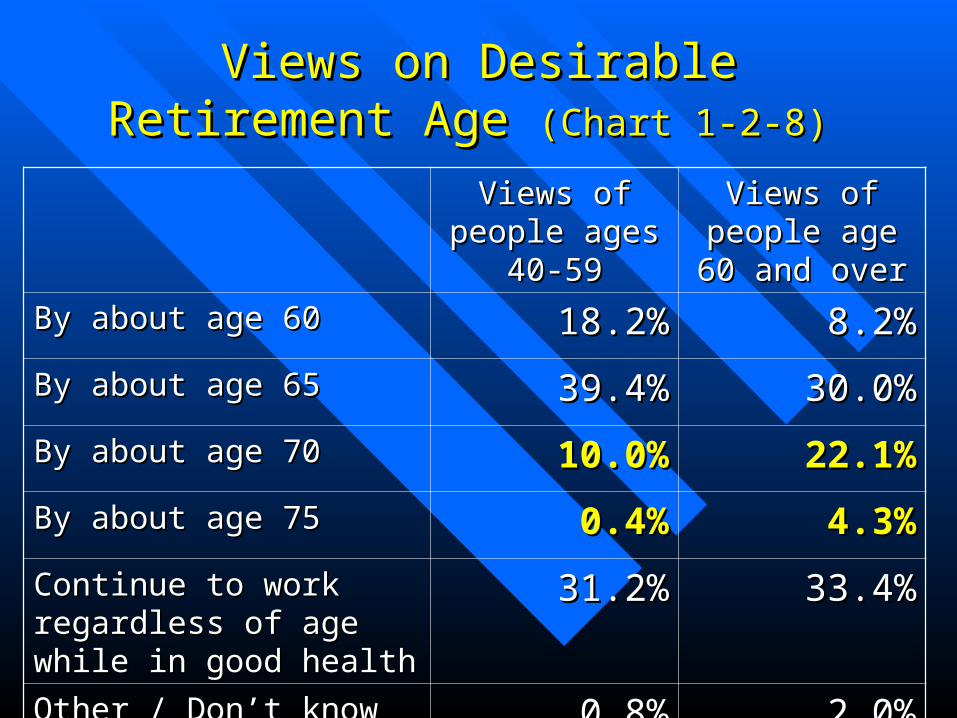
Views on Desirable Retirement Age Views on Desirable Retirement Age (Chart 1-2-8) (Chart 1-2-8)
Views of people Views of people ages 40-59ages 40-59
Views of people Views of people age 60 and overage 60 and over
By about age 60By about age 60 18.2%18.2% 8.2%8.2%
By about age 65By about age 65 39.4%39.4% 30.0%30.0%
By about age 70By about age 70 10.0%10.0% 22.1%22.1%
By about age 75By about age 75 0.4%0.4% 4.3%4.3%
Continue to work regardless Continue to work regardless of age while in good healthof age while in good health
31.2%31.2% 33.4%33.4%
Other / Don’t knowOther / Don’t know 0.8%0.8% 2.0%2.0%

Structure of the Public Pension SystemStructure of the Public Pension System
Employee pension fund
Tax-qualified pension plan
(Substitutive portion)
Employee pension insurance scheme
Mutual aid pension
National pension system (Basic pension)
(Dependent spouses of employees, others)
(Self-employed persons, others)
(Salaried workers in private sector) (Government employees,others)
National pension fund
Guaranteed contribution-based
pension
<Defined benefit type corporate pension>
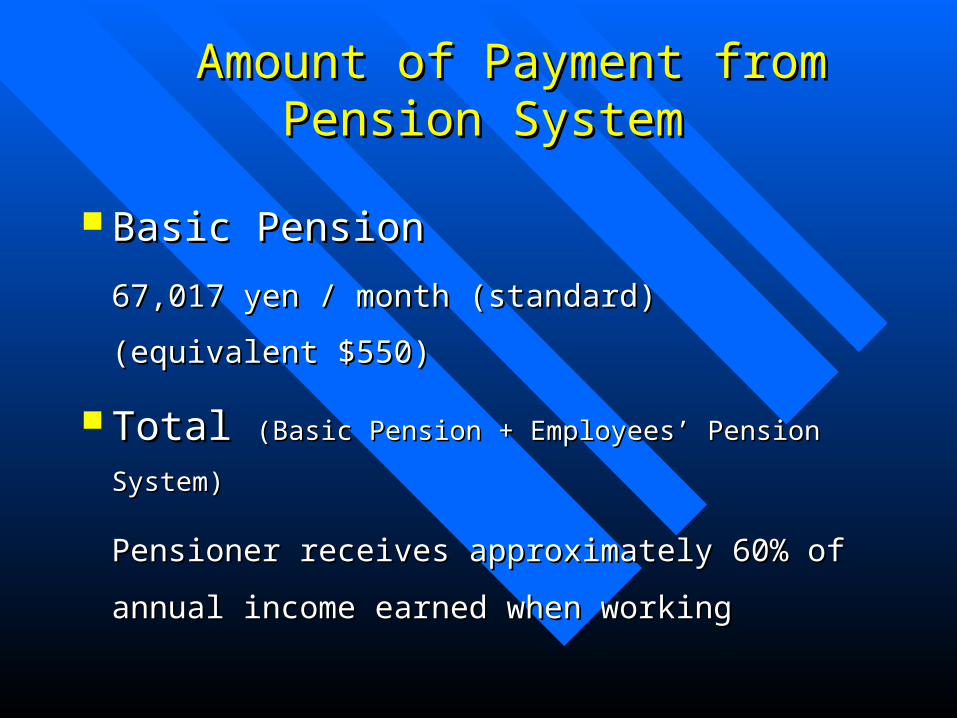
Amount of Payment from Pension SystemAmount of Payment from Pension System
Basic PensionBasic Pension
67,017 yen / month (standard) 67,017 yen / month (standard)
(equivalent $550)(equivalent $550)
Total Total (Basic Pension + Employees’ Pension System)(Basic Pension + Employees’ Pension System)
Pensioner receives approximately 60% of Pensioner receives approximately 60% of
annual income earned when workingannual income earned when working
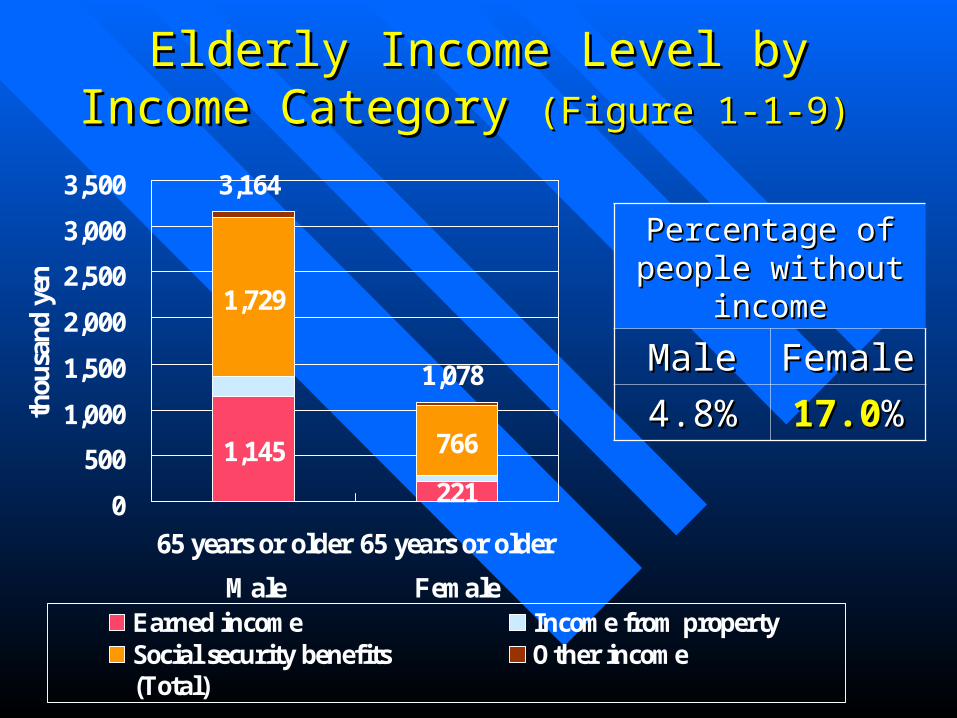
Elderly Income Level by Income Category Elderly Income Level by Income Category (Figure 1-1-9)(Figure 1-1-9)
1,145 766
221
1,729
3,164
1,078
0
500
1,000
1,500
2,000
2,500
3,000
3,500
65 years or older 65 years or older
Male Female
thou
sand
yen
Earned income Income from propertySocial security benefits Other income(Total)
Percentage of people Percentage of people without incomewithout income
MaleMale FemaleFemale
4.8%4.8% 17.017.0%%

Our challenges are …Our challenges are …
To improve the economic situation of older To improve the economic situation of older
womenwomen
To provide a balance between benefits and To provide a balance between benefits and
contributions among different generationscontributions among different generations