economic review and outlook - gov
TRANSCRIPT

Budget Paper A
ECONOMIC REVIEW AND OUTLOOK
Available in alternate formats upon request.

ECONOMIC REVIEW AND OUTLOOK
CONTENTS
INTRODUCTION .............................................................................................................................................................................................. 1
INTERNATIONAL AND CANADIAN ECONOMIC DEVELOPMENTS ................................................................................................... 1
MANITOBA ECONOMY ................................................................................................................................................................................. 2
ECONOMIC OUTLOOK .................................................................................................................................................................................. 12
Appendix 1: MANITOBA’S NORTH ............................................................................................................................................................ 17
Appendix 2: GROWING RURAL MANITOBA – INVESTING IN SUSTAINABLE GROWTH OPPORTUNITIES ........................... 20

B U D G E T 2 0 1 3 E c o n o m i c R e v i e w a n d O u t l o o k / A 1
n INTRODUCTIONDespite moderate growth in 2012, Manitoba’s economy fared relatively well among provinces. The province saw strength in employment growth and further solid gains in housing, wholesale trade and capital investment. This helped offset some of the weakness arising from slower growth in manufacturing sales, a decline in exports and limited growth in retail sales associated with the more cautious consumer sentiment witnessed throughout Canada.
Given the elevated level of global economic uncertainty, private forecasters expect Manitoba’s overall economic growth to slow in 2013, as domestic and international demand for goods and services remains in check.
Manitoba’s real GDP growth is forecast to soften to 1.9% in 2013, down from the estimated 2.2% increase in 2012, but above Canada’s projected growth for a second consecutive year.
External economic factors associated with developments in Europe, Asia and the United States are unlikely to be resolved in the near term, and continue to present risks to Manitoba’s economic outlook. In the face of these and other global challenges, the province’s diverse economy is expected to remain stable relative to other Canadian provinces.
n INTERNATIONAL AND CANADIAN ECONOMIC DEVELOPMENTSAfter a sharp rebound in 2010, global economic growth has slowed. The sovereign debt concerns in Europe, fiscal consolidation in many advanced economies, unresolved budget and debt negotiations in the U.S., and slower growth in China are among the key factors elevating risks and weighing down overall business and consumer confidence.
Following real GDP growth of 5.1% in 2010, the global economy slowed to growth of 3.9% in 2011 and 3.2% in 2012. The International Monetary Fund (IMF) estimates world growth to moderate in the near term, expanding 3.5% in 2013 and increasing to 4.1% in 2014.
The U.S. economy, the largest economy in the world, remains fragile as it expands at a reserved pace. The economy is experiencing the weakest post-recession recovery since WWII. Both labour and housing markets, although improving, remain well below their previous peaks. Soft domestic and foreign demand is limiting business investments.
On the fiscal side, the challenges of implementing any budget resolution regarding U.S. federal spending and revenue measures continue to undermine near-term economic outlook. Overall, U.S. GDP growth is estimated at 2.2% in 2012 and 2.0% in 2013, up modestly from 1.8% in 2011.
Growth in China is somewhat restrained, reflecting weaker demand for goods and services in advanced economies. The slowdown shows the impacts of tighter credit policy implemented in the past. As these credit rules are eased, growth in China is expected to strengthen. The IMF projects growth in
Per Cent
Real GDP Growth, Manitoba and Canada
Sources: Statistics CanadaManitoba Bureau of StatisticsManitoba Finance, survey of economic forecasters
f - Forecast
File: B_chart 3 - Real GDP MB&Can_13.aiCreated: Thursday, 28 March 2013Revised: 1/2013-04-02Fixed: Paper: Economy
-2
-1
08 1109 10 12f07
0
2
4
5
3
1
-3
-4
Manitoba Canada
13f
11 12f 13f 14f0905 06 07 08 10
Percentage Change
Real GDP Growth, 2005 to 2014f
Canada WorldU.S.
Sources: Statistics CanadaU.S. Bureau of Economic AnalysisManitoba Finance, survey of economic forecasters
International Monetary Fund
f - Forecast
File: A_chart 1 - Real GDP_13.aiCreated: March 25, 2013Revised: 4/April 2, 2013 Fixed:Paper: Economy
-1
-2
-3
-4
2
1
0
3
4
5
6

A 2 / E c o n o m i c R e v i e w a n d O u t l o o k B U D G E T 2 0 1 3
developing Asia to moderate to 6.6% in 2012, down from 8.0% growth in 2011. Growth will accelerate to 7.1% in 2013 as investment activity and household spending start to rebound. China is currently the world’s second-largest economy and according to the IMF, it is expected to surpass the U.S. in size by the end of the decade.
Following a recession in 2012, Europe is expected to generate almost no growth in 2013. The sovereign debt and financial markets crisis continue to weigh on economic activity in Europe. The crisis has created a credit squeeze for commercial and household borrowing, thereby dampening domestic spending. According to the IMF, the Euro Area, accounting for over 14% of the global economy, is estimated to have contracted by 0.4% in 2012 and expected to decline by 0.2% this year.
Influenced by global economic conditions, the Canadian economy slowed in 2012 and is expected to grow at a modest pace over the next two years. Canada has shifted to a more moderate expansion phase, signaling a balance between the gradual withdrawal of fiscal stimulus, and moderate growth in business and consumer spending. Real GDP increased by 1.8% in 2012.
According to the Bank of Canada (BOC), consumer spending is expected to grow at a tempered pace through 2014. This growth in spending will be financed through debt, thereby further increasing the ratio of household debt to income. The recent tightening of mortgage financing rules is expected to shift the housing market to a more sustainable pace by dampening residential investment spending over the near term.
As global demand strengthens, the well capitalized Canadian corporations are expected to boost investment spending on productivity enhancing technology.
Measured growth in sales to the U.S. and Asia, especially for mineral resources and commercial services, has constrained Canadian exports to 1.7% growth in 2012, down from 4.7% in 2011. Canadian exports are not forecast to regain their pre-recession peak until the first half of 2014.
Given the global situation coupled with volatility in commodity prices, the Manitoba Finance survey of economic forecasters suggests Canadian growth will average 1.7% in 2013 and 2.5% in 2014. Consumer prices are expected to increase 1.6% in 2013 and 2.0% in 2014, compared to 1.5% in 2012. These expectations are in line with the inflation target established by the BOC.
Canada’s unemployment rate is expected to progressively improve over the next two years, falling from 7.3% in 2012 to 7.2% in 2013 and 6.9% in 2014.
n MANITOBA ECONOMYThe Manitoba economy is highly diversified, with 11 different sectors, each making up more than 5% of GDP. This diversity, across such industries as manufacturing, mining, construction, finance and insurance, and education, makes Manitoba’s economy one of the most stable in the country. Given the province’s broad industrial structure, Manitoba has fared relatively well during the current global economic slowdown. Manitoba’s real GDP slowed from 2.3% growth in 2010 to 2.2% in both 2011 and 2012.Source: Statistics Canada
Manitoba Economy, 2011
File: B_chart 1 - MB Economy_13.aiCreated: March 25, 2013 Revised: Fixed: 26 March
Goods Non-commercial ServicesCommercial Services
AgricultureMiningUtilities
Construction
Manufacturing
WholesaleTrade
Retail TradeTransportationInformation
Finance & Insurance
Real Estate
Professional& Scientific
Other Services
Education
Health & Social
Public Admin.

B U D G E T 2 0 1 3 E c o n o m i c R e v i e w a n d O u t l o o k / A 3
Over the five-year period from 2007 to 2012, Manitoba’s average annual real GDP growth rate was 2.1%, second among provinces and almost double Canada’s overall rate of 1.1%. Manitoba Finance’s survey of economic forecasters suggests real GDP growth will be 1.9% in 2013, ahead of Canada’s 1.7% growth.
Manitoba’s Consumer Price Index (CPI) increased 1.6% in 2012, marginally ahead of Canada’s 1.5%. The gains were driven by price increases in alcohol, tobacco and food. Clothing and recreation prices were responsible for keeping the CPI in check. Manitoba Finance’s survey of economic forecasters indicates that CPI growth in Manitoba will continue to be modest at 1.7% in 2013, in line with the 1.6% expected increase in national CPI.
Household balance sheets in Manitoba remain among the strongest in the country. According to the Canadian Bankers Association, Manitoba has the second-lowest rate of mortgages in arrears. In addition, Manitoba’s personal debt per capita levels are the lowest among all provinces, as measured by personal debt held at commercial banks, including mortgages, credit cards and non-business loans. With persistently low interest rates, low unemployment and rising real wages, overall, Manitoba households find themselves on relatively secure financial footings.
While population growth in the province slipped slightly to 1.2% from record increases of 1.3% in both 2010 and 2011, it remains high by historical standards. This growth has supported increased levels of domestic demand, particularly in the housing and retail sectors. It was also a factor in mitigating the negative impacts of the recession in 2008-2009.
Labour MarketThe labour market in Manitoba remained strong in 2012. Growth in the labour force was more than matched by employment growth, resulting in an unemployment rate that fell to 5.3% in 2012 from 5.4% in 2011. That placed Manitoba third among provinces and below the Canadian average of 7.2%. Employment strengthened during the last quarter of 2012, and the year finished with more Manitobans employed than at any point in history. On an average annual basis, in 2012, Manitoba’s employment increased 0.9% and Manitoba’s labour force expanded 0.8%.
Manitoba’s private sector created 7,500 jobs in 2012, while the public sector shed 1,900 jobs, for a net gain of 5,600 jobs. Most occupational groups saw employment growth in 2012, with management, construction, and educational services leading the way. Declines were recorded in manufacturing, public administration, accommodation and food services, and finance.
Over the first three months of 2013, Manitoba employment is 1.8% higher (11,200 jobs) than it was in the same period in 2012, and the labour force
Percentage Change
Real GDP, Average Annual Growth, 2007 to 2012f
Sources: Statistics CanadaManitoba Finance, survey of economic forecasters
f - Forecast
File: B_chart 2 - Real GDP 5 yr_13.aiCreated: Monday, 25 March 2013Revised: Fixed: 26 March Paper: Economy
-0.5
0
MB BCAB PE QC CASK NLNS NB ON
0.5
1.5
2.5
3.0
2.0
1.0
-1.0
Per Cent
Unemployment Rate, 2012
Source: Statistics Canada
File: M_chart 1 - Unemp Rates by Prov.aiCreated: March 26, 2013Revised: Fixed:
0 2 4 6 8 10 12 14
SKMB
AB
NSNBPENL
QCON
BCCA

A 4 / E c o n o m i c R e v i e w a n d O u t l o o k B U D G E T 2 0 1 3
is up 1.3% (8,500). Over the same three-month comparison, private sector employment is up 2.1% (9,900) and public sector employment is up 0.8% (1,300). Full-time employment is up 1.6% (8,000), while part-time employment is up 2.6% (3,200). The average unemployment rate in 2013 is 5.0%, the third lowest among provinces and below the 2012 average.
ManufacturingManufacturing is Manitoba’s largest industry, accounting for 10% of Manitoba’s GDP and providing 10% of all jobs in the province. Sales in manufacturing have increased by an average annual rate of 4.8% over the last 20 years. This compares favourably to the national average annual increase of 3.8%.
The majority of manufactured goods in Manitoba are exported. Manufacturing sales account for about two-thirds of total foreign merchandise exports. These exports include a diverse mix of industrial and consumer goods, including aerospace products, transit and intercity buses, meat, grain and oilseed based food products, wood products including doors and windows, industrial and agricultural chemicals, and agricultural machinery. Given the economic uncertainty in many of Manitoba’s export markets, shipments of manufactured goods from the province may be restrained in 2013.
Following the impact from the 2008-2009 global recession, Manitoba’s manufacturing sales rebounded 6.2% in 2011, principally on the strength of increases in chemical products (34%), machinery (24%), primary metals (13%) and aerospace parts (9%).
In 2012, Manitoba’s manufacturing sales increased 1.3% to $15.5 billion. Weaker global demand for food products lowered food manufacturing shipments 6.4%. Chemical sales fell 2.9%. Overall, sales on non-durable
goods declined 4.8% in 2012. The increases were broad based, but mainly in durable manufactured goods.
With aging fleets of aircraft in North America and Europe, and increasing passenger traffic, especially in emerging markets, Manitoba’s aerospace parts manufacturing industry has rapidly expanded. Sales increased 9% in 2011 and by a further 16% in 2012. Annual sales in aerospace parts now exceed $1 billion and the industry accounts for 8% of total manufacturing sales in the province.
Machinery manufacturing has also increased in the province. Machinery production for agriculture increased by 24% in 2011 and by 14% in 2012. Machinery for other sectors, including mining and construction, increased 69% in 2011 and 11% in 2012. Fabricated metal product manufacturing increased by 6% in 2012, driven primarily by a 15% increase in architectural and structural metals manufacturing. The recent strength in housing in Canada and in the U.S. pushed up sales of wood products by 20% in 2012. Sales of sawmill products increased by 20%, while sales of millwork, which included door and window products, increased 6%.
Per Cent
Manitoba Manufacturing Shares, 2012
Source: Statistics Canada
File: H_chart 1 - MB Manufacturing Shares_13.aiCreated: Tues, 26 March 2013Revised: Fixed: Paper: Economy
0 5 10 15 20 25
Plastics & RubberWood
Transportation EquipmentFabricated Metals
Aerospace PartsChemicals
FoodMachinery
Primary Metals
PrintingNon-metallic Minerals
Electrical AppliancesPaper
Manitoba Employment Trend
Source: Statistics Canada
Three-Month Moving Average, Thousands
File: M_chart 2 - MB Employ Trend B_13.aiCreated: April 5, 2013Revised: Fixed: April 8, 2013
0
620
625
630
635
640
Mar 11 Sep 11 Mar 12 Sep 12 Mar 13

B U D G E T 2 0 1 3 E c o n o m i c R e v i e w a n d O u t l o o k / A 5
Global competition, currency fluctuations and the tight skilled labour market continue to encourage Manitoba manufacturers to invest in lean principals and new technology. Last year, the sector spent $424 million on machinery and equipment, a 4.2% increase over the previous year. This year, according to Statistics Canada’s Survey of Private and Public Investment Intentions report, machinery and equipment purchases will reach $556 million, the highest since 2000 and a 31% annual increase.
Mining and Oil ProductionThe minerals sector has been a major contributor to Manitoba’s economic growth. It directly employed 5,700 people in 2012, representing almost 1% of the work force and its output was estimated at 6.4% of the total economy in 2011. In addition, this sector accounts for 16% of foreign merchandise exports. Manitoba’s chief mineral commodities are nickel, copper, zinc and gold, while oil production is a burgeoning sector.
The mining sector GDP increased 12.8% in 2011, following a 13.5% increase in 2010. From 2007 to 2011, it has been Manitoba’s fastest growing industry at 7.8% annually. That growth has made mining the fifth-largest sector among Manitoba industries in 2011, up from tenth in 2007. While metal ore mining output decreased 2.7% annually over that time, oil production increased 17.0% annually.
Production of most metals remained constant in 2012, with modest increases in nickel (1.1%), zinc (3.0%) and gold (1.6%). Copper production fell 26.2%, reflecting the closure of two mines. With reduced global economic activity and soft demand conditions, prices for nickel, copper and zinc fell in 2012, resulting in the total value of metal production in Manitoba falling by 17.0%.
Despite a fall in oil prices, production continued to increase in Manitoba, growing 18.6% in 2012, to a record 17.9 million barrels. The increased output pushed the value of oil production up 8.5%. Over the past decade, oil production has increased 15.9% annually and averaged over 23% annually over the last three years.
The growth in Manitoba’s oil industry is supported by a sharp increase in new wells being drilled in the province. Over the last five years, the number of new wells has increased 90% to 614 units. Expenditures in the industry have grown from $361 million in 2007 to an estimated $1.3 billion in 2012.
Mining sector capital investment in the province was down 8.4% in 2012, from a record high in 2011. In fact, 2012 was more than double the previous ten-year average. The level in 2012 marks the third consecutive year above $1 billion of investment, and 2013 survey estimates project a new high, with a 15.9% growth.
Millions of Dollars
Manitoba Mining Investment
p - Preliminary i - IntentionsSource: Statistics Canada
File: J_chart 2 - Manitoba Mining Investment_13.aiCreated: Tues, 26 March 2013Revised: Fixed: 26 March, 2013Paper: Economy
0
1,200
1,400
1,600
1,000
800
600
400
200
03 04 05 06 07 08 09 10 11 12p 13i
Millions of Barrels
Manitoba Oil Production
Source: Manitoba Innovation, Energy and Mines
File: J_chart 1 - Manitoba Oil Production_13.aiCreated: Tues, 26 March 2013Revised: Thurs, 28 March 2013 Fixed: Paper: Economy
0
16
18
20
14
12
10
8
6
4
2
03 04 05 06 07 08 09 10 11 12

A 6 / E c o n o m i c R e v i e w a n d O u t l o o k B U D G E T 2 0 1 3
AgricultureAgriculture is an important sector of the Manitoba economy with many linkages to other industries. The agriculture sector’s value added output directly represented 2.9% of the Manitoba economy in 2011, and employed 3.4% of the work force in 2012. Crop, livestock and related food-processing businesses represented over a third of total provincial exports last year.
Farm cash receipts gained 1.0% in the first three quarters of 2012, compared to the same period in 2011. Crop receipts fell 2.5%, livestock receipts increased 4.0% and direct payments to agricultural producers, which includes insurance and various types of income supports, gained 8.5%.
Crop production faced significant challenges in 2010 and 2011, with excessive precipitation and f looding affecting seeding, yields and harvests. Farm inventory levels were drawn down, leaving levels of stocks at historical lows at the beginning of 2012. Wheat and barley inventories were at their lowest recorded levels, while canola was at an 11-year low.
However, 2012 crop production rebounded, starting with more seeding and ending with higher yields. Wheat production increased 76.0%, and canola gained 20.3%. Production of corn for grain doubled, making it the third-largest crop in Manitoba in 2012. Soybean production spiked 83.5%, while production of barley more than doubled, up 136.6%, and oat harvests were 31.8% higher than in 2011.
Crop receipts did not reflect the increase in production. Anticipating higher prices in the future, crop producers elected to rebuild inventory levels. Wheat stocks doubled to a level 10% higher than the previous five-year average. Canola inventories gained 28.4%. Grain corn and soybean stocks increased to record-high levels, reflecting their growing importance to Manitoba farmers. Since the crops were not sold, receipts for oilseeds were down 14.8% in September 2012 on a year-to-date basis, while receipts for wheat were down 13.4%, and other grains fell 12.3%.
Manitoba’s livestock sector continues to be hampered by challenging market conditions: weak demand, higher feed costs, livestock price f luctuation and the U.S. Country of Origin Labelling (“COOL”) law which requires country of origin identification labels for fresh beef, pork and lamb sold in the U.S.
In 2012, despite an improvement in prices, cattle inventories decreased in Manitoba. Producers had fewer than 1.2 million cattle on their farms as of January 1, 2013, down 0.4% from the same date a year earlier. Total demand fell by 4.6%, led by a 3.8% drop in exports and 6.1% drop in processing. Total exports have declined in each of the past four years and are lower than levels in 2003 and 2004, during the BSE crisis.
After several years of contraction following the introduction of the U.S. COOL regulations, Manitoba’s hog industry is expanding. Total supply of hogs increased 1.3% in 2012, with domestic production rising in step. Aggregate demand increased in line with supply, up 1.3%, reflecting higher international exports (0.6%) and domestic sales (1.8%).
Percentage Change
Crop Production Growth, 2012
Source: Statistics Canada
File: K_chart 1 - Crop Production_13.aiCreated: March 26, 2013Revised: 2/April 2, 2013Fixed: 26 March Paper: Economy
0
40
20
60
80
100
120
140
160
Wheat Canola Corn for grain
Soybeans Barley Oats

B U D G E T 2 0 1 3 E c o n o m i c R e v i e w a n d O u t l o o k / A 7
Electricity GenerationManitoba Hydro is responsible for electricity generation, transmission and distribution within the province. More than 98% of the electricity produced in Manitoba comes from clean, renewable sources. The vast majority comes from 14 hydro-electric generating stations, primarily on the Winnipeg, Saskatchewan and Nelson River systems. In total, these stations are capable of producing in excess of 5,200 megawatts (MW).
With the completion and activation of the final generator at Wuskwatim in October 2012, Manitoba Hydro is moving to consider a number of new capital projects to help meet future energy demands and safeguard service supply. The Keeyask station would be a 695 MW facility on the Nelson River, projected to commence producing power in 2019. The Conowapa generating station, potentially Manitoba’s largest hydro facility at 1,485 MW, is also being evaluated with a view to commencing production in 2025.
To transmit this new capacity and ease the risk of service disruptions, Manitoba Hydro is proposing to build Bipole III down the western part of the province. The projected in-service date for this project is 2017.
Hydro sales declined 2.8% in 2012 on weaker U.S. demand and a relatively mild summer cooling season. Sales are expected to increase due to stronger seasonal demand.
PopulationManitoba’s total population was estimated at 1,267,003 persons as of July 1, 2012. This is Manitoba’s “official” population for the year. The population growth for the year was 15,313 persons, or 1.2%, third highest among provinces and above Canada’s increase of 1.1%.
Manitoba’s population has experienced healthy growth over the past 10 years, rising 9.5%, or over 110,000 persons, compared to 3.9% or 44,000 persons, in the previous 10 years. Over the last decade, immigration levels to the province have more than tripled, net interprovincial out-migration has decreased and the number of births has increased.
The demographic profile of the province has also shifted; the share of youth (0-14 years) has decreased from 20.4% in 2002 to 18.8% in 2012, while the share of Manitobans aged 65 and over increased from 13.6% to 14.2%.
An absolute increase in the number of individuals aged 15 to 64 has helped lower the median age of Manitoba’s population from 37.8 in 2009 to 37.6 in 2012. Last year, the national median age was 40.0. In 2012, Manitoba was the third-youngest province, behind Alberta at 36.1 years and Saskatchewan at 37.1 years.
Percentage Change
Manitoba Population Growth
Note: at July 1Source: Statistics Canada
File: F_chart 1_MB Population change_13.aiCreated: March 26, 2013Revised: Fixed: Paper: Economy
0
0.2
0.4
0.6
0.8
1.0
1.2
1.4
03 04 05 06 07 08 11 121009
Manitoba Hydro Generating Stations Station MW
Limestone 1,340Kettle Rapids 1,220Long Spruce 1,010Grand Rapids 479Kelsey 250Wuskwatim* 200Seven Sisters Falls 165Great Falls 129Jenpeg 129Pine Falls 88Pointe du Bois 75Slave Falls 67McArthur Falls 55Laurie River 1 & 2 10
Total 5,217
Source: Manitoba Hydro * Fully operational in October 2012

A 8 / E c o n o m i c R e v i e w a n d O u t l o o k B U D G E T 2 0 1 3
HousingManitoba’s housing market reported a strong year in 2012. Enumerated single-detached starts, the best measure of housing demand, were up 4% from 2011, while all starts were 19% greater. Both were above the Canadian growth rates of zero and 11%, respectively. Province-wide total housing starts surpassed 7,000 units in 2012, the highest since 1987.
Driven by strong population growth, the housing market in Manitoba has been underpinned by real, rather than speculative, demand. Manitoba’s average resale price grew from $234,604 in 2011 to $246,318 in 2012, a gain of 5%. Average new home prices in Manitoba’s urban centres rose 1.9% in 2012, roughly in line with inflation. With more than 14,000 Multiple Listing Service sales, the total dollar volume of activity was the highest on record.
Despite the elevated economic activity, Manitoba remains one of the most affordable jurisdictions in Canada and in line with long-term affordability measures, according to the Royal Bank’s Housing Affordability Report.
Canada Mortgage and Housing Corporation is forecasting a moderation in both new and resale markets as both swing to more balanced condition in 2013 and 2014. The forecast suggests province-wide starts will level off at 7,100 units in both years, down slightly from 2012, while sales and prices in the resale market will expand by an average of 0.7% and 3.5%, respectively. Real demand, coupled with relative economic and demographic strength, mean Manitoba is expected to remain somewhat insulated in the event of a national housing downturn.
Renovation activity has long been an important part of Manitoba’s housing sector. In 2012, 41% of Winnipeg homeowners performed some type of renovation, among the highest propensities in the country. With nearly $1 billion spent on renovations in Winnipeg alone, this sector of the housing market is larger in size than the new home market in the province. A relatively
older housing stock, regular energy related retro-fit programs from Manitoba Hydro, and recent limited supply in the resale market have all contributed to the robust activity in this sector.
The average apartment vacancy rate in Manitoba was 1.6% in 2012, up from 1.0% in 2011. Both government and market incentives have spurred rental construction in recent years, with more than 2,000 rental starts province-wide in the last two years. Ongoing activity in this sector will continue to alleviate pressures on the vacancy rate.
Retail TradeIn Manitoba, the retail trade sector represents 6% of the economy and 11% of all jobs in the province. Supported by solid economic and demographic fundamentals, including improving disposable incomes and increasing weekly earnings, sales in the sector have expanded by almost 60% in 10 years, well above the national increase and third fastest among provinces.
In 2012, growth in Canadian retail receipts softened to 2.4%, down from 4.1% in 2011. Manitoba sales slowed to 1.4% from 4.3% in 2011. All provinces experienced weaker growth except Alberta.
In Manitoba, 2012 sales were tempered by a 6.4% drop in electronic and appliance sales and a 1.8% drop in gasoline store sales. Food and beverage store sales, the largest retail component, at 23% of total receipts, increased by 1.0%. Department
Source: Canada Mortgage and Housing Corporation
f - Forecast
Manitoba Housing StartsUnits
File: C_ chart 1 - Manitoba Housing Starts_13.aiCreated: March 26, 2012 Revised: Fixed: March 26Paper: Economy
Singles Multiples
08 0905 10 11 12 13f 14f0403 06 070
1,000
2,000
3,000
4,000
5,000
6,000
7,000
8,000

B U D G E T 2 0 1 3 E c o n o m i c R e v i e w a n d O u t l o o k / A 9
and general merchandise sales were the largest gain among sectors at 4.5%. Clothing store sales increased 4.2%, while furniture and home furnishing store sales increased 5.5%.
Sales at motor vehicle and parts dealerships increased 2.5% last year. New motor vehicle sales jumped 7.6% to a record 52,236 units in 2012. Passenger vehicle unit sales grew 9.8% and trucks, SUVs and vans bolstered unit sales with a 6.6% gain.
Manitoba’s strength in domestic demand is attracting new retail sector capital investments into the province, including IKEA, Target and Marshalls, and expansion of existing outlets. Investment in 2012 in Manitoba’s retail sector was high, growing 26.5%. Over the past five years, investment has increased 3.2% annually, ranked fourth among provinces and ahead of Canada, which has been flat over that time. Retail investment is expected to continue to build in 2013 with 6.6% growth.
Wholesale TradeManitoba’s geographic location at the centre of Canada, combined with a well established rail, road and air transportation system, has provided a solid base for a diverse and growing wholesale distribution network. This network is delivering large quantities of goods to and from retailers, primary producers (agriculture and mining), and institutional clients. In 2011, inflation adjusted wholesale output represented 6.1% of the economy, which was the second-largest wholesale sector share among provinces.
Recent strength in commodity prices in agriculture, strong growth retail activity and a rapidly expanding energy sector have provided a boost to Manitoba’s wholesale trade.
Growth in nominal wholesale trade from 2007 to 2012 was 3.2% annually and has been broad based. The largest contribution was in farm products which increased by 7.1% annually. Machinery and equipment sales increased by 6.9% annually, while motor vehicle and parts sales increased by 5.8% annually over five years.
In 2012, wholesale trade sales increased 6.0% in Manitoba, the third-highest growth among provinces. The largest increases were in motor vehicles and parts (13.8%), building materials and supplies (12%), and machinery and equipment (10.9%).
Capital investment in Manitoba’s wholesale sector rose 29.4% in 2012, second highest among provinces and higher than Canada at 10.6%. Over the past five years, from 2007 to 2012, Manitoba’s wholesale trade increased at an average annual rate of 5.7%, fourth highest and above Canada at 0.9% annually.
Billions of Dollars
Manitoba Retail Sales
Source: Statistics Canada
File: D_chart 1 - Manitoba Retail Sales_13.aiCreated: March 26, 2013Revised: Fixed:
0
6
4
2
8
10
12
14
16
18
03 04 05 06 07 08 11 121009
Average Annual Per Cent Growth Rate
Manitoba Wholesale Trade by Industry, 2007 to 2012
Source: Statistics Canada
File: E_chart 1 - Wholesale Trade by Industry_13.aiCreated: Tues, 26 March 2013Revised: 26 March Fixed: Paper: Economy
-3 0 3 6 9
Food, Beverage, Tobacco
Motor Vehicles, Parts
Machinery & Equipment
Farm Product
Building Materials
Personal, Household
Miscellaneous

A 1 0 / E c o n o m i c R e v i e w a n d O u t l o o k B U D G E T 2 0 1 3
Capital InvestmentCapital investment plays a vital role in economic development. Investment in industrial, commercial, institutional, road and bridge infrastructure, and housing not only provide an immediate economic boost, but offer long-term benefits through increased productive capacity of the economy. Capital investment in machinery and equipment, intellectual property products, and other technology also enhance efficiency and productivity.
In Manitoba, capital expenditures have been extremely buoyant for a number of years. Over 10 years, annual capital spending has more than doubled from $6.0 billion in 2002 to $12.3 billion in 2012. Annual investment in new structures in Manitoba reached a record $8.9 billion in 2012, and investment in machinery and equipment marked a record $3.4 billion. In addition, Manitoba has the most consistent growth in business capital investment of all provinces with only one year of decline in the past 21 years.
In the last five years, capital investment increased 38% in Manitoba, the third-highest increase among provinces, and double the 19% national increase. Investment in Manitoba’s mining, oil and gas extraction industry increased by $703 million in the last five years. Adding and improving hydro infrastructure, including the construction of the Wuskwatim generating station, helped boost capital investment by $709 million in the utilities sector since 2007. The significant increase in population and incomes has strengthened annual investment in housing by $1.1 billion in the last five years.
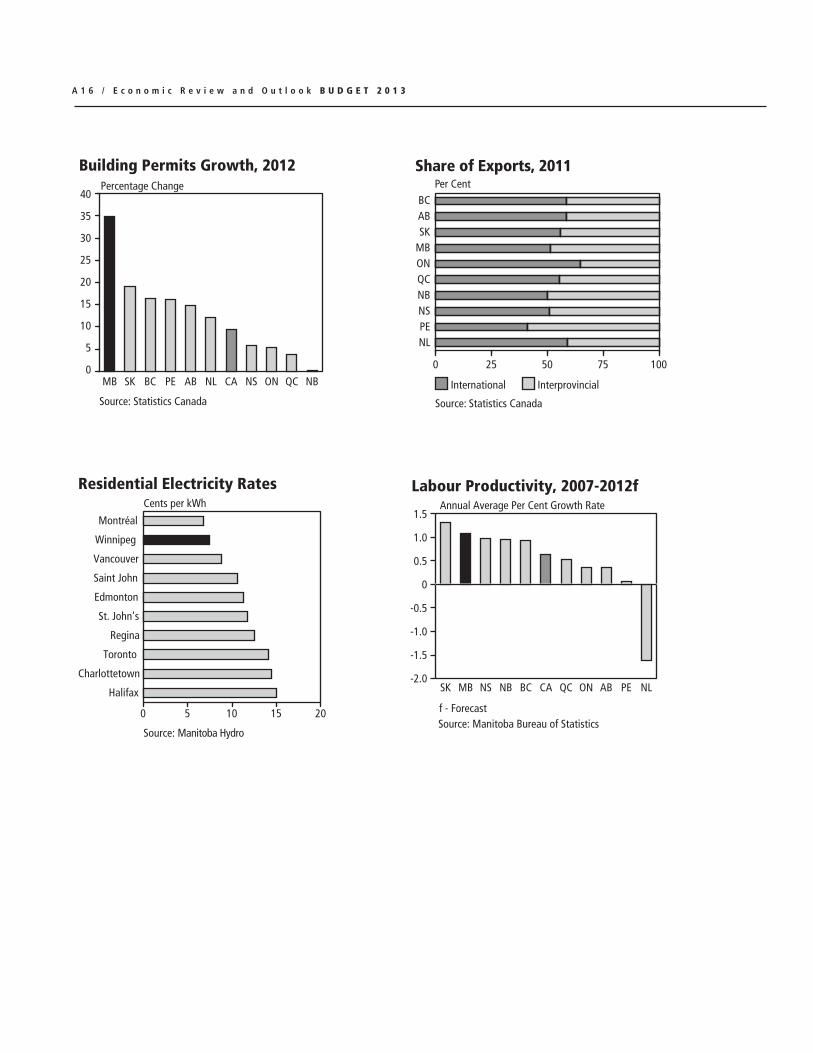
In 2012, the value of building permits issued in Manitoba increased 34.9%, the highest growth among provinces and above the national increase of 9.3%. Manitoba residential permits increased 24.0% and non-residential permits increased 53.8%. Non-residential building permits were supported by industrial permits (126.6%), commercial permits (41.2%) and institutional permits (37.9%). Commercial and industrial investment accounted for 74% of all non-residential building permits in the province in 2012.
Looking forward, Statistics Canada’s Survey of Private and Public Investment Intentions report indicates that Manitoba’s capital spending will increase 8.5% in 2013. This is the second-highest increase among provinces and five times more than the national expected increase of 1.7%. Capital spending is forecast to increase to a record $13.3 billion in 2013, up $1.0 billion and following a $1.1 billion increase in 2012.
Among industrial sectors, waste management and remedial services (120%), utilities (38%), finance and insurance (29%), and manufacturing (20%) are expected to lead capital spending in 2013. The unwinding of several institutional infrastructure projects is expected to decrease public administration capital spending by 11% in 2013. After having been spurred on by the return of the Winnipeg Jets and the construction of the new stadium at the University of Manitoba, investment in arts, entertainment and recreational services is expected to drop by 8% this year after surging 29% and 27% in 2012 and 2011, respectively.
Average Annual Per Cent Growth Rate
Capital Investment, 2007-2012p
p - Preliminary Source: Statistics Canada
File: L_chart 2 - Investment_13.aiCreated: Tues, 26 March 2013Revised: 2/April 2, 2013 Fixed: Paper: Economy
10
15
20
5
0
-5NL SK MB QC CA AB ON BC PE NS NB
91 93 95 97 99 01 03 05 07 09 11 13i
Billions of Dollars
Manitoba Capital Investment
Private Public
Source: Statistics Canadai - Intentions
File: L_chart 1 - MB Capital Investment_13.aiCreated: March 26, 2013Revised: March 26, 2013 Fixed: Paper: Economy
32
10
654
789
10

B U D G E T 2 0 1 3 E c o n o m i c R e v i e w a n d O u t l o o k / A 1 1
Research and InnovationInnovation is a fundamental catalyst in the process of bringing new products, new processes and new services to market. It allows for the creation of new ideas, new economic activity and progressive development opportunities. As international trade expands, and global competition for all products and services accelerates, investing in leading-edge innovation businesses is essential. Innovation enhances productivity, competitiveness, standard of living and quality of life, and wealth.
Manitoba is an ideal environment for investing in innovation. Fostering the right environment requires a combination of well-designed funding supports and tax measures, along with a business culture that encourages collaboration and celebrates success. Provincial government support for innovation and competitiveness is strong. From the Manitoba Research and Development (R&D) Tax Credit to the Commercialization Support for Business program, to reductions in business taxes, Manitoba has created an environment for innovation.
As a result of this environment, R&D spending growth in Manitoba has outpaced Canada in each of the last two years. The product of this spending has been labour productivity growth that has been almost double the annual Canadian average over the last 5 years.
Foreign Merchandise ExportsThe rapid growth of a number of major markets particularly in Asia, has significantly affected the distribution of global economic activity. In this changing environment, Manitoba businesses are broadening their foreign export markets.
The U.S., which accounts for 19% of the global economy, remains Manitoba’s largest international trading market. However, exposure to this market fell from 81% of foreign export share to 67% over the last decade. Over the same period, Manitoba has been gaining market share in exports to the “BRICS” countries (Brazil, Russia, India, China and South Africa), which represent over 26% of the global economy. The share of Manitoba’s exports to these countries increased from 1.3% in 2002 to 10.9% of total sales in 2012. In contrast, Canadian export share to the U.S. declined from 87% to 74%, and increased to BRICS countries from 1.5% to 6.1% over the same period.
Manitoba’s exports to China increased from $80 million in 2002 to $962 million in 2012. China is now Manitoba’s second- largest export market. Exports to Russia have increased from $4 million in 2002 to $153 million in 2012, making it the sixth-largest destination for Manitoba exports.
Due to moderating global economic growth and some domestic factors in 2012, Manitoba’s foreign merchandise exports decreased 4.8%. Non-U.S. exports were down 19.1%. The recovery in the U.S. provided an important lift to U.S. imports of Manitoba goods. Manitoba exports to the U.S. were up 4.5%.
Per Cent
BRICS Share of Manitoba Exports
Source: Statistics Canada
File: I_chart 1 - MB Exports.aiCreated: March 27, 2013Revised: Fixed:
02 03 04 05 06 07 08 09 10 11 12
12
10
0
2
4
6
8
Total R&D Spending in Manitoba,1991 to 2010
Source: Statistics Canada
Millions of Dollars
File: N_chart 1 - Research & Innovation_13.aiCreated: March 26, 2013Revised: Fixed:
0
100
200
300
400
500
600
800
700
9192
93 9598 00 02 04 06
0708
091094 96
97 99 01 03 05

A 1 2 / E c o n o m i c R e v i e w a n d O u t l o o k B U D G E T 2 0 1 3
The increase in exports to the U.S. was the largest contributor to Manitoba’s export growth in 2012, followed by Russia, a large purchaser of agricultural equipment, and Germany, which has increased its imports of pharmaceuticals and, in 2012, started to import copper ore.
The largest contributors to decreases in exports were in Asia, led by South Korea, Japan, Pakistan and Taiwan. Asian markets received fewer exports of wheat (-49%), metal ore (-45%) and refined metals (-14%). Asian destinations comprise the largest region for Manitoba exports outside of the U.S., making up 20% of total exports.
Low yields and small harvests in 2010 and 2011 reduced export sales of Manitoba crops in 2012. In addition, copper ore exports fell in 2012 after receiving a one-time boost in 2011 from a smelter closure plus an inventory reduction. Total export sales excluding these industries grew 3.6% owing to a diversified mix of goods and services.
While declines were concentrated in a few primary industries, several others experienced significant growth. Large gains in export sales were found in frozen foods (+42%), heavy-duty truck manufacturing (+30%), motor vehicle manufacturing (+28%), and agricultural equipment (+14%). Double-digit gains were also experienced in aerospace products and parts, soybeans, animal processing, and vegetable oil manufacturing.
n ECONOMIC OUTLOOKThe Manitoba economy continues to fair well relative to other regions in Canada. Over the last five years (2007-2012) and through the Great Recession, Manitoba’s economy expanded by an average of 2.1% annually, the second-best performance among provinces. However, global economic activity has slowed through 2011 and 2012, and remains fragile due to concerns in the European, U.S. and Asian economies. This has elevated the downside risks to the near-term economic outlook.
Given this risk exposure, the Manitoba economy, being diverse and resilient, is projected to maintain close to average growth. Manitoba is expected to outperform the national growth in 2012 and 2013, and expand below the national average rate in 2014. The current Manitoba Finance survey of forecasters calls for 2.2% growth in 2012 and slowing to 1.9% in 2013. With global demand improving, Manitoba’s real GDP is expected to increase 2.3% in 2014.
Nominal GDP is projected to increase by 3.8% in 2013 and by 4.4% in 2014. With continued modest demand conditions, Manitoba consumer price inflation is expected to average 1.7% in 2013.
Steady employment growth in 2013 and 2014 will result in somewhat stable unemployment rates in Canadian provinces. Manitoba’s unemployment rate is expected to average 5.3% in 2013, while the national unemployment rate decreases to 7.2%.

B U D G E T 2 0 1 3 E c o n o m i c R e v i e w a n d O u t l o o k / A 1 3
Manitoba Outlook at a Glance2012 2013f 2014f
(% Change)
Gross Domestic ProductReal 2.2f 1.9 2.3Nominal 3.6f 3.8 4.4
Employment 0.9 1.2 1.3Unemployment Rate (%) 5.3 5.3 5.1CPI 1.6 1.7 2.0Population 1.2 1.2 1.2
f - ForecastSources: Statistics Canada
Manitoba Finance, survey of economic forecasters
Source: Statistics Canada
File: P_chart 5 MB_GDP by Industry_13.ai
Created: April 3, 2013
Revised:
Fixed:
Manitoba Real GDP Growth by Industry, 2007-2011Average Annual Per Cent Growth Rate
0
Arts, Ent. & Rec.
Mining
Accommodation
Professional Services
Other ServicesInformation & Culture
Administrative
Real Estate
Agriculture
Construction
Education
Finance & Insurance
Wholesale Trade
Transp. & Warehousing
Retail TradeHealth & Social
Management
Public Administration
ManufacturingUtilities
-5 5 10

A 1 4 / E c o n o m i c R e v i e w a n d O u t l o o k B U D G E T 2 0 1 3
MANITOBA ECONOMIC STATISTICS, 2008 TO 20122008 2009 2010 2011 2012
Millions of Dollars
POPULATION July 1 (000’s) 1,206 1,220 1,236 1,252 1,267
GROSS DOMESTIC PRODUCT1
Nominal 51,676 51,554 54,275 56,947 59,405Real ($2002) 42,728 42,516 43,498 44,469 45,447
SECTORSFarm Cash Receipts 4,829 4,848 4,838 4,944 n/a
Crops 2,763 2,805 2,729 2,555 n/a Livestock 1,716 1,657 1,760 1,880 n/a Direct Payments 350 386 349 509 n/a
Manufacturing Shipments 16,373 14,653 14,422 15,316 15,517Mining 2,522 1,971 2,582 3,188 3,026Electric Power Sales 1,737 1,560 1,569 1,592 1,547
Export Sales 634 399 410 354 321Housing Starts (no. of units) 5,537 4,174 5,888 6,083 7,242Retail Trade 14,980 14,915 15,766 16,448 16,670New Car Sales (no. of units) 48,029 43,995 45,355 48,546 52,236
FOREIGN EXPORTSTotal Exports 12,972 10,567 10,238 11,678 11,120
U.S. 8,905 7,138 6,545 7,096 7,412
LABOUR MARKETLabour Force (000’s) 635.0 641.8 654.9 660.2 665.4Employment (000’s) 608.5 608.3 619.8 624.5 630.1Participation Rate (%) 69.3 69.1 69.6 69.3 69.1Unemployment Rate (%) 4.2 5.2 5.4 5.4 5.3Average Weekly Earnings ($) 749.23 770.87 785.92 807.46 829.50
INVESTMENTTotal 10,008 9,694 11,218 11,213 12,306
Private 7,166 6,657 7,635 7,850 8,233Public 2,842 3,037 3,582 3,363 4,073
Non-residential 7,698 7,448 8,567 8,381 9,147Housing 2,310 2,246 2,651 2,832 3,159
CONSUMER PRICE INDEX(Index, 2002 = 100) 113.4 114.1 115.0 118.4 120.3
BANKRUPTCIESBusiness 103 65 68 60 36
Farm 22 17 6 5 7Personal 2,025 2,443 1,994 1,514 1,276
1 2011 are preliminary estimates by Manitoba Bureau of Statistics. 2012 are Conference Board of Canada and Manitoba Finance, survey of economic forecasters.
Sources: Statistics Canada and Manitoba Bureau of Statistics Totals may not add due to rounding.

B U D G E T 2 0 1 3 E c o n o m i c R e v i e w a n d O u t l o o k / A 1 5
2008 2009 2010 2011 2012
Annual Percentage Change
POPULATION 1.0 1.2 1.3 1.3 1.2 July 1 (000’s)
GROSS DOMESTIC PRODUCT1
5.7 -0.2 5.3 4.9 4.3 Nominal4.0 -0.5 2.3 2.2 2.2 Real ($2002)
SECTORS10.7 0.4 -0.2 2.2 n/a Farm Cash Receipts25.7 1.5 -2.7 -6.4 n/a Crops-2.1 -3.5 6.2 6.8 n/a Livestock
-15.1 10.2 -9.6 45.8 n/a Direct Payments1.2 -10.5 -1.6 6.2 1.3 Manufacturing Shipments
-17.9 -21.8 31.0 23.5 -5.1 Mining4.2 -10.2 0.5 1.5 -2.8 Electric Power Sales3.4 -37.0 2.6 -13.6 -9.3 Export Sales
-3.5 -24.6 41.1 3.3 19.1 Housing Starts (no. of units)6.9 -0.4 5.7 4.3 1.4 Retail Trade2.0 -8.4 3.1 7.0 7.6 New Car Sales (no. of units)
FOREIGN EXPORTS6.4 -18.5 -3.1 14.1 -4.8 Total Exports6.7 -19.8 -8.3 8.4 4.5 U.S.
LABOUR MARKET1.4 1.1 2.0 0.8 0.8 Labour Force (000’s)1.7 0.0 1.9 0.8 0.9 Employment (000’s)
- - - - - Participation Rate (%)- - - - - Unemployment Rate (%)
2.8 2.9 2.0 2.7 2.7 Average Weekly Earnings ($)
INVESTMENT12.4 -3.1 15.7 0.0 9.7 Total14.3 -7.1 14.7 2.8 4.9 Private
7.8 6.9 18.0 -6.1 21.1 Public 13.2 -3.2 15.0 -2.2 9.1 Non-residential10.0 -2.8 18.0 6.8 11.5 Housing
CONSUMER PRICE INDEX2.3 0.6 0.8 3.0 1.6 (Index, 2002 = 100)
BANKRUPTCIES1.0 -36.9 4.6 -11.8 -40.0 Business
57.1 -22.7 -64.7 -16.7 40.0 Farm-0.8 20.6 -18.4 -24.1 -15.7 Personal
A 1 6 / E c o n o m i c R e v i e w a n d O u t l o o k B U D G E T 2 0 1 3
Residential Electricity Rates
File: P_chart 3 Electricity Rates_13.aiCreated: April 2, 2013Revised: Fixed:
20151050
Cents per kWh
Toronto
Charlottetown
Halifax
Regina
Vancouver
St. John's
Edmonton
Saint John
Winnipeg
Montréal
Source: Manitoba Hydro
Source: Statistics Canada
Share of Exports, 2011
File: P_chart 2 - ratio_of_exports_13.aiCreated: April 2, 2013Revised: Fixed:
Per Cent
InterprovincialInternational
7525 50 1000
NLPENSNBQCONMBSKABBC
Percentage Change
Building Permits Growth, 2012
Source: Statistics Canada
File: P_chart 4 - Bldg Permits Growth_13.aiCreated: April 2, 2013Revised: Fixed: Paper: Economy
10
15
20
25
30
35
40
5
0NLSKMB QCCAAB ONBC PE NS NB
Annual Average Per Cent Growth Rate
Labour Productivity, 2007-2012f
Source: Manitoba Bureau of Statisticsf - Forecast
File: P_chart 6 Labour Productivity_13.aiCreated: April 3, 2013Revised: Fixed: Paper: Economy
-0.5
0
MB BC AB PEQCCASK NLNS NB ON
0.5
1.5
1.0
-1.0
-1.5
-2.0
B U D G E T 2 0 1 3 E c o n o m i c R e v i e w a n d O u t l o o k / A 1 7
n Appendix 1: MANITOBA’S NORTH
In 2012, a special celebration hosted by Premier Greg Selinger focused on 100 years of success since northern Manitoba officially joined the province in 1912. The vision and determination of Aboriginal people, pioneers and the strength of communities have created a strong and diverse region, rich in natural resources, including clean, hydro-electric power.
New economic opportunities are opening up in northern Manitoba and across the Arctic and sub-Arctic regions, pointing to a new era of investment, development and wealth creation.
The Manitoba government introduced the Northern Development Strategy in 2000 to build on the strengths of the north and invest in the future. A new strategy, Opportunities North, will continue the important focus on the north for the benefit of the province and northern residents.
In 2000, the Northern Development Strategy focused on five key areas: housing, health, transportation, employment and training, and economic development. The resulting investments have provided tangible benefits for the north and its citizens including:
• establishing the University College of the North with facilities in 14 communities to offer training closer to home;
• establishing dialysis treatment centres in Garden Hill, Norway House and Berens River;
• investing in the Port of Churchill and pursuing trade opportunities with Nunavut;
• devoting an increased share of the provincial highways budget to northern roads;
• developing an all-season road network to connect isolated communities east of Lake Winnipeg;
• investing in the First Peoples Economic Growth Fund, the Metis Economic Development Fund and expanding the Communities Economic Development Fund to support Aboriginal and northern entrepreneurs and job creation;
• launching the Northern Healthy Foods Initiative which has produced 800 gardens, 60 greenhouses, poultry and livestock operations, and a community freezer program to promote harvesting and preserving traditional foods in the north; and
• supporting the establishment of the Northern Manitoba Mining Academy in Flin Flon.
The Northern Development Strategy highlighted the value of partnerships between Aboriginal communities, the Manitoba government and private enterprise. The government’s new Opportunities North strategy will continue to build on strong partnerships, ongoing consultations and efforts to ensure future development is sustainable and beneficial to northern residents. The continued development of clean hydro-electric power, the partnerships being developed on the east side of Lake Winnipeg and a thriving mining industry are key areas that will help drive future economic successes that benefit northern communities.

A 1 8 / E c o n o m i c R e v i e w a n d O u t l o o k B U D G E T 2 0 1 3
Hydro
In July, the Wuskwatim generating station on the Burntwood River officially opened. The 200 megawatt generating station was built through a unique equity partnership between Manitoba Hydro and Nisichawayasihk Cree First Nation community, which included training, employment and economic development for First Nations communities and northern residents.
Since 2000, Manitoba Hydro has increased the number of Aboriginal employees and now 42 per cent of its northern employees are Aboriginal. Between 2008 and 2012, Manitoba Hydro entered into contracts worth over $200 million with Aboriginal and northern companies.
Planning is continuing to develop the proposed 695 megawatt Keeyask station and the 1,485 megawatt Conawapa dam. Over the next five years, Manitoba Hydro is expected to invest $18 billion or more in capital spending, and recruit between 2,500 and 3,000 new employees. Contracts with local businesses, jobs, training and equity partnership will directly benefit individual northerners and support a thriving economy.
East Side Road Initiative
In March 2013, a fourth bridge was officially opened on the east side of Lake Winnipeg over the Red Sucker River. The bridge will be part of the permanent road system currently under construction, and extend the length of time local residents and commercial truck drivers can use the winter road network.
The development of the east side road system will link isolated communities and provide training in construction, skilled labour and heavy equipment operations for local communities.
Skills training and local investment were part of the $5 million Red Sucker River bridge project, which was undertaken under a community benef its agreement employing approximately 28 local residents. Community benefit agreements worth a total of $64 million are in place with 13 east side First Nations to ensure local residents benefit from job training and economic opportunities related to the construction of the all-weather road networks.
Additional new bridges were recently opened to coincide with this year’s winter road season at Loon and Longbody Creeks on the all-season road between PR 304 and Bloodvein First Nation. Bloodvein First Nation will be the first remote community connected to the permanent road network since 1979 when construction of this section of the all-weather road is completed in 2014. Last year, the Wanipigow River bridge was opened to coincide with the start of the 2012 winter road season.

B U D G E T 2 0 1 3 E c o n o m i c R e v i e w a n d O u t l o o k / A 1 9
Mining
Mining and petroleum is the largest primary resource industry in Manitoba’s economy, with 2012 production value exceeding $3.0 billion and estimated capital expenditures of $1.3 billion. The sector provides jobs for approximately 5,700 Manitobans, plus additional jobs generated through the service sector and spinoff businesses.
Manitoba is committed to supporting a strong mining sector through competitive mining tax rates and tax credits, as well as the Mineral Exploration Assistance Program and Manitoba Geoscience Advantage Program. Renewed efforts will be undertaken this year to reach out to local and First Nations communities to increase participation in this industry. These efforts may include initiatives such as joint venture partnerships, resource revenue benefit sharing, or job and training opportunities.
Other activities that will help drive northern development include completing the work of the Churchill Task Force, in partnership with the federal government. With the opening of Arctic shipping routes and the expansion of mining, tourism and research activities in the north, the Port of Churchill is poised to become a major hub in the next phase of northern development. Links to Nunavut and the northern territories are an immediate priority. The 2010 memorandum of understanding signed with Nunavut set out a framework to promote development and strengthen shipping and transportation links. Discussions are also underway with the federal government to develop a winter road to connect Manitoba and Nunavut.
Opportunities North
Opportunities North has a strong base on which to grow future success in the north. It will address the unique challenges and emerging issues of the north, and ensure northern communities and stakeholders have a direct role in shaping the strategic direction of the plan. The following principles will guide the new strategy:
• ensure economic development in the north benefits northerners
• reflect northern community values
• promote economic diversity and environmental sustainability
• reduce economic disparity
• respect Aboriginal rights and further reconciliation
• provide clarity in how development will proceed in the north.
The region’s young population, natural resources and strong communities will be integral to a strong and dynamic northern region that provides a high standard of living for northern residents, attracts business investment, and brings in new residents and tourists. Opportunities North and its future partnerships will play an important role in new and ongoing development efforts.

A 2 0 / E c o n o m i c R e v i e w a n d O u t l o o k B U D G E T 2 0 1 3
n Appendix 2: GROWING RURAL MANITOBA – INVESTING IN SUSTAINABLE GROWTH OPPORTUNITIES
Unprecedented flooding along the Assiniboine, Souris and Qu’Appelle Rivers affected local communities and farmland, and washed out hundreds of municipal and provincial roads and bridges. The estimated $1 billion flood in 2011 demonstrated the resilience and strength of local communities to work together to meet the challenges of rising flood waters.
Much of southwest Manitoba continues to rebuild and develop new flood protection systems following the f lood of 2011. The recovery is well underway with the support of the Manitoba government working with local municipalities and residents. By the end of 2012, the Manitoba government had provided $697 million for financial assistance and $344 million for flood fighting, restoration and flood proofing, including the construction of the Lake St. Martin outlet channel.
Rural Manitoba will continue to grow and make important economic and cultural contributions to the well-being of the province with the support of the Manitoba government. Programs such as the federal-provincial Growing Forward 2 initiative and Growing Green focus on the strengths of Manitoba’s rural regions.
Rural Manitoba had some of the fastest growing municipalities in Canada between 2006 and 2011.
• La Broquerie grew 42 per cent.
• Steinbach increased its population by 22 per cent.
• Winkler grew 17 per cent.
The overall rural population increased 8.4 per cent since 2001 – more than the nearly 8.0 per cent growth across the whole province. Population growth comes from immigration, people moving from other provinces and a growing Aboriginal population. At the same time, between 2006 and 2011, many smaller municipalities showed a decline in population, mainly due to aging populations and people moving to urban areas.
Rural Economic Drivers
Investments in infrastructure, the green economy and value added industries have helped drive tangible successes such as:
• upgrading highways and infrastructure across Manitoba under the 10-year $4 billion highway plan, now in its seventh year;
• supporting positive immigration numbers in Winkler, Steinbach, Arborg and throughout rural Manitoba;
• investing in regional composting in southeastern Manitoba;
• encouraging hemp industry development in Dauphin and Gilbert Plains;
• supporting biomass processing in Carman;
Persons
Population – Rural Manitoba
Source: Statistics Canada
File: Rural_13.aiCreated: April 6, 2013Revised: Fixed:
0
420,000
440,000
460,000
480,000
500,000
86 91 96 01 06 11

B U D G E T 2 0 1 3 E c o n o m i c R e v i e w a n d O u t l o o k / A 2 1
• investing in 100 water treatment projects worth $250 million since 1999; and
• partnering with the food processing industry to create Buy Manitoba, which is a program to help consumers identify and buy Manitoba products.
Rural economies are mostly driven by agriculture, mineral development, manufacturing and services that support farms, local businesses and communities. These traditional sectors continue to present more new opportunities. For example, renewable bioproducts such as biomass for heating, biofibre for a number of industrial uses and bio-energy to replace fossil fuels and a wide spectrum of functional foods, nutraceuticals and advanced health products build on the traditional rural economy. China and India are providing more opportunities for food, agriculture products, animal genetics, machinery, specialized expertise and services. Development and commercialization of innovative products, paired with market opportunities at home and abroad, will help expand and diversify the rural economy.
Oil and gas extraction, including support services in southwestern Manitoba, has seen 100 per cent growth since 2000, with 4,440 wells producing in 2012. The mining, oil and gas industry directly employed over 5,700 workers in 2012 and spent $1.3 billion in capital expenditures. The sector is expected to continue to expand rapidly.
The government is helping municipalities amalgamate with neighbouring communities to create efficiencies and attract more funding for much needed infrastructure. Combining local expertise and experience will help communities make the transition to more affordable local government operations.
Investing in the Future
The Manitoba government is committed to providing programs and services that help communities seize their own unique opportunities, become more self sufficient and meet the challenges they face. The following are specific areas of focus.
• Green economic opportunities: Growing Green, The Manitoba Bioproducts Strategy, supports manufacturing development in the green economy and is projected to more than double bioproduct manufacturing to $2 billion by 2020.
• Innovation and commercialization: the government will continue supporting a strong rural economy by increasing its investments in strategic initiatives through the federal-provincial Growing Forward 2 policy framework to further enhance innovation and the long-term competitiveness and resiliency of Manitoba’s agriculture and food industry.
• Infrastructure: the commitment to provide the equivalent of one-seventh of the provincial sales tax to support investments in municipal infrastructure complements the government’s $4 billion highway plan and gives municipalities the ability to meet local needs.
• Stronger municipalities and communities: Partners 4 Growth will support regional economic development planning and action in rural Manitoba, and investments will continue to help communities share information and support growth.
The Foundation for Rural Growth
•building on Manitoba’s natural assets•skilled labour•infrastructure•strong municipalities and communities•regional and government partnerships•sharing knowledge and best practices by
communities•quality of life

A 2 2 / E c o n o m i c R e v i e w a n d O u t l o o k B U D G E T 2 0 1 3
• Skilled labour: streamlining the Manitoba Provincial Nominee Program for skilled workers will increase the attraction of new immigrants; the Rural and Northern Apprenticeship Strategy will provide rural Manitobans with practical training options to build successful careers close to home; the new Journeyperson’s Business Support Program will provide financing to help rural journeypersons set up their own businesses; and ten additional trade training courses will be delivered online.
• Strengthening services: new CancerCare treatment centres are being established, and there are more doctors and nurses serving rural Manitobans. The government provided $1.7 million to redevelop Assiniboine Community College’s Parkland Campus in Dauphin in 2010; and $400,000 to build Red River College’s mobile training labs to reach more rural and northern communities.
The Manitoba government will continue to work with local communities to build on strengths and share expertise among regions. Developing new economic opportunities through value-added enterprises and green economic opportunities, opening up new markets and renewing infrastructure will be important hallmarks of future investments.