economic research forum gender diversity, productivity...
TRANSCRIPT

1
Economic Research Forum
Gender Diversity, Productivity, and Wages in Egyptian Firms
Rami Galal1 American University in Cairo (AUC)
Mona Said American University in Cairo (AUC)
Susan Joekes London School of Economics and Political Science (LSE)
Mina Sami Misr International University (MIU)
October 2017 Work in Progress
1 The authors acknowledge the financial support provided by the Economic Research Forum as well as invaluable comments from Ragui Assaad, Caroline Krafft, and the participants of the 2017 ERF Workshop. All errors remain with the authors.
2
1. Introduction
Typically, women are not employed evenly across firms and sectors. This observation owes to
many causes ranging from demand side factors such as outright discrimination and low job
growth in female-dominated sectors, to supply side factors like gendered educational
attainment and social norms. The consequences are that employment and wage patterns are
gender segregated. Unlike most of the existing literature on Egypt, this paper does not
concentrate on supply side factors only in studying this phenomenon. Instead, it utilizes firm
level-data to focus on potential factors influencing firm demand for female labor by exploring
the link between gender diversity and firms’ productivity and wages across sectors. This is
carried out in the context of newly available establishment data for the Egyptian labor market.
In recent years, examination of the negative economic consequences of gender inequalities
has emerged from unexpected quarters, such as McKinsey (McKinsey Global Institute 2016)
and the IMF (e.g. Cuberes 2014, Elborgh-Woytek et al 2013, IMF 2016). These organisations
are now promoting the idea that countries with low female (and hence total) labour force
participation – more exactly, employment - rates experience reduced diversification and output
and forego significant demand and growth effects and advocating policy makers to act to
increase employment among women. MENA and South Asian countries have the lowest
female participation and employment rates in the world. They would therefore seem to have
the most to gain from raising women’s participation in the labour force.
Increasing female labour force is not, however, a matter amenable to simple policy
intervention. The only available direct measure is to provide more jobs in the public sector.
Any such move is fiscally constrained. In Egypt, where the public sector is indeed the main
provider of jobs for women, it has also to some extent counterproductive by negatively
affecting the nature of women’s insertion in the labour market (Assaad, various).
Employers are the agents of job creation, whether in state owned enterprises or the private
sector. From employers’ perspective, encouragement to increase women’s share in the
workforce faces several objections and disincentives. The first is that employment law may
and in Egypt does require costly, special treatment for women workers, notably paid maternity
leave (IFC 2016). Second, women workers tend to present with other kinds of costs, not legally
prescribed, but to do with their social role as wives and mothers. Women may demand more
time off, be less willing to work overtime, and insist on socially protective conditions within
the workplace to reassure themselves and their families that they are not exposed to sexual

3
harassment. Even if these facilities are provided, and women are paid less than men to offset
employers’ costs in this regard (different wage payments being allowed by statute in Egypt
(IFC 2016)), women lack commitment to employment and exhibit higher absenteeism and
turnover rates than men (Hakim 1995). Third, greater gender equality in employment could be
at the cost of production efficiency. Employers may believe that they are justified in not
recruiting women in greater numbers because they are less productive workers than men, either
because they are less dedicated to their work as a consequence of their social obligations or
because they are less experienced and/or skilled and therefore less effective at their tasks. This
paper examines the last of these hypotheses, i.e. the relative productivity and wages of
enterprises in the private sector with respect to the gender diversity of their workforce for the
case of Egypt. This of course, is done bearing in mind that it is very difficult to make claims
of causality on this relationship, because women, as a result of discrimination, may face entry
barriers to high-tech / high-wage firms, and hence, they may have no choice but to crowd in
the labor intensive / lower-productivity jobs that are made available to them.
With this caveat in mind, the contribution of this paper is twofold. Firstly, we empirically
measure the relationship between gender diversity, wages, and productivity using a novel firm-
level dataset for Egypt. The data enables us to explore the relationship across sectors focusing
on differential impacts of gender diversity in knowledge-intensive and less knowledge-
intensive services, and high- and low-technology manufacturing. Secondly, the paper
complements the prior work on women’s labor force preferences for public sector employment,
by looking at characteristics of firms that provide greater or lesser access to women’s
employment in the private sector.
Our findings indicate that greater shares of women’s employment and greater gender
diversity have a positive association with productivity and wages in the knowledge-intensive
services sector, but a negative relationship in the less knowledge-intensive services and
manufacturing sectors.
The rest of the paper is organized as follows. Section 2 presents a review of select relevant
literature. Section 3 describes the data and methodology employed in our analysis. Section 4
presents the empirical findings. Section 5 discusses limitations and concludes.
4
2. Literature Review
Theory suggests that diversity can influence firm productivity both positively or negatively.
Greater diversity of the workforce can on lead to improved productivity when employees hold
complementary skills facilitating knowledge spillover effects (Lazear, 1999). Ethnic diversity
can also improve decision-making and problem-solving (Hong and Page, 2001) and knowledge
heterogeneity is an important part of the knowledge production process (Berliant and Fujita,
2008). However, greater diversity may hurt productivity due to co-worker discrimination
(Becker, 1957) or from workers’ preferences for ethnic homogeneity (Lazear, 1999), greater
distrust among heterogeneous workers (Alesina and La Ferrara, 2002). If labor diversity has
an impact on firm productivity, and if productivity is related to wages, then diversity may also
influence wages.
Taking these theories to the test also produces competing results as well as differential
impacts across sectors. Garnero et al., (2013) find educational diversity raises productivity and
wages, age diversity does the opposite, and the effect of gender diversity is positive in high-
technology and knowledge intensive sectors, but negative in more traditional sectors. Parrotta
et al., (2014) find that diversity in ethnicity has a negative impact on productivity, while
demographic diversity has no impact. The impact of skill diversity depends on the industry.
Barrington and Troske (2001) find diversity has a positive impact on productivity. Iranzo et al.,
(2006) find a positive effect on productivity of skill dispersion within occupational groups.
Skill diversity also has a positive effect on productivity in the manufacturing sector through
human capital spillovers (Navon, 2009). Grund and Westergaard-Nielsen (2005) find an
inverse u-shaped relationship between age diversity and productivity, with some differences
across sectors and firm sizes. Few studies have included gender diversity in their analysis.
The literature on diversity broadly suggests different causal mechanisms between
workforce diversity and productivity. Resource-based theory (Barney, 1991) states that there
is a positive link between workforce diversity and firm productivity as psychological
differences, experiences, and backgrounds can equip an organization with a diverse set of skills,
knowledge, and perspectives. This could lead to better market insight, higher creativity, and
innovation, which can lead to a higher rate of productivity. Social identity theory suggests that
it is common for genders to have a tendency to group together, resulting in a male groups and
female groups (Tajfel, 1982). Each gender group has a tendency to view themselves as superior
(Tajfel and Turner, 1979). This phenomenon can result in decreased communication (Kravitz
2003), stereotype-based role expectations (Elsass and Graves 1997), a lack of cohesion

5
(Triandis, Kurowski and Gelfand 1997) and cooperation (Chatman and Flynn 2001), and
increased conflict (Pelled 1996). These could in turn lead to lower firm productivity.
Empirical work on the link between female participation and gender diversity on firm
outcomes has shown mixed results. Some have found that female-owned firms tend to have
worse performance than male owned firms (Bardasi et al, 2011), possibly due to the fact that
females face more constraints than males in securing credit, gender bias affects females
adversely in legal treatment, and females are more affected by crime and corruption than their
male counterparts. Others, though, have found that female-owned firms in Africa are at least
as productive as their male counterparts (Bardasi et al 2007). Baliamoune & Lutz (2017)
expand on this research by analyzing whether having female-owners and female managers has
an effect on firms’ productivity, specifically in the MENA region. Their work finds that firms
that are managed by females, but do not have female owners have higher productivity.
Conversely, firms who have female-owners and female managers have lower productivity.
The type of industry has an effect on the strength of the relationship between gender
diversity and performance. Based on the empirical research, it was found that the gender-
diversity provides a competitive advantage for the service industry, as there is an
interrelationship between the employee and the customer. Diversity in the workforce provides
insights into the needs of male and female customers (Richard 2002). On the other hand, the
manufacturing industry’s workforce has relatively low job interdependence (Dean and Snell
1991) and limited interaction (Frink et al. 2003). This limits the interactions between gender
groups, which can cause the negative effects of the social identity theory to occur (Baliamoune
and Lutz, 2017).
Also, complex industries that rely on innovation find workplace diversity to be an asset. A
firm’s likelihood to innovate increases when workers have various skills, information sets, and
backgrounds. If the workforce is diverse, the firm increases its potential ideas and solutions to
any given challenge. Garnero et al. (2013) finds that productivity rises by on average 2.5%-6%
following one standard deviation increase in gender diversity in high-knowledge, high-tech
fields. In the manufacturing industry, however, gender-diversity hurts firm productivity. Prat
(2002) and Jehn et al. (1999) highlighted that industries such as manufacturing that require
routine and rudimentary tasks find workplace diversity a net-loss. Workforce homogeneity is
favorable when workers must coordinate a series of actions with various units. In this situation,
homogeneity can increase communication, expectations, and therefore also increase
productivity.

6
3. Methodology and Data The empirical approach is based on the separate estimation of a value added function and
a wage equation at the firm level. We use a linear econometric model with fixed effects that
takes into account the heterogeneity across firms, sectors and governorates within Egypt
(Garnero 2014, Melitz, 2003). The equations provide parameter estimates for the impact of
labour diversity (with respect to education, age, and gender) on average productivity and wages,
respectively. Both equations are estimated using the same sample with identical control
variables. Because of this, the parameters for marginal products and wages can be compared.
From this comparison, we can draw conclusions regarding how the benefits or losses of
diversity are shared between employees and firms. As noted by Garnero et al. (2014), this
technique was originally used by Hellerstein and Neumark (1995), Hellerstein and Neumark
(2004) and van Ours and Stoeldraijer (2011). We use their same initial model where the
estimated firm-level productivity and wage equations are the following:
Log (Value added/hours)j � D��E1Gσ
j �OXj�Hj (1)
Log (Total wages/hours)j� D*���E1*Gσ
j �O*Xj��Hj* (2)
The dependent variables in the estimated equations are firms’ value added per worker (1)
and average wages on an hourly basis (2). The dependent variable in equation (1) is firm j's
value added per worker. This was calculated by dividing the total added value of firm j by the
total number of workers. The dependent variable in equation (2) is firm j's average hourly gross
wage. Labor diversity indicators with respect to gender (Gσ) are the main variables of interest.
As a segregation index of gender diversity, three main measures have been implemented in the
regressions: average dissimilarity index, Herfindahl index and the share of females.
At a first stage, the share of females per firm has been included in the regressions.

7
Then, Following Rhoades (1993) normalized Herfindahl index2 has carried out in our empirical
estimations on the firm level3. The index is implemented as follows:
𝐻𝑒𝑟𝑓𝑖𝑛𝑑𝑎ℎ𝑙 = 1 − ∑ 𝑝𝑖2
𝑠
𝑖=1
𝑝𝑖2 is the quadratic form of the share of each group. As we deal with only two groups (males
and females), in our regressions we multiplied the index by two in order to simplify the
interpretation of our coefficients. When the index is zero, one group dominates the firm. Finally,
the average dissimilarity index has been implemented. It represents the shares of males and
females, has been constructed on the firm level as follows:
𝐴𝑣𝑒𝑟𝑎𝑔𝑒 𝐷𝑖𝑠𝑠𝑖𝑚𝑖𝑙𝑎𝑟𝑖𝑡𝑦 = 𝑆𝑓𝑗 × 𝑆𝑚𝑗
𝑆𝑓𝑗 𝑎𝑛𝑑 𝑆𝑚𝑗 represent the share of females and males respectively within the firm j. The index
ranges from zero (perfect dissimilarity of distribution between the two groups) to 0.25 (greatest
similarity of distribution between the two groups). For simplification, especially in the
interpretation of the empirical results, the index has been multiplied by four to range from 0
(dominance of one group) to 100 (no dominant group).
The dataset used is the Economic Census (EC) 2013. It is a 50% subsample of all
establishments in Egypt. The data has been collected in 2013 by the Central Agency for Public
Mobilization and Statistics (CAPMAS) and has been provided by the Economic Research
Forum (ERF). The database provides substantial information on the firm level including
economic. These include detailed information on the activity of the firm, location, age, number
of employees by gender, and levels of labor and capital. Public sector establishments are not
included in our analysis.
To assess the differential effects of gender diversity by sector we followed the classification
of industries proposed by Eurostat that distinguishes the two-digit sector into two main sectors:
Manufacturing and Services. Furthermore, each sector (Manufacturing, Services) has been
dissected into two main sub-sectors according to technological intensity for the manufacturing
sector and the knowledge intensity in the service sector. Regarding the manufacturing sector,
two main industries can be distinguished according to the technological intensity: High,
2 The normalized Herfindahl index is bounded between zero (diversity) and one (dominance of one group). In our regressions, we subtracted the index by one in order to have comparable results with the average dissimilarity index. 3 This index can be used to measure diversity within firms. For more information, see Schneider and Eckl
(2016) as well as Upadhyay and Zeng (2014).

8
Medium High technology (HT-MHT) and Low, Medium low technology (LT-MLT).
Regarding the services sector, two sub-industries can be carried out according to the knowledge
intensity: High Knowledge intensive Services (KIS) and Low Knowledge intensive Services
(LKIS). Details of the aggregation are available in Appendix 1.
In order to incorporate employee characteristics within each sector, we merged the
establishment survey with the “Egyptian Labor Market Survey 2012 (ELMPS). The ELMPS
is a panel data survey compiled by Economic Research Forum (ERF) in cooperation with
Central Agency for Public Mobilization and Statistics (CAPMAS). It covers substantial
information on individuals covering employment and occupational characteristics, education,
demographic information, and social background characteristics.
4. Empirical Findings In this section we first present some descriptive analysis on the relationship between gender
diversity, wages, and productivity, followed up by our regression results.
4.1 Descriptive Analysis
In Egypt, measures of diversity necessarily reflect the female share because women’s
presence in the private sector workforce is so low. The total share is 16 percent, and by industry,
19 percent of the workforce in services and 13 percent in manufacturing. By 2 digit sector,
women constitute more than 40 percent in only four services industries (social work, human
health, residential care and education). In several other, larger service activities women are
almost entirely absent from the workforce. In manufacturing, women constitute more than 40
percent of the workforce in only one industry (wearing apparel) and more than 20 percent in
only two (computer, electronic and optical products and pharmaceuticals products and
preparations), with negligible shares in many other activities. The only 2 digit female-
dominated (female workforce majority) industries in Egypt are education and residential care.
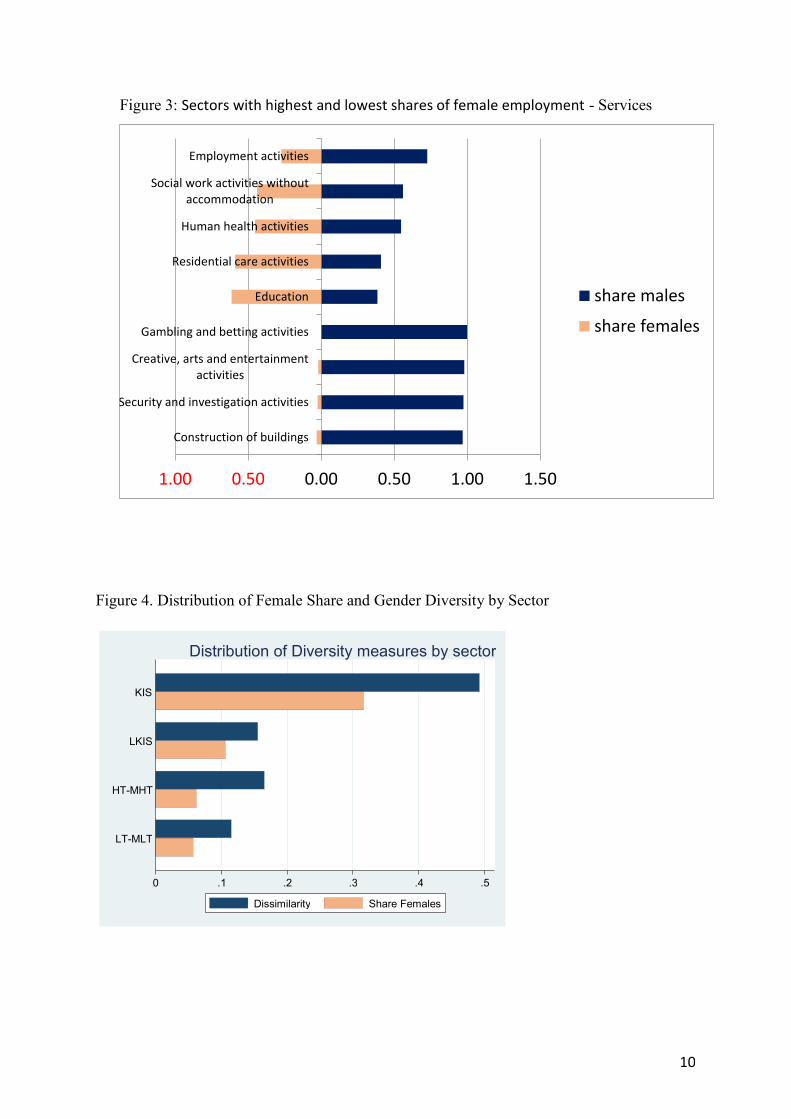
Women’s employment in Egypt is segregated by occupational sector. The share of females
in KIS is over 30%, compared to approximately 10% in LKIS, and only 6% and 5% in HT-
MHT and LT-MLT respectively (Figure 4). The gender composition of firms across these
sectors is also not even. Firms operating in KIS employ men and women together more so than
other sectors, followed by HT-MHT, LKIS, and LT-MLT.

9
The distribution of female shares and gender diversity are also systematically different by
firm size. Meanwhile, women’s employment is greatest among medium-sized firms.
Figure 1: Distribution by gender within firms in Egypt
Figure 2: Sectors with highest and lowest shares of female employment - Manufacturing
0
0.1
0.2
0.3
0.4
0.5
0.6
0.7
0.8
0.9
1
Manufacturing Services
Females
Males
0.60 0.40 0.20 0.00 0.20 0.40 0.60 0.80 1.00 1.20
Manufacture of other non-metallic mineral…
Manufacture of other transport equipment
Manufacture of furniture
Manufacture of wood and of products of wood…
Manufacture of basic metals
Manufacture of wearing apparel
Manufacture of computer, electronic and optical…
Manufacture of basic pharmaceutical products…
Manufacture of rubber and plastics products
males share
females share
10
Figure 3: Sectors with highest and lowest shares of female employment - Services
Figure 4. Distribution of Female Share and Gender Diversity by Sector
1.00 0.50 0.00 0.50 1.00 1.50
Construction of buildings
Security and investigation activities
Creative, arts and entertainmentactivities
Gambling and betting activities
Education
Residential care activities
Human health activities
Social work activities withoutaccommodation
Employment activities
share males
share females
0 .1 .2 .3 .4 .5
LT-MLT
HT-MHT
LKIS
KIS
Distribution of Diversity measures by sector
Dissimilarity Share Females

11
Figure 5. Distribution of Female Share and Gender Diversity by Firm Size
Note: Firm size is defined by number of workers such that huge >=1000), large 250-999,
medium 50-249, small 10-49, and micro 0-9.
Combining the elements of firm size and sector classification provides a helpful visual
representation of where women are engaging in the labor force. In Figures 6-7 vertical axes
display the female share by firm and the horizontal axes display value added per worker and
wages. The size of the markers denotes the firm size (5 categories) and the color denotes the
industry classification (4 categories). There is a close association between firm size and both
value added as well as wages. In Figure 6, the largest KIS and larger HT-MHT sectors have
greater value added than the LKIS and LT-MLT. However, while the KIS as a whole has the
largest share of female employees, female shares are highest among the smaller and lower
value added firms within the industry. A similar pattern is apparent in the case of wages. The
largest firms pay the highest wages with KIS paying the highest wages, followed by HT-MHT,
LT-MLT and LKIS. The graphs reveal that women’s employment is concentrated foremost in
firms in the KIS sector, but in particular, among the small to medium sized firms within this
sector.
0 .1 .2 .3 .4 .5
micro
Huge
small
large
meduim
Distribution of Diversity measures by sector
Dissimilarity Share Females

12
Figure 6. Female Share and Value Added per Worker
Figure 7. Female Share and Wages per Worker
4.2 A- Productivity and Wage Models
Table 1 presents means of the variables used in the regression analysis. The rest of the summary
statistics are reported in Appendix 2. The majority of the sample is in the services industry,
with 55.6 percent in the LKIS and 22.5 percent in the KIS. Most of the manufacturing firms
are LT-MLT comprising 20.5 percent of the total, with only 1.4 percent of firms in HT-MHT.

13
This small percentage of high-tech manufacturing firms has the highest value added and wages
per worker. These are followed by the LT-MLT and KIS, and the LKIS come at the bottom.
As expected, there is a low concentration of women and low diversity in the manufacturing
firms. The highest presence of women as well as diversity is in the KIS.
Table 1. Means of Dependent Variables and Diversity Measures
Mean KIS LKIS MT-MHT LT-MLT Value add per worker 46186.81 95493.47 76356.51 35275.40 Wage per worker 6.12 5.52 12.2 6.85 Herfindahl4 0.24 0.07 0.08 0.05 Share Females 0.32 0.11 0.06 0.06 Average dissimilarity 0.49 0.15 0.17 0.11
Observations Total 13560 33502 841 12355
Regression results for value added per worker and wages across the four sector categories are
displayed in Tables 2-5. The tables display the coefficients for capital, labor, education, and
age, followed by our indicators on the female labor share and gender diversity. Fixed effects
are included for firm size and firm geographic location. The tables are organized by sector and
in each case the first four columns display results for value added per worker and the latter four
columns wages per worker.
Taken as a whole, the regression results paint a consistent and expected picture that a larger
female share and greater labor force diversity is positively associated with productivity and
wages in some sectors, but negatively in others. Results are largely across different
specifications and gender diversity measures. In the case of KIS, there is a positive association
between the share of women and greater gender diversity, and value added per worker and
wages. This relationship becomes negative for both value added and wages in LKIS and LT-
MLT sectors. The effect is essentially insignificant for HT-MHT.
4 These are summary stats of the normalised Herfindahl index.

14
Table 2. Knowledge-Intensive Services Value Added and Wages per Worker (1) (2) (3) (6) (7) (8) VA per
worker VA per worker
VA per worker
wage per worker
wage per worker
wage per worker
VARIABLES KIS KIS KIS KIS KIS KIS lcap 0.224*** 0.219*** 0.293*** 0.102*** 0.0952*** 0.113*** (0.0174) (0.0170) (0.00747) (0.00986) (0.00958) (0.00391) llabor -0.393*** -0.422*** -0.431*** 0.801*** 0.778*** 0.585*** (0.0542) (0.0537) (0.0230) (0.0328) (0.0318) (0.0134) educ_person 0.363*** 0.347*** 0.588*** 0.204*** 0.180*** 0.262*** (0.0392) (0.0385) (0.0194) (0.0260) (0.0248) (0.0111) age_person -0.0730*** -0.0714*** -0.0502*** -0.0480*** -0.0456*** -0.0386*** (0.0137) (0.0141) (0.00531) (0.00891) (0.00916) (0.00328) share_females 0.153** 0.257*** (0.0694) (0.0424) Herfindahl 0.232*** 0.279*** (0.0537) (0.0317) av4_diss 0.180*** 0.209*** (0.0249) (0.0143) Constant 9.613*** 9.743*** 6.704*** -1.712*** -1.570*** -1.625*** (0.652) (0.656) (0.284) (0.415) (0.411) (0.162) Observations 13,118 13,118 13,118 13,357 13,357 13,357 R-squared 0.243 0.248 0.371 0.530 0.538 0.479 Firm Size FE YES YES YES YES YES YES Governorate FE YES YES YES YES YES YES
Robust standard errors in parentheses
*** p<0.01, ** p<0.05, * p<0.1

15
Table 3. Less Knowledge-Intensive Services Value Added and Wages per Worker (1) (2) (3) (4) (5) (6) VA per
worker VA per worker
VA per worker
wage per worker
wage per worker
wage per worker
VARIABLES LKIS LKIS LKIS LKIS LKIS LKIS lcap 0.114*** 0.117*** 0.166*** 0.0176*** 0.0185*** 0.0319*** (0.0138) (0.0139) (0.00432) (0.00576) (0.00578) (0.00240) llabor 0.0314 0.119*** 0.107*** 1.082*** 1.158*** 1.078*** (0.0424) (0.0451) (0.0118) (0.0137) (0.0144) (0.00656) educ_person 0.344*** 0.341*** 0.374*** 0.0562* 0.0488 0.100*** (0.0640) (0.0629) (0.0199) (0.0339) (0.0337) (0.0108) age_person -0.0397*** -0.0349*** -0.00805** -0.0428*** -0.0345*** -0.0243*** (0.0109) (0.0111) (0.00359) (0.00532) (0.00535) (0.00215) share_females -0.641*** -0.317*** (0.0488) (0.0247) Herfindahl -0.541*** -0.419*** (0.0440) (0.0235) av4_diss -0.354*** -0.253*** (0.0193) (0.0123) Constant 9.720*** 9.266*** 6.892*** -0.681*** -1.159*** -1.796*** (0.564) (0.578) (0.156) (0.237) (0.241) (0.0911) Observations 32,750 32,750 32,750 33,370 33,370 33,370 R-squared 0.161 0.163 0.244 0.571 0.586 0.659 Firm Size FE YES YES YES YES YES YES Governorate FE YES YES YES YES YES YES
Robust standard errors in parentheses
*** p<0.01, ** p<0.05, * p<0.1

16
Table 4. High Technology Manufacturing Value Added and Wages per Worker
(1) (2) (3) (4) (5) (6) VA per
worker VA per worker
VA per worker
wage per worker
wage per worker
wage per worker
VARIABLES HT-MHT HT-MHT HT-MHT HT-MHT HT-MHT HT-MHT lcap 0.223*** 0.225*** 0.247*** 0.0630 0.0637 0.0888*** (0.0426) (0.0425) (0.0280) (0.0410) (0.0410) (0.0168) llabor -0.153 -0.180 -0.0470 0.489*** 0.481*** 0.495*** (0.134) (0.134) (0.0749) (0.165) (0.166) (0.0530) educ_person 0.193 0.117 0.443* 0.233 0.209 0.576*** (0.390) (0.385) (0.231) (0.298) (0.304) (0.156) age_person -0.0649** -0.0604** -0.0439*** -0.0704*** -0.0690*** -0.0710*** (0.0306) (0.0304) (0.0143) (0.0226) (0.0223) (0.0110) share_females -0.258 -0.0637 (0.335) (0.252) Herfindahl 0.101 0.0406 (0.201) (0.144) av4_diss 0.0295 -0.178** (0.129) (0.0814) Constant 9.915*** 10.13*** 7.052*** 1.288 1.354 -0.642 (1.306) (1.293) (0.817) (1.301) (1.327) (0.548) Observations 828 828 828 835 835 835 R-squared 0.390 0.389 0.329 0.545 0.545 0.597 Firm Size FE YES YES YES YES YES YES Governorate FE YES YES YES YES YES YES
Robust standard errors in parentheses
*** p<0.01, ** p<0.05, * p<0.1

17
Table 5. Low Technology Manufacturing Value Added and Wages per Worker (1) (2) (3) (1) (2) (3) VA per
worker VA per worker
VA per worker
wage per worker
wage per worker
wage per worker
VARIABLES LT-MLT LT-MLT LT-MLT LT-MLT LT-MLT LT-MLT lcap 0.122*** 0.122*** 0.164*** 0.0149 0.0155 0.0439*** (0.0111) (0.0112) (0.00570) (0.0101) (0.0101) (0.00415) llabor -0.0117 -0.00400 -0.0228 1.167*** 1.182*** 0.951*** (0.0298) (0.0304) (0.0148) (0.0216) (0.0219) (0.0105) educ_person -0.0681 -0.0790* -0.0156 -0.0325 -0.0282 -0.0303** (0.0452) (0.0451) (0.0203) (0.0383) (0.0386) (0.0154) age_person -0.00482 -0.00457 -0.00225 7.61e-05 0.000511 0.0134*** (0.00801) (0.00804) (0.00364) (0.00711) (0.00712) (0.00276) share_females -0.665*** -0.649*** (0.112) (0.0913) Herfindahl -0.296*** -0.459*** (0.0673) (0.0589) av4_diss -0.275*** -0.398*** (0.0319) (0.0234) Constant 9.602*** 9.583*** 8.371*** -2.340*** -2.413*** -2.451*** (0.395) (0.398) (0.158) (0.313) (0.311) (0.111) Observations 12,204 12,204 12,204 12,264 12,264 12,264 R-squared 0.148 0.142 0.199 0.599 0.601 0.606 Firm Size FE YES YES YES YES YES YES Governorate FE
YES YES YES YES YES YES
Robust standard errors in parentheses
*** p<0.01, ** p<0.05, * p<0.1
18
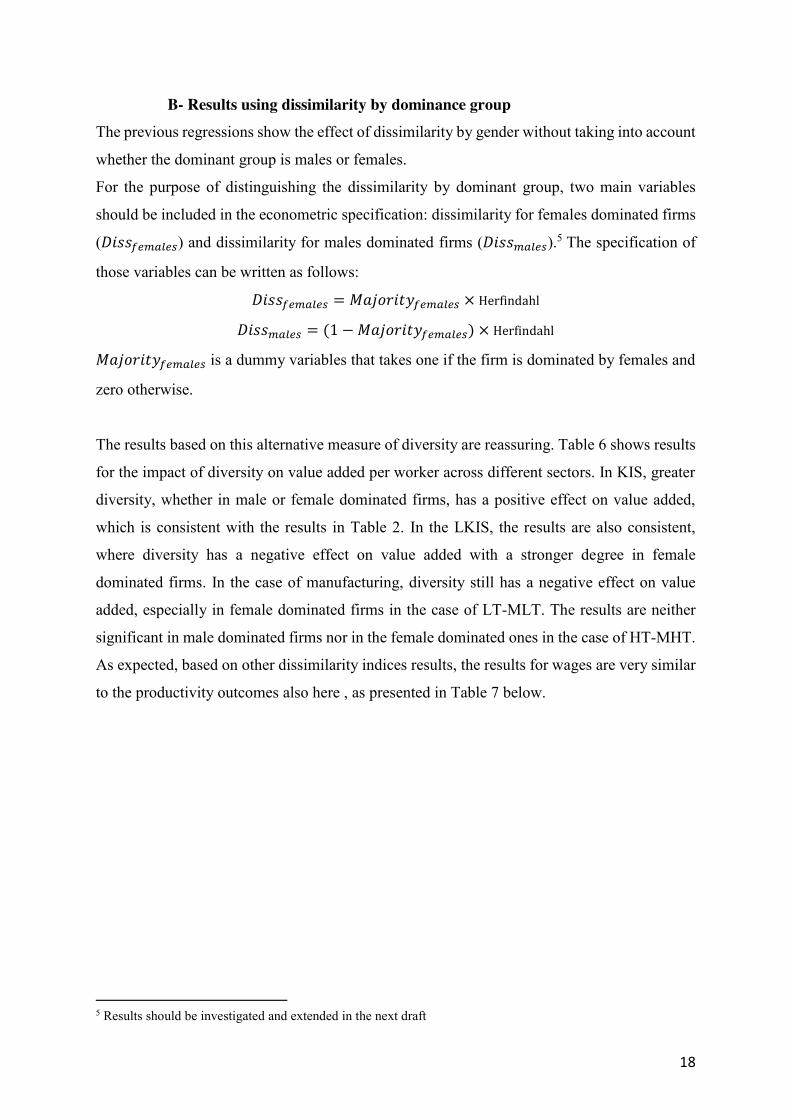
B- Results using dissimilarity by dominance group The previous regressions show the effect of dissimilarity by gender without taking into account
whether the dominant group is males or females.
For the purpose of distinguishing the dissimilarity by dominant group, two main variables
should be included in the econometric specification: dissimilarity for females dominated firms
(𝐷𝑖𝑠𝑠𝑓𝑒𝑚𝑎𝑙𝑒𝑠) and dissimilarity for males dominated firms (𝐷𝑖𝑠𝑠𝑚𝑎𝑙𝑒𝑠).5 The specification of
those variables can be written as follows:
𝐷𝑖𝑠𝑠𝑓𝑒𝑚𝑎𝑙𝑒𝑠 = 𝑀𝑎𝑗𝑜𝑟𝑖𝑡𝑦𝑓𝑒𝑚𝑎𝑙𝑒𝑠 × Herfindahl
𝐷𝑖𝑠𝑠𝑚𝑎𝑙𝑒𝑠 = (1 − 𝑀𝑎𝑗𝑜𝑟𝑖𝑡𝑦𝑓𝑒𝑚𝑎𝑙𝑒𝑠) × Herfindahl
𝑀𝑎𝑗𝑜𝑟𝑖𝑡𝑦𝑓𝑒𝑚𝑎𝑙𝑒𝑠 is a dummy variables that takes one if the firm is dominated by females and
zero otherwise.
The results based on this alternative measure of diversity are reassuring. Table 6 shows results
for the impact of diversity on value added per worker across different sectors. In KIS, greater
diversity, whether in male or female dominated firms, has a positive effect on value added,
which is consistent with the results in Table 2. In the LKIS, the results are also consistent,
where diversity has a negative effect on value added with a stronger degree in female
dominated firms. In the case of manufacturing, diversity still has a negative effect on value
added, especially in female dominated firms in the case of LT-MLT. The results are neither
significant in male dominated firms nor in the female dominated ones in the case of HT-MHT.
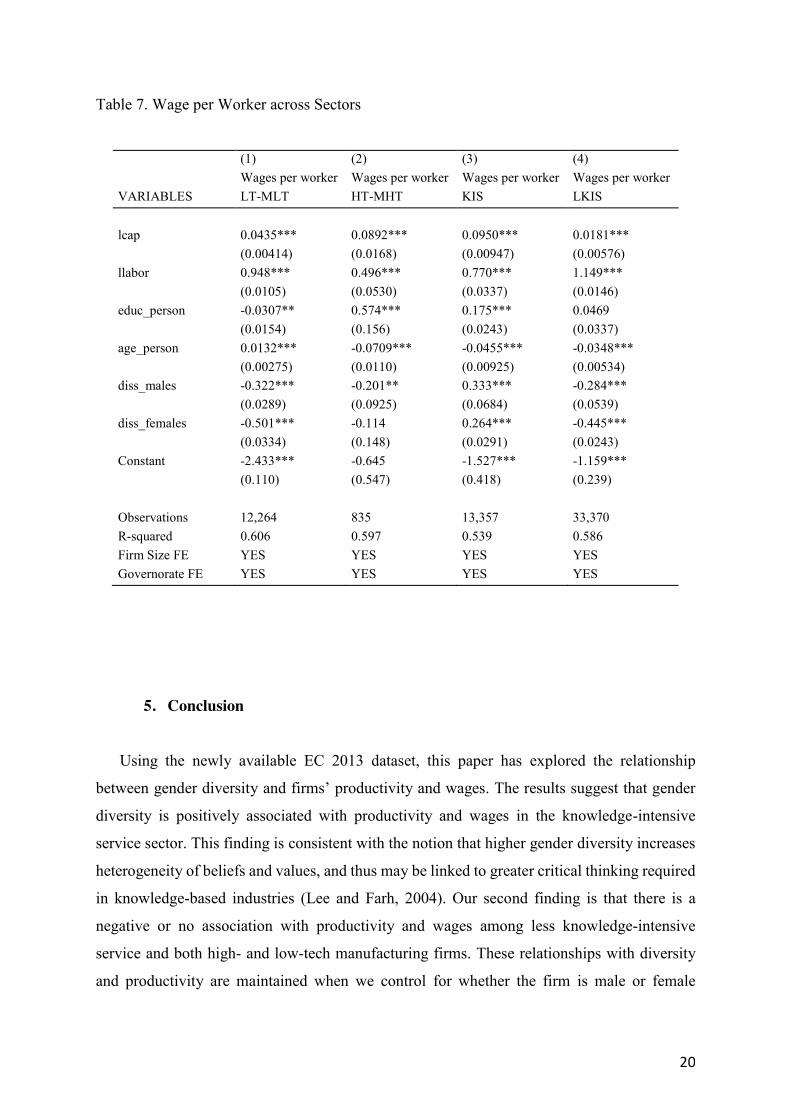
As expected, based on other dissimilarity indices results, the results for wages are very similar
to the productivity outcomes also here , as presented in Table 7 below.
5 Results should be investigated and extended in the next draft

19
Table 6. Value Added per Worker across Sectors (1) (2) (3) (4) VA per worker VA per worker VA per worker VA per worker VARIABLES LT-MLT HT-MHT KIS LKIS Lcap 0.164*** 0.246*** 0.218*** 0.117*** (0.00570) (0.0281) (0.0169) (0.0139) Llabor -0.0267* -0.0494 -0.435*** 0.108** (0.0149) (0.0749) (0.0569) (0.0463) educ_person -0.0160 0.446* 0.339*** 0.339*** (0.0203) (0.231) (0.0383) (0.0628) age_person -0.00253 -0.0441*** -0.0711*** -0.0355*** (0.00364) (0.0143) (0.0142) (0.0111) diss_males -0.179*** 0.0606 0.329*** -0.377*** (0.0404) (0.140) (0.113) (0.0865) diss_females -0.408*** -0.0584 0.205*** -0.571*** (0.0449) (0.243) (0.0479) (0.0443) Constant 8.394*** 7.058*** 9.819*** 9.265*** (0.158) (0.817) (0.669) (0.578) Observations 12,204 828 13,118 32,750 R-squared 0.201 0.329 0.249 0.164 Firm Size FE YES YES YES YES Governorate FE YES YES YES YES
Robust standard errors in parentheses
*** p<0.01, ** p<0.05, * p<0.1
20
Table 7. Wage per Worker across Sectors
(1) (2) (3) (4) Wages per worker Wages per worker Wages per worker Wages per worker VARIABLES LT-MLT HT-MHT KIS LKIS lcap 0.0435*** 0.0892*** 0.0950*** 0.0181*** (0.00414) (0.0168) (0.00947) (0.00576) llabor 0.948*** 0.496*** 0.770*** 1.149*** (0.0105) (0.0530) (0.0337) (0.0146) educ_person -0.0307** 0.574*** 0.175*** 0.0469 (0.0154) (0.156) (0.0243) (0.0337) age_person 0.0132*** -0.0709*** -0.0455*** -0.0348*** (0.00275) (0.0110) (0.00925) (0.00534) diss_males -0.322*** -0.201** 0.333*** -0.284*** (0.0289) (0.0925) (0.0684) (0.0539) diss_females -0.501*** -0.114 0.264*** -0.445*** (0.0334) (0.148) (0.0291) (0.0243) Constant -2.433*** -0.645 -1.527*** -1.159*** (0.110) (0.547) (0.418) (0.239) Observations 12,264 835 13,357 33,370 R-squared 0.606 0.597 0.539 0.586 Firm Size FE YES YES YES YES Governorate FE YES YES YES YES
5. Conclusion
Using the newly available EC 2013 dataset, this paper has explored the relationship
between gender diversity and firms’ productivity and wages. The results suggest that gender
diversity is positively associated with productivity and wages in the knowledge-intensive
service sector. This finding is consistent with the notion that higher gender diversity increases
heterogeneity of beliefs and values, and thus may be linked to greater critical thinking required
in knowledge-based industries (Lee and Farh, 2004). Our second finding is that there is a
negative or no association with productivity and wages among less knowledge-intensive
service and both high- and low-tech manufacturing firms. These relationships with diversity
and productivity are maintained when we control for whether the firm is male or female

21
dominated and are robust to changing the productivity measure from value added per worker
to TFP. The results for wages are very similar to those for productivity
In future drafts of this paper, we will explore additional dissimilarity indices that take into
consideration potential non-linearities in the relationship between gender diversity and firm
outcomes. Secondly, we will also investigate the possibility of using other classifications of
firms that take into account more explicitly gender-specific occupational preferences and roles
within the firm (perhaps by merging information from the ELMPS 2012). Thirdly, other firm
characteristics, such as informality, and interactions between diversity and firm characteristics
could be incorporated in the analysis.
There are a number of important caveats. These findings should not be interpreted causally.
There are a number of characteristics that this analysis was not able to control for due to data
limitations. Typically studies that endeavor to measure the causal link between employee
characteristics and firm outcomes use matched panel employee-employer data. This type of
data would allow us to examine another host of hypotheses such as types of discrimination,
factors influencing crowding of women in particular occupations and industries, and more
generally the interaction of supply side and demand side determinants of wage and productivity
outcomes.

22
References: Alesina, Alberto, and Eliana La Ferrara. 2005. “Ethnic Diversity and Economic Performance.”
Journal of Economic Literature 43(3): 762-800. Ali, M., Kulik, C. T., & Metz, I. (2011). The gender diversity–performance relationship in
services and manufacturing organizations. The International Journal of Human Resource Management, 22(07), 1464-1485.
Assaad, R., & Krafft, C. (2015). The Structure and Evolution of Employment in Egypt: 1998-
2012. The Egyptian Labor Market in an Era of Revolution, 27-51. Baliamoune-Lutz, M., & Lutz, S. Gender and Firm Performance in Middle Eastern and African
Economies. Bardasi, E., Blackden, C. M., & Guzman, J. C. (2007). Gender, Entrepreneurship, and
Competitiveness. The Africa Competitiveness Report. Bardasi, E., Sabarwal, S., & Terrell, K. (2011). How do female entrepreneurs perform?
Evidence from three developing regions. Small Business Economics, 37(4), 417. Barney, J. (1991). Firm resources and sustained competitive advantage. Journal of
management, 17(1), 99-120. Barrington, L., & Troske, K. (2001). Workforce diversity and productivity: An analysis of
employer-employee matched data. Economics Program Working Papers, (01-02). Becker, Gary S. 1957. The Economics of Discrimination. Chicago: University of Chicago Press. Berliant, M., & Fujita, M. (2011). The dynamics of knowledge diversity and economic
growth. Southern Economic Journal, 77(4), 856-884. Breen, R., & Garcia-Penalosa, C. (2002). Bayesian learning and gender segregation. Journal of
Labor Economics, 20(4), 899-922. Brown III, U. J., Knouse, S. B., Stewart, J. B., & Beale, R. L. (2009). The relationship between
unit diversity and perceptions of organizational performance in the military. Journal of Applied Statistics, 36(1), 111-120.
Cataldi, Alessandra, Stephan Kampelmann, and François. Rycx. 2012. “Part-time Work,
Wages, and Productivity: Evidence from Matched Panel Data.” Brussels: unpublished manuscript.
Chatman, J. A., & Flynn, F. J. (2001). The influence of demographic heterogeneity on the
emergence and consequences of cooperative norms in work teams. Academy of Management Journal, 44(5), 956-974.
Cuberes, D. and M. Teignier. 2014. “Gender Inequality and Economic Growth: A Critical
Review.” Journal of International Development 26: 260-276.

23
Dean, J. W., & Snell, S. A. (1991). Integrated manufacturing and job design: Moderating effects of organizational inertia. Academy of Management journal, 34(4), 776-804.
Dwyer, S., Richard, O. C., & Chadwick, K. (2003). Gender diversity in management and firm
performance: The influence of growth orientation and organizational culture. Journal of Business Research, 56(12), 1009-1019.
Elborgh-Woytek, K., M. Newiak, K. Kochhar, S. Fabrizio, K. Kpodar, P. Wingender, B.
Clements, and G. Schwartz. 2013. “Women, Work, and the Economy: Macroeconomic Gains from Gender Equity.” Staff Discussion Note, SDN/13/10, (Washington: International Monetary Fund).
Elsass, P. M., & Graves, L. M. (1997). Demographic diversity in decision-making groups: The
experiences of women and people of color. Academy of Management Review, 22(4), 946-973.
Foster, L., J. C. Haltiwanger, AND C. J. Krizan (2001): Aggregate Productivity Growth.
Lessons from Microeconomic Evidence, chap. 9, pp. 303–372, New Develop- ments in Productivity Analysis. National Bureau of Economic Research, Inc.
Frink, D. D., Robinson, R. K., Reithel, B., Arthur, M. M., Ammeter, A. P., Ferris, G. R., ... &
Morrisette, H. S. (2003). Gender demography and organization performance: A two-study investigation with convergence. Group & Organization Management, 28(1), 127-147.
Garnero, A., Kampelmann, S., & Rycx, F. (2014). The heterogeneous effects of workforce
diversity on productivity, wages, and profits. Industrial Relations: A Journal of Economy and Society, 53(3), 430-477.
Göbel, Christian, and Thomas Zwick. 2012. “Age and Productivity: Sector Differences.” De
Economist 160 (1): 35-57. Grund, C., & Westergård-Nielsen, N. (2008). Age structure of the workforce and firm
performance. International Journal of Manpower, 29(5), 410-422. Hakim, C., 1995, Five Feminist Myths about Women's Employment. The British Journal of
Sociology, 46(3), 429-455. Haltiwanger, J. Eric Bartelsman and Stefano Scarpetta "Cross-Country Differences in
Productivity: The Role of Allocation and Selection" , American Economic Review, Vol. 103, Issue 1 (February 2013) , pp. 305-334
Hellerstein, J. K., & Neumark, D. (1995). Are earnings profiles steeper than productivity
profiles? Evidence from Israeli firm-level data. Journal of Human Resources, 89-112. Hellerstein, J. K., & Neumark, D. (2007). Production function and wage equation estimation
with heterogeneous labor: Evidence from a new matched employer-employee data set. In Hard-to-measure goods and services: Essays in honor of Zvi Griliches (pp. 31-71). University of Chicago Press.

24
Hong, L., & Page, S. E. (2001). Problem solving by heterogeneous agents. Journal of economic theory, 97(1), 123-163.
IFC, 2016, Women, Business and the Law: Getting to Equal, World Bank, Washington DC IMF, 2016, Gender Equality and Economic Diversification, by R. Kazandjian, L.Kolovich, K.
Kochhar, and M. Newiak. Working Paper WP/16/140, African Department, Human Resource Department, and Strategy, Policy, and Review Department
Iranzo, S., Schivardi, F., & Tosetti, E. (2008). Skill dispersion and firm productivity: An
analysis with employer-employee matched data. Journal of Labor Economics, 26(2), 247-285.
Jehn, Karen. 1995. “A Multimethod Examination of the Benefits and Detriments of Intragroup
Conflict.” Administrative Science Quarterly 40(4): 256–82. Kiendrebeogo, Youssef “Export Activity and Productivity: New Evidence from the Egyptian
Manufacturing Industry” Kinda, Tidiane, Patrick Plane and Marie-Ange Vaerganzos-Varoudakis (2011) “Firm
Productivity and Investment Climate in Developing Countries: How does Middle East and North Africa manufacturing perform?” Developing Economics
Kravitz, D. A. (2003). More women in the workplace: is there a payoff in firm
performance?. The Academy of Management Executive, 17(3), 148-149. Lazear, Edward P. 1999. “Globalisation and the Market for Team-Mates.” Economic Journal
109(454): C15-40. Lee, Cynthia L., and Jiing-Lih Farh. 2004. “Joint Effects of Group Efficacy and Gender
Diversity on Group Cohesion and Performance.” Applied Psychology 53(1): 136-54. McKinsey Global Institute 2016, Delivering the Power of Parity: Toward a more gender- equal
society, Working Paper, May Melitz, M. J. (2003). The impact of trade on intra‐industry reallocations and aggregate industry
productivity. Econometrica, 71(6), 1695-1725. Mincer, J., & Polachek, S. (1974). Family investments in human capital: Earnings of
women. Journal of political Economy, 82(2, Part 2), S76-S108. Navon, G. (2010). Human capital spillovers in the workplace: Labor diversity and productivity. Parra, Maria and Inmaculada Martínez-Zarzoso (2015) “ Imported Inputs and Egyptian
Exports: Exploring the Links” Economics Parrotta, P., Pozzoli, D., & Pytlikova, M. (2014). Labor diversity and firm
productivity. European Economic Review, 66, 144-179.

25
Pelled, L. H. (1996). Demographic diversity, conflict, and work group outcomes: An intervening process theory. Organization science, 7(6), 615-631.
Prat, Andrea. 2002. “Should a Team Be Homogeneous?” European Economic
Review 46(7): 1187–207. Richard, O. C., Kochan, T. A., & McMillan-Capehart, A. (2002). The impact of visible
diversity on organizational effectiveness: Disclosing the contents in Pandora's black box. Journal of Business and Management, 8(3), 265.
Schneider J. and V. Eckl (2016), “The difference make a difference: Team diversity and
innovative capacity”, OECD conference proceedings, Belgium, September 16, 2016 Solberg, E. J. (2005). The gender pay gap by occupation: A test of the crowding
hypothesis. Contemporary Economic Policy, 23(1), 129-148. Tajfel, H. (1982). Social psychology of intergroup relations. Annual review of
psychology, 33(1), 1-39. Tajfel, H. E. (1978). Differentiation between social groups: Studies in the social psychology of
intergroup relations. Tajfel, H., & Turner, J. C. (1979). An integrative theory of intergroup conflict. The social
psychology of intergroup relations, 33(47), 74. Triandis, H. C., Dunnette, M. D., & Hough, L. M. (1994). Handbook of industrial and
organizational psychology, Vol. 4. Upadhyay and Zeng (2014), Gender and ethnic diversity on boards and corporate information
environment, Journal of Business Research 67(11):2456–2463. Van Ours, J. C., & Stoeldraijer, L. (2011). Age, wage and productivity in Dutch
manufacturing. De Economist, 159(2), 113-137. Vandenberghe, V. (2013). Are firms willing to employ a greying and feminizing
workforce?. Labour Economics, 22, 30-46. World Bank. 2004. World Development Report 2005: A Better Investment Climate for
Everyone. New York: Oxford University Press.

26
Appendix 1 Manufacturing Industry Classification - NACE Rev. 2 codes – 2-digit level High and medium-high are combined. Medium-low and low are combined.
High-technology 21 Manufacture of basic pharmaceutical products and pharmaceutical preparations
26 Manufacture of computer, electronic and optical products Medium-high technology
20 Manufacture of chemicals and chemical products 27 to 30 Manufacture of electrical equipment, machinery and
equipment n.e.c., motor vehicles, trailers and semi-trailers, other transport equipment
Medium-low technology
19 Manufacture of coke and refined petroleum products 22 to 25 Manufacture of rubber and plastic products; Manufacture of
other non-metallic mineral products; Manufacture of basic metals; Manufacture of fabricated metals products, excepts machinery and equipment
33 Repair and installation of machinery and equipment Low technology 10 to 18 Manufacture of food products, beverages, tobacco products,
textile, wearing apparel, leather and related products, wood and of products of wood, paper and paper products, printing and reproduction of recorded media
31 to 32 Manufacture of furniture; Other manufacturing

27
Service Industry Classification - NACE Rev. 2 codes – 2-digit level Knowledge Intensive Services
Knowledge intensive services (KIS)
50 to 51 Water transport; Air transport; 58 to 63 Publishing activities; Motion picture, video and television
programme production, sound recording and music publish activities; Programming and broadcasting activities; Telecommunications; computer programming, consultancy and related activities; Information service activities (section J);
64 to 66 Financial and insurance activities (section K); 69 to 75 Legal and accounting activities; Activities of head offices,
management consultancy activities; Architectural and engineering activities, technical testing and analysis; Scientific research and development; Advertising and market research; Other professional, scientific and technical activities; Veterinary activities (section M);
78 Employment activities; 80 Security and investigation activities; 84 to 93 Public administration and defence, compulsory social security
(section O); Education (section P), Human health and social work activities (section Q); Arts, entertainment and recreation (section R).
Knowledge intensive market services (excluding high-tech and financial services)
50 to 51 Water transport; Air transport; 69 to 71 Legal and accounting activities; Activities of head offices,
management consultancy activities; Architectural and engineering activities, technical testing and analysis;
73 to 74 Advertising and market research; Other professional, scientific and technical activities;
78 Employment activities; 80 Security and investigation activities;
High-tech knowledge intensive services
59 to 63 Motion picture, video and television programme production, sound recording and music publish activities; Programming and broadcasting activities; Telecommunications; computer programming, consultancy and related activities; Information service activities;
72 Scientific research and development; Knowledge intensive financial services
64 to 66 Financial and insurance activities (section K).
Other knowledge intensive services
58 Publishing activities; 75 Veterinary activities; 84 to 93 Public administration and defence, compulsory social security
(section O); Education (section P), Human health and social work activities (section Q); Arts, entertainment and recreation (section R).

28
Less Knowledge Intensive Services
Less knowledge intensive services (LKIS)
45 to 47 Wholesale and retail trade; Repair of motor vehicles and motorcycles (section G);
49 Land transport and transport via pipelines; 52 to 53 Warehousing and support activities for transportation; Postal
and courier activities; 55 to 56 Accommodation and food service activities (section I); 68 Real estate activities (section L); 77 Rental and leasing activities; 79 Travel agency, tour operator reservation service and related
activities; 81 Services to buildings and landscape activities; 82 Office administrative, office support and other business support
activities; 94 to 96 Activities of membership organisation; Repair of computers
and personal and household goods; Other personal service activities (section S);
97 to 99 Activities of households as employers of domestic personnel; Undifferentiated goods- and services-producing activities of private households for own use (section T); Activities of extraterritorial organisations and bodies (section U).
Less knowledge intensive market services
45 t6 47 Wholesale and retail trade; Repair of motor vehicles and motorcycles (section G);
49 Land transport and transport via pipelines; 52 Warehousing and support activities for transportation; 55 to 56 Accommodation and food service activities (section I); 68 Real estate activities (section L); 77 Rental and leasing activities; 79 Travel agency, tour operator reservation service and related
activities; 81 Services to buildings and landscape activities; 82 Office administrative, office support and other business support
activities; 95 Repair of computers and personal and household goods;
Other less knowledge intensive services
53 Postal and courier activities; 94 Activities of membership organisation; 96 Other personal service activities; 97 to 99 Activities of households as employers of domestic personnel;
Undifferentiated goods- and services-producing activities of private households for own use (section T); Activities of extraterritorial organisations and bodies (section U).

29
Appendix 2 – Summary Statistics of Variables by Sector
KIS sector Obs Mean Std. Dev. Min Max Value add per worker 13560 46186.81 1987115 -1310864 230000000 Wage per worker 13560 6.12 29.52 0 1970 Herfindahl6 13560 0.24 0.14 0 1 Average dissimilarity 13560 0.49 0.44 0 1 Share Females 13560 0.32 0.31 0 1
LKIS Obs Mean Std. Dev. Min Max Value add per worker 33502 95493.47 3457844 -7499976 600000000 Wage per worker 33502 5.52 15.56 0 2076 Herfindahl 33502 0.07 0.16 0 1 Average dissimilarity 33502 0.15 0.33 0 1 Share Females 33502 0.11 0.24 0 1
HT-MHT Obs Mean Std. Dev. Min Max Value add per worker 841 76356.51 281509 -2056509 4167452 Wage per worker 841 12.20 15.18 0 276 Herfindahl 841 0.08 0.14 0 1 Average dissimilarity 841 0.17 0.29 0 1 Share Females 841 0.06 0.13 0 1
LT-MLT Obs Mean Std. Dev. Min Max Value add per worker 12355 35275.40 226872 -235485 14900000 Wage per worker 12355 6.85 8.80 0 385 Herfindahl 12355 0.05 0.14 0 1 Average dissimilarity 12355 0.11 0.28 0 1 Share Females 12355 0.06 0.16 0 1
6 These are summary stats of the normalised Herfindahl index