economic research and analysis may 2008€¦ · economic research and analysis may 2008 . 05/2008...
TRANSCRIPT

COMPARING TIMBERLAND
WITH OTHER INFLATION HEDGES
Chung-Hong Fu, Ph.D., Managing Director
Economic Research and Analysis
May 2008
05/2008 Timberland Investment Resources, LLC 1
Introduction
Timberland as an Inflation Hedge Timberland, as the name suggests, is an investment in land with the objective of growing timber. As such, timberland is an investment in both real estate and a commodity, one that is an economic input used to produce other products such as dimensional lumber and paper. From this perspective, timberland is often considered a real asset and real assets have value for their direct or indirect usefulness in the production or consumption of goods and services. In contrast, capital or financial assets, such as stocks or bonds, are only claims on future enterprise cash flows. The bond or stock itself has no inherent utility, unlike a parcel of land or a barrel of oil.
Since real assets are physical inputs directly consumed in a working economy, they are less likely, in theory, to be affected by inflation. For this reason, timberland is sometimes considered an inflation hedge, an asset that loses little value in periods of rising prices.
Purpose of Holding an Investment Hedge Research has shown that equities and fixed income instruments generally have low or negative correlation with inflation. As a result, stocks and bonds frequently underperform during periods of rapidly rising prices. Adding inflation hedging assets may insulate against the inflation exposure inherent within stock and bond portfolios.
An inflation hedge is useful for investors who are sensitive to erosion of the real value (i.e., purchasing power) of their portfolio. If capital stability in real terms is important, then adding inflation hedging characteristics to the portfolio may be valuable. This is especially true for investors such as pension funds or endowments who have long-term funding requirements.
In recent years monetary policy of developed, industrial economies has been more diligent in addressing inflation concerns, but the risk still exists. According to research by the University of Notre Dame Investment Office, there were 23 three-year periods in the 20th century when real equity returns in the United States were negative. Of the 23 instances of negative returns, 14 instances or 61% were during periods of high inflation.

05/2008 Timberland Investment Resources, LLC 2
The Usual Suspects Timberland is not alone among asset classes as having a reputation as an inflation hedge. While not an exhaustive list, the following asset classes are commonly considered inflation hedges:
• Energy • Commodities • Precious metals • Farmland • Commercial real estate
In this paper timberland will be compared with these other commonly cited inflation hedges. Timberland is currently recognized for its (1) competitive returns relative to its risk; (2) low correlation with other asset classes; and (3) biological growth that creates value independent of the market. How well timberland performs in the context of a volatile inflationary environment may provide insight into whether a fourth feature may be added to the list: (4) an effective inflation hedge.
A Missing Usual Suspect: TIPS No discussion of inflation hedging assets is complete without the mention of Treasury Inflation Protection Securities, otherwise known as TIPS. These bonds were first issued on January 29, 1997 by the U.S. Treasury. Although the coupon rate is fixed, they protect the bond holder from inflation risk because the principal – and therefore the coupon payments – adjust with the Consumer Price Index.
TIPS are issued as 5, 10, 20 and 30-year notes. Like other bonds, their value will move in the opposite direction of interest rates. Interest rates, however, may move independently of inflation. As a result, a portfolio of TIPS bonds could fluctuate in value in a manner that does not coincide with inflation movements. In order to receive the full hedging benefit of TIPS, the securities must be held through full maturity. This concept is illustrated in the chart Figure 1, which plots annual TIPS returns (as measured by the Lehman U.S. Treasury Inflation Notes Index) alongside annual CPI inflation from 2001 through 2007. It is notable that in 2004 and 2005, while inflation was increasing, TIPS returns were flat or declining. In fact, the correlation between Lehman
Figure 1. Annual total return of Lehman U.S. Treasury Inflation Notes Index and annual inflation of the Consumer Price Index from 2001 through 2007.

05/2008 Timberland Investment Resources, LLC 3
U.S. Treasury Inflation Notes Index and CPI inflation in that 2001-2006 span was a negligible -0.006.
In short, an investor may choose TIPS as an inflation hedge if the intention is to hold the securities through maturity. Yields through maturity will be insured against inflation risk, but annual returns and asset values are not.
For the purpose of this paper, an asset should meet three criteria in order to be considered a proper inflation hedge: (1) its real market value remains stable after adjusting for inflation; (2) total annual returns move in tandem with changes in the rate of inflation; and (3) if the asset has a fixed life, then real life-of-investment returns are not eroded by inflation experienced within that period. TIPS fit the third criteria, but not the first two. For this reason, TIPS is not included in this paper’s comparative analysis of inflation hedges.
Comparison to Other Inflation Hedges The following benchmark indices have been chosen to represent the performance of asset classes known to be inflation hedges:
Table 1. Representative benchmark indices
05/2008 Timberland Investment Resources, LLC 4
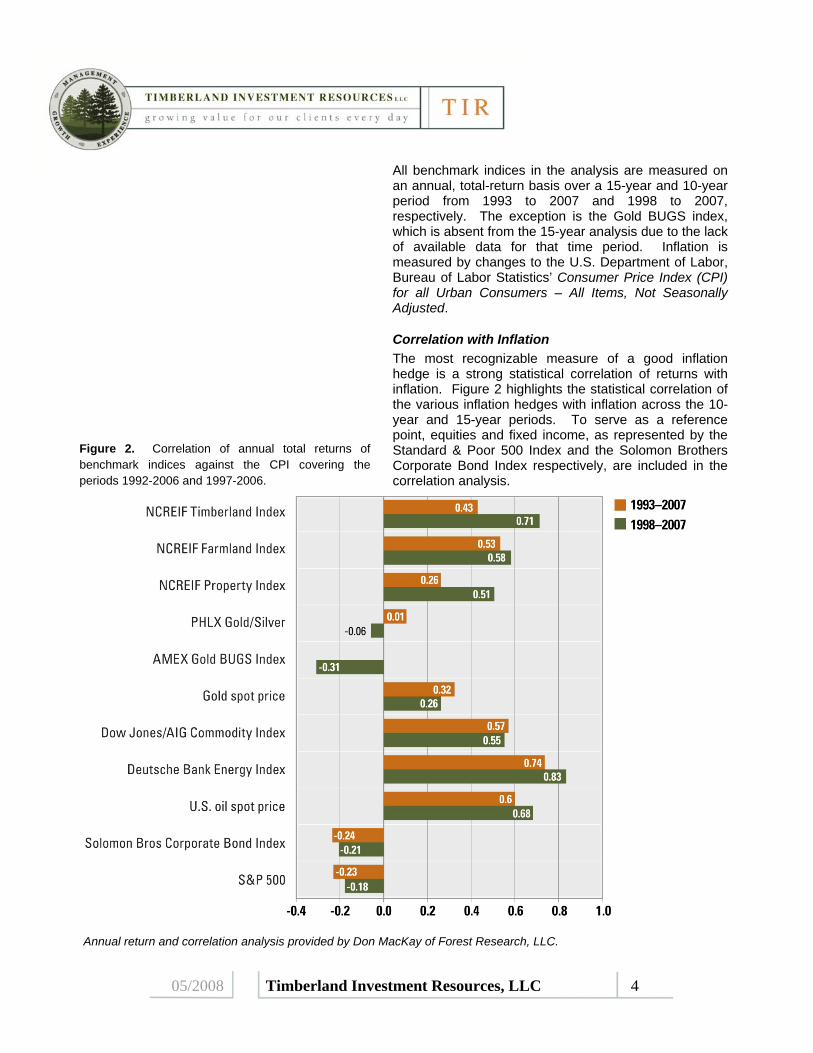
All benchmark indices in the analysis are measured on an annual, total-return basis over a 15-year and 10-year period from 1993 to 2007 and 1998 to 2007, respectively. The exception is the Gold BUGS index, which is absent from the 15-year analysis due to the lack of available data for that time period. Inflation is measured by changes to the U.S. Department of Labor, Bureau of Labor Statistics’ Consumer Price Index (CPI) for all Urban Consumers – All Items, Not Seasonally Adjusted.
Correlation with Inflation The most recognizable measure of a good inflation hedge is a strong statistical correlation of returns with inflation. Figure 2 highlights the statistical correlation of the various inflation hedges with inflation across the 10-year and 15-year periods. To serve as a reference point, equities and fixed income, as represented by the Standard & Poor 500 Index and the Solomon Brothers Corporate Bond Index respectively, are included in the correlation analysis.
Figure 2. Correlation of annual total returns of benchmark indices against the CPI covering the periods 1992-2006 and 1997-2006.
Annual return and correlation analysis provided by Don MacKay of Forest Research, LLC.
05/2008 Timberland Investment Resources, LLC 5
Figure 2 shows that equities and fixed income negatively correlate with the inflation rate. This indicates that stocks and bonds generally have not performed as well, in real terms under rising price levels. But how about the purported inflation hedges? Here, the results are mixed. The weakest performance in the 1993-2007 and 1998-2007 periods were the precious metals. Correlation of inflation with the Gold spot price, PHLX Gold & Silver Index and the Gold BUGS Index was modest or even slightly negative. This suggests that precious metals offer little meaningful insurance against inflation risk. On the opposite end of the spectrum, the best performance comes from commodities and energy markets; both have shown strong correlations, greater than 50%. In the middle of the pack fall the real property asset classes of timberland, farmland and commercial real estate. The inflation correlation of all three asset classes stayed in the 50-70% range for the historic 10-year period. However, the collapse of the real estate bubble in the early 90’s pushed down the 15-year correlation values for commercial real estate sector.
Historic Inflation Hedging Performance of Timberland The true acid test of an inflation hedge is returns tracking inflation over the investment term. Nominal returns should be higher under a high inflation environment and lower under a low inflation environment. Timberland
may be tested for this feature by employing the NCREIF Timberland Index to represent indicative returns that an investor may earn from a broad portfolio of domestic timberland investments.
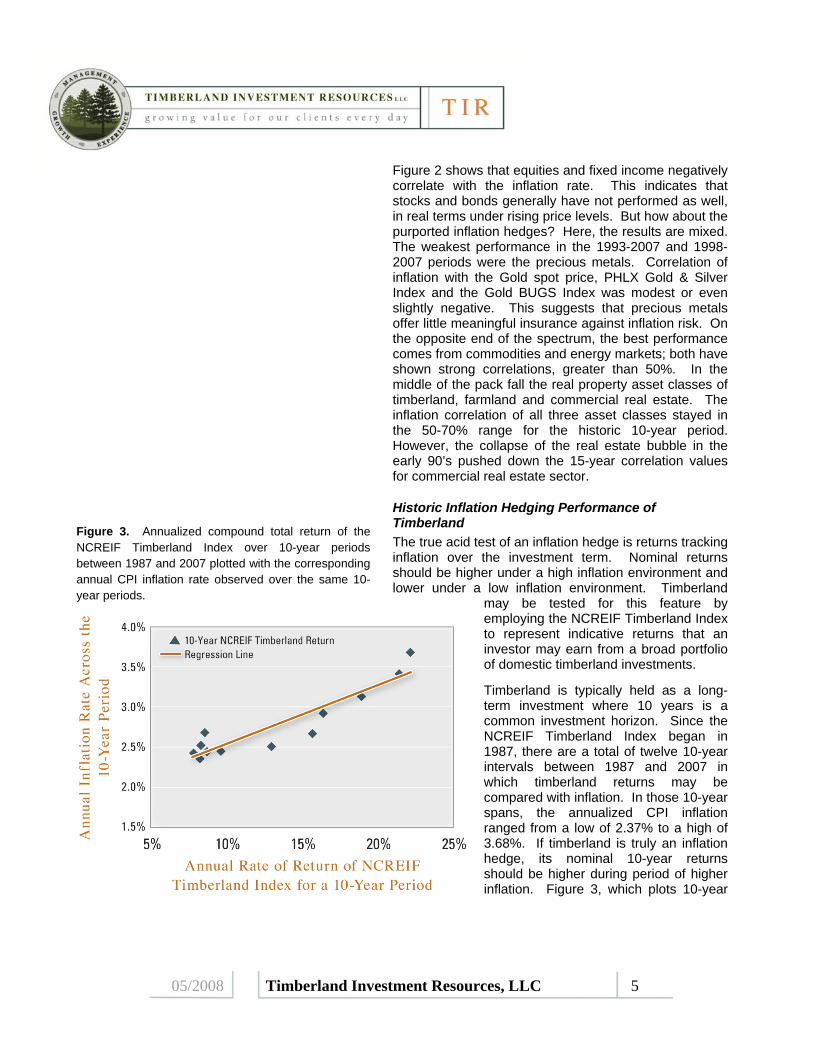
Timberland is typically held as a long-term investment where 10 years is a common investment horizon. Since the NCREIF Timberland Index began in 1987, there are a total of twelve 10-year intervals between 1987 and 2007 in which timberland returns may be compared with inflation. In those 10-year spans, the annualized CPI inflation ranged from a low of 2.37% to a high of 3.68%. If timberland is truly an inflation hedge, its nominal 10-year returns should be higher during period of higher inflation. Figure 3, which plots 10-year
Figure 3. Annualized compound total return of the NCREIF Timberland Index over 10-year periods between 1987 and 2007 plotted with the corresponding annual CPI inflation rate observed over the same 10-year periods.

05/2008 Timberland Investment Resources, LLC 6
NCREIF Timberland performance against the corresponding annual inflation rate, clearly bears this out.
The relationship is statistically robust. When a regression line is applied, the adjusted R-square is 83.9%. In other words, 83.9% of the changes in timberland returns can be matched with changes in the inflation rate. An F-test of the regression shows the results to be statistically significant beyond the 0.01% level.
Asset Allocation of Inflation Hedges in a Portfolio Modern portfolio theory suggests that inflation hedging assets can expand a portfolio’s efficient frontier of risk and return since an inflation hedge by nature would have a low correlation with many traditional asset classes. The question at hand is which inflation hedges to select for a portfolio. That choice, of course, will vary according to risk appetite and return expectations of the portfolio.
Because each investor’s portfolio is unique, there are no universal recommendations. However, a potential range of allocations can be highlighted. A simple optimal portfolio asset allocation was performed with the six different inflation hedges (precious metals, energy, commodities, farmland, timberland and real estate) to supplement the traditional asset classes of equities (S&P500) and fixed income (Salomon Bros. Bond Index). Because inflation hedges are generally considered alternative assets, a modeling rule was applied where no single inflation hedge can exceed 15% of the portfolio. The resulting efficient frontier of a hypothetical portfolio is shown in Figure 4. Of greater relevance is the breakout of the inflation hedges in the portfolio across target portfolio returns shown in Figure 5.
The portfolio allocation example shown in Figure 5 demonstrates that all inflation hedges could play a role in expanding the efficient frontier of (a) minimizing risk or (b) maximizing return. All six inflation hedges were represented at some point in the portfolio allocation modeling. In our modeling, precious metals, commodities and real estate play a major role in the lower target returns. As expected returns are raised, precious metals drop out and are replaced by energy and timberland. Interestingly, the three property asset classes – timberland, commercial real estate and
Figure 4. The efficient frontier of return and risk that a hypothetical portfolio may expect given the choice of large cap equities, corporate bonds and six inflation hedges: (a) precious metals, (b) energy, (c) commodities, (d) farmland, (e) timberland, and (f) commercial real estate. Each asset class is represented in the asset allocation modeling by the respective benchmarks listed in Table 1.
Note: The efficient frontier is based on portfolio optimization based on standard deviation, return and correlation values of all the represented benchmark indices covering the 1993-2007 period. Each inflation hedge asset class is limited to no more than 15% of the portfolio.

05/2008 Timberland Investment Resources, LLC 7
farmland – are featured strongly in the middle and higher portfolio returns. This suggests that real property assets, including timberland, can effectively broaden the efficient frontier envelope of a portfolio.
Figure 5. The proportional allocation of inflation hedges that an optimal portfolio model selects for an efficient frontier of increasing investment return, as represented in Figure 4.

05/2008 Timberland Investment Resources, LLC 8
Conclusions Any inflation hedge that is considered for inclusion in an investment portfolio should be judged against a broad spectrum of attributes and not just its inflation hedging ability. This includes an investment’s (a) risk level, (b) expected return, and (c) correlation with other components of the portfolio. Consequently, a moderate inflation hedge may still be chosen alongside or over a stronger inflation hedge due to those other attributes. That aside, meaningful differences across asset classes considered to be inflation hedges do exist. Some are more effective than others in protecting the investor against inflation risk.
When the preservation of the real value of capital and the matching of nominal returns with unexpected changes to the price level are important to the investor, our analysis suggests that timberland could be worthy of consideration for inclusion in a portfolio. While its inflation hedging ability may not be as strong as some other asset classes – namely the commodities and energy sectors – timberland has held up well against other known inflation hedges such as commercial real estate and farmland and is superior to precious metals.

05/2008 Timberland Investment Resources, LLC 9
Appendix
Description of the benchmark indices used in the analysis

05/2008 Timberland Investment Resources, LLC 10
Indexed nominal returns are compiled by Don MacKay of Forest Research, LLC from various sources, including Ibbotson Associates., NCREIF, U.S. Labor Department, and U.S. Department of Energy