economic report vietnam 2015q1 presented by vu thi diep and bernhard kelkes netherlands embassy...
TRANSCRIPT

Economic Report Vietnam 2015Q1Presented by Vu Thi Diep and Bernhard Kelkes
Netherlands Embassy Hanoi | 14 April 2015

Content• Vietnam’s Economy
• Bilateral Trade and Investment
Netherlands Embassy Hanoi | 14 April 2015 2

Vietnam’s Economy
3Netherlands Embassy Hanoi | 14 April 2015 3
4
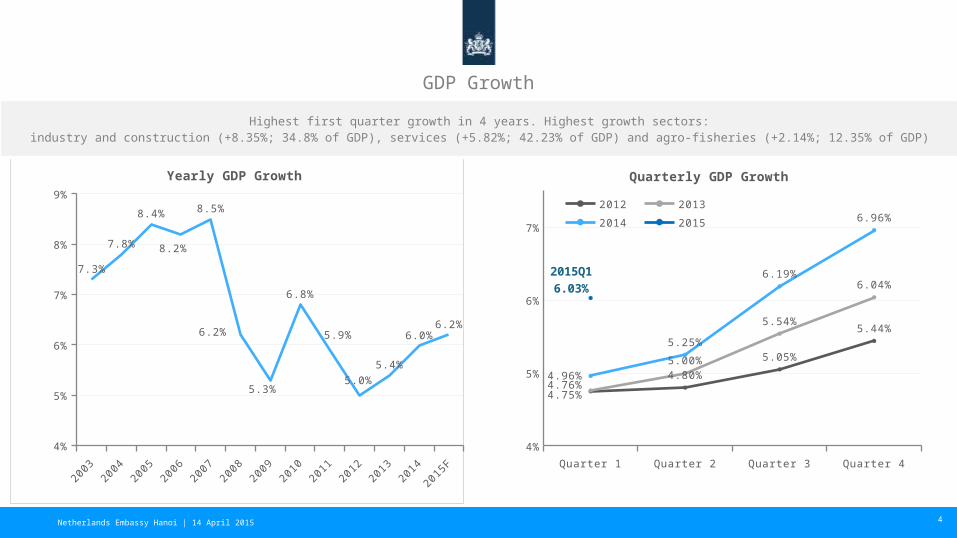
GDP Growth
Quarter 1 Quarter 2 Quarter 3 Quarter 44%
5%
6%
7%
4.75%
4.80%
5.05%
5.44%
4.76%
5.00%
5.54%
6.04%
4.96%
5.25%
6.19%
6.96%
2015Q16.03%
Quarterly GDP Growth
2012 2013 2014
2015
2003
2004
2005
2006
2007
2008
2009
2010
2011
2012
2013
2014
2015
F
4%
5%
6%
7%
8%
9%
7.3%
7.8%
8.4%
8.2%
8.5%
6.2%
5.3%
6.8%
5.9%
5.0%5.4%
6.0%6.2%
Yearly GDP Growth
Highest first quarter growth in 4 years. Highest growth sectors:industry and construction (+8.35%; 34.8% of GDP), services (+5.82%; 42.23% of GDP) and agro-fisheries (+2.14%; 12.35% of GDP)
Netherlands Embassy Hanoi | 14 April 2015

5
2003
2004
2005
2006
2007
2008
2009
2010
2011
2012
2013
2014
2015
F
0%
5%
10%
15%
20%
25%
3.20%
7.80% 8.30%7.40%
8.90%
22.90%
6.90%
11.80%
18.60%
9.21%
6.60%
4.09%
5.00%
Consumer Price Index (CPI) per Year
Quarter 1 Quarter 2 Quarter 3 Quarter 40%
2%
4%
6%
8%
10%
12%
14%
16%
18%
15.95%
12.20%
9.96%
5.44%
6.91% 6.73% 6.83%6.04%
4.83%4.77%
3.62%2.56%
2015Q10.74%
Consumer Price Index per Quarter
2012
2013
2014
2015
Inflation
Low domestic demand led to an inflation increase of only 0.74% (compared to 2014Q1), which is the lowest increase since a decade. However, monthly inflation rates are increasing from 0.3% in February to 0.9% in March.
Netherlands Embassy Hanoi | 14 April 2015

2015Q1
Newly Registered FDI267 projects
New and Additionally Financed FDI
Disbursed FDI
0
10
20
30
40
50
60
70
0
200
400
600
800
1000
1200
1400
1600
1800
4.556.84
12
21.35
64.01
21.518.6 14.7
16.3 14.3 15.6
2.93.3 4.1
811.6 10
11 11 10.46 11.5 12.3
811
970 987
1544
1171
839 833
1091
1287 1275
1588
Registered (USD bln.) Disbursed (USD bln.) Number of projects
USD
bill
ion
Num
ber
of p
roje
cts
auth
oris
ed
6
Foreign Direct Investment (FDI)
+40.6% -44.9%
Strong increase in newly registered FDI (40.6% from 1 Jan – 20 Mar 2015), but total amount of newly registered plus additionally financed projects decreased by 44.9%. Disbursed FDI increased by 7% (USD 3.05bn)
+7.1%
Netherlands Embassy Hanoi | 14 April 2015

2015Q1
Export USD 35.7bn Import USD 37.5bn
Trade Deficit of which Foreign USD2bn surplus
Domestic USD3.8bn deficit(Gov.target <5% exports)
7
2004 2005 2006 2007 2008 2009 2010 2011 2012 2013 20140
50
100
150
200
250
300
26.5 32.4 39.8 48.6 62.7 57.1 72.296.9
114.6132.2 150.0
32.036.8
44.962.8
80.769.9
84.8
106.7
114.3
131.3
148.0
58.569.2
84.7
111.3
143.4127.0
157.1
203.7
229.0
263.5
298.0
Export (USD bn) Import (USD bn)Trade volume (USD bn)
+16.3%+ 6.9%
Export and import (USD bn.)
-1.8bnUSD
Netherlands Embassy Hanoi | 14 April 2015

8
Export and import
Foreign
70%
Foreign
62%Import
Export
Top 5 export destinations Top 5 export items Domestic/Foreign Invested
1. EU: USD 6.9bn. (+14.2%)
2. USA: USD6.9bn. (+12.5%)
3. ASEAN: USD4.5bn. (-1.4%)
4. China: USD3.5bn. (-6.2%)
5. Japan: USD3.3bn. (-10.9%)
1. Telephones and accessories: USD6.7bn. (+21.9%)
2. Textiles and garments: USD4.8bn. (+7,8%)
3. Computers and components: USD 3.6bn. (+65,4%)
4. Footwear: USD2.5bn. (+1.8%)
5. Machinery and spare parts: USD1.8bn. (+16,7%)
Domestic sector: USD 10.6bn (-5.1%)
FDI sector: USD 25.1bn (+12.9%)
Top 5 import destinations Top 5 import items Domestic/Foreign Invested
1. China: USD11.6bn. (+31.5%)
(trade deficit USD8.1 billion, +58.5%)
2. Korea: USD 6.2bn. (+12.1%)
3. ASEAN: USD5.4bn. (+2.3%)
4. Japan: USD 3.3bn. (+31.5%)
5. EU: USD 2.1bn. (+9.8%)
1. Machinery and spare parts: USD6.9bn. (+44,4%)
2. Computers and components: USD5.5bn. (+31.1%)
3. Telephones and spare parts: USD2.6bn. (+25.0%)
4. Fabrics: USD1.9bn. (+1.7%)
5. Steel: USD1.5bn. (+1.6%)
Domestic sector: USD 14.4bn (+5.7%)
FDI sector: USD 23.1bn (+6.6%)
Netherlands Embassy Hanoi | 14 April 2015

9
Limited added value and no spillover foreign
companiesSlow SoE reform Slow financial sector reform Large public debt
Limited progress improving business climate and
tackling corruption
Vietnam imports around 90%
of its export value. The ratio
of micro businesses is around
97% and they are struggling
to access export markets (just
21% of Vietnamese SMEs
participate in global supply
chains). In Q1 19,049
companies were established,
against 16,175 which stopped
operations. Better education
and access to credit are key.
Credit growth 2015Q1 just
1.25% (but expected 15-17%
in 2015).
Slow SoE reform in 2015Q1
with 29 SOEs equitised (target
2015 is 289, in 2014 143 SoEs
were equitised). However,
some major IPO’s and M&A’s
expected this year (20%
Vietnam Airlines, M&A’s in
banking sector, etc.).
Investment Law requirements
for foreign investors eased as
from 1 July 2015.
NPL ratio stood at 3.25% at the
end of 2014 according to SBV (but
NPL rate according to international
standards is probably much
higher). Total number of banks to
be reduced from 40 to 15 by 2017
and for this year 6 bank mergers
expected.
Budget deficit expected to be
around 5% at the end of 2015.
Public debt may reach 60% at
the end of 2016 according to
ADB as the Gov. tax base is
eroding due to reductions in
corporate income tax rates, the
removal of tariffs, exemptions
for favored firms and lower oil
prices.
Vietnam fell 6 places in World Bank’s
Doing Business 2015 report (78/189)
on ‘ease of doing business’,
compared to 2014 and is falling
behind regional countries like
Malaysia and Thailand. Vietnam’s
score in Global Corruption
Perception Index (31/100, ranking
119 globally) remains unchanged for
three consecutive years (2012-
2014).
Macroeconomic stability must be remained and there is urgent need to accelerate the pace of structural reforms and the fight of red tape and corruption to fully reap Vietnam’s growth potential…
Other Economic Issues
Netherlands Embassy Hanoi | 14 April 2015
10
Bilateral Trade and Investment
Netherlands Embassy Hanoi | 14 April 2015
11
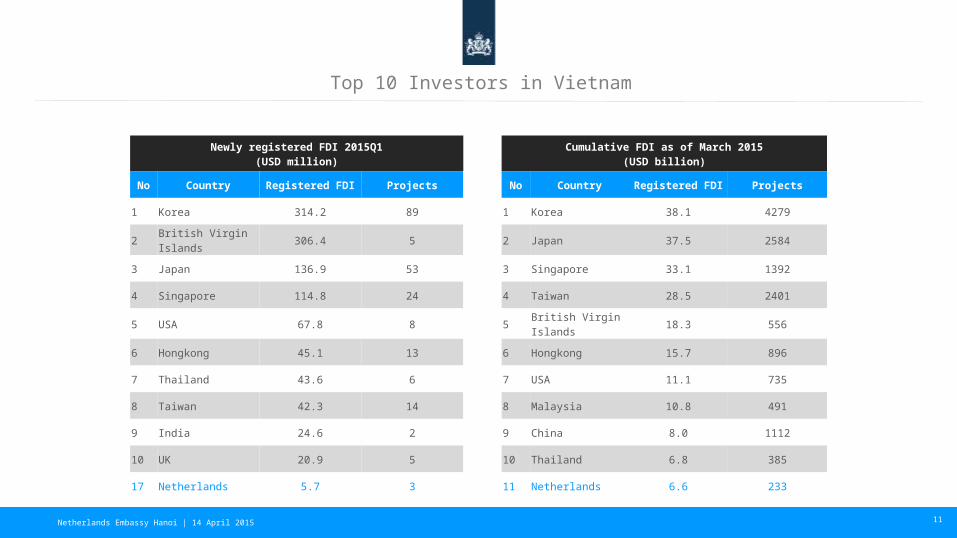
Top 10 Investors in Vietnam
Newly registered FDI 2015Q1(USD million)
Cumulative FDI as of March 2015(USD billion)
No Country Registered FDI Projects No Country Registered FDI Projects
1 Korea 314.2 89 1 Korea 38.1 4279
2British Virgin Islands
306.4 5 2 Japan 37.5 2584
3 Japan 136.9 53 3 Singapore 33.1 1392
4 Singapore 114.8 24 4 Taiwan 28.5 2401
5 USA 67.8 8 5British Virgin Islands
18.3 556
6 Hongkong 45.1 13 6 Hongkong 15.7 896
7 Thailand 43.6 6 7 USA 11.1 735
8 Taiwan 42.3 14 8 Malaysia 10.8 491
9 India 24.6 2 9 China 8.0 1112
10 UK 20.9 5 10 Thailand 6.8 385
17 Netherlands 5.7 3 11 Netherlands 6.6 233
Netherlands Embassy Hanoi | 14 April 2015
12
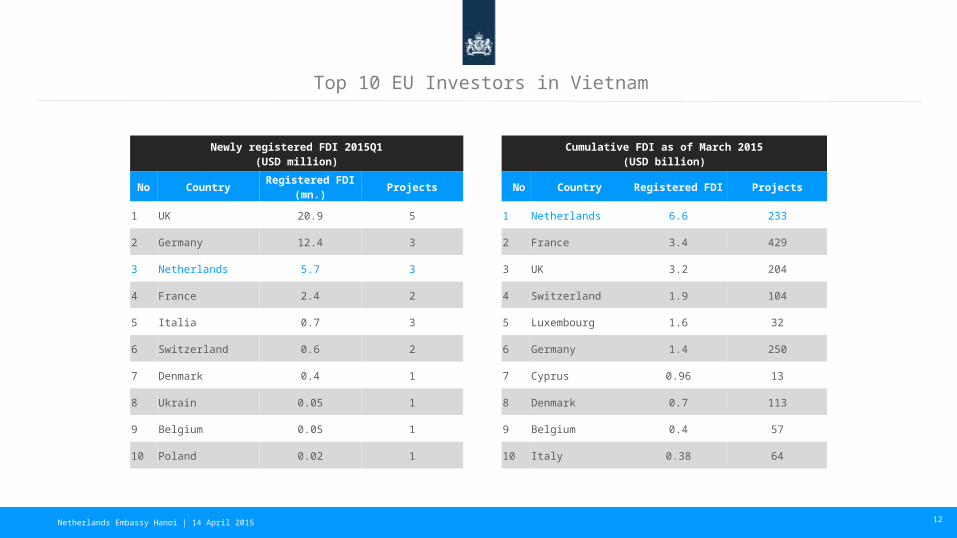
Newly registered FDI 2015Q1(USD million)
Cumulative FDI as of March 2015(USD billion)
No CountryRegistered FDI
(mn.)Projects No Country Registered FDI Projects
1 UK 20.9 5 1 Netherlands 6.6 233
2 Germany 12.4 3 2 France 3.4 429
3 Netherlands 5.7 3 3 UK 3.2 204
4 France 2.4 2 4 Switzerland 1.9 104
5 Italia 0.7 3 5 Luxembourg 1.6 32
6 Switzerland 0.6 2 6 Germany 1.4 250
7 Denmark 0.4 1 7 Cyprus 0.96 13
8 Ukrain 0.05 1 8 Denmark 0.7 113
9 Belgium 0.05 1 9 Belgium 0.4 57
10 Poland 0.02 1 10 Italy 0.38 64
Top 10 EU Investors in Vietnam
Netherlands Embassy Hanoi | 14 April 2015

Ger-many
Nether-lands
UK
Italy
France
Austria
Spain
Bel-gium
Sweden
Poland
0 200 400 600 800 1000 1200 1400
375.3
64.3
88.4
200.8
190.1
93.0
55.3
57.7
34.6
23
914.9
630.4
568.6
1689
413.7
351.5
366.4
262.2
139
92.8
1290.2
694.7
658.2
636.7
603.8
444.5
421.7
319.9
173.6
115.8
Export to VN Import from VN Total tradeUSD million
Market share
11.9%
13
Trade | Main EU Trading Partners
Netherlands Embassy Hanoi | 14 April 2015
2004 2005 2006 2007 2008 2009 2010 2011 2012 2013 20140
500
1000
1500
2000
2500
3000
3500
4000
4500
130 150 230 320 400 430 317 481704 678 504387 400
490600
700976 1,017
1,546
2,4762,937
3,348
517 550720
9201,100
1,406 1,334
2,027
3,180
3,615 3,852
Export to Vietnam Export to the Netherlands Total trade
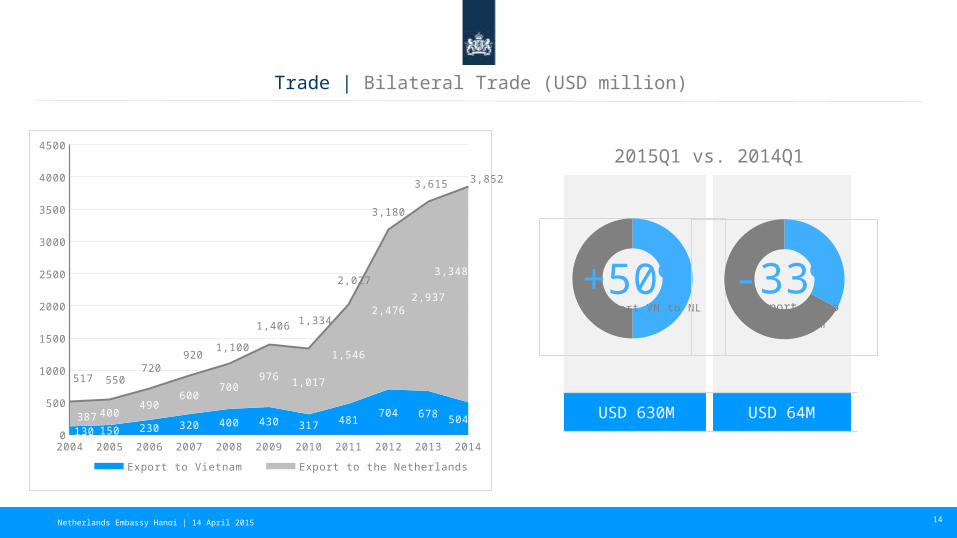
14
Trade | Bilateral Trade (USD million)
2015Q1 vs. 2014Q1
USD 630M USD 64M
Export VN to NL
+50%Export NL to
Vietnam
-33%
Netherlands Embassy Hanoi | 14 April 2015
15
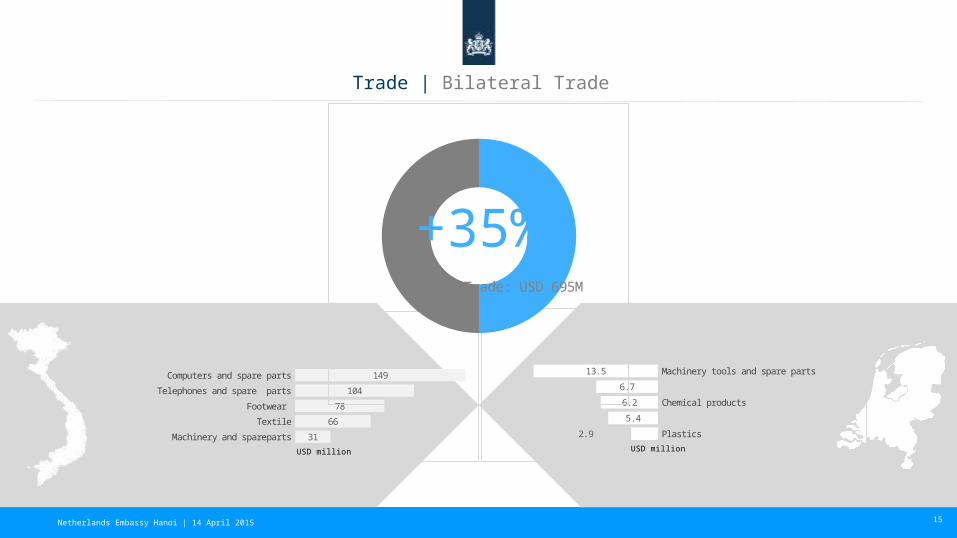
Trade | Bilateral Trade
Machinery and spareparts
Textile
Footwear
Telephones and spare parts
Computers and spare parts
31
66
78
104
149
USD million
Machinery tools and spare partsAutomobile accessorises and spare
partsChemical products
Milk and dairy products
Plastics
13.5
6.7
6.2
5.4
2.9USD million
Total Trade: USD 695M
+35%
Netherlands Embassy Hanoi | 14 April 2015

16
Thank you!
16
© Embassy of the Kingdom of the Netherlands BIDV Building, 7th Floor, 194 Tran Quang Khai StreetHoan Kiem District, Hanoi, [email protected]
Sources:Statistics: Vietnam General Statistics Office, GSOVietnam Foreign Investment Agency, FIAMaps: www.freevectormaps.com, Pictures: Holland Branding