economic potential of using high tunnel hoop houses to produce fruits and vegetables jeri
TRANSCRIPT

1
Economic Potential of Using High Tunnel Hoop Houses to Produce Fruits and Vegetables
Jeri Donnell, Jon T. Biermacher, and Steve Upson
Jeri Donnell is an associate agricultural economist, Jon T. Biermacher is an associate professor and
agricultural economist, and Steve Upson is a horticulture specialist and senior consultant, The
Samuel Roberts Noble Foundation. Professional paper NF-AG-08-013A.
Contact author:
Jon T. Biermacher
The Sam Roberts Noble Foundation, Inc.
2510 Sam Noble Parkway
Ardmore, OK 73401
Phone: (405) 224-6410
e-mail: [email protected]
Selected Paper prepared for presentation at the Southern Agricultural Economics Association
Annual Meeting, Corpus Christi, TX, February 5-8, 2011
Copyright 2011 by Jeri Donnell, Jon T. Biermacher and Steve Upson. All rights reserved. Readers may make verbatim copies of this document for non-commercial purposes by any means, provided that this copyright notice appears on all such copies.

2
Economic Potential of Using Hoop House Plasticulture Technology to Produce Fruits and Vegetables Abstract
Hoop house plasticulture has been promoted as a production technology that allows fruit and
vegetable crops to be grown in the cool season months in early spring and late fall. At this time
little information regarding the economics of hoop house plasticulture is available. Two fruit
and vegetable production systems were developed for growing conditions in south-central
Oklahoma. The first system has a spinach crop followed by field tomato, and the second
system has annually produced strawberry followed by yellow and zucchini squash. Crop
production data were collected in a three-year randomized and replicated experiment. The
objectives were (1) to determine the expected cost of production for each crop and systems, (2)
to determine the breakeven price for each crop in each system, and (3) to determine how
robust breakeven prices are to a number of yield, expense and marketing scenarios. The
expected total cost of production were $1,968 and $1,652 per house for spinach and tomato
crops, respectively, and $2,749, $359 and $353 per house for yellow and zucchini squash crops,
respectively. Breakeven prices for spinach and tomato were $3.32 and $0.83 per pound,
respectively, and $6.16, $0.92, and $1.40 per pound for strawberry and yellow and zucchini
squash, respectively. Breakeven prices for spinach and strawberry crops were most sensitive to
assumptions about quantity of marketable yield sold and/or quantity of yield consumed by
grower household.
Keywords: breakeven prices, economics, fruits and vegetables, hoop houses, plasticulture

3
Introduction:
There are many problems and issues that limited resource fruit and vegetable growers and
horticultural enthusiasts experience during the growing season that often times result in the
loss of crop production and income. These problems are commonly associated with crop
exposure to unpredictable and highly variable growing conditions such as untimely freezing,
extreme heat, excessive rainfall, excessive wind, and/or unpredictable snow and hail. Yield
losses can also result from infestation of weeds, insects, pests (e.g., rabbits, raccoons, and
deer), fungi and/or plant diseases. As a result, growers are continuously searching for
management practices and/or production technologies that reduce the problems and issues
commonly associated with producing fruits and vegetables.
Hoop house plasticulture has been promoted as a production technology that has many
advantages associated with producing fruits and vegetables. For instance, previous work has
shown that hoop houses can reduce crop damage from insects, pests, weeds, diseases
(Blomgren and Frisch 2010; Demchak 2009; and Upson 1998). Hoop houses have also been
shown to reduce problems commonly associated with volatile, unpredictable growing
conditions (Lamont and Orzolek 2003, and Upson 1998). The exception, according to Lamont
and Orzolek 2003, is that excessive wind can lead to damage to hoop house structures, and
potentially lead to damage to crops, that would result into greater hoop house maintenance
expenses and loss of yield. Lastly, Blomgren and Frisch 2007, Conner et al 2010, and Lamont
and Orzolek 2003 reported that hoop houses can be used to extend the growing season of
fruits and vegetables into the cool seasons months of the growing season, allowing growers the
potential to receive more favorable prices when demand is high and supply limited.
4
Given the advantages being promoted, many growers and horticultural enthusiasts have
been asking what the economics are associated with using hoop house plasticulture and
whether or not the technology will be economically beneficial to their operations. At this time,
though, little information about the expected benefits and costs associated with using hoop
houses is available to growers; especially for those operating in the southern Great Plains who
tend to be exposed to volatile growing conditions in the cooler season months of the growing
season. In response to these questions and the lack of economic information, two different
fruit and vegetable cropping systems were developed for the growing conditions of south-
central Oklahoma. The first system includes a spinach (Spinacia oleracea) crop that is
established in September with harvests occurring in the cool season months of November,
December, January, and February followed by a tomato (Lycopersicon esculentum) crop that is
established in March with harvests occurring in May, June and July. In the second system,
strawberry (Fragaria spp) is established annually in October with harvests occurring in April and
May followed by yellow and zucchini squash (Cucurbita pepo) crops that are established in May
with harvests in June and July.
The objectives of the research were (1) to determine the expected total cost of
production for each crop and system, (2) to determine the expected breakeven price for each
crop in each system for a number of production/marketing scenarios, and (3) to determine how
robust breakeven prices are to various yield, expense and marketing scenarios. To our
knowledge, this is the first study that quantifies the economics of fruit and vegetable cropping
systems using data collecting from high tunnel hoop houses in a randomized and replicated
agronomic experiment. Information reported in this study is expected to be useful to profit-
5
minded growers and cost conscience horticultural enthusiasts in helping them decide whether
or not to adopt hoop house plasticulture technology into their operations, and to production
scientists and extension educators that work closely with fruit and vegetables growers.
Data and Methods:
A randomized and replicated production experiment evaluated two fruit and vegetable
cropping systems (spinach/tomato and strawberry/squash) was conducted at the Samuel
Roberts Noble Foundation Headquarters Farm located in south-central Oklahoma for the
2007/08, 2008/09, and 2009/10 growing seasons. The study utilized four 1,400 square foot
high tunnel hoop houses with each house having four 208 cubic foot permanent raised growing
beds. Both cropping systems were replicated in two high tunnel hoop houses in each growing
season of the study.
Each crop for each system and house were inspected daily during the growing season.
All fertilizer treatments were managed based on results from soil sampling activity throughout
the growing season. In addition, all treatments for weeds, insects, fungi, and diseases were
administered based on need determined by visual inspection. Moreover, glyphosate herbicide
was applied to the outside perimeter of each house to manage weed encroachment and
infestation throughout the growing season. Drip line irrigation was utilized for strawberry,
tomato and squash crops, and spinach was irrigated manually with an irrigation wand, when a
soil water-tension reading between 30 and 40 centibars (approximately 50 percent of available
water depletion) was indicated using a tensiometer. Sidewall ventilation techniques were
employed manually to help regulate temperature and airflow for each house during the

6
growing season. A comprehensive chronology of all production activities for each system are
reported in Tables 1 and 2.
Enterprise budgeting techniques were used to determine expected values for cash
operating expenses and fixed costs associated with depreciable assets. Labor data were
measured and recorded in hours into one of seven categories of production activity, including
pre-planting, planting, crop care, hoop house maintenance, harvesting, sorting and packaging,
and post crop cleanup. A labor rate of $7.75 per hour was assumed in the analysis. Local retail
prices for all operating inputs were gathered in the summer of 2010 and used with the three-
year average quantities of inputs for each crop and system to calculate the three-year average
cost of production for each operating expense. An annual interest rate of eight percent was
used to calculate the opportunity cost of operating capital. Procedures published by the
American Society of Agricultural and Biological Engineers (2006) were used to calculate fixed
costs associated with depreciable assets (i.e., high tunnel hoop houses, permanent raised
growing beds, plastic, garden tiller, work truck, irrigation systems, etc.).
Crops harvested in each year were not marketed to the public. As a result, price data
for each crop and year were not collected in the study. In an effort to provide useful
information to profit-minded growers and cost conscience horticultural enthusiasts to help
them determine whether or not to use hoop house plasticulture, three-year average breakeven
prices were calculated for each crop for a number of possible marketing scenarios. Biermacher
et al 2007 reported a substantial disparity between the total quantity of crops harvested and
the total amount of crops sold in a production and retailing study conducted in south-central
Oklahoma. They reported that the percent of the total quantity of crops made available for

7
sale at the market that perished (i.e., quantity that could not be sold as fresh at the farmers
market) ranged from 10% for watermelon to 91% for habanera pepper. They go on to report
that 52% of tomato and 68% of squash went to waste. As a result of these findings, we
calculated breakeven prices assuming that 100%, 75% and 50% of the total quantity of each
crop harvested was actually sold at market. These scenarios are also meant to represent
horticultural enthusiasts that are interested in consuming a portion of what they grow (i.e.,
household consumption) while at the same time interested in marketing the portion that they
do not consume. In addition, calculations for these breakeven price scenarios were made with
and without labor expenses in order to provide useful information to (1) profit-minded growers
seeking to earn a return on their labor, and (2) for enthusiasts that tend to value their labor in
terms of quality-of-life and/or recreational activity. Furthermore, it was determined through
preliminary findings, that breakeven prices for strawberry and spinach crops were most
sensitive to assumptions about yield marketing scenario. In response, further analyses were
carried out for a number of crop price ceiling marketed scenarios.
Results and Discussion:
Yields. Marketable crop yields (pounds/house) for each crop, system and year are reported in
table 3. Spinach was the most stable crop in terms yield variation across growing seasons. This
is the result of less variable growing conditions during the cool season months (October
through February) then growing conditions typically realized during the warmer season months.
Tomato, strawberry and squash crops realized substantial variation in yields across growing
seasons compared to spinach. Tomato and squash crops are subjected to extreme heat across
growing seasons while strawberry crops were exposed to post-spring freezing in the 2008/09

8
and 2009/10 growing seasons that reduced harvest periods and ultimately production yields
relative to the 2007/08 growing season. Further, all cropping systems realized some across
house variation in each growing season that was mostly due to soil-borne disease problems and
soil N mineralization issues that appeared to occur randomly in any given growing season.
Labor. Labor hours by production activity, system and crop are reported in table 4. Fruit and
vegetable cropping systems grown in hoop houses required considerable amounts of labor
hours. Harvest, sorting and packaging labor accounting for 42% of the total labor effort for the
spinach/tomato system and for 26% of the total effort for the strawberry/squash system. Crop
care activity accounted for 29% of the labor effort for the spinach/tomato system and 36% for
the strawberry/squash system. Substantial crop care is required for the strawberry crop as it
utilizes the hoop house for up to 10 months of the growing seasons. Hoop house maintenance
expenses accounted for approximately 8% of the total labor effort for both systems. Much of
this effort goes for repairing hoop houses after periods of heavy rain and extreme winds.
Economics. Expected values for cash operating expenses and fixed expenses for depreciable
assets by crop are reported in table 5. Total variable costs, including labor expenses, were $765
and $720 per house for spinach and tomato crops, respectively. For the strawberry and squash
crops, variable costs were $1,151, $188, and $182, respectively. Of the six operating expense
categories, labor accounted for 78% and 72% for the spinach and tomato crops, and 51%, 74%,
and 74% for strawberry and squash (yellow and zucchini) crops, respectively.
Total fixed costs were $1,203 and $862 for spinach and tomato, respectively and $1,598,
$171, and $171 for strawberry and yellow and zucchini squash, respectively. Total fixed costs
for the spinach/tomato system was $2,065 ($1,203 for spinach and $862 for tomato), and

9
$1,940 for the strawberry/squash system. Among the fixed costs, the largest was associated
with owning the hoop house, permanent raised growing beds, soil, plastic and windbreaks.
These costs were $933 and accounted for 26% of the total cost of production for the
spinach/tomato system and 27% of the strawberry/squash system, respectively. In addition,
the costs associated with using 50% of the work truck, $667, accounted for 18% of total cost of
the spinach/tomato system and 19% of the strawberry/squash system. The total cost of each
system would be less if a grower assumes the cost associated with a used truck in place of a
new truck.
Due to the lack of financial research resources for this study, marketable produce was
not sold to the public. Therefore, breakeven prices were calculated for each crop for each
system for a number marketing scenarios. Breakeven prices for each crop and system are
reported in Table 6. Market scenarios for 100%, 75%, and 50% of the marketable crop yield
was sold at the market. The 75% and 50% scenarios (with and without labor expenses) might
represent cases where growers/enthusiasts are not able to sell all of their produce due to
spoilage or due to family consumption. It was found that breakeven prices are quite sensitive
to assumptions about the percentage of the crop harvested that is not sold and goes to waste
or is consumed by grower households. For example, in scenario 6 on Table 6, we assume that
a grower will consume half of the spinach and tomatoes they grow and do not choose to place
a value on their labor efforts (i.e., they grow produce for quality of life measures). In this
scenario, price they would require to breakeven for spinach was determined to be $4.42 per
pound and for tomato it was $1.17 per pound.

10
In another scenario (SC2 in Table 6), it is assumed that a profit-driven grower producing
strawberry and squash crops is only able to sell 75% of each crop at their market (i.e., 25% of
each crop is spoiled and thrown out). Under this scenario the grower would have to receive a
price $7.08 per pound for strawberry, $1.06 per pound for yellow squash, and $1.48 per pound
for zucchini squash in order to breakeven. For this scenario, a profit-motivated grower may
determine that is it unlikely that s/he will be able to receive such a high price for strawberry at
their marketplace. In response to this concern, and similar concerns about prices in similar
scenarios (e.g., SC2, SC3 and SC6 in Table 6), breakeven prices were calculated for tomato in
system 1 and squash crops (yellow and zucchini) in system 2 when prices for spinach (in system
1) and strawberry (in system 2) were fixed at various rates that growers might anticipate
receiving at their respective markets. Breakeven prices under a number of expected price
ceiling scenarios for spinach and strawberry are reported in Table 7.
For the scenario that assumes that growers can only receive $4 per pound of strawberry
at their market, and that only 50% of the strawberry and squash crops will be marketed, and
growers are not interested in recovering labor expenses (SC9 in Table 7), it was determined that
this type of grower would need to receive $1.69 and $2.38 per pound of yellow and zucchini
squash, respectively, in order to breakeven. Note, that these breakeven prices do not consider
any costs associated with marketing; that is, when marketing costs are included in the analysis,
the breakeven prices that a grower would require for their squash crops will be greater than
what are reported in Table 7. Each grower will likely have different marketing expenses
depending on their marketing plan.

11
Conclusions and Limitations:
Information about the economic potential for growing fruits and vegetable crops in high tunnel
hoop houses is limited. Results of this study indicate that the economic potential for using a
high tunnel hoop house with permanent raised growing beds to produce spinach and tomatoes
(system 1) or strawberries and summer squash (system 2) depends on the growers ability to
successfully market their produce. For a profit-minded grower, marketing 100% of the
marketable yield produced is possible, but past research has shown it unlikely. In cases where
growers are unable to market a high percentage of the of crops produced, in either cropping
system evaluated, requires a greater breakeven price and hence reduces the potential to
generate positive economic returns. Results of the study also indicate that a grower will likely
have a better chance of receiving the prices necessary to receive a positive net return from
growing and marketing spinach and tomato (system 1) as opposed to growing and marketing
strawberry and squash (system 2).
There are several limitations to this research that need to be pointed out. First, only
two fruit and vegetable cropping systems were considered in this study. It is important to note
that there are many possible cropping systems that could be grown in high tunnel hoop houses
in the growing conditions common to south-central Oklahoma. Further research needs to be
conducted that consider these systems for their economic potential. Second, the quantity of
water required by these two systems was not measured in this study, and therefore, the total
cost of production have been underestimated by the cost of water. It is likely that the cost of
water is substantial and further research needs to address this issue of water use. Third, cold
storage equipment was not considered in the analysis. Cold storage gives a grower the
12
potential to reduce the time it takes fruit and vegetable crops to perish and spoil. This would
allow a profit-minded producers a way to manage the cost of crop spoilage. However, the
additional benefits from reducing crop spoilage needs to be compared to the additional costs
associated with cold storage equipment. Lastly, there are several types of hoop house
structures available to producers. This study only considered high tunnel hoop houses with
permanent raised growing beds. Further research is warranted that focuses on the economic
potential of using alternative hoop house technologies to produce fruit and vegetable cropping
systems.
References:
American Society of Agricultural and Biological Engineers. 2006. “Agricultural Machinery
Management Data.” ASAE D497.5. St. Joseph, MI.
Biermacher, J.T., S. Upson, D. Miller, and D. Pittman. “Economic Challenges of Small-Scale
Vegetable Production and Retailing in Rural Communities: An Example from Rural
Oklahoma.” Journal of Food Distribution Research 38,3(2007):1-13.
Blomgren, T., and T. Frisch. “High Tunnels: Using Low Cost Technology to Increase Yields,
Improve Quality and Extend the Season.” Center for Sustainable Agriculture, University
of Vermont, 2007. Internet site:
http://www.uvm.edu/sustainableagriculture/Documents/HighTunnels.pdf (Accessed
July, 2010).
13
Conner, D.S., K.B. Waldman, A.D. Montri, M.W. Hamm, and J.A. Biernbaum. “Hoophouse
Contributions to Economic Viability: Nine Michigan Case Studies.” HortTechnology
20,5(2010):877-884.
Demchak, K. “Small Fruit Production in High Tunnels.” HortTechnology 19,1(2009):44-49.
Lamont, W. J. Jr., and M.D. Orzolek. “2003 High Tunnel Production Manual.” Center of
Plasticulture, Pennsylvania State University (2003).
Upson, S. “Hooping It Up: Observations from Two Years of Hoop House Vegetable Trials.” Ag
News and Views, 1998. Internet site:
http://www.noble.org/Ag/Horticulture/HoopVeggieTrials/index.html (Accessed
December, 2010).

14
Table 1. Chronology of Production Activity for Spinach Followed by Tomato (System 1)
Month Production Activity
August Solarize soil using clear plastic mulch Soil sample
September Leach beds for 24 to 48 hours using overhead irrigation system Till in 0-0-60 at a rate of 3.67 pounds/house Till in Sulfur at a rate of 6.00 pounds/house Till in 34-0-0 at a rate of 0.13 pounds/house Seed spinach (Melody variety) at a rate of 6.2 ounces/house and hand irrigate Regulate temperature between 70-80 °F using sidewall ventilation techniques
October Fertigate 34-0-0 weekly for a monthly application rate of 35.84 ounces/house Hand weed Hand thin spinach to 6 inch plant spacing
November Hand irrigate using irrigation wand Regulate temperature between 65-75 °F using sidewall ventilation techniques Fertigate 34-0-0 weekly for a monthly application rate of 35.84 ounces/house Hand weed Apply carbaryl (Sevin 80S) at a rate of 0.05 pounds/house to control for caterpillars Apply esfenvalerate (Asana XL) at a rate of 0.40 ounces/house to control for caterpillars Apply glyphosate outside perimeter of houses at a rate of 1.07 ounces/house to control for weeds Harvest, clean, weigh, and package spinach
December Hand irrigate using irrigation wand Regulate temperature between 65-75 °F using sidewall ventilation techniques Fertigate 34-0-0 weekly for a monthly application rate of 17.92 ounces/house Hand weed Harvest, clean, weigh, and package spinach
January Hand irrigate using irrigation wand Regulate temperature between 60-75 °F using sidewall ventilation techniques Install row covers when outside temperature less than 35 °F Hand weed Harvest, clean, weigh, and package spinach
February Hand irrigate using irrigation wand Regulate temperature between 60-75 °F using sidewall ventilation techniques Install row covers when outside temperature less than 35 °F Hand weed Apply abamectin (Agri-Mek 0.15EC) at a rate of 0.480 ounces/house to control for mites Harvest, clean, weigh, and package spinach Soil sample to depth of 6 inches Order custom grown tomato plants at a rate of 140 plants/house
March Remove spinach plants and clean house Till in 0-0-60 at a rate of 3.13 pounds/house Till in 34-0-0 at a rate of 0.67 pounds/house Till in Sulfur at a rate of 4.00 pounds/house Install 0.50 gph dripline irrigation Lay black plastic mulch Transplant custom grown tomato plants at a rate 120 plants/house Apply 18-18-21 starter solution at a rate of 72 ounces/house Install tomato cages Irrigate using dripline irrigation Regulate temperature between 75-85 °F using sidewall ventilation techniques Install row covers when outside temperature less than 35 °F
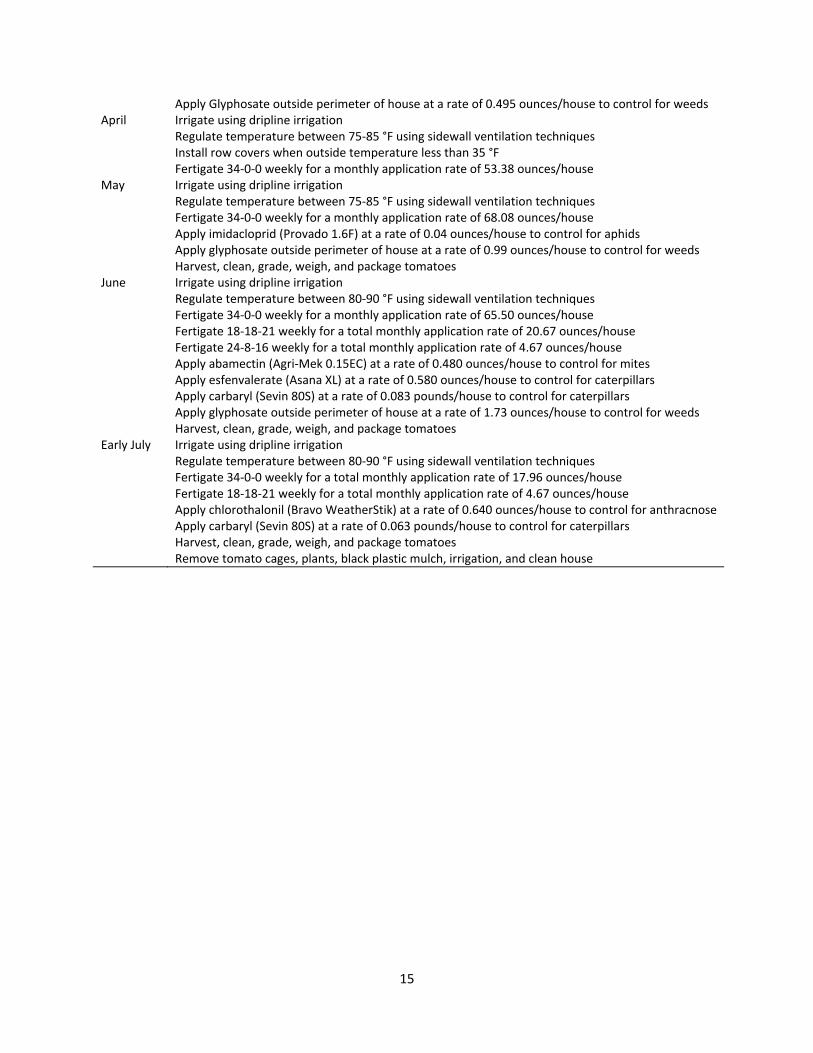
15
Apply Glyphosate outside perimeter of house at a rate of 0.495 ounces/house to control for weeds April Irrigate using dripline irrigation
Regulate temperature between 75-85 °F using sidewall ventilation techniques Install row covers when outside temperature less than 35 °F Fertigate 34-0-0 weekly for a monthly application rate of 53.38 ounces/house
May Irrigate using dripline irrigation Regulate temperature between 75-85 °F using sidewall ventilation techniques Fertigate 34-0-0 weekly for a monthly application rate of 68.08 ounces/house Apply imidacloprid (Provado 1.6F) at a rate of 0.04 ounces/house to control for aphids Apply glyphosate outside perimeter of house at a rate of 0.99 ounces/house to control for weeds Harvest, clean, grade, weigh, and package tomatoes
June Irrigate using dripline irrigation Regulate temperature between 80-90 °F using sidewall ventilation techniques Fertigate 34-0-0 weekly for a monthly application rate of 65.50 ounces/house Fertigate 18-18-21 weekly for a total monthly application rate of 20.67 ounces/house Fertigate 24-8-16 weekly for a total monthly application rate of 4.67 ounces/house Apply abamectin (Agri-Mek 0.15EC) at a rate of 0.480 ounces/house to control for mites Apply esfenvalerate (Asana XL) at a rate of 0.580 ounces/house to control for caterpillars Apply carbaryl (Sevin 80S) at a rate of 0.083 pounds/house to control for caterpillars Apply glyphosate outside perimeter of house at a rate of 1.73 ounces/house to control for weeds Harvest, clean, grade, weigh, and package tomatoes
Early July Irrigate using dripline irrigation Regulate temperature between 80-90 °F using sidewall ventilation techniques Fertigate 34-0-0 weekly for a total monthly application rate of 17.96 ounces/house Fertigate 18-18-21 weekly for a total monthly application rate of 4.67 ounces/house Apply chlorothalonil (Bravo WeatherStik) at a rate of 0.640 ounces/house to control for anthracnose Apply carbaryl (Sevin 80S) at a rate of 0.063 pounds/house to control for caterpillars Harvest, clean, grade, weigh, and package tomatoes Remove tomato cages, plants, black plastic mulch, irrigation, and clean house
16
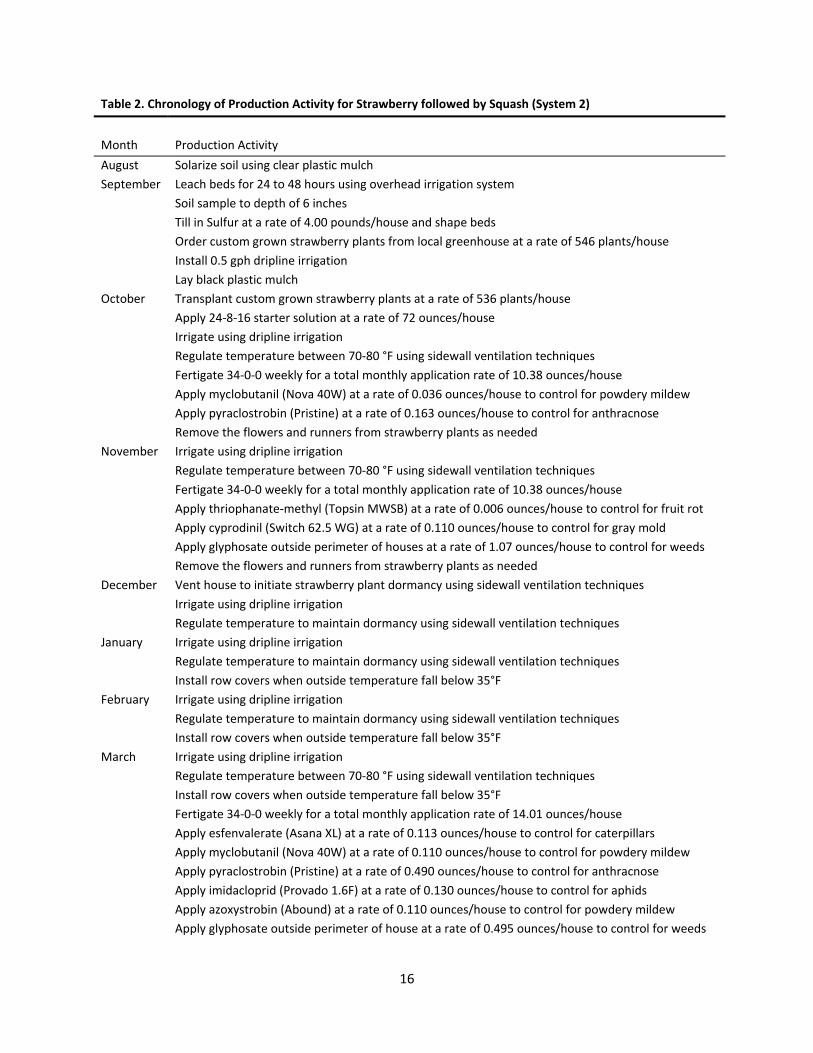
Table 2. Chronology of Production Activity for Strawberry followed by Squash (System 2)
Month Production Activity
August Solarize soil using clear plastic mulch
September Leach beds for 24 to 48 hours using overhead irrigation system
Soil sample to depth of 6 inches
Till in Sulfur at a rate of 4.00 pounds/house and shape beds
Order custom grown strawberry plants from local greenhouse at a rate of 546 plants/house
Install 0.5 gph dripline irrigation
Lay black plastic mulch
October Transplant custom grown strawberry plants at a rate of 536 plants/house
Apply 24-8-16 starter solution at a rate of 72 ounces/house
Irrigate using dripline irrigation
Regulate temperature between 70-80 °F using sidewall ventilation techniques
Fertigate 34-0-0 weekly for a total monthly application rate of 10.38 ounces/house
Apply myclobutanil (Nova 40W) at a rate of 0.036 ounces/house to control for powdery mildew
Apply pyraclostrobin (Pristine) at a rate of 0.163 ounces/house to control for anthracnose
Remove the flowers and runners from strawberry plants as needed
November Irrigate using dripline irrigation
Regulate temperature between 70-80 °F using sidewall ventilation techniques
Fertigate 34-0-0 weekly for a total monthly application rate of 10.38 ounces/house
Apply thriophanate-methyl (Topsin MWSB) at a rate of 0.006 ounces/house to control for fruit rot
Apply cyprodinil (Switch 62.5 WG) at a rate of 0.110 ounces/house to control for gray mold
Apply glyphosate outside perimeter of houses at a rate of 1.07 ounces/house to control for weeds
Remove the flowers and runners from strawberry plants as needed
December Vent house to initiate strawberry plant dormancy using sidewall ventilation techniques
Irrigate using dripline irrigation
Regulate temperature to maintain dormancy using sidewall ventilation techniques
January Irrigate using dripline irrigation
Regulate temperature to maintain dormancy using sidewall ventilation techniques
Install row covers when outside temperature fall below 35°F
February Irrigate using dripline irrigation
Regulate temperature to maintain dormancy using sidewall ventilation techniques
Install row covers when outside temperature fall below 35°F
March Irrigate using dripline irrigation
Regulate temperature between 70-80 °F using sidewall ventilation techniques
Install row covers when outside temperature fall below 35°F
Fertigate 34-0-0 weekly for a total monthly application rate of 14.01 ounces/house
Apply esfenvalerate (Asana XL) at a rate of 0.113 ounces/house to control for caterpillars
Apply myclobutanil (Nova 40W) at a rate of 0.110 ounces/house to control for powdery mildew
Apply pyraclostrobin (Pristine) at a rate of 0.490 ounces/house to control for anthracnose
Apply imidacloprid (Provado 1.6F) at a rate of 0.130 ounces/house to control for aphids
Apply azoxystrobin (Abound) at a rate of 0.110 ounces/house to control for powdery mildew
Apply glyphosate outside perimeter of house at a rate of 0.495 ounces/house to control for weeds
17
April Irrigate using dripline irrigation
Regulate temperature between 70-80 °F using sidewall ventilation techniques
Install row covers when outside temperature fall below 35°F
Fertigate 34-0-0 weekly for a monthly application rate of 32.46 ounces/house
Apply fenhexamid (Elevate 50WDG) at a rate of 0.080 pounds/house to control for fruit rot
Apply pyraclostrobin (Pristine) at a rate of 0.490 ounces/house to control for anthracnose
Apply imidacloprid (Provado 1.6F) at a rate of 0.130 ounces/house to control for aphids
Apply thriophanate-methyl (Topsin MWSB) at a rate of 0.006 ounces/house to control for fruit rot
Apply cyprodinil (Switch 62.5 WG) at a rate of 0.220 ounces/house to control for gray mold
Harvest, clean, grade, weigh, and package strawberries
Order custom grown squash plants (65 yellow/65 zucchini) from local greenhouse
Soil sample to depth of 6 inches
May Irrigate using dripline irrigation
Regulate temperature between 70-80 °F using sidewall ventilation techniques
Install row covers when outside temperature less than 35 °F
Apply esfenvalerate (Asana XL) at a rate of 0.113 ounces/house to control for caterpillars
Apply azoxystrobin (Abound) at a rate of 0.110 ounces/house to control for powdery mildew
Apply glyphosate outside perimeter of house at a rate of 0.49 ounces/house to control for weeds
Harvest, clean, grade, weigh, and package strawberries
Remove strawberry plants, black plastic mulch, irrigation, and clean house
Till in 34-0-0 at a rate of 0.33 pounds/house
Till in Sulfur at a rate of 2.00 pounds/house and shape beds
Reinstall 0.50 gph dripline irrigation
Transplant custom grown squash plants at a rate of 60 yellow and 60 zucchini plants/house
Apply 24-8-16 starter solution at a rate of 36 ounces/house
Apply glyphosate outside perimeter of house at a rate of 0.24 ounces/house to control for weeds
June Irrigate using dripline irrigation
Regulate temperature between 80-90 °F using sidewall ventilation techniques
Fertigate 34-0-0 weekly for a monthly application rate of 36.00 ounces/house
Apply pyraclostrobin (Pristine) at a rate of 0.01 ounces/house to control for powdery mildew
Apply carbaryl (Sevin 80S) at a rate of 0.050 pounds/house to control for squash bugs
Apply glyphosate outside perimeter of house at a rate of 0.866 ounces/house to control for weeds
Harvest, clean, grade, and weigh squash
Early July Irrigate using dripline irrigation
Regulate temperature between 80-90 °F using sidewall ventilation techniques
Fertigate 34-0-0 weekly for a monthly application rate of 18.73 ounces/house
Apply esfenvalerate (Asana XL) at a rate of 0.11 ounces/house to control for caterpillars
Apply myclobutanil (Nova 40W) at a rate of 0.07 ounces/house to control for powdery mildew
Apply carbaryl (Sevin 80S) at a rate of 0.05 pounds/house to control for squash bugs
Apply thriophanate-methyl (Topsin MWSB) at a rate of 0.01 ounces/house to control for powdery mildew
Harvest, clean, grade, and weigh squash
Remove squash plants, irrigation and clean house

18
Table 3. Marketable Yields by System, Crop and Production Year (pounds/house)
System 1 System 2
Growing Yellow Zucchini Season Spinach Tomato Strawberry Squash Squash
2007/08 695.18 (287) 1817.37 (381) 820.41 (25) 256.79 (17) 152.88 (19) 2008/09 597.85 (281) 2106.99 (95) 363.66 (48) 497.69 (56) 453.39 (105) 2009/10 650.78 (290) 1828.63 (42) 369.42 (65) 601.81 (57) 347.67 (43) Average 647.94 (226) 1917.66 (229) 517.83 (237) 452.10 (162) 317.98 (146)
Numbers in parenthesis are standard deviations.

19
Table 4. Labor by Production Activity, System and Crop (hours/house)
System 1 System 2
Production activity
Spinach
Tomato
Strawberry
Yellow Squash
Zucchini Squash
Preplant 8.72 7.67 17.54 1.07 1.07 Planting 2.23 1.95 5.61 0.58 0.58 Post planting crop care 17.38 27.39 20.97 10.14 10.14 Hoop house maintenance 4.34 6.92 7.03 0.78 0.78 Crop harvest 35.31 15.30 13.69 3.44 3.01 Cleaning and packaging 7.77 5.78 6.98 1.09 0.97 Post crop cleanup 4.20 7.48 5.65 1.59 1.59 Total 79.95 72.49 77.47 18.69 18.14

20
Table 5. Expected Operating and Fixed Expenses for Depreciable Assets ($/house)
System 1 System 2
Yellow Zucchini Expense Category Spinach Tomato Strawberry Squash Squash
Cash Operating Expenses: Fertilizers (N, P, K) 5.68 29.17 10.46 5.75 5.75 Seeds and plants 65.96 156.43 365.33 24.93 27.33 Pesticides and herbicides 3.95 6.04 10.98 1.84 1.84 Packaging supplies 71.27 57.53 144.99 13.56 9.54 Labor 599.55 528.94 582.30 140.00 136.10 Interest on operating expenses 18.57 11.68 37.00 1.24 1.20 Total Operating Expenses 764.98 789.79 1151.06 187.32 181.76
Fixed Costs for Depreciable Assets: House, beds, plastic, and windbreaks 587.58 345.08 792.76 69.95 69.95 Work truck (50% allocation) 420.00 246.67 566.67 50.00 50.00 Tiller, sprayers and other equipment 78.43 137.85 85.05 20.24 20.24 Irrigation system 26.53 62.02 62.42 6.10 6.10 Harvest and cleaning equipment 41.10 22.20 22.20 11.10 11.10 Miscellaneous tools and equipment 49.15 48.17 69.25 14.03 14.03 Total Fixed Expenses 1202.79 861.99 1598.35 171.42 171.42 Total Operating Plus Fixed Expenses 1967.77 1651.78 2749.41 358.74 353.18

21
Table 6. Breakeven prices by Crop and Assumption Scenarios for Percent of Marketable Yield Sold and Labor Expense ($/pound)
System 1 System 2
% Marketable Yield Sold/ Labor Expense Scenario
Yellow Zucchini Spinach Tomato Strawberry Squash Squash
SC1: 100%/with labor 3.04 0.86 5.31 0.79 1.11 SC2: 75%/with labor 4.05 1.15 7.08 1.06 1.48 SC3: 50%/with labor 6.07 1.72 10.62 1.59 2.22
SC4: 100%/without labor 2.11 0.59 4.18 0.48 0.68 SC5: 75%/without labor 2.82 0.78 5.58 0.65 0.91 SC6: 50%/without labor 4.22 1.17 8.37 0.97 1.37

22
Table 7. Breakeven Prices by Crop and Assumption Scenario for Percent of Marketable Yield Sold, Labor Expense, and Expected Prices Received at Market ($/pound)
System 1 System 2 % Marketable Yield Sold/Labor Expense/ Yellow Zucchini Expected Price Scenario Spinach Tomato Strawberry Squash Squash SC1: 100%/with labor/$3 strawberry ----- ----- 3.00 1.03 1.45 SC2: 100%/with labor/$4 strawberry ----- ----- 4.00 0.75 1.05 SC3: 50%/with labor/$3 strawberry ----- ----- 3.00 2.90 4.07 SC4: 50%/with labor/$4 strawberry ----- ----- 4.00 2.62 3.68 SC5: 50%/with labor/$5 strawberry ----- ----- 5.00 2.34 3.29
SC6: 100%/without labor/$3 strawberry ----- ----- 3.00 0.57 0.80 SC7: 100%/without labor/$4 strawberry ----- ----- 4.00 0.29 0.40 SC8: 50%/without labor/$3 strawberry ----- ----- 3.00 1.97 2.77 SC9: 50%/without labor/$4 strawberry ----- ----- 4.00 1.69 2.38 SC10: 50%/without labor/$5 strawberry ----- ----- 5.00 1.41 1.99
SC11: 100%/with labor/$2 spinach 2.00 1.21 ----- ----- ----- SC12: 50% /with labor/$2 spinach 2.00 3.10 ----- ----- ----- SC13: 50% /with labor/$3 spinach 3.00 2.76 ----- ----- ----- SC14: 50% /with labor/$4 spinach 4.00 2.42 ----- ----- -----
SC15: 100%/without labor/$2 spinach 2.00 0.62 ----- ----- ----- SC16: 50% /without labor/$2 spinach 2.00 1.92 ----- ----- ----- SC17: 50% /without labor/$3 spinach 3.00 1.58 ----- ----- ----- SC18: 50% /without labor/$4 spinach 4.00 1.25 ----- ----- -----