economic outlook march 2012 economic policy division
TRANSCRIPT

Economic OutlookMarch 2012
Economic Policy Division
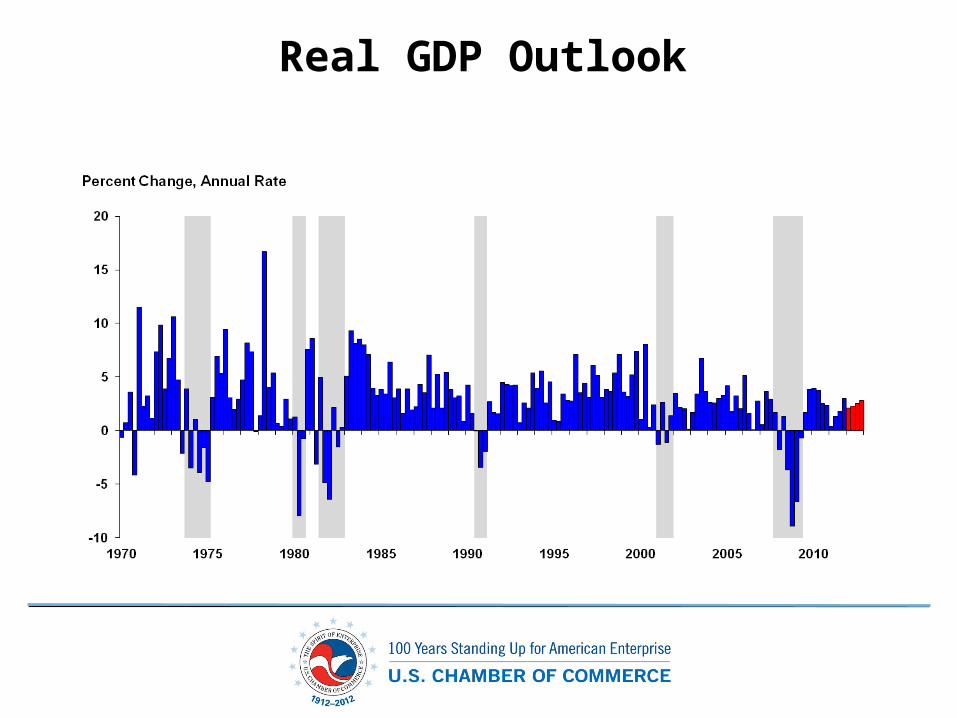
Real GDP Outlook
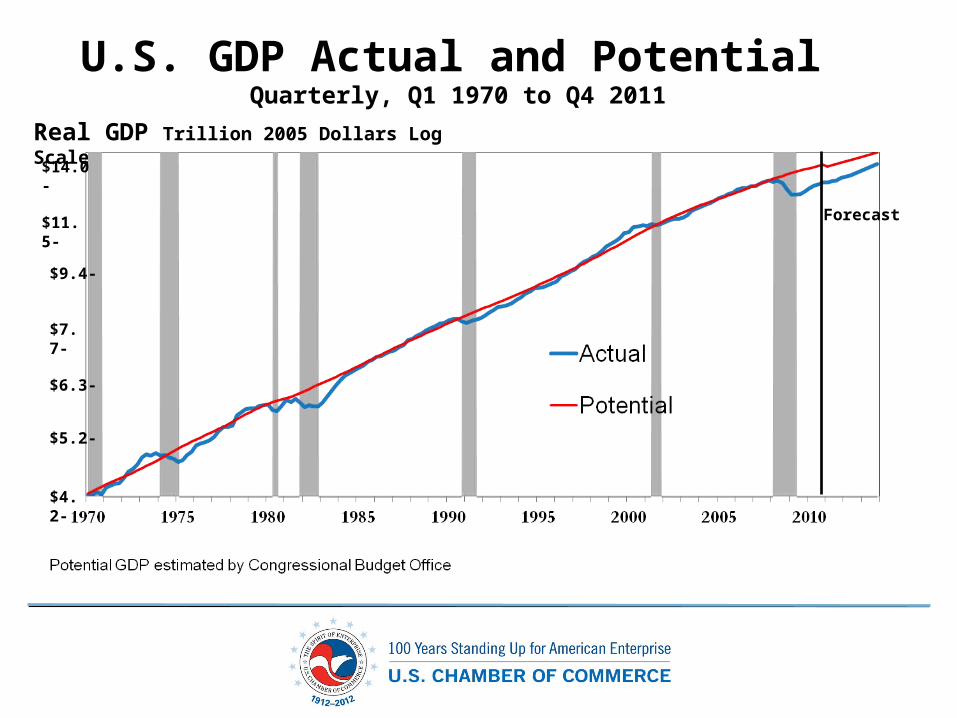
U.S. GDP Actual and Potential Quarterly, Q1 1970 to Q4 2011
Real GDP Trillion 2005 Dollars Log Scale
$5.2-
$11.5-
$7.7-
$4.2-
$14.0-
$9.4-
$6.3-
Forecast

Real Personal Consumption Expenditures
Real Disposable Income Per Capita
Household Wealth
Personal Consumption Outlook
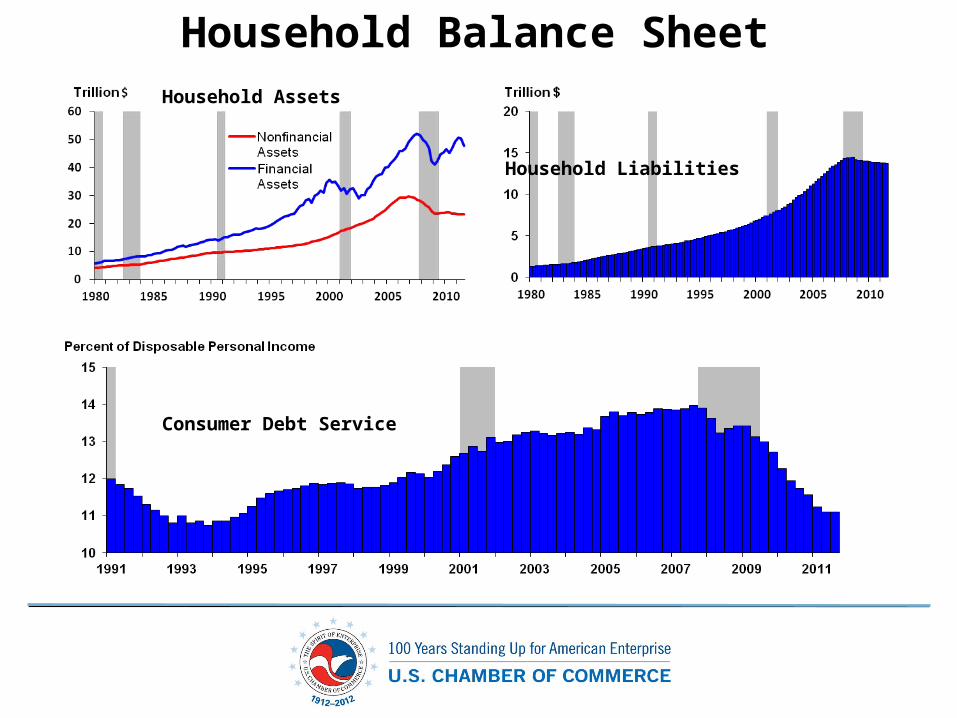
Consumer Debt Service
Household Liabilities
Household Assets
Household Balance Sheet
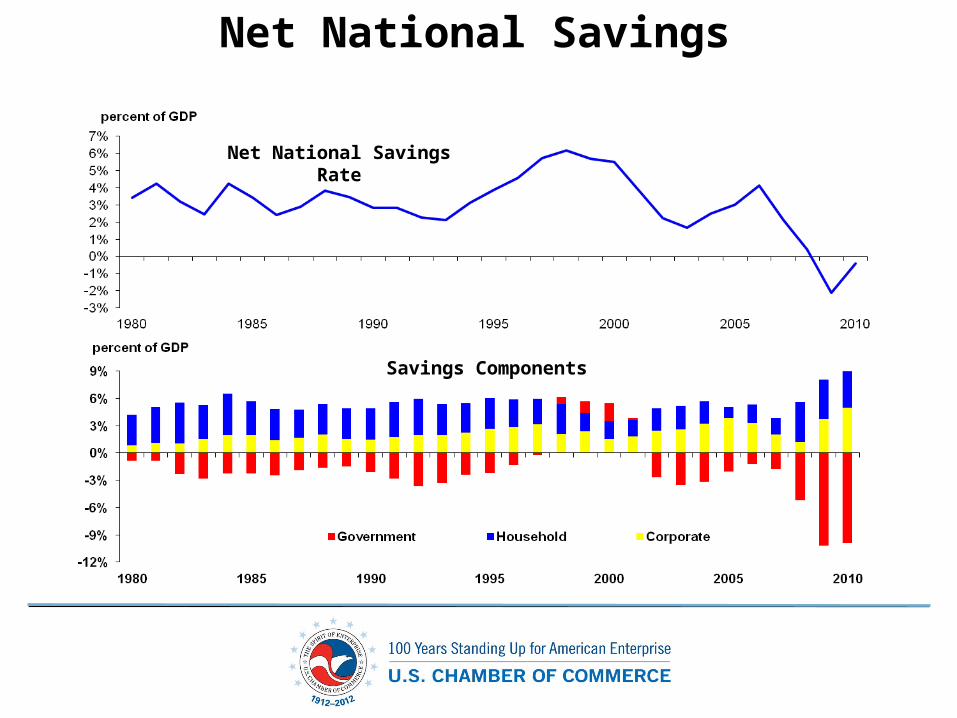
Net National Savings
Net National Savings Rate
Savings Components

Housing Market Trends
Housing Starts
Median Home Prices
Housing Inventory
Home Sales
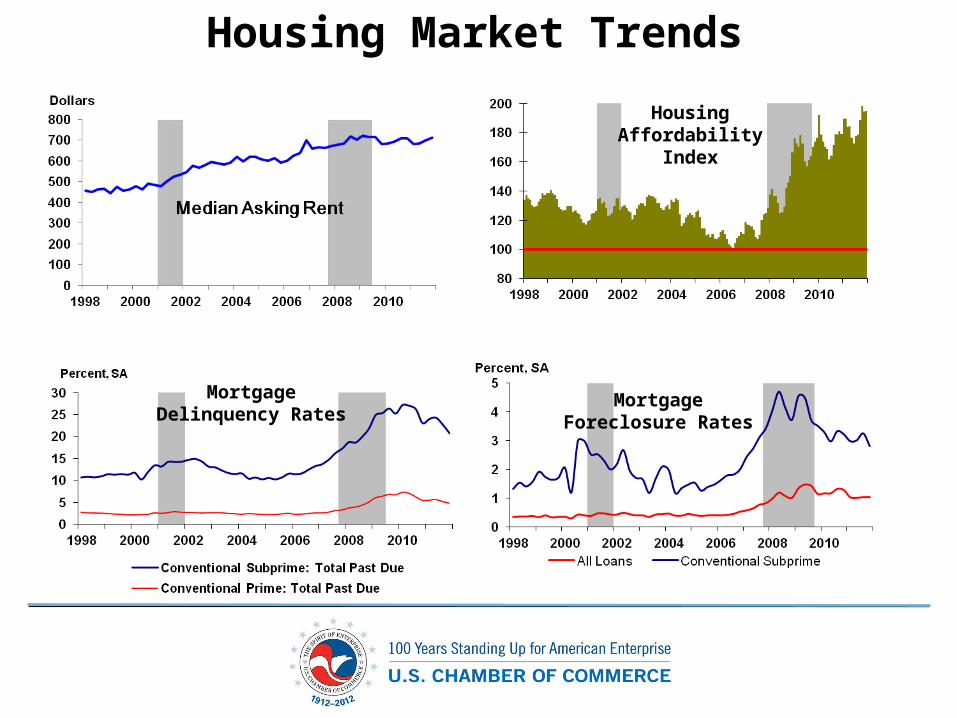
Housing Market Trends
Mortgage Delinquency Rates
Mortgage Foreclosure Rates
Housing Affordability Index

Investment
Real Private Investment in Equipment &
Software
Real Private Investment - Structures
Real Change in Private
Inventories
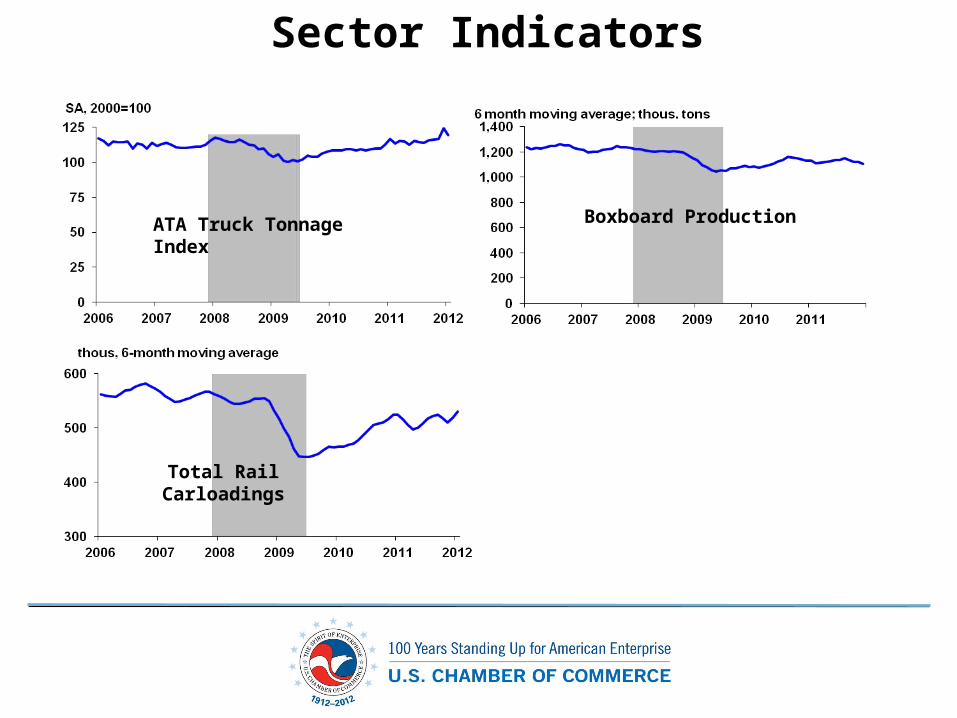
Sector Indicators
ATA Truck Tonnage Index
Total Rail Carloadings
Boxboard Production

U.S. Trade
Real Net Exports of Goods and Services
U.S. Nominal Trade Weighted Exchange
Rate

Labor Market
Total Nonfarm Jobs
Initial Unemployment
Claims
Unemployment Rate January: 8.3
percent
Household Employment

Civilian Participation
Rate
Duration of Unemployment
Part-time for Economic Reasons
Discouraged Workers
Labor Market
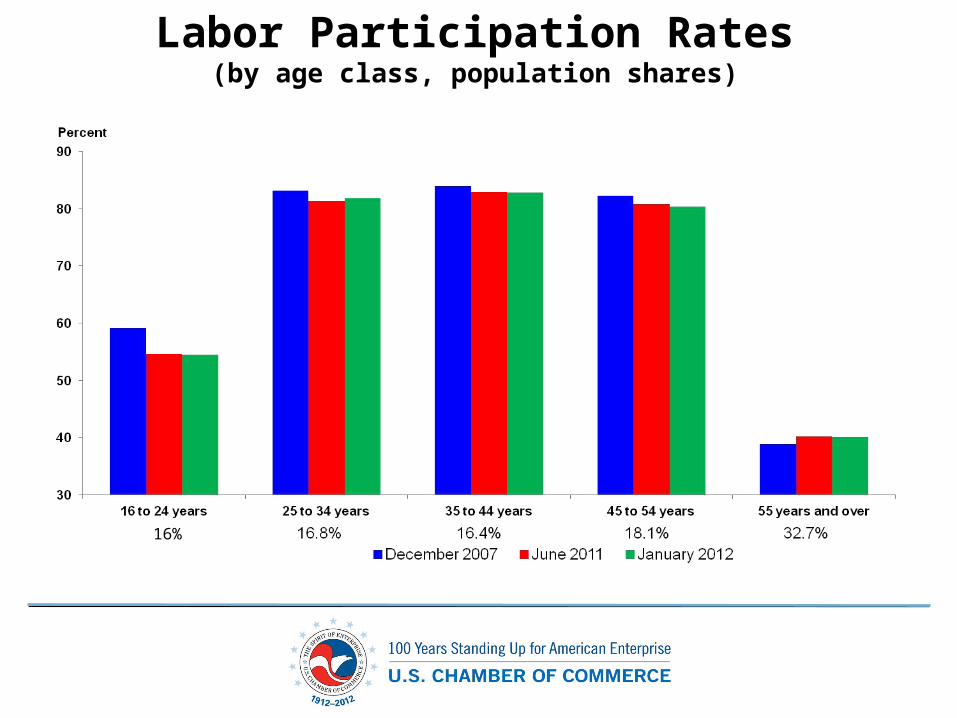
Labor Participation Rates(by age class, population shares)
16%
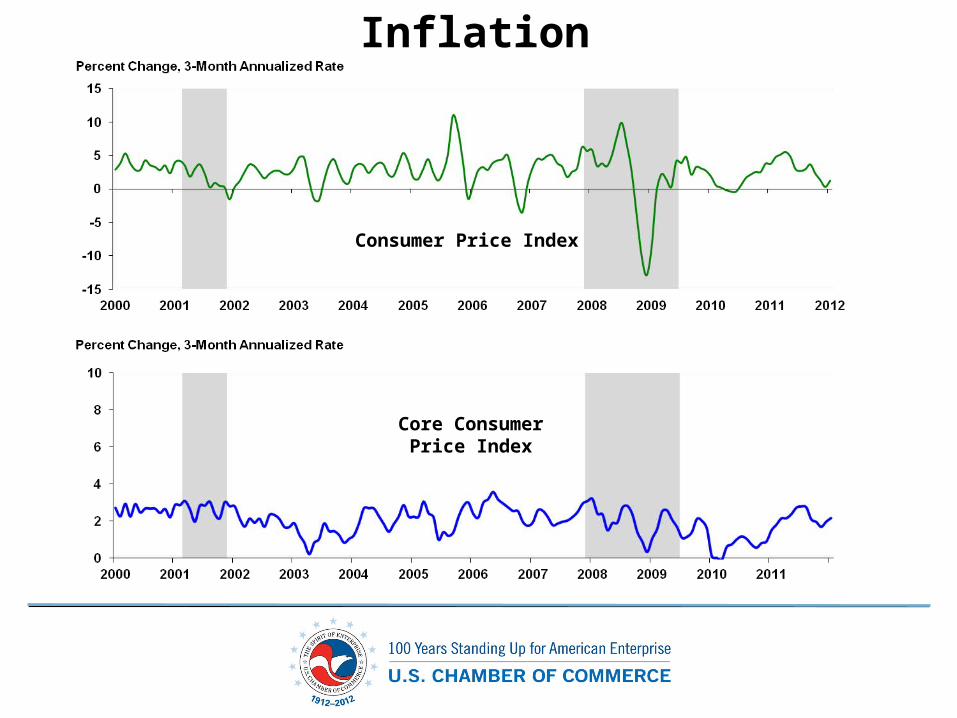
Inflation
Consumer Price Index
Core Consumer Price Index
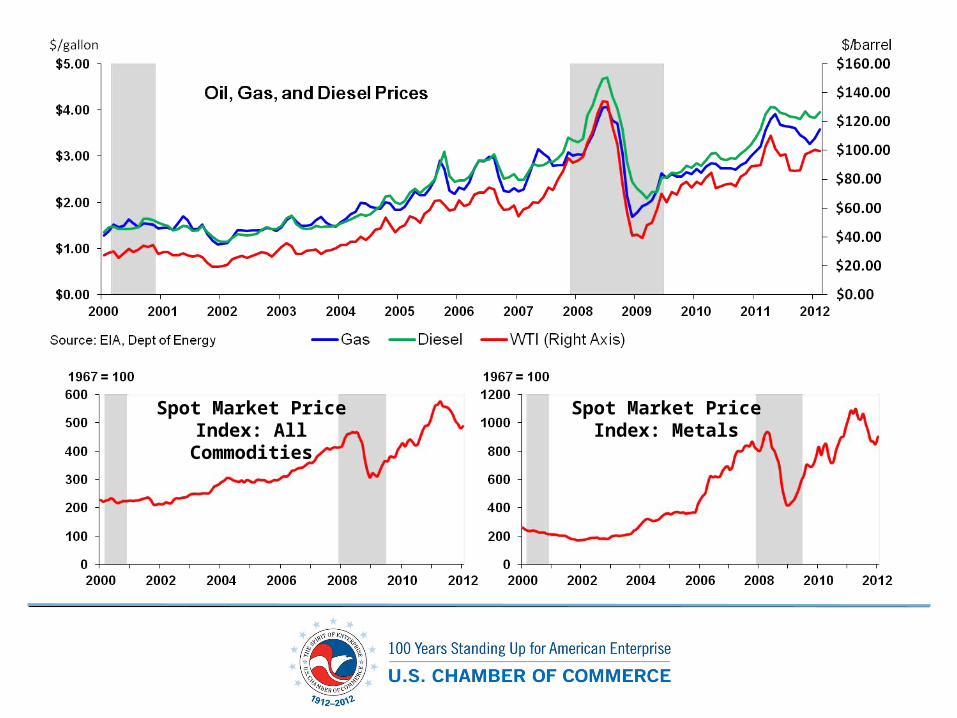
Spot Market Price Index: All
Commodities
Spot Market Price Index: Metals
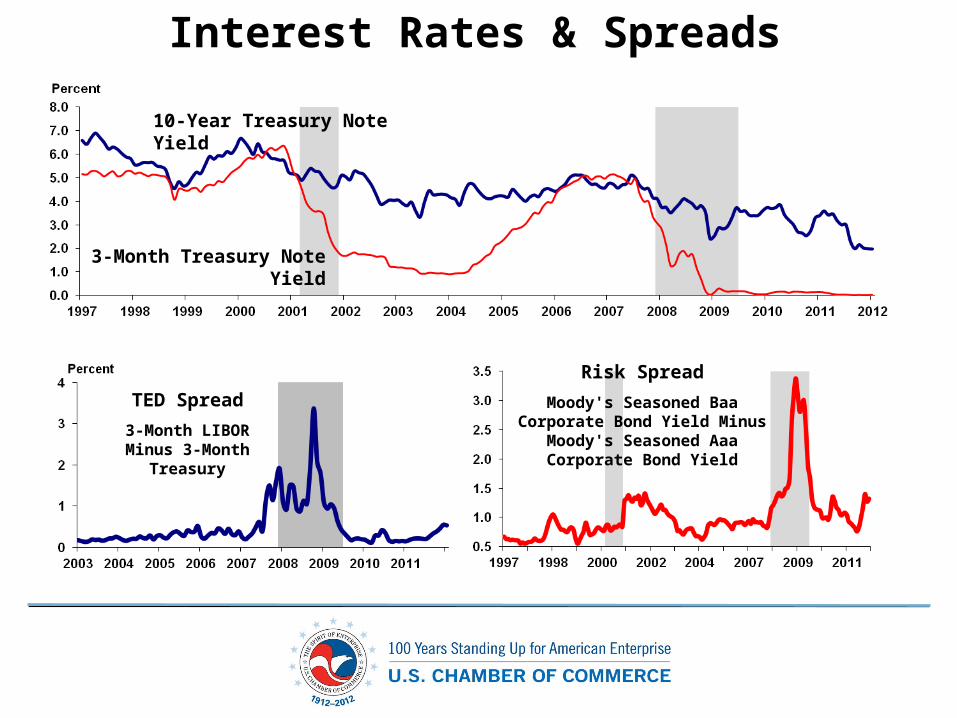
Interest Rates & Spreads
Risk Spread
Moody's Seasoned Baa Corporate Bond Yield Minus
Moody's Seasoned Aaa Corporate Bond Yield
10-Year Treasury Note Yield
3-Month Treasury Note Yield
TED Spread
3-Month LIBOR Minus 3-Month
Treasury

Fed Policy
Bank Assets and Liabilities
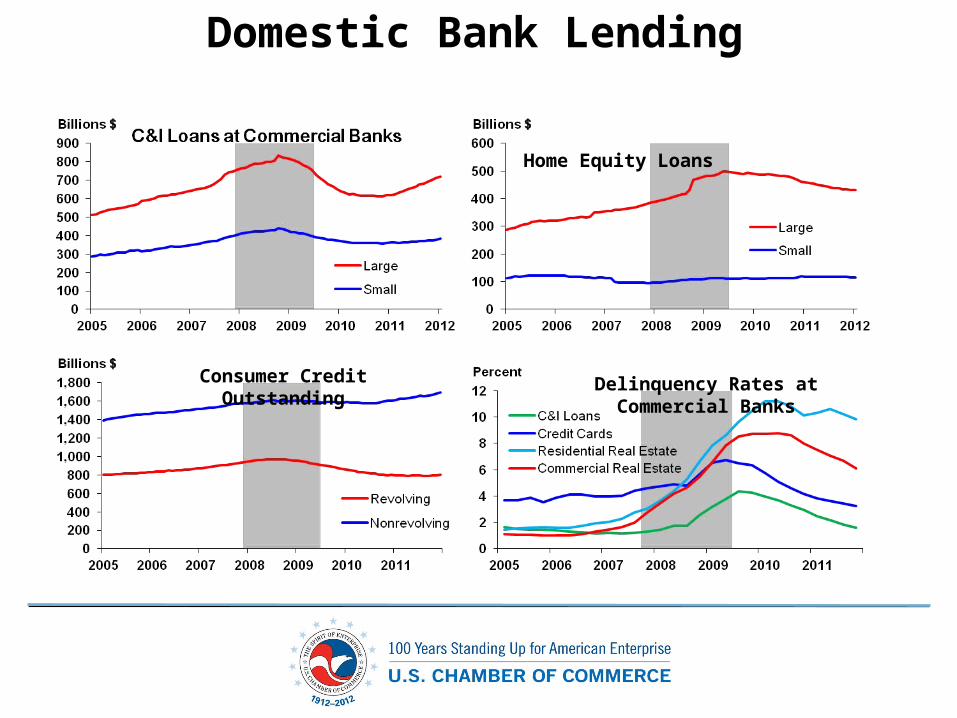
Delinquency Rates at Commercial Banks
Consumer Credit Outstanding
Domestic Bank Lending
Home Equity Loans

-15
-10
-5
0
5
1980 1982 1984 1986 1988 1990 1992 1994 1996 1998 2000 2002 2004 2006 2008 2010 2012 2014 2016 2018 2020 2022
Percent of GDP Deficit to GDP
-2,000
-1,500
-1,000
-500
0
500
1980 1982 1984 1986 1988 1990 1992 1994 1996 1998 2000 2002 2004 2006 2008 2010 2012 2014 2016 2018 2020 2022
Billions $ Budget Deficit
CBO’s Baseline Deficit
(January 2012)

Alternative Deficit Forecasts
ForecastBudget Deficit
Forecast

0
20
40
60
80
1980 1982 1984 1986 1988 1990 1992 1994 1996 1998 2000 2002 2004 2006 2008 2010 2012 2014 2016 2018 2020 2022
Percent of GDP
Debt to GDP
0
5,000
10,000
15,000
20,000
1980 1982 1984 1986 1988 1990 1992 1994 1996 1998 2000 2002 2004 2006 2008 2010 2012 2014 2016 2018 2020 2022
Billions $Debt
Government Baseline Debt
(CBO’s Baseline – January 2012)
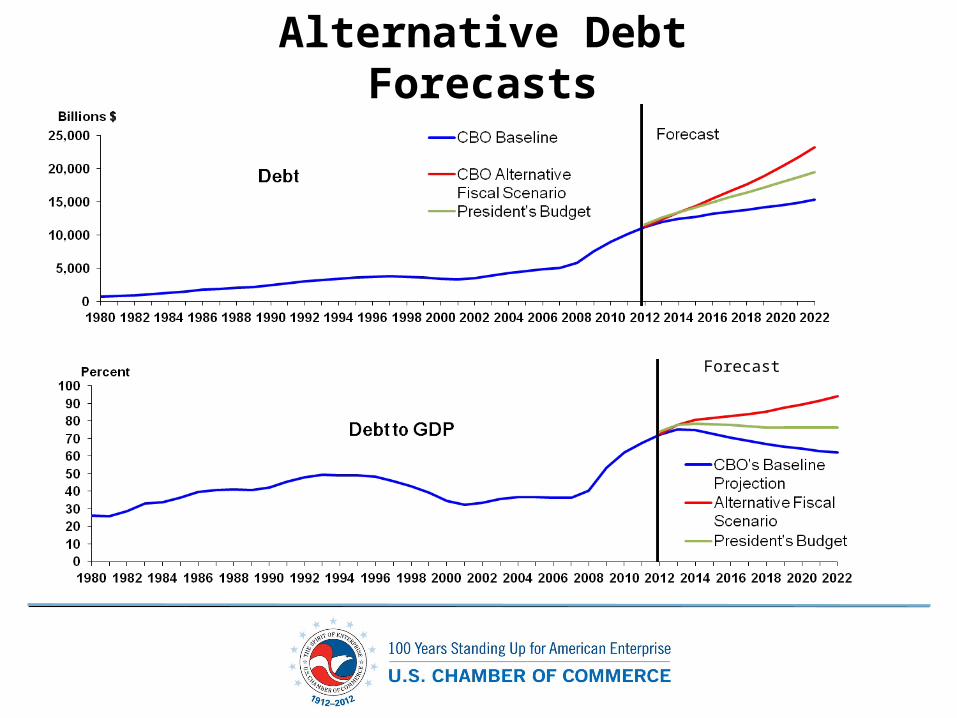
Alternative Debt Forecasts
Forecast

Government Revenues and Outlays( percent of GDP)
Source: CBO Baseline (January 2012)