economic implications of cotton production …ijecm.co.uk/wp-content/uploads/2015/11/31149.pdf ·...
TRANSCRIPT

International Journal of Economics, Commerce and Management United Kingdom Vol. III, Issue 11, November 2015
Licensed under Creative Common Page 726
http://ijecm.co.uk/ ISSN 2348 0386
ECONOMIC IMPLICATIONS OF COTTON PRODUCTION IN
NAUSHAHRO FEROZE DISTRICT, SINDH PROVINCE, PAKISTAN
Ghulam Raza Sargani
Ph.D. Student, College of Economics and Management,
Huazhong Agricultural University, Wuhan, PR China
Deyi Zhou
Professor, College of Economics and Management,
Huazhong Agricultural University, Wuhan, PR China
Mumtaz Joyo
Assistant Professor, SAU, Tando Jam, Sindh, Pakistan
Sanaullah Noonari
Assistant Professor, SAU, Tando Jam, Sindh, Pakistan
Habibullah Rajpar
Ph.D. Student, College of Public Administration,
Huazhong Agricultural University, Wuhan, PR China
Abdullah Shalmani
M.Sc Student, College of Economics and Management,
Huazhong Agricultural University, Wuhan, PR China

International Journal of Economics, Commerce and Management, United Kingdom
Licensed under Creative Common Page 727
Abstract
The present study was designed to explore the important factors that affecting cotton production
such as socio-economic conditions of cotton growers which affect the yield directly. The data on
various cost items including land, labour, and capital inputs, marketing costs and physical and
revenue productivity, net return, input-output ratio and cost-benefit ratios and farm sizes during
the year 2010-11, were collected from 60 selected cotton farmers for this purpose, from different
villages of district N.Feroze by using multi-stages cluster sampling survey method. The poor
production implies implications that the, illiteracy, ignorance, inadequate canal water, insect pest
and poor extension services soil quality implications of various inputs like cultivation, seed and
sowing, irrigation, inter-culturing / hoeing ,fertilizer, plant protection, and labour cost on cotton
yield could be the causes to this low production due to lack of marketing facilities at village level,
less payment by the marketing agencies, high prices of inputs, lack of timely availability of
genuine fertilizers. The practical results indicated that significant increase in output of cotton in
the study area could be traced mainly to use of latest technology that plays the vital role in
cotton productivity enhancement.
Keywords: Agrieconomics, Cotton, productivity input-output cost-benefit, net returns, Pakistan
INTRODUCTION
Cotton (Gossypium: Hirsutum) is known as ‘white gold’ and important non-food cash crop lifeline
for the economy and is playing significantly role in the uplift of the economy is the principle
source of raw material for textile sector the largest agro-based industry. Pakistan is the 5th
largest producer, 4th largest consumer, 4th largest exporter yarn and 3rd largest exporter of raw
cotton, in the world. While cotton provides 45 percent employing of workforce and 60% foreign
exchange earnings, and is an occupation of more than 1.5 million farming families which
contributes to the exports of country in the form of raw , yarn cotton cloth and other by-products.
Cotton contributes 6.9 percent of value added in agriculture and 1.4 percent of GDP. (GOP,
2011).
Cotton cultivation in the province has been recorded on 611,000 acres this year which is
21,000 acres more than the target fixed by the federal government. The Kharif crops suffered a
loss of $4bn in foreign exchange earnings or 2.323 percent of the GDP, agriculture. Cotton
received a loss of 1.8 million bales, accounting for 1.8 percent of the GDP, Earlier the cotton
production target was set at 14.5 million bales for 2011-12 however almost 50 percent of the
cotton crop was intensively and extensively damaged by heavy rains and devastating floods in
Sindh and cotton production was reduce to 13 million bales for the year. Cotton growers have
© Ghulam, Deyi, Mumtaz, Sanaullah, Habibullah & Abdullah
Licensed under Creative Common Page 728
lost heavily as there quality of seed-cotton and the resultant lint have also been badly damaged;
seed-cotton was sold as low as Rs 1,500 per maund of 40 Kg ex-gin while lint cotton was sold
as low as Rs 3,500 per maund of 37.324 kg ex-gin. These rates are very below from production
cost. Due to this, Sindh has large unsold stocks of cotton to 33 percent of total arrivals. The fall
in seed-cotton prices were mainly due to lower economic activity caused by massive power load
shedding it was further compounded by cash flow problems with the ginners, creating a
bottleneck in bulk purchase of seed-cotton from farmers. In view of future forecast of world
supply and demand, cotton prices in the international market are likely to be higher than last
year. Similarly, the market price of seed-cotton is also expected to follow the same pattern in
view of the depressed demand for it (GOP, 2010).
Overall 32 percent cotton sown area of Tharparkar, Umerkot, Mirpurkhas, Sanghar,
Tando Allahyar, Badin, Tando Muhammad Khan, Kashmore-Kandhkot, Hyderabad, Matiari,
Jamshoro, Dadu, Shikarpur, Naushahro Feroze, Nawabshah, Khairpur, Sukkur and Ghotki
districts of Sindh province. The bales from Tando Adam in Sindh reportedly sold at Rs 1890 per
maund (37.32 kgs), while another 200 bales from the same station were said to have been sold
at Rs 1900 per maund; 400 bales from Benzirabad (Nawabshah) sold at Rs 1900 per maund,
500 bales Naushahro Feroze sold at Rs 1800 per maund; while 1000 bales from the Khairpur
district sold at Rs 1950 per maund. During 2009-10, the domestic price of seed-cotton was
reported at around Rs 1,900 per 40 kilograms in early season. However, the price started
sliding, particularly in November-December, and touched the level of Rs 1,300 per 40 kilograms
at some places the (Arshad, 2010).
The fall in the prices cotton was mostly due to lower economic activity caused by
massive power load shedding. It was further compounded by cash flow problems with the
ginners, creating a bottleneck in bulk purchase of cotton from farmers. In view of future forecast
of world supply and demand, cotton prices in the international market are likely to be higher than
last year. Similarly, the market price of seed-cotton is also expected to follow the same pattern
in view of the depressed demand for it (GOP, 2010).
Looking at the above facts and economic importance of cotton crop in our country the
study was designed to achieve following objectives.
To examine the status and growth of cotton production in Sindh and Pakistan.
To analyze the production cost of cotton crop in the study area.
To identify the production, marketing constraints in the study area.
To suggest policy measures & program initiatives for efficient cotton production.

International Journal of Economics, Commerce and Management, United Kingdom
Licensed under Creative Common Page 729
REVIEW OF LITERATURE
Dagistan et al. (2009) determined that the input and output involved in cotton production in the
Hatay province of Turkey. The cost of cotton production per acre is found to be 2 246 $ha-1 in
the region, with 79.87% of this being variable costs. It can be concluded that intensive cotton
farms are being operated in the area since the variable cost ratio is quite high. As a result of
benefit-cost ratio (1.24) analysis, cotton production is found to be economically efficient.
Javed et al. (2009) estimated that the technical, allocative and economic efficiency and
subsequently to investigate the determinants of technical, allocative and economic inefficiency
of cotton-wheat and rice-wheat farming systems in Pakistan. Technical, allocate and economic
production efficiency scores were estimated by a non-parametric data envelopment analysis
procedure. Technical, allocate and economic production inefficiency scores were separately
regressed on socio-economic and farm specific variables to identify the sources of technical,
allocate and economic production inefficiency using a Tobit regression model. The mean
technical, allocative and economic production efficiency calculated for the cotton wheat system
was 0.75, 0.44 and 0.37, respectively. Results of the study revealed that if sample farms in
cotton-wheat system operated at full efficiency level they could reduce their input use by 25%
and cost of production by 56 % without reducing the level of output and with the same
technology.
Khan and Chaudhry (2009) examined the factors affecting cotton production in Multan
region using primary source of data. The Cobb-Douglas Production Function is employed to
assess the effects of various inputs like cultivation, seed and sowing, irrigation, fertilizer, plant
protection, inter-culturing / hoeing and labour cost on cotton yield. The results depicted that
seed, fertilizer and irrigation were found scarce commodity for all category of farmers in district
Multan. The Cobb-Douglas Production Function results revealed that the coefficients for
cultivation (0.113) and seed (0.103) were found statistically significant at 1 percent level. The
Cost-Benefit Ratio for the large farmers was found higher (1.41) than that of small (1.22) and
medium (1.24) farmers. There is a dire need to ensure the availability of these scarce inputs by
both public and private sectors as these inputs were major requirement of the cotton crop.
Daniel et al. (2010) reported that the study examined the Net Income and efficiency of
resource use among cotton farmers Analysis of the sampled farmers showed that 86% of them
were youth which suggest that if proper attention is given to cotton cultivation, a lot of youth
would be gainfully employed. The results also revealed that 40% of the farmers did not attend
any formal school while 14% attended tertiary level of education. About 59% of the respondents
reported. The average cost and returns per acre of the cotton farmers was N46, 046.25 and
N56, 224.90 respectively Land, labour and seed have positive influence on farmers income and

© Ghulam, Deyi, Mumtaz, Sanaullah, Habibullah & Abdullah
Licensed under Creative Common Page 730
the first two significant at 1% and 10% levels respectively. Fertilizer, chemical and transportation
had negative influence on farmers’ income probably due to their escalating prices. The marginal
physical product analysis revealed that an extra acre of land acquired for cotton will result to an
increase of over one ton of cotton.
Khan and Akhtar (2011) studied provides cost-benefit analysis of cotton production and
processing by different stakeholders in Pakistan. In order to analyze the cost-benefit analysis,
Multan and Bahawalpur regions were selected as study area since majority of the cotton
producers are living herein. It has been identified that spinners and ginners have an incentive in
the shape of profit to raise their production. Basing on the study, it is recommended that the
Government of Pakistan should support the cotton producer by giving subsidies in the inputs
and with the help of support price system. By promoting productive capacities of grower, the
poverty can be reduced in the study areas.
METHODOLOGY
Planned strategy was used to study the area (Cotton production in district Naushahro Feroze
Sindh, Pakistan), type and number of respondents without which it would be an ineffective
effort. Therefore, it is essential to define variables included in the research to make it more
scientific.
Research Design
The study was restricted generally to gather primary data from district Naushahro Feroze Sindh.
It was selected as the universe of the study because it represents a good case study for Cotton
production activities. The district is naturally gifted with fertile soil
Sample Size
The present study were sampled as multistage clustered sampling so that one taluka Kandiaro
from district Naushahro Feroze out of which 2 union councils Mohabat Dero and Kamal Dero
were selected in each union council three villages were selected and among each village
different number of farmers were randomly. The sample was supposed to contain Cotton
farmers. A sample size of 60 respondents was selected through multistage cluster sampling.
Questionnaire Development
Interview schedule was based on a well-designed and pretested questionnaire. Comprehensive
information was obtained face to face from the farmers involved in Cotton farming, business and

International Journal of Economics, Commerce and Management, United Kingdom
Licensed under Creative Common Page 731
documented by the interviewer. Questionnaire was prepared in English language while the
interview was taken in local language i.e. Siraiki and Sindhi.
Research Approach
Cost of production function
Y = f (Xn), Y= (X1, X2, X3, ……… ……Xn)
Where X1….n= per hectare input used
Arithmetic Mean
It is defined as value obtained by dividing the sum of all observations by their numbers.
Arithmetic mean or average can also be used for tabulated presentation of data.
A.M or Average = Xn ⁄ n
Where ∑= Total or Sum, Xn = Variables observations used in analysis. n = No. of observations.
Standard Deviation
Deviation of a data from its mean is called the standard deviation. If a deviation of it Mean is
squared then the resulting deviation is called standard deviation.
S.D = √ [(∑X-X*) / n]
Where X = Value of Observations, X* = Mean of a Variable, n= No. of observations.
√= Square Root and ∑ = Summation
Standard Error
Square root of standard deviation is called standard error
S. Error = (√ [(∑X-X*)/n])
Where X = Value of Observations, X* = Mean of a Variable & n= No. of observations
√= Square Root and ∑ = Summation
Percentages
Percentage is the proportion of fraction articulated in hundredth. It was computed by Percentage
= F / N* 100
Where, F =Respondents of desired class N* = Total number of respondents
Minimum & Maximum analysis Model
Y=ax+bx+c
© Ghulam, Deyi, Mumtaz, Sanaullah, Habibullah & Abdullah
Licensed under Creative Common Page 732
Data Analysis
Initially the data were arranged and organized in coding system. By using the coding sheet, all
the data were tabulated, summarized and analyzed through computer software SPSS
Descriptive statistics were uses to calculate interpret and discuss results and formulate the
recommendation. The data were summarized and presented in the form of tables.
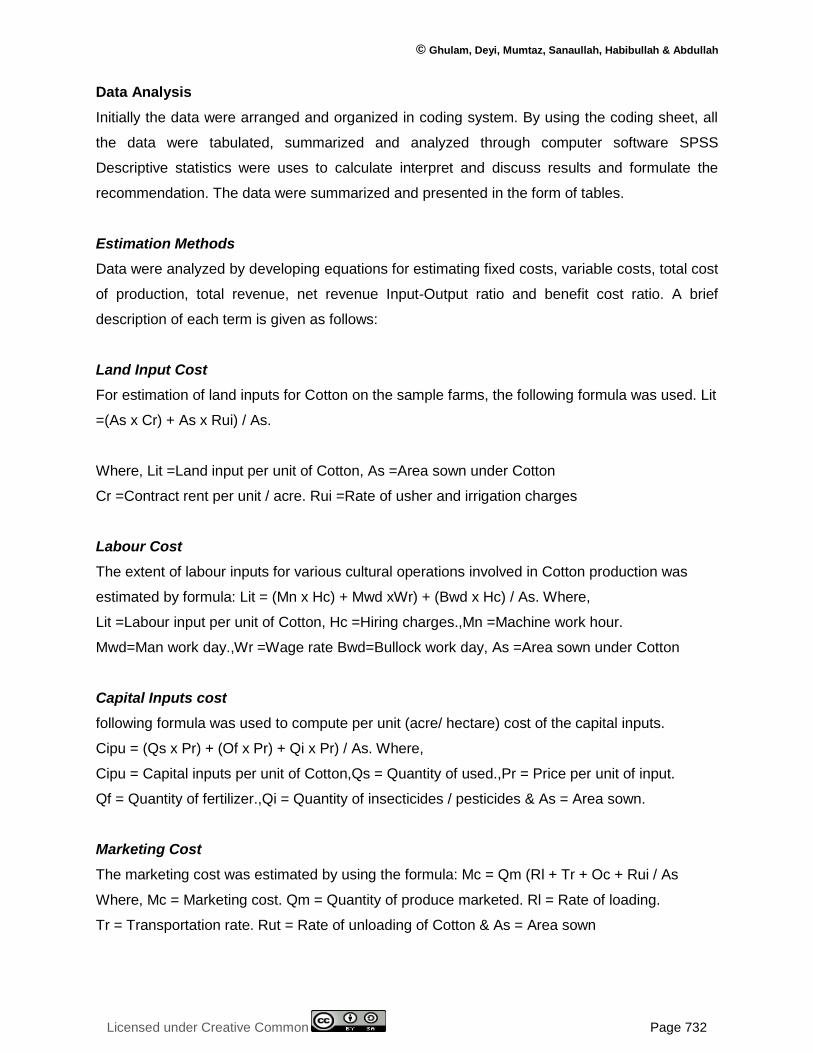
Estimation Methods
Data were analyzed by developing equations for estimating fixed costs, variable costs, total cost
of production, total revenue, net revenue Input-Output ratio and benefit cost ratio. A brief
description of each term is given as follows:
Land Input Cost
For estimation of land inputs for Cotton on the sample farms, the following formula was used. Lit
=(As x Cr) + As x Rui) / As.
Where, Lit =Land input per unit of Cotton, As =Area sown under Cotton
Cr =Contract rent per unit / acre. Rui =Rate of usher and irrigation charges
Labour Cost
The extent of labour inputs for various cultural operations involved in Cotton production was
estimated by formula: Lit = (Mn x Hc) + Mwd xWr) + (Bwd x Hc) / As. Where,
Lit =Labour input per unit of Cotton, Hc =Hiring charges.,Mn =Machine work hour.
Mwd=Man work day.,Wr =Wage rate Bwd=Bullock work day, As =Area sown under Cotton
Capital Inputs cost
following formula was used to compute per unit (acre/ hectare) cost of the capital inputs.
Cipu = (Qs x Pr) + (Of x Pr) + Qi x Pr) / As. Where,
Cipu = Capital inputs per unit of Cotton,Qs = Quantity of used.,Pr = Price per unit of input.
Qf = Quantity of fertilizer.,Qi = Quantity of insecticides / pesticides & As = Area sown.
Marketing Cost
The marketing cost was estimated by using the formula: Mc = Qm (Rl + Tr + Oc + Rui / As
Where, Mc = Marketing cost. Qm = Quantity of produce marketed. Rl = Rate of loading.
Tr = Transportation rate. Rut = Rate of unloading of Cotton & As = Area sown

International Journal of Economics, Commerce and Management, United Kingdom
Licensed under Creative Common Page 733
Total Cost of Production
Total cost of production was estimated by using formula: TC=TFC+TVC
Where, TC = Total Costs of Production
Estimation of Returns
Estimation of returns was developed by using formula: VP = (Qs x Pr) / As
Where, VP = Value of Product QS = Quantity Sold. Pr = Price per unit. & As = Area
Net Returns
Net returns were estimated by using formula: NR = TI- TC
Where, NR = Net Returns, TI = Total Income, TC = Total Cost
Input-Output Ratio
Input-output was estimated by using the formula: 𝐼𝑂𝑅 =T1
TC
Where IOR = Input-Output Ratio
Cost-Benefit Ratio
Cost-Benefit Ratio was estimated by using formula: 𝐶𝐵𝑅 =NR
TC
Where, CBR = Cost Benefit Ratio
EMPIRICAL RESULTS
Characteristics of Sample Cotton Growers
The knowledge of general environments the farmers are working in some selected socio-
economic characteristics of sample owner farmers are generally believed to take risk of
adoption of new technologies with uncertain outcomes. Others are of the view that owner-cum-
tenants are more innovative as they can share the risk with land owners. These arrangements
show the importance of information on land tenure system.
Table 1. Socio-Economic profile of cotton growers
Characteristics Average Standard Error
Age of respondent (years) 51.28 1.49
Formal education (years) 13.02 0.25
Farming experience (years) 28.6 1.6
© Ghulam, Deyi, Mumtaz, Sanaullah, Habibullah & Abdullah
Licensed under Creative Common Page 734
The information regarding socio-economic characteristics of the sample cotton grower is
presented in table-1. On an overall basis the average age of selected cotton growers was 51.28
years, implying that relatively senior members of farmer’s family were operating the farming
business and had 28.6 years of farming experience.
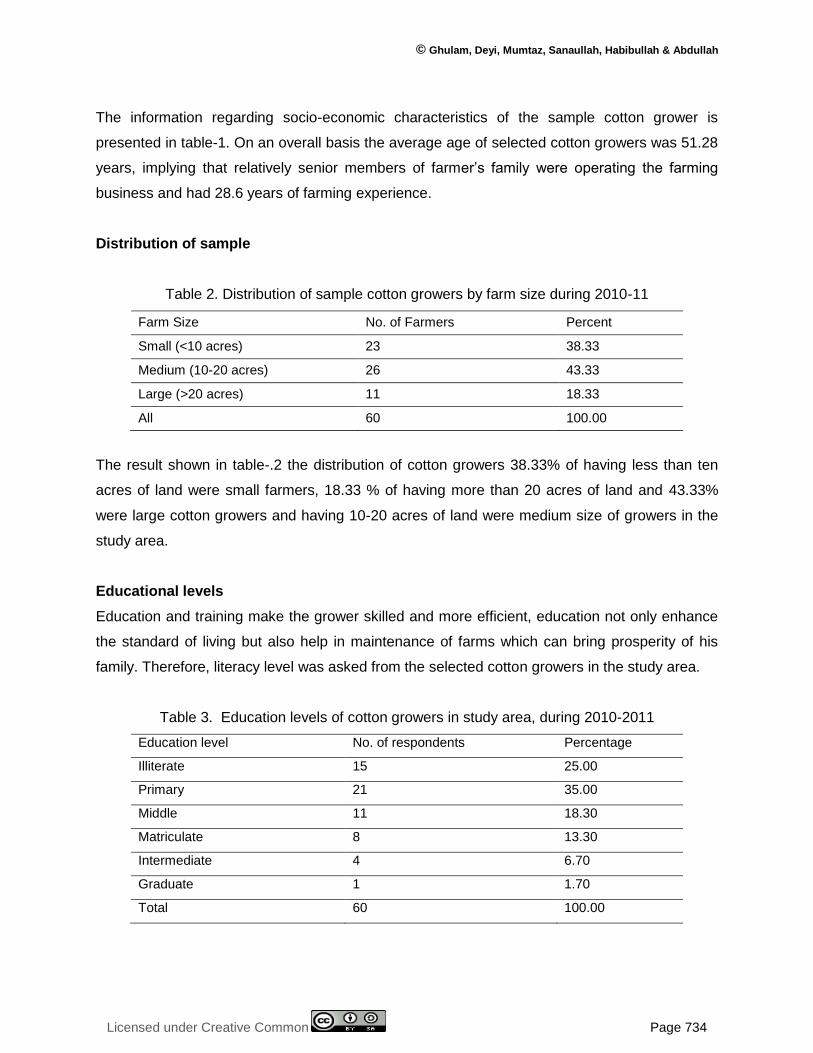
Distribution of sample
Table 2. Distribution of sample cotton growers by farm size during 2010-11
Farm Size No. of Farmers Percent
Small (<10 acres) 23 38.33
Medium (10-20 acres) 26 43.33
Large (>20 acres) 11 18.33
All 60 100.00
The result shown in table-.2 the distribution of cotton growers 38.33% of having less than ten
acres of land were small farmers, 18.33 % of having more than 20 acres of land and 43.33%
were large cotton growers and having 10-20 acres of land were medium size of growers in the
study area.
Educational levels
Education and training make the grower skilled and more efficient, education not only enhance
the standard of living but also help in maintenance of farms which can bring prosperity of his
family. Therefore, literacy level was asked from the selected cotton growers in the study area.
Table 3. Education levels of cotton growers in study area, during 2010-2011
Education level No. of respondents Percentage
Illiterate 15 25.00
Primary 21 35.00
Middle 11 18.30
Matriculate 8 13.30
Intermediate 4 6.70
Graduate 1 1.70
Total 60 100.00

International Journal of Economics, Commerce and Management, United Kingdom
Licensed under Creative Common Page 735
It was observed in table-3 that the education level of selected growers was in order of 35.00%
primary (5-years), 18.30% middle (8-years), 13.30% matriculate (10years) 6.70% intermediated
(12-years), 1.70% graduate beyond the 25.00% of cotton respondents were illiterate in the
study area.
Crop Seasons and Cropping Patterns
There are two main crop seasons; "Kharif" and "Rabi" in the study area. The Kharif season
starts from April-May and ends in October-November while the Rabi starts from November-
December and ends in April-May. However due to regional variation in temperature, several
factors i.e. varieties, availability of water, soil texture etc. determine the crop pattern, sowing and
harvesting time. Wheat, Cotton, Rice, Sugar-cane are the major crops of the district; Sorghum,
& Mustard, peas, Onion, Millet and Maize fall in the category of minor crops.
Table 4. Cropping patterns of sample cotton growers during 2010-11
Crops Percent area
Kharif Crops
Cotton 45.6
Rice 22.4
Sugarcane 15.2
Sorghum 5.6
Vegetables 6.8
Others 4.4
All 100.00
Rabi Crops
Wheat 74.4
Sugarcane 18.6
Barseem 5.8
Others 1.2
All 100.00
Cropping patterns in study area is shown in table 4. In Kharif season, rice, sugarcane, Sorghum
and cotton, were the major predominant crops with 22.4, 15.2, 5.6 and 45.6 % of the total
© Ghulam, Deyi, Mumtaz, Sanaullah, Habibullah & Abdullah
Licensed under Creative Common Page 736
cropped area, respectively. While wheat vegetables, barseem, maize had 74.4, 18.6, 5.8
percent respectively sizable share in the Rabi cropping pattern of sample cotton growers.
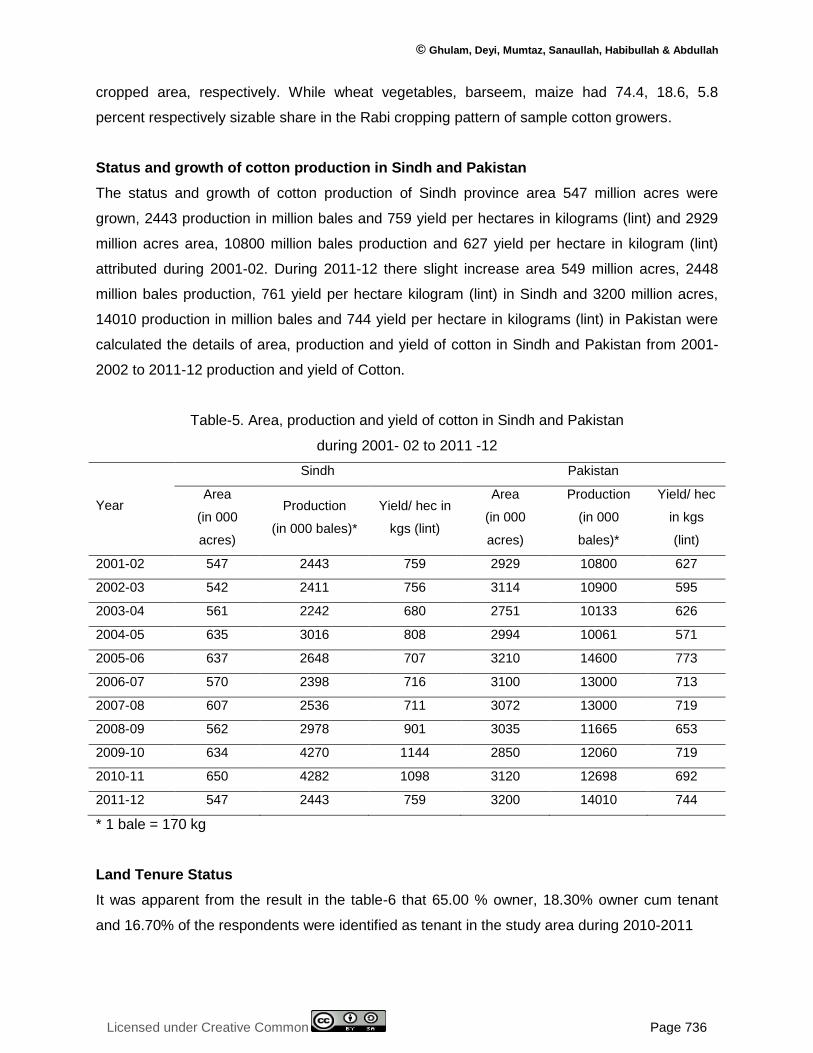
Status and growth of cotton production in Sindh and Pakistan
The status and growth of cotton production of Sindh province area 547 million acres were
grown, 2443 production in million bales and 759 yield per hectares in kilograms (lint) and 2929
million acres area, 10800 million bales production and 627 yield per hectare in kilogram (lint)
attributed during 2001-02. During 2011-12 there slight increase area 549 million acres, 2448
million bales production, 761 yield per hectare kilogram (lint) in Sindh and 3200 million acres,
14010 production in million bales and 744 yield per hectare in kilograms (lint) in Pakistan were
calculated the details of area, production and yield of cotton in Sindh and Pakistan from 2001-
2002 to 2011-12 production and yield of Cotton.
Table-5. Area, production and yield of cotton in Sindh and Pakistan
during 2001- 02 to 2011 -12
Year
Sindh Pakistan
Area
(in 000
acres)
Production
(in 000 bales)*
Yield/ hec in
kgs (lint)
Area
(in 000
acres)
Production
(in 000
bales)*
Yield/ hec
in kgs
(lint)
2001-02 547 2443 759 2929 10800 627
2002-03 542 2411 756 3114 10900 595
2003-04 561 2242 680 2751 10133 626
2004-05 635 3016 808 2994 10061 571
2005-06 637 2648 707 3210 14600 773
2006-07 570 2398 716 3100 13000 713
2007-08 607 2536 711 3072 13000 719
2008-09 562 2978 901 3035 11665 653
2009-10 634 4270 1144 2850 12060 719
2010-11 650 4282 1098 3120 12698 692
2011-12 547 2443 759 3200 14010 744
* 1 bale = 170 kg
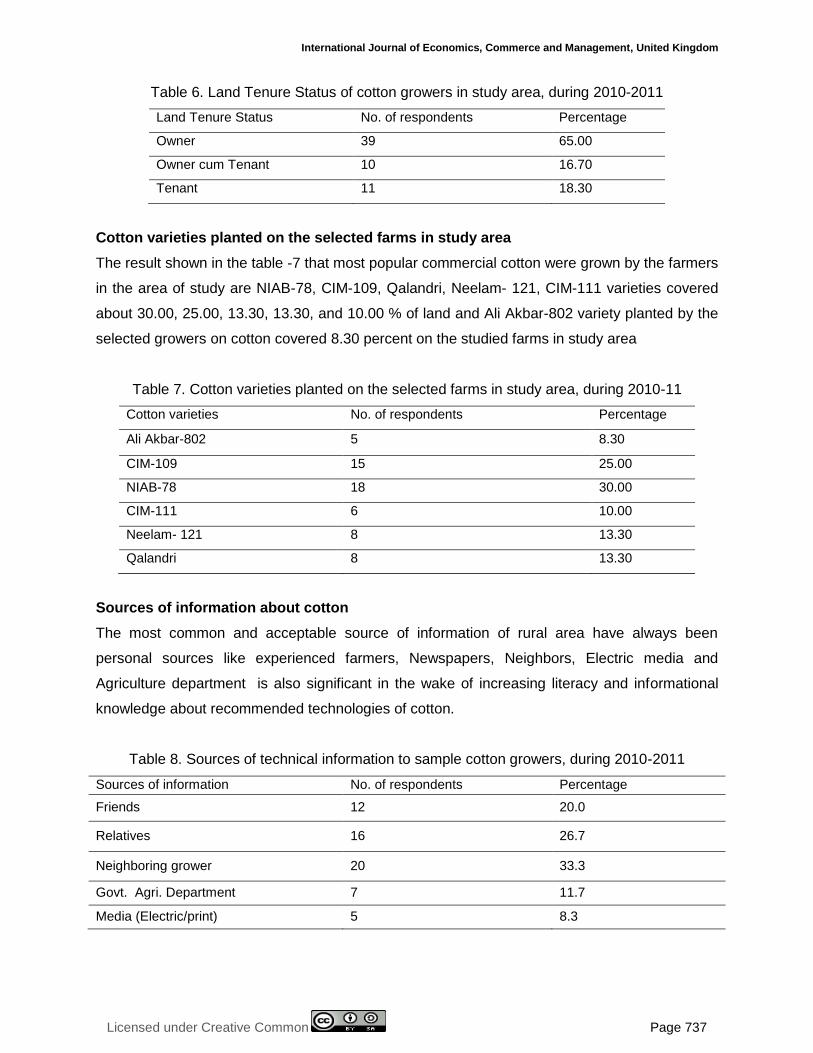
Land Tenure Status
It was apparent from the result in the table-6 that 65.00 % owner, 18.30% owner cum tenant
and 16.70% of the respondents were identified as tenant in the study area during 2010-2011
International Journal of Economics, Commerce and Management, United Kingdom
Licensed under Creative Common Page 737
Table 6. Land Tenure Status of cotton growers in study area, during 2010-2011
Land Tenure Status No. of respondents Percentage
Owner 39 65.00
Owner cum Tenant 10 16.70
Tenant 11 18.30
Cotton varieties planted on the selected farms in study area
The result shown in the table -7 that most popular commercial cotton were grown by the farmers
in the area of study are NIAB-78, CIM-109, Qalandri, Neelam- 121, CIM-111 varieties covered
about 30.00, 25.00, 13.30, 13.30, and 10.00 % of land and Ali Akbar-802 variety planted by the
selected growers on cotton covered 8.30 percent on the studied farms in study area
Table 7. Cotton varieties planted on the selected farms in study area, during 2010-11
Cotton varieties No. of respondents Percentage
Ali Akbar-802 5 8.30
CIM-109 15 25.00
NIAB-78 18 30.00
CIM-111 6 10.00
Neelam- 121 8 13.30
Qalandri 8 13.30
Sources of information about cotton
The most common and acceptable source of information of rural area have always been
personal sources like experienced farmers, Newspapers, Neighbors, Electric media and
Agriculture department is also significant in the wake of increasing literacy and informational
knowledge about recommended technologies of cotton.
Table 8. Sources of technical information to sample cotton growers, during 2010-2011
Sources of information No. of respondents Percentage
Friends 12 20.0
Relatives 16 26.7
Neighboring grower 20 33.3
Govt. Agri. Department 7 11.7
Media (Electric/print) 5 8.3

© Ghulam, Deyi, Mumtaz, Sanaullah, Habibullah & Abdullah
Licensed under Creative Common Page 738
It is observed from above table that majority of the selected cotton farmers i.e. obtained
technical information from neighboring farmers that was 33.3% while obtained 26.7% from
relatives, 20.0% from friends, 8.3% knowledge about cotton production practices from electric
media and newspapers and 11% from government agricultural department that provided
technical information was meager about cultural practices and marketing was found minor.
Total Fixed cost
Total fixed cost is simply the summation of the several types of fixed costs (Ronald, 1996). In
the present study the total fixed costs include the rent of land (lease) and the land taxes. Fixed
costs are those costs, which are incurred irrespective of the level of output.
Table 9. Averages per acre land inputs realized by cotton growers in study area
Item Minimum Maximum Average
Standard
Deviation
Standard
Error
Rent of land 10250.00 13000.00 11543.36 955.81 30.91
Land tax 202.35 465.40 302.91 83.32 9.13
Irrigation charges 182.11 323.76 238.43 56.01 7.48
Local fund 121.41 323.76 193.24 45.56 6.74
Total 10755.87 14112.91 12277.95 1140.71 54.26
In table-9 the selected cotton growers spend average per acre fixed costs of Rs.12277.95 (±
54.26) including rent of land, land tax irrigation charges and local fund an average per acre cost
of Rs. 11543.36 (± 30.91) as land rent, land tax per acre was Rs. 302.91 (± 9.13), while
irrigation charges per acre was 238.43 (± 7.48) and local fund was 193.24 (±6.74) per acre, land
rent ranged between Rs 10755.87 to 14112.91 in the study area.
Labour inputs
Labour inputs, average physical and mental effort for the performance of any work. Inputs
analyzed in this study include man as well as animal labour.
International Journal of Economics, Commerce and Management, United Kingdom
Licensed under Creative Common Page 739
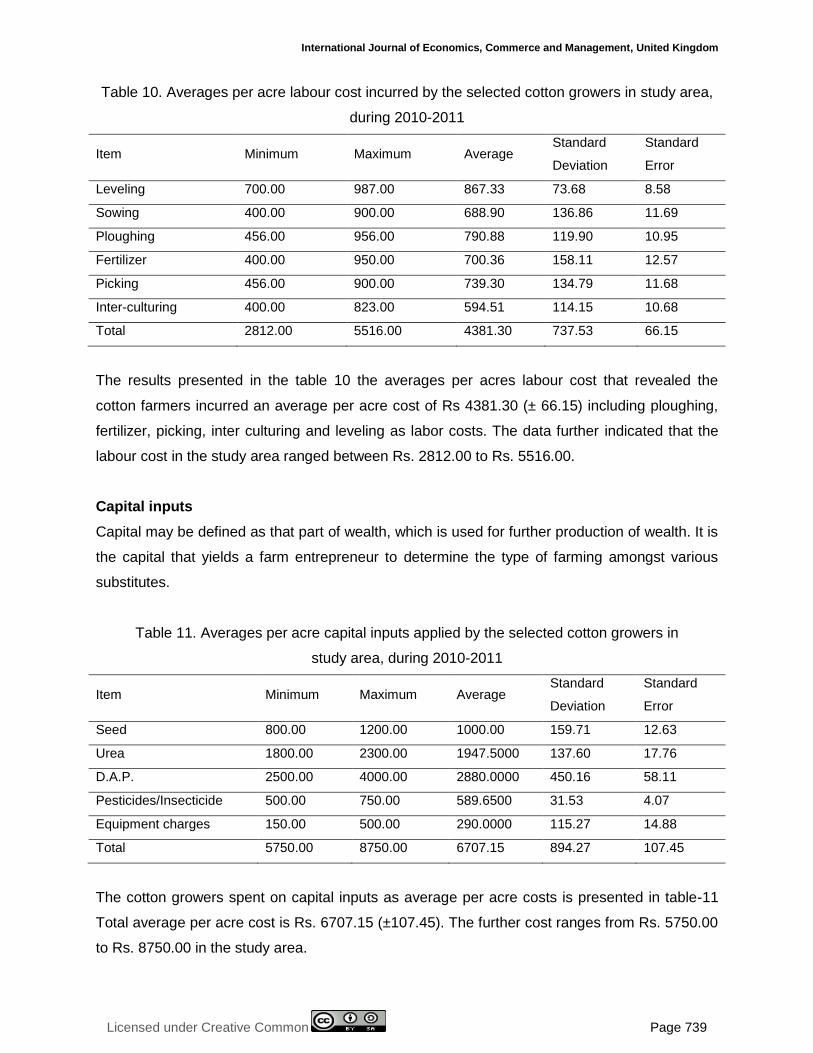
Table 10. Averages per acre labour cost incurred by the selected cotton growers in study area,
during 2010-2011
Item Minimum Maximum Average Standard
Deviation
Standard
Error
Leveling 700.00 987.00 867.33 73.68 8.58
Sowing 400.00 900.00 688.90 136.86 11.69
Ploughing 456.00 956.00 790.88 119.90 10.95
Fertilizer 400.00 950.00 700.36 158.11 12.57
Picking 456.00 900.00 739.30 134.79 11.68
Inter-culturing 400.00 823.00 594.51 114.15 10.68
Total 2812.00 5516.00 4381.30 737.53 66.15
The results presented in the table 10 the averages per acres labour cost that revealed the
cotton farmers incurred an average per acre cost of Rs 4381.30 (± 66.15) including ploughing,
fertilizer, picking, inter culturing and leveling as labor costs. The data further indicated that the
labour cost in the study area ranged between Rs. 2812.00 to Rs. 5516.00.
Capital inputs
Capital may be defined as that part of wealth, which is used for further production of wealth. It is
the capital that yields a farm entrepreneur to determine the type of farming amongst various
substitutes.
Table 11. Averages per acre capital inputs applied by the selected cotton growers in
study area, during 2010-2011
Item Minimum Maximum Average Standard
Deviation
Standard
Error
Seed 800.00 1200.00 1000.00 159.71 12.63
Urea 1800.00 2300.00 1947.5000 137.60 17.76
D.A.P. 2500.00 4000.00 2880.0000 450.16 58.11
Pesticides/Insecticide 500.00 750.00 589.6500 31.53 4.07
Equipment charges 150.00 500.00 290.0000 115.27 14.88
Total 5750.00 8750.00 6707.15 894.27 107.45
The cotton growers spent on capital inputs as average per acre costs is presented in table-11
Total average per acre cost is Rs. 6707.15 (±107.45). The further cost ranges from Rs. 5750.00
to Rs. 8750.00 in the study area.
© Ghulam, Deyi, Mumtaz, Sanaullah, Habibullah & Abdullah
Licensed under Creative Common Page 740
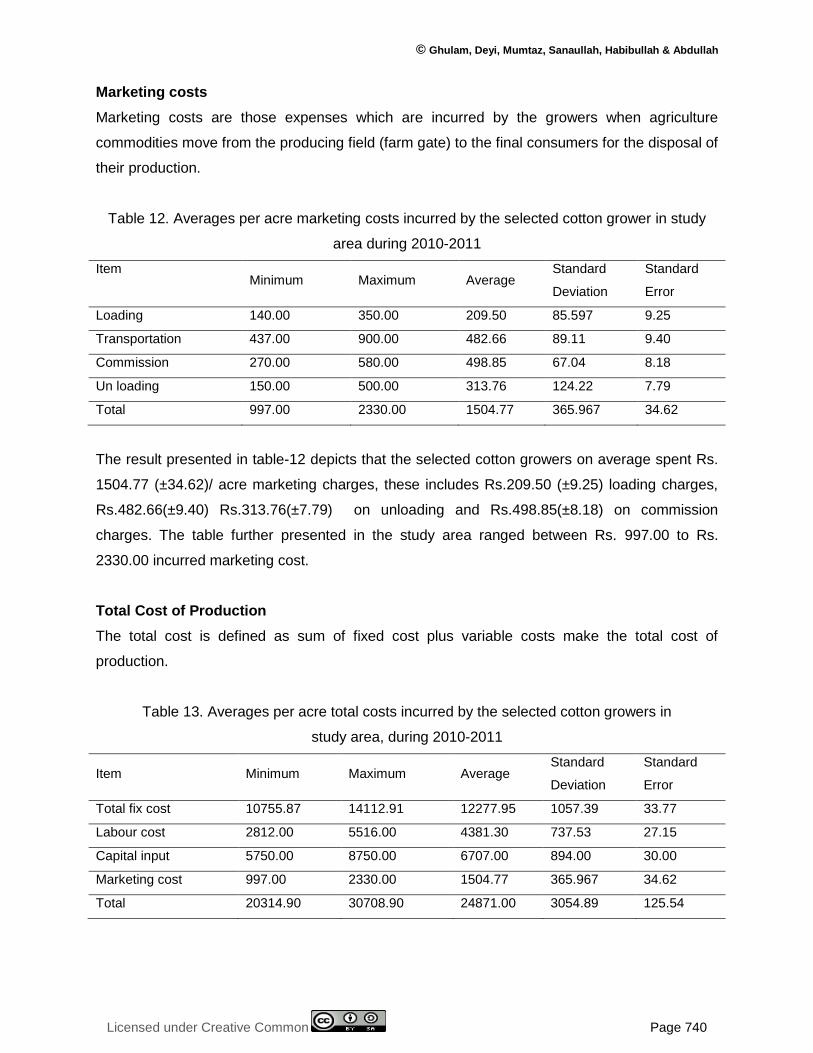
Marketing costs
Marketing costs are those expenses which are incurred by the growers when agriculture
commodities move from the producing field (farm gate) to the final consumers for the disposal of
their production.
Table 12. Averages per acre marketing costs incurred by the selected cotton grower in study
area during 2010-2011
Item Minimum Maximum Average
Standard
Deviation
Standard
Error
Loading 140.00 350.00 209.50 85.597 9.25
Transportation 437.00 900.00 482.66 89.11 9.40
Commission 270.00 580.00 498.85 67.04 8.18
Un loading 150.00 500.00 313.76 124.22 7.79
Total 997.00 2330.00 1504.77 365.967 34.62
The result presented in table-12 depicts that the selected cotton growers on average spent Rs.
1504.77 (±34.62)/ acre marketing charges, these includes Rs.209.50 (±9.25) loading charges,
Rs.482.66(±9.40) Rs.313.76(±7.79) on unloading and Rs.498.85(±8.18) on commission
charges. The table further presented in the study area ranged between Rs. 997.00 to Rs.
2330.00 incurred marketing cost.
Total Cost of Production
The total cost is defined as sum of fixed cost plus variable costs make the total cost of
production.
Table 13. Averages per acre total costs incurred by the selected cotton growers in
study area, during 2010-2011
Item Minimum Maximum Average Standard
Deviation
Standard
Error
Total fix cost 10755.87 14112.91 12277.95 1057.39 33.77
Labour cost 2812.00 5516.00 4381.30 737.53 27.15
Capital input 5750.00 8750.00 6707.00 894.00 30.00
Marketing cost 997.00 2330.00 1504.77 365.967 34.62
Total 20314.90 30708.90 24871.00 3054.89 125.54
International Journal of Economics, Commerce and Management, United Kingdom
Licensed under Creative Common Page 741
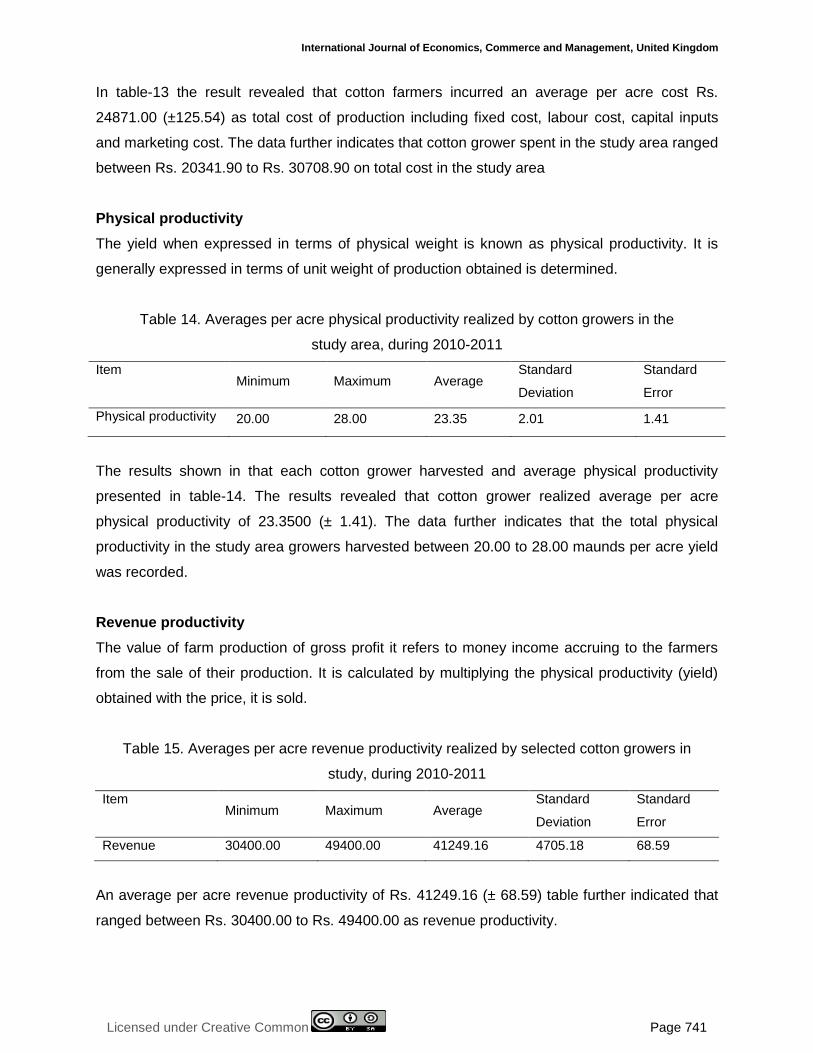
In table-13 the result revealed that cotton farmers incurred an average per acre cost Rs.
24871.00 (±125.54) as total cost of production including fixed cost, labour cost, capital inputs
and marketing cost. The data further indicates that cotton grower spent in the study area ranged
between Rs. 20341.90 to Rs. 30708.90 on total cost in the study area
Physical productivity
The yield when expressed in terms of physical weight is known as physical productivity. It is
generally expressed in terms of unit weight of production obtained is determined.
Table 14. Averages per acre physical productivity realized by cotton growers in the
study area, during 2010-2011
Item Minimum Maximum Average
Standard
Deviation
Standard
Error
Physical productivity 20.00 28.00 23.35 2.01 1.41
The results shown in that each cotton grower harvested and average physical productivity
presented in table-14. The results revealed that cotton grower realized average per acre
physical productivity of 23.3500 (± 1.41). The data further indicates that the total physical
productivity in the study area growers harvested between 20.00 to 28.00 maunds per acre yield
was recorded.
Revenue productivity
The value of farm production of gross profit it refers to money income accruing to the farmers
from the sale of their production. It is calculated by multiplying the physical productivity (yield)
obtained with the price, it is sold.
Table 15. Averages per acre revenue productivity realized by selected cotton growers in
study, during 2010-2011
Item Minimum Maximum Average
Standard
Deviation
Standard
Error
Revenue 30400.00 49400.00 41249.16 4705.18 68.59
An average per acre revenue productivity of Rs. 41249.16 (± 68.59) table further indicated that
ranged between Rs. 30400.00 to Rs. 49400.00 as revenue productivity.

© Ghulam, Deyi, Mumtaz, Sanaullah, Habibullah & Abdullah
Licensed under Creative Common Page 742
Net - farm income
Net farm income is gross profits remains cash operating expenses and depreciation cost of
machinery and equipment costs could be obtained by subtracting the gross revenue from cash
operating expenses.
Table 16. Averages per acre net income realized by the cotton growers in study
area, during 2010-2011
Item Minimum Maximum Average Standard
Deviation
Standard
Error
Gross income (a) 30400.00 49400.00 41249.16 4705.18 68.59
Total cost of
production (b) 20314.90 30708.90 24871.00 3054.89 125.54
Net income a-b=c 10085.1 18691.1 16378.20 1650.29 -56.95
The result showed that in the study area cotton growers received the average per acre net
income is presented in table 16. Results reveal that cotton farmers realized an average per acre
net returns of Rs. 16378.20 (±56.95). The table further indicates in the study area ranged
between Rs. 10085.10 to Rs. 18691.09.
Input – Output and Cost – Benefit Ratio Relationship
The cost benefit ratio is defined as net returns compared to cost of production. It is calculated by
dividing net returns with cost of production was computed.
Table 17. Input-output and cost benefit ratio calculated by the selected cotton growers
in study area, during 2010-2011
Item Minimum Maximum Average Standard
Deviation
Standard
Error
Input-output Ratio 1:1.49 1:1.60 1:1.65 1.54 0.54
Cost Benefit Ratio 1:0.49 1:0.60 1:0.65 0.54 -0.45
In the above table-17 the results indicated that the input-output ratio was 1: 1.65 and cost
benefit ratio ranges 1:0.49 to 1:0.60. It evidently showed that cotton producers obtained benefit
of Rs. 1:0.65 an average while spending a rupee in the study area which is meager benefits for
the cotton grower it is due to the unfavorable prices of their produce in the study area were
examined.

International Journal of Economics, Commerce and Management, United Kingdom
Licensed under Creative Common Page 743
DISCUSSION
In this study, identified a number of implications and constrains were determined from Cotton
farming area of taluka Kandiaro district Naushahero Feroze Sindh. The results are indicating
that proposed model provides an acceptable fit on the data. GOP (2006) reported that the
variations were in yield which suggests that there may be a reliable potential for improving
productivity.
The results indicated that cotton farmers incurred an average per acre cost of their
production presented in the table the selected cotton growers in the study area paid average per
acre fixed costs of Rs.12277.95 including rent of land, land tax irrigation charges and local fund.
The results revealed that cotton farmers incurred an average per acre cost of Rs. 11543.36 (±
30.91) as land rent, land tax per acre was Rs. 302.91 (± 9.13), while irrigation charges per acre
was 238.43 (± 7.48) and local fund was 193.24 (±6.74) per acre. It further indicated that the land
rent ranged between Rs 10755.87 to 14112.91 in the study area. The results revealed the
cotton farmers incurred an average per acre cost of Rs 4381.30 (± 66.15) as labor costs and
that t ranged between Rs. 2812.00 to Rs. 5516.00 averages per acres.
While the cotton farmers spent average per acre cost 1504.77 (±34.62) marketing
charges, these includes Rs.209.50 (±9.25) loading charges, Rs.482.66 (±9.40)
Rs.313.76(±7.79) on unloading and Rs.498.85(±8.18) on commission charges and ranged
between Rs. 997.00 to Rs. 2330.00. The growers spent on capital inputs as average per acre
costs and total average is Rs. 6707.00 (±107.00) which ranged from Rs. 5750.00 to Rs.
8750.00.
The result revealed that cotton farmers incurred an average per acre cost Rs. Rs.
24871.00 (±125.54) as total cost of production including fixed cost, labour cost, capital inputs
and marketing cost that ranged between Rs. 20341.90 to Rs. 30708.90 in the study area, while
cotton grower realized average per acre physical productivity of 23.3500 (± 1.41). Cotton
growers harvested between 20.00 to 28.00 maunds per acre yield. Result interpreted that cotton
growers realized an average per acre revenue productivity of Rs. 41249.16 (± 68.59) and
ranged between Rs. 30400.00 to Rs. 49400.00.00 Results revealed that cotton farmers realized
an average per acre net returns / income of Rs. 16378.20 (±56.95). The result further indicates
in the study area ranged between Rs. 10085.10to Rs. 18691.09 which the growers received
from the study area the input-output ratio of cotton grower’s average was 1: 1.65 and cost
benefit ratio was 1:0.60. It evidently examined that cotton producers obtained benefit of Rs. 0.60
average while spending a rupee in the study area. While Sial et al. (2004) reported that the
cotton growers received Rs. 4235, average per acre returns. In that study area input output and
cost benefit ratio were estimated 1: 1.81 and 1: 0.81.

© Ghulam, Deyi, Mumtaz, Sanaullah, Habibullah & Abdullah
Licensed under Creative Common Page 744
The result discussed in above section clearly indicate that the cost of production as well as
returns (physical and revenue) have increased over the time. Normally, the increases in
revenue returns take place because of technologically back stopping or technical efficiencies,
abundant availability of water in the area, and use of hybrid seed cotton crop.
CONCLUSION AND POLICY IMPLICATIONS
On the basis of present investigation may be summing up, it is concluded that cotton is the main
cash crop of Pakistan and plays an important role in the economy of the country. In our country,
there are 80 percent of small growers and they face financial constraints at the time of
ploughing farms. They purchase their input from the local traders on loan at high interest rates
or pay 10 percent to 25 percent more price. The economic analysis review indicates that cost of
cotton production is in a continuous change due to inflation. The fast changing scenario in costs
on inputs used in cotton, services rates and capital costs demands a regular study on the
economic parameters of cotton production. The main problem reported from the selected cotton
growers was on farms shortage of irrigation, low quality but high prices of seed and pesticides,
far market distance low price of cotton crop received, poor farm market road, costly inputs and
exploitation hoarding and speculation of local traders. Yet the growers are confronting with
many problems due to which per acre yield is declining.
This production system leads to varying results in the different cotton-producing areas of
district Naushahro Feroze, since the results for the changes in productivity and in its
components are not homogeneous across them. In light of these research results, and from the
point of view of establishing an agricultural policy for the cotton production system in Pakistan,
some recommendations can be made:
Policy makers should improve the database of the cotton production sector. Only with a
good database it is possible to get to know the productive reality of the cotton production sector
appropriately, and a sufficient knowledge of this productive reality is required in order to
establish an effective agricultural policy.
Policy makers should aim to improve the total productivity of cotton with the purpose of
reducing the production costs and increasing the degree of competitiveness cotton production. It
would therefore be useful to identify and to tackle the factors that cause the negative
contributions of efficiency and the technical progress components to total productivity growth.
However some effective policy measures (such as providing better extension services and
farmer training programs) can be proposed to improve the capacity of farmers. If the farmers
have greater capacity, they are able to allocate their resources more efficiently and make a
better use of the available technology.

International Journal of Economics, Commerce and Management, United Kingdom
Licensed under Creative Common Page 745
Finally, policy makers should take into account that the behavior of productivity and its
components is not homogeneous across country. Therefore, it seems reasonable to propose
specific measures for each of them and to analyze the possibility of orientating production.
Summary
Fixed cost: Average fixed cost per acre. Rs. 12277.95
Variable costs: Average labour cost per acre Rs. 4381.30
Marketing cost: Average per acre marketing costs Rs. 1504.77
Capital inputs: Average per acre capital inputs Rs. 6707.00
Total costs: Average per acre total costs Rs. 24871.00
Revenue products: Average Revenue productivity per acre Rs. 41249.16
Net Farm income: Average net income per acre Rs. 16378.20
Input-Output ratio Rs. 1:1.65
Cost benefit ratio Rs. 1:0.65
Physical productivity: Average per acre productivity Mds. 23.35
REFERENCES
Ashiq M., N. P. Khan, (2002). Comparative advantage of cotton production in Pakistan and its policy implications. Pakistan Journal of Agricultural Economics Jan-June 1-16.
Dagistan, E., H. Akcaoz, B. Demirtas and Y. Yilmaz. 2009. Energy usage and benefit-cost analysis of cotton production in Turkey, 1University of Mustafa Kemal, Faculty of Agriculture, Department of Agricultural Economics, Hatay, Turkey 2 (1/2) 137-138.
Daniel, J.D; A. A. Sanda, A.A. and E. F. Adebayo 2010. Net income analysis and efficiency of resource use among cotton farmers in the Southern part of Adamawa State, Nigeria, Agric. Biol. J. N. Am., 1(6): 1215-1222.
Das, M. A., Y. S. Shivay and B. M. Prasad. 2008. Economic Sustainability of Cotton-Wheat Cropping System as Influenced by Prilled Urea, Azotobacter and Farmyard Manure, Journal of Sustainable Agriculture, 32 (1): 37.
GOP, 2011. Federal Bureau of Statistics, Statistics Division Wing Cotton Production in Pakistan. Government of Pakistan. Federal Ministry of Pakistan.
Javed, M. I. 2009. Efficiency Analysis of Cotton-Wheat and Rice-Wheat Systems in Punjab, Pakistan PhD thesis, University of Agriculture, Faisalabad.
Khan, M. B., M. H. Akhtar. 2011. Cost-Benefit Analysis of Cotton Production and Processing by Stakeholders: The case of Mutlan and Bahawalpur Regions, American Journal of Scientific Research, 13: 131-141.
Khan, M. B. Chaudhry, I. S. 2009. Factors Affecting Cotton Production in Pakistan: Empirical Evidence from Multan District, Journal of Quality and Technology Management, Volume V, Issue I1, Dec, 2009, pg. 91-100.
Siddiqui, (2004). Pakistan Cotton Market. An overview, Pakistan Central Cotton Committee, Karachi.