economic impact of visitors in new york
TRANSCRIPT

ECONOMIC IMPACT OF
VISITORS IN NEW YORK
2019
W W W . T O U R I S M E C O N O M I C S . C O M
New York CityFocus

2
INTRODUCTION
The travel sector is an integral part of the New York
economy. Visitors generate significant economic benefits to
households, businesses, and government alike and represent
a critical driver of New York’s future. Gross output (business
sales) attributable to visitor spending in New York totaled
$118 billion in 2019.
By monitoring the visitor economy, policymakers can inform
decisions regarding the funding and prioritization of the
sector’s development. They can also carefully monitor its
successes and future needs. This is particularly true for New
York as it continues to expand upon its visitor economy, and
by establishing a baseline of economic impacts, the industry
can track its progress over time.
To quantify the economic significance of the tourism sector
in New York, Tourism Economics has prepared a
comprehensive model detailing the far-reaching impacts
arising from visitor spending. The results of this study show
the scope of the travel sector in terms of direct visitor
spending, as well as the total economic impacts, jobs, and
fiscal (tax) impacts in the broader economy.

3
METHODOLOGY AND DATA SOURCES
An IMPLAN input-output model was constructed for the
state of New York. The model traces the flow of visitor-
related expenditures through the local economy and their
effects on employment, wages, and taxes. IMPLAN also
quantifies the indirect (supplier) and induced (income)
impacts of tourism. Tourism Economics then cross-checked
these findings with employment and wage data for each
sector to ensure the findings are within reasonable ranges.
The value of seasonal and second homes was estimated
based on census data for seasonal units and estimated
gross rents.
The primary source of the employment and wage data is the
Regional Economic Information System (REIS), Bureau of
Economic Analysis. This is more comprehensive than Bureau
of Labor Statistics (ES202/QCEW) data because sole-
proprietors do not require unemployment insurance and are
not counted in the ES202 data.
The analysis draws on the following data sources:
• Longwoods International: survey data, including spending
profile characteristics for visitors to New York
• Bureau of Economic Analysis and Bureau of Labor
Statistics: employment and wage data, by industry
• STR: Lodging performance data, including room demand,
room rates, occupancy, and room revenue
• Tax collections: Lodging and sales tax receipts

KEY FINDINGS

5
Tourism is an integral part of the New York economy
and continues to be a key driver of business sales,
employment, and tax revenue.
KEY FINDINGSThe visitor economy is an engine for
economic growth
Growth in visitation, spending, and
employment
Visitor Spending
Visitors to New York spent nearly $73.6 billion in 2019, an
increase of 2.5% over the prior year. Cumulatively,
spending has increased 39% above the state’s pre-
recession peak set in 2008.
Continued Growth
Personal income associated with direct tourism
employment increased 4.2% in 2019. In terms of personal
income, tourism outpaced the general economy.
Fiscal Contributions
Tourism in New York generated $19.3 billion in tax
revenues in 2019, with $9.1 billion accruing to state and
local governments.
Hotel Indicators
Hotel room demand increased 2.1% in 2019, while
average daily room rates declined (-1.4%). As a result,
hotel room revenues increased just 0.7% year-over-
year.

VISITOR ECONOMY TRENDS

7
$63.1
$64.8
$67.6
$71.8
$73.6
2015 2016 2017 2018 2019
VISITOR SPENDING TRENDS
Visitor spending has increased every year
for a full decade
Visitor spending in 2019 reached nearly $74 billion,
an increase of 2.5% year-over-year, and a more
than $10 billion increase over 2015.
Over the five-year period, visitor spending has
cumulatively increased 17%: an annualized growth
rate of 3.9%.
New York total visitor spendingAmounts in billions of nominal dollars
Source: Tourism Economics
17%

8
VISITOR SPENDING TRENDSVisitor spending by industry
Visitors to New York spent $73.6 billion
across a wide range of sectors in 2019
$73.6B TOTAL VISITOR SPENDING
FOOD &
BEVERAGE
$17.9B
24%
LODGING
$21.4B
29%
RETAIL &
GASOLINE
STATIONS
$13.4B
18%
RECREATION
$7.3B
10%
TRANSPORT
$13.7B
19%
Visitors spent $21.4 billion on lodging, $17.9
billion on food and beverages, $13.7 billion on
transportation, including both local
transportation and air, $13.4 billion on retail
shopping and gasoline stations, and $7.3 billion
on recreational activities in 2019.
Note: Lodging spending is calculated as an industry, including meetings, catering, etc.
Spending also includes dollars spend on second homes. Transport includes both air and
local transportation.
Source: Tourism Economics

9
VISITOR SPENDING TRENDSVisitor spending by industry
Visitor spending increased by 2.5% in 2019,
supported by growth in food and beverages,
transportation, and recreational activities.
Of the $1.8 billion increase in 2019, about two-
thirds was concentrated in food & beverages
and transportation expenses.
Excluding purchases of gasoline, visitor spending
expanded 2.7% in 2019.
Visitor Spending in New YorkAmounts in billions of nominal dollars and growth rates
Source: Tourism Economics
2019 CAGR
2015 2016 2017 2018 2019 Growth 2015-2019
Total visitor spending $63.08 $64.79 $67.63 $71.82 $73.62 2.5% 3.9%
Lodging* $18.71 $19.33 $19.96 $21.21 $21.39 0.9% 3.4%
Food & beverages $14.50 $15.37 $16.17 $17.14 $17.86 4.1% 5.3%
Transportation** $12.85 $12.72 $12.71 $13.24 $13.72 3.7% 1.6%
Retail & Service Stations $10.82 $10.91 $12.03 $13.15 $13.35 1.5% 5.4%
Recreation $6.18 $6.45 $6.77 $7.08 $7.31 3.2% 4.3%
* Lodging includes 2nd home spending
** Transportat ion includes both ground and air t ransportat ion

10
VISITOR ECONOMY TRENDSSpending segments
Spending from both domestic and overseas visitors
increased, while spending from Canadian markets
declined. New York saw less visitors from overseas
and Canadian markets in 2019 than in 2018, and
spending was indicative of that. Domestic spend
remains the highest in terms of levels amongst all
markets.
Visitor Spending by MarketAmounts in billions of nominal dollars
Source: Longwoods International; Tourism Economics
2019
2015 2016 2017 2018 2019 Growth
Total visitor spending $63.08 $64.79 $67.63 $71.82 $73.62 2.5%
Domestic $44.04 $45.57 $47.22 $51.27 $52.97 3.3%
Canada $1.54 $1.46 $1.56 $1.60 $1.42 -10.9%
Overseas $17.49 $17.75 $18.86 $18.95 $19.22 1.4%

ECONOMIC IMPACTS

12
Our analysis of tourism's impact on New York
begins with actual spending by visitors, but
also considers the downstream effects of this
injection of spending into the local economy.
To determine the total economic impact of
tourism in New York, we input visitor
spending into a model of the New York state
economy created in IMPLAN. This move
calculates three distinct types of impact:
direct, indirect, and induced.
The impacts on business sales, jobs, wages,
and taxes are calculated for all three levels of
impact.
How visitor spending generates
employment and income
1. Direct Impacts: Visitors create direct
economic value within a discreet group
of sectors (e.g. recreation,
transportation). This supports a relative
proportion of jobs, wages, taxes, and
GDP within each sector.
2. Indirect Impacts: Each directly affected
sector also purchases goods and services
as inputs (e.g. food wholesalers, utilities)
into production. These impacts are called
indirect impacts.
3. Induced Impacts: Lastly, the induced
impact is generated when employees
whose wages are generated either
directly or indirectly by visitors, spend
those wages in the local economy.
ECONOMIC IMPACTS

13
IMPLAN is particularly effective because it
calculates these three levels of impact – direct,
indirect, and induced – for a broad set of
indicators. These include the following:
• Spending
• Wages
• Employment
• Federal Taxes
• State Taxes
• Local Taxes
Economic impact flowchart
ECONOMIC IMPACTS
How visitor spending generates
employment and income
Accommodation
Food & beverage
Retail
Entertainment/rec
Local transportation
Air transportation
Goods &
services purchases
Household
purchases
VISITOR SPENDING
INDIRECT EFFECTS
INDUCED EFFECTS
TOTAL IMPACTS
Production
Jobs
Wages
Taxes
Supply-side
effects
Household tax
impacts

14
ECONOMIC IMPACTS
Business sales impacts by industry
Visitors and tourism businesses spent
$73.6 billion in New York in 2019. This
supported a total of nearly $118 billion in
business sales when indirect and induced
impacts are considered.
Summary economic impacts ($ billions)
Business sales impacts by industry
Source: Tourism Economics
Direct Indirect Induced Total
sales sales sales sales
Total, all industries $73,618 $21,786 $22,195 $117,599
By industry
Food & beverage $17,855 $483 $937 $19,275
Lodging $18,826 $128 $150 $19,104
Retail trade $7,086 $365 $2,237 $9,688
FIRE $2,562 $3,868 $3,129 $9,559
Air transport $9,168 $59 $74 $9,301
Business services $7,150 $1,886 $9,036
Recreation and entertainment $7,305 $354 $281 $7,941
Gasoline stations $6,264 $14 $78 $6,356
Other transport $4,552 $1,331 $454 $6,336
Manufacturing $2,297 $1,878 $4,175
Education and healthcare $26 $4,076 $4,101
Government $549 $3,125 $3,674
Wholesale trade $1,435 $1,325 $2,760
Communications $1,474 $827 $2,301
Construction and utilities $1,380 $649 $2,029
Personal services $396 $887 $1,283
Agriculture, fishing, mining $478 $201 $679
Amounts in millions of current dollars

15
$0 $4 $8 $12 $16 $20
Agr iculture, fishing, mining
Personal services
Construction and ut ilities
Communicat ions
Wholesale t rade
Government
Educat ion and healthcare
Manufacturing
Other t ransport
Gasoline stat ions
Recreat ion and enter tainment
Business services
Air transpor t
FIRE
Retail trade
Lodging
Food & beverage
Direct Indirect Induced
ECONOMIC IMPACTS
Business sales impacts by industryBusiness sales impacts by industry
While the majority of sales are in
industries directly serving visitors, $3.9
billion in business sales is happening in
finance, insurance and real estate as a
result of selling to tourism businesses.
$ billions
Source: Tourism Economics

16
ECONOMIC IMPACTS
Employment impacts by industry
Tourism supported a total of 811,759
jobs when indirect and induced impacts
are considered.
Employment impacts by industry
Summary employment impacts (number of jobs)
Source: Tourism Economics
Direct Indirect Induced Total
jobs jobs jobs jobs
Total, all industries 571,368 107,469 132,923 811,759
By industry
Food & beverage 223,911 6,651 13,289 243,851
Lodging 110,614 849 1,038 112,500
Other transport 73,298 12,457 3,757 89,512
Recreation and entertainment 80,891 4,933 3,668 89,493
Retail trade 26,499 3,751 23,888 54,139
Business services 39,590 12,067 51,657
Education and healthcare 295 39,127 39,422
Air transport 34,520 198 257 34,975
FIRE 8,162 11,218 8,787 28,166
Personal services 4,649 12,019 16,668
Gasoline stations 13,473 137 795 14,405
Wholesale trade 5,576 5,309 10,885
Manufacturing 5,528 4,055 9,583
Agriculture, fishing, mining 3,810 1,684 5,494
Communications 3,045 1,423 4,468
Construction and utilities 2,969 648 3,617
Government 1,813 1,111 2,924
Amounts in number of jobs

17
0 50,000 100,000 150,000 200,000 250,000
Government
Construction and ut ilities
Communicat ions
Agr iculture, fishing, mining
Manufacturing
Wholesale t rade
Gasoline stat ions
Personal services
FIRE
Air transpor t
Educat ion and healthcare
Business services
Retail trade
Recreat ion and enter tainment
Other t ransport
Lodging
Food & beverage
Direct Indirect Induced
ECONOMIC IMPACTS
Employment impacts by industry
As a labor-intensive collection of services,
tourism-related sectors represent
significant employment to New York.
The nearly 812,000 jobs supported by
New York tourism span every sector of
the economy, either directly or indirectly.
Employment impacts by industry
jobs
Source: Tourism Economics
18
ECONOMIC IMPACTS
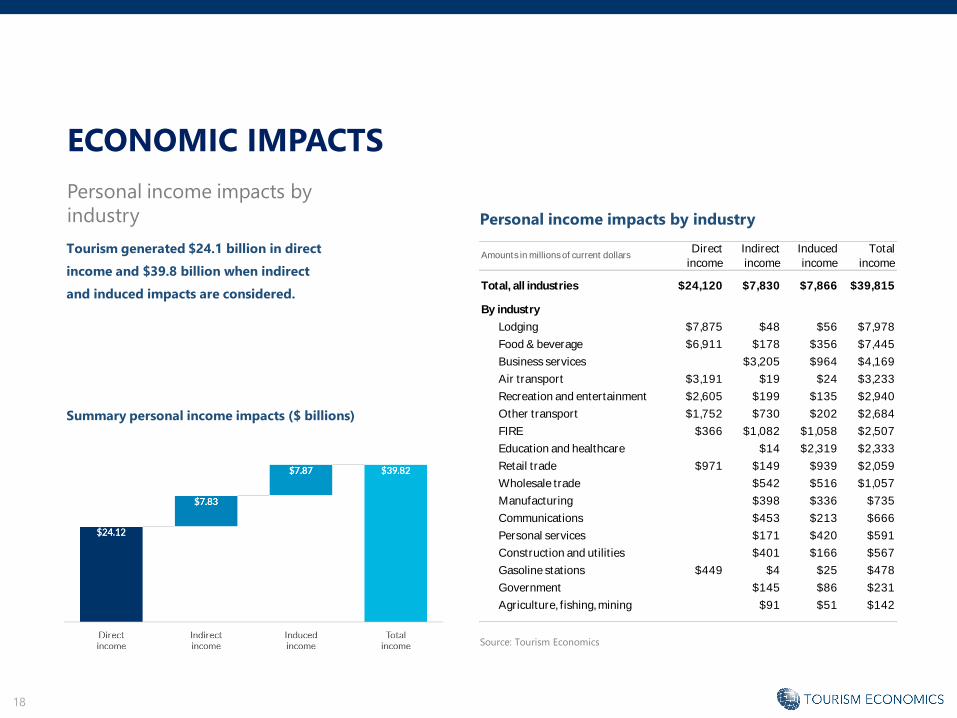
Personal income impacts by
industry
Tourism generated $24.1 billion in direct
income and $39.8 billion when indirect
and induced impacts are considered.
Personal income impacts by industry
Summary personal income impacts ($ billions)
Source: Tourism Economics
Direct Indirect Induced Total
income income income income
Total, all industries $24,120 $7,830 $7,866 $39,815
By industry
Lodging $7,875 $48 $56 $7,978
Food & beverage $6,911 $178 $356 $7,445
Business services $3,205 $964 $4,169
Air transport $3,191 $19 $24 $3,233
Recreation and entertainment $2,605 $199 $135 $2,940
Other transport $1,752 $730 $202 $2,684
FIRE $366 $1,082 $1,058 $2,507
Education and healthcare $14 $2,319 $2,333
Retail trade $971 $149 $939 $2,059
Wholesale trade $542 $516 $1,057
Manufacturing $398 $336 $735
Communications $453 $213 $666
Personal services $171 $420 $591
Construction and utilities $401 $166 $567
Gasoline stations $449 $4 $25 $478
Government $145 $86 $231
Agriculture, fishing, mining $91 $51 $142
Amounts in millions of current dollars
19
$0 $2,000 $4,000 $6,000 $8,000
Agr iculture, fishing, mining
Government
Gasoline stat ions
Construction and ut ilities
Personal services
Communicat ions
Manufacturing
Wholesale t rade
Retail trade
Educat ion and healthcare
FIRE
Other t ransport
Recreat ion and enter tainment
Air transpor t
Business services
Food & beverage
Lodging
Direct Indirect Induced
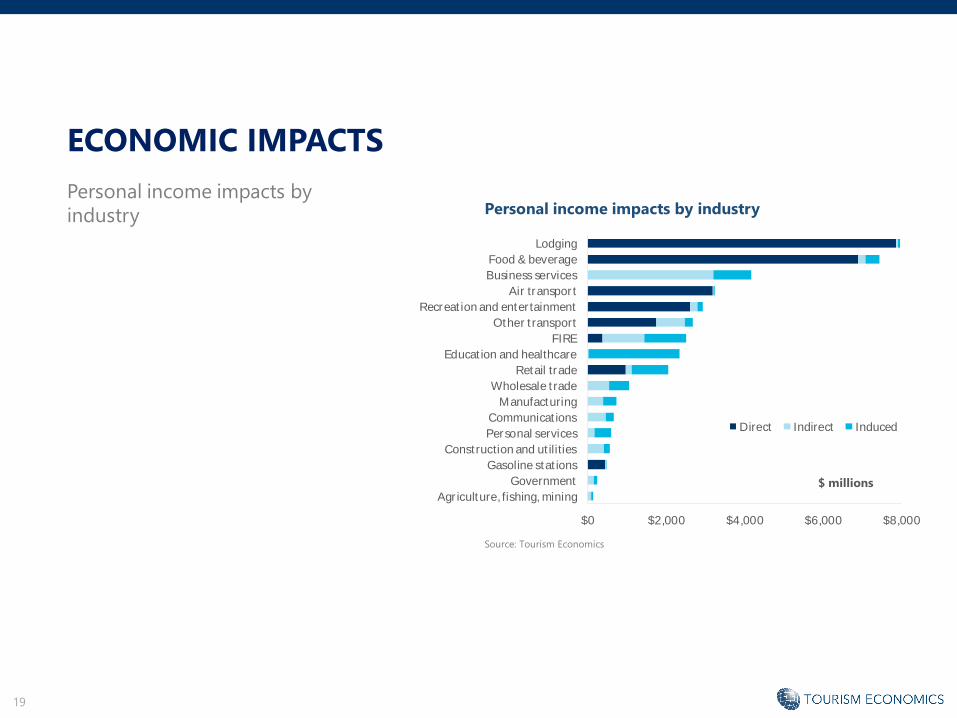
ECONOMIC IMPACTS
Personal income impacts by
industry Personal income impacts by industry
$ millions
Source: Tourism Economics

20
Visitor spending, visitor supported jobs, and
business sales generated $19.3 billion in
governmental revenues.
Fiscal (tax) impacts
ECONOMIC IMPACTS
Fiscal (tax) impacts
Visitor generated taxes, totaling $19.3 billion,
increased 3.1% over the prior year.
Each household in New York would need to be
taxed an additional $1,248 to replace the visitor
taxes received by the state and local governments
in 2019.
Source: Tourism Economics
Total
Total $19,299
Federal $10,165
Personal income $3,637
Corporate $1,700
Indirect business $763
Social insurance $4,065
State and Local $9,134
Sales $2,766
Personal income $1,573
Corporate $1,810
Social insurance $147
Excise and fees $364
Property $2,475
Amounts in millions of current dollars

21
Fiscal (tax) impacts
ECONOMIC IMPACTS
Fiscal (tax) impacts
Visitors generated just over $4.0 billion in state
taxes, increasing 3.0% year-over-year. Local
visitor-supported taxes, sustained mainly through
sales and property taxes, registered $5.1 billion,
and increased 2.0% in 2019.
Source: Tourism Economics
2019
2015 2016 2017 2018 2019 growth
State Tax Subtotal 3,498.3$ 3,614.8$ 3,719.4$ 3,917.0$ 4,035.6$ 3.0%
Corporate 674.2$ 692.4$ 708.0$ 747.6$ 765.8$ 2.4%
Peronal Income 1,069.9$ 1,118.6$ 1,154.6$ 1,209.9$ 1,260.1$ 4.2%
Sales 1,439.9$ 1,478.8$ 1,517.5$ 1,602.4$ 1,641.4$ 2.4%
Excise and Fees 192.2$ 197.4$ 204.8$ 216.3$ 221.6$ 2.4%
State Unemployment 122.0$ 127.6$ 134.4$ 140.9$ 146.7$ 4.2%
Local Tax Subtotal 4,505.1$ 4,614.2$ 4,797.7$ 5,000.2$ 5,098.6$ 2.0%
Corporate 896.3$ 920.5$ 965.4$ 1,019.5$ 1,044.3$ 2.4%
Personal Income 238.4$ 249.2$ 286.5$ 300.2$ 312.7$ 4.2%
Sales 959.9$ 985.9$ 1,039.5$ 1,097.7$ 1,124.4$ 2.4%
Property 2,286.8$ 2,331.6$ 2,374.5$ 2,443.7$ 2,474.6$ 1.3%
Excise and fees 123.6$ 127.0$ 131.7$ 139.1$ 142.5$ 2.4%
Amounts in millions of current dollars

ECONOMIC IMPACTS IN CONTEXT

23
Unemployment rate Unemployment rate without
tourism
In 2019, the unemployment rate was
4.0%. Without jobs supported by visitors,
the unemployment rate would more than
triple to 12.5%.
Visitor-generated employment
ECONOMIC IMPACTSIN CONTEXT
Source: BEA; BLS; Tourism Economics
Unemployment with and without the visitor economy
4.0%
12.5%

24
Each household in New York
would need to be taxed an
additional $1,248 to replace the
visitor taxes received by the state
and local governments in 2019.
ECONOMIC IMPACTS IN CONTEXTSpending, jobs, and income impacts in context
$73.6
BILLION
The $73.6 billion in visitor spending means that almost
$202 million was spent EVERY DAY by visitors in
New York.
The $39.8 billion in total income generated by
tourism is the equivalent of $5,400 for every household
in New York.
$39.8
BILLION$9.1
BILLION
VISITOR SPENDING PERSONAL INCOME STATE AND LOCAL TAXES

REGIONAL SUMMARY

26
REGIONAL SUMMARYVisitor spending by region
New York State is divided into 11 economic
regions.
New York City is the largest single tourism
region with 65% of state visitor spend.
New York City, Long Island, and Hudson Valley
together comprise 80% of New York State
traveler spend.
Visitor Spending by RegionPercentage of New York State visitor spend
Source: Tourism Economics
Chautauqua-
Allegheny
1%
Niagara
4%
Finger Lakes
4%Thous. Islands
1%
Adirondacks
2%
Cen. New York
3%
Capital-Saratoga
3%Catskills
2%
Hudson Valley
6%Long Island
9%New York City
65%

27
REGIONAL SUMMARYUpstate traveler spending
Traveler spending across the upstate regions of
New York, excluding New York City and Long
Island, is more evenly distributed.
Upstate Visitor Spending by RegionPercentage of Upstate New York visitor spend
Source: Tourism Economics
Chautauqua-
Allegheny3%
Niagara
14%
Finger Lakes
17%
Thous. Islands
3%
Adirondacks
8%Cen. New York
13%
Capital-Saratoga
11%
Catskills
8%
Hudson Valley
23%

28
REGIONAL SUMMARYReliance on tourism
Tourism is an integral part of every
region’s economy, generating from 6% to
19% of employment.
Tourism is most important to the
Adirondacks and Catskills, generating
19% and 17% of total employment,
respectively.
Tourism share of regional employment
Source: Tourism Economics
0%
2%
4%
6%
8%
10%
12%
14%
16%
18%
20%
Direct Tourism Total Tourism

29
0%
2%
4%
6%
8%
10%
12%
14%
16%
18%
20%
22%
2018 2019
REGIONAL SUMMARYTraveler spending growth
Traveler spending increased in all regions
in 2019, generally at a lower rate than in
2018.
The strongest growth occurred in the
Catskills, Central New York, and the
Adirondacks regions.
Traveler spending growth was led by
food and beverage. The transportation
and recreation sectors additionally
experienced strong growth.
Growth in traveler spending
Source: Tourism Economics

30
2019
2017 2018 2019 Growth
Total visitor spending $67,633 $71,819 $73,618 2.5%
1. Chautauqua-Allegheny $553 $589 $596 1.3%
2. Greater Niagara $2,666 $2,778 $2,828 1.8%
3. Finger Lakes $3,048 $3,169 $3,261 2.9%
4. Thousand Islands $543 $564 $575 1.9%
5. Adirondacks $1,422 $1,491 $1,541 3.4%
6. Central New York $2,351 $2,473 $2,578 4.2%
7. Capital-Saratoga $2,011 $2,136 $2,207 3.3%
8. Catskills $1,319 $1,469 $1,576 7.3%
9. Hudson Valley $3,664 $4,366 $4,466 2.3%
10. Long Island $5,871 $6,135 $6,310 2.8%
11. New York City $44,185 $46,650 $47,679 2.2%
REGIONAL SUMMARYRegional growth
Source: Tourism Economics
Traveler spendAmounts in millions of nominal dollars

31
REGIONAL SUMMARYRegional tourism summary
Source: Tourism Economics
Tourism Economic ImpactDollar amounts in millions of nominal dollars, employment in persons
Combined direct, indirect, and induced
Direct Labor Employment, Local State
Sales Income Persons Taxes Taxes
Total $73,618 $39,815 811,759 $5,099 $4,036
1. Chautauqua-Allegheny $596 $275 11,377 $41 $33
2. Greater Niagara $2,828 $1,562 53,244 $185 $155
3. Finger Lakes $3,261 $1,638 58,248 $231 $178
4. Thousand Islands $575 $254 8,863 $37 $31
5. Adirondacks $1,541 $738 21,167 $104 $84
6. Central New York $2,578 $1,497 37,958 $157 $140
7. Capital-Saratoga $2,207 $1,232 38,465 $145 $120
8. Catskills $1,576 $728 19,938 $100 $86
9. Hudson Valley $4,466 $2,353 62,230 $311 $245
10. Long Island $6,310 $3,407 80,101 $414 $345
11. New York City $47,679 $26,132 420,169 $3,374 $2,617

32
Direct Labor Local State
Sales Income Taxes Taxes
Total 100% 100% 100% 100% 100%
1. Chautauqua-Allegheny 1% 1% 1% 1% 1%
2. Greater Niagara 4% 4% 7% 4% 4%
3. Finger Lakes 4% 4% 7% 5% 4%
4. Thousand Islands 1% 1% 1% 1% 1%
5. Adirondacks 2% 2% 3% 2% 2%
6. Central New York 4% 4% 5% 3% 3%
7. Capital-Saratoga 3% 3% 5% 3% 3%
8. Catskills 2% 2% 2% 2% 2%
9. Hudson Valley 6% 6% 8% 6% 6%
10. Long Island 9% 9% 10% 8% 9%
11. New York City 65% 66% 52% 66% 65%
Employment
REGIONAL SUMMARYRegional tourism impact
distribution
Source: Tourism Economics
Tourism Economic ImpactRegional shares

REGIONAL DETAIL FOR
NEW YORK CITY
34
Bronx
2% Kings
6%
New York
71%
Queens
20%
Richmond
1%
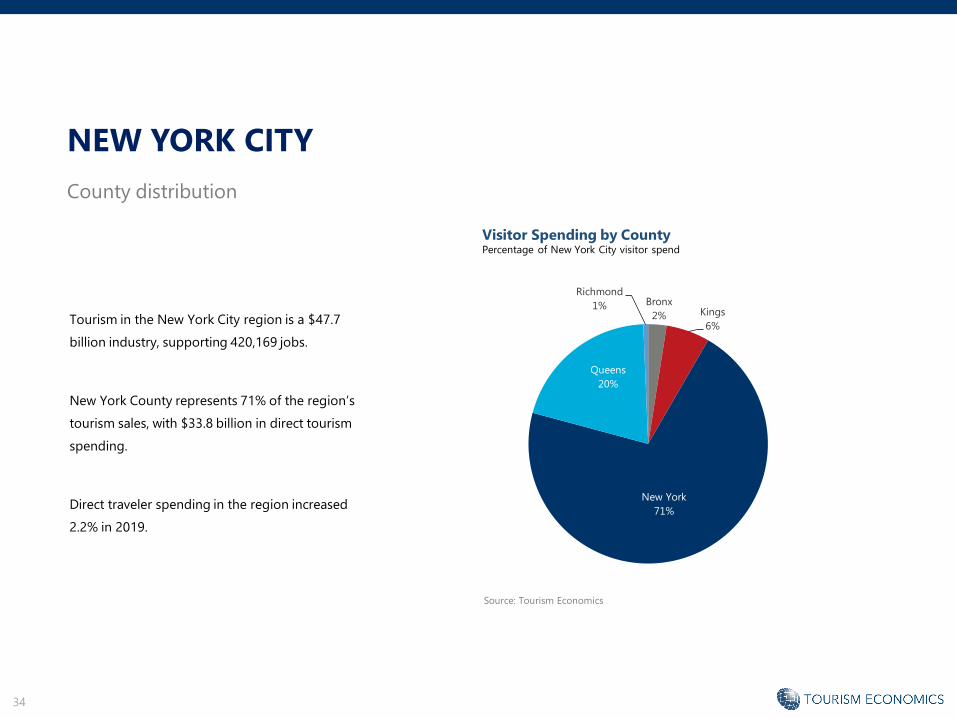
NEW YORK CITY
County distribution
Tourism in the New York City region is a $47.7
billion industry, supporting 420,169 jobs.
New York County represents 71% of the region’s
tourism sales, with $33.8 billion in direct tourism
spending.
Direct traveler spending in the region increased
2.2% in 2019.
Visitor Spending by CountyPercentage of New York City visitor spend
Source: Tourism Economics

35
NEW YORK CITY
Total tourism impact
Source: Tourism Economics
Tourism Economic ImpactDollar amounts in millions of nominal dollars, employment in persons
Combined direct, indirect, and induced
Direct Labor Employment, Local State
Sales Income Persons Taxes Taxes
Total $47,679.4 $26,132.2 420,169 $3,373.9 $2,617.4
Bronx $1,179.2 $653.6 12,597 $94.3 $64.0
Kings $2,800.7 $1,512.6 31,324 $171.8 $152.2
New York $33,773.8 $18,280.3 277,036 $2,443.8 $1,859.0
Queens $9,610.3 $5,516.5 93,558 $637.3 $525.1
Richmond $315.2 $169.2 5,654 $26.7 $17.1
36
Lodging
27%
Recreation
11%
F&B
22%
Retail & Svc
Stations
18%
Transport
21%
Second Homes
1%
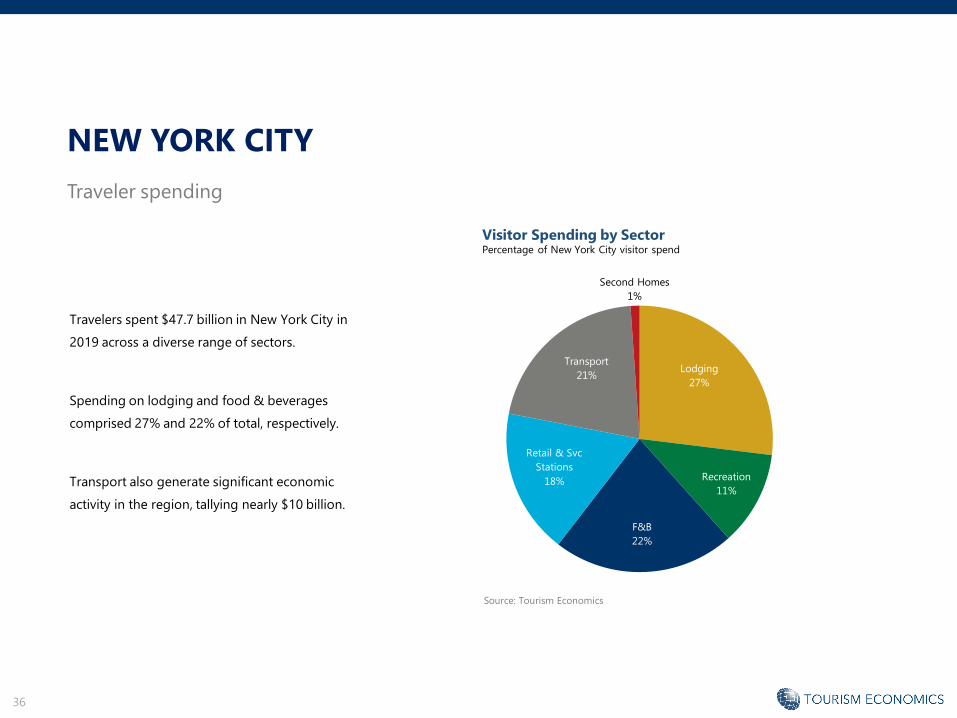
NEW YORK CITY
Traveler spending
Travelers spent $47.7 billion in New York City in
2019 across a diverse range of sectors.
Spending on lodging and food & beverages
comprised 27% and 22% of total, respectively.
Transport also generate significant economic
activity in the region, tallying nearly $10 billion.
Visitor Spending by SectorPercentage of New York City visitor spend
Source: Tourism Economics

37
NEW YORK CITY
Total tourism impact
Source: Tourism Economics
Traveler SpendingAmounts in millions of nominal dollars
Retail & Svc Second
Stations Homes
Total $12,848.9 $5,449.3 $10,525.9 $8,387.6 $9,946.4 $521.3 $47,679.4
Bronx $125.7 $262.8 $415.4 $234.0 $130.7 $10.5 $1,179.2
Kings $505.5 $271.5 $966.8 $502.1 $509.9 $45.0 $2,800.7
New York $11,268.9 $4,725.4 $8,020.4 $7,044.5 $2,327.1 $387.6 $33,773.8
Queens $897.4 $165.8 $983.8 $544.7 $6,948.8 $69.9 $9,610.3
Richmond $51.4 $23.8 $139.4 $62.3 $29.9 $8.4 $315.2
Lodging Recreation F&B Transport Total

38
Traveler Spend 2019
Amounts in millions of nominal dollars 2017 2018 2019 Growth
Total $44,185 $46,650 $47,679 2.2%
Bronx $998 $1,089 $1,179 8.3%
Kings $2,381 $2,618 $2,801 7.0%
New York $31,738 $33,458 $33,774 0.9%
Queens $8,792 $9,184 $9,610 4.6%
Richmond $275 $301 $315 4.6%
State Taxes 2019
Amounts in thousands of nominal dollars 2017 2018 2019 Growth
Total $2,429,913 $2,544,298 $2,613,690 2.7%
Bronx $54,884 $59,409 $64,643 8.8%
Kings $130,958 $142,769 $153,532 7.5%
New York $1,745,421 $1,824,801 $1,851,416 1.5%
Queens $483,529 $500,890 $526,821 5.2%
Richmond $15,120 $16,429 $17,278 5.2%
Local Taxes 2019
Amounts in thousands of nominal dollars 2017 2018 2019 Growth
Total $3,188,056 $3,306,343 $3,373,440 2.0%
Bronx $81,947 $89,094 $94,347 5.9%
Kings $154,879 $168,378 $171,964 2.1%
New York $2,310,222 $2,398,921 $2,442,906 1.8%
Queens $616,155 $623,793 $637,486 2.2%
Richmond $24,853 $26,157 $26,737 2.2%
NEW YORK CITY
Regional growth
Source: Tourism Economics

39
$0
$2,000
$4,000
$6,000
$8,000
$10,000
$12,000
$14,000
$16,000
$18,000
$20,000
Bronx Kings New York Queens Richmond
Direct
Indirect/Induced
Tourism-Generate Labor IncomeAmounts in millions of nominal dollars
NEW YORK CITY
Labor income
Tourism in New York City generated
$15.8 billion in direct labor income and
$26.1 billion including indirect and
induced impacts.
Tourism is most significant in New York
County generating $18.3 billion in labor
income, including indirect and induced
impacts.
Source: Tourism Economics

40
0% 3% 6% 9% 12% 15% 18%
Bronx
Kings
New York
Queens
Richmond
TOTAL
Share (Total)
Share (Direct)
Tourism-Generate Labor IncomeShare of economy
NEW YORK CITY
Labor income
6.4% of all labor income in the New York
City region is generated by tourism.
Queens is the most dependent upon
tourism with 14.0% of all labor income
generated by visitors.
Tourism in New York County generated
6.0% of all labor income last year.
Source: Tourism Economics

41
NEW YORK CITY
Labor income
Source: Tourism Economics
Tourism Labor IncomeAmounts in millions of nominal dollars
Total (Direct, Share Share
Indir., Induced) (Direct) (Total)
Total $15,830.8 $26,132.2 3.9% 6.4%
Bronx $396.0 $653.6 2.2% 3.7%
Kings $916.4 $1,512.6 2.4% 4.0%
New York $11,074.1 $18,280.3 3.6% 6.0%
Queens $3,341.8 $5,516.5 8.5% 14.0%
Richmond $102.5 $169.2 1.6% 2.6%
Direct

42
0% 2% 4% 6% 8% 10% 12% 14% 16%
Bronx
Kings
New York
Queens
Richmond
TOTALShare (Total)
Share (Direct)
Tourism-Generated EmploymentShare of economy
NEW YORK CITY
Tourism employment
9.9% of all employment in the New York
City region is generated by tourism.
Queens County is again the most
dependent upon tourism with 14.1% of
all employment sustained by visitors.
Source: Tourism Economics

43
0
50,000
100,000
150,000
200,000
250,000
300,000
Bronx Kings New York Queens Richmond
Direct Indirect/Induced
NEW YORK CITY
Tourism employment
Source: Tourism Economics
Total (Direct, Share Share
Indir., Induced) (Direct) (Total)
Total 295,741 420,169 7.0% 9.9%
Bronx 8,867 12,597 2.9% 4.2%
Kings 22,047 31,324 3.1% 4.4%
New York 194,995 277,036 7.9% 11.3%
Queens 65,852 93,558 9.9% 14.1%
Richmond 3,980 5,654 3.4% 4.9%
Direct

44
$0
$500
$1,000
$1,500
$2,000
$2,500
$3,000
$3,500
$4,000
$4,500
$5,000
Bronx Kings New York Queens Richmond
State
Local
Tourism-Generated TaxesAmounts in millions of nominal dollars
NEW YORK CITY
Tourism taxes
Tourism in New York City generated
nearly $6.0 billion in state and local taxes
in 2019.
Sales, property, and hotel bed taxes
contributed $3.4 billion in local taxes.
New York County produced 71.7% of the
region’s tourism tax base.
Source: Tourism Economics

45
NEW YORK CITY
Tourism taxes
Source: Tourism Economics
Tourism-Generated TaxesAmounts in thousands of nominal dollars
Were it not for tourism-generated state
and local taxes, the average household in
the region would have to pay an
additional $1,914 to maintain the same
level of government revenue.
Local State Regional Tax Savings
Taxes Taxes Share per Household
Total $3,373,440 $2,613,690 $5,987,130 100.0% $1,914
Bronx $94,347 $64,643 $158,990 2.7% $324
Kings $171,964 $153,532 $325,496 5.4% $347
New York $2,442,906 $1,851,416 $4,294,323 71.7% $5,700
Queens $637,486 $526,821 $1,164,306 19.4% $1,494
Richmond $26,737 $17,278 $44,015 0.7% $265
Total

46
ABOUT TOURISM ECONOMICS
For more information:
Tourism Economics is an Oxford Economics company with a singular objective: combine an understanding of the travel
sector with proven economic tools to answer the most important questions facing our clients. More than 500 companies,
associations, and destination work with Tourism Economics every year as a research partner. We bring decades of experience
to every engagement to help our clients make better marketing, investment, and policy decisions. Our team of highly-
specialized economists deliver:
• Global travel data-sets with the broadest set of country, city, and state coverage available
• Travel forecasts that are directly linked to the economic and demographic outlook for origins and destinations
• Economic impact analysis that highlights the value of visitors, events, developments, and industry segments
• Policy analysis that informs critical funding, taxation, and travel facilitation decisions
• Market assessments that define market allocation and investment decisions
Tourism Economics operates out of regional headquarters in Philadelphia and Oxford, with offices in Belfast, Buenos Aires,
Dubai, Frankfurt, and Ontario.
Oxford Economics is one of the world’s foremost independent global advisory firms, providing reports, forecasts and
analytical tools on 200 countries, 100 industrial sectors and over 3,000 cities. Our best-of-class global economic and industry
models and analytical tools give us an unparalleled ability to forecast external market trends and assess their economic,
social and business impact. Headquartered in Oxford, England, with regional centers in London, New York, and Singapore,
Oxford Economics has offices across the globe in Belfast, Chicago, Dubai, Miami, Milan, Paris, Philadelphia, San Francisco, and
Washington DC, we employ over 250 full-time staff, including 150 professional economists, industry experts and business
editors—one of the largest teams of macroeconomists and thought leadership specialists.