economic impact of visitors in nevada
TRANSCRIPT
ECONOMIC IMPACT OF
VISITORS IN NEVADA
2019
W W W . T O U R I S M E C O N O M I C S . C O M
Prepared for:
Travel Nevada
2
INTRODUCTION
The travel sector is an integral part of the Nevada economy.
Visitors generate significant economic benefits to
households, businesses, and government alike and represent
a critical driver of Nevada’s future. Gross output (business
sales) attributable to visitor spending in Nevada neared $68
billion in 2019.
By monitoring the visitor economy, policymakers can inform
decisions regarding the funding and prioritization of the
sector’s development. They can also carefully monitor its
successes and future needs. This is particularly true for
Nevada as it continues to expand upon its visitor economy,
and by establishing a baseline of economic impacts, the
industry can track its progress over time.
To quantify the economic significance of the tourism sector
in Nevada, Tourism Economics has prepared a
comprehensive model detailing the far-reaching impacts
arising from visitor spending. The results of this study show
the scope of the travel sector in terms of direct visitor
spending, as well as the total economic impacts, jobs, and
fiscal (tax) impacts in the broader economy.
3
METHODOLOGY AND DATA SOURCES
An IMPLAN input-output model was constructed for the
state of Nevada. The model traces the flow of visitor-related
expenditures through the local economy and their effects on
employment, wages, and taxes. IMPLAN also quantifies the
indirect (supplier) and induced (income) impacts of tourism.
Tourism Economics then cross-checked these findings with
employment and wage data for each sector to ensure the
findings are within reasonable ranges.
The value of seasonal and second homes was estimated
based on census data for seasonal units and estimated
gross rents.
Visitors included those who stayed in overnight
accommodations or those who came from a distance greater
than 50 miles and deviated from their normal routine.
The primary source of the employment and wage data is the
Regional Economic Information System (REIS), Bureau of
Economic Analysis. This is more comprehensive than Bureau
of Labor Statistics (ES202/QCEW) data because sole-
proprietors do not require unemployment insurance and are
not counted in the ES202 data.
The analysis draws on the following data sources:
• TNS OmniTrak survey data, including spending, for
domestic visitors to Nevada
• LVCVA and RSVCA: Visitation statistics
• Bureau of Economic Analysis and Bureau of Labor
Statistics: employment and wage data, by industry
• STR: Lodging performance data, including room demand,
room rates, occupancy, and room revenue
• Nevada Department of Taxation: bed tax receipts
• Nevada Gaming Commission: revenues and tax
collections for Nevada gaming
• Tourism Economics: international travel data for overseas,
Canadian, and Mexican travel to Nevada based on
aviation, survey, and credit card information

KEY FINDINGS

5
Tourism is an integral part of the Nevada economy
and continues to be a key driver of business sales,
employment, and tax revenue.
Approximately 25% (1 in 4) of all jobs in the state
were sustained by tourism.
KEY FINDINGSThe visitor economy is an engine for
economic growth
Growth in visitation, spending, and
employment
Visitor Spending
Visitors to Nevada spent $42.3 billion in 2019, which
generated $68 billion in total business sales, including
indirect and induced impacts.
Continued Growth
Tourism-sustained jobs generated total income of $21.5
billion in 2019, a 4.2% increase over the prior year.
Fiscal Contributions
Tourism in Nevada generated $10.7 billion in tax revenues
in 2019, with just over $5 billion accruing to state and local
governments.
Employment Generator
A total of 469,230 jobs were sustained by visitors to
Nevada in 2019. This included 300,596 direct and
168,635 indirect and induced jobs.

6
12.8%
3.2% 2.9%
Visitor spending Visits Tourism employment
Visitor spending has grown 13% over the past five years,
increasing from $37.5 billion in 2015 to $42.3 billion in
2019.
Visitor Spending
Direct tourism-supported employment continued to
expand, surpassing 300,000 jobs in 2019.
Tourism employment
The number of visits to Nevada increased by 325,000
visits to top 56 million visits in 2019, a cumulative
increase of 3.2%.
Visits
Cumulative Growth in Key Indicators, 2015-2019
KEY FINDINGS
Source: Tourism Economics

VISITATION & SPENDING
8
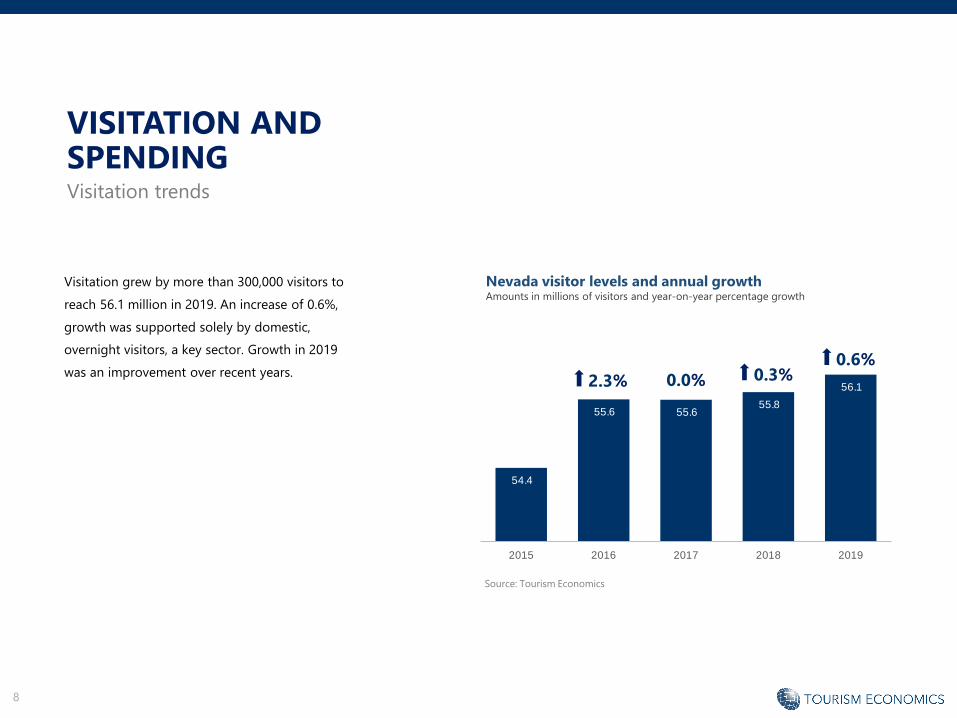
54.4
55.6 55.6 55.8
56.1
2015 2016 2017 2018 2019
VISITATION AND SPENDINGVisitation trends
2.3%
Nevada visitor levels and annual growthAmounts in millions of visitors and year-on-year percentage growth
Visitation grew by more than 300,000 visitors to
reach 56.1 million in 2019. An increase of 0.6%,
growth was supported solely by domestic,
overnight visitors, a key sector. Growth in 2019
was an improvement over recent years.
Source: Tourism Economics
0.0% 0.3%0.6%
9
$37.5
$38.8
$39.7
$40.7
$42.3
2015 2016 2017 2018 2019
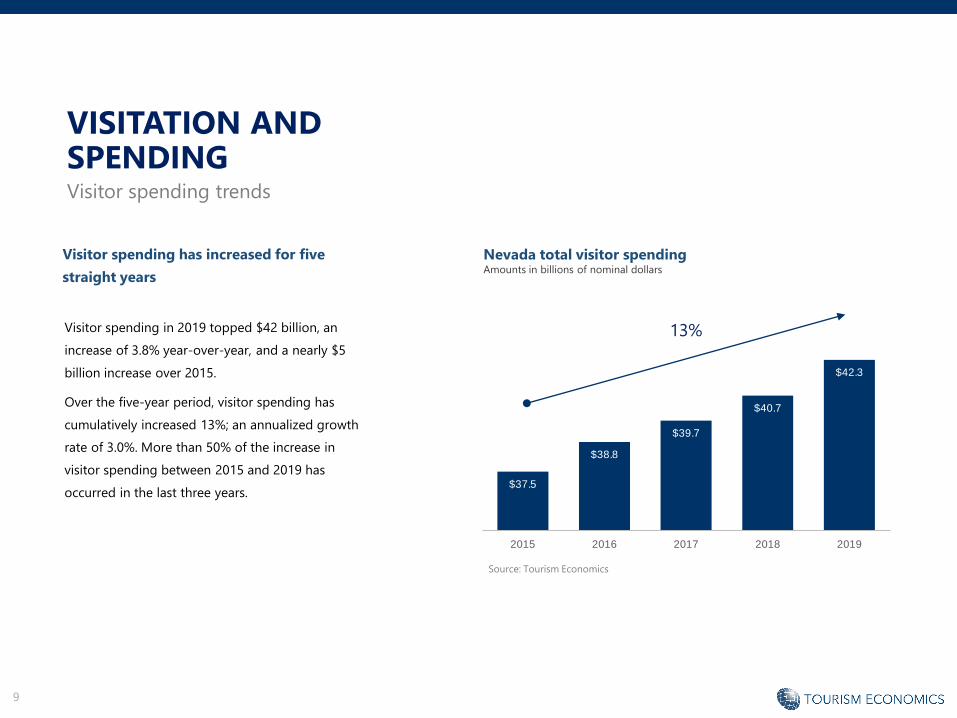
VISITATION AND SPENDINGVisitor spending trends
Visitor spending has increased for five
straight years
Visitor spending in 2019 topped $42 billion, an
increase of 3.8% year-over-year, and a nearly $5
billion increase over 2015.
Over the five-year period, visitor spending has
cumulatively increased 13%; an annualized growth
rate of 3.0%. More than 50% of the increase in
visitor spending between 2015 and 2019 has
occurred in the last three years.
Nevada total visitor spendingAmounts in billions of nominal dollars
Source: Tourism Economics
13%

10
VISITATION AND SPENDINGVisitor spending by industry
Visitors to Nevada spent $42.3 billion across a
wide range of sectors in 2019
TOTAL VISITOR SPENDING
FOOD &
BEVERAGE
$6.2B
15%
LODGING
$7.7B
18%
RETAIL
$7.1B
17%
RECREATION
$5.4B
13%
TRANSPORT
$6.4B
15%
Visitors spent $9.4 billion on gaming, $7.7 billion on
lodging, $7.1 billion on retail, $6.4 billion on
transportation, including both local transportation
and air, $6.2 billion on food and beverages, and $5.4
billion on recreational activities in 2019.
The value of second home accommodations,
included in lodging spend, tallied $172 million.
Note: Lodging spending is calculated as an industry, including meetings, catering, etc.
Spending also includes dollars spend on second homes. Transport includes both air and
local transportation.
Source: Tourism Economics
GAMING
$9.4B
22%

11
VISITATION AND SPENDINGVisitor spending by industry
Visitor spending increased by $1.5 billion between
2018 and 2019, an increase of 3.8%. Spending on
lodging and recreation, including gaming,
contributed more than half of the total increase.
While Nevada generally enjoyed broad growth,
spending on recreational activities, as well as retail,
led the charge.
Visitor Spending in NevadaAmounts in millions of nominal dollars and growth rates
Source: Tourism Economics
2019 CAGR
2015 2016 2017 2018 2019 Growth 2015-2019
Total visitor spending $37,495 $38,765 $39,679 $40,750 $42,279 3.8% 3.0%
Gaming $8,691 $8,807 $9,044 $9,305 $9,380 0.8% 1.9%
Lodging* $6,587 $6,955 $7,284 $7,352 $7,703 4.8% 4.0%
Retail $6,392 $6,402 $6,480 $6,796 $7,141 5.1% 2.8%
Food & beverages $5,147 $5,441 $5,728 $5,979 $6,221 4.1% 4.9%
Recreation (non-gaming) $4,952 $5,293 $5,154 $5,031 $5,395 7.2% 2.2%
Entertainment $4,064 $4,282 5.4%
Outdoor recreation $966 $1,113 15.2%
Transportation $4,454 $4,507 $4,565 $4,714 $4,790 1.6% 1.8%
Air transportation $1,271 $1,359 $1,424 $1,572 $1,650 4.9% 6.7%
* Lodging includes 2nd home spending

12
VISITOR ECONOMY TRENDSVisitation segments
Visitation increased 0.6% in 2019, supported solely by
domestic visitation.
Although domestic visits and spending account for the
majority of tourism in Nevada, international visitors spend
almost double in comparison to domestic visitors on a per
person basis.
Visitor Volume and SpendingAmounts in millions of visitors, millions of nominal dollars, and dollars per person
Source: TNS OmniTrak; Tourism Economics
2019
2015 2016 2017 2018 2019 Growth
Total visitor volume 54.36 55.63 55.62 55.77 56.09 0.6%
Domestic 48.24 49.70 49.66 49.70 50.21 1.0%
International 6.12 5.93 5.97 6.07 5.88 -3.1%
Total visitor spending $37,495 $38,765 $39,679 $40,750 $42,279 3.8%
Domestic $30,517 $31,462 $32,183 $33,140 $35,389 6.8%
International $6,978 $7,303 $7,497 $7,610 $6,890 -9.5%
Per visitor spending $690 $697 $713 $731 $754 3.2%
Domestic $633 $633 $648 $667 $705 5.7%
International $1,140 $1,231 $1,256 $1,254 $1,171 -6.6%

ECONOMIC IMPACTS
14
Our analysis of tourism's impact on Nevada
begins with actual spending by visitors, but
also considers the downstream effects of this
injection of spending into the local economy.
To determine the total economic impact of
tourism in Nevada, we input visitor spending
into a model of the Nevada state economy
created in IMPLAN. This move calculates
three distinct types of impact: direct, indirect,
and induced.
The impacts on business sales, jobs, wages,
and taxes are calculated for all three levels of
impact.
How visitor spending generates
employment and income
1. Direct Impacts: Visitors create direct
economic value within a discreet group
of sectors (e.g. recreation,
transportation). This supports a relative
proportion of jobs, wages, taxes, and
GDP within each sector.
2. Indirect Impacts: Each directly affected
sector also purchases goods and services
as inputs (e.g. food wholesalers, utilities)
into production. These impacts are called
indirect impacts.
3. Induced Impacts: Lastly, the induced
impact is generated when employees
whose wages are generated either
directly or indirectly by visitors, spend
those wages in the local economy.
ECONOMIC IMPACTS
15
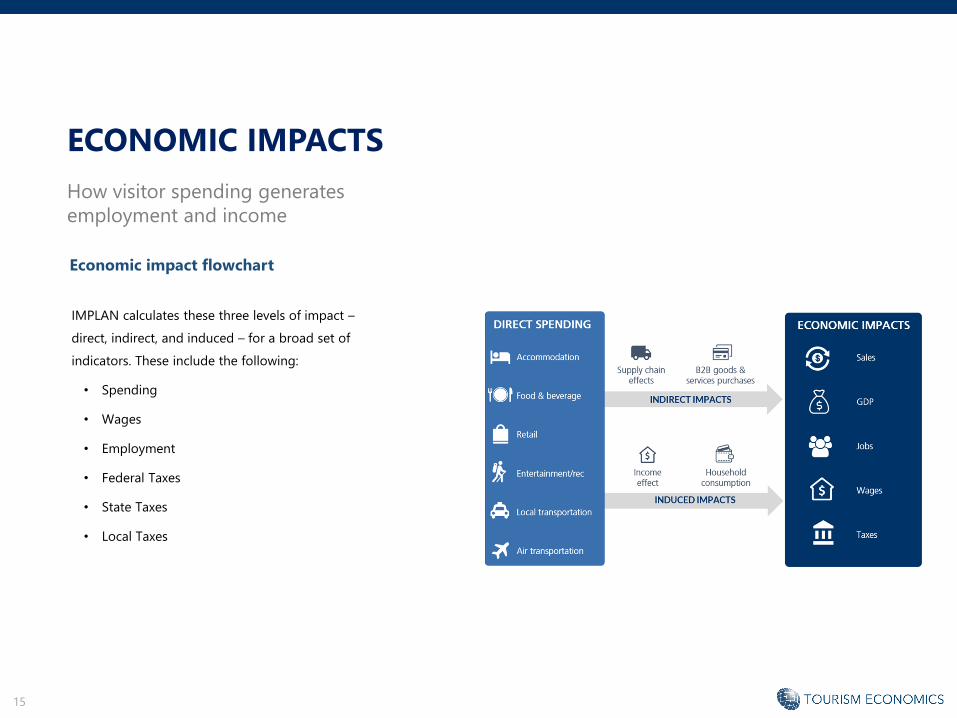
IMPLAN calculates these three levels of impact –
direct, indirect, and induced – for a broad set of
indicators. These include the following:
• Spending
• Wages
• Employment
• Federal Taxes
• State Taxes
• Local Taxes
Economic impact flowchart
ECONOMIC IMPACTS
How visitor spending generates
employment and income
Production
Jobs
Wages
Taxes
16
ECONOMIC IMPACTS
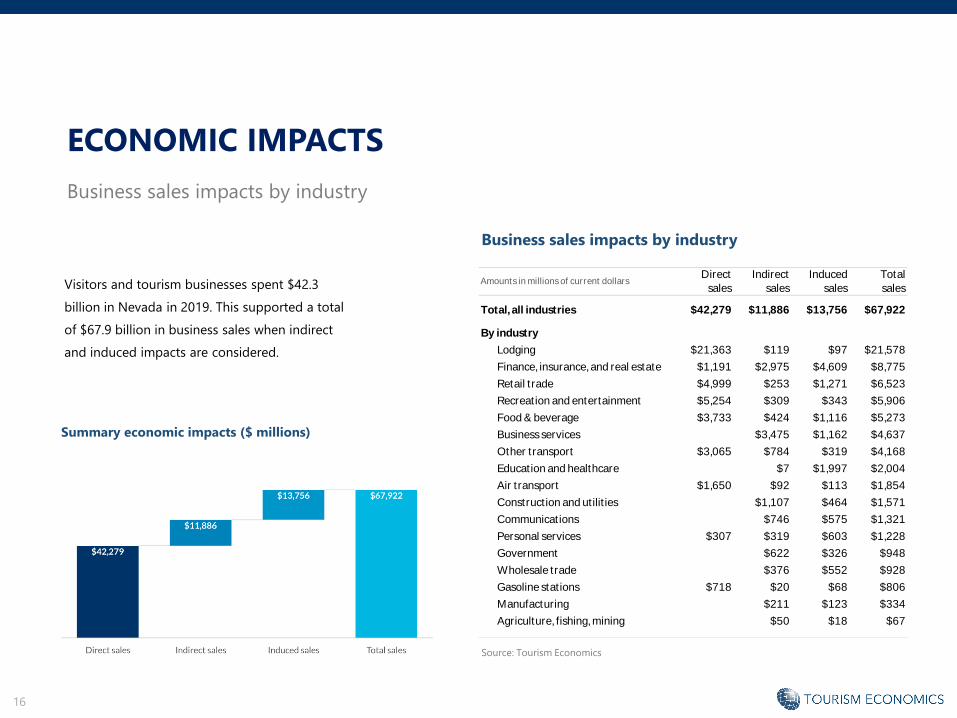
Business sales impacts by industry
Visitors and tourism businesses spent $42.3
billion in Nevada in 2019. This supported a total
of $67.9 billion in business sales when indirect
and induced impacts are considered.
Summary economic impacts ($ millions)
Business sales impacts by industry
Source: Tourism Economics
Direct Indirect Induced Total
sales sales sales sales
Total, all industries $42,279 $11,886 $13,756 $67,922
By industry
Lodging $21,363 $119 $97 $21,578
Finance, insurance, and real estate $1,191 $2,975 $4,609 $8,775
Retail trade $4,999 $253 $1,271 $6,523
Recreation and entertainment $5,254 $309 $343 $5,906
Food & beverage $3,733 $424 $1,116 $5,273
Business services $3,475 $1,162 $4,637
Other transport $3,065 $784 $319 $4,168
Education and healthcare $7 $1,997 $2,004
Air transport $1,650 $92 $113 $1,854
Construction and utilit ies $1,107 $464 $1,571
Communications $746 $575 $1,321
Personal services $307 $319 $603 $1,228
Government $622 $326 $948
Wholesale trade $376 $552 $928
Gasoline stations $718 $20 $68 $806
Manufacturing $211 $123 $334
Agriculture, fishing, mining $50 $18 $67
Amounts in millions of current dollars

17
$0 $6,000 $12,000 $18,000 $24,000
Agriculture, fishing, mining
Manufacturing
Gasoline stat ions
Wholesale trade
Government
Personal services
Communicat ions
Construct ion and ut ilit ies
Air transport
Education and healthcare
Other transport
Business services
Food & beverage
Recreat ion and entertainment
Retail t rade
Finance, insurance, and real estate
Lodging
Direct Indirect Induced
ECONOMIC IMPACTS
Business sales impacts by industry
Business sales impacts by industryWhile the majority of sales are in
industries directly serving visitors, nearly
$3 billion in business sales is happening
in finance, insurance and real estate as a
result of selling to tourism businesses.
$ millions
Source: Tourism Economics

18
ECONOMIC IMPACTS
GDP impacts by industry
Travel generated a total $39.4 billion in state
GDP in 2019 when indirect and induced
values are considered, accounting for 22%
of the state economy.
Summary GDP impacts ($ millions)
GDP impacts by industry
Source: Tourism Economics
Direct Indirect Induced Total
value value value value
Total, all industries $24,076 $7,009 $8,299 $39,384
By industry
Lodging $14,102 $77 $63 $14,243
Finance, insurance, and real estate $778 $1,829 $2,664 $5,270
Recreation and entertainment $2,819 $232 $218 $3,269
Food & beverage $2,044 $303 $741 $3,088
Business services $2,200 $738 $2,938
Other transport $1,783 $379 $156 $2,318
Retail trade $1,272 $168 $864 $2,304
Education and healthcare $5 $1,301 $1,306
Air transport $1,009 $58 $71 $1,138
Personal services $203 $215 $424 $843
Construction and utilit ies $519 $216 $735
Wholesale trade $241 $354 $596
Communications $322 $254 $576
Government $352 $150 $503
Gasoline stations $66 $13 $42 $120
Manufacturing $70 $35 $105
Agriculture, fishing, mining $25 $6 $32
Amounts in millions of current dollars

19
$0 $3,000 $6,000 $9,000 $12,000 $15,000
Agriculture, fishing, mining
Manufacturing
Gasoline stat ions
Government
Communicat ions
Wholesale trade
Construct ion and ut ilit ies
Personal services
Air transport
Education and healthcare
Retail t rade
Other transport
Business services
Food & beverage
Recreation and entertainment
Finance, insurance, and real estate
Lodging
Direct Indirect Induced
ECONOMIC IMPACTS
GDP impacts by industry
GDP impacts by industry
The lodging industry has the largest
economic contribution from direct visitor
spending, followed by recreation.
$ millions
Source: Tourism Economics

20
Tourism employment
Source: BEA; BLS; Tourism Economics
Direct tourism employment in NevadaAmounts in number of jobs
Visitor spending directly supported 300,596 jobs
In 2019, direct visitor spending supported
300,596 jobs in Nevada. Growing 1.3% from
the previous year, tourism employment has
increased 3% since 2015.
The 300,596 jobs directly supported by
visitors represents 16% of all jobs within
Nevada.
ECONOMIC IMPACTS
292,138 292,843
294,840
296,810
300,596
2015 2016 2017 2018 2019

21
ECONOMIC IMPACTS
Employment impacts by industry
Tourism supported a total of 469,230 jobs
when indirect and induced impacts are
considered.
Employment impacts by industry
Summary employment impacts (number of jobs)
Source: Tourism Economics
Direct Indirect Induced Total
jobs jobs jobs jobs
Total, all industries 300,596 75,931 92,704 469,230
By industry
Lodging 165,264 920 748 166,933
Food & beverage 40,587 5,485 13,669 59,741
Recreation and entertainment 33,931 3,014 3,044 39,989
Business services 28,475 10,858 39,334
Retail trade 22,108 2,805 12,330 37,243
Other transport 23,600 5,780 2,360 31,739
Finance, insurance, and real estate 2,620 14,430 13,779 30,829
Personal services 8,114 3,367 8,772 20,253
Education and healthcare 147 19,268 19,415
Government 3,125 1,115 4,241
Wholesale trade 1,685 2,474 4,159
Construction and utilit ies 2,872 1,274 4,146
Communications 2,066 1,318 3,384
Air transport 2,888 171 210 3,268
Gasoline stations 1,484 283 943 2,709
Manufacturing 925 349 1,273
Agriculture, fishing, mining 380 194 574
Amounts in number of jobs
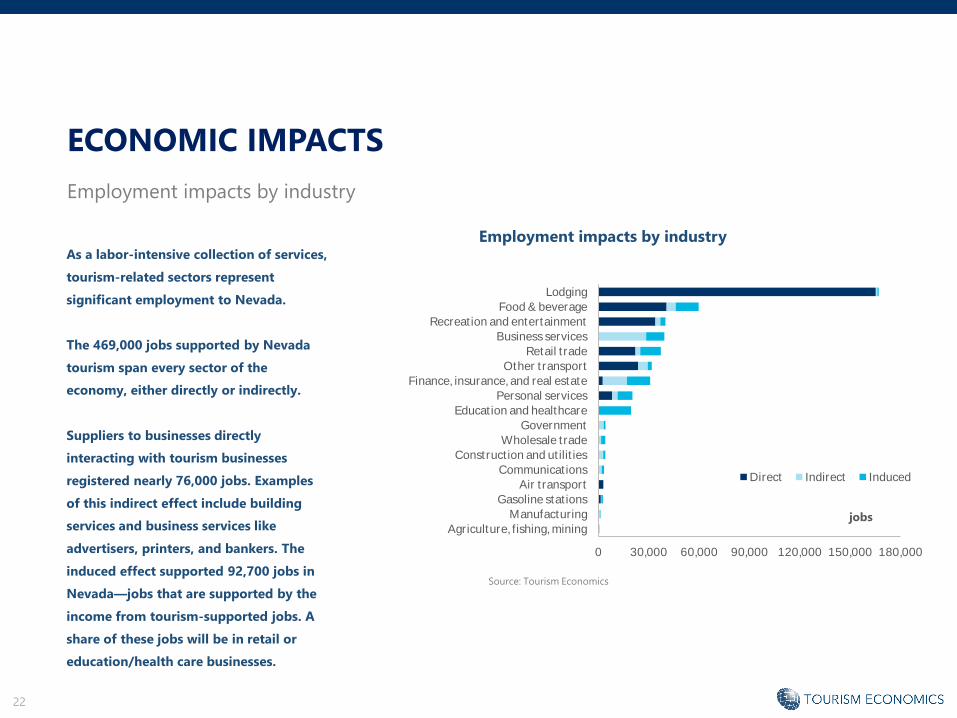
22
0 30,000 60,000 90,000 120,000 150,000 180,000
Agriculture, fishing, mining
Manufacturing
Gasoline stat ions
Air transport
Communicat ions
Construct ion and ut ilit ies
Wholesale trade
Government
Education and healthcare
Personal services
Finance, insurance, and real estate
Other transport
Retail t rade
Business services
Recreat ion and entertainment
Food & beverage
Lodging
Direct Indirect Induced
ECONOMIC IMPACTS
Employment impacts by industry
As a labor-intensive collection of services,
tourism-related sectors represent
significant employment to Nevada.
The 469,000 jobs supported by Nevada
tourism span every sector of the
economy, either directly or indirectly.
Suppliers to businesses directly
interacting with tourism businesses
registered nearly 76,000 jobs. Examples
of this indirect effect include building
services and business services like
advertisers, printers, and bankers. The
induced effect supported 92,700 jobs in
Nevada—jobs that are supported by the
income from tourism-supported jobs. A
share of these jobs will be in retail or
education/health care businesses.
Employment impacts by industry
jobs
Source: Tourism Economics

23
ECONOMIC IMPACTS
Personal income impacts by
industry
Tourism generated $13.6 billion in direct
income and $21.5 billion when indirect and
induced impacts are considered.
Personal income impacts by industry
Summary personal income impacts ($ millions)
Source: Tourism Economics
Direct Indirect Induced Total
income income income income
Total, all industries $13,631 $3,813 $4,100 $21,544
By industry
Lodging $8,464 $47 $38 $8,549
Business services $1,654 $579 $2,233
Recreation and entertainment $1,420 $116 $87 $1,624
Food & beverage $1,070 $160 $372 $1,602
Other transport $1,175 $304 $118 $1,597
Retail trade $692 $96 $448 $1,235
Education and healthcare $5 $1,201 $1,206
Finance, insurance, and real estate $196 $394 $336 $925
Personal services $245 $161 $366 $772
Government $287 $107 $394
Air transport $324 $19 $24 $367
Wholesale trade $126 $185 $311
Construction and utilit ies $217 $94 $311
Communications $157 $94 $250
Gasoline stations $46 $8 $28 $82
Manufacturing $51 $20 $71
Agriculture, fishing, mining $12 $3 $15
Amounts in millions of current dollars
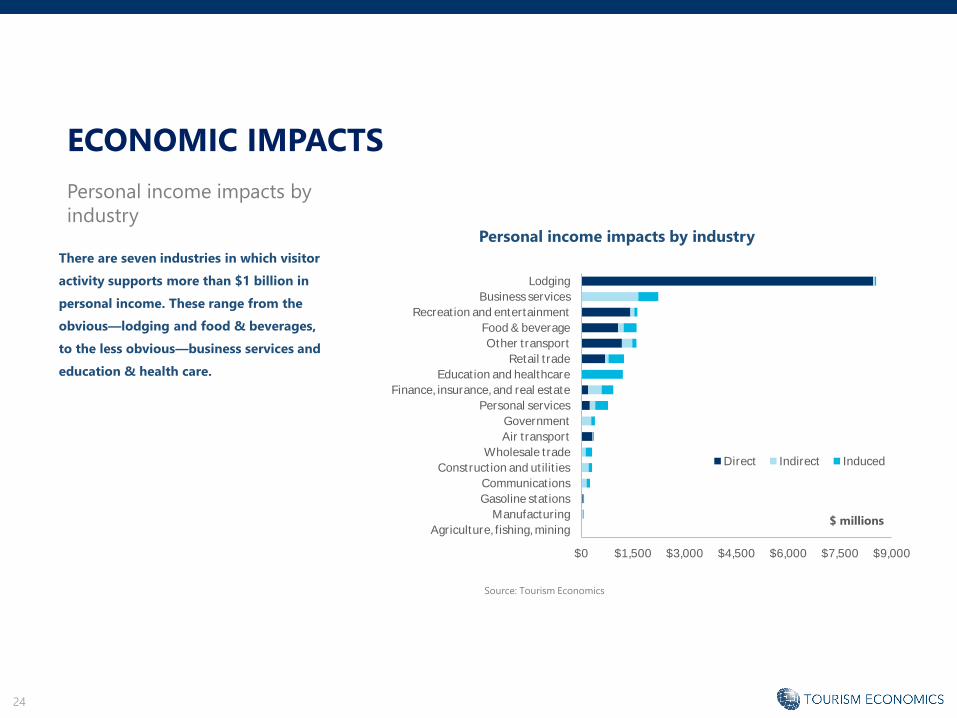
24
$0 $1,500 $3,000 $4,500 $6,000 $7,500 $9,000
Agriculture, fishing, mining
Manufacturing
Gasoline stat ions
Communicat ions
Construct ion and ut ilit ies
Wholesale trade
Air transport
Government
Personal services
Finance, insurance, and real estate
Education and healthcare
Retail t rade
Other transport
Food & beverage
Recreat ion and entertainment
Business services
Lodging
Direct Indirect Induced
ECONOMIC IMPACTS
Personal income impacts by
industryPersonal income impacts by industry
$ millions
Source: Tourism Economics
There are seven industries in which visitor
activity supports more than $1 billion in
personal income. These range from the
obvious—lodging and food & beverages,
to the less obvious—business services and
education & health care.

25
Fiscal (tax) impacts, FY2019
ECONOMIC IMPACTS
Fiscal (tax) impactsNevada tax revenues generated by visitor
spending, visitor supported jobs, and business
sales neared $10.7 billion in FY 2019.
State and local taxes alone tallied $5.0 billion.
Each household in Nevada would need to be taxed
an additional $4,689 to replace the visitor taxes
received by the state and local governments in FY
2019.
Source: Tourism Economics
Indirect/
Direct Induced Total
Total $7,242 $3,453 $10,696
Federal $3,546 $2,105 $5,651
Personal income $1,160 $665 $1,825
Corporate $546 $377 $922
Indirect business $319 $190 $509
Social insurance $1,521 $873 $2,394
State and Local $3,696 $1,348 $5,045
Sales $972 $804 $1,776
Gaming $721 $82 $803
Lodging Tax $888 $0 $888
Excise and fees $558 $131 $689
Property $557 $331 $888
Amounts in millions of current dollars
ECONOMIC IMPACTS IN CONTEXT

27
Visitor-generated employment is a
significant part of key industries—87% of
lodging, 65% of recreation, and 42% of food
& beverage employment is supported by
visitor spending, including indirect and
induced benefits.
Tourism employment
Source: BEA; BLS; Tourism Economics
Tourism employment intensityAmounts in percentage of total industry employment
ECONOMIC IMPACTS
87%
65%
42%
21%25%
Lodging Recreat ion Food services Retail All industries

28
Unemployment rate Unemployment rate without
tourism
In 2019, the unemployment rate was 3.9%.
Without jobs supported by visitors, the
unemployment rate would skyrocket to 34.3%.
Visitor-generated employment
ECONOMIC IMPACTSIN CONTEXT
Source: BEA; BLS; Tourism Economics
Unemployment with and without the visitor economy
3.9%
34.3%

29
The $5.0 billion in state and local
taxes generated by tourism would
cover the average salaries of
around 84,000 public school
teachers in Nevada, or the
average salaries of about 85,500
police officers.
ECONOMIC IMPACTS IN CONTEXTSpending, jobs, and income impacts in context
$42.3
BILLION
The $42.3 billion in visitor spending means that nearly
$116 million was spent EVERY DAY by visitors in
Nevada.
Stacking $42.3 billion worth of $5 bills would reach 574 miles high—more than the
distance between Las Vegas and Reno.
The $21.5 billion in total income generated by
tourism is the equivalent of $20,000 for every household in Nevada, or about $7,000
for every resident of the state.
The number of total jobs sustained by tourism
(469,230) supports 25% of all jobs in Nevada.
The number of jobs sustained by tourism is enough to fill Allegiant
Stadium more than seven times.
$21.5
BILLION469,230
JOBS
$5.0
BILLION
VISITOR SPENDING PERSONAL INCOME STATE AND LOCAL TAXESEMPLOYMENT
30
ABOUT TOURISM ECONOMICS
For more information:
Tourism Economics is an Oxford Economics company with a singular objective: combine an understanding of the travel
sector with proven economic tools to answer the most important questions facing our clients. More than 500 companies,
associations, and destination work with Tourism Economics every year as a research partner. We bring decades of experience
to every engagement to help our clients make better marketing, investment, and policy decisions. Our team of highly-
specialized economists deliver:
• Global travel data-sets with the broadest set of country, city, and state coverage available
• Travel forecasts that are directly linked to the economic and demographic outlook for origins and destinations
• Economic impact analysis that highlights the value of visitors, events, developments, and industry segments
• Policy analysis that informs critical funding, taxation, and travel facilitation decisions
• Market assessments that define market allocation and investment decisions
Tourism Economics operates out of regional headquarters in Philadelphia and Oxford, with offices in Belfast, Buenos Aires,
Dubai, Frankfurt, and Ontario.
Oxford Economics is one of the world’s foremost independent global advisory firms, providing reports, forecasts and
analytical tools on 200 countries, 100 industrial sectors and over 3,000 cities. Our best-of-class global economic and industry
models and analytical tools give us an unparalleled ability to forecast external market trends and assess their economic,
social and business impact. Headquartered in Oxford, England, with regional centers in London, New York, and Singapore,
Oxford Economics has offices across the globe in Belfast, Chicago, Dubai, Miami, Milan, Paris, Philadelphia, San Francisco, and
Washington DC, we employ over 250 full-time staff, including 150 professional economists, industry experts and business
editors—one of the largest teams of macroeconomists and thought leadership specialists.