economic impact of the covid-19 pandemic on east african
TRANSCRIPT
Headline Verdana BoldEconomic impact of the COVID-19 pandemic on East African economiesVolume 2
Navigating new realitiesJuly 2021

2
Economic Impact of the COVID-19 Pandemic on East African Economies: Volume 2
Foreword
Introduction
Is 2021 the year for recovery?
Global industries overview
The African scene
Kenya
Ethiopia
Tanzania
Uganda
Rwanda
References
Contacts
Contents
3
Economic Impact of the COVID-19 Pandemic on East African Economies: Volume 2
We are pleased to present Volume 2 of the Economic impact of the COVID-19 pandemic on East African economies, published in May 2020.
In this Volume 2 publication, we expound on the insights we highlighted in Volume 1 (Vol. 1) of our publication. We focus on analyses of COVID-19 sector heat maps across Kenya, Ethiopia, Tanzania, Uganda and Rwanda and the expected recovery in 2021.
The COVID-19 pandemic first reported in Hubei province of China in December 2019 turned out to be the black swan of 2020 and ravaging effects were largely witnessed through 2020. In more than half of emerging market and developing economies (EMDEs), per capita income losses in 2020 reversed more than half a decade of income gains. A year later since COVID-19 was declared a global pandemic, most nations have covered immense ground in flattening the COVID-19 curve while vaccinating their citizens thus turning around their economies towards recovery while others are still grappling with the effects of a second/third wave of infections. However, as the world seeks to comprehend the new normal, we still face many unknowns with the recovery largely expected to be bumpy and slow.
The COVID-19 pandemic has taken more than 4.0m human lives and seen economic stimulus packages across global economies surpass USD 13tn, four times more than the response to the 2008-09 financial crisis. Across the East African region (with the exception of Uganda that is under a 42-day lockdown from 18 June 2021 to 30 July 2021), most of the social distancing measures put in place at the onset of the pandemic have now been eased with borders opening for external trade and airlines embarking on international flights.
For purposes of our analysis in this publication, we have used available data to 30 June 2021; unless indicated on specific graphs.
We hope that you find this publication useful as we all attempt to navigate our new realities.
Foreword
Gladys Makumi
Financial Advisory Leader | East Africa
Tewodros Sisay
Associate Director
Financial Advisory | East Africa
Kevin Kimotho
Associate Director
Financial Advisory | East Africa
4
Economic Impact of the COVID-19 Pandemic on East African Economies: Volume 2
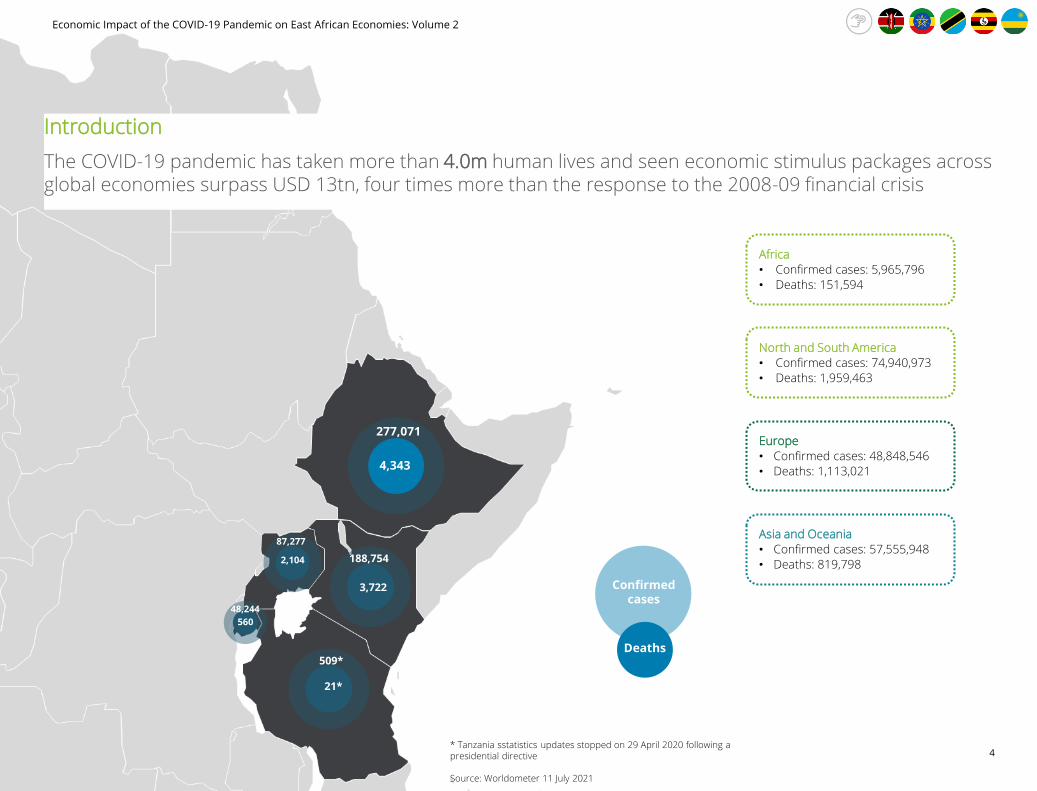
North and South America
• Confirmed cases: 74,940,973
• Deaths: 1,959,463
Europe
• Confirmed cases: 48,848,546
• Deaths: 1,113,021
Asia and Oceania
• Confirmed cases: 57,555,948
• Deaths: 819,798
* Tanzania sstatistics updates stopped on 29 April 2020 following a presidential directive
Source: Worldometer 11 July 2021
4,343
277,071
3,722
188,754
21*
509*
2,104
87,277
560
48,244
Introduction
The COVID-19 pandemic has taken more than 4.0m human lives and seen economic stimulus packages across global economies surpass USD 13tn, four times more than the response to the 2008-09 financial crisis
Africa
• Confirmed cases: 5,965,796
• Deaths: 151,594
Deaths
Confirmed cases

5
Economic Impact of the COVID-19 Pandemic on East African Economies: Volume 2
| At least 213 countries globally have administered more than 3.3bn doses of the COVID-19 vaccine. Different types of vaccines have been developed at record speed, following billions of dollars in investment
1,530.0
2,060.0
1,060.0
646.0
Kenya Ethiopia
Uganda Rwanda
Total administered doses (‘000)
Source: Our World in Data- as of 11 July 2021
Kenya1.90%
Ethiopia
1.80%
Uganda
2.30%
Rwanda
3.00%
Share of vaccinated/population in East Africa
• The vaccine roll-out process in East Africa and largely Sub-Saharan Africa has remained largely slow due to logistical challenges, weak country administration, and public resistance.
• About 18.2m doses have been administered in Sub-Saharan Africa, reflecting a 1.7% share of the population. This is below the global average vaccination rate of 25.1% of the population.
• The delayed vaccine roll-out and the emergence of new variants indicates that the risk of a new wave of infections remains high in the region. This may impede the economic recovery in 2021 as nations will be forced to fall back to stringent social distancing measures witnessed in 2020.
Global average: 25.1%
Africa average: 2.9%
Sub-Sahara Africa average: 1.7%
Introduction

6
Economic Impact of the COVID-19 Pandemic on East African Economies: Volume 2
Source: World Bank, IMF, OECD, EIU, ILO, AFDB
Real GDP growth in major global economies
-3.3%-2.1%
-3.5%
2.3%
-4.8% -4.9%
-8.0%
-9.9%
-8.2%-8.9%
-4.1%
6.0%
3.4%
6.4%8.4%
3.3% 3.6%
12.5%
5.3% 5.8%4.2% 3.7%
-15%
-10%
-5%
0%
5%
10%
15%
Global Africa US China Japan Germany India UK France Italy Brazil
2020 2021F
| The substantial progress in the development of effective vaccines coupled with an investment activity in both advanced and emerging/developing economies will see the global economy recover moderately to a growth of 6.0% in 2021 from a contraction of 3.3% in 2020 amidst the emergence of new variants of the virus in second and third infection waves
Is 2021 the year for recovery?

7
Economic Impact of the COVID-19 Pandemic on East African Economies: Volume 2
• The global economy is estimated to have contracted by 3.3% (USD 4tn contraction) in 2020 but is expected to recover to a growth of 6.0% in 2021. The estimated recession is 0.3% higher than the 3.0% contraction in global GDP initially projected in our Vol.1 publication. The global economy is expected to rebound to a growth of 6.0% in 2021 backed by an upsurge in investment activity and the development of effective vaccines that will curb the spread of the virus.
• Emerging market and developing economies are estimated to have contracted by 2.2% in 2020 and are forecast to revamp to a growth of 6.7% in 2021 driven by improvement in business confidence, consumption, trade and supported by the ongoing vaccination.
• Advanced economies are estimated to have contracted by 4.7% in 2020 and are forecast to rebound to a growth of 5.1% in 2021.
• Key downside risks to the forecasted recovery in 2021 include heightened financial stress augmented by elevated debt levels, persistent policy uncertainty and subdued investment amid lingering trade tensions.
• The pandemic adversely aggravated the global debt crisis. Emerging market and developing economies (EMDEs) were worst affected with government debt estimated to have increased by 930 basis points from 52.1% of GDP in 2019 to 61.4% in 2020 of GDP.
• Following a sharp contraction of 9.5% in 2020, global trade is expected to accelerate to a positive growth averaging 8.4% in 2021.
• The pandemic had deleterious effects on the accumulation of human capital. An additional year of schooling is globally associated with a 10.0% increase in wages. Given this, productivity was largely impacted in 2020 as more than 90% of students globally had their education disrupted.
• An estimated 500 million full-time jobs were destroyed by the pandemic globally in 2020.
• The number of people living in extreme poverty, globally, is estimated to have risen by close to 95m in 2020, reversing several years of poverty reduction. More than half of this increase is estimated to have occurred in South Asia while about one-third is estimated to have occurred in Sub-Saharan Africa.
Selected global macro indicators

8
Economic Impact of the COVID-19 Pandemic on East African Economies: Volume 2
Source: World Bank, IATA, IEA, WTTC, Dow Jones, Mckinsey, S&P Capital IQ, GlobeNewswire
| The estimated 3.3% contraction in Global GDP in 2020 was primarily due to the advancement of the pandemic with far reaching effects witnessed on global industries. The 6.0% growth in global GDP will be driven by expansion in most of the global industries as they recover from the negative effects of the pandemic
Consumer• The Aviation sector generated USD 372bn revenue in 2020, a 55.6% decline from the USD
838bn generated in 2019. Revenues are expected to grow to USD 458bn in 2021, a 39.9% improvement from 2020. However, amidst second/third wave of infections globally, the sector is not expected to recoup this loss.
• Travel and Tourism job losses for 2020 are estimated at 174.4m. GDP losses from the sector are estimated at USD 4.7tn.
• Global auto sales declined from 91m units to 77m units in 2020. In 2021, the sales are forecast to expand by 8%-10% to 83m-85m driven by increased demand as major Asian and American economies recover from the pandemic.
• Increased consumer spending on essential goods drove a 2.9% growth in revenue from USD 5.9tn in 2019 to USD 6.1tn in 2020. A growth of 7.0% is expected in 2021 as economic recovery fuels consumer demand.
02
01
Energy, resources and industrials• Oil prices dropped by an average of 0.2% in 2020 compared to a growth of 29.4% in 2019
while demand is estimated to have fallen by 8.8mb/d in 2020. Lower jet fuel demand due to a struggling aviation sector is expected to see global oil prices decline by 33.7% in 2021, despite an expected rebound in gasoline and diesel demand to 98% of 2019 levels.
• Global electricity demand is estimated to have fallen by 2% in 2020 as upticks in residential demand were outweighed by reduced consumption in commercial and industrial operations, the highest decline in the last 50 years. Demand is set to rebound to a growth of 3% in 2021.
Life sciences and healthcare• The global pharmaceutical market sales are expected to grow by a CAGR of 1.8% from USD
1.2tn in 2020 to USD 1.3tn in 2021 driven by major pharma companies recovering from the pandemic’s effects which had led to restrictive containment measures that impacted on their operations. 03
Global Industries Overview

9
Economic Impact of the COVID-19 Pandemic on East African Economies: Volume 2
Source: World Bank, IATA, IEA, WTTC, Dow Jones, Mckinsey, S&P Capital IQ, GlobeNewswire
Technology, media and telecommunications• Global telecommunication sales are expected to grow at a CAGR of 3.8% from
USD 2.6tn in 2020 to USD 2.7tn in 2021 driven by broadband sales as the demand for data continues to increase as well as industry consolidation.
• The global media and entertainment sector is estimated to have witnessed a 4.8% decline in sales growth from USD 2.1tn in 2019 to USD 2.0tn in 2020 largely due to disruptions in the TV and movie production sub-sector. The sector is forecast to recover to a growth of 10% in 2021, driving sales to USD 2.2tn primarily due to increased consumer spending on entertainment bundles/subscriptions.
04
05
06
Financial services• Global banks are forecasted to report credit losses of USD 2.1tn between 2020
and 2021. The most acute losses are expected among credit card debt, commercial real estate, and small business loans. According to Moody’s ratings, more than 75% of rated banks in 2020 had a negative outlook, compared to just 14% in 2019. Going into 2021, the likelihood of a financial crisis is low, however, considerable risks remain.
• The insurance sector global premiums are estimated to have shrunk by 3.8% in 2020. This is largely attributed to the decline in life insurance premiums by 4.4% while property and casualty insurance premiums are estimated to have declined by 2.9% in 2020. The global insurance premium market is forecast to recover to a growth of 3% in 2021. Life insurance growth will be driven by increased awareness owing to the pandemic while non-life growth will be driven by hardening in commercial insurance i.e., the market is less competitive, and underwriters adhere to stricter standards
Government and public services• Economic stimulus response across economies is estimated to have surpassed
USD 13tn; four times more than the response to the 2008-09 financial crisis. • A shortfall in tax revenues is estimated to have seen government fiscal deficits
rise to USD 10tn in 2020 and is forecast to widen to USD 30tn by 2023. • Higher levels of sovereign debt are also expected to increase government debt
servicing costs by USD 2.5tn over the next decade.
Global Industries Overview
10
Economic Impact of the COVID-19 Pandemic on East African Economies: Volume 2
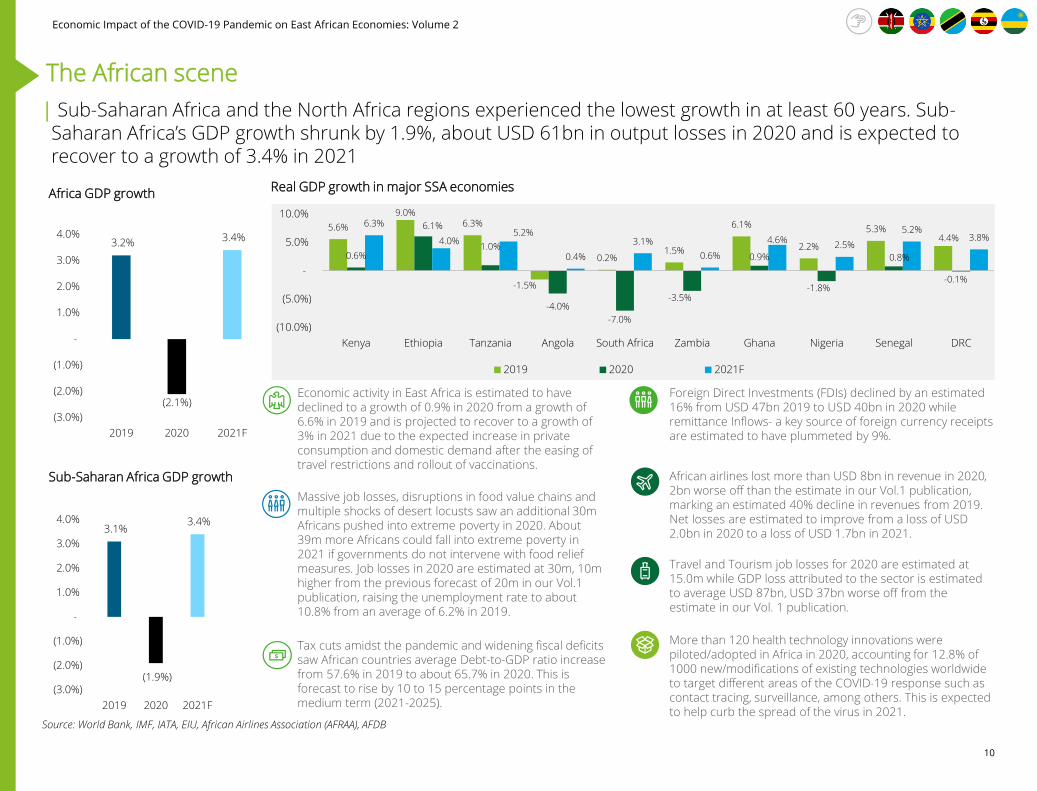
| Sub-Saharan Africa and the North Africa regions experienced the lowest growth in at least 60 years. Sub-Saharan Africa’s GDP growth shrunk by 1.9%, about USD 61bn in output losses in 2020 and is expected to recover to a growth of 3.4% in 2021
5.6%
9.0%6.3%
-1.5%
0.2%1.5%
6.1%
2.2%
5.3%4.4%
0.6%
6.1%
1.0%
-4.0%
-7.0%
-3.5%
0.9%
-1.8%
0.8%
-0.1%
6.3%
4.0%5.2%
0.4%
3.1%
0.6%
4.6%2.5%
5.2%3.8%
(10.0%)
(5.0%)
-
5.0%
10.0%
Kenya Ethiopia Tanzania Angola South Africa Zambia Ghana Nigeria Senegal DRC
2019 2020 2021F
Real GDP growth in major SSA economies
Source: World Bank, IMF, IATA, EIU, African Airlines Association (AFRAA), AFDB
Economic activity in East Africa is estimated to have declined to a growth of 0.9% in 2020 from a growth of 6.6% in 2019 and is projected to recover to a growth of 3% in 2021 due to the expected increase in private consumption and domestic demand after the easing of travel restrictions and rollout of vaccinations.
Foreign Direct Investments (FDIs) declined by an estimated 16% from USD 47bn 2019 to USD 40bn in 2020 while remittance Inflows- a key source of foreign currency receipts are estimated to have plummeted by 9%.
Massive job losses, disruptions in food value chains and multiple shocks of desert locusts saw an additional 30m Africans pushed into extreme poverty in 2020. About 39m more Africans could fall into extreme poverty in 2021 if governments do not intervene with food relief measures. Job losses in 2020 are estimated at 30m, 10m higher from the previous forecast of 20m in our Vol.1 publication, raising the unemployment rate to about 10.8% from an average of 6.2% in 2019.
African airlines lost more than USD 8bn in revenue in 2020, 2bn worse off than the estimate in our Vol.1 publication, marking an estimated 40% decline in revenues from 2019. Net losses are estimated to improve from a loss of USD 2.0bn in 2020 to a loss of USD 1.7bn in 2021.
Travel and Tourism job losses for 2020 are estimated at 15.0m while GDP loss attributed to the sector is estimated to average USD 87bn, USD 37bn worse off from the estimate in our Vol. 1 publication.
Tax cuts amidst the pandemic and widening fiscal deficits saw African countries average Debt-to-GDP ratio increase from 57.6% in 2019 to about 65.7% in 2020. This is forecast to rise by 10 to 15 percentage points in the medium term (2021-2025).
More than 120 health technology innovations were piloted/adopted in Africa in 2020, accounting for 12.8% of 1000 new/modifications of existing technologies worldwide to target different areas of the COVID-19 response such as contact tracing, surveillance, among others. This is expected to help curb the spread of the virus in 2021.
3.2%
(2.1%)
3.4%
(3.0%)
(2.0%)
(1.0%)
-
1.0%
2.0%
3.0%
4.0%
2019 2020 2021F
3.1%
(1.9%)
3.4%
(3.0%)
(2.0%)
(1.0%)
-
1.0%
2.0%
3.0%
4.0%
2019 2020 2021F
Sub-Saharan Africa GDP growth
Africa GDP growth
The African scene
11
Economic Impact of the COVID-19 Pandemic on East African Economies: Volume 2
| Analysis of COVID-19 sector heat maps of the Kenyan economy
The Kenyan Economy

12
Economic Impact of the COVID-19 Pandemic on East African Economies: Volume 2
Source: World Bank, IMF, EIU, CFC Stanbic Bank, NSE, S&P Capital IQ
Real GDP growth rate
2.7% 3.2%
5.7%
-3.3% -2.1%
0.6%
6.0%
3.4%
6.3%
Global Africa Kenya
2019 2020 2021F
Muted demand, tax cuts and
a drop in oil price saw Kenya’s
inflation average 5.6% in
2020. With a favourable
outlook of food prices ahead,
2021 full year inflation
forecast is expected to
remain subdued at 5.0%.
5.2%
5.6%
5.0%
Inflation
2019
2020
2021F
45.4
39.3
53.6
53.9
51.6
48.3
Q1 2020
Q2 2020
Q3 2020
Q4 2020
Q1 2021
Q2 2021
Kenya PMI
Note: PMI>50 indicates an expansion of activity
Note: PMI<50 indicates a contraction in activity
5.8%
5.3% 5.9%
5.1%
(2.0%)
(1.4%)
6.8%
5.7%
6.3%
-3%
-2%
-1%
0%
1%
2%
3%
4%
5%
6%
7%
8%
Agriculture Sevices Industry
2019 2020 2021F
Sectoral growth More than 604 companies in the country had to let go of their employees, resulting in more than 1.7 million job losses in 2020. This saw the unemployment rate rise from an average of 2.6% in 2019 to an estimated 6.2% in 2020.
Kenya’s Debt to GDP ratio rose from an average of 62.1% in 2019 to an estimated 68.7% in 2020 and is forecast to reach 71.5% in 2021 due to the contraction in government income.
The Kenyan shilling remains under pressure against the dollar, deteriorating by 1.8% from an average of KES 106.0/USD as at 08 May 2020 when We published Our Vol.1 publication to KES 107.9 as at 30 June 2021.
The current account deficit narrowed to 4.8% of GDP in 2020 compared to 5.8% of GDP in 2019. This was a positive change compared to the 5% to 6% deficit that had been estimated for 2020 in our Vol.1 publication. The current account deficit is expected to average 5.3% of GDP in 2021.
Kenya’s foreign exchange reserves remained adequate at USD 9.5bn (5.8 months of import cover) as at 30 June 2021. This is a 23.4% increase from USD 7.7bn (4.7 months of import cover) as per Our Vol.1 publication.
50 PMI
Kenya’s real GDP growth rate for 2020 is estimated at 0.6%, 0.4% lower than the projection in our Vol.1 publication
Kenya’s GDP is expected to recover from a meagre growth in 2020 to post a 6.3% growth in 2021 on the back of strong agricultural sector growth and a revamped manufacturing sector.
Foreign Direct Investment (FDI) inflows to Kenya declined by 36.4% to reach USD 0.7bn in 2020, from USD 1.1bn in 2019.
Kenya’s Economy at a Glance

13
Economic Impact of the COVID-19 Pandemic on East African Economies: Volume 2
1.2% 1.0%0.3%
5.8%5.1%
6.8%
0%
1%
2%
3%
4%
5%
6%
7%
8%
2016 2017 2018 2019 2020 2021F
Source: Central Bank of Kenya (CBK), Kenya National Bureau of Statistics (KNBS), EIU, World Bank
Agriculture sector
• The agriculture sector remains fundamentally important to the Kenyan economy, contributing about 33.0% of the GDP and 56% of the employment (both formally and informally). The positive growth of 5.1% in 2020 therefore did go a along way in preventing a contraction of the Kenyan economy.
• At the time of publishing Vol. 1 of this publication in May 2020, Kenya’s Agricultural sector painted a grim outlook due to the locust swarm infestation affecting domestic agricultural production. As of Q4 2020, the sector reflected a revamped outlook owing to favourable rains and success in beating back a second wave of desert locusts. As such, the sector is estimated to have posted a 5.1% growth in 2020, emerging as the silver lining sector. Kenya’s main agricultural export products are coffee, tea and horticulture.
Kenya Agriculture sector perfomance (Y-o-Y growth)
• The adverse impact of the COVID-19 pandemic felt in the horticulture and floriculture sub-sectors eased down in Q3 and Q4 2020. The volume of coffee exported decreased by 10.3% from 50.6T in 2019 to 45.4T in 2020 while the value increased by 9.9% from KES 20.9m in 2019 to KES 23.0 min 2020. The volume of tea exported increased by 21.1% from 475.3T in 2019 to 575.5T in 2020 while the value increased by 14.8% from KES 113.5m in 2019 to KES 130.3m in 2020. The volume of horticultural produce exported increased by 86.3% from 292.8T in 2019 to 545.6T in 2020 while the value increased by 3.3% from KES 112.7m in 2019 to KES 116.4m in 2020.
• Kenya's agriculture sector remains fragmented and largely endowed by small-scale farmers who account for close to 80.0% of the sector’s output. The sector is forecast to grow by 6.8% in 2021 and this largely remains dependent on partnerships with food companies, the development of cooperatives and greater access to credit. Downside risks to these growth prospects stem from unreliable weather patterns, volatile global prices for cash crop exports and inadequate access to affordable farm inputs for small-scale farmers.
• Similarly, investment in sectors strongly linked to agricultural equipment will be needed if the sector is to thrive in the coming years. The development of infrastructure - such as roads, ports, power and credit access will be necessary for sustained growth in the agricultural equipment sector.
56%of the Kenya GDP is contributed by Agriculture
COVID-19 impact on key sectors of Kenya’s economy
| Kenya’s agriculture sector recovered from the locusts invasion to post a 5.1% growth in 2020. This substantially helped fuel the meagre 0.6% overall Kenyan economy GDP growth and avoid a contraction. The sector’s growth is expected to rise to 6.8% in 2021 driven by increased exports of coffee, tea and horticultural products

14
Economic Impact of the COVID-19 Pandemic on East African Economies: Volume 2
Source: Kenya National Bureau of Statistics (KNBS), EIU, Fitch Solutions, Kenya Ministry of Tourism
Tourism/Hospitality sector
• For a sector that has historically contributed to about 9.0% of Kenya’s GDP, the tourism sector faces an uphill task of recovery post COVID-19. Tourist arrivals are estimated to have declined by 78.4% in 2020 compared to the 2019 average. This translates to a 99.7% decline in earnings from KES 163.6bn in 2019 to KES 0.5bn in 2020. This has left more than 1.1m individuals employed in the sector in disarray. In a research conducted by the Ministry of Tourism in June 2020, 81.3% of firms in the sector reported a significant reduction in the number of employees, 85.5% of firms reported the implementation of pay cuts while 81.9% of the firms reported implementation of unpaid leaves in 2020.
• The decline in international tourism arrivals led to an abrupt and unprecedented drop in hotel demand that led to the closure of most hotels, consequently sending staff home on unpaid leave or worse, permanent dismissal. The total loss in hotel room revenue for 2020 is estimated at USD 511m.
99
.7
11
9.9
15
7.4
16
3.6
0.5
0.7
1,6661,778
2,028 2,035
439
806
0
500
1000
1500
2000
2500
0
20
40
60
80
100
120
140
160
180
2016 2017 2018 2019 2020 2021F
Tourism earnings (KES bn) International arrivals ('000)
Kenya Tourism sector perfomance
• Kenya’s national carrier; KQ was already in distress way before the pandemic, posting a whooping net loss of KES 19bn for the period ended 30 June 2020, a worse of position from the KES 13bn loss posted in the 2019 financial year. The airline lost more than 80.0% of its passenger traffic in 2020 and was forced to seek over KES 7.0bn in bailout from the national government in order to survive through the tumultuous times. The full year revenue loss for the carrier in 2020 is estimated to have surpassed KES 53bn.
• As a third wave of the pandemic hits several countries, a raft of social distancing measures will see tourism levels in 2021 remain below historic levels. Despite this, the tourism sector is expected to post modest recovery in 2021 with international arrivals forecasted to rise by 37% to 806k. To aid the recovery, the Kenyan government set aside KES 2bn for renovation in the hospitality sector, KES 1bn for hiring 5,500 wildlife scouts and KES 1bn for game parks and conservancies. This is a significant increase in aid compared to the KES 500m the government had set aside to aid the sector as at the time of publishing our Vol. 1 publication, indicating the higher government intervention due to challenges faced by sector in 2020.
• To underpin a positive momentum in the aftermath of the pandemic, the growth of low-cost flight networks, a broadening of source markets, collaborative strategies among key public and private sectors, and the recovery of disposable incomes is vital. Key challenges in the sector posing a risk to the recovery include infrastructure growth, terrorism concerns and capital funding for tourism Small and Medium Enterprises (SMEs).
9%of the Kenya GDP stems from tourism
COVID-19 impact on key sectors of Kenya’s economy
| International tourism arrivals in Kenya experienced an overwhelming 78.4% decline from 2.0m arrivals in 2019 to an estimated 439k arrivals in 2020. Due to the global vaccination drive and the revamp in global aviation, international arrivals are forecast to increase by 183% to 806k in 2021 while tourism earnings rise by 40% from KES 0.5bn to KES 0.7bn
15
Economic Impact of the COVID-19 Pandemic on East African Economies: Volume 2
Manufacturing sector
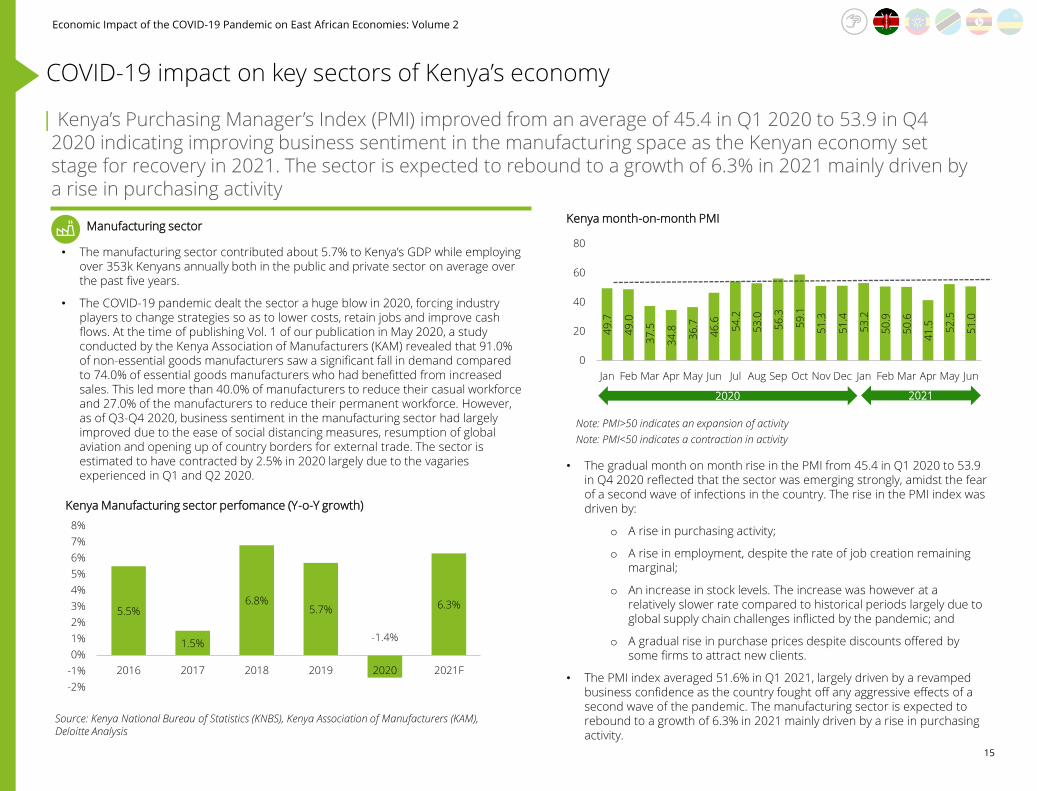
• The manufacturing sector contributed about 5.7% to Kenya’s GDP while employing over 353k Kenyans annually both in the public and private sector on average over the past five years.
• The COVID-19 pandemic dealt the sector a huge blow in 2020, forcing industry players to change strategies so as to lower costs, retain jobs and improve cash flows. At the time of publishing Vol. 1 of our publication in May 2020, a study conducted by the Kenya Association of Manufacturers (KAM) revealed that 91.0% of non-essential goods manufacturers saw a significant fall in demand compared to 74.0% of essential goods manufacturers who had benefitted from increased sales. This led more than 40.0% of manufacturers to reduce their casual workforce and 27.0% of the manufacturers to reduce their permanent workforce. However, as of Q3-Q4 2020, business sentiment in the manufacturing sector had largely improved due to the ease of social distancing measures, resumption of global aviation and opening up of country borders for external trade. The sector is estimated to have contracted by 2.5% in 2020 largely due to the vagaries experienced in Q1 and Q2 2020.
Source: Kenya National Bureau of Statistics (KNBS), Kenya Association of Manufacturers (KAM), Deloitte Analysis
5.5%
1.5%
6.8%5.7%
-1.4%
6.3%
-2%
-1%
0%
1%
2%
3%
4%
5%
6%
7%
8%
2016 2017 2018 2019 2020 2021F
Kenya Manufacturing sector perfomance (Y-o-Y growth)
49
.7
49
.0
37
.5
34
.8
36
.7
46
.6
54
.2
53
.0
56
.3
59
.1
51
.3
51
.4
53
.2
50
.9
50
.6
41
.5 52
.5
51
.0
0
20
40
60
80
Jan Feb Mar Apr May Jun Jul Aug Sep Oct Nov Dec Jan Feb Mar Apr May Jun
Kenya month-on-month PMI
Note: PMI>50 indicates an expansion of activity
Note: PMI<50 indicates a contraction in activity
• The gradual month on month rise in the PMI from 45.4 in Q1 2020 to 53.9 in Q4 2020 reflected that the sector was emerging strongly, amidst the fear of a second wave of infections in the country. The rise in the PMI index was driven by:
o A rise in purchasing activity;
o A rise in employment, despite the rate of job creation remaining marginal;
o An increase in stock levels. The increase was however at a relatively slower rate compared to historical periods largely due to global supply chain challenges inflicted by the pandemic; and
o A gradual rise in purchase prices despite discounts offered by some firms to attract new clients.
• The PMI index averaged 51.6% in Q1 2021, largely driven by a revamped business confidence as the country fought off any aggressive effects of a second wave of the pandemic. The manufacturing sector is expected to rebound to a growth of 6.3% in 2021 mainly driven by a rise in purchasing activity.
2020 2021
COVID-19 impact on key sectors of Kenya’s economy
| Kenya’s Purchasing Manager’s Index (PMI) improved from an average of 45.4 in Q1 2020 to 53.9 in Q4 2020 indicating improving business sentiment in the manufacturing space as the Kenyan economy set stage for recovery in 2021. The sector is expected to rebound to a growth of 6.3% in 2021 mainly driven by a rise in purchasing activity
16
Economic Impact of the COVID-19 Pandemic on East African Economies: Volume 2
Source: Kenya National Bureau of Statistics (KNBS), Fitch Solutions, Architectural Association of Kenya (AAK)
Construction sector
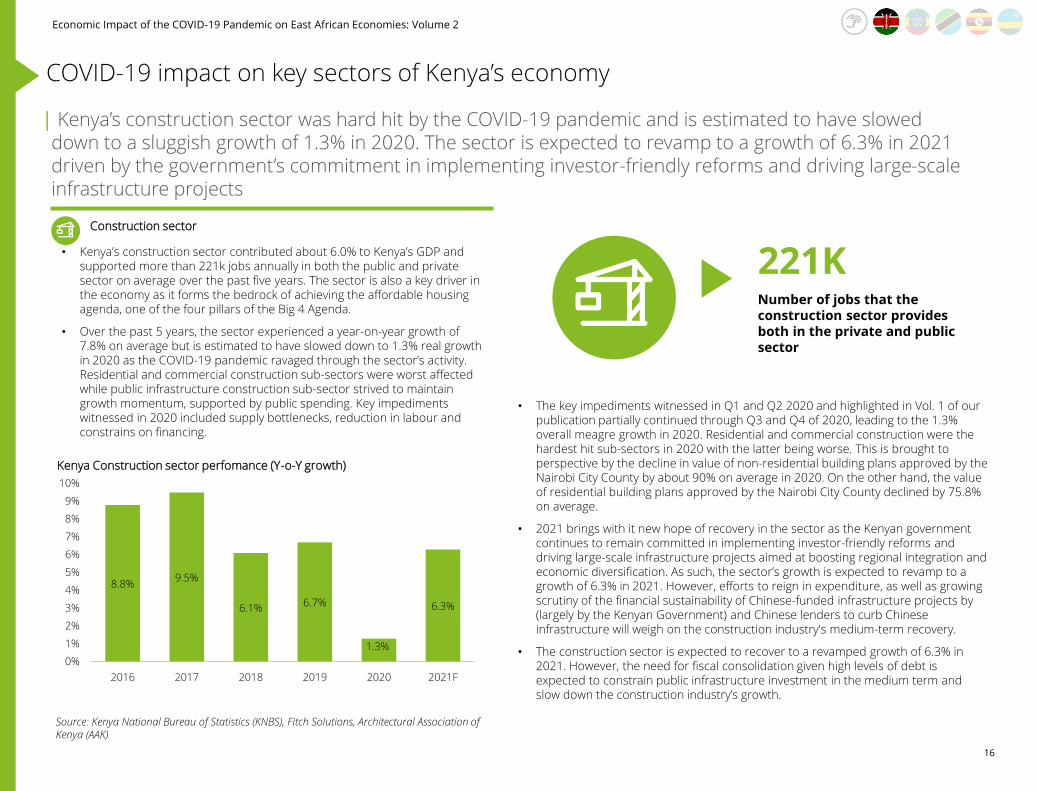
• Kenya’s construction sector contributed about 6.0% to Kenya’s GDP and supported more than 221k jobs annually in both the public and private sector on average over the past five years. The sector is also a key driver in the economy as it forms the bedrock of achieving the affordable housing agenda, one of the four pillars of the Big 4 Agenda.
• Over the past 5 years, the sector experienced a year-on-year growth of 7.8% on average but is estimated to have slowed down to 1.3% real growth in 2020 as the COVID-19 pandemic ravaged through the sector’s activity. Residential and commercial construction sub-sectors were worst affected while public infrastructure construction sub-sector strived to maintain growth momentum, supported by public spending. Key impediments witnessed in 2020 included supply bottlenecks, reduction in labour and constrains on financing.
• The key impediments witnessed in Q1 and Q2 2020 and highlighted in Vol. 1 of our publication partially continued through Q3 and Q4 of 2020, leading to the 1.3% overall meagre growth in 2020. Residential and commercial construction were the hardest hit sub-sectors in 2020 with the latter being worse. This is brought to perspective by the decline in value of non-residential building plans approved by the Nairobi City County by about 90% on average in 2020. On the other hand, the value of residential building plans approved by the Nairobi City County declined by 75.8% on average.
• 2021 brings with it new hope of recovery in the sector as the Kenyan government continues to remain committed in implementing investor-friendly reforms and driving large-scale infrastructure projects aimed at boosting regional integration and economic diversification. As such, the sector’s growth is expected to revamp to a growth of 6.3% in 2021. However, efforts to reign in expenditure, as well as growing scrutiny of the financial sustainability of Chinese-funded infrastructure projects by (largely by the Kenyan Government) and Chinese lenders to curb Chinese infrastructure will weigh on the construction industry's medium-term recovery.
• The construction sector is expected to recover to a revamped growth of 6.3% in 2021. However, the need for fiscal consolidation given high levels of debt is expected to constrain public infrastructure investment in the medium term and slow down the construction industry’s growth.
8.8%9.5%
6.1% 6.7%
1.3%
6.3%
0%
1%
2%
3%
4%
5%
6%
7%
8%
9%
10%
2016 2017 2018 2019 2020 2021F
Kenya Construction sector perfomance (Y-o-Y growth)
221KNumber of jobs that the construction sector provides both in the private and public sector
COVID-19 impact on key sectors of Kenya’s economy
| Kenya’s construction sector was hard hit by the COVID-19 pandemic and is estimated to have slowed down to a sluggish growth of 1.3% in 2020. The sector is expected to revamp to a growth of 6.3% in 2021 driven by the government’s commitment in implementing investor-friendly reforms and driving large-scale infrastructure projects

17
Economic Impact of the COVID-19 Pandemic on East African Economies: Volume 2
Source: Kenya National Bureau of Statistics (KNBS), Fitch Solutions, Cytonn, Architectural Association of Kenya (AAK)
Real estate sector
• Kenya’s real estate sector growth has been turbulent over the past 5 years, ranging from a high of 12.2% growth in 2016 to a low of 5.6% growth in 2018. The sector posted a growth of 8.3% in 2019 and is estimated to have had a paltry 1.0% growth in 2020 owing to a persistent supply glut and dampened demand.
• The COVID-19 pandemic had several negative impacts in the sector, with the most severe being financing impediments. At the time of publishing Vol. 1 of our publication, a study conducted by the KNBS in Q2 2020 revealed that 30.5% of Kenyans who rented houses were unable to pay their rent on time. Other severe consequences witnessed in 2020 include a slowdown in collections for off-plan real estate purchases on instalment plans and in building approvals as public offices remained closed. House prices contracted by an estimated 0.2% in 2020, attributable to the economic slump which affected both demand and supply in the residential market.
• The office sub-sector was largely affected by the COVID-19 pandemic, albeit the year-on-year historical contraction in the sub-sector. Dwindling demand and high levels of supply saw rental yields decline from 7.8% to 7.3% between Q1 2020 and Q4 2020. On the back of remote working and scaling down of operations by companies owing to COVID-19 social distancing measures, demand slowed down further, positioning tenants favourably to acquire lower rental contractual agreements. Rental yields averaged 7.1% in 2020. Oversupply of office space is expected to see office rental rates decline to USD 8.7/sqm in 2021
• The retail subsector witnessed a significant decline in occupancy rates as retailers made strategic decisions to cushion themselves against the negative impacts of the pandemic. Rental yields declined by 0.3% from an average of 7.0% in 2019 to 6.7% in 2020. The oversupply of retail space, constrained spending power among consumers resulting from a decrease in disposable incomes and a growing trend towards online shopping will consequently force landlords to provide concessions and other incentives to attract new clientele or retain existing tenants into 2021. As such, retail rental rates are expected to decline to USD 14.6/sqm in 2021.
• The industrial sub-sector experienced a stagnation of rental yields in 2020 as a limited supply of prime stock was met by a lack of development activity in the industrial market. Infrastructure development and the integration of new industrial-economic zones is expected to spur demand for industrial space between 2021-2024. Consequently, industrial rental rates are expected to rise to USD 3.7/sqm in 2021. The completion of Phase 2A of the Standard Gauge Railway and the construction of an inland container depot in Naivasha is also expected to catalyse growth in the sub-sector between 2021-2024.
Kenya Real estate rental rates (USD/sqm)
9.8 9.7 9.5 8.8 8.7
16.5 16.4 16.214.8 14.6
3.5 3.7 3.73.6 3.7
0
5
10
15
20
25
30
35
2017 2018 2019 2020 2021F
Office rates Retail rates Industrial rates
The COVID-19 pandemic had several negative impacts in the sector, with the most severe being financing impediments
COVID-19 impact on key sectors of Kenya’s economy
| Office rental rates are estimated to have declined from an average of USD 9.5/sqm in 2019 to USD 8.8/sqm in 2020 while retail rental rates are estimated to have declined from an average of USD 16.2/sqm in 2019 to USD 14.8/sqm in 2020. Oversupply of office space will see office rental rates decline to USD 8.7/sqm in 2021 as retail rates decline to USD 14.6/sqm

18
Economic Impact of the COVID-19 Pandemic on East African Economies: Volume 2
• The COVID-19 pandemic saw the bourse lose its market capitalisation by about 23.3%, from an average of KES 3.0bn in Jan-2020 to KES 2.3bn as of 30 June 2021 as most investors continued to engage in a net selling position, with a preferred option of purchasing fixed income securities due to uncertainty in the market. As at 30 June 2021, the three largest contractions in YTD perfomance were witnessed in the energy and petroleum, construction and allied, and investment industries that posted a contraction of 10.1%, 5.8% and 4.3% respectively. On the other, the most significant growth was witnessed in the telecommunication and technology sector with a YTD perfomance of 21.0%. Subsequently, the number of equity transactions in 2020 decline by 15.5% from 21.5k transactions as of Jan-20 to 18.1k transactions as of Dec-20.
• The 2021 outlook points at an existing investment vacuum created for non risk averse investors with the market trading at below average valuation multiples compared to historical norms. Further, the planned launch of a new commodity exchange and the recent introduction of new small- and medium-sized enterprise bonds and derivatives trading will see the NSE remain the leading bourse in East Africa.
NASI YTD (as of 30 June 2021) performance by sector
(2.4%)
17.8%
6.1% 4.8%
(5.8%)
(10.1%)3.4%
(4.3%) 1.4%
21.0%
14.1%
Agriculture Automobiles and accessories
Banking Commercial And Services
Construction And Allied Energy And Petroleum
Insurance Investment
Manufacturing And Allied Telecommunication And Technology
Nasi All Share Index
Financial services industry | Equity market
• Kenya’s equity market continues to recover from the turbulence caused by the COVID-19 pandemic, albeit at a gradual pace. As referenced in Vol. 1 of Our publication, large cap stocks such as Safaricom and KCB had declined by 5.4% and 7.0% respectively on 13 March 2020, the first day a COVID-19 case was reported in the country. However, as of 30 June 2021, Safaricom stocks had improved to a YTD growth of 21.0% while KCB stocks posted a YTD growth of 11.9%. The gradual improvement in large cap stocks steadied the upswing of the equity market in 2020.
• The market’s average price to earnings ratio (P/E) stood at 9.3x as of 30 June 2021, 28.5% below the 11-year historical average of 13.0x.
16
2.1
14
8.6
13
1.9
13
7.6
13
7.1
13
7.7
13
4.5
13
9.7
14
0.4
14
0.0
14
5.2
15
2.1
15
5.6
16
5.4
15
8.6
16
9.2
17
0.0
17
3.5
-20%
-15%
-10%
-5%
0%
5%
10%
0
20
40
60
80
100
120
140
160
180
200
Jan
-20
Feb
-20
Ma
r-2
0
Ap
r-2
0
Ma
y-2
0
Jun
-20
Jul-
20
Au
g-2
0
Se
p-2
0
Oct
-20
No
v-2
0
De
c-2
0
Jan
-21
Feb
-21
Ma
r-2
1
Ap
r-2
1
Ma
y-2
1
Jun
-21
Share price (KES) YTD change (%)
Nairobi All Share Index (NASI) perfomance
Source: S&P Capital IQ, Deloitte Analysis
COVID-19 impact on key sectors of Kenya’s economy
| Kenya’s equity market has since recovered from the initial shocks of the COVID-19 pandemic although investor sentiment remains weak The NSE20, NSE25 and NASI indexes all recorded a growth of 2.4%, 14.3%, and 11.5% as of 30 June 2021

19
Economic Impact of the COVID-19 Pandemic on East African Economies: Volume 2
Source: Kenya National Bureau of Statistics (KNBS), Fitch Solutions, Cytonn, Central Bank of Kenya
Financial services industry | Banking
• The financial services sector grew by 5.5% and contributed 4.8% to Kenya's GDP in 2019, driven by the rate cap repeal benefits that allowed financial institutions to price risk appropriately. As of Q4 2020, Kenya had a total of 38 commercial banks, 1 mortgage finance company, 13 microfinance banks, 9 representative offices of foreign banks, 74 foreign exchange bureaus, 18 money remittance providers and 3 credit reference bureaus in the banking sector. The sector is moderately concentrated, with the eight largest Kenyan banks accounting for around 75% of the assets.
• The COVID-19 pandemic saw Kenyan banks asset quality weaken as evidenced by the high Non-Performing Loans (NPL) ratio of 15% by end of 2020 compared to an NPL ratio of 12% by end of 2019. Prudent growth strategies saw client loans grow by 7% in 2020. Subsequently, Kenyan banks restructured more than KES 1.1tn loans, about 38% of the total industry loan book in 2020 in line with the Central Bank’s directive on loan reclassification and restructuring.
• The pandemic also ravaged through the banking sector’s profitability in 2020. Kenyan Tier 1 Banks 2020 full-year results showed a sharp decline in profitability due to falling earnings reflecting policy rate cuts, lower client activity and rising loan impairment charges (LICs). Debt relief measures and subdued loan growth also hampered profitability. The Tier 1 Banks profits fell by a 25.7% from an average of KES 12.2bn in 2019 to KES 9.1bn in 2020.
• Kenyan banks are expected to remain adamantly cautious of new lending and may prefer investing in government securities as a safer alternative to private credit growth. Client loan growths are estimated to have averaged 7% in 2020 and are forecast to remain muted at a 7% growth in 2021. Banks’ own debt relief measures, including loan repayment holidays, moratoriums and restructurings are expected to prevent a faster rise in NPLs in 2021, albeit this acting as a temporary measure. Financial inclusion is expected to remain a key driver for phenomenal growth as the financial inclusion rate continues to soar high (estimated at 85% as of 2020).
4.8
5.4
6.0
2.6 2.9 3.22.7 2.9 3.1
0
1
2
3
4
5
6
7
2019 2020 2021F
Total Assets (Kes tn) Client deposits (Kes m) Client loans (Kes m)
Kenyan Banks deposits and loans
4.8%is the contribution of the financial services industry to the GDP
COVID-19 impact on key sectors of Kenya’s economy
| Tepid credit growth, heightened asset quality risks and lower profits were witnessed as the key downside risks for Kenyan banks in 2020 as the COVID-19 pandemic ravaged through the operating environment. Client loan growths are estimated to have averaged 7% in 2020 and are forecast to remain muted at a 7% growth in 2021
20
Economic Impact of the COVID-19 Pandemic on East African Economies: Volume 2
Source: Kenya National Bureau of Statistics (KNBS), Communications Authority of Kenya (CA), Fitch Solutions
Technology, media and telecommunications industry| Mobile NetworkOperators (MNOs)
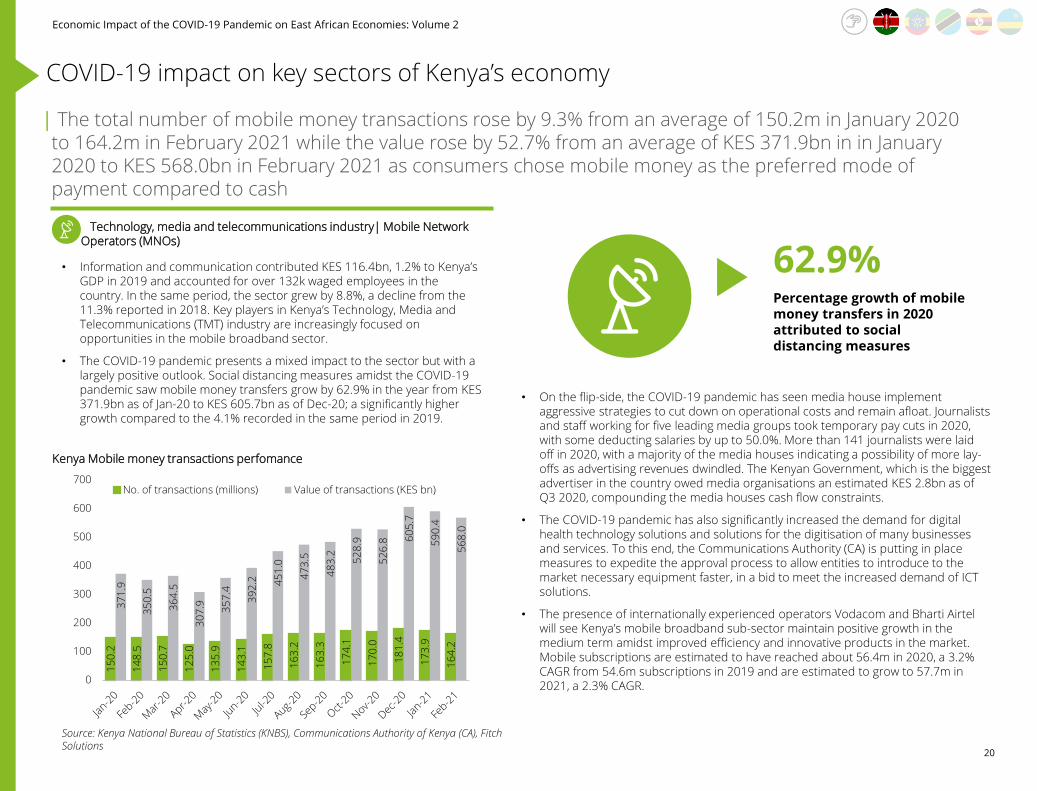
• Information and communication contributed KES 116.4bn, 1.2% to Kenya’s GDP in 2019 and accounted for over 132k waged employees in the country. In the same period, the sector grew by 8.8%, a decline from the 11.3% reported in 2018. Key players in Kenya’s Technology, Media and Telecommunications (TMT) industry are increasingly focused on opportunities in the mobile broadband sector.
• The COVID-19 pandemic presents a mixed impact to the sector but with a largely positive outlook. Social distancing measures amidst the COVID-19 pandemic saw mobile money transfers grow by 62.9% in the year from KES 371.9bn as of Jan-20 to KES 605.7bn as of Dec-20; a significantly higher growth compared to the 4.1% recorded in the same period in 2019.
• On the flip-side, the COVID-19 pandemic has seen media house implement aggressive strategies to cut down on operational costs and remain afloat. Journalists and staff working for five leading media groups took temporary pay cuts in 2020, with some deducting salaries by up to 50.0%. More than 141 journalists were laid off in 2020, with a majority of the media houses indicating a possibility of more lay-offs as advertising revenues dwindled. The Kenyan Government, which is the biggest advertiser in the country owed media organisations an estimated KES 2.8bn as of Q3 2020, compounding the media houses cash flow constraints.
• The COVID-19 pandemic has also significantly increased the demand for digital health technology solutions and solutions for the digitisation of many businesses and services. To this end, the Communications Authority (CA) is putting in place measures to expedite the approval process to allow entities to introduce to the market necessary equipment faster, in a bid to meet the increased demand of ICT solutions.
• The presence of internationally experienced operators Vodacom and Bharti Airtel will see Kenya’s mobile broadband sub-sector maintain positive growth in the medium term amidst improved efficiency and innovative products in the market. Mobile subscriptions are estimated to have reached about 56.4m in 2020, a 3.2% CAGR from 54.6m subscriptions in 2019 and are estimated to grow to 57.7m in 2021, a 2.3% CAGR.
Kenya Mobile money transactions perfomance
15
0.2
14
8.5
15
0.7
12
5.0
13
5.9
14
3.1
15
7.8
16
3.2
16
3.3
17
4.1
17
0.0
18
1.4
17
3.9
16
4.2
37
1.9
35
0.5
36
4.5
30
7.9 35
7.4
39
2.2 45
1.0
47
3.5
48
3.2 52
8.9
52
6.8 6
05
.7
59
0.4
56
8.0
0
100
200
300
400
500
600
700No. of transactions (millions) Value of transactions (KES bn)
62.9%Percentage growth of mobile money transfers in 2020 attributed to social distancing measures
COVID-19 impact on key sectors of Kenya’s economy
| The total number of mobile money transactions rose by 9.3% from an average of 150.2m in January 2020 to 164.2m in February 2021 while the value rose by 52.7% from an average of KES 371.9bn in in January 2020 to KES 568.0bn in February 2021 as consumers chose mobile money as the preferred mode of payment compared to cash

21
Economic Impact of the COVID-19 Pandemic on East African Economies: Volume 2
| Analysis of COVID-19 sector heat maps of the Ethiopian economy
The Ethiopian Economy
22
Economic Impact of the COVID-19 Pandemic on East African Economies: Volume 2
Source: World Bank, IMF, EIU, Fitch, NBE, Deloitte Analysis
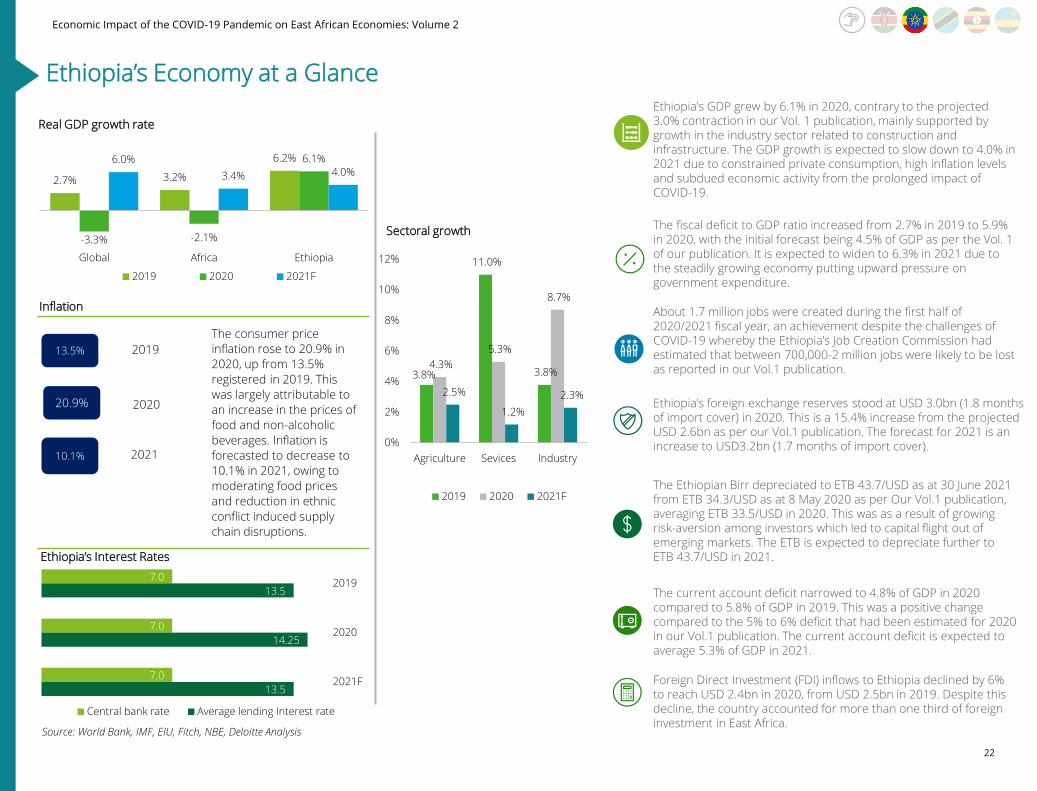
Real GDP growth rate
2.7% 3.2%
6.2%
-3.3% -2.1%
6.1%6.0%
3.4% 4.0%
Global Africa Ethiopia
2019 2020 2021F
The consumer price
inflation rose to 20.9% in
2020, up from 13.5%
registered in 2019. This
was largely attributable to
an increase in the prices of
food and non-alcoholic
beverages. Inflation is
forecasted to decrease to
10.1% in 2021, owing to
moderating food prices
and reduction in ethnic
conflict induced supply
chain disruptions.
13.5%
20.9%
10.1%
Inflation
2019
2020
2021
7.0
7.0
7.0
13.5
14.25
13.5
2019
2020
2021F
Central bank rate Average lending Interest rate
Ethiopia’s Interest Rates
Sectoral growth
3.8%
11.0%
3.8% 4.3%
5.3%
8.7%
2.5%
1.2%
2.3%
0%
2%
4%
6%
8%
10%
12%
Agriculture Sevices Industry
2019 2020 2021F
Foreign Direct Investment (FDI) inflows to Ethiopia declined by 6% to reach USD 2.4bn in 2020, from USD 2.5bn in 2019. Despite this decline, the country accounted for more than one third of foreign investment in East Africa.
About 1.7 million jobs were created during the first half of 2020/2021 fiscal year, an achievement despite the challenges of COVID-19 whereby the Ethiopia’s Job Creation Commission had estimated that between 700,000-2 million jobs were likely to be lost as reported in our Vol.1 publication.
The fiscal deficit to GDP ratio increased from 2.7% in 2019 to 5.9% in 2020, with the initial forecast being 4.5% of GDP as per the Vol. 1 of our publication. It is expected to widen to 6.3% in 2021 due to the steadily growing economy putting upward pressure on government expenditure.
The Ethiopian Birr depreciated to ETB 43.7/USD as at 30 June 2021 from ETB 34.3/USD as at 8 May 2020 as per Our Vol.1 publication, averaging ETB 33.5/USD in 2020. This was as a result of growing risk-aversion among investors which led to capital flight out of emerging markets. The ETB is expected to depreciate further to ETB 43.7/USD in 2021.
The current account deficit narrowed to 4.8% of GDP in 2020 compared to 5.8% of GDP in 2019. This was a positive change compared to the 5% to 6% deficit that had been estimated for 2020 in our Vol.1 publication. The current account deficit is expected to average 5.3% of GDP in 2021.
Ethiopia’s foreign exchange reserves stood at USD 3.0bn (1.8 months of import cover) in 2020. This is a 15.4% increase from the projected USD 2.6bn as per our Vol.1 publication. The forecast for 2021 is an increase to USD3.2bn (1.7 months of import cover).
Ethiopia’s GDP grew by 6.1% in 2020, contrary to the projected 3.0% contraction in our Vol. 1 publication, mainly supported by growth in the industry sector related to construction and infrastructure. The GDP growth is expected to slow down to 4.0% in 2021 due to constrained private consumption, high inflation levels and subdued economic activity from the prolonged impact of COVID-19.
Ethiopia’s Economy at a Glance
23
Economic Impact of the COVID-19 Pandemic on East African Economies: Volume 2
Agriculture sector
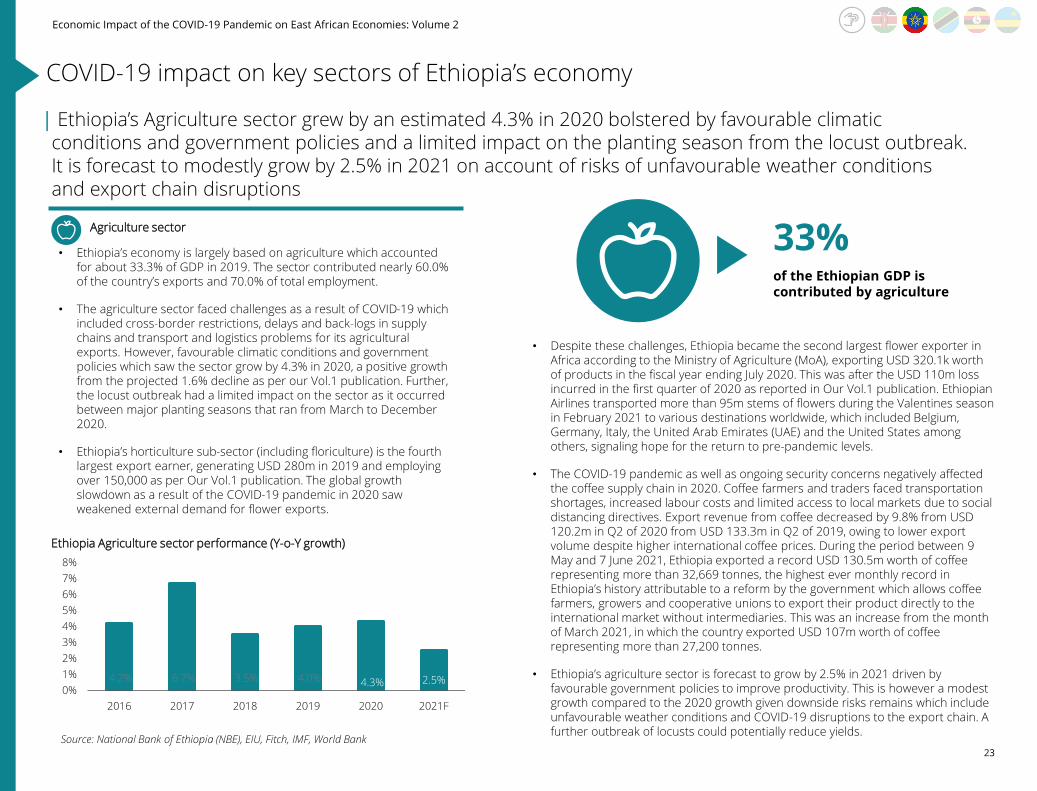
• Ethiopia’s economy is largely based on agriculture which accounted for about 33.3% of GDP in 2019. The sector contributed nearly 60.0% of the country’s exports and 70.0% of total employment.
• The agriculture sector faced challenges as a result of COVID-19 which included cross-border restrictions, delays and back-logs in supply chains and transport and logistics problems for its agricultural exports. However, favourable climatic conditions and government policies which saw the sector grow by 4.3% in 2020, a positive growth from the projected 1.6% decline as per our Vol.1 publication. Further, the locust outbreak had a limited impact on the sector as it occurred between major planting seasons that ran from March to December 2020.
• Ethiopia’s horticulture sub-sector (including floriculture) is the fourth largest export earner, generating USD 280m in 2019 and employing over 150,000 as per Our Vol.1 publication. The global growth slowdown as a result of the COVID-19 pandemic in 2020 saw weakened external demand for flower exports.
Source: National Bank of Ethiopia (NBE), EIU, Fitch, IMF, World Bank
| Ethiopia’s Agriculture sector grew by an estimated 4.3% in 2020 bolstered by favourable climatic conditions and government policies and a limited impact on the planting season from the locust outbreak. It is forecast to modestly grow by 2.5% in 2021 on account of risks of unfavourable weather conditions and export chain disruptions
Ethiopia Agriculture sector performance (Y-o-Y growth)
• Despite these challenges, Ethiopia became the second largest flower exporter in Africa according to the Ministry of Agriculture (MoA), exporting USD 320.1k worth of products in the fiscal year ending July 2020. This was after the USD 110m loss incurred in the first quarter of 2020 as reported in Our Vol.1 publication. Ethiopian Airlines transported more than 95m stems of flowers during the Valentines season in February 2021 to various destinations worldwide, which included Belgium, Germany, Italy, the United Arab Emirates (UAE) and the United States among others, signaling hope for the return to pre-pandemic levels.
• The COVID-19 pandemic as well as ongoing security concerns negatively affected the coffee supply chain in 2020. Coffee farmers and traders faced transportation shortages, increased labour costs and limited access to local markets due to social distancing directives. Export revenue from coffee decreased by 9.8% from USD 120.2m in Q2 of 2020 from USD 133.3m in Q2 of 2019, owing to lower export volume despite higher international coffee prices. During the period between 9 May and 7 June 2021, Ethiopia exported a record USD 130.5m worth of coffee representing more than 32,669 tonnes, the highest ever monthly record in Ethiopia’s history attributable to a reform by the government which allows coffee farmers, growers and cooperative unions to export their product directly to the international market without intermediaries. This was an increase from the month of March 2021, in which the country exported USD 107m worth of coffee representing more than 27,200 tonnes.
• Ethiopia’s agriculture sector is forecast to grow by 2.5% in 2021 driven by favourable government policies to improve productivity. This is however a modest growth compared to the 2020 growth given downside risks remains which include unfavourable weather conditions and COVID-19 disruptions to the export chain. A further outbreak of locusts could potentially reduce yields.
4.2% 6.7% 3.5% 4.0% 4.3% 2.5% 0%
1%
2%
3%
4%
5%
6%
7%
8%
2016 2017 2018 2019 2020 2021F
33%of the Ethiopian GDP is contributed by agriculture
COVID-19 impact on key sectors of Ethiopia’s economy

24
Economic Impact of the COVID-19 Pandemic on East African Economies: Volume 2
Aviation sector
• Ethiopia’s airline industry supports over 1.1m jobs and contributed 5.4% to Ethiopia’s GDP (about USD 4.15bn) in 2019.
• Ethiopian Airlines suffered a significant loss of about USD 1bn in passenger flight revenue between January and June 2020 out of which USD 550m loss occurred between January and April 2020 as per our Vol. 1 publication. As a result of this, the airline took advantage of its large fleet and destination networks to ferry cargo across the globe and converted 20 passenger aircraft to cargo planes during the onset of the pandemic.
• Increased demand through June saw the airline double its cargo revenue and its cargo route expanded to 74 destinations. This diversification strategy allowed it to stay profitable without bailout money or borrowing, closing the past fiscal year ending July 2020 with an estimated profit of USD 260m.
Source: Ethiopian Airlines, IATA,
| Ethiopian Airlines managed to be profitable in the fiscal year ended July 2020, with an estimated profit of USD 260m despite a drop in revenues from USD 3.9bn in 2019 to USD 2.1bn in 2020 owing to its cargo diversification strategy and repatriation flights. The acceleration of the COVID-19 vaccine roll-out should see core passenger revenues recover in 2021
Ethiopian Airlines Revenue Y-o-Y growth
• Through this cargo diversification strategy, Ethiopian Airlines indicated that it had operated a total of 33,182 flights and transported 735, 869 tonnes of cargo between 25 March 2020 and 25 March 2021. The airline won a gold award for being the leading airline in terms of cargo transported in and out of Guangdong Airport with 54.4m kilograms in 2020. This was as a result of a strong partnership with China throughout the pandemic even as other airlines halted flights to China.
• The outlook for 2021 critically depends on the pace of the COVID-19 vaccine rollout. The acceleration of the vaccine rollout plans and easing of travel restrictions may lead to an increase of passenger flights in 2021 which has historically been the airline’s core revenue stream. The airline has gone digital in all of its operations to avoid physical contact and stem the spread of COVID-19 as part of boosting traveller confidence and convenience. It recently became the first African carrier to trial the IATA Travel Pass, a digital travel mobile app to enhance efficiency in testing or vaccine verifications. With the pandemic still ongoing, cargo remains a strong business for Ethiopian Airlines and is expected to remain profitable in 2021 on the backdrop of this.
2.43 2.71 3.7 3.9 2.1
4.2%11.5%
36.5%
5.4%
-46
.2%
-60%
-40%
-20%
0%
20%
40%
60%
0
1
1
2
2
3
3
4
4
5
2015/2016 2016/2017 2017/2018 2018/2019 2019/2020
Revenue (USDbn) Y-o-Y growth %
1.1Mnumber of employees that depend on the aviation sector
COVID-19 impact on key sectors of Ethiopia’s economy

25
Economic Impact of the COVID-19 Pandemic on East African Economies: Volume 2
Tourism/hospitality sector
• The Tourism sector remains crucial to Ethiopia’s economy representing about 5.0% of Ethiopia’s GDP and supporting more than 2.2 million jobs (about 8.3% of total employment) in the country.
• In Our Vol. 1 publication, initial forecasts had suggested a 6% and 5.3% increase in tourist arrivals and international receipts respectively, as Ethiopia was seen as not likely to be severely affected by a drop in Chinese tourism and the country had recorded relatively few cases at the time. However, the devastating impact of the COVID-19 pandemic coupled with heightened political risk in the country saw tourist arrivals and international receipts decline by an estimated 67.3% and 75.2% respectively to reach an estimated 266k arrivals and USD 1.0bn respectively in 2020.
• Against the backdrop of the devastating effects of the travel related restrictions, hotel occupancy rates reached a low of 2% leading to 88% of hotels in Addis Ababa either partially or fully halting operations in 2020 as per our Vol. 1 publication.
Source: Fitch Solutions, World Bank, Ethiopia Tourism Ministry
| Following the devastating impact of the COVID-19 pandemic in 2020, tourist arrivals declined by an estimated 67.3%, from 812k in 2019 to 266k in 2020. Tourist arrivals are forecast to rebound by 38.8% in 2021 to reach 369k supported by increased demand for foreign travel. Political instability however poses a threat to this outlook
2.1 2.5 3.5 4.2 1.0 1.6
871 933 849 893
266
369
0
200
400
600
800
1000
0
1
2
3
4
5
2016 2017 2018 2019 2020 2021F
Tourism earnings (USDbn) International arrivals ('000)
Ethiopia Tourism sector perfomance
• The hotel industry growth slowed down to 2.2% in 2020 compared to a growth of 9.0% in 2019, and estimates indicate that the industry suffered a monthly loss of USD 35m in 2020 due to the COVID-19 pandemic.
• The Ethiopian government introduced a five-year zero profit tax policy for new investments in the hospitality sector which is expected to encourage private sector investment. The development of world class tourism facilities is expected to lead to job creation and boost tourism earnings. The country has upwards of 21 internationally branded hotels under development which are expected to add about 4,300 rooms to the market. It is however unlikely that all of these hotels will open given that business and leisure travel is yet to pick up as a result of travel restrictions still in effect due to the new COVID-19 strains being identified.
• A modest recovery of the sector is forecast in 2021 whereby international receipts and tourist arrivals are expected to increase to USD 1.6bn and 369k arrivals respectively, driven by ongoing economic growth in key source markets as people have more disposable income and there is an increased demand for foreign travel due to the vaccine distribution. The ongoing political conflict will weigh heavily on the country’s 2021 outlook as tourists who are already wary of post-pandemic travel seek more stable destinations.
5%of the Ethiopian GDP comes from tourism
COVID-19 impact on key sectors of Ethiopia’s economy

26
Economic Impact of the COVID-19 Pandemic on East African Economies: Volume 2
Manufacturing sector
• The manufacturing sector contributed 4% to Ethiopia’s GDP and employed 13.0% of the total workforce in 2019.
• The sector’s growth was 7.5% in 2020, lower than the 7.7% growth in 2019, due to supply chain disruptions arising from the COVID-19 pandemic. This growth defied the expected 50% shrinkage of the sector as indicated in our Vol. 1 publication.
• Ethiopia’s textile and garment industry is a leading provider of jobs in the country’s manufacturing sector with the industrial parks having employed about 95,000 people before the pandemic. The fall in consumer demand and closure of retail stores in high income countries due to the COVID-19 pandemic negatively impacted the textile and garment manufacturers. However, the Ethiopian Textile Industry Development Institute (ETIDI) disclosed that Ethiopia earned over USD 171.1m in the fiscal year ending Jul-2020, showing a robust performance despite the supply chain disruptions witnessed early on. Order cancellations and suspensions were offset by new foreign customers coming into the pipeline. In Jul-2020, the country secured USD 15m of the budgeted USD 16m from the textile and garment sub-sector in the 2019/2020 fiscal year.
Source: EIU, Fitch Solutions, Africa Development Bank
|The manufacturing sector’s growth declined from 7.7% in 2019 to 7.5% in 2020 mainly attributed to subdued demand in the key textile and garment sub-sector as a result of the closure of retail stores in high income countries. The sector’s growth is expected to be limited at 1.5% in 2021 given the uncertainties surrounding economic recovery in the high income countries
22
.9%
24
.7%
6.8
%
7.7
%
7.5
%
1.5
%
0%
5%
10%
15%
20%
25%
30%
2016 2017 2018 2019 2020 2021F
Ethiopia Manufacturing sector perfomance (Y-o-Y growth)
• A telephone survey of nearly 4,000 female garment workers revealed that four out of ten garment workers on Ethiopia’s flagship industrial park lost their jobs due to the COVID-19 pandemic in 2020. The decline in capacity utilisation pushed firms in the industrial parks to re-invent their business models pivoting to manufacture of personal protective equipment (PPE). A USD 6.5m fund was set up between the UK and Germany governments in collaboration with the Ethiopian government with the aim of safeguarding the industry as well as protecting the livelihoods of the workers and thus save thousands of jobs. The National Bank of Ethiopia (NBE) is in charge of assessing applications and textile factories in industrial parks can apply for wage subsidies and incentives to reward businesses that can adapt in response to COVID-19.
• The uncertainties surrounding economic recovery from the COVID-19 pandemic, the second/third wave in key export markets, and rising cases within the country affecting the domestic labour supply are expected to limit the growth in the manufacturing sector (particularly garments and textile sub-sectors) to register a growth of 1.5% in 2021. Ethiopia’s plans to position itself as a manufacturing hub will benefit companies’ plans to diversify supply chains and reduce reliance on Chinese supply.
4%of the Ethiopian GDP comes from manufacturing
COVID-19 impact on key sectors of Ethiopia’s economy

27
Economic Impact of the COVID-19 Pandemic on East African Economies: Volume 2
Source: National Bank of Ethiopia (NBE), EIU, Fitch, IMF
|The construction sector’s growth slowed down to an estimated 9.9% in 2020 due to labour and material shortages as a result of supply chain disruptions attributed to the COVID-19 pandemic. The sector is forecast to grow by 8.9% in 2021supported by increased investment in industrial construction projects and infrastructure capital projects
Ethiopia Construction sector performance (Y-o-Y growth)
31
.6%
25
.0%
20
.7%
15
.7%
15
.0%
9.9
%
8.9
%
0%
5%
10%
15%
20%
25%
30%
35%
2015 2016 2017 2018 2019 2020 2021F
• Ethiopia’s construction sector is expected to grow by 8.9% in 2021 and not to its double-digit pre-pandemic growth rates. The sector will greatly benefit from increased investment in industrial construction projects including industrial parks and infrastructure projects. Infrastructure capital projects are forecast to remain elevated as the country’s industrialisation plans require significant improvements in transport infrastructure. The growing public debt is expected to shrink the fiscal space available for the construction of new infrastructure projects and increase the need for private investment. Although the sector is forecast to grow, a downside risk remains due to the unstable political environment which could weigh on investor confidence around completion of projects.
Construction and Real estate sectors
• The construction and real estate sectors combined contributed about 20.3% to Ethiopia’s GDP in 2019.
• The construction sector registered an estimated 9.9% growth in 2020, albeit lower than the 15.0% in 2019 due to COVID-19-related supply disruptions of labour and materials. The government’s decision not to impose a strict lockdown enabled construction activities to continue during the pandemic which helped the industry achieve positive growth in 2020 and avoid the 9.9% contraction initially forecasted in our Vol. 1 publication.
• The strong presence of Chinese construction firms exacerbates the industry’s vulnerability to supply chain disruptions given that companies source a large share of their materials and labour from China. In an effort to diversify supply chains and reduce reliance on Chinese suppliers, the government is expected to prioritise the development of the Berbera Port in Somaliland.
20.3%of the 2019 Ethiopian GDP came from real estate and construction
COVID-19 impact on key sectors of Ethiopia’s economy

28
Economic Impact of the COVID-19 Pandemic on East African Economies: Volume 2
Financial services Industry | Banking
• The financial services sector contributed about 4.5% to Ethiopia’s GDP in 2019, an improvement from 3.1% in 2018.
• The COVID-19 pandemic weighed down the banking sub-sector with loan growth slowing from 30.1% in 2019 to an estimated 25.0% in 2020 due to weak activity in the manufacturing sector; which has the highest demand for loans in the economy. Even as the National Bank of Ethiopia (NBE) does not publish data on non-performing loans, this is likely to have risen in 2020.
• In mid-August 2020, the National Bank of Ethiopia (NBE) introduced the foreign currency intermediation banks directive which allows local banks to borrow in foreign currency from international financial institutions in USD, CAD, GBP, EUR, CNY and JPY. In the short term, however, as the global pandemic drags on, caution in terms of investments and risk mitigation is expected.
Source: National Bank of Ethiopia (NBE), EIU, Fitch, IMF
| The COVID-19 pandemic weighed down the banking sub-sector with loan growth slowing from 30.1% in 2019 to 25.0% in 2020. A further slower growth of 21.5% is forecast in 2021 due to muted demand for loans and decrease in fixed capital investment
10
.3
10
.6
12
.7
14
.6
15
.2
17
19
.8
21
.5
26
.9
28
.2
25
.7
27
.5
15.4%
2.8%
19.6%
30.1%
25.0%
21.5% 13.9%
8.8%
25.0%
4.9%
(9.0%)
16.6%
-20%
-10%
0%
10%
20%
30%
40%
0
5
10
15
20
25
30
2016 2017 2018 2019 2020 2021F
Client loans (USDbn) Client deposits (USDbn)
Client loans Y-o-Y growth % Client deposits Y-o-Y growth %
Ethiopia Banks deposits and loans
• Following political insurgency in the Tigray region, commercial banks closed down, impeding trade activities and cash flow. The NBE had ordered commercial banks to stop providing services in Tigray for fear of theft and misallocation of financial resources, leading to a liquidity shortage. Despite the re-opening of the banks, the transaction limit continues to hinder traders from buying and selling whereas economic activity is yet to resume normalcy.
• Ethiopia launched a demonetisation process in September 2020, issuing fresh banknotes in a move that prompted 1.3m unbanked Ethiopians to hand in their old cash in exchange for a bank account from which they could draw the new notes. This move shielded the country from economic crisis by improving liquidity, saving and preventing financial crimes, whereby 7.2m citizens opened new accounts and savings reached ETB 126bn.
• The Ethiopian banking sub-sector is expected to grow but with a reduced growth rate of 21.5% in 2021 as the economy weakens. Relatively muted demand for loans is expected to be exacerbated by weak levels of business investment and a decline in fixed capital investment due to the political situation dissuading foreign investors. Further the outcome of the national elections that were held on 21 June 2021, is expected to further elevate the already heightened political tension in the country and constrain loan growth.
4.5%percentage of the GDP that the financial services sector contributed to in 2019
COVID-19 impact on key sectors of Ethiopia’s economy

29
Economic Impact of the COVID-19 Pandemic on East African Economies: Volume 2
Technology, media and telecommunications industry | Mobile Network Operators (MNOs)
• The state owned Ethio Telecom is the sole provider of integrated telecommunication services in Ethiopia. As of April 2021, Ethio Telecom’s total subscriber base was about 54.7m, with 43.7m active subscribers. Internet penetration in the country however remains low, whereby 4G penetration stands at a mere 2.6%, with complaints of slow and unreliable service.
• Ethio Telecom generated ETB 46.2bn revenue in the year 2019/2020, in line with the growth in active subscribers over the same period. This represented a revenue increase of ETB 11.9bn (16.0% CAGR) from the previous period of the year 2018/2019.
• The monthly blended Average Revenue Per User (ARPU) decreased from ETB 95.0 in July 2019 to ETB 74.0 in July 2020, as a result of subdued consumer spending from the effects of job losses and reduction in disposable incomes due to the COVID-19 pandemic. The ARPU however showed a growth to reach ETB 97.0 in April 2021 attributable to the necessity of internet usage as a tool for working from home given social distancing measures remain.
Source: National Bank of Ethiopia (NBE), EIU, Fitch, IMF, World Bank
| Ethiopia’s telecommunication sector was impacted by the negative effects of COVID-19 as job losses and reduced incomes subdued consumer spending resulting in a decrease of the ARPU from ETB 95.0 in July 2019 to ETB 74.0 in July 2020. The privatisation of Ethio Telecom and the launch of mobile money services are expected to drive growth in the sector in 2021
Average Revenue Per User (ARPU) (ETB)
• The Ethiopian government has recently taken steps in its push for liberalisation of the telecommunication sector, which has long been monopolistic, as part of its wider economic reforms to open the country to external investment. The partial privatisation of Ethio Telecom was announced in September 2019 with an aim of awarding two telecom licences and selling a 40.0% stake in the company to an international operator. The MTN Group Ltd and a consortium led by Vodafone Group Plc bid for the licenses and the latter was awarded the license as announced in May 2021 for an offer of USD 850m.
• Ethio Telecom in partnership with Huawei recently launched the 4G LTE advanced mobile service in Ethiopia’s Somali region as part of efforts to avail the network in 103 towns across Ethiopia. Ethio Telecom also launched the Telebirr Mobile Money services in May 2021 and subscriber numbers reached 3.5m in the one month to June 2021, signifying the high pent-up demand for mobile money services in the country.
• The Ethiopian government’s plan to liberalise the telecom sector in order to spur private investment is expected to accelerate growth in this sector in 2021. This will further be supported by the implementation of ‘Digital Ethiopia 2025’ Strategy. Mobile money services is also expected to contribute to the growth in this sector and drive financial inclusion of the unbanked population via access to the mobile banking channels.
62.0 82.0 95.0 74.0 89.00
20
40
60
80
100
2017 2018 2019 2020 2021F
2.6%4G network penetration in the country
COVID-19 impact on key sectors of Ethiopia’s economy

30
Economic Impact of the COVID-19 Pandemic on East African Economies: Volume 2
| Analysis of COVID-19 sector heat maps of the Tanzanian economy
The Tanzanian Economy

31
Economic Impact of the COVID-19 Pandemic on East African Economies: Volume 2
Foreign exchange reserves remained ample and amounted to USD 5.2bn as at 31 May 2021 (6.1 months of projected import cover). This is 8.7% lower than the USD 5.6bn (6.4 import months cover) as at February 2020, as indicated in Our Vol 1 Publication.
The decline in inflation by 0.5%
from 3.8% in 2019 to 3.3% in 2020
is attributable to muted consumer
demand due to declining income
levels and economic uncertainty.
However, a sharp uptick in global oil
prices alongside recovery in
consumer demand is expected to
see inflation increase to 4.2% in
2021.
Inflation
The Tanzania Shilling (TZS) depreciated by 0.3% amid declining exports and foreign investment from TZS 2291/USD as at 08 May 2020, when we published Our Vol. 1 Publication to TZS 2299/USD as at 30 June 2021
3.8%
3.3%
4.2%
Real GDP growth rate
2.7% 3.2%
6.3%
-3.3% -2.1%
1.0%
6.0%3.4%
5.2%
Global Africa Tanzania
2019 2020 2021F
Source: World Bank, IMF, EIU, DSE, Fitch Solutions, Bank of Tanzania
16.8%
16.8%
16.8%
16.9%
16.7%
16.5%
16.6%
16.6%
16.3%
16.6%
16.6%
16.7%
16.6%
16.7%
16.6%
Jan
-20
Feb
-20
Ma
r-2
0
Ap
r-2
0
Ma
y-2
0
Jun
-20
Jul-
20
Au
g-2
0
Se
p-2
0
Oct
-20
No
v-2
0
De
c-2
0
Jan
-21
Feb
-21
Ma
r-2
1
Lending rate
4.4
%
11
.9%
3.0
%
(1.4%)
4.1
%
0.4
%
2.6
%
9.7
%
4.4
%
-2%
0%
2%
4%
6%
8%
10%
12%
14%
Agriculture Industry Services
Sectoral growth
2019 2020 2021F
Tanzania’s debt to GDP ratio increased from 47.4% to 50.8% between 2019 and 2020 driven by the country’s ambitious infrastructure development plans. The country’s debt uptake is expected to increase in 2021 and drive up the debt to GDP ratio to 52.7%.
Tanzania’s GDP growth rate is estimated to have reached 1.0% in 2020, 1% lower than the projection indicated in our Vol. 1 publication.
A 5.2% rebound in GDP growth in 2021 will be driven mainly by the industry sector, which is expected to grow by 9.7% in 2021 attributable to the country’s high value infrastructure projects and increased mineral exports.
The current account deficit narrowed from USD 1.3bn in 2019 to USD 886m in 2020. This is lower than the USD 2.4bn deficit indicated in our Vol 1 Publication for 2020. This is expected to widen to USD 2.1bn in 2021 as import demand increases and supply chains improve globally..
Tanzania’s unemployment rate increased from 5.42% in 2019 to 7.11% in 2020 in line with job layoffs and reduced business activity in the country. An expected economic recovery in 2021 is expected to reduce the unemployment rate to 6.5%.
2019
2020
2021
Tanzania’s Economy at a Glance

32
Economic Impact of the COVID-19 Pandemic on East African Economies: Volume 2
Agriculture sector
• The agriculture sector contributed about 25.7% to total GDP with 55.0% of the population directly depending on the sector for their livelihoods annually and on average over the past five years. A further 15.0% of the population indirectly benefits from agricultural value chain related functions.
• Agricultural output was reported as TZS 5.9tn as at Q32020 compared to TZS 8.5tn in Q12020 (30.8% decline), mainly attributable to decreased export demand for Tanzania’s cash crop exports.
• Our Vol. 1 publication depicted that the sector’s growth was set to decrease from 5.0% in 2019 to 3.0% in 2020, amidst decreased demand for agricultural exports and a locust invasion that had threatened to reduce agricultural yields.
• In this Vol. 2 publication, we note that the sector’s output is estimated to have decreased by 1.4% in 2020, 160 basis points lower than the forecast in our Vol. 1 publication. The declining performance was attributable to declining global demand for Tanzanian food and cash crop exports.
| The agricultural sector’s output is estimated to have contracted by 1.4% in 2020 amid supply chain disruptions and declining demand for Tanzanian agricultural exports. The recovery of global demand for agricultural exports coupled with ease of travel restrictions is expected to bolster the agricultural sector to a growth of 2.6% in 2021
• The resumption of international flights is estimated to have saved 51,000 jobs in the horticulture industry and supported a further 297,000 dependents on the industry’s value chain functions.
• With households expected to have cut back on non essential spending in 2020, domestic demand for agricultural products such as sugar, meat, and processed dairy items is estimated to have fallen over the same period. Further, the socio-economic impact of the COVID-19 pandemic will see approximately 2.1m Tanzanians in need of food assistance due to increased food poverty.
• Productivity and efficiency in the sector will remain low in the medium term due to domination by smallholder farmers reliant on rainfall, limited access to credit and farm inputs among farmers and ineffective government subsidy programs. Despite this, the sector is expected to rebound to a growth of 2.6% in 2021 mainly attributable to increased demand for export-focussed food and cash crops. Nonetheless, the sector still remains vulnerable to weather related shocks.
Tanzania Agriculture sector perfomance (Y-o-Y growth)
4.8% 5.9% 5.3% 4.4%
(1.4%)
2.6%
-2%
-1%
0%
1%
2%
3%
4%
5%
2016 2017 2018 2019 2020 2021F
Source: EIU, Fitch Solutions, Bank of Tanzania, UNDP
25.7%of the Tanzanian GDP is contributed to by agriculture
COVID-19 impact on key sectors of Tanzania’s economy

33
Economic Impact of the COVID-19 Pandemic on East African Economies: Volume 2
Tourism/hospitality sector
• Tanzania’s tourism sector earnings contributed 4.6% to GDP on average between 2016 and 2019 and reported a 6.6% CAGR growth over the same period. The sector is Tanzania’s primary foreign currency earner (25% contribution) and supports more than 1.5m jobs.
• The sector was however dealt a significant blow in 2020 as tourism earnings fell by an estimated 74.0% compared to a growth of 0.6% in 2019, a consequence of shrinking tourist arrivals that approximately reduced by 74.1% (1.1m) in 2020 due to travel restrictions. More than 477k jobs are estimated to have been lost in 2020 due to the tourism sector’s poor performance.
• Hotel occupancy rates are estimated to have reached 21.9% in 2020, which is lower than the estimated 23.5% occupancy rate indicated in our Vol. 1 publication. Consequently, overall hotel demand is estimated to have declined by 74.6% in 2020 and is reflected by the closure of close to 60 hotels across the country.
Source: Fitch Solutions, Bank of Tanzania, UNDP, Ministry of Tourism- Tanzania
| An estimated 74.1% decline in tourist arrivals in 2020 resulted in a 74.0% drop in tourism earnings over the same period. Tourist arrivals and earnings are expected to increase by 38.0% and 38.8% in 2021 respectively. Tourist earnings will still be 63.9% lower than 2019 earnings, with a full recovery of the sector expected by 2024
Tanzania Tourism sector perfomance
• Moreover, approximately 5,000 staff employed in the tourism sector have been laid off in Zanzibar in 2020, underlining the pandemics negative impact on the sector.
• The government opened the country to tourists in May 2020 after lifting of restrictions on international flights and this is estimated to have led to a slight increase in international tourist arrivals in Q3 and Q4 of 2020. Likewise, the Government of Tanzania’s (GoT) previous lax approach to the COVID-19 pandemic is likely to have helped promote domestic tourism in 2020.
• The third wave of the COVID-19 pandemic coupled with the GoT’s lax approach to the pandemic is expected to impede the recovery of the tourism sector in 2021. Nonetheless, a positive outlook for the tourism sector in 2021 is expected with tourism earnings and tourist arrivals set to increase by 38.8% and 38.0% respectively. This is mainly due to the resumption of global travel. Tourism earnings and tourist arrivals will be 63.7% and 64.2% lower than 2019 levels respectively, with a full recovery of the sector expected by 2024.
3,8
31
4,6
79
5,0
48
5,5
80
5,6
74
1,5
10
2,1
92
1.1 1.3
1.3 1.5
1.5
0.4 0.6
-
0.5
1.0
1.5
2.0
0
1,000
2,000
3,000
4,000
5,000
6,000
2015 2016 2017 2018 2019 2020 2021F
Arr
iva
ls
To
uri
st e
arn
ing
s (T
ZS
bn
)
Tourist earnings (TZSbn) Total arrivals in millions
4.6%is the average percentage contribution to GDP from tourism
COVID-19 impact on key sectors of Tanzania’s economy
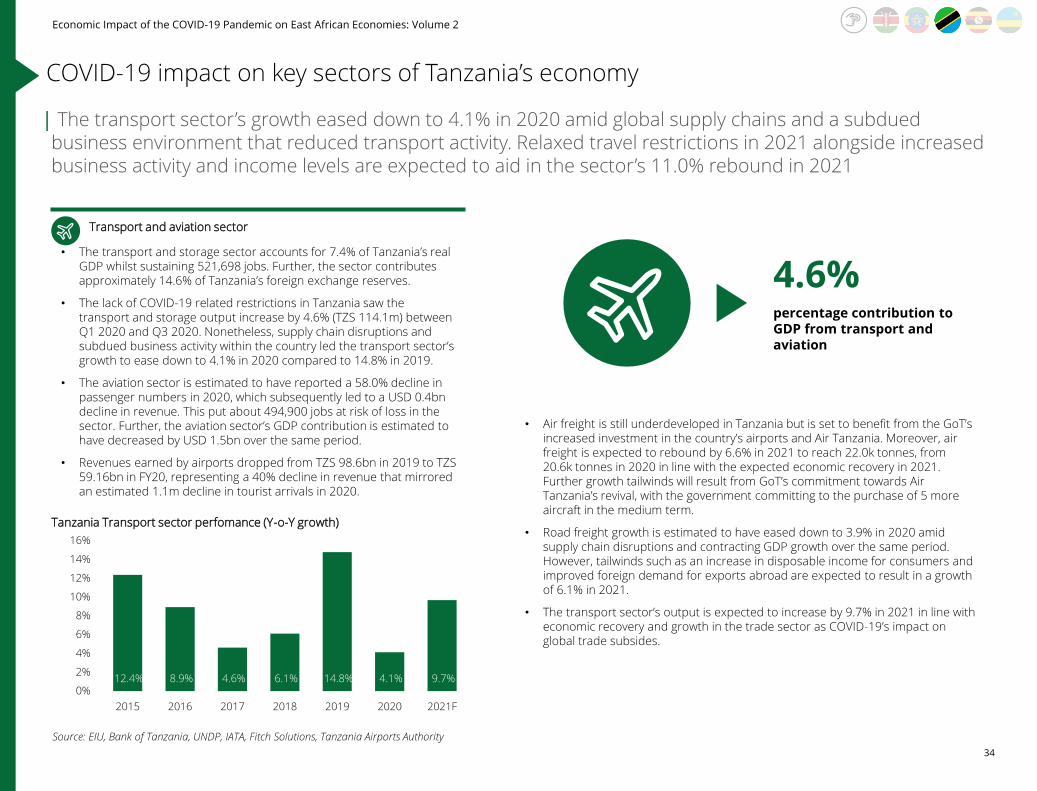
34
Economic Impact of the COVID-19 Pandemic on East African Economies: Volume 2
Transport and aviation sector
• The transport and storage sector accounts for 7.4% of Tanzania’s real GDP whilst sustaining 521,698 jobs. Further, the sector contributes approximately 14.6% of Tanzania’s foreign exchange reserves.
• The lack of COVID-19 related restrictions in Tanzania saw the transport and storage output increase by 4.6% (TZS 114.1m) between Q1 2020 and Q3 2020. Nonetheless, supply chain disruptions and subdued business activity within the country led the transport sector’s growth to ease down to 4.1% in 2020 compared to 14.8% in 2019.
• The aviation sector is estimated to have reported a 58.0% decline in passenger numbers in 2020, which subsequently led to a USD 0.4bn decline in revenue. This put about 494,900 jobs at risk of loss in the sector. Further, the aviation sector’s GDP contribution is estimated to have decreased by USD 1.5bn over the same period.
• Revenues earned by airports dropped from TZS 98.6bn in 2019 to TZS 59.16bn in FY20, representing a 40% decline in revenue that mirrored an estimated 1.1m decline in tourist arrivals in 2020.
Source: EIU, Bank of Tanzania, UNDP, IATA, Fitch Solutions, Tanzania Airports Authority
| The transport sector’s growth eased down to 4.1% in 2020 amid global supply chains and a subdued business environment that reduced transport activity. Relaxed travel restrictions in 2021 alongside increased business activity and income levels are expected to aid in the sector’s 11.0% rebound in 2021
Tanzania Transport sector perfomance (Y-o-Y growth)
• Air freight is still underdeveloped in Tanzania but is set to benefit from the GoT’s increased investment in the country’s airports and Air Tanzania. Moreover, air freight is expected to rebound by 6.6% in 2021 to reach 22.0k tonnes, from 20.6k tonnes in 2020 in line with the expected economic recovery in 2021. Further growth tailwinds will result from GoT’s commitment towards Air Tanzania’s revival, with the government committing to the purchase of 5 more aircraft in the medium term.
• Road freight growth is estimated to have eased down to 3.9% in 2020 amid supply chain disruptions and contracting GDP growth over the same period. However, tailwinds such as an increase in disposable income for consumers and improved foreign demand for exports abroad are expected to result in a growth of 6.1% in 2021.
• The transport sector’s output is expected to increase by 9.7% in 2021 in line with economic recovery and growth in the trade sector as COVID-19’s impact on global trade subsides.
12.4% 8.9% 4.6% 6.1% 14.8% 4.1% 9.7% 0%
2%
4%
6%
8%
10%
12%
14%
16%
2015 2016 2017 2018 2019 2020 2021F
4.6%percentage contribution to GDP from transport and aviation
COVID-19 impact on key sectors of Tanzania’s economy

35
Economic Impact of the COVID-19 Pandemic on East African Economies: Volume 2
8.0
%
10
.8%
8.2
%
8.3
%
5.8
%
6.4
%
7.3
%
0%
2%
4%
6%
8%
10%
12%
2015 2016 2017 2018 2019 2020 2021F
Manufacturing sector
• The manufacturing sector’s importance to Tanzania’s economy is highlighted by the sector’s 8.2% contribution to Tanzania’s GDP as well as its 9.5% contribution to Tanzania’s foreign exchange reserves.
• Tanzania’s manufacturing sector is dominated by the food and beverage industry, which accounts for more than 40.0% of the sector’s output. Other significant production categories are furniture, rubber and plastics, and non-metallic mineral products.
• The manufacturing sector showed resilience in the face of the COVID-19 pandemic, and is estimated to have grown by 6.4% in 2020 compared to 5.8% in 2019 mainly driven by:
❑ An estimated 12.1% increase in consumer spending on food and non-alcoholic beverages in 2020 resulting from consumer shift towards essential goods consumption in light of the COVID-19 pandemic; and
❑ A 13.3% (USD 107.0m) increase in manufactured export goods in 2020.
| The manufacturing sector reported a robust growth of 6.4% in 2020 compared to 5.8% in 2019 attributable to a USD 107.0m increase in manufacturing goods exports. The sector is expected to attain a positive outturn of 7.3% in 2021 driven by increased foreign investment.
Tanzania Manufacturing sector perfomance (Y-o-Y growth)
• Furthermore, the lack of an imposed lockdown in the country eased operations within the manufacturing sector and outweighed the adverse impact of the COVID-19 pandemic in 2020.
• Manufactured goods exports increased by 12.5% in the year ending Apr-2021, compared to a decline of 16.1% in the year ending April 2019. This indicates an increase in demand for manufacturing exports in Tanzania signalling further expansion in the manufacturing sector output in 2021.
• Moreover, an improved operating landscape for businesses majorly due to infrastructural growth, coupled with the country’s competitive labour rates and a calm political environment pave the way for increased foreign investment in the sector, which is expected to drive manufacturing sector growth by 7.3% in 2021.
Source: EIU, Bank of Tanzania, UNDP, Confederation of Tanzania Industries
8.2%percentage contribution to GDP from manufacturing
COVID-19 impact on key sectors of Tanzania’s economy

36
Economic Impact of the COVID-19 Pandemic on East African Economies: Volume 2
Mining sector
• The mining sector’s 4.5% contribution to GDP on average over the past five years was mainly sustained by gold exports, which account for about 40% of total export revenue in the country.
• The GoT’s alterations to Tanzania's mining code, including a ban on ore exports in 2017 and further changes to the mining regulations in 2018 that favoured domestic mining companies and financial institutions have hindered investments by multinational mining corporations in the sector. The challenging operating environment alongside supply chain disruptions that impeded the export of mineral commodities informed our outlook of Tanzania’s mining sector in Vol. 1 of our publication.
• In this Vol. 2 publication, we note that the sector’s growth is estimated to have eased down slightly to 15.0% in 2020 compared to 17.7% in 2019. This is attributable to increasing gold prices globally coupled with an improved regulatory landscape in Tanzania’s mining sector that outweighed the adverse effects of the COVID-19 pandemic in 2020.
Source: EIU, Bank of Tanzania, UNDP
| An improved regulatory environment coupled with increasing value of gold drove an estimated 15.0% growth in the mining sector in 2020, in effect buffering the sector from COVID-19’s negative impact. The sector is expected to report a robust growth of 10.9% in 2021 mainly driven by attractive gold prices and an improving regulatory landscape
Tanzania Mining sector perfomance (Y-o-Y growth)
• Mining output increased from TZS 1.4tn in Q1 2020 to TZS 1.5tn in Q3 2020 as the government’s decision to not impose lockdowns and other COVID-19 related restrictions ensured continued operations within the sector over the same period.
• The gold mining segment was largely unaffected by the economic slowdown in 2020 as evidenced by gold mining firms such as Barrick Gold committing to continue their operations throughout the year. Consequently, this is estimated to have increased gold production by 5.0% in 2020, with a further 2.0% growth expected in 2021 in light of attractive global gold prices. In addition, improving relations between the GoT and Barrick Gold is expected to sustain a 10.9% growth in the mining sector’s output in 2021.
10.0% 7.4% 5.3% 1.5%
17.7% 15.0% 10.9% 0%
5%
10%
15%
20%
2015 2016 2017 2018 2019 2020 2021F
4.5%percentage contribution to GDP from mining
COVID-19 impact on key sectors of Tanzania’s economy

37
Economic Impact of the COVID-19 Pandemic on East African Economies: Volume 2
(1.9%)
3.0% 4.9%
11.3%
0.4%
4.4%
14.4% 15.1% 14.8% 13.8%
14.8% 14.0% 14.6%
-2%
3%
8%
13%
18%
2015 2016 2017 2018 2019 2020 2021F
Real estate % YoY Growth Construction % yoy growth
Real estate and construction sector
• The construction sector on the other hand contributes circa 12.8% to total GDP whilst sustaining more than 1.5m jobs. The sector further reported a growth of 14.1% in 2019, and as indicated in our Vol. 1 publication, is credited to be largest contributor to Tanzania’s GDP growth.
• Our Vol. 1 publication pointed out that the ripple effects of the COVID-19 pandemic on the economy had spread to the construction sector, with various energy projects and the standard gauge railway project stalling due to increased project financing costs. In our second volume, we note that the construction sector’s 14.0% growth in 2020 was buoyed by large scale infrastructural projects such as the Bagamoyo Mega Port (USD 10bn), Tanzania-Rwanda-Burundi Railway Project (USD 2.6bn) and the Rufiji Hydropower Project (USD 3.6bn) that shielded the sector from the adverse effects of the COVID-19 pandemic.
• Tanzania’s plethora of ongoing infrastructural projects coupled with a robust future pipeline of large scale projects will boost the sector’s recovery in 2021, with growth forecasted to reach 14.6% over the same period. Re-nationalisations and tender cancellations however continue to increase operational risk within the construction sector, thus deterring private investors.
Source: EIU, Bank of Tanzania, UNDP, Knight Frank Africa Real Estate Report
| Tanzania’s construction sector is estimated to have grown by 14.0% in 2020 buoyed by large scale infrastructural projects. The sector’s growth in 2021 is expected to reach 14.6% bolstered by the country’s ambitious infrastructural development plan and robust project pipeline
Tanzania Real estate and construction sector performance
• The real estate sector contributed 2.9% to Tanzania’s real GDP while sustaining more than 4,800 jobs annually and on average over the past five years.
• The real estate sector is estimated to have grown by 0.4% in 2020, 10.9% lower than the growth attained in 2019, driven by declining demand for residential properties due to decreasing consumer income levels in 2020. The office market is also estimated to have taken a hit as firms continued to encourage their staff to work from home. Further, as indicated in the Vol. 1 publication, increased financing costs are expected to have stalled various real estate projects in 2020.
• The real estate sector is expected to grow by 4.4% in 2021 amid increasing income levels in the economy that will see demand for residential housing and industrial warehousing improve.
12.8%percentage that the real estate and construction sector contributed to the GDP
COVID-19 impact on key sectors of Tanzania’s economy

38
Economic Impact of the COVID-19 Pandemic on East African Economies: Volume 2
7.47.8 7.7 7.8
8.9 9.19.9
8.5 8.4 8.9 9.0 9.5 9.8 10.6-2%
0%
2%
4%
6%
8%
10%
12%
14%
0
2
4
6
8
10
12
2015 2016 2017 2018 2019 2020 2021F
% Y
oY
Gro
wth
Lo
an
s a
nd
de
po
sits
in U
SD
bn
Client loans Client deposits
Source: Fitch Solutions, Bank of Tanzania, DSE, Investing.com
Financial services | Banking
• Tanzania’s financial services sector contributed approximately 3.8% to Tanzania’s total GDP on average over the past five years. Moreover, the country’s banking sector assets accounted for about 13.8% of total GDP while customer deposits accounted for approximately 14.7% of total GDP over the same period.
• Subdued loan demand has weighed down the sector in 2020 amid an economic slowdown and declining income levels as loans and advances to customers increased by circa 4.5% in 2020 compared to 13.6% in 2019. The impact of COVID-19 is further underlined as growth of credit to the private sector eased down to 3.0% in 2020 compared to 11.0% in 2019.
• On the other hand, declining consumer spending translated into higher savings by consumers and is estimated to have driven a 5.0% increase in customer deposits in 2020.
Tanzania Banking clients and loans deposits
• Loan asset quality improved for the banking sector as the non-performing loan (NPL) ratio decreased from 10.1% in December 2019 to 9.3% in December 2020 following measures by the Bank of Tanzania (BOT) that allowed the restructuring of loans by commercial banks as well as the reduction of the Central Bank Rate (“CBR”) from 7% to 5% in 2020. Furthermore, the BoT has mandated lenders to reduce their NPL ratios to below 5.0% by December 2022.
• Growth in the financial sector is expected to reach 6.5% in 2021 amid a recovering economy and income levels. Consequently, this should see loan growth surge by 11.0% over the same period, thereby signalling a period of recovery for the sector. The overall lending rate averaged 16.8% in 2020 and is expected to ease down to 16.5% in 2021. The CBR, which was reduced from 7.0% to 5.0% in 2020 to facilitate cheaper financing, is expected to remain constant at 5% in 2021 thereby providing stimulus for economic activity in Tanzania.
• With the ongoing efforts of vaccination globally, the tourism and export sectors are expected to rebound in the medium term (2021-2025). This is expected to feed through into improved labour market conditions, which is projected to increase loan uptake by 11.0% in 2021.
| Economic uncertainty coupled with contracting income levels in 2020 decreased loan demand, subsequently leading to a suppressed credit growth of 4.5% in 2020 compared to 13.6% in 2019. Recovering economic activity and increasing income levels are expected to see loan growth reach 11.0% in 2021
3.8%percentage of the GDP that customer deposits accounted for on average over the last 5 years
COVID-19 impact on key sectors of Tanzania’s economy

39
Economic Impact of the COVID-19 Pandemic on East African Economies: Volume 2
Source: Fitch Solutions, Bank of Tanzania, DSE, Investing.com, S&P Capital IQ
Financial services | Equity market
• The Dar es Salaam Exchange (DSE) has historically reported slow growth due to its limited capitalisation with the bourse recording the largest decline in capitalisation in 2019 (a 13.0% decline) following the delisting of Acacia Gold Mine Plc.
• The Tanzania All Shares Index (DSEI) reported a YTD loss of 14.0% as at 31 December 2020, mainly attributable to the decline in share prices of cross listed companies in the bourse. The decline in share value is on account of the negative impacts of COVID-19 pandemic on the DSE and resulted in a 15.0% (TZS 2.6tn) decline in market capitalisation between January 2020 and December 2020.
• The DSE was faced with liquidity constraints in 2020 as foreign investors contributed less than 20% to market liquidity, compared to an historical average contribution of over 85%, as foreign investor risk aversion increased.
Tanzania All Share Index (DSEI) perfomance
• The DSEI posted a YTD gain of 10.9% as at 30 June 2021, driven mainly by an increase in share prices of listed firms, particularly the share prices of CRDB Bank, which recorded a YTD gain of 51.3% as at 30 June 2021 that was attributable to record profit levels achieved in FY20.
• The DSE’s long term growth is expected to be driven by privatisation of state-owned assets and the increase in SME (Small and Medium-Sized Enterprises) listings.
2.4%
-18.9%
54.0%
-13.9%
-3.8%
2.7% 0.0%
-9.4%
-40%
-20%
0%
20%
40%
60%
DSEI YTD Performance by sector (as of 30 June 2021)
Banking Commercial And Services
Construction And Allied Energy And Petroleum
Insurance Investment
Manufacturing And Allied Telecommunication And Technology
| The DSEI reported a YTD loss of 14.0% as at 31 December 2020 that was driven by a decline in the performance of cross listed firms, reducing market liquidity and a preference for government securities by investors. As at 30 June 2021, the DSEI reported a YTD gain of 10.9% in line with increase in share prices of listed firms
COVID-19 impact on key sectors of Tanzania’s economy2
,11
2.8
2,0
36
.9
1,7
47
.7
1,7
83
.3
1,8
09
.1
1,8
30
.1
1,8
00
.2
1,8
27
.2
1,8
24
.7
1,7
82
.9
1,7
93
.5
1,8
16
.9
1,7
90
.2
1,8
44
.1
1,8
48
.6
1,8
78
.5
1,9
13
.3
1,9
85
.8
-16%
-14%
-12%
-10%
-8%
-6%
-4%
-2%
0%
2%
4%
6%
1,600
1,650
1,700
1,750
1,800
1,850
1,900
1,950
2,000
Jan
-20
Feb
-20
Ma
r-2
0
Ap
r-2
0
Ma
y-2
0
Jun
-20
Jul-
20
Au
g-2
0
Se
p-2
0
Oct
-20
No
v-2
0
De
c-2
0
Jan
-21
Feb
-21
Ma
r-2
1
Ap
r-2
1
Ma
y-2
1
Jun
-21
Share price (TZS) M-o-M change (%)

40
Economic Impact of the COVID-19 Pandemic on East African Economies: Volume 2
Technology, media and telecommunications | Mobile NetworkOperators (MNOs)
• The Information and Communication Technology (ICT) sector contributed circa 1.73% to Tanzania’s GDP on average over the past five years. The sector’s Average Revenue Per User decreased by 14.4% between 2019 and 2020 amid subscription volatility brought about by the Tanzania Communication Regulatory Authority (TCRA’s) mandatory biometric sim card registration that is set to limit subscribers to a single sim card each.
• Mobile money users in the country increased from 26.5m in Jan-2020 to 30.6m as at Sept-2020, indicative of a 15.4% increase compared to 6.3% increase over the corresponding period in 2019.
• The Bank of Tanzania (BoT), in a bid to promote cashless transactions, increased daily transaction limits and daily account balance limits as well, which will aid in increasing mobile money penetration in Tanzania.
Source: Fitch Solutions, Bank of Tanzania, Tanzania Communications Regulatory Authority
| The value of mobile money transactions increased from TZS 9.3tn in Jan-2020 to TSZ 11.6tn in Sep-2020, which was in line with Bank of Tanzania’s (BoT) push to promote cashless transactions by increasing the daily transaction limits from TZS 3m to TZS 5m
Tanzania mobile money transactions perfomance
• A marked 14.1% increase in mobile money transaction value was recorded between January and June 2020 compared to 6.0% over the same period in 2019. This is attributable to the promotion of cashless transactions by the BoT that is estimated to have increased total transaction value by TZS 3.6tn (38.3%) in 2020.
• The introduction of interoperability among rival firms in the market alongside an increasing mobile penetration rate are expected to see the transaction value reach USD 216.4bn by 2024.
• Regulatory compliance among telecom operators and aggressive pricing strategies will attract subscribers in 2021 and see mobile subscribers grow to 50.6m, a 3.5% increase from 2020.
9.3 8.3 9.0 8.3 9.5 10.7 11.3 11.1 11.6
34.5 34.7 35.1
33.7
36.8
39.1 39.2 38.4 38.6
30
32
34
36
38
40
-
2
4
6
8
10
12
14
Jan-20 Feb-20 Mar-20 Apr-20 May-20 Jun-20 Jul-20 Aug-20 Sep-20
Value of transactions (TZStn) Value per transactions (TZS '000)
15.4%increase in mobile money users as at September 2020
COVID-19 impact on key sectors of Tanzania’s economy
41
Economic Impact of the COVID-19 Pandemic on East African Economies: Volume 2
| Analysis of COVID-19 sector heat maps of the Ugandan economy
The Ugandan Economy

42
Economic Impact of the COVID-19 Pandemic on East African Economies: Volume 2
Source: World Bank, IMF, EIU, Bank of Uganda, Fitch Solutions, S&P Capital IQ
Inflation in 2020 was relatively
subdued at 3.8% against a pre-
COVID-19 forecast of 3.5% mostly
due to the decline in global oil
prices, and an accommodative
monetary policy put in place to
cushion against the effects of the
pandemic. Inflation is forecasted
to rise to 4.2% in 2021 partly
driven by expected higher global
oil prices.
3.8%
4.2%
Inflation
2019
2020
2021F
Note: PMI>50 indicates an expansion of business activity
Note: PMI<50 indicates a contraction in business activity
GDP is estimated to have contracted by 1.1% in 2020 – lower than the 3.5% growth projected in Vol.1 of our publication – mainly due to a sharp decline in tourism and the effect of the regional locust outbreak on agriculture.
Despite the negative effect of the pandemic, the Ugandan Shilling (UGX) remained relatively stable against the US Dollar (USD) averaging UGX 3,717.5/USD in 2020, performing much better than UGX 3,860/USD projected in Vol. 1 of our publication. The UGX is projected to appreciate to 3,714UGX/USD in 2021 driven by a rebound in exports.
Uganda’s foreign exchange reserves were estimated at USD 3.8bn (5 months of import cover) in 2020 driven by an overall balance of payments surplus. This is an increase compared to 3.5 months of import cover projected in Vol. 1 of our publication..
The current account deficit worsened to 9.8 % of GDP in 2020 against 8.1% projected in Vol. 1 of our publication, driven by a widened service account deficit. This is however expected to narrow to 6.8% in 2021 driven by rising exports and remittance inflows.
4.4%5.3%
6.6%
-0.7%
1.1%
-2.5%
2.8%
5.0% 3.5%
Agriculture Industry Services
Sectoral Growth
2019 2020 2021F
2.7% 3.2%
5.3%
-3.3%-2.1%
-1.1%
6.0%3.4% 3.7%
Global Africa Uganda
Real GDP growth rate
2019 2020 2021F
53.17
36.67
53.13
53.63
51.4
49.7
Q1 2020
Q2 2020
Q3 2020
Q4 2020
Q1 2021
Q2 2021
Uganda Composite PMI
Debt to GDP ratio rose from 42.3% in 2019 to an estimated 49.7% in 2020 mainly on account of increased borrowing to support the economy from COVID-19 effects. This ratio is projected to rise to 51.8% by 2022.
2.9%
GDP growth is projected at 3.7% in 2021 driven by a 2.8% growth in agriculture as global demand for coffee rises, a 5.0% growth in industry owing to a resumption of infrastructure projects and a 3.5% growth in services supported by growing regional trade. However, the country is currently on a 42-day lockdown that is to end on 30 July 2021. This may deter the country from achieving the 3.7% forecasted growth in 2021.
50 PMI
Uganda’s Economy at a Glance

43
Economic Impact of the COVID-19 Pandemic on East African Economies: Volume 2
• Uganda is one of the leading producers of coffee in Africa, contributing up to 19% of the country’s total exports. Despite a contraction in the agricultural sector, coffee export revenues registered a 17.6% growth from USD 438.6m in 2019 to USD 515.6m in 2020. This cushioned the losses from horticultural produce.
• The economic stimulus package allocated UGX 300bn to the agriculture sector for improving agricultural inputs to compensate for the deterioration in agricultural production during the nationwide lockdown, which was eased from late May 2020.
• The agriculture sector is projected to rebound in 2021, posting a 2.8% growth. This will be driven by a rise in global prices for major agricultural exports and an increase in agricultural output as sector-specific projects funded by development partners help boost production.
Agriculture sector
• The agriculture sector is estimated to have contracted by close to 1% due to reduced export demand associated with COVID-19 restrictions and decreased output caused by the regional desert locust invasion.
• Agriculture remains a key economic sector and one of the largest employers in the country, responsible for 70.3% of the labour force (with the majority in subsistence farming) and accounting for almost 28% of real GDP.
• 2020 saw a significant decline in effective domestic demand for food following the closure of schools and the hospitality industry. The massive loss of employment further led to reduced household incomes with consumers opting for less food and cheaper, less nutrient-rich food items. The number of food insecure people increased by 1.1 million to 16.4 million representing 37.6% of the total population.
• Uganda was a major net exporter of pineapples and tomatoes to Kenya and South Sudan. However, because of the lockdown implemented in March, buyers were unable to access the produce hence the entire March to May harvests of pineapples and tomatoes scheduled for South Sudan and Kenya, were channeled into the local market thus overwhelming it and sending prices plummeting, leading to staggering losses to farmers and traders.
-0.9%
6.1%
2.6%
4.4%
-0.7%
2.8%
-2%
-1%
0%
1%
2%
3%
4%
5%
6%
7%
2016 2017 2018 2019 2020 2021F
Uganda Agriculture Sectoral Performance (Y-o-y growth)
Source: EIU, Fitch Solutions, EABC: Impact of COVID-19 on Agriculture and Food Security in the EAC
| The agriculture sector contracted by 0.7% in 2020 owing to COVID-19 lockdown measures which negatively impacted the availability of temporary labour on farms, while the desert locust outbreak decreased agricultural output. The sector is projected to grow by 2.8% in 2021 due to increased global demand for Uganda’s agricultural exports
70.3%percentage of population depending on agriculture for a living
COVID-19 impact on key sectors of Uganda’s economy

44
Economic Impact of the COVID-19 Pandemic on East African Economies: Volume 2
Source: EIU, Uganda Bureau of Statistics, Fitch Solutions
Industry| Manufacturing and Construction sub-sectors
• The manufacturing sub-sector largely relies on imports namely petroleum products, iron and steel, medical and pharmaceuticals, plastics, heavy machinery and cereals. 75% of manufacturing firms in Uganda experienced disruptions in the supply of raw materials following factory closures in China and other main suppliers of intermediate inputs as a result of the pandemic.
• In an effort to cushion the manufacturing sector against the effects of COVID-19 pandemic, the government allowed SMEs in the manufacturing sub-sector to defer corporate income tax with no accumulation of interest or penalties. Following these measures, manufacturing output is estimated to have increased by 7.0% in 2020 to UGX 29.5tn from UGX 27.6tn in 2019, and its contribution to GDP is estimated to have risen to an average of 16.1% in 2020 from 15.3% in 2019.
• Growth in manufacturing was estimated at 5.0% in 2020 as supply-chain disruptions eased leading to an increase in exports. Cement production increased, evidenced by a 29.2% increase in export volumes from 406,750 tonnes in 2019 to 525,710 tonnes in 2020.
• Uganda has a small construction market whose value was estimated at USD 2.0bn as of 2020 contributing to about 6.1% of GDP, representing a 5.3% contraction from 2019.
• The COVID-19 pandemic led to the delay of new construction projects owing to the lockdown in China, whose construction firms account for 45% of key construction roles in Uganda. Furthermore, there was reduced public spending on infrastructure as funds were directed to expand and improve healthcare.
• The sub-sector is projected to grow by 9.7% in 2021, largely driven by the development of oil-related infrastructure like the East African Crude Oil Pipeline (EACOP) ahead of oil production in 2024, and the government's commitment to its national development plan of achieving industrialisation by supporting significant public infrastructure spending.
4.2%3.8%
7.0%
5.3%
1.1%
5.0%
0%
1%
2%
3%
4%
5%
6%
7%
8%
2016 2017 2018 2019 2020 2021F
Uganda Industry Sectoral Performance (Y-o-y growth)
Note: Industry comprises: Mining and quarrying + Manufacturing + Electricity and water supply + Construction
| Industry was the only sector estimated to record growth in 2020 at 1.1%, mainly driven by the production of sanitisers and protective gear. The 5.0% growth projected in 2021 will be mainly driven by a resumption of infrastructure projects.
75%percentage of industries that experiences a shortage of raw materials as a result of the pandemic
COVID-19 impact on key sectors of Uganda’s economy

45
Economic Impact of the COVID-19 Pandemic on East African Economies: Volume 2
Source: EIU, Ministry of Finance, Planning and Economic Development
493.3
249.0 257.8 257.6254.9
348.0
665.4
551.0
-100%
-50%
0%
50%
100%
150%
0
100
200
300
400
500
600
700
Q1 Q2 Q3 Q4 Q1 Q2 Q3 Q4
2019 2020
US
D m
illio
ns
Gold Export Revenues Performance
Revenue Q-o-Q % growth
Industry: Mining and Energy sub-sectors
• Due to the global shutdowns brought by the coronavirus pandemic, Uganda’s gold export revenues fell from USD 104.6m beginning of Q1 2020 to USD 60.4m beginning of Q2 2020. The concentration of gold exports to a single market (United Arab Emirates comprised 96.0% of Uganda’s gold exports) exposed Uganda to volatility arising from pandemic-related economic uncertainties.
• Gold export revenues picked up in Q3 2020 totalling USD 665.4m, following the gradual ease of the global pandemic containment measures. Revenues and production dipped slightly in Q4 2020 as a result of the political tensions in the run up to the national elections in January 2021.
• Gold prices are expected to rise from USD1,780/oz in 2020 to USD1,850/oz in 2021. However, since Uganda imports the majority of its unrefined gold from regional countries (mainly DRC) (which is then refined domestically), the higher gold price will increase both the value of gold exports, and that of the imported ore.
• The COVID-19 pandemic saw global oil prices decline by more than 40% and this dissuaded oil players from committing finances in the prevailing environment thus posing further delays to final investment decisions on Uganda's key oil projects. The 60,000b/d Hoima oil refinery project which was to become operational in 2022 was pushed further into 2024.
• An estimated 3.9% decrease in electricity generation in 2020 stemmed from COVID-19 related disruptions that slowed mining, construction and heavy industrial operations, lowering electricity demand and consequently electricity supply. However, economic recovery in 2021 as well as the completion of the Karuma Hydropower Plant is expected to increase generation by 14.3% to reach 5.3TWh in 2021, surpassing the 2020 levels, as electricity oversupply increases in the country.
• Electricity generation is expected to grow exponentially in 2022 in line with the completion and commissioning of the Karuma Hydropower Plant. Electricity generation is expected to reach 8.1TWh by 2025, representing an 8.9% CAGR growth between 2021 and 2025. Electricity generation growth is expected to tail off between 2023 and 2025 on account of decreased incentives by the GoU to invest in large scale power projects given Uganda’s oversupply. As such, efforts will be steered towards development and expansion of the national grid to ensure grid stability.
4.1 4.24.5
4.84.6
5.3
-5%
0%
5%
10%
15%
20%
25%
30%
2
3
4
5
6
2016 2017 2018 2019 2020e 2020F
Ele
ctri
city
ge
ne
rati
on
in T
Wh
Electricity Generation
Total Generation TWh % Y-o-Y change
2021F
| In spite of the pandemic, Uganda’s leading commodity export, gold registered a 38% increase in export revenues from USD 1.3bn in 2019 to USD 1.8bn in 2020. The completion of the Karuma Hydropower Plant is expected to boost Uganda's hydropower output which will aid in sustaining the mining sector’s growth in 2021.
COVID-19 impact on key sectors of Uganda’s economy
2020

46
Economic Impact of the COVID-19 Pandemic on East African Economies: Volume 2
Service: Transport and Aviation
• In 2019, 1.8m passengers passed through Entebbe International Airport. In 2020, only 565k passengers passed through the airport. Furthermore, commercial aircraft movements reduced from 33k in 2019 to 14k in 2020. However, due to the sustainment of cargo operations during the lockdown, the Airport handled 58k metric tonnes of cargo in 2020, compared to 42k metric tonnes in 2019.
• Commercial passenger flights in and out of Entebbe International Airport were suspended on March 22, 2020, owing to the need to mitigate the spread of COVID-19 through air travel. However, the only exceptions were special charter and repatriation flights mostly for Ugandans stranded abroad. The airport resumed commercial passenger flights on 01 October 2020.
• As of February 2021, the airport handled 26,904 arrivals, 31,084 departures and 3,448 transit passengers, achieving a daily average of 2,194 passengers in comparison to a 5,400-daily average in 2019.
• Phase one of the cconstruction of Kabaale International Airport in Hoima – which includes runway and cargo-handling facilities – is expected to be ready by 2021, while phase two will be delivered in 2022.This will boost tourism to the country and broaden trade opportunities due to improved logistical connectivity and enhanced air cargo facilities.
Source: EIU, Fitch Solutions, IATA, Uganda Bureau of Statistics
Note: Service includes Wholesale and retail trade + Accommodation and restaurant + Transport and storage + Information and communication + Financial and insurance + Public administration + Professional administration and support services + Real estate +Education + Health + Other services + FISIM + Taxes on products
4.5%
7.8% 7.8%
6.6%
-2.5%
3.5%
-4%
-2%
0%
2%
4%
6%
8%
10%
2016 2017 2018 2019 2020 2021F
Uganda Service Sector Performance (Y-o-y growth) • The Service sector contraction of 2.5% in 2020 is mainly attributable to the slump in tourism receipts, the national lockdown that led to the closure of hotels, schools and malls, and social distancing measures that made it difficult to carry out trade and have caused massive losses in the transport sector.
• Household spending is estimated to have contracted by 0.4% in 2020. This was mainly due to the loss of jobs experienced in the Service sector, which reduced household income. Household spending is projected to grow by 9.0% in 2021, with spending on essential goods and services representing 65.8% of total household expenditure.
• In 2021, it is expected that the Service sector will continue to account for the largest proportion of GDP (about 40%) and will record brisk growth, supported by growing regional trade, expansion in telecommunications services and public utilities and a gradual recovery in tourism.
| The Service sector is estimated to have contracted by 2.5% in 2020 owing to the sharp decline in tourism and trade activities as a result of COVID-19 containment measures. The sector is projected to grow by 3.5% in 2021 supported by growing regional trade due to the implementation of the African Continental Free Trade Area.
39.3%percentage contribution of the services sector to the GDP in Q1-2020
COVID-19 impact on key sectors of Uganda’s economy
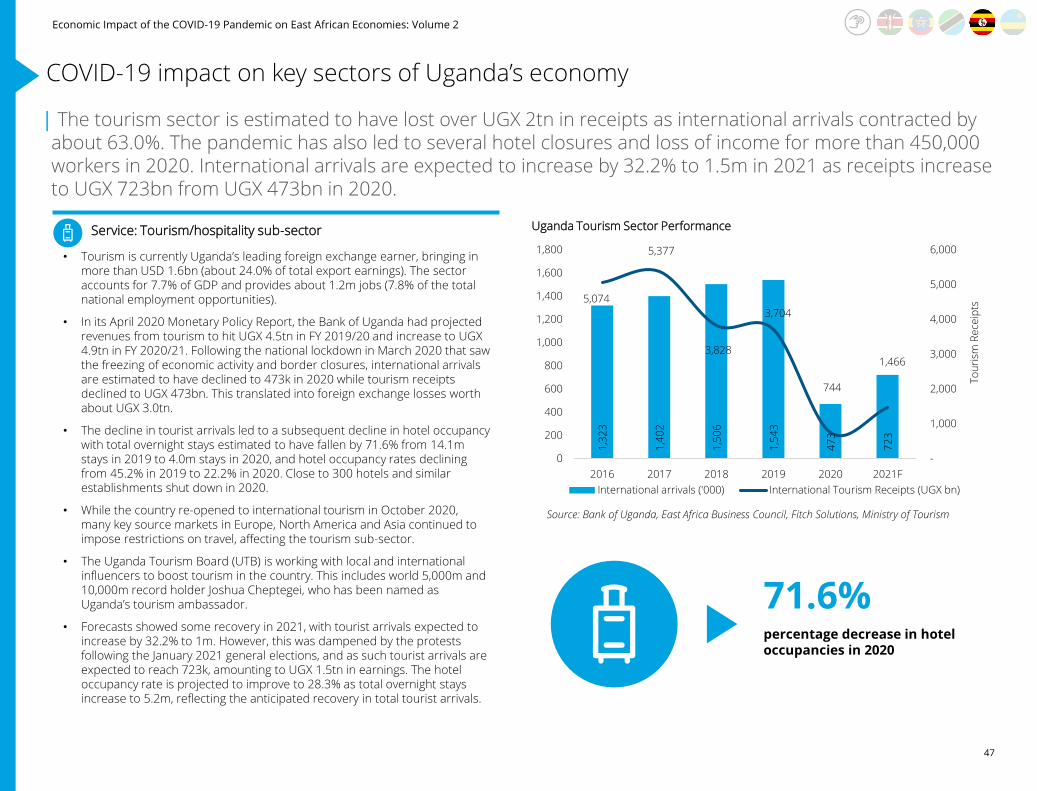
47
Economic Impact of the COVID-19 Pandemic on East African Economies: Volume 2
Source: Bank of Uganda, East Africa Business Council, Fitch Solutions, Ministry of Tourism
Service: Tourism/hospitality sub-sector
• Tourism is currently Uganda’s leading foreign exchange earner, bringing in more than USD 1.6bn (about 24.0% of total export earnings). The sector accounts for 7.7% of GDP and provides about 1.2m jobs (7.8% of the total national employment opportunities).
• In its April 2020 Monetary Policy Report, the Bank of Uganda had projected revenues from tourism to hit UGX 4.5tn in FY 2019/20 and increase to UGX 4.9tn in FY 2020/21. Following the national lockdown in March 2020 that saw the freezing of economic activity and border closures, international arrivals are estimated to have declined to 473k in 2020 while tourism receipts declined to UGX 473bn. This translated into foreign exchange losses worth about UGX 3.0tn.
• The decline in tourist arrivals led to a subsequent decline in hotel occupancy with total overnight stays estimated to have fallen by 71.6% from 14.1m stays in 2019 to 4.0m stays in 2020, and hotel occupancy rates declining from 45.2% in 2019 to 22.2% in 2020. Close to 300 hotels and similar establishments shut down in 2020.
• While the country re-opened to international tourism in October 2020, many key source markets in Europe, North America and Asia continued to impose restrictions on travel, affecting the tourism sub-sector.
• The Uganda Tourism Board (UTB) is working with local and international influencers to boost tourism in the country. This includes world 5,000m and 10,000m record holder Joshua Cheptegei, who has been named as Uganda’s tourism ambassador.
• Forecasts showed some recovery in 2021, with tourist arrivals expected to increase by 32.2% to 1m. However, this was dampened by the protests following the January 2021 general elections, and as such tourist arrivals are expected to reach 723k, amounting to UGX 1.5tn in earnings. The hotel occupancy rate is projected to improve to 28.3% as total overnight stays increase to 5.2m, reflecting the anticipated recovery in total tourist arrivals.
1,3
23
1,4
02
1,5
06
1,5
43
47
3
72
3
5,074
5,377
3,828
3,704
744
1,466
-
1,000
2,000
3,000
4,000
5,000
6,000
0
200
400
600
800
1,000
1,200
1,400
1,600
1,800
2016 2017 2018 2019 2020 2021F
To
uri
sm R
ece
ipts
Uganda Tourism Sector Performance
International arrivals ('000) International Tourism Receipts (UGX bn)
| The tourism sector is estimated to have lost over UGX 2tn in receipts as international arrivals contracted by about 63.0%. The pandemic has also led to several hotel closures and loss of income for more than 450,000 workers in 2020. International arrivals are expected to increase by 32.2% to 1.5m in 2021 as receipts increase to UGX 723bn from UGX 473bn in 2020.
71.6%percentage decrease in hotel occupancies in 2020
COVID-19 impact on key sectors of Uganda’s economy

48
Economic Impact of the COVID-19 Pandemic on East African Economies: Volume 2
Source: EIU, Uganda Bureau of Statistics, Centre for Affordable Housing Finance in Africa
Services: Real estate sub-sector
• Despite the historical rise of property prices in the Greater Kampala Metropolitan Area (GKMA), there was a marked decline of 2.9% in Q2 2020 attributed to the negative effects of the pandemic on the residential property market. Before the first case of COVID-19 was announced in Uganda, property prices had reported a 5.8% increase in Q1 2020 compared to a similar period in 2019.
• As the government successfully contained the spread of the virus and opened up the economy post lockdown, the property price index bounced back up in Q3 and grew by 5.8%. However, rising political tensions in the run up to the national elections in early 2021 and increased COVID-19 cases led to a 3.3% decline in Q4 2020.
• According to the Bank of Uganda, the non-performing loan (NPL) ratio in the building, construction, and real estate sector increased by 6.5% in Q2 2020 from 4.4% in the previous quarter. The NPL ratio improved in Q3 to 4.7% and rose slightly to 4.9% in Q4 owing to a recovery in economic activity following the opening of the economy post lockdown.
• As a risk mitigation measure, the Bank of Uganda set a maximum limit of 85% on the loan-to-value ratio for residential mortgages and loans for land purchase due to the likely impact of COVID-19 on the quality of assets. • According to Knight Frank, there was an 11% increment in the supply of residential
apartment units to 2,230 units in H1 2020, up from 2,006 units in H1 2019. The increase in supply versus low demand owing to the repatriation of foreign nationals to their home countries at the announcement of the lockdown, forced most landlords to discount their rents in order to be more competitive.
• Although the Bank of Uganda lowered the central bank rate significantly (9% to 7%), lending rates by financial institutions remain high – averaging 19.2% – given the risks of loan recovery thus negatively affecting investment decisions in the building, construction and real estate sector.
• The real estate sector is particularly vulnerable to weakening private investment as the crisis is likely to see a significant portion of businesses hold off on decisions to expand facilities, with real estate developers also holding off launching new projects.
-5.7%
-0.3%
6.2%
1.3%
5.8%
-2.9%
5.8%
-3.3%
-8%
-6%
-4%
-2%
0%
2%
4%
6%
8%
85
90
95
100
105
110
115
Q1 Q2 Q3 Q4 Q1 Q2 Q3 Q4
2019 2020
Pri
ce In
de
x
GKMA Residential Property Price Index Performance
Price Index Q-o-Q % growth
| As at Q4 2020, the GKMA residential property price index stood at -3.3%, a decline from 1.3% in the same period in 2019 owing to the negative effects of the COVID-19 pandemic on the residential property market. The medium term (2021-2025) outlook points to a sector that remains particularly vulnerable to weakening private investment
19.2%lending rate offered by financial institutions in Uganda
COVID-19 impact on key sectors of Uganda’s economy

49
Economic Impact of the COVID-19 Pandemic on East African Economies: Volume 2
Source: Bank of Uganda, Fitch Solutions, Uganda Securities Exchange (USE)
Financial services: Banking and Insurance
• The Bank of Uganda lowered its policy rate from 9% in January 2020 to 8% in April 2020 and further to 7.0% in June 2020 to ensure normal functioning of the financial markets. As of 30 June 2021, the policy rate was still maintained at 7%
• Despite the accommodative monetary policy, the average lending rate increased from 17.7% in March 2020 to 19.6%% in November 2020. This is because banks expected the default rates on both business and personal loans to increase further on account of uncertainty over the increased rate of infections.
• The economic slowdown in the country caused by the COVID-19 pandemic has led to a deterioration of asset quality with the non-performing loans (NPL) ratio rising to 6.0% as of June 2020 compared to 3.8% in June 2019. However,following the re-opening of the economy post lockdown, the NPL ratio declined to 5.3% in December 2020.
• The Central Bank announced credit relief measures (CRMs) in April 2020 in order to cushion the effects of COVID-19 on borrowers who had been affected by the economic downturn. As at end of February 2021, the restructured loans under the CRMs amounted to UGX 8.2tn, UGX 4.6tn of which remain outstanding. 46.9% of loans in the banking sector have benefitted from the CRMs since April 2020.
• As of February 2021, the value of loan applications stood at UGX 3.8tn while loan approvals stood at UGX 2.5tn, majority being personal and household loans. However, these were far below the pre-pandemic (2019) value of loan applications and approvals valued at KES 7.6trn and 4.8trn, respectively, signifying lending aversion by commercial banks.
• As of Q4 2020, gross insurance written premiums totalled UGX 1.06trn, UGX 662bn attributable to non-life insurance premiums (registering an 8.84% growth compared to Q4 2019). Despite increased cases of insurance fraud and the slow uptake of insurance, the insurance sector remained resilient and managed to record growth in 2020.
• There’s a positive outlook for the sector in 2021 with total bank assets projected to rise by 11.0% to UGX 38.0trn in 2021, while insurance premiums are projected to rise by 7% to UGX 1.14trn following a rebound in economic activity.
Financial services: Equity market
• As of 31 December 2020, market capitalisation of the Uganda Securities Exchange stood at UGX 18.3tn down from UGX 24.9tn in Dec-2019, representing a 26.5% loss following reduced investor confidence caused by the coronavirus pandemic.
• As of 30 June 2021, the exchange comprised of 17 listed companies, with 7 companies being cross-listed in Kenya. There was no cross-listed company that traded during the month and furthermore, the all-share index registered a 15.3% YTD growth from January 2020 (pre-pandemic).
• An acceleration of trading activity is expected going forward owing to the government’s move requiring its telecom operators to list at least 20% of their shares on the local bourse to allow local investors in the East African Community to benefit from the sector’s profits.
1,8
15
1,7
88
1,4
92
1,3
19
1,3
88
1,3
62
1,3
01
1,2
83
1,3
57
1,3
30
1,3
09
1,2
76
1,3
00
1,3
52
1,3
55
1,3
90
1,4
52
1,4
98
-20%
-15%
-10%
-5%
0%
5%
10%
0
200
400
600
800
1000
1200
1400
1600
1800
2000
Jan
-20
Feb
-20
Ma
r-2
0
Ap
r-2
0
Ma
y-2
0
Jun
-20
Jul-
20
Au
g-2
0
Se
p-2
0
Oct
-20
No
v-2
0
De
c-2
0
Jan
-21
Feb
-21
Ma
r-2
1
Ap
r-2
1
Ma
y-2
1
Jun
-21
% g
row
th
Uganda Securities Exchange All Share Index Performance
Index % M-o-M growth
| The sector’s 2021 outlook is positive with total bank assets projected to rise by 11.0% from UGX 33.8tn to UGX 38.0tn in 2021, while insurance premiums are projected to rise by 7% from UGX 1.06tn to UGX 1.14tn following a rebound in economic activity
COVID-19 impact on key sectors of Uganda’s economy

50
Economic Impact of the COVID-19 Pandemic on East African Economies: Volume 2
Technology, media and telecommunications: Mobile NetworkOperators (MNOs)
• Mobile money transactions were negatively affected with the value declining by 3% in the quarter ending June 2020, despite the move by operators to waive some of the mobile money transaction fees. MTN and Airtel gradually reintroduced mobile money transactions at a 50% discount to standard tariffs for 30 days for MTN and Airtel Money person-to-person (P2P) transactions on the same network, and mobile wallet-to-bank transactions. There was a 29% increase in mobile money transactions in Q3 owing to the drive to use digital services in order to curb the spread of the virus via physical contact.
• According to the Uganda Communications Commission (UCC), mobile subscriptions declined from 28.4 million at the end of March 2020 to 25.5 million at the end of June 2020. This was the first ever recorded market decline in the last 2 years. The contraction in mobile subscriptions was due to a clean up by one of the leading mobile cellular companies, which got rid of the register of SMS-only receiving SIMs. Furthermore, the closure of retail stores prevented on-boarding of customers to networks.
• Preliminary review of the annual 2020 performance showed that the telecommunications market had grossed more than USD 1bn in annual revenues for the first time. This was attributed to sustained growth in digital and mobile financial services. By the end of December 2020, the number of active internet subscriptions had grown to 21.4 million, translating into an internet access reach of more than 1 active connection for every 2 Ugandans.
• The performance of the TMT sector is forecasted to slightly decline in 2021 owing to:― Migration of the two largest operators – Airtel Uganda and MTN to a
national operator license which will affect their tariffs; and ― Majority of consumers and businesses may choose to defer migrating to
premium products such as fibre and 4G/5G connectivity in favour of cheaper but still good enough products/services due to the decline of disposable income brought about by the effects of the pandemic.
17
,00
5
17
,04
0
18
,52
1
20
,52
5
20
,70
0
20
,01
0
25
,73
8
27
,28
1
-6%
-1%
4%
9%
14%
19%
24%
29%
2,000
7,000
12,000
17,000
22,000
27,000
32,000
Q1 Q2 Q3 Q4 Q1 Q2 Q3 Q4
2019 2020
UG
X b
n
Uganda Mobile Money Transactions Performance
Transaction Value % Q-o-Q Growth
Source: Bank of Uganda, Uganda Communications Commission, Fitch Solutions
| Despite a decline in disposable income due to the negative effects of the pandemic on the economy, the Technology, Media and Telecommunications sub-sector stands to gain due to the uptake of digital services in an effort to curb the spread of the virus.
3%percentage decline in mobile money transaction by end of June 2021
COVID-19 impact on key sectors of Uganda’s economy

51
Economic Impact of the COVID-19 Pandemic on East African Economies: Volume 2
| Analysis of COVID-19 sector heat maps of the Rwandan economy
The Rwandan Economy

52
Economic Impact of the COVID-19 Pandemic on East African Economies: Volume 2
Source: World Bank, IMF, RSE, National Bank of Rwanda, Deloitte Analysis
Real GDP growth rate
2.7% 3.2%
9.4%
-3.3% -2.1%-0.2%
6.0%3.4%
5.7%
Global Africa Rwanda
2019 2020 2021F
Reduced trade flows,
temporary closure of
businesses coupled with
higher food prices and a
weaker currency saw
Rwanda’s inflation average
8.0% in 2020. Declining food
prices and subdued demand
–side pressures due to low
levels of private consumption
will see inflation contained at
2.5% in 2021
6.7%
8.0%
2.5%
Inflation
2019
2020
2021F
5.0%
8.2%
16.5%
(1.0%)
(4.2%)
4.5%
3.5%
6.6% 6.8%
-10%
-5%
0%
5%
10%
15%
20%
Agriculture Sevices Industry
2019 2020 2021F
Sectorial growth
The Rwandan Shilling (RWF) remains under pressure against the dollar, depreciating from an average of RWF 899.4/USD in 2019 to RWF 943.3/USD in 2020 and is projected to deteriorate further to an average of 987.5RWF/USD in 2021.
Current account deficit narrowed to USD 0.75bn (6.7% of GDP) in 2020 compared to USD 0.78bn average of 2019 (7.7% of GDP) and is expected to average 7.3% of GDP in 2021 as global fuel prices and demand for capital goods recover.
Rwanda’s real GDP is projected to grow by 5.7% as compared to an estimated contraction of 0.2% in 2020, with public sector investment and consumption being the main drivers of the projected growth.
Rwanda’s Debt to GDP ratio rose from an average of 61.4% in 2019 to an estimated 66.0% in 2020 and is forecast to reach 72.0% in 2021 due to the anticipated increase in government borrowing and spending on infrastructure projects.
Rwanda’s unemployment rate rose by 0.4% from 1.0% in 2019 to 1.4% in 2020 due to increased retrenchments as a result of the pandemic.
Rwanda’s GDP is expected to recover from a contraction of 0.2% in 2020 to a growth of 5.7% growth in 2021 on the back of a strong agricultural sector and a revamped services and manufacturing sector.
16
.8%
16
.5%
16
.1%
16
.7%
16
.7%
15
.8%
16
.5%
16
.5%
Qtr
1
Qtr
2
Qtr
3
Qtr
4
Qtr
1
Qtr
2
Qtr
3
Qtr
4
Lending rate
2019 2020
Rwanda’s foreign exchange reserves (excluding gold) averaged USD 1.2m in 2020. This is a 20% decline from USD 1.5m in 2019.
Rwanda’s Economy at a Glance

53
Economic Impact of the COVID-19 Pandemic on East African Economies: Volume 2
Agriculture sector
• The agricultural sector accounted for 24.0% of Rwanda’s GDP and provided employment to roughly 72% of the working population annually and on average over the past five years. The sector accounts for an estimated 80% of foreign income from exports of coffee, tea, hides and skins, horticulture and pyrethrum. Coffee and tea are Rwanda’s most important agricultural export items.
• The agricultural sector is estimated to have contracted by 0.7% in 2020 as compared to a 5.0% growth in 2019, largely a consequence of the reduction in export crop (coffee and tea) by 16.0%. Further, global price fluctuations and travel restrictions led to an overall reduction in total export revenues.
4.0%4.8%
6.3%5.0%
-0.7%
3.5%
-2%
-1%
0%
1%
2%
3%
4%
5%
6%
7%
2016 2017 2018 2019 2020 2021F
Rwanda Agriculture sector Y-o-Y growth
Source: National Institute of Statistics Rwanda, Deloitte Analysis
• The impact of the COVID-19 crisis was compounded by heavy rains, which in May-2020 led to flooding that killed dozens, destroyed crops and caused damage of around RWF 120bn (USD 130m) to infrastructure. This exerted pressure on food prices which have been on a steady rise as the price of food and non-alcoholic beverages in urban areas increased by 12.0% between Jul-2019 and Jul-2020.
• Rwanda’s agricultural sector is forecasted to grow by 3.5% in 2021 largely due to the increased focus on the production of coffee, tea and horticulture for export. Further, the production and export of cannabis was legalised in Oct-2020 and this may boost growth in agricultural sector.
72%percentage of employment stemming from agriculture
COVID-19 impact on key sectors of Rwanda’s economy
| Rwanda’s agricultural sector is estimated to have contracted by 0.7% in 2020 largely driven by a 16.0% decrease in tea and coffee production and exports. The sector is expected to grow by 3.5% in 2021 largely driven by the expansion in export-focused subsectors, mainly coffee, horticulture and tea

54
Economic Impact of the COVID-19 Pandemic on East African Economies: Volume 2
Source: Fitch solutions, Deloitte Analysis
Tourism and hospitality
• Tourism revenues from international visitors dropped by an estimated 35.0% in 2020 compared to 2019, with the total of number of visitors dropping by 47.2% in 2020. In the months of April and May, Rwanda saw a drop of 100% in the number of international tourists following the announcement of the lockdown. The losses related to Meetings, Conventions and Exhibitions (MICE) tourism were estimated to be around USD 80m for events that would have been hosted between Mar-2020 and Nov-2020.
1,3
33
.5
1,4
39
.4
1,5
02
.9
1,6
02
.5
84
7.0
1,0
95
.7
2.6%7.9%
4.4%6.6%
-47.2%
29.4%
-60%
-50%
-40%
-30%
-20%
-10%
0%
10%
20%
30%
40%
0
200
400
600
800
1,000
1,200
1,400
1,600
1,800
2016 2017 2018 2019 2020 2021F
Total tourist arrivals ('000) Y-o-Y growth (%)
Rwanda total tourist arrivals • Rwanda benefitted on a global scale as from Q3 2020 after being included
on the European Union’s list of 'epidemiologically safe' countries for travel.
The Rwanda Development Board (RDB) continues to promote tourism in
2021. The board has since reduced the price of permits for tracking
endangered mountain gorillas by between 60.0% to 80.0%. Furthermore,
the board offers attractive all-inclusive tourism packages for Rwandans and
foreign residents.
• Tourist arrivals are projected to grow by 29.4% to 1.1m arrivals in 2021
mainly due to the rollout of vaccine inoculations which will result in the
easing of travel restrictions. The growth will also be backed by increased
incentives by the RDB to promote tourism.
35%percentage decline in tourism revenues
COVID-19 impact on key sectors of Rwanda’s economy
| Rwanda’s tourist arrivals declined by 47.2% in 2020 due to the travel restrictions placed as a result of the COVID-19 pandemic. Tourist arrivals are forecasted to increase by 29.4% in 2021 due to the ease of the travel restrictions following the rollout of COVID-19 vaccinations.

55
Economic Impact of the COVID-19 Pandemic on East African Economies: Volume 2
Transport and Aviation sectors
• The transport sector contributed 6.0% to Rwanda’s GDP, on average, over the past five years.
• The sector is estimated to have contracted by 20.5% in 2020 compared to a growth of 12.3% in 2019 largely due to decreased land transport, logistical services, and air transport following the global travel restrictions and social distancing measures.
• The government in February 2020 sold a 49.0% stake in the Rwandair airline to Qatar Airways. This followed the investment partnership between Qatar Airways and the Rwandan government made in December 2019 where the Middle Eastern carrier agreed to take a 60.0% stake in the new Bugesera airport (east of Kigali), a project worth nearly USD 1.3bn.
• Domestic movement restrictions were partially relaxed in May 2020 but strict physical distancing measures were then mandated in public modes of transportation. The price of average transport fares increased by approximately 23.0% compared to 2019, brought on by COVID-19 regulations such as the 50.0% reduction in public transport capacity.
8.0
%
15
.3%
19
.8%
12
.3%
-20
.5%
6.6
%
-25%
-20%
-15%
-10%
-5%
0%
5%
10%
15%
20%
25%
2016 2017 2018 2019 2020 2021F
Rwanda Transport sector perfomance (Y-o-Y growth)
Source: National Institute of Statistics Rwanda, Fitch Solutions
• The country’s national carrier, Rwandair, cut between 8.0% to 65.0% off net salaries of employees in 2020 in a bid to reduce its operational costs following global travel restrictions that hindered operations.
• The sector is projected to grow by 6.6% in 2021 as travel restrictions are eased following the rollout of the vaccines. Further growth is anticipated in future due to the planned construction of the Isaka-Kigali Standard Gauge Railway line. Additionally, Qatar Airways' purchase of a 60% stake in Bugesera International Airport bodes well for the sector.
6%contribution to the GDP on average over the past 5 years from the transport sector
COVID-19 impact on key sectors of Rwanda’s economy
| Rwanda’s transport sector is estimated to have contracted by 20.5% in 2020 following increased global travel restrictions and the imposed government lockdown. The sector is however expected to recover to a growth of 6.6% in 2021 following the easing of restrictions and opening up of the economy.
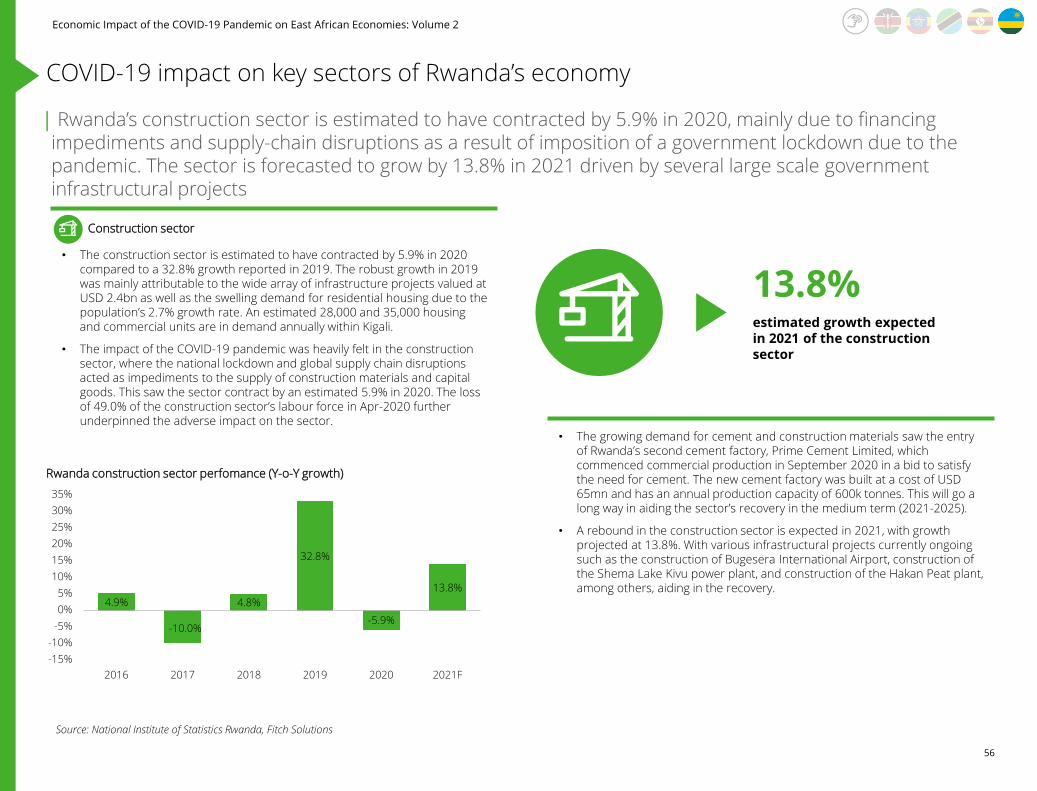
56
Economic Impact of the COVID-19 Pandemic on East African Economies: Volume 2
4.9%
-10.0%
4.8%
32.8%
-5.9%
13.8%
-15%
-10%
-5%
0%
5%
10%
15%
20%
25%
30%
35%
2016 2017 2018 2019 2020 2021F
Rwanda construction sector perfomance (Y-o-Y growth)
Construction sector
• The construction sector is estimated to have contracted by 5.9% in 2020 compared to a 32.8% growth reported in 2019. The robust growth in 2019 was mainly attributable to the wide array of infrastructure projects valued at USD 2.4bn as well as the swelling demand for residential housing due to the population’s 2.7% growth rate. An estimated 28,000 and 35,000 housing and commercial units are in demand annually within Kigali.
• The impact of the COVID-19 pandemic was heavily felt in the construction sector, where the national lockdown and global supply chain disruptions acted as impediments to the supply of construction materials and capital goods. This saw the sector contract by an estimated 5.9% in 2020. The loss of 49.0% of the construction sector’s labour force in Apr-2020 further underpinned the adverse impact on the sector.
Source: National Institute of Statistics Rwanda, Fitch Solutions
• The growing demand for cement and construction materials saw the entry of Rwanda’s second cement factory, Prime Cement Limited, which commenced commercial production in September 2020 in a bid to satisfy the need for cement. The new cement factory was built at a cost of USD 65mn and has an annual production capacity of 600k tonnes. This will go a long way in aiding the sector’s recovery in the medium term (2021-2025).
• A rebound in the construction sector is expected in 2021, with growth projected at 13.8%. With various infrastructural projects currently ongoing such as the construction of Bugesera International Airport, construction of the Shema Lake Kivu power plant, and construction of the Hakan Peat plant, among others, aiding in the recovery.
13.8%estimated growth expected in 2021 of the construction sector
COVID-19 impact on key sectors of Rwanda’s economy
| Rwanda’s construction sector is estimated to have contracted by 5.9% in 2020, mainly due to financing impediments and supply-chain disruptions as a result of imposition of a government lockdown due to the pandemic. The sector is forecasted to grow by 13.8% in 2021 driven by several large scale government infrastructural projects

57
Economic Impact of the COVID-19 Pandemic on East African Economies: Volume 2
Manufacturing sector
• Rwanda’s manufacturing sector growth slowed down to 4.5% in 2020 compared to a growth of 11.3% in 2019 that was driven by the governments continued efforts to create an impetus for manufacturing goods exports through the ‘Made in Rwanda’ initiative.
• The sector’s positive outturn in 2020, despite the overall economic slowdown experienced over the same period was mainly due to increased production in food processing, textiles, clothing & leather and chemicals and plastic products.
• The manufacturing sector is set to fully rebound towards the end of 2021 as projects on energy infrastructure development and advancements in the manufacturing sector through new factories under the ‘Made in Rwanda’ policy initiative are expected to see growth reach 12.6%. The country is also setting up a tin smelting plant and a tantalum ore refinery poised to increase their industrial activity and output.
6.6% 6.5%
13.6%11.3%
4.5%
12.6%
0%
2%
4%
6%
8%
10%
12%
14%
16%
2016 2017 2018 2019 2020 2021F
Rwanda Manufacturing sector perfomance (Y-o-Y growth)
Source: National Institute of Statistics Rwanda, Fitch Solutions
• We expect Rwanda to attract investment in manufacturing industries such as textiles, automobiles and advanced technology. Subsequently, a favourable business environment is expected to lead to increased foreign private investment inflows in 2021.
12.6%estimated growth in 2021 of the manufacturing sector
COVID-19 impact on key sectors of Rwanda’s economy
| Rwanda’s industrial output witnessed an estimated 7.0% contraction in 2020, following the disruption of supply chains brought on by the imposed government lockdown. The sector is projected to grow by 12.6% due to increased set up of new factories.

58
Economic Impact of the COVID-19 Pandemic on East African Economies: Volume 2
Rwanda Customer Deposits and Loans Y-o-Y growth
• The National Bank of Rwanda (BNR) issued new regulations to cushion the banking sector in response to the COVID-19 pandemic. These included:
‒ Banks were allowed to temporarily ease loan repayment terms
for borrowers so as to soften the increase in Non-Performing
Loans;
‒ Mobile wallet charges were revised downwards to encourage
digital transactions;
‒ The National Bank of Rwanda allocated an additional RWF50bn
(USD 52.5m) for banks to prevent liquidity challenges; and
‒ The cash reserve ratio was reduced to 4.0% from 5.0% from 01
April 2020 allowing banks to keep more usable liquidity, which
they could loan to customers.
• We anticipate that the BNR will maintain its main policy rate at 4.5% in
2021 so as to support economic growth.
• Deposits are forecasted to grow by 13.7% whilst loans are projected to
grow by 13.1% in 2021 due to the anticipated economic growth over the
same period that will lead to growth in private consumption.
Financial services: Banking and Equity market
• The Rwanda stock market showed resilience in the face of the COVID-19 pandemic, remaining stable as it doubled its trading volumes in the first three months of 2020, compared with the same period in 2019. The bourse remained steady throughout Q2, Q3 and Q4 2020 with minimal YTD changes. The steady performance also saw the listing of Cimerwa Plc, a leading cement manufacturer in August 2020 on the Main Investment Market Segment of the Rwandan Stock Exchange.
Source: Rwanda Stock Exchange, National Bank of Rwanda (BNR), Fitch Solutions
15
1.1
15
0.4
15
0.2
15
0.2
15
0.2
15
0.4
14
8.9
14
9.2
14
9.2
14
8.3
14
8.2
14
8.2
14
8.2
14
7.8
14
7.0
14
9.1
14
7.5
14
7.2
-12%
-10%
-8%
-6%
-4%
-2%
0%
2%
144
145
146
147
148
149
150
151
152
Jan
-20
Feb
-20
Ma
r-2
0
Ap
r-2
0
Ma
y-2
0
Jun
-20
Jul-
20
Au
g-2
0
Se
p-2
0
Oct
-20
No
v-2
0
De
c-2
0
Jan
-21
Feb
-21
Ma
r-2
1
Ap
r-2
1
Ma
y-2
1
Jun
-21
Share price (RWF) YTD change (%)
Rwanda All Share Index (ALSIRW) perfomance
13
.8%
12
.7%
14
.6%
13
.8%
7.0
%
13
.1%
9.6% 9.7%
18.9%
13.7%
10.0%
13.7%
0%
2%
4%
6%
8%
10%
12%
14%
16%
18%
20%
2016 2017 2018 2019 2020 2021F
Loans Deposits
COVID-19 impact on key sectors of Rwanda’s economy
| Rwanda’s customer deposits and loans growth are estimated to have declined from 13.8% and 13.7% respectively in 2019 to 10.0% and 7.0% respectively in 2020 due a decline in disposable incomes stemming from job losses. Deposits are forecasted to grow by 13.7% whilst loans are projected to grow by 13.1% in 2021.

59
Economic Impact of the COVID-19 Pandemic on East African Economies: Volume 2
COVID-19 impact on key sectors of Rwanda’s economy
Source: Fitch solutions
Technology, media and telecommunications: Mobile Network Operators
(MNOs)
• Mobile subscriber growth in Rwanda is expected to remain robust, owing to the competition that exists between the country's three remaining network operators: MTN, Tigo and Airtel. Mobile phone subscribers are estimated to have increased by 4.2%, with 3G and 4G subscribers forecasted to have increased by 14.0% and 101.0% respectively in 2020, as telecoms services remain vital in enabling individuals and organisations to continue functioning at a time of crisis.
• Mobile money transactions are estimated to have grown by 58.0% in 2020 following the move to cashless transactions due to the COVID-19 pandemic and a waiver of mobile money transfer fees by some network providers. The transactions are forecasted to grow by 38.0% in 2021 as income levels stabilise due to increased job creation and a revamp in business activity.
26.0% 44.0% -64.0% -10.0%
58.0%
38.0%
-80%
-60%
-40%
-20%
0%
20%
40%
60%
80%
2016 2017 2018 2019 2020 2021F
Rwanda mobile money transactions Y-o-Y growth
• Rwanda’s mobile subscriber base is projected to grow by about 3.5% in 2021. This will be aided by increased traffic on mobile networks due to a rise in use of mobile and broadband services by those working from home as well as furloughed employees opting to spend more time online. Downside risks to the growth include the discounting of inactive SIMs as well as the difficulty of extending mobile network coverage to Rwanda’s large rural population.
38%estimated growth of mobile transactions in 2021
| Rwanda's mobile market is forecasted to grow in the long term, mainly in rural and underserved areas, due to the government's adoption of more aggressive ICT policies and the introduction of incentives such as the ‘Connect Rwanda Initiative

60
Economic Impact of the COVID-19 Pandemic on East African Economies: Volume 2
• UNCTAD: Assessing the Impact of COVID-19 on Africa’s Economic Development July 2020 report
• World Bank: World Economic Outlook update June 2020
• International Monetary Fund (IMF), 2020. World Economic Outlook, April 2020: The Great Lockdown. Available [Online]. https://www.imf.org/en/Publications/WEO/Issues/2020/04/14/World-Economic-Outlook-April-2020-The-Great-Lockdown-49306
• International Monetary Fund (IMF), 2019. Sub-Saharan Africa Economic outlook. Available [Online]. https://www.imf.org/en/Publications/REO/SSA/
• International Air Transport Association (IATA)
• World Travel & Tourism Council (WTTC)
• Fitch Solutions East Africa reports
• Economist Intelligence Unit (EIU) East Africa reports
• S&P Capital IQ
• World Health Organisation
• Kenya National Bureau of Statistics (KNBS) Economic Survey 2020
• Kenya National Bureau of Statistics: Leading Economic indicators (January to July 2020).
• Kenya Ministry of Tourism: http://www.tourism.go.ke/wp-content/uploads/2020/07/COVID-19-and-Travel-and-Tourism-Final-1.pdf
• Kenya Ministry of Tourism: http://www.tri.go.ke/wp-content/uploads/2020/09/TOURISM-PERFORMANCE-AUGUST-2020-.pdf
• University of Nairobi: Impact of COVID-19 on Travel and Tourism Industry in Kenya: https://uonresearch.org/blog/impact-of-covid-19-on-travel-and-tourism-industry-in-kenya/
• CGTN Africa: Kenya mulls recovery of tourism sector as COVID-19 restrictions eased: https://africa.cgtn.com/2020/07/12/kenya-mulls-recovery-of-tourism-sector-as-covid-19-restrictions-eased/
• Fitch Solutions Kenya tourism Report July 2020.
• The impact of COVID-19 on the manufacturing sector in Kenya: https://kam.co.ke/kam/wp-content/uploads/2020/05/KPMG-KAM-Survey-The-impact-of-Covid-19-on-the-manufacturing-sector-in-Kenya_FINAL_19May2020-1.pdf
• The Architectural Association of Kenya; Status of the Built Environment Report: https://aak.or.ke/download/status-of-the-built-environment-january-june-2020/?wpdmdl=4083
• Cytonn: Impact of COVID-19 on Kenya’s Real Estate Sector: https://www.cytonn.com/topicals/impact-of-covid-19-on-kenyas-real-estate-sector#:~:text=COVID%2D19%20has%20caused%20unprecedented,on%20the%20sector%20has%20been%3A&text=Reduced%20funding%20to%20the%20sector,risk%20aversion%20during%20the%20pandemic.
• Fitch Solutions Kenya Real Estate Report August 2020.
• Cytonn report: https://cytonnreport.com/topicals/kenyas-public-debt-2020
• Cytonn report: https://cytonn.com/uploads/downloads/q12020-kenya-listed-banking-sector-report_1.pdf
• National Bank of Ethiopia https://nbebank.com/wp-content/uploads/2020/02/first-quarter-report-2019-20new.pdf
• Africa Development Bank: African Economic Outlook- https://www.afdb.org/en/documents/african-economic-outlook-2020
• Jobs Creation Commission Ethiopia-https://www.jobscommission.gov.et/wp-content/uploads/2019/11/JOBS-CREATION-REPORT-FINAL-HIGHRES-FILE_24_OCT_2019.pdf
End notes

61
Economic Impact of the COVID-19 Pandemic on East African Economies: Volume 2
• International Monetary Fund-https://www.imf.org/en/Publications/CR/Issues/2020/01/28/The-Federal-Democratic-Republic-of-Ethiopia-2019-Article-IV-Consultation-and-Requests-for-48987
• ECA Report – Covid-19 in Africa: Protecting lives and Economies https://www.uneca.org/publications/covid-19-africa-protecting-lives-and-economies
• International Monetary Fund (IMF), 2020. World Economic Outlook, April 2020: The Great Lockdown. Available [Online]. https://www.imf.org/en/Publications/WEO/Issues/2020/04/14/World-Economic-Outlook-April-2020-The-Great-Lockdown-49306
• The economy wide impact of the COVID-19 in Ethiopia: Policy and Recovery options https://media.africaportal.org/documents/The_economywide_impact_of_the_COVID-19_in_Ethiopia.pdf
• Food Agriculture Organisation (http://www.fao.org/ag/locusts/en/info/info/index.html )
• Businesswire (https://www.businesswire.com/news/home/20190827005605/en/Tanzania-Mobile-Money-Markets-2019-2024-Technology-Business)
• World Food Programme (WFP) Food Security Overview Tanzania 2020 (https://www.agroberichtenbuitenland.nl/binaries/agroberichtenbuitenland/documenten/publicaties/2020/05/29/wfp-factsheet-on-impact-of-covid-19-on-food-security-tanzania/Food+Security+Overview+Context+of+COVID19+-+May+2020+-+WFP+Tanzania.pdf)
• Tanzania Horticultural Association (TAHA) (https://www.taha.or.tz/taha/blogPost/87)
• Confederation of Tanzania Industries (CTI) (https://allafrica.com/stories/202005130313.html)
• Bank of Tanzania Quarterly, Monthly and Annual Reports (https://www.bot.go.tz/)
• IMF (https://www.imf.org/en/Topics/imf-and-covid19/Policy-Responses-to-COVID-19#T)
• Ministry of Tourism (https://umaizi.com/covid-19s-impact-on-tanzanias-tourism-sector/)
• Investing.com (https://www.investing.com/indices/tanzania-all-share)
• Dar es Salaam Stock Exchange (https://www.dse.co.tz/)
• International Air Transport Association (IATA) (https://www.iata.org/contentassets/50aef8da0fbd47298a3bb2aa52a9ec77/020720-figures-africa.pdf)
• Tanzania Communications Regulatory Authority (TCRA) (https://www.tcra.go.tz/)
• United Nations Development Program. (https://www.africa.undp.org/content/dam/tanzania/docs/docs2020/undp-tz-SEA-Report%20Rapid-COVID19.pdf)
• The National Bureau of Statistics (NBS)
• Africa CTGN - https://africa.cgtn.com/2020/06/10/uganda-braces-for-major-locust-invasion/
• African Markets – USE: https://www.african-markets.com/en/stock-markets/use
• Bank of Uganda – Quarterly Financial Stability Review (June 2020): https://www.bou.or.ug/bou/bouwebsite/bouwebsitecontent/FinancialStability/Financial-Stability-Review/Jun/Quarterly-Financial-Stability-Review-June-2020-Final.pdf
• Bank of Uganda – Monetary Policy Report (August 2020): https://www.bou.or.ug/bou/bouwebsite/bouwebsitecontent/MonetaryPolicy/Monetary_Policy_Reports/2020/Aug/Monetary-Policy-Report-August-2020.pdf?fbclid=IwAR2EBxJwh_9_Wxwa9KWoqn3NLRjUO_0q8m13KfEKNjZA54yKbM-GcHwSAk8
• Bank of Uganda – State of the Economy Report (September 2020): https://www.bou.or.ug/bou/bouwebsite/bouwebsitecontent/publications/StateofEconomy/publications/StateOfEconomyReports/2020/Sep/State-of-the-Economy-September-2020.pdf
• Insurance Regulatory Authority Uganda: https://www.ira.go.ug/cp/uploads/RESULTS.pdf
• Uganda Ministry of Finance, Planning and Economic Development – https://www.finance.go.ug/sites/default/files/Publications/BMAU%20Briefing%20Paper%204-20-Uganda%25u2019s%20Industrialization%20sub-sector%20during%20Covid-19-%20What%20should%20be%20done.pdf
End notes

62
Economic Impact of the COVID-19 Pandemic on East African Economies: Volume 2
• Uganda Ministry of Finance, Planning and Economic Development – Performance of the Economy Report (August 2020): https://www.finance.go.ug/sites/default/files/Publications/August%20Performance%20of%20the%20Economy%20Monthly%20Report.pdf
• Uganda Ministry of Finance, Planning and Economic Development – Background to the Budget Fiscal Year 2020/21: file:///C:/Users/igathatwa/Downloads/465226497-THE-Back-Ground-to-Uganda-Budget-2020.pdf
• Uganda Ministry of Tourism, Wildlife and Antiquities – Tourism Sector Annual Performance Report: https://02826de6-506e-42ce-ac67-e9e63c7051de.filesusr.com/ugd/1e6d1c_25f604996c33442492f8ec066b21777c.pdf
• Thomson Reuters - Uganda to re-open airport: https://af.reuters.com/article/idAFKBN26125W-OZATP
• Uganda Bureau of Statistics - Residential Property Price Index (RPPI): https://www.ubos.org/wp-content/uploads/publications/07_20204th_Quarter_2019-20_Report.pdf
• Uganda Composite PMI - https://www.fxempire.com/macro/uganda/composite-pmi
• Uganda Revenue Authority – https://www.ura.go.ug/Resources/webuploads/HMPGMSG/PDF.%2007-05-2020%20Update%20on%20the%20URA%20COVID-19%20Business%20Continuity%20Measures.pdf
• East African Daily – Rwanda’s Financial sector is solid. Available [Online]. https://www.theeastafrican.co.ke/tea/business/rwanda-s-financial-sector-is-solid-has-strong-capital-base-1438874
• Tellimer Research – Rwanda sets new bank regulations. Available [Online]. https://tellimer.com/article/rwanda-sets-new-bank-regulations-in-light-of
• KT Press – Rwanda’s stocks remain untouched. Available [Online]. https://www.ktpress.rw/2020/03/rwanda-stocks-remain-untouched-ceo-rwabukumba/
• East African Daily – Rwanda’s bourse remains resilient. Available [Online]. https://www.theeastafrican.co.ke/tea/business/rwanda-s-bourse-remains-resilient-to-covid-19-shocks-doubles-trade-volumes-1439058
• KT Press – Rwanda’s tourism picking up following reopening. Available [Online]. https://www.ktpress.rw/2020/06/rwandas-tourism-picking-up-following-reopening/
• Devex news – How Rwanda’s tourism will change post covid. Available [Online].https://www.devex.com/news/how-will-tourism-in-lmics-change-post-covid-97559
• ECA Report – Covid-19 in Africa: Protecting lives and Economies https://www.tralac.org/documents/resources/covid-19/3293-covid-19-protecting-african-lives-and-economies-uneca-april-2020/file.html
• Tourism on progressive trajectory since reopening: https://www.newtimes.co.rw/news/tourism-progressive-trajectory-reopening
• National Institute of Statistics Rwanda: https://www.statistics.gov.rw/statistical-publications/subjects
• AIPS media: https://www.aipsmedia.com/index.html?page=artdetail&art=28065&CoronavirusKenya.Post-COVID-journalism
End notes

63
Economic Impact of the COVID-19 Pandemic on East African Economies: Volume 2
Contacts
Deloitte East Africa Leaders
CEOJoe [email protected]
Office Managing Partners
David [email protected]
Norbert [email protected]
Deloitte East Africa Offices
KenyaDeloitte PlaceWaiyaki Way, MuthangariNairobiTel: +254 719 039 000
TanzaniaAris House3rd Floor, Plot 152, HaileSelassie Road,Oysterbay, Dar es SalaamTel: +255 22 211 6006 or+255 22 2169000
Uganda3rd Floor Rwenzori House1 Lumumba AvenueKampalaTel: +256 41 7 701000
Deloitte East Africa Financial Advisory
Gladys MakumiFinancial Advisory [email protected]
Kevin KimothoAssociate [email protected]
Tewodros SisayAssociate [email protected]
Special thanks to the technical team
• Ian Nakaya, Senior Business Analyst
• Faiza Mgua, Business Analyst
• David Musyoka, Business Analyst
• Ivy Nyaguthii, Business Analyst
• Sharon Muigai, Business Analyst

About Deloitte
“Deloitte” is the brand under which tens of thousands of dedicated professionals in independent firms throughout the world collaborate to provide audit, consulting, financial advisory, risk management, and tax services to selected clients. These firms are members of Deloitte Touche Tohmatsu Limited (DTTL), a UK private company limited by guarantee. Each member firm provides services in a particular geographic area and is subject to the laws and professional regulations of the particular country or countries in which it operates. DTTL does not itself provide services to clients. DTTL and each DTTL member firm are separate and distinct legal entities, which cannot obligate each other. DTTL and each DTTL member firm are liable only for their own acts or omissions and not those of each other. Each DTTL member firm is structured differently in accordance with national laws, regulations, customary practice, and other factors, and may secure the provision of professional services in its territory through subsidiaries, affiliates, and/or other entities.
© 2021 Deloitte & Touche. All rights reserved. Member of Deloitte Touche Tohmatsu Limited.