solid performance despite covid-19 pandemic
TRANSCRIPT

Solid performance despite COVID-19 pandemic
Results 2020
Charles HéaulméPresident and CEO
Thomas GeustCFO

February 11, 2021 Results 20202
Continued solid performance despite COVID-19 pandemic
– Solid full year sales performance, continued profit improvement and strong cash flow, enabling continued investments into levers for growth
– Gradual recovery in short-term demand has continued, however volatility remains especially for foodservice
– Strong continued demand for fiber packaging and retail tableware
– We have embarked on a transformation journey in line with our long-term growth ambition. We focus on improving our competitiveness, innovation and sustainability, for growth

Our operating environment

February 11, 2021 Results 20204
2020 has been a year of external disruption and internal transformation
- Macroeconomy impacted by COVID-19 crisis and continued geopolitical tensions
- Sustainability legislation gaining momentum particularly in the EU, creating uncertainty, and also opportunities
- Consumption shift towards consumption at home. Rise in demand for innovation in circular products. Competitive pressure created by available capacity
EXTERNAL DISRUPTION
- 2030 growth strategy finalized and rolled-out with enhanced focus on sustainability, digitalization, innovation and high-performance
- Product portfolio adapting to consumption changes and increased sustainability focus
- Preparing for post-COVID, including actions to improve competitiveness and investments for expansion and automation
INTERNAL TRANSFORMATION
Our renewed purpose inspires our everyday work: Protecting food, people and the planet

February 11, 2021 Results 20205
Essential status and health and safety safeguards ensured business continuity to serve our customers
– During 2020, temporary close-down of operations in 14 out of 81 units, with only 3 units closed for more than 3 weeks
– Operations have been closed during 1% of the time
– We have constantly worked on protecting the health of our employees
% of weeks in operation in 2020
North & South America 99%
Europe (incl. Eastern Europe) 97%
Middle East & Africa 99%
Asia and Oceania 99%
Total 99%

Business performance
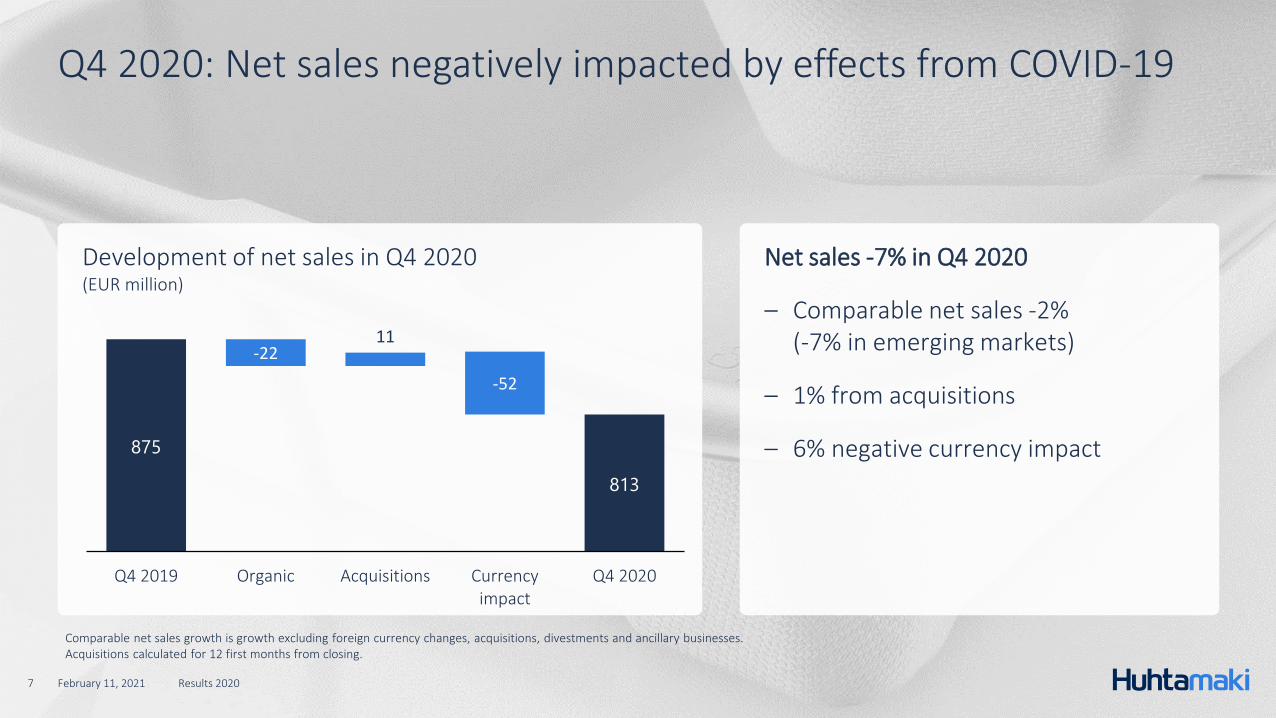
Development of net sales in Q4 2020(EUR million)
875
813
-2211
-52
Q4 2019 Organic Acquisitions Currencyimpact
Q4 2020
February 11, 2021 Results 20207
Q4 2020: Net sales negatively impacted by effects from COVID-19
Net sales -7% in Q4 2020
– Comparable net sales -2% (-7% in emerging markets)
– 1% from acquisitions
– 6% negative currency impact
Comparable net sales growth is growth excluding foreign currency changes, acquisitions, divestments and ancillary businesses.Acquisitions calculated for 12 first months from closing.
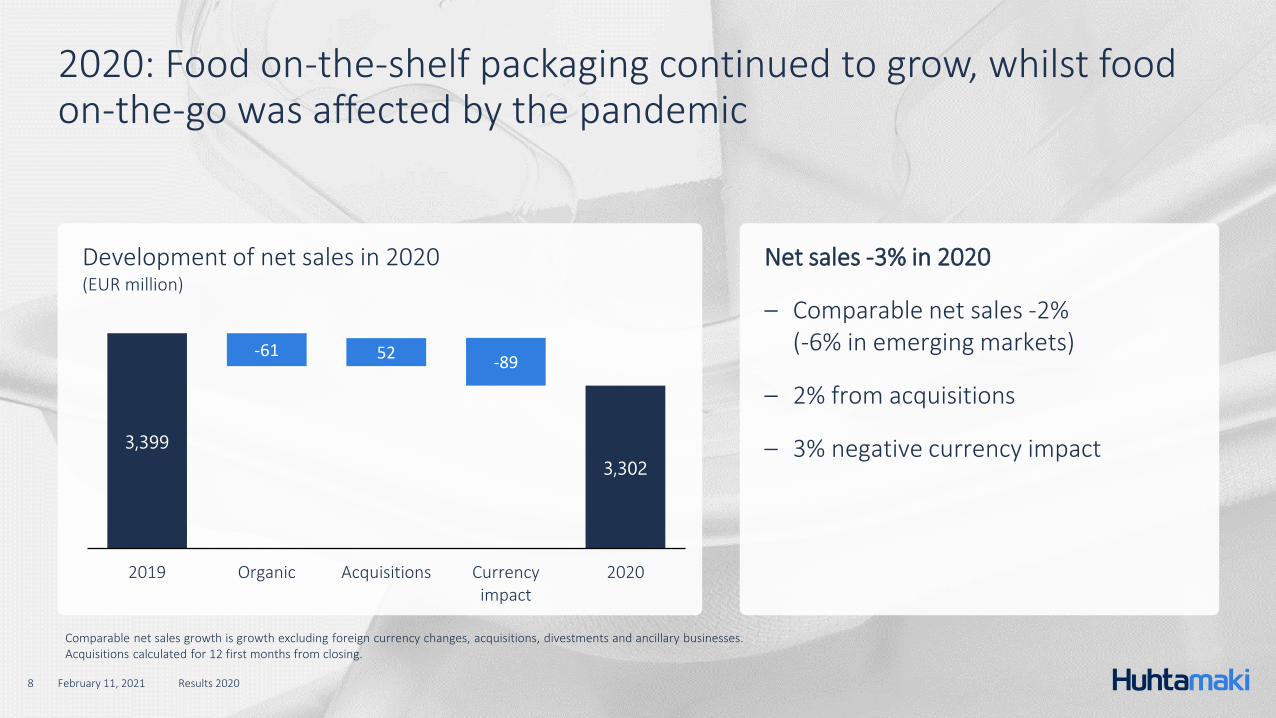
Development of net sales in 2020(EUR million)
3,399
3,302
-61 52-89
2019 Organic Acquisitions Currencyimpact
2020
February 11, 2021 Results 20208
2020: Food on-the-shelf packaging continued to grow, whilst food on-the-go was affected by the pandemic
Net sales -3% in 2020
– Comparable net sales -2% (-6% in emerging markets)
– 2% from acquisitions
– 3% negative currency impact
Comparable net sales growth is growth excluding foreign currency changes, acquisitions, divestments and ancillary businesses.Acquisitions calculated for 12 first months from closing.

February 11, 2021 Results 20209
The global pandemic resulted in a minor decrease in 2020 net sales
Comparable net sales growth is growth excluding foreign currency changes, acquisitions, divestments and ancillary businesses.
– Comparison vs. high 2019 Q4 sales unhelpful against consistency of sales in 2020 H2
– Strong demand continued in retail tableware in North America, growth limited by available inventory and no seasonal impact
– COVID-19 continued to affect foodservice business, globally
– Solid demand continued for food on-the-shelf products. However, with high volatility in emerging markets throughout the year
Comparable growth Q4 19 Q1 20 Q2 20 Q3 20 Q4 20 2019 2020Long-term
ambitions
Foodservice E-A-O 4% -4% -28% -1% -7% 4% -10% 5-7%
North America 6% 9% -5% 4% -2% 9% 1% 3-5%
Flexible Packaging 3% 2% 2% 1% 0% 3% 1% 6-8%
Fiber Packaging 8% 9% 10% 7% 8% 6% 9% 3-5%
Group 5% 3% -8% 2% -2% 6% -2% 5+%

1) Excluding IAC of EUR -24.9 million in Q4 2020 (EUR -2.3 million) and EUR -36.8 million in 2020 (EUR -7.6 million).2) Excluding IAC of EUR -19.3 million in Q4 2020 (EUR -1.8 million) and EUR -26.2 million in 2020 (EUR -5.9 million).
February 11, 2021 Results 202010
Improved adjusted EBIT margin by 0.5 p.p.
– Net sales decreased due to lower demand for foodservice, following the impact of COVID-19
– Adjusted EBIT margin improved in 2020 following favorable sales mix, beneficial cost environment and continued focus on operational efficiency
– Adjusted EPS increased 4% in 2020
– 2020 investments geared towards business expansion and automation
MEUR Q4 20 Q4 19 Change 2020 2019 Change
Net sales 812.8 874.6 -7% 3,301.8 3,399.0 -3%
Adjusted EBIT1 72.8 74.7 -2% 302.1 293.1 3%
Margin 9.0% 8.5% 9.1% 8.6%
Adjusted EPS, EUR2 0.48 0.48 1% 1.95 1.88 4%
Capital expenditure 103.2 71.0 45% 223.5 203.9 10%
February 11, 2021 Results 202011
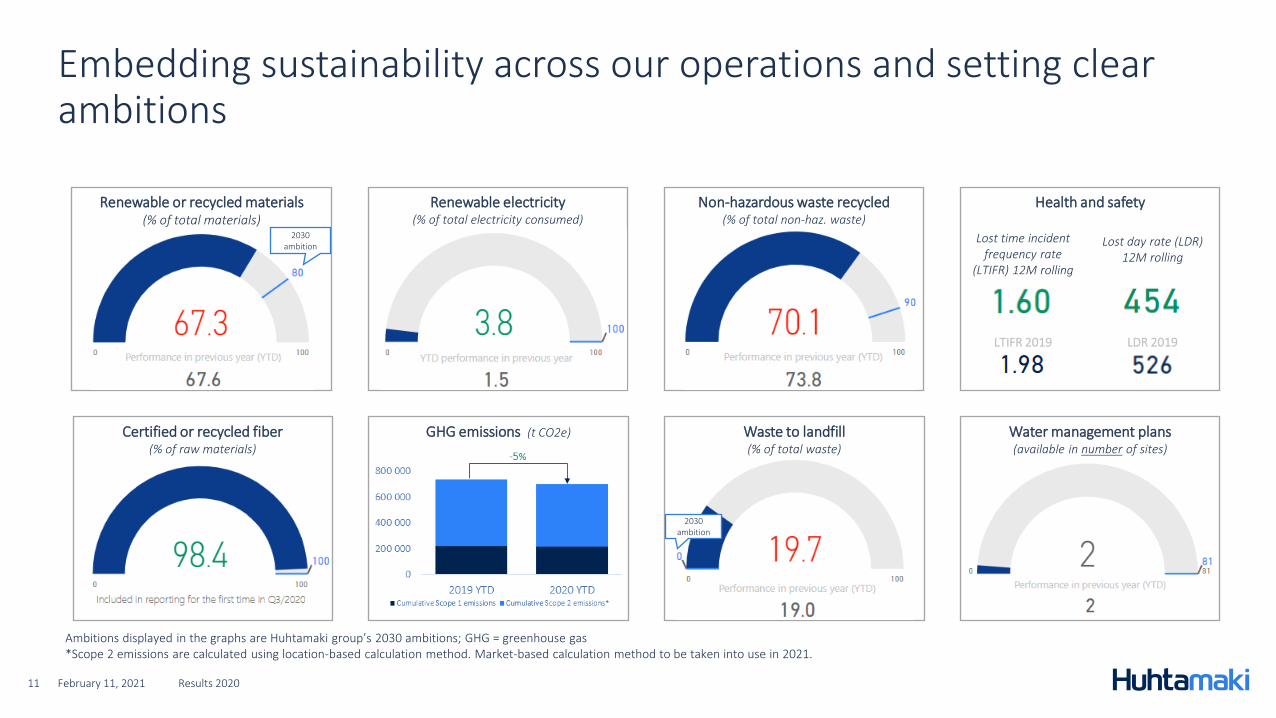
Embedding sustainability across our operations and setting clear ambitions
Ambitions displayed in the graphs are Huhtamaki group’s 2030 ambitions; GHG = greenhouse gas*Scope 2 emissions are calculated using location-based calculation method. Market-based calculation method to be taken into use in 2021.
GHG emissions (t CO2e)
Renewable or recycled materials(% of total materials)
Certified or recycled fiber(% of raw materials)
Non-hazardous waste recycled(% of total non-haz. waste)
Water management plans (available in number of sites)
Waste to landfill (% of total waste)
Health and safety
Lost time incident frequency rate
(LTIFR) 12M rolling
Lost day rate (LDR) 12M rolling
Renewable electricity (% of total electricity consumed)
LTIFR 2019 LDR 2019
2030 ambition
2030 ambition

Business segment review

Net sales and comparable growth (EUR million & %)
228 241 242 245218
167
231213
Q1 Q2 Q3 Q4
2019
2020
4% -4% 3% -28% 4% -1% 4% -7%
1) Excluding IAC of EUR -10.5 million in Q4 2020 (EUR -0.2 million) and EUR -30.0 million in 2020 (EUR -0.5 million).
February 11, 2021 Results 202013
Foodservice EAO: Transformation initiated to secure competitiveness and to adapt to future trends
Comp. growth
– COVID-19 continued to have a significant negative impact on demand
– Net sales decreased in most main markets, however partly compensated by sales of face shields and face masks (Huhta Mask)
– The segment’s adjusted EBIT decreased as a result of lower asset utilization due to lower demand
– IAC of EUR -10 million in Q4 (EUR -29 million in 2020) booked to adapt capacity to future market demand while investing in new products, industrialization and investments in growth markets (Malaysia)
Key figures, MEUR Q4 20 Q4 19 Change
Net sales 213.5 245.3 -13%
Comparable growth -7% 4%
Adjusted EBIT1 15.5 20.9 -26%
Margin 7.3% 8.5%
Capital expenditure 31.6 26.1 21%
Operating cash flow1 11.7 22.3 -48%
Key figures, MEUR 2020 2019 Change
Net sales 829.1 956.7 -13%
Comparable growth -10% 4%
Adjusted EBIT1 60.9 85.7 -29%
Margin 7.3% 9.0%
Adjusted RONA 7.7% 11.5%
Capital expenditure 78.7 74.7 5%
Operating cash flow1 41.6 66.8 -38%

Net sales and comparable growth (EUR million & %)
256
306287 304286 296 283 274
Q1 Q2 Q3 Q4
2019
2020
5% 9% 13% -5% 14% 4% 6% -2%
February 11, 2021 Results 202014
North America: Strong performance throughout the year
– Demand for foodservice packaging still impacted by COVID-19, continued strong demand for retail tableware and in-home ice cream packaging
– Sales in retail tableware were limited by a lower-than-normal available inventory following the strong demand in the previous quarter
– Earnings were supported by the continuation of the margins established in 2019 and favorable sales mix
Key figures, MEUR Q4 20 Q4 19 Change
Net sales 274.0 303.6 -10%
Comparable growth -2% 6%
Adjusted EBIT1 32.2 33.1 -3%
Margin 11.8% 10.9%
Capital expenditure 35.9 15.9 >100%
Operating cash flow1 22.1 44.4 -50%
Key figures, MEUR 2020 2019 Change
Net sales 1,138.9 1,152.7 -1%
Comparable growth 1% 9%
Adjusted EBIT1 136.6 111.4 23%
Margin 12.0% 9.7%
Adjusted RONA 16.8% 13.0%
Capital expenditure 71.7 54.6 31%
Operating cash flow1 150.1 125.0 20%
1) Excluding IAC of EUR 0.1 million in Q4 2020 (EUR -0.1 million) and EUR -6.5 million in 2020 (EUR -3.1 million).
Comp. growth

Net sales and comparable growth (EUR million & %)
252 249 261 255271 263 266 251
Q1 Q2 Q3 Q4
2019
2020
5% 2% 1% 2% 4% 1% 3% 0%
February 11, 2021 Results 202015
Flexible Packaging: Performance held back by COVID-19
– Overall good demand in Europe, with volatility of demand and disruption of the value chain in India and the Middle East
– In Q4, growth was strongest in Europe and decreased especially in India due to pandemic-driven shifts in consumer behavior and unfavorable product mix – also reflected in earnings
– Blueloop deployment ramping up in line with plan
Comp. growth
Key figures, MEUR Q4 20 Q4 19 Change
Net sales 250.8 255.1 -2%
Comparable growth 0% 3%
Adjusted EBIT1 17.9 18.8 -5%
Margin 7.2% 7.4%
Capital expenditure 12.9 15.2 -15%
Operating cash flow1 45.4 49.3 -8%
Key figures, MEUR 2020 2019 Change
Net sales 1,050.8 1,016.4 3%
Comparable growth 1% 3%
Adjusted EBIT1 80.7 82.6 -2%
Margin 7.7% 8.1%
Adjusted RONA 10.1% 11.1%
Capital expenditure 35.9 44.4 -19%
Operating cash flow1 83.8 88.8 -6%
1) Excluding IAC of EUR -0.5 million in Q4 2020 (EUR -0.6 million) and EUR -6.2 million in 2020 (EUR -0.7 million).

Net sales and comparable growth (EUR million & %)
7278
687675 76 72
85
Q1 Q2 Q3 Q4
2019
2020
4% 9% 7% 10% 7% 7% 8% 8%
February 11, 2021 Results 202016
Fiber Packaging: Strong performance throughout the year
– Underlying market growth boosted by the COVID driven in-house consumption trend – net sales growth was strong, especially in Europe
– Earnings improvement driven by volume growth and pricing actions implemented earlier
– Continued investments in capacity, including new factory in Russia
Comp. growth
Key figures, MEUR Q4 20 Q4 19 Change
Net sales 85.4 76.1 12%
Comparable growth 8% 8%
Adjusted EBIT1 12.7 7.5 70%
Margin 14.8% 9.8%
Capital expenditure 22.5 13.7 65%
Operating cash flow1 8.5 7.8 10%
Key figures, MEUR 2020 2019 Change
Net sales 307.8 293.4 5%
Comparable growth 9% 6%
Adjusted EBIT1 37.4 29.0 29%
Margin 12.2% 9.9%
Adjusted RONA 15.8% 12.6%
Capital expenditure 36.7 29.5 24%
Operating cash flow1 18.9 22.4 -16%
1) Excluding IAC of EUR -3.5 million in Q4 2020 (EUR -0.2 million) and EUR -5.2 million in 2020 (EUR -1.2 million).

Financial review

February 11, 2021 Results 202018
Higher adjusted EBIT margin with lower sales
– The increase in earnings in 2020 was supported by the North America and Fiber Packaging segments
– Higher adjusted tax in 2020 with corresponding tax rate 23% (23% in 2019)
1) Excluding IAC of EUR -15.4 million in Q4 2020 (EUR -2.3 million) and EUR -8.6 million in 2020 (EUR -7.6 million).
2) Excluding IAC of EUR -24.9 million in Q4 2020 (EUR -2.3 million) and EUR -36.8 million in 2020 (EUR -7.6 million).
MEUR Q4 20 Q4 19 Change 2020 2019 Change
Net sales 812.8 874.6 -7% 3,301.8 3,399.0 -3%
Adjusted EBITDA1 116.8 117.3 0% 473.1 456.3 4%
Margin 1 14.4% 13.4% 14.3% 13.4%
Adjusted EBIT2 72.8 74.7 -2% 302.1 293.1 3%
Margin 2 9.0% 8.5% 9.1% 8.6%
EBIT 47.9 72.3 -34% 265.3 285.5 -7%
Net financial items -6.5 -6.2 -5% -28.2 -28.8 2%
Adjusted profit
before taxes66.4 68.5 -3% 270.9 264.3 2%
Adjusted income tax
expense3 -14.9 -15.4 3% -60.9 -59.5 -2%
Adjusted profit for
the period4 51.4 53.1 -3% 209.9 204.8 2%
Adjusted EPS, EUR4 0.48 0.48 1% 1.95 1.88 4%
3) Excluding IAC of EUR 5.6 million in Q4 2020 (EUR 0.5 million) and EUR 7.6 million in 2020 (EUR 1.7 million).
4) Excluding IAC of EUR -19.3 million in Q4 2020 (EUR -1.8 million) and EUR -26.2 million in 2020 (EUR -5.9 million).

Foreign currency translation impact
Q4 2020(EUR million)
Net sales EBIT
-52 -5
2020(EUR million)
Net sales EBIT
-89 -8
February 11, 2021 Results 202019
Impact from currencies turned negative during 2020
Please note: Income statement is valued on average rate, balance sheet on closing rate.
Average
rate
Average
rate
2019 2020Q4 19 Q1 20 Q2 20 Q3 20 Q4 20
USD 1.12 1.14 -2% 1.12 1.10 1.13 1.17 1.23 -10%
INR 78.85 84.54 -7% 79.81 83.50 85.19 86.28 89.88 -13%
GBP 0.88 0.89 -1% 0.85 0.89 0.92 0.91 0.90 -6%
CNY 7.73 7.87 -2% 7.82 7.83 7.98 7.98 8.01 -3%
AUD 1.61 1.66 -3% 1.60 1.80 1.64 1.64 1.60 0%
THB 34.78 35.68 -3% 33.47 36.08 34.85 36.99 36.77 -10%
RUB 72.50 82.56 -14% 69.28 88.14 78.92 92.16 91.89 -33%
BRL 4.41 5.88 -33% 4.51 5.65 6.11 6.60 6.36 -41%
NZD 1.70 1.76 -3% 1.66 1.84 1.75 1.77 1.71 -3%
ZAR 16.18 18.76 -16% 15.74 19.73 19.43 19.87 18.01 -14%
Change in
average
rate
Closing ratesChange in
closing
rate(YoY)

February 11, 2021 Results 202020
Net debt decreased compared to Q4 2019 and Q3 2020
Net debt, net debt/adj. EBITDA and gearing – Net debt/Adj. EBITDA at 1.8
– At the end of Q4 2020:
– Cash and cash equivalents EUR 315 million
– Unused committed credit facilities available EUR 310 million
– Net debt EUR 867 million and lease liabilities EUR 154 million
– The dividend for 2019 (EUR 93 million in total) was paid out in September
Ambition
2–3
Covenant level1 3.5
1) Covenant level is excluding IFRS 16 lease liabilities.
9801,019
944904
980908 896 867
2.4 2.4
2.12.0
2.12.0
1.91.8
0.73 0.780.68 0.63 0.68 0.62 0.65 0.64
Q1 19 Q2 19 Q3 19 Q4 19 Q1 20 Q2 20 Q3 20 Q4 20
Net debt, M€
Net debt/Adj.
EBITDA
Gearing

0
100
200
300
400
500
600
2021 2022 2023 2024 2025 Later
Lease liabilities Contingent considerations
Available unused committed facilities Drawn committed credit facilities
Commercial paper program Uncommitted loans from financial institutions
Bonds and other loans
February 11, 2021 Results 202021
Loan maturities
Debt maturity structure December 31, 2020(EUR million)
– Average maturity 2.7 years at the end of Q4 2020 (3.4 at the end of Q4 2019)
– Unused committed credit facilities of EUR 310 million maturing in 2022
– New syndicated multicurrency revolving credit facility loan agreement signed in January 2021 – Size: EUR 400 million
– Maturity: 3 years with two one-year extension options
– Interest margin: Tied to three sustainability indicators
– Reason: To refinance existing credit facility signed in 2015
– Purpose: For general corporate purposes
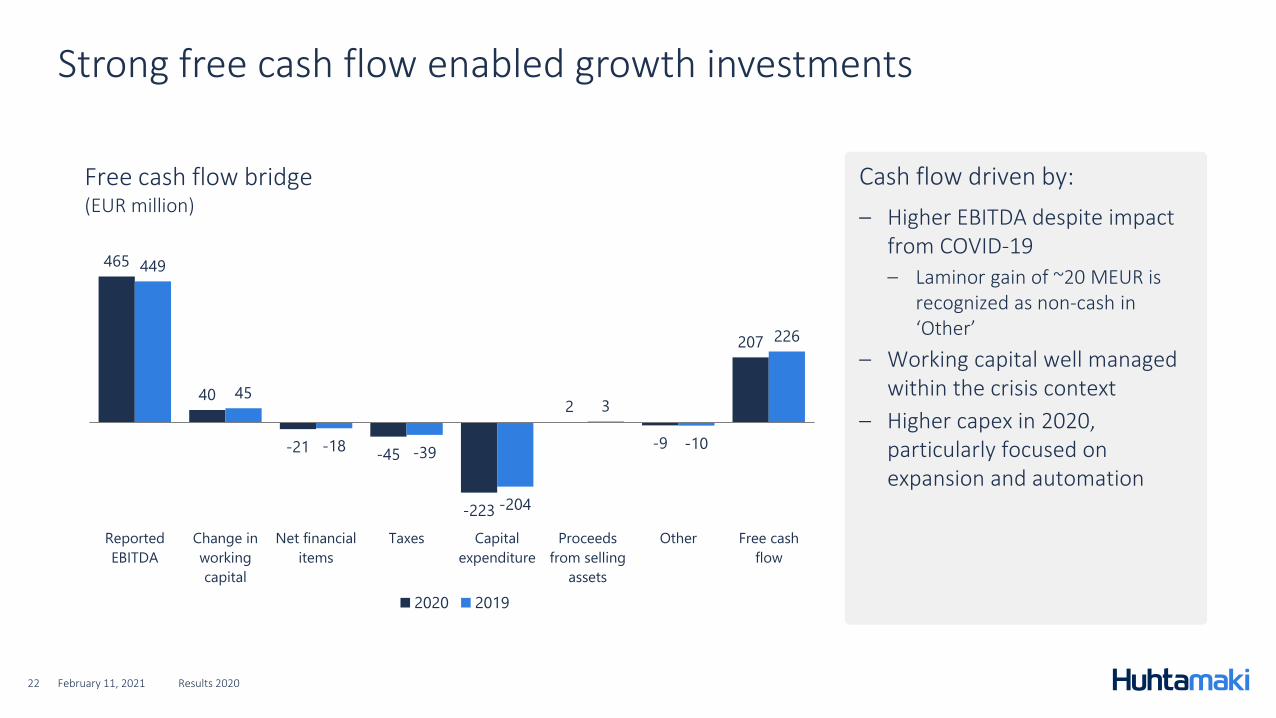
465
40
-21-45
-223
2
-9
207
449
45
-18 -39
-204
3
-10
226
Reported
EBITDA
Change in
working
capital
Net financial
items
Taxes Capital
expenditure
Proceeds
from selling
assets
Other Free cash
flow
2020 2019
February 11, 2021 Results 202022
Strong free cash flow enabled growth investments
Free cash flow bridge(EUR million)
Cash flow driven by:
– Higher EBITDA despite impact from COVID-19
– Laminor gain of ~20 MEUR is recognized as non-cash in ‘Other’
– Working capital well managed within the crisis context
– Higher capex in 2020, particularly focused on expansion and automation

February 11, 2021 Results 202023
Stable financial position
– Total assets lower mainly due to negative impact from currencies
– Net debt decreased and gearing at last year’s level
-> Stable financial position
1) Excluding IAC.
MEUR Dec 2020 Dec 2019
Total assets 3,596 3,611
Operating working capital 514 585
Net debt 867 904
Equity & non-controlling interest 1,364 1,437
Gearing 0.64 0.63
Adjusted ROI1 11.7% 12.3%
Adjusted ROE1 14.8% 15.2%
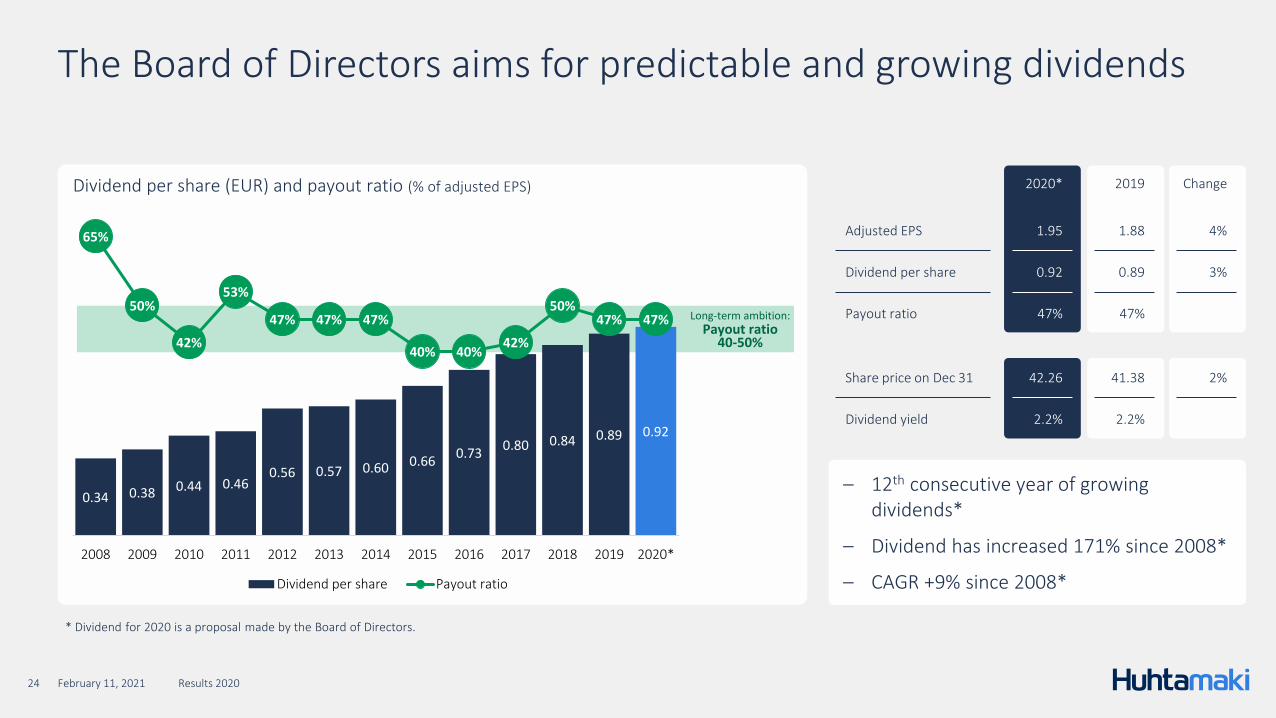
Dividend per share (EUR) and payout ratio (% of adjusted EPS)
February 11, 2021 Results 202024
The Board of Directors aims for predictable and growing dividends
2020* 2019 Change
Adjusted EPS 1.95 1.88 4%
Dividend per share 0.92 0.89 3%
Payout ratio 47% 47%
Share price on Dec 31 42.26 41.38 2%
Dividend yield 2.2% 2.2%
0.34 0.38 0.44 0.460.56 0.57 0.60 0.66
0.730.80 0.84 0.89 0.92
65%
50%
42%
53%
47% 47% 47%
40% 40%42%
50%47% 47%
2008 2009 2010 2011 2012 2013 2014 2015 2016 2017 2018 2019 2020*
Dividend per share Payout ratio
Long-term ambition:Payout ratio
40-50%
* Dividend for 2020 is a proposal made by the Board of Directors.
– 12th consecutive year of growing dividends*
– Dividend has increased 171% since 2008*
– CAGR +9% since 2008*

February 11, 2021 Results 202025
Progress towards long-term financial ambitions
FY 2018 figures restated for IFRS 16 impact. * Dividend for 2020 is a proposal made by the Board of Directors.
– The long-term ambitions were updated at the Strategy Update on March 23, 2020
– A dividend of EUR 0.89 per share (for fiscal year 2019) was paid out on September 25, 2020
– The Board of Directors propose a dividend of EUR 0.92 for fiscal year 2020
2014 2015 2016 2017 2018 2019 2020Long-term
ambition
Organic growth 6% 4% 4% 3% 5% 6% -2% 5+%
Adjusted EBIT margin 7.8% 8.7% 9.4% 9.0% 8.1% 8.6% 9.1% 10+%
Net debt/Adj. EBITDA 1.0 1.6 1.8 1.8 2.3 2.0 1.8 2-3
Dividend payout ratio 47% 40% 40% 42% 50% 47% 47% 40-50%*

Looking forward

February 11, 2021 Results 202027
Outlook 2021
The Group’s trading conditions are expected to improve compared to 2020, however with continued volatility in the operating environment. Huhtamaki's diversified product portfolio provides resilience and the Group’s good financial position enables addressing profitable growth opportunities.

February 11, 2021 Results 202028
Short-term risks and uncertainties
The COVID-19 pandemic is a significant short-term risk potentially creating disturbance in the Group’s trading conditions and its operating environment, as well as in demand for the Group’s products. Volatile raw material and energy prices as well as movements in currency rates are considered to be relevant short-term business risks and uncertainties in the Group's operations. General political, economic and financial market conditions can also have an adverse effect on the implementation of the Group's strategy and on its business performance and earnings.

February 11, 2021 Results 202029
Continued solid performance despite COVID-19 pandemic
– Solid full year sales performance, continued profit improvement and strong cash flow, enabling continued investments into levers for growth
– Gradual recovery in short-term demand has continued, however volatility remains especially for foodservice
– Strong continued demand for fiber packaging and retail tableware
– We have embarked on a transformation journey in line with our long-term growth ambition. We focus on improving our competitiveness, innovation and sustainability, for growth

February 11, 2021 Results 202030
Financial calendar
April 22, 2021
Q1 2021 Interim Report & Annual General Meeting
July 22, 2021
Half-yearly Report
Week commencing
March 1, 2021
Annual Accounts
October 21, 2021
Q3 2021 Interim Report

February 11, 2021 Results 202031
Disclaimer
Information presented herein contains, or may be deemed to contain, forward-looking statements. These statementsrelate to future events or Huhtamäki Oyj’s or its affiliates’ (“Huhtamaki”) future financial performance, including, but notlimited to, strategic plans, potential growth, expected capital expenditure, ability to generate cash flows, liquidity andcost savings that involve known and unknown risks, uncertainties and other factors that may cause Huhtamaki’s actualresults, performance or achievements to be materially different from those expressed or implied by any forward-lookingstatements. By their nature, forward-looking statements involve risks and uncertainties because they relate to eventsand depend on circumstances that may or may not occur in the future. Such risks and uncertainties include, but are notlimited to: (1) general economic conditions such as movements in currency rates, volatile raw material and energy pricesand political uncertainties; (2) industry conditions such as demand for Huhtamaki’s products, pricing pressures andcompetitive situation; and (3) Huhtamaki’s own operating and other conditions such as the success of manufacturingactivities and the achievement of efficiencies therein as well as the success of pending and future acquisitions andrestructurings and product innovations. Future results may vary from the results expressed in, or implied by, forward-looking statements, possibly to a material degree. All forward-looking statements made in this presentation are based oninformation currently available to the management and Huhtamaki assumes no obligation to update or revise anyforward-looking statements. Nothing in this presentation constitutes investment advice and this presentation shall notconstitute an offer to sell or the solicitation of an offer to buy any securities or otherwise to engage in any investmentactivity.
