economic impact of covid -19 on structural engineers › downloads › files › ›...
TRANSCRIPT

Andrew Opdyke, CFAFirst Trust Economics
ECONOMIC IMPACT OF COVID-19 ON STRUCTURAL ENGINEERS
John Cross, P.E., LEED APCrosswind Consulting LLC
ModeratorBill Bast, P.E., S.E.
Thornton Tomasetti
Kevin ArtlAmerican Council of
Engineering Companies

Perspective
Andrew Opdyke, CFAEconomist
This report was prepared by First Trust Advisors L.P., and reflects the current opinion of the authors. It is based upon sources and data believed to be accurate and reliable. Opinions and forward looking statements expressed are subject to change withoutnotice. This information does not constitute a solicitation or an offer to buy or sell any security. The information presented is not intended to constitute an investment recommendation for, or advice to, any specific person. By providing this information, FirstTrust is not undertaking to give advice in any fiduciary capacity within the meaning of ERISA, the Internal Revenue Code or any other regulatory framework. Financial advisors are responsible for evaluating investment risks independently and for exercisingindependent judgment in determining whether investments are appropriate for their clients.

Source: Bureau of Economic Analysis. Quarterly data Q1 1948 – Q1 2020. Q2 2020 First Trust Forecast
-40%
-30%
-20%
-10%
0%
10%
20%
1948 1956 1964 1972 1980 1988 1996 2004 2012 2020
annualized percent change, real GDP

Source: Bureau of Labor Statistics. Monthly data Jan 2000 – May 2020.
125
130
135
140
145
150
155
2000 2002 2004 2006 2008 2010 2012 2014 2016 2018 2020
employees on nonfarm payrolls, millions
Jan '08 - Feb '10:-8.7 Million
Mar '20 - Apr '20:-20.7 Million
Feb '10 - Feb '20:+22.8 Million
May '20:+2.5 Million

Source: Bureau of Labor Statistics. Monthly data Jan 2000 – May 2020.
50
60
70
80
90
100
110
120
130
140
2005 2007 2009 2011 2013 2015 2017 2019
Residential ConstructionNonresidential ConstructionResidential Trade ContractorsNonresidential Trade ContractorsHeavy & Civil Engineering Construction
index, January 2005 = 100

Housing Starts
Source: Census Bureau. Monthly data Jan 2005 – Apr 2020
0
500
1000
1500
2000
2500
2005 2007 2009 2011 2013 2015 2017 2019
thousands, seasonally adjusted annual rate
"normal" = 1.500 million

Retail Sales
0
20
40
60
80
100
2005 2007 2009 2011 2013 2015 2017 2019
General Merchandise Stores
Nonstore Retailers
billions
Source: Census Bureau. Monthly data Jan 2005 – Apr 2020

The App Economy
Source: Bureau of Economic Analysis. Quarterly data Q1 1960 – Q1 2020
0.0%
2.0%
4.0%
6.0%
8.0%
10.0%
0.0%
2.0%
4.0%
6.0%
8.0%
10.0%
1960 1970 1980 1990 2000 2010 2020
Structures
Software
percent of real GDP percent of real GDP

Source: The COVID Tracking Project. Daily data 03/04/20 - 06/07/20
0%
5%
10%
15%
20%
25%
30%
35%
40%
45%
50%
0
100,000
200,000
300,000
400,000
500,000
600,000
3/4 3/11 3/18 3/25 4/1 4/8 4/15 4/22 4/29 5/6 5/13 5/20 5/27 6/3
daily new tests positive tests % of daily new tests
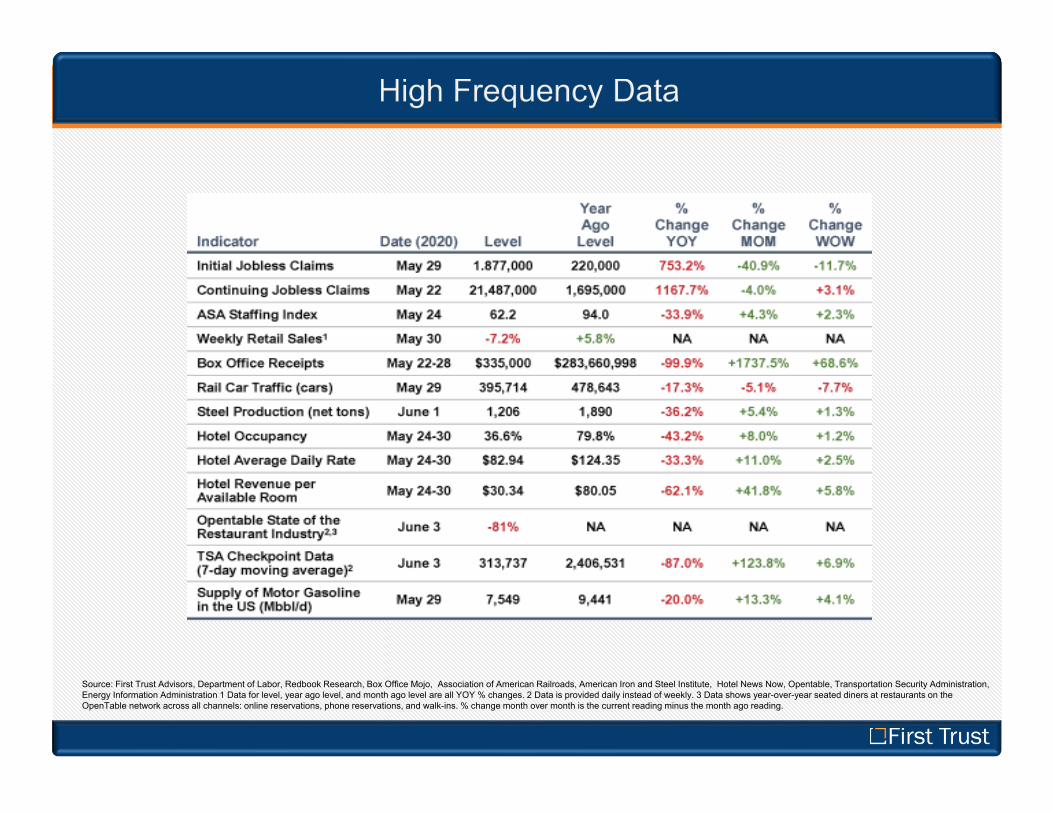
Source: First Trust Advisors, Department of Labor, Redbook Research, Box Office Mojo, Association of American Railroads, American Iron and Steel Institute, Hotel News Now, Opentable, Transportation Security Administration, Energy Information Administration 1 Data for level, year ago level, and month ago level are all YOY % changes. 2 Data is provided daily instead of weekly. 3 Data shows year-over-year seated diners at restaurants on the OpenTable network across all channels: online reservations, phone reservations, and walk-ins. % change month over month is the current reading minus the month ago reading.

Crosswind Consulting LLC
The Design & Construction Market in an Interrupted World
John Cross, PE, LEED APCrosswind Consulting LLC

Crosswind Consulting LLC
“That men do not learn much from the lessons of history is the most important of all the lessons of history.”
Aldous Huxley

Crosswind Consulting LLC

Crosswind Consulting LLC
Design Lag Starts Lag P-I-P Lag
FROM START OF ECONOMIC DOWNTURN
FROM START OF ECONOMIC UPTURNDesign Lag Starts Lag P-I-P Lag
1 QTR 2-3 QTRS 4-6 QTRS
3-4 QTRS 4-6 QTRS 5-7 QTRS

Crosswind Consulting LLC
EXPANSION OVER SUPPLY
RECESSIONRECOVERY
2008
2019
2020
Rent Occupancy
Rent Occupancy
Rent Occupancy
Rent Occupancy
Design
Construction

Crosswind Consulting LLC
EMPLOYMENT TO PRE-RECESSION LEVEL
2021Q26q
2023Q113q
2028Q234q
2008Q1 2014Q124q

Crosswind Consulting LLC
GDP RETURNING TO PRE-RECESSION LEVEL
2023Q113q
2021Q14q
2021Q36q
2007Q3 2011Q215q

Crosswind Consulting LLC
MEANINGLESS SPECULATION
Optimistic
Middling
Pessimistic
Dow
ntur
nRe
cove
ryDe
sign
Star
ts
Construction Put-in-Place

Crosswind Consulting LLC
ARCHITECTS BILLING INDEX (ABI)

Crosswind Consulting LLC
DODGE MOMENTUM INDEX

Crosswind Consulting LLC
WHO LEADS?1. Historically - residential2. Great Recession
a. Industrialb. Limited help from infrastructure stimulus
i. Too narrow of a focusc. Renovation and Rehabilitation
3. 2020?a. Probably not industrial – oil price impactb. Maybe single family – if flight to suburbsc. High Tech (Data Centers & chip manufacturing)d. Renovation and Rehabilitatione. Warehouses
Crosswind Consulting LLC
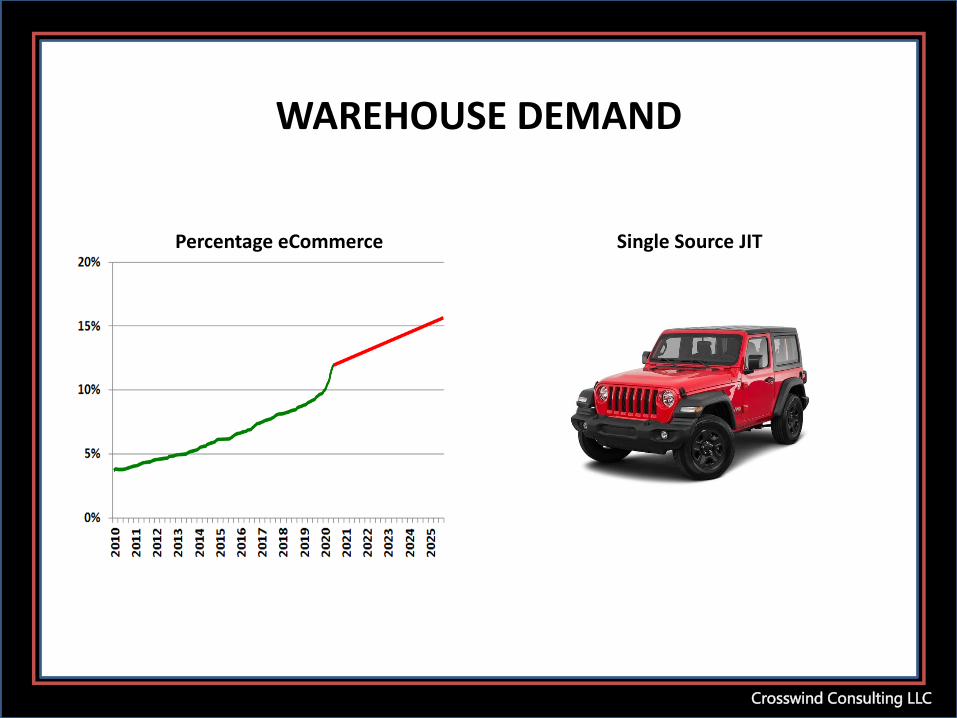
WAREHOUSE DEMAND
Percentage eCommerce Single Source JIT

Crosswind Consulting LLC
IMPACT & RECOVERY

Crosswind Consulting LLC
WHAT ABOUT ME AND MY FIRM?
Crosswind Consulting LLC
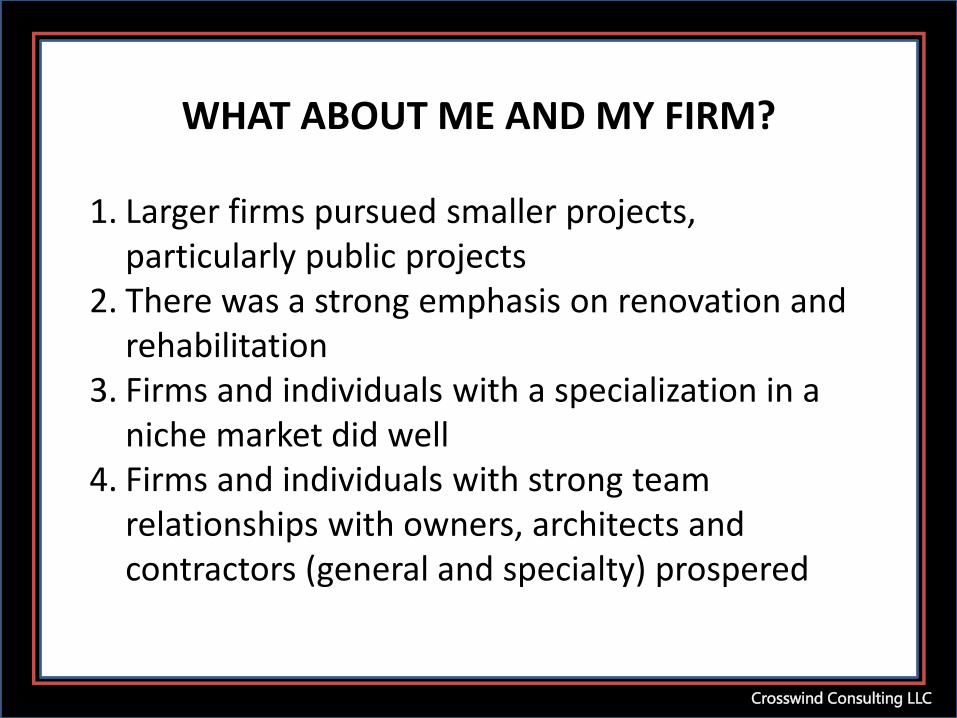
WHAT ABOUT ME AND MY FIRM?
1. Larger firms pursued smaller projects, particularly public projects
2. There was a strong emphasis on renovation and rehabilitation
3. Firms and individuals with a specialization in a niche market did well
4. Firms and individuals with strong team relationships with owners, architects and contractors (general and specialty) prospered

Crosswind Consulting LLC
Monthly columns are available at: www.peddinghaus.com

National Council of Structural Engineers Associations & the Structural Engineers Association of Illinois
Economic Impact of COVID-19 on Structural Engineers
Kevin ArtlPresident and CEO
American Council of Engineering Companies of Illinois

NATIONALTRAVEL
Highway Trust Fund Receipts
May 2019 $3.238 billion
May 2020 $ 674 million
Federal Highway Miles Traveled
April 2019 169 million miles
April 2020 57 million miles
79% Decline
40% Decline
Region Total Travel
Percentage Change
North-East 20.2 -46.7South-Atlantic
36.3 -41.2
North-Central
38.5 -38.2
South-Gulf 36.3 -35.9West 38.3 -39.3

STATE DOTS
• Stay-at-home orders are being followed—significant traffic declines.
• Forecasting a 30% decline in transportation revenue over the next 18 months.
• Significant projects across the nation being postponed and delayed.
• North Carolina DOT postponed 100 projects valued at over $2.2 billion. Ohio, Missouri and others postponing projects as well.
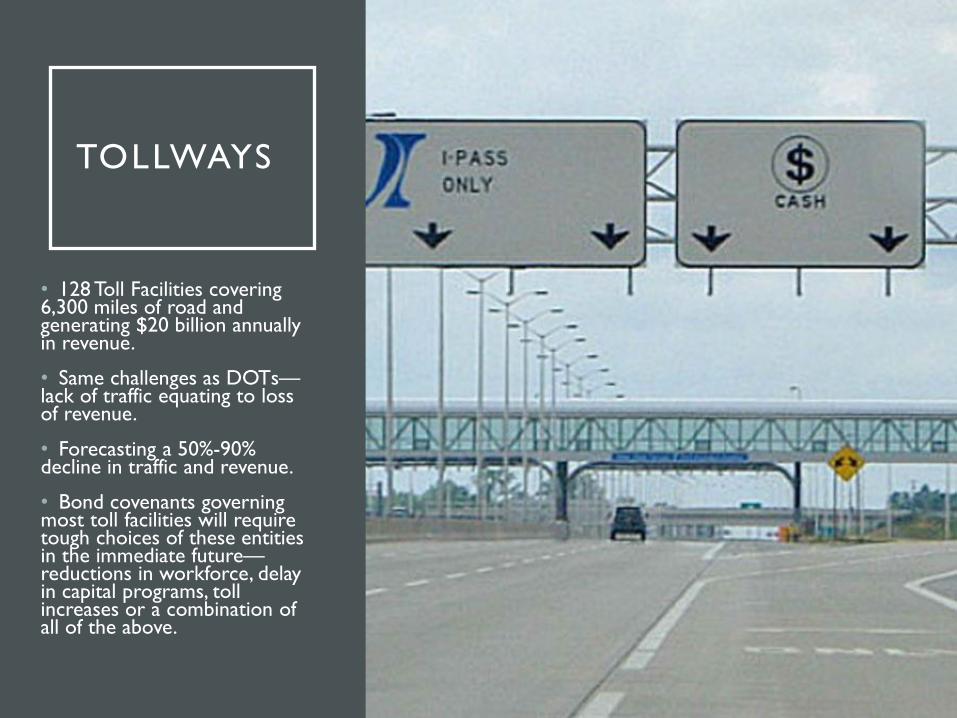
TOLLWAYS
• 128 Toll Facilities covering 6,300 miles of road and generating $20 billion annually in revenue.
• Same challenges as DOTs—lack of traffic equating to loss of revenue.
• Forecasting a 50%-90% decline in traffic and revenue.
• Bond covenants governing most toll facilities will require tough choices of these entities in the immediate future—reductions in workforce, delay in capital programs, toll increases or a combination of all of the above.

COUNTIES &CITIES
• Counties anticipate a $144 billion impact through 2021.
• Cities estimate a $360 billion impact through 2022.
• Key revenue generators, like sales tax, fees, income tax, gaming are all at risk.
• Cities and Counties are reallocating spending for health and human services—postponing, delaying or cancelling capital projects.

MASS TRANSIT
• New York Subway ridership down 75%
• San Francisco BART ridership down 94%.
• Illinois Metra ridership down 97%
• Nationally-public transit ridership is down 75%.
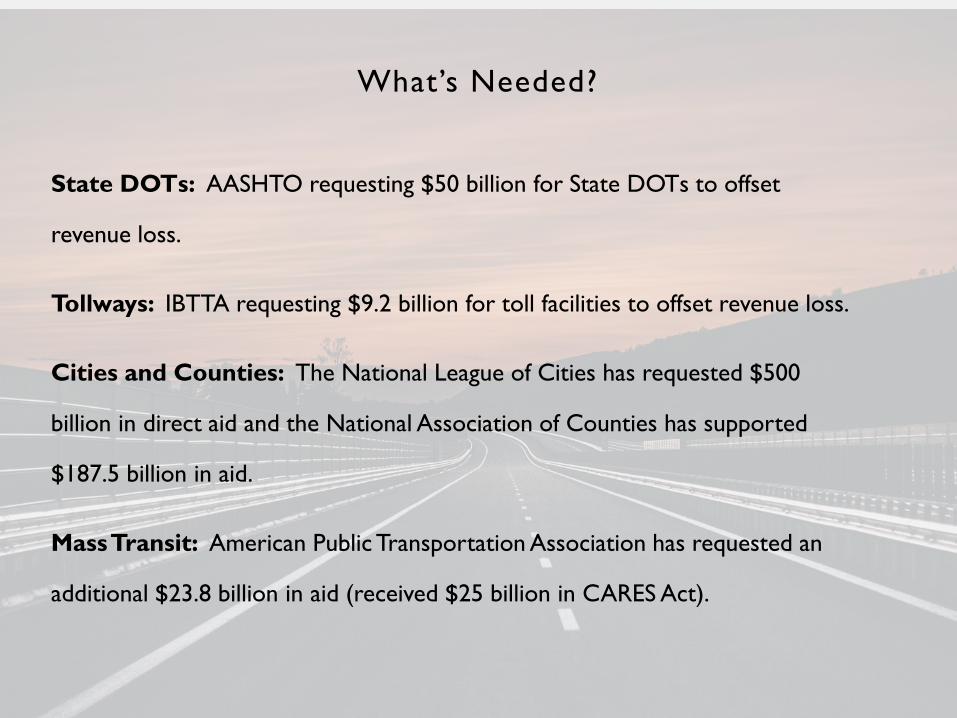
What’s Needed?
State DOTs: AASHTO requesting $50 billion for State DOTs to offset
revenue loss.
Tollways: IBTTA requesting $9.2 billion for toll facilities to offset revenue loss.
Cities and Counties: The National League of Cities has requested $500
billion in direct aid and the National Association of Counties has supported
$187.5 billion in aid.
Mass Transit: American Public Transportation Association has requested an
additional $23.8 billion in aid (received $25 billion in CARES Act).

H.R. 6800( P A S S E D H O U S E )
• State Aid: $500 billion
• State DOTs: $15 billion
• Local Government: $375 billion
• FAA: $75 billion
• Mass Transit: $15.75 Billion
What’s Coming?

SURFACE TRANSPORTATION REAUTHORIZATION
$319 billion Federal-Aid Highway Program
$105 billion for Transit
$60 billion for Rail Programs
$5.3 billion for Highway Safety
A 5-Year, $494 Billion Program
What’s Coming?

THANK YOU

Andrew OpdykeCFA
First Trust Economics
Q & A
John Cross P.E., LEED AP
Crosswind Consulting LLC
ModeratorBill BastP.E., S.E.
Thornton Tomasetti
Kevin ArtlAmerican Council of
Engineering Companies

THANK YOU FOR JOINING US
This webinar has been recorded and will be distributed after processing.
If you have any additional questions, please reach out to us at [email protected].