economic impact and travel patterns of · pdf fileservice contract si2.acproce052481700...
TRANSCRIPT

© GfK Belgium 2014 | 6 June 2014 1
ECONOMIC IMPACT AND TRAVEL PATTERNS OF ACCESSIBLE TOURISM IN EUROPE Presentation of the key study findings Service Contract SI2.ACPROCE052481700 – European Commission, DG Enterprise and Industry

© GfK Belgium 2014 | 6 June 2014 2
Objectives and methodology

© GfK Belgium 2014 | 6 June 2014 3
Methodology - Overview • Task 1a – Cluster analysis and current
demand • Task 1b - Forecasting
Task 1: Current and future demand for
Accessible Tourism in Europe and beyond
• Task 2a – Website and brochure analysis • Task 2b - Online survey and senior focus
groups
Task 2: Travel patterns and behaviour of people
with access needs
• Task 3a – Case-studies • Task 3b – Desk research on barriers
Task 3: Tourist experience across
different tourism sectors
• Task 4a – Stakeholder consultation • Task 4b – Scenarios and impact
assessment
Task 4: Current and future economic contribution of
Accessible Tourism
Task 5: Recommendations and success factors

© GfK Belgium 2014 | 6 June 2014 4
Task 1 – Demographic profiling of tourists with special access needs
© GfK Belgium 2014 | 6 June 2014 5
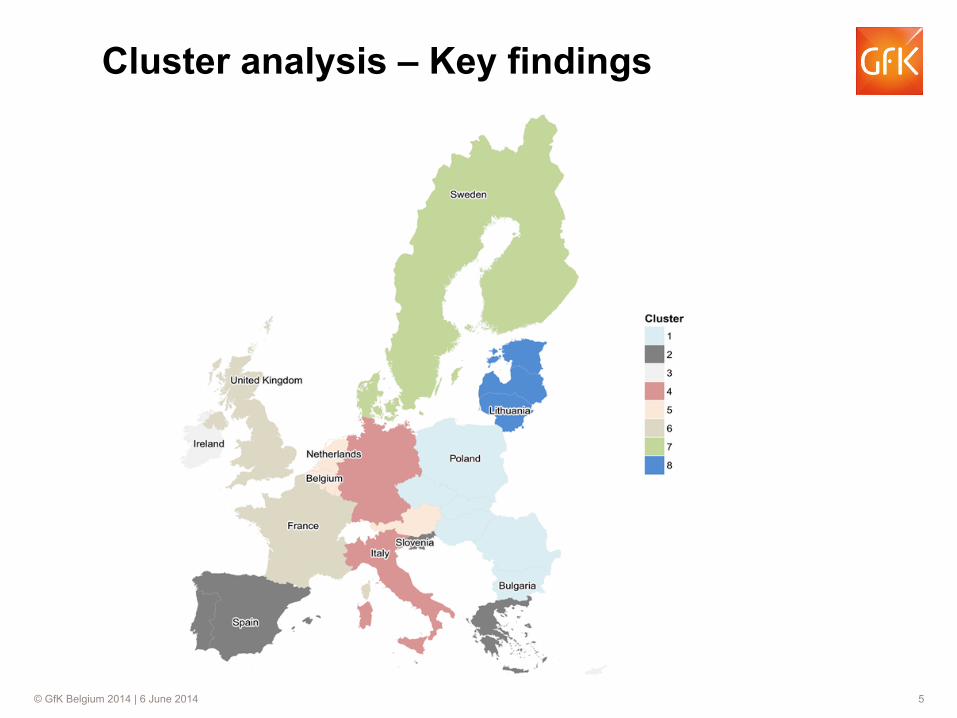
Cluster analysis – Key findings

© GfK Belgium 2014 | 6 June 2014 6
Current demand and forecasting – Key findings
1. As of 2011, there were 138.6 million people with access needs in
the EU, of which 35.9% were people with disabilities aged 15-64, and
64.1% were the elderly population aged 65 or above.
2. Among the EU27 countries, UK, France, Germany, Italy and
Spain are countries with the largest population of people with
access needs, all above 10 million.
3. In 2012, people with access needs in the EU took
approximately 783 million trips within the EU, and the demand
is anticipated to grow to about 862 million trips per year by
2020, equivalent to an average growth rate of 1.2% annually.

© GfK Belgium 2014 | 6 June 2014 7
Current and future demand for EU’s accessible tourism by EU27 countries from 2012-2020
339,558 339,770 340,062 340,439 340,901 341,440 342,029 342,632 343,222
443,209 452,073 461,307 470,759 480,314 489,897 499,467 509,029 518,647
782,768
791,843
801,369
811,197
821,215
831,337
841,496
851,662
861,869
0
100,000
200,000
300,000
400,000
500,000
600,000
700,000
800,000
900,000
1,000,000
2012 2013 2014 2015 2016 2017 2018 2019 2020
Demand by People with Disabilities Demand by The Elderly People Demand by People with Access Needs
Current and future demand for EU’s accessible tourism by EU27 countries (2012-2020)
Current demand and forecasting– Key findings

© GfK Belgium 2014 | 6 June 2014 8
Current demand and forecasting– Key findings
Group People with Disabilities The Elderly population
Travel Type Day Trips Overnight Trips Day Trips Overnight
Trips Travel Propensity 51.8% 58.1% 36.4% 47.5% Travel Frequency 6.7 6.7 6.9 5.5 Of these, spent in Domestic (%) 87.1% 60.1% 87.3% 70.0% EU (%) 10.4% 27.4% 12.1% 22.8% International (%) 2.5% 12.5% 0.5% 7.2%
4. In 2012 more than half of the individuals with disabilities in the
EU travelled; a slightly smaller proportion of the elderly people
travelled during the same period.
Travel behaviour of people with access needs: EU27 averages, 2012
5. The majority of the trips, either day or overnight trips, took place
within the EU, particularly in home country.

© GfK Belgium 2014 | 6 June 2014 9
Task 2 – Behavioural profiling of tourist with special access needs

© GfK Belgium 2014 | 6 June 2014 10
Website analysis - Key findings
Good practice - Visit England website • Focus on marketing and travel
recommendations • Information on accessibility fully
integrated in the main website • Inclusive communication without
discrimination
70 % of all 66 surveyed websites provide information on accessible offers.
Destination, railway companies and airline websites fare better than tour operators and hotel chains.
61% of the surveyed websites do not have basic accessibility features (e.g. contrast, text alternative to images, no frames…) Accessible features are almost never used to promote a destination.

© GfK Belgium 2014 | 6 June 2014 11
2 of 12 tourism boards do not send printed brochures anymore
None of the 12 tourism board provided special interest brochures for people with access needs although in 4 cases information for people with access needs is given in the main brochure
In terms of the accessibility of the brochures themselves:
• The brochures were mostly well laid out and dazzle-free
• The contrast between text and background was sufficient in most cases
• But the font size was too small in most brochures analysed
Brochure analysis – Key findings
11

© GfK Belgium 2014 | 6 June 2014 12
Online survey and focus groups – Travel behavioural patterns
Overall, people with access needs share many behavioural patterns with other travellers. They tend to use standard infrastructures, with minorities selecting answers specific to this group.
However, people with access needs have specific behavioural patterns when preparing a trip: • Many use specialised information sources or book through an
institution or group. • A majority checks accessibility conditions and/or available help before travelling.
• Large majorities find information about accessibility at destination sufficient, reliable and accessible, although this is an issue for a minority.
• The focus groups show evidence of advance planning aiming at preventing issues and fulfilling specific needs.

© GfK Belgium 2014 | 6 June 2014 13
Online survey and focus groups – Barriers People with access needs experience obstacles of different kinds when travelling but may not always perceive them as barriers.
The availability of medical help and health treatments get low satisfaction scores and are mentioned fairly frequently as barriers.
Among accessibility-related aspects, the availability of information about accessible services and accessible
locations are also mentioned as barriers. There is evidence of issues with the price of accessibility, with
some people saying they had to pay more than the standard price or had to switch to a more expensive product or service at least
sometimes for them to be accessible. Many people do not perceive barriers as such or have developed strategies to avoid experiencing barriers,
including advance planning. People with access needs are not a uniform group and their attitudes and behaviour vary across countries, types of access
needs and types of limitation.

© GfK Belgium 2014 | 6 June 2014 14
Online survey and focus groups – Improvements to accessibility and behavioural changes Improvements to accessibility may lead to behavioural changes among sizeable proportions of people with access needs
Improvements to accessibility
• Seniors and people with limitations most
often mention medical help and menus for special dietary needs.
• These items are also mentioned often by people who travel with children, together with equipment and activities for children.
• In terms of building accessibility, the aspects seen as most important by all three groups are accessible toilets, accessible parking spaces and the ease of use of lifts.
Possible behavioural changes
• Sizeable minorities
would consider increasing their travel budget or travelling more often
• Over 80% say they are likely to return to a destination when they are satisfied with accessibility

© GfK Belgium 2014 | 6 June 2014 15
Task 3 – Evaluation of the tourist experience across different tourism sectors

© GfK Belgium 2014 | 6 June 2014 16
Case studies
Case studies
City of Erfurt Accessible Poland Tours Chateau des Ducs de Bretagne St. Martin Wine Cellar Berlin
Barcelona Metro Scandic Hotels GVAM Mobile Guides for All Restaurant Monnalisa Restaurant Girasoli

© GfK Belgium 2014 | 6 June 2014 17
1. Although social responsibility is a motivation, it can be
combined with a focus on business. In mainstream tourism
services investment in accessibility results in increased client
numbers. The return on investment correlates with a correct
management of the 7 Success Factors
2. Destinations that take care of accessibility are usually focused
on service quality in general. Some destinations succeed in
including accessibility, comfort and services in their branding.
The communication style for accessible facilities is always
positive and avoids “charity or social service” style language.
Case-studies – Key findings
17

© GfK Belgium 2014 | 6 June 2014 18
3. Successful accessible destinations show some kind of
cooperation among service providers or accessible
services are guaranteed along the tourism chain. The
commitment of the decision makers and training of the
staff are key aspects.
4. The importance of investment varies largely depending on
the type of services provided and whether the accessibility
improvements have been included since inception, have
been planned or have been made in response to demand. To
plan the actions and anticipate the results before starting is
also a key element of success.
Case-studies – Key findings
18

© GfK Belgium 2014 | 6 June 2014 19
• At the pre-travel stage: The lack or limited availability of information about accessible services represents the biggest barrier.
• At the transit/ transport stage: airlines cause the most difficulties particularly with regard to the lack of toilets.
• At a destination, people with access needs encounter different levels of frequency of barriers across key tourism sectors. • Barriers in the transport sector at the destination are faced more
often compared to other sectors. • For people with sensory, communication and hidden limitations,
barriers in the food and beverage sector are encountered significantly more often than in the accommodation sector.
• Nature based activities are associated with the most important barriers at 10 out of 15 destinations.
• The lack of accessible toilets represents an important barrier across all sectors.
• Overall, attitudinal barriers are encountered more often than physical access barriers
Barriers encountered during travel – Key findings

© GfK Belgium 2014 | 6 June 2014 20
Task 4 - Estimate of the current and future economic contribution of accessible tourism

© GfK Belgium 2014 | 6 June 2014 21
1. Accessible tourism is considered a business opportunity but there is a lack of coordination, particularly between the public and private sector.
2. Accessibility is mainly understood as a feature for disabled guests and almost never understood as a plus in comfort and service. Therefore product development and marketing mainly targets disabled people and accessibility is not used in marketing and advertising.
3. For the tourism business, political and financial support, awareness raising and engagement of service providers are important drivers.
4. For the guest, reliable information on accessible offers and services is a key factor for success.
Stakeholder consultation – Key findings
21

© GfK Belgium 2014 | 6 June 2014 22 22
Economic impact assessment – Key findings

© GfK Belgium 2014 | 6 June 2014 23
Economic impact assessment – Key findings
Current gross turnover contribution in 2012 (€ million)
1. The direct gross turnover of EU’s Accessible Tourism in 2012 was about €352 billion; after taking the multiplier effect into account, the total gross turnover contribution amounted to about €786 billion.

© GfK Belgium 2014 | 6 June 2014 24
Current gross value added contribution in 2012 (€ million)
2. The direct gross value added of EU’s Accessible Tourism in 2012 was about €150 billion; after taking the multiplier effect into account, the total gross value added contribution amounted to about €356 billion. .
Economic impact assessment – Key findings

© GfK Belgium 2014 | 6 June 2014 25
Current employment contribution in 2012 (‘000 persons)
3. The direct employment contribution of EU’s Accessible Tourism in 2012 was about 4.2 million persons; after taking the multiplier effect into account, the total employment generated was about 8.7 million persons.
Economic impact assessment – Key findings

© GfK Belgium 2014 | 6 June 2014 26
Scenario analysis
Scenario A: At the destination some buildings and types of transport are made accessible, but not all of them. The services provided by some of the hotels, restaurants and museums have been adapted for special needs, but no other services – like wheelchairs – are available. The staff know very little about special needs and cannot help much. Information about accessibility is difficult to find and not reliable. Scenario B: At the destination most buildings and types of transport are made accessible. The services provided by most of the hotels, restaurants and museums are adapted for special needs, and some services – like wheelchairs, visual or hearing aids – are available. The staff have basic knowledge of special needs and can help a little. Information on accessibility and services is available when requested and is reliable. Scenario C: At the destination almost all buildings and types of transport are made accessible. The services provided by almost all of the hotels, restaurants and museums are adapted for special needs, and many services – like wheelchairs, visual or hearing aids, medical services, dedicated personal assistants etc. – are available. The staff have good knowledge of special needs and can help a lot. Information on accessibility is easy to find, reliable and indicates if a location may be difficult to access.

© GfK Belgium 2014 | 6 June 2014 27
1. With improvements of accessibility, current tourism demand in 2012 could potentially increase against the current level by 24.2%, 33.2% and 43.6% under Scenarios A, B and C, respectively.
782,768 791,843 801,369 811,197 821,215 831,337 841,496 851,662 861,869
189,111 190,952 192,910 194,950 197,042 199,159 201,272 203,361 205,42871,116 71,595 72,108 72,645 73,199 73,765 74,334 74,899 75,46081,247 82,014 82,830 83,683 84,560 85,449 86,338 87,219 88,091
0
200,000
400,000
600,000
800,000
1,000,000
1,200,000
1,400,000
2012 2013 2014 2015 2016 2017 2018 2019 2020
Baseline Additional Demand under Scenario AAdditional Demand under Scenario B Additional Demand under Scenario C
Potential Demand for EU’s Accessible Tourism by people with access needs in the EU27 countries (‘000 trips)
Scenario analysis – Key findings

© GfK Belgium 2014 | 6 June 2014 28
Scenario Scenario A Scenario B Scenario C
Group People with disabilities
The elderly population
People with disabilities
The elderly population
People with disabilities
The elderly population
Direct economic contribution (gross turnover, € million)
176,668 239,277 191,878 247,192 209,461 270,505
of which, generated by
Existing travellers 85.7% 85.3% 79.9% 82.8% 77.4% 78.2% New travellers 14.3% 14.7% 20.1% 17.2% 22.6% 21.8%
Distribution of direct economic contribution under different scenarios between existing travellers and new travellers
2. If accessibility is improved, the total economic contribution generated by the EU tourists is expected to increase against the current contribution by roughly 18%, 25% and 36% under Scenarios A, B and C, respectively.
3. The existing travellers would be the major driving forces of Accessible Tourism under all three scenarios, although the share of contributions by the new travellers gets higher and higher with improvements of accessibility.
Scenario analysis – Key findings
© GfK Belgium 2014 | 6 June 2014 29
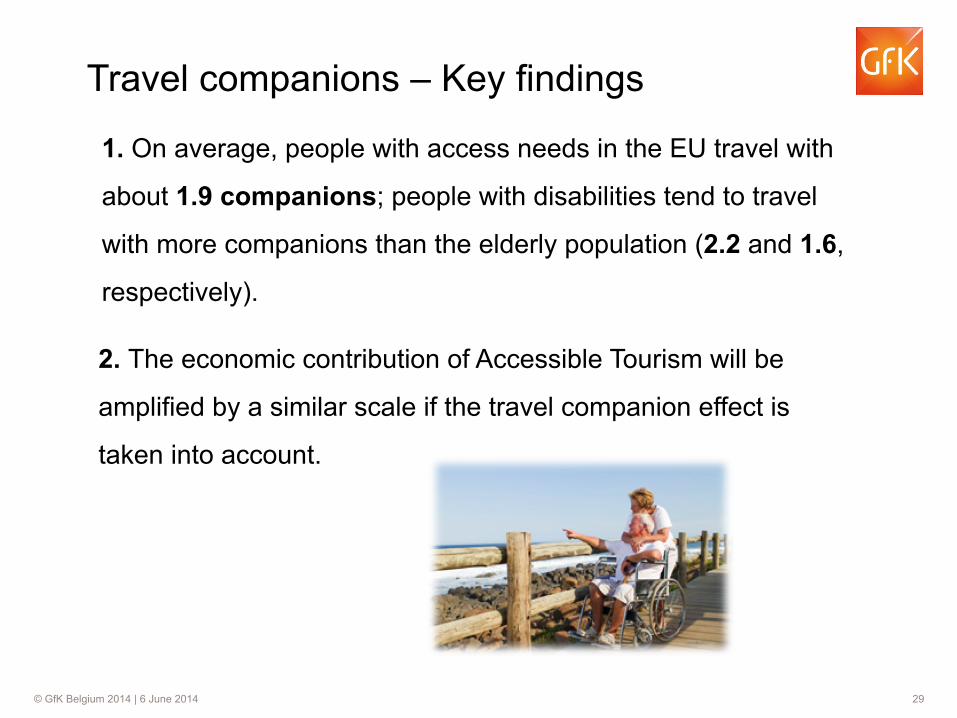
1. On average, people with access needs in the EU travel with
about 1.9 companions; people with disabilities tend to travel
with more companions than the elderly population (2.2 and 1.6,
respectively).
2. The economic contribution of Accessible Tourism will be
amplified by a similar scale if the travel companion effect is
taken into account.
Travel companions – Key findings

© GfK Belgium 2014 | 6 June 2014 30
Key findings

© GfK Belgium 2014 | 6 June 2014 31
Key findings – Task 1
Task 1a – Cluster analysis
• A cluster analysis based on travel behaviour (with 13 criteria related location, demographics, income and education) was used to group EU Member States in 8 clusters.
• 12 representative countries were selected: Belgium, Bulgaria, France, Ireland, Italy, Lithuania, the Netherlands, Poland, Slovenia, Spain, Sweden, and the United Kingdom.
Task 1b – Forecasting
• In 2012, people with access needs in the EU took approximately 783 million trips within the EU, and the demand is anticipated to grow to about 862 million trips per year by 2020.

© GfK Belgium 2014 | 6 June 2014 32
Key findings – Task 2 Task 2a –
Website and brochure analysis • Almost 70 % of all 66 surveyed websites provide information on accessible offers, but accessible features are almost never used to promote a destination.
• Special interest brochures with information for people with access needs were not always available from the tourism boards of the 12 surveyed countries.
Task 2b - Online survey and senior focus groups
• 2534 people with access needs were surveyed in total in 12 EU Member States and 4 inbound markets (Russia, China, Brazil and the US) and 2 focus groups of 12 participants each were organised in Lithuania and Ireland with people above 65.
• Overall, people with access needs share many behavioural patterns with other travellers, although they differentiate themselves in the preparation process.
• The price of accessibility, medical help, the availability of information about accessibility and the accessibility of locations itself are seen as issues by some.
• There is evidence that many people with access needs adapt to issues as they arise and do not perceive them as barriers as such.
• People with access needs are not a uniform group: results vary between people who travel with children, people aged 65 and above and people with limitations, and across countries and limitations.
• Results point towards possible behaviour changes if accessibility conditions were improved, such as an increase in travel budget or travel frequency.

© GfK Belgium 2014 | 6 June 2014 33
Key findings – Task 3
Task 3a – Case-studies
• 10 case-studies were analysed across the EU.
• In most cases accessibility is integrated as part of the quality policy.
• The closer the cooperation with other local service providers the greater the success.
• Although social responsibility is a motivation, it does not imply that the company deviates from its own business focus.
• The engagement and training of the staff is a key issue in improving results.
• Knowledge transfer flows more easily when the organisation is part of professional networks.
• Planning and anticipating the results before starting is also a key element of success.
Task 3b – Desk research on barriers
• People with access needs experience different levels of frequency of barriers across key tourism sectors. The barriers experienced in the transport stage (at the destination) are faced more often compared to other sectors
• The identification of different barriers for each tourism sector helps to remove existing obstacles for people with different access needs
• Overall, attitudinal barriers are encountered more often than physical access barriers across all sectors

© GfK Belgium 2014 | 6 June 2014 34
Key findings – Task 4 Task 4a – Stakeholder consultation
• 21 stakeholders took part in a pre-focus group and 15 in the main focus group. This consultation was completed by 11 telephone interviews.
• Accessible tourism is considered a business opportunity but there is a lack of coordination, particularly between the public and private sector.
• Accessibility is mainly understood as a feature for disabled guests and almost never as a plus in comfort and service and, therefore, not widely used in marketing and advertising.
• For the tourism business, political and financial support, awareness raising and engagement of service providers are important drivers.
• For the guest, reliable information on accessible offers and services is a key factor for success.
Task 4b – Scenarios and impact assessment
• Under scenarios of minimum, medium and extensive improvements, the tourism demand could potentially increase against the current level by 24.2%, 33.2% and 43.6%, respectively.
• The current tourism demand in 2012 generated €786 billion of gross turnover and €394 billion of GDP, equivalent to about 2.75% of the total EU27 GDP, and 8.7 million persons of employment within the EU, considering direct, indirect and induced contributions.
• The EU economy could benefit from further contribution under scenarios of minimum, medium and extensive improvements by about 18%, 25% and 36% against the current level, respectively.
© GfK Belgium 2014 | 6 June 2014 35
Recommendations and success factors

© GfK Belgium 2014 | 6 June 2014 36
Task 5: Recommendations and success factors (1)
1. Commitment of the decision-makers
• Integration in mainstream offers • Encourage service providers to
invest in accessible tourism and demonstrate its economic and social benefits
• Harmonise standards and legislation to provide better guidance for providers and clearer information for users
• Strong and on-going support from politicians, administrators and decision makers in business – including education and training as well as direct financial support
2. Coordinating and continuity • Improve the industry’s
coordination efforts, particularly through public-private partnerships and on local and regional levels
• Assign dedicated work unit or coordinator within the management structure of tourism organisations with appropriate resources
© GfK Belgium 2014 | 6 June 2014 37
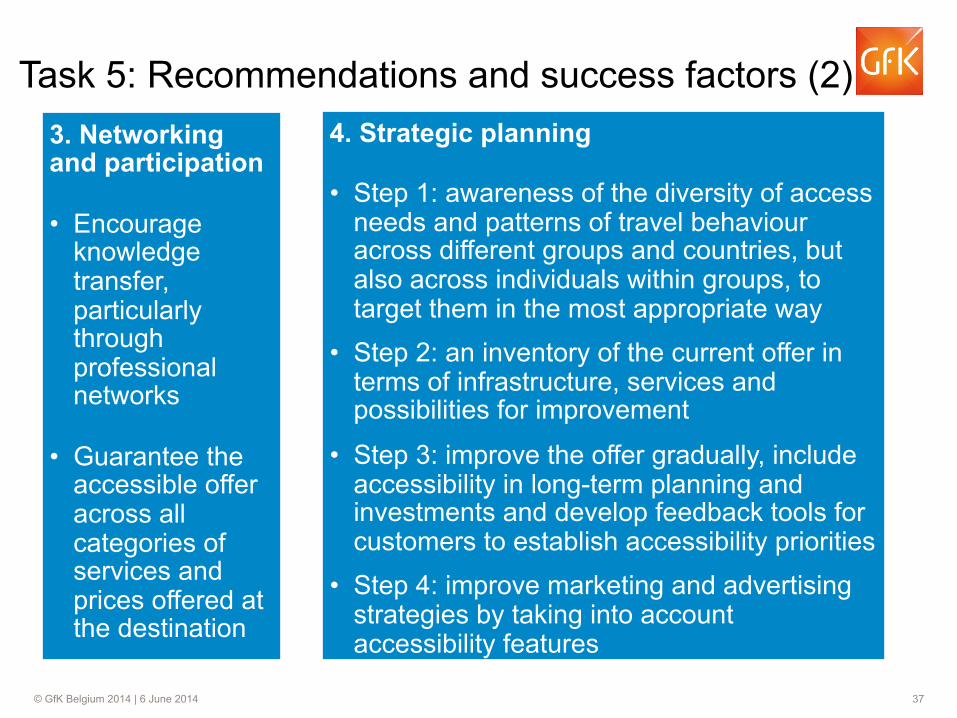
Task 5: Recommendations and success factors (2) 3. Networking and participation
• Encourage knowledge transfer, particularly through professional networks
• Guarantee the accessible offer across all categories of services and prices offered at the destination
4. Strategic planning
• Step 1: awareness of the diversity of access needs and patterns of travel behaviour across different groups and countries, but also across individuals within groups, to target them in the most appropriate way
• Step 2: an inventory of the current offer in terms of infrastructure, services and possibilities for improvement
• Step 3: improve the offer gradually, include accessibility in long-term planning and investments and develop feedback tools for customers to establish accessibility priorities
• Step 4: improve marketing and advertising strategies by taking into account accessibility features

© GfK Belgium 2014 | 6 June 2014 38
Task 5: Recommendations and success factors (3)
5. Knowledge management and qualification • Staff with a solid knowledge
base on accessibility through good knowledge management
• Regular training of staff and management
6. Optimisation of resources • Using as many resources as
possible for a strategic development of accessible tourism
• Prioritising tasks along the service chain
7. Communication and marketing • Include sufficient accessibility information
in mainstream tourism information
• Take personal information and recommendations into account in marketing strategies (e.g. through social media)

© GfK Belgium 2014 | 6 June 2014 39
THANK YOU FOR YOUR ATTENTION
GfK Belgium, Arnould Nobelstraat 42, 3000 Leuven, Belgium