inflation and income inequality in developed economies...inflation and income inequality. low...
TRANSCRIPT
Inflation and Income Inequality in Developed Economies
Pierre Monnin May 2014
CEP Working Paper 2014/1
ABOUT THE AUTHOR
Pierre Monnin is a fellow with the Council on Economic Policies (CEP) where he is
focusing on the distributive effects of monetary policy. Prior to that he has been with
the Swiss National Bank (SNB) in various roles for a total of ten years — counseling SNB’s
Board Members on issues concerning financial markets and monetary policy as well as
developing measures of financial stability and integrating them into the bank’s monetary
policy framework. He also worked at Man Investments as a Quantitative Analyst,
developing asset allocation strategies for alternative investments. Dr. Monnin holds a
PhD in Economics from the University of Zurich, a MSc in Economics from Queen Mary,
University of London, as well as a MSc in Statistics and a BA in Economics from the
University of Neuchatel.
The CEP Working Paper Series is published by the Council on Economic Policies (CEP) —
an international economic policy think for sustainability focused on fiscal, monetary,
and trade policy. Publications in this series are subject to a prepublication peer review
to ensure analytical quality. The views expressed in the papers are those of the
authors and do not necessarily represent those of CEP or its board. Working papers
describe research in progress by the authors and are published to elicit comments and
further debate. For additional information about this series or to submit a paper please
contact Council on Economic Policies, Seefeldstrasse 60, 8008 Zurich, Switzerland,
Phone: +41 44 252 3300, www.cepweb.org [email protected]
ABSTRACT
This paper explores the empirical link between income inequality and inflation in ten
OECD countries over the period 1971 to 2010. In addition to inflation, we include six
control variables in our analysis: economic development level, business cycles,
unemployment, unionization, openness to international trade and skill-biased
technological change. We estimate the empirical link between all seven variables and
income inequality with a balanced panel. We find a U-shaped link between long-run
inflation and income inequality. Low inflation rates are associated with higher income
inequality. As inflation goes up, inequality decreases, reaches a minimum with an
inflation rate of about 13%, and then starts rising again. The precise mechanisms that
lead more inflation to correlate with a decrease in income inequality until a certain
threshold are unclear yet, and warrant further research.
TABLE OF CONTENTS
1 Introduction ........................................................................................ 1
1.1 Methodology overview ...................................................................... 2
1.2 Summary of results.......................................................................... 2
1.3 Structure of the paper ...................................................................... 3
2 Drivers of inequality — literature review ...................................................... 4
2.1 Inflation ...................................................................................... 4
2.2 Economic development level .............................................................. 6
2.3 Business cycles............................................................................... 6
2.4 Unemployment .............................................................................. 6
2.5 Unionization.................................................................................. 7
2.6 Openness to international trade .......................................................... 7
2.7 Skill-biased technological change ......................................................... 8
3 Data ............................................................................................... 10
3.1 Description ................................................................................. 10
3.2 Stationarity tests .......................................................................... 11
4 Methodology ..................................................................................... 12
5 Empirical results ................................................................................ 13
5.1 Panel analysis .............................................................................. 13
5.2 Quantifying the empirical impact of each country ................................... 15
5.3 Coefficients stability ...................................................................... 15
6 Conclusion ........................................................................................ 18
References ............................................................................................ 19
Appendix A: Charts .................................................................................. 23
1
1 INTRODUCTION
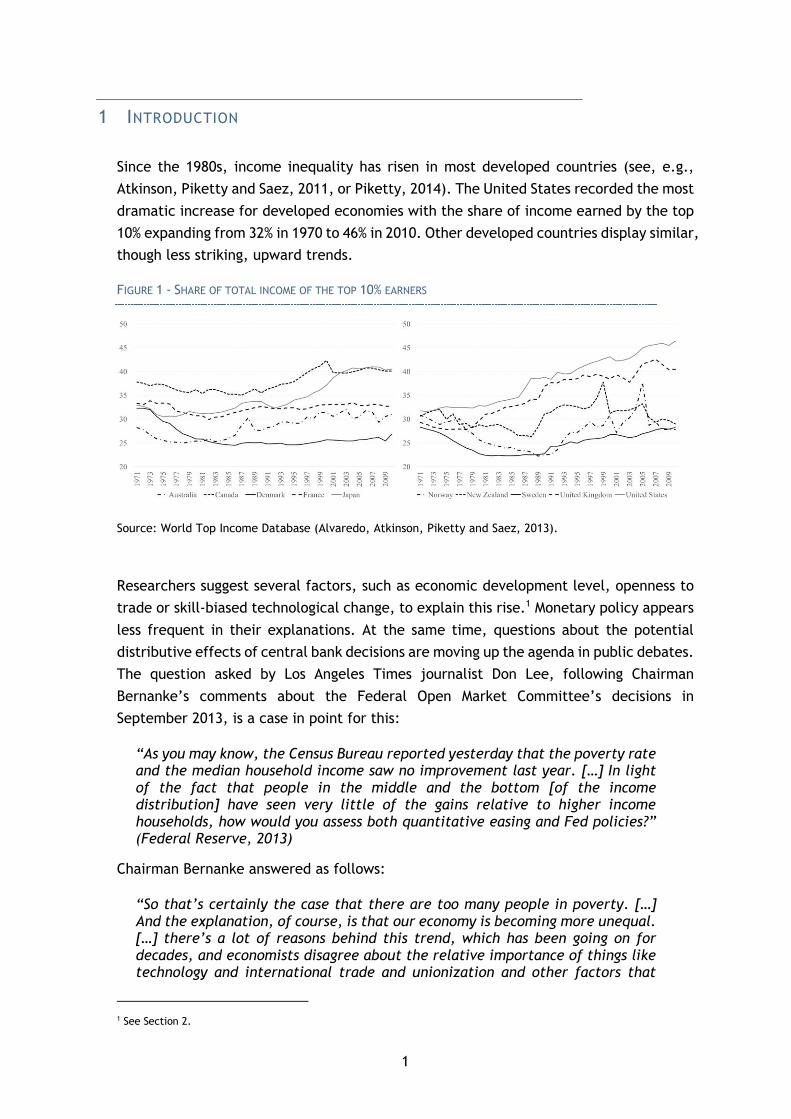
Since the 1980s, income inequality has risen in most developed countries (see, e.g.,
Atkinson, Piketty and Saez, 2011, or Piketty, 2014). The United States recorded the most
dramatic increase for developed economies with the share of income earned by the top
10% expanding from 32% in 1970 to 46% in 2010. Other developed countries display similar,
though less striking, upward trends.
FIGURE 1 - SHARE OF TOTAL INCOME OF THE TOP 10% EARNERS
Source: World Top Income Database (Alvaredo, Atkinson, Piketty and Saez, 2013).
Researchers suggest several factors, such as economic development level, openness to
trade or skill-biased technological change, to explain this rise.1 Monetary policy appears
less frequent in their explanations. At the same time, questions about the potential
distributive effects of central bank decisions are moving up the agenda in public debates.
The question asked by Los Angeles Times journalist Don Lee, following Chairman
Bernanke’s comments about the Federal Open Market Committee’s decisions in
September 2013, is a case in point for this:
“As you may know, the Census Bureau reported yesterday that the poverty rate and the median household income saw no improvement last year. […] In light of the fact that people in the middle and the bottom [of the income distribution] have seen very little of the gains relative to higher income households, how would you assess both quantitative easing and Fed policies?” (Federal Reserve, 2013)
Chairman Bernanke answered as follows:
“So that’s certainly the case that there are too many people in poverty. […] And the explanation, of course, is that our economy is becoming more unequal. […] there’s a lot of reasons behind this trend, which has been going on for decades, and economists disagree about the relative importance of things like technology and international trade and unionization and other factors that
1 See Section 2.
2
have contributed to that. […] the Federal Reserve doesn’t really have the tools to address these long-run distributional trends.” (Federal Reserve, 2013)
This paper aims to contribute to understanding whether the factors mentioned by
Chairman Bernanke are the only ones that explain the growth in income inequality, or
whether monetary policy has distributive effects, and thus may have played a role in
this development. We focus our analysis on the impact of inflation, which central banks
usually target and partially control, to get first insights. More specifically, we explore
whether inflation affects income distribution in developed economies.
1.1 METHODOLOGY OVERVIEW
The paper explores the empirical link between income inequality, inflation and other
factors in a sample of ten OECD countries (Australia, Canada, Denmark, France, Japan,
New Zealand, Norway, Sweden, United Kingdom and the United States) over the period
1971 to 2010.2 Our measure of income inequality is the income share of the top 10%
earners in each country. Income is before taxes, which allows assessing the effects of
different factors on inequality before governments might mitigate them through
redistributive taxes. Our data accounts for labor income, capital income, and
government transfers, but excludes capital gains.
We analyze seven factors that could influence income inequality: inflation, economic
development level, business cycles, unemployment, unionization, openness to
international trade and skill-biased technological change. The last six factors are the
most widely cited in the literature to explain rising income inequality. We estimate the
empirical link between all seven variables and income inequality with a balanced panel.
1.2 SUMMARY OF RESULTS
We find a U-shaped link between long-run inflation and income inequality. Low inflation
rates are associated with higher income inequality. As inflation goes up, inequality
decreases, reaches a minimum with an inflation rate of about 13%, and then starts rising
again.
We conclude from our analysis that inflation may not be neutral for income inequality.
However, the precise mechanisms that lead more inflation to correlate with a decrease
in income inequality until a certain inflation rate threshold and to coincide with a rise
in income inequality thereafter are unclear yet. We need more research, both
theoretical and empirical, to explain our findings.
2 Wealth inequality would be another important aspect to consider to analyze the distributive impact of monetary policy. We opted to focus on income inequality in this study because the databases available on income distribution are presently more comprehensive and accurate. Similarly, we restrict our study to 10 countries over the period 1971-2010 because of data availability for income inequality measures.

3
1.3 STRUCTURE OF THE PAPER
The next section lists the economic factors, which are the most often cited as drivers of
income inequality. In particular, it reviews the research about their link to income
inequality. Section 3 explains the econometric methodology used in this paper to assess
the empirical link between inflation and income inequality. Section 4 presents the data.
Section 5 shows the results that we find with our dataset and methodology. Section 6
concludes.
4
2 DRIVERS OF INEQUALITY — LITERATURE REVIEW
In this section, we first review potential channels linking inflation with income inequality
and then turn our attention to other factors that economists frequently cite as drivers
of growing income inequality in developed economies.
2.1 INFLATION
Inflation does not affect all income sources homogeneously. Since households differ in
their sources of income, the impact of inflation on their total incomes will not be
homogeneous either. By affecting each household differently, inflation can thus modify
the income distribution. To identify the potential channels through which inflation can
potentially increase or decrease income inequality, let us first divide total income into
three categories: labor income, capital income and government transfers.
2.1.1 Labor income
Inflation can modify labor income distribution through two channels: an inflation
exposure channel and the Cantillon effect. The inflation exposure channel has its roots
in the fact that wages are linked to inflation in different degrees. A wage, which is
contractually indexed to inflation, is by definition better hedged against inflation than
a wage, which is not. Similarly, bonuses are often proportional to a firm’s stock
performance, which in turn may move with inflation thus providing a hedge.
The Cantillon effect reflects the lag between the moments when money is created, and
when this expansion translates into inflation (see e.g. Bordo, 1983). Concretely, new
money hits the agents first that are the closest to the money creation process (e.g. bank
employees) (Williamson, 2008, and Ledoit, 2011). These agents will see their income
rise and spend the additional money to buy goods and services, which in turn leads to
further spending by other economic agents and thus gradually — but only gradually — to
inflation. This lag can be a further temporary factor affecting income distribution.
2.1.2 Capital income
Capital income, i.e. the dividends and interest payments from investments, is a second
income source for households — and one that may in fact offer several possibilities to
hedge against inflation. Access to financial markets, however, is not equal between
households due to entry costs and barriers. The resulting financial market segmentation
disadvantages low-income households, and thus, their use of financial innovations to
better hedge against inflation. Cysne, Maldonado, and Klinger Monteiro (2005) or Areosa
and Areosa (2006) theoretically show that such segmentation induces a positive link
between inflation and income inequality.
5
2.1.3 Government transfers
The impact of inflation on government transfers depends on the degree of inflation
adjustment in each country’s transfer scheme. Generally, when transfers are indexed,
lower-income households benefit as they receive, on average, a larger share of their
income from transfers (e.g. unemployment benefits, food stamps).
2.1.4 Review of empirical results
With the theory referenced above not giving a clear answer whether inflation increases
or decreases income inequality, we turn to the empirical evidence — which does not
provide an uncontested answer either. Galli and van der Hoeven (2001) review pre-2000
empirical literature on the topic. They find that “the results from all these studies are
noticeably mixed — some authors find inflation to be a regressive tax, others find it to
be a progressive tax, and others find it to be unrelated to income distribution — so that
the literature seems to have generated an inflation-inequality puzzle.”
Further empirical studies add to this puzzle. On the one hand, Albanesi (2007) finds a
strong positive correlation between inflation and income inequality for 51 industrialized
and developing countries between 1966 and 1990. Erosa and Ventura (2002) identify
inflation as acting like a regressive tax in the United States.
On the other hand, Sun (2011) and Maestri and Roventini (2012) find that inflation
reduces average wealth and income inequality. Similarly, Coibion, Gorodnichenko,
Kueng, and Silvia (2012) show that a permanent increase in the inflation target 3
decreases income inequality, and Heer and Maussner (2004) find that higher inflation
marginally reduces inequality.
Galli and van der Hoeven (2001) offer a reconciliation of these contradicting results by
assuming a non-linear relation between inflation and income distribution. They show
that a rise in inflation can both reduce inequality or increase inequality, depending on
the initial inflation rate. Rising inflation is associated with a decrease in inequality for
low initial inflation rates and with an increase for high initial inflation rates. Bulir (2001)
and Auda (2010) find similar results.4 Romer and Romer (1998) find that the slope of
income distribution changes with inflation.
3 The need for further research to reflect the important distinction between inflation targets and inflation will be discussed in Section 6.
4 Bulir (2001) divides his dataset in three subgroups: low, middle and high inflation episodes. He shows that going from low to middle inflation episodes reduces inequality (but not statistically significantly) and that going from middle to high inflation episodes increases inequality (statistically significant). Auda (2010) uses the same methodology as Galli and van der Hoeven (2001), but with an extended period of observations and finds the same U-shape relationship between inflation and inequality as them.

6
2.2 ECONOMIC DEVELOPMENT LEVEL
Kuznets (1955) explains growing income inequality based on income levels. The so-called
Kuznets hypothesis states that countries shift from relative equality to inequality and
back to greater equality as they move through economic development stages. His
graphical representation of this view, the Kuznets curve, shows an inverted U-shape for
the link between GDP per capita and income inequality.
Empirical analyses contradict Kuznets’ hypothesis. A first comprehensive study by Bulir
and Gulde (1995) concludes that the Kuznets hypothesis explains only a very limited part
of the inter-country variation in income distribution. Studies that are more recent reject
Kuznets’ hypothesis more clearly. Gallup (2012) reports that “new international panel
data with the first internally consistent time series for a large number of countries show
no evidence of a Kuznets curve” as the link between economic development level and
inequality is not constant across countries. Similarly, Hossain (2013) concludes that
Kuznets’ hypothesis is not confirmed as some countries experience an increase in income
inequality along with economic development level after an estimated threshold level of
income, while other countries experience a negative relationship between inequality
and economic development level before it. Lim and Sek (2014) find a positive link
between economic development and inequality for high-income countries where the
Kuznets hypothesis would assume a negative relationship. They find no statistically
significant link for other countries.
2.3 BUSINESS CYCLES
Business cycles are another cited factor influencing income distribution. Early literature
finds that the income share of the highest income groups in the interwar U.S. economy
rose in recessions and declined in booms (Mendershausen, 1946, Kuznets and Jenks,
1953). However, research that is more recent shows that this link has weakened after
World War II (Parker, 1998, and Castaneda, Diaz-Gimenez and Rios-Rull, 1998). Recently,
Heathcote, Perri and Violante (2010) document that the earnings for the lower
percentiles of the income distribution decline very rapidly in recessions, such that
recessions are times when earnings inequality widens sharply. Finally, Maestri and
Roventini (2012) find that inequality is counter-cyclical in a set of OECD countries.
2.4 UNEMPLOYMENT
The link between unemployment and income inequality is a further factor widely studied
in the literature. The empirical results are mixed. In a first study, Castaneda, Diaz-
Gimenez and Rios-Rull (1997) find that unemployment does a poor job in accounting for
changing income shares of income groups observed across business cycles. For the United
States, Heer and Süssmuth (2003) find that unemployment does not significantly
7
correlate with Gini coefficients in a simple linear regression, but show a significant
positive link between unemployment and Gini coefficients in an error correction model.
For the same country, Parker and Vissing-Jorgensen (2010) show that the incomes of
high-income households are less sensitive to unemployment than those of low-income
households, which implies that income inequality increases with unemployment. In OECD
countries, Checchi and Garcia-Penalosa (2008) and Maestri and Roventini (2012) find that
higher unemployment rates increase inequality, measured with either personal income
ratios or Gini coefficients. Eklil (2011) challenges their results, as he does not find any
significant link between Gini coefficients and unemployment rates.
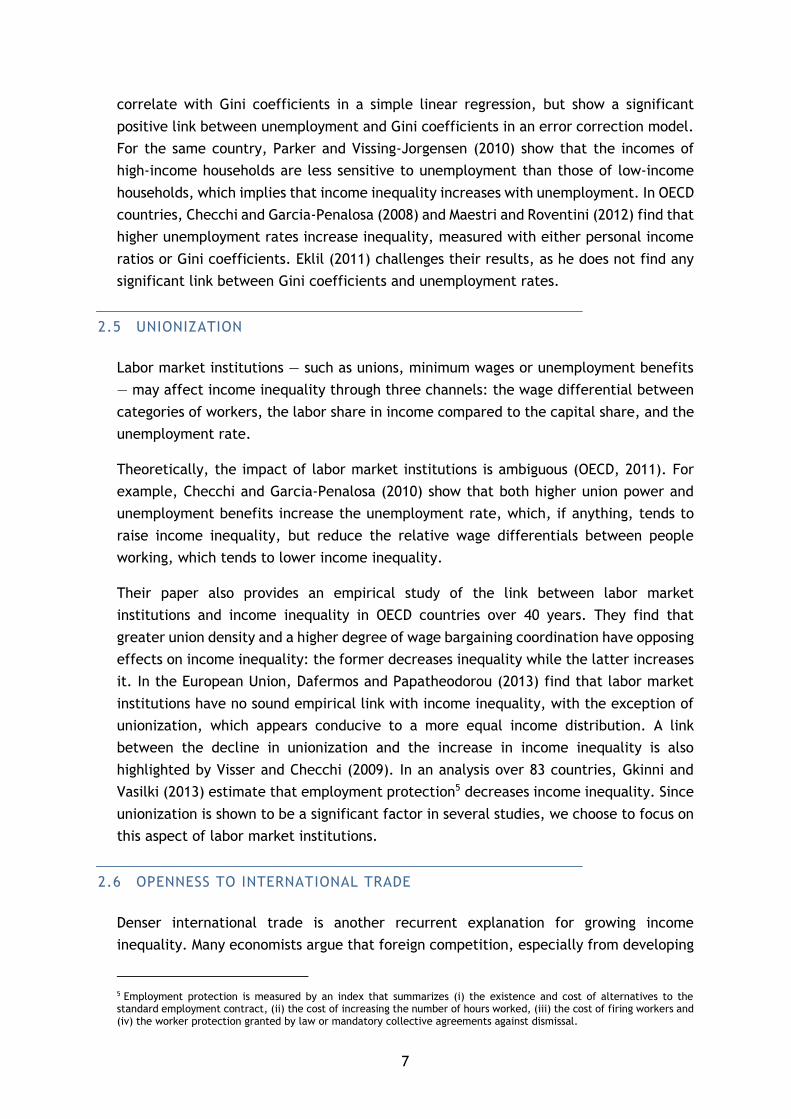
2.5 UNIONIZATION
Labor market institutions — such as unions, minimum wages or unemployment benefits
— may affect income inequality through three channels: the wage differential between
categories of workers, the labor share in income compared to the capital share, and the
unemployment rate.
Theoretically, the impact of labor market institutions is ambiguous (OECD, 2011). For
example, Checchi and Garcia-Penalosa (2010) show that both higher union power and
unemployment benefits increase the unemployment rate, which, if anything, tends to
raise income inequality, but reduce the relative wage differentials between people
working, which tends to lower income inequality.
Their paper also provides an empirical study of the link between labor market
institutions and income inequality in OECD countries over 40 years. They find that
greater union density and a higher degree of wage bargaining coordination have opposing
effects on income inequality: the former decreases inequality while the latter increases
it. In the European Union, Dafermos and Papatheodorou (2013) find that labor market
institutions have no sound empirical link with income inequality, with the exception of
unionization, which appears conducive to a more equal income distribution. A link
between the decline in unionization and the increase in income inequality is also
highlighted by Visser and Checchi (2009). In an analysis over 83 countries, Gkinni and
Vasilki (2013) estimate that employment protection5 decreases income inequality. Since
unionization is shown to be a significant factor in several studies, we choose to focus on
this aspect of labor market institutions.
2.6 OPENNESS TO INTERNATIONAL TRADE
Denser international trade is another recurrent explanation for growing income
inequality. Many economists argue that foreign competition, especially from developing
5 Employment protection is measured by an index that summarizes (i) the existence and cost of alternatives to the standard employment contract, (ii) the cost of increasing the number of hours worked, (iii) the cost of firing workers and (iv) the worker protection granted by law or mandatory collective agreements against dismissal.
8
countries, depresses developed economies wages for low skilled labor and worsens
income distribution accordingly.
Empirical evidence on this link between growing international trade and income
distribution is mixed. Spilimbergo, Londono and Szekely (1999) find that the effects of
trade openness on inequality depend on initial factor endowments. Moore and Ranjan
(2005) and Chusseau, Dumont and Hellier (2008) find that trade openness leads to
increases in wage inequality, but Meschi and Vivarelli (2007), Roine, Vlachos and
Waldenström (2009) or Eklil (2011), show that trade openness has no significant
distributional impact. Recently, Lim and McNelis (2014) find that trade openness
increases income inequality in a sample of 42 countries between 1992 and 2007.
2.7 SKILL-BIASED TECHNOLOGICAL CHANGE
Rising wage inequality is also often attributed to the skill-biased technological change
(SBTC) that is associated with advances in personal computers and in related information
and communication technologies (ICT). Most recent studies show that developments in
ICT boost, first, the demand for skilled workers (Autor, Levy and Murnane, 2003,
Jorgenson and Timmer, 2011, Katz and Margo, 2013, Michaels, Natraj and Van Reenen,
2013) and, second, their relative productivity (Faggio, Salvanes and Van Reenen, 2010).
Moreover, Goldin and Katz (2007) find a sharp decline in skill supply growth because of
a slowdown in educational attainment since 1980. Several authors view the conjunction
of higher demand for skills, higher productivity for skilled workers and weaker growth in
skilled supply as the crucial explanation for increasing wage inequality in developed
economies since the 1980s (Autor, Katz and Krueger, 1998, Autor, Katz and Kearney,
2006, Goldin und Katz, 2008, van Reenen, 2011).
Empirical validations of the SBTC hypothesis are difficult to provide as only imperfect
statistical measures of SBTC are available. Card and DiNardo (2002) use the share of ICT
industry output in GDP and the percentage of workers using computers as proxies. A
further example is Michaels, Natraj and Van Reenen (2010) who use a measure of ICT
capital at the firm level to check if it correlates with wage inequality.
Most studies rely on indirect observations of SBTC effects, by introducing SBTC in a model
via theoretical restrictions or frictions in the equations and then checking whether the
generated dynamics are similar to those observed in reality. Using this methodology,
several authors find support for the SBTC hypothesis. Galor and Moav (2000) show that
a growth model characterized by skill-biased technological transition is consistent with
the observed increase in income inequality in the United States and other advanced
countries over the past decades. According to Haskel and Slaughter (2002), the degree
of skill-biased technology in each industry sector can explain differences in sectors’ skill
premia in ten OECD countries over the 1970s and 1980s. Moore and Ranjan (2005) and
Chusseau, Dumont and Hellier (2008) find that skill-biased technological change leads to

9
an increase in wage inequality. Autor, Katz and Kearney (2008) and Carneiro and Lee
(2009) show that the SBTC hypothesis successfully accounts for several salient changes
in the distribution of earnings in the United States. Guvenen and Kuruscu (2012) find
that introducing skill-biased technological change in an economy where agents differ in
their ability to accumulate human capital generate behaviors consistent with a rise in
overall wage inequality both in the short and long run.
However, other authors doubt that skill-biased technological change is a significant
driver of wage inequality. Card and DiNardo (2002) explain that, as women and young
people work more often with computers, skill-biased technological change should favor
them and increase their relative wage; this stands in contradiction to the observed
gender gap and the dramatic rise in education-related wage gaps for younger versus
older workers. They conclude that this hypothesis “is not very helpful in understanding
the myriad shifts in the structure of wages that have occurred over the past three
decades”. Greiner, Rubart and Semmler (2004) find that there is less wage inequality
across skills in Europe in contrast to the US on the macroeconomic level. This difference
cannot be explained if technological change similarly affected them. Lemieux (2006)
finds that there is little evidence of a persuasive increase in the demand for particular
skills. Finally, in the most recent review of the literature, Mishel, Shierholz and Schmitt
(2013) conclude that “that there is no currently available technology-based story that
can adequately explain the wage trends of the last three decades.”
10
3 DATA
In this section, we present the data used to analyze the link between inflation and
income inequality. We first describe the data used and their source and then study their
stationarity properties. Appendix A displays all the data used.
3.1 DESCRIPTION
Income inequality
Our indicator of income inequality is the share of total pre-tax income of the top 10%
earners. This variable comes from the World Top Income Database (Alvaredo, Atkinson,
Piketty and Saez, 2013). It is computed from national tax declarations and includes labor
income, capital income, and government transfers. It does not include capital gains.
Inflation
We measure inflation by the CPI annual growth rate. We decompose this growth rate in
two components: a long-term trend (i.e. long-run inflation)6 and short-term cycles (i.e.
inflation cycles). We estimate these two components with a Hodrick-Prescott (HP) filter,
which we run independently for each country. Our data source is the World Top Income
Database (Alvaredo, Atkinson, Piketty and Saez, 2013).
Economic development level and business cycles
We decompose real GDP per capita into a long-term trend (i.e. economic development
level) and business cycle fluctuations with a Hodrick-Prescott (HP) filter. We run the HP
filter independently for each country. We use the data for real GDP per capita from the
Penn World Table database provided by Feenstra, Inklaar and Timmer (2013).
Unemployment
We measure unemployment by the official unemployment rates taken from OECD (2014).
Openness to international trade
To assess the openness of a country, we take the ratio of its exports and imports over
GDP. Data comes from the Penn World Table database.
Unionization
To measure unionization, we use the number of workers that are members of a union
divided by the total number of workers in a country. Our source is Visser (2013).
6 As in Galli and van der Hoeven (2011).
11
Skill-biased technological change
To test the SBTC hypothesis, we have to quantify the pace of technological change. For
this we collect data on three dimensions of IT progress: the penetration rates of mobile
phones, of internet and of landlines. We use the data on these indicators from the
International Telecommunication Union (2014).
To summarize these three indices with one indicator, we apply principal components
analysis. This technique measures the co-movements in all three dimensions to highlight
changes that are common to all indices. It thus gives a proxy to assess the common
technological progress made in all three indices.
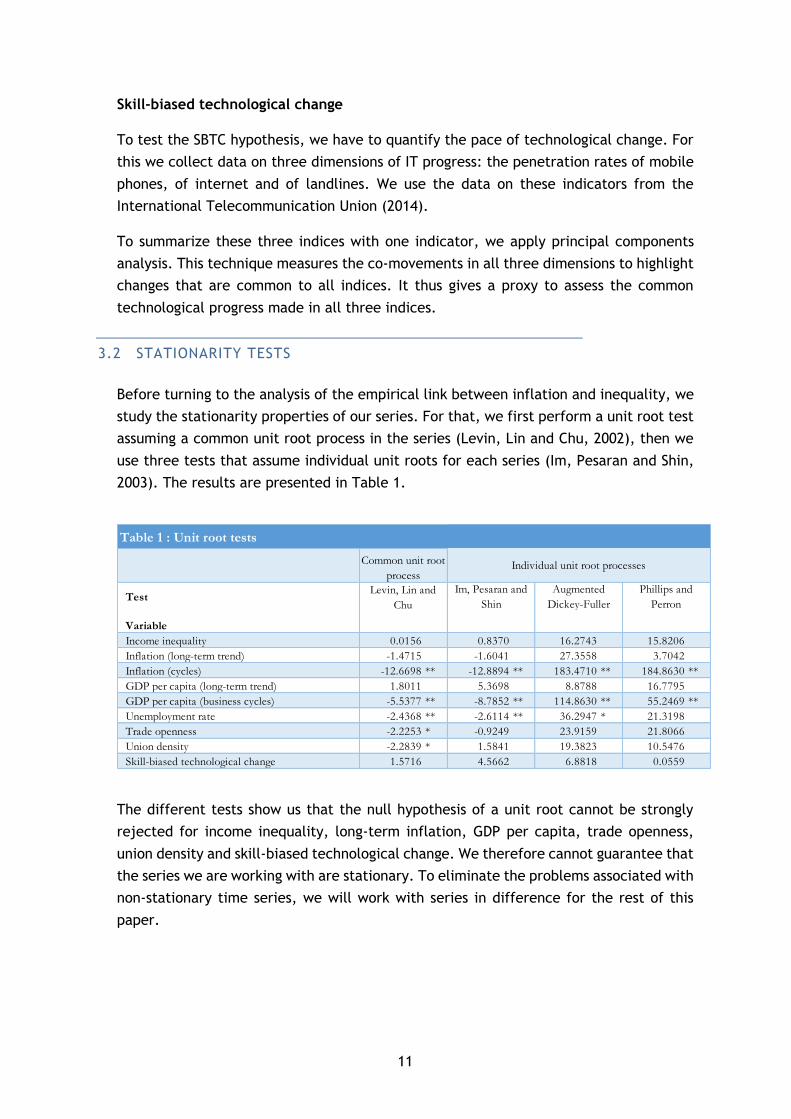
3.2 STATIONARITY TESTS
Before turning to the analysis of the empirical link between inflation and inequality, we
study the stationarity properties of our series. For that, we first perform a unit root test
assuming a common unit root process in the series (Levin, Lin and Chu, 2002), then we
use three tests that assume individual unit roots for each series (Im, Pesaran and Shin,
2003). The results are presented in Table 1.
The different tests show us that the null hypothesis of a unit root cannot be strongly
rejected for income inequality, long-term inflation, GDP per capita, trade openness,
union density and skill-biased technological change. We therefore cannot guarantee that
the series we are working with are stationary. To eliminate the problems associated with
non-stationary time series, we will work with series in difference for the rest of this
paper.
Table 1 : Unit root tests
Variable
Income inequality 0.0156 0.8370 16.2743 15.8206
Inflation (long-term trend) -1.4715 -1.6041 27.3558 3.7042
Inflation (cycles) -12.6698 ** -12.8894 ** 183.4710 ** 184.8630 **
GDP per capita (long-term trend) 1.8011 5.3698 8.8788 16.7795
GDP per capita (business cycles) -5.5377 ** -8.7852 ** 114.8630 ** 55.2469 **
Unemployment rate -2.4368 ** -2.6114 ** 36.2947 * 21.3198
Trade openness -2.2253 * -0.9249 23.9159 21.8066
Union density -2.2839 * 1.5841 19.3823 10.5476
Skill-biased technological change 1.5716 4.5662 6.8818 0.0559
TestIm, Pesaran and
Shin
Augmented
Dickey-Fuller
Phillips and
Perron
Individual unit root processes
Levin, Lin and
Chu
Common unit root
process

12
4 METHODOLOGY
To assess the impact of the different factors referred to above on income inequality, we
estimate the following econometric specification
∆𝑦𝑖𝑡 = 𝛼 + 𝛽∆𝑋𝑖𝑡 + 𝜀𝑖𝑡 (1)
where 𝑦𝑖𝑡 is the income inequality indicator for country 𝑖 at period 𝑡, 𝛼 is a constant, 𝛽
is a vector of coefficients, 𝑋𝑖𝑡 is a matrix of factors and 𝜀𝑖𝑡 is a vector of error terms.
We test two models: one with long-run inflation only and one with long-run inflation and
its squared term. The first model estimates a linear link between inflation and
inequality; the second, a non-linear link between these two variables. In both models,
we estimate a non-linear link between economic development level and inequality. We
test for non-linearity because, in the case of inflation, Romer and Romer (1998), Galli
and van der Hoeven (2001), Bulir (2001) and Auda (2010) empirically find a non-linear
relation between inflation and income distribution, and in the case of economic
development, the Kuznets hypothesis postulates an inverted U-shape curve.
13
5 EMPIRICAL RESULTS
5.1 PANEL ANALYSIS
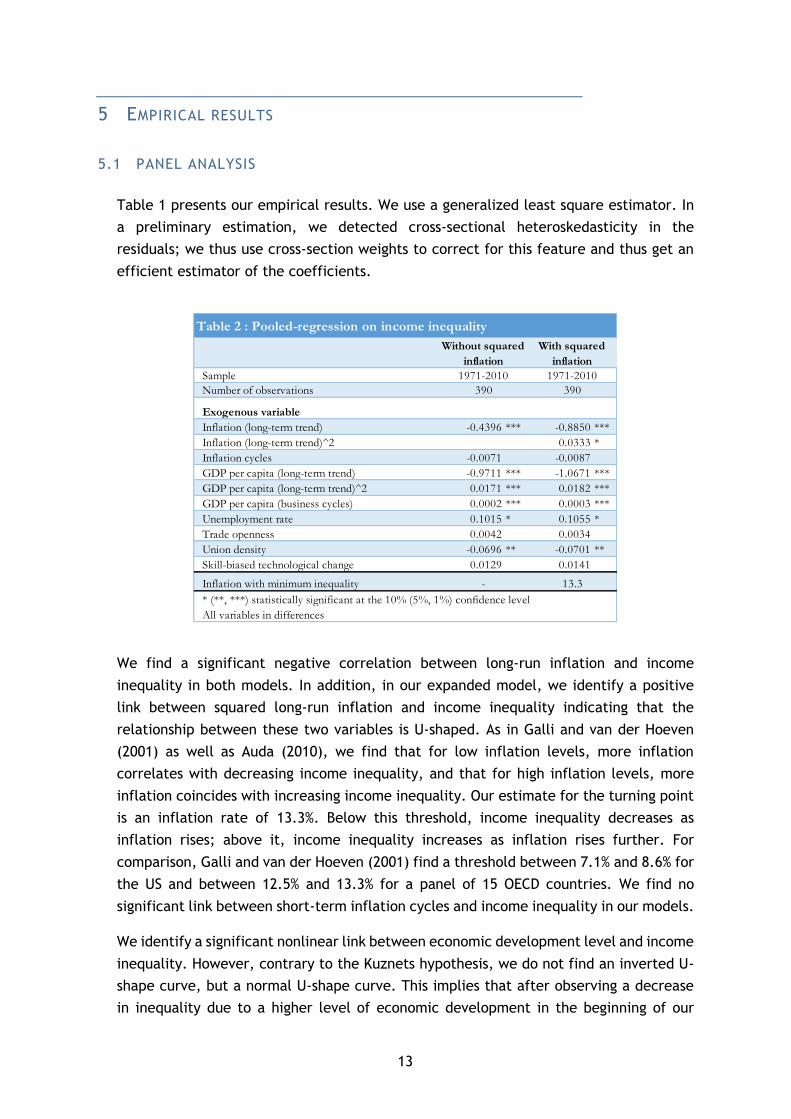
Table 1 presents our empirical results. We use a generalized least square estimator. In
a preliminary estimation, we detected cross-sectional heteroskedasticity in the
residuals; we thus use cross-section weights to correct for this feature and thus get an
efficient estimator of the coefficients.
We find a significant negative correlation between long-run inflation and income
inequality in both models. In addition, in our expanded model, we identify a positive
link between squared long-run inflation and income inequality indicating that the
relationship between these two variables is U-shaped. As in Galli and van der Hoeven
(2001) as well as Auda (2010), we find that for low inflation levels, more inflation
correlates with decreasing income inequality, and that for high inflation levels, more
inflation coincides with increasing income inequality. Our estimate for the turning point
is an inflation rate of 13.3%. Below this threshold, income inequality decreases as
inflation rises; above it, income inequality increases as inflation rises further. For
comparison, Galli and van der Hoeven (2001) find a threshold between 7.1% and 8.6% for
the US and between 12.5% and 13.3% for a panel of 15 OECD countries. We find no
significant link between short-term inflation cycles and income inequality in our models.
We identify a significant nonlinear link between economic development level and income
inequality. However, contrary to the Kuznets hypothesis, we do not find an inverted U-
shape curve, but a normal U-shape curve. This implies that after observing a decrease
in inequality due to a higher level of economic development in the beginning of our
Table 2 : Pooled-regression on income inequality
Sample
Number of observations
Exogenous variable
Inflation (long-term trend) -0.4396 *** -0.8850 ***
Inflation (long-term trend)^2 0.0333 *
Inflation cycles -0.0071 -0.0087
GDP per capita (long-term trend) -0.9711 *** -1.0671 ***
GDP per capita (long-term trend)^2 0.0171 *** 0.0182 ***
GDP per capita (business cycles) 0.0002 *** 0.0003 ***
Unemployment rate 0.1015 * 0.1055 *
Trade openness 0.0042 0.0034
Union density -0.0696 ** -0.0701 **
Skill-biased technological change 0.0129 0.0141
Inflation with minimum inequality
* (**, ***) statistically significant at the 10% (5%, 1%) confidence level
All variables in differences
- 13.3
Without squared
inflation
With squared
inflation
1971-2010 1971-2010
390 390
14
sample period, we observe an increase of income inequality as economic development
levels rise. This result strengthens those of Gallup (2012) as well as Lim and Sek (2014),
who provide the latest findings on the link between economic development level and
income inequality.
Our result seems to be in contradiction with Kuznets’ theory; however, a closer look
might reconcile the two. Kuznets explains that income distribution follows cycles:
income inequality increases as workers move from an old industry to new ones to capture
productivity growth and then decreases, as most of the working force is included in the
new industry sector. A positive link between economic development level and income
inequality, as found in our sample, might reflect the fact that developed countries have
left one Kuznets cycle and are now in the first phase of a new one. This means that the
growing inequality associated with economic development level might indicate that
workers are currently moving from traditional industry sectors to new ones and that
these economies are in an industrial transition phase.
We find a significant procyclical link between business cycles and income inequality. Our
results seem to be in contradiction with other empirical results (see, e.g. Castaneda,
Diaz-Gimenez and Rios-Rull, 1998), who find that income inequality is countercyclical.
However, the comparison between results is difficult to make for two reasons: first, our
sample incorporates 15 more years of data. Second, in our study, we separate business
cycles from long-run growth. In previous studies, business cycles and long-term
components are not distinguished.
In both models, we find a slightly significant positive link between unemployment and
inequality, i.e. higher unemployment is associated with higher inequality. This positive
empirical link is the one theoretically expected. It is in line with other empirical studies
that find a positive link or no significant link between unemployment and income
inequality (see Section 2).
We do not find any significant link between openness to trade and income inequality in
our model. This result is in line with recent studies, such as Meschi and Vivarelli (2007),
Roine, Vlachos and Waldenström (2009) and Eklil (2011), who find that trade openness
has no significant distributional impact.
We identify a significant negative correlation between unionization rate and income
inequality. This means that a higher unionization rate is associated with less income
inequality. This result is in line with findings by Visser and Checchi (2009) for a sample
of 25 developed countries and by Dafermos and Papatheodorou (2013) for EU countries.
We do not find any significant link between our indicator of skill-biased technological
change and income distribution. This result adds to the observation of a lack of solid
empirical proofs on the impact of SBTC on income inequality, as pointed out by Mishel,
Shierholz and Schmitt (2013) in their review of empirical studies on the topic.
15
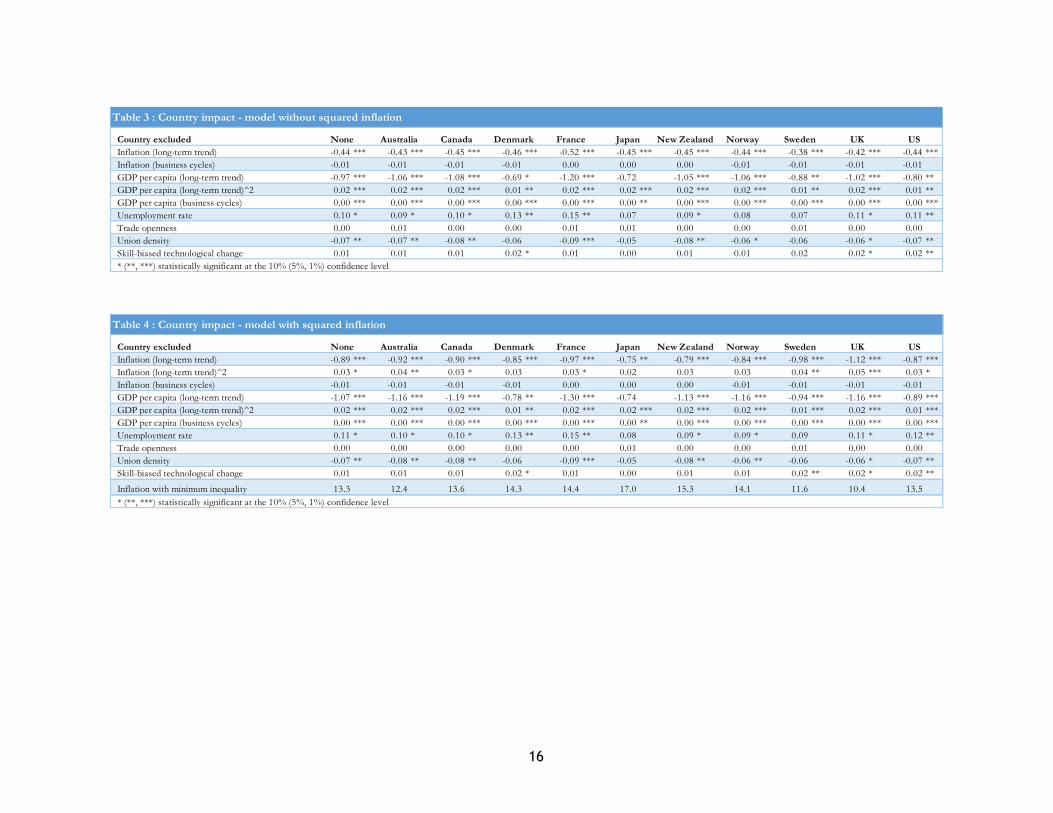
5.2 QUANTIFYING THE EMPIRICAL IMPACT OF EACH COUNTRY
Until now, we have concentrated on the empirical relationship existing over the whole
sample of 10 countries. To get an idea whether our results are robust on the whole
sample or whether only few individual countries influence them, we repeatedly re-
estimate our models with a sample that each time excludes one specific country. The
results are presented in Table 3 and in Table 4.
They show that the negative link between inflation and income inequality is robust to
the exclusion of each country. The links between economic development level, business
cycles and inequality also remains robust to single country exclusion.
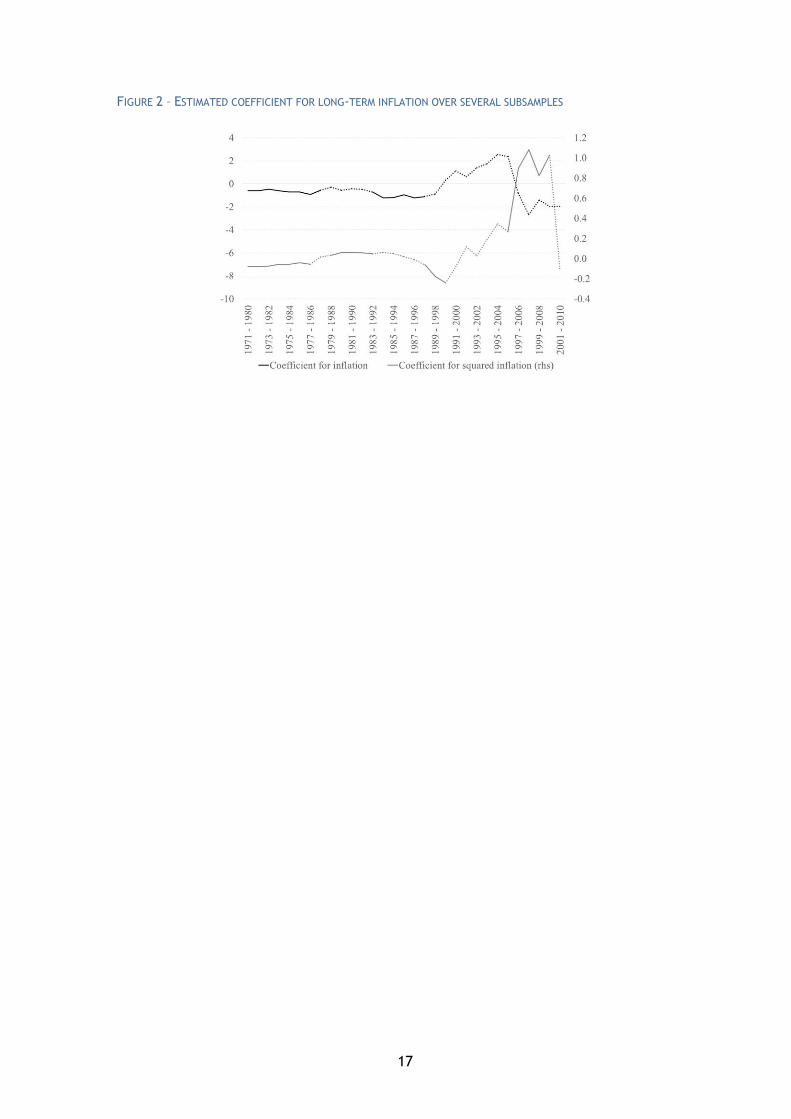
5.3 COEFFICIENTS STABILITY
To assess the stability of the negative empirical link between long-run inflation and
inequality, we also re-estimate our panel over a rolling sample of 10 years. Figure 10
presents the results. A dotted line indicates that the coefficient is not significant at the
5% level. We observe a significant negative link between inflation and inequality over
the sample 1971 to 1987 and between 1983 and 1997. The U-shape curve seems however
to be a more recent feature, as it starts in 1995.
16
Country excluded
Inflation (long-term trend) -0.44 *** -0.43 *** -0.45 *** -0.46 *** -0.52 *** -0.45 *** -0.45 *** -0.44 *** -0.38 *** -0.42 *** -0.44 ***
Inflation (business cycles) -0.01 -0.01 -0.01 -0.01 0.00 0.00 0.00 -0.01 -0.01 -0.01 -0.01
GDP per capita (long-term trend) -0.97 *** -1.06 *** -1.08 *** -0.69 * -1.20 *** -0.72 -1.05 *** -1.06 *** -0.88 ** -1.02 *** -0.80 **
GDP per capita (long-term trend)^2 0.02 *** 0.02 *** 0.02 *** 0.01 ** 0.02 *** 0.02 *** 0.02 *** 0.02 *** 0.01 ** 0.02 *** 0.01 **
GDP per capita (business cycles) 0.00 *** 0.00 *** 0.00 *** 0.00 *** 0.00 *** 0.00 ** 0.00 *** 0.00 *** 0.00 *** 0.00 *** 0.00 ***
Unemployment rate 0.10 * 0.09 * 0.10 * 0.13 ** 0.15 ** 0.07 0.09 * 0.08 0.07 0.11 * 0.11 **
Trade openness 0.00 0.01 0.00 0.00 0.01 0.01 0.00 0.00 0.01 0.00 0.00
Union density -0.07 ** -0.07 ** -0.08 ** -0.06 -0.09 *** -0.05 -0.08 ** -0.06 * -0.06 -0.06 * -0.07 **
Skill-biased technological change 0.01 0.01 0.01 0.02 * 0.01 0.00 0.01 0.01 0.02 0.02 * 0.02 **
* (**, ***) statistically significant at the 10% (5%, 1%) confidence level
UK US
Table 3 : Country impact - model without squared inflation
None Australia Canada Denmark France Japan New Zealand Norway Sweden
Country excluded
Inflation (long-term trend) -0.89 *** -0.92 *** -0.90 *** -0.85 *** -0.97 *** -0.75 ** -0.79 *** -0.84 *** -0.98 *** -1.12 *** -0.87 ***
Inflation (long-term trend)^2 0.03 * 0.04 ** 0.03 * 0.03 0.03 * 0.02 0.03 0.03 0.04 ** 0.05 *** 0.03 *
Inflation (business cycles) -0.01 -0.01 -0.01 -0.01 0.00 0.00 0.00 -0.01 -0.01 -0.01 -0.01
GDP per capita (long-term trend) -1.07 *** -1.16 *** -1.19 *** -0.78 ** -1.30 *** -0.74 -1.13 *** -1.16 *** -0.94 *** -1.16 *** -0.89 ***
GDP per capita (long-term trend)^2 0.02 *** 0.02 *** 0.02 *** 0.01 ** 0.02 *** 0.02 *** 0.02 *** 0.02 *** 0.01 *** 0.02 *** 0.01 ***
GDP per capita (business cycles) 0.00 *** 0.00 *** 0.00 *** 0.00 *** 0.00 *** 0.00 ** 0.00 *** 0.00 *** 0.00 *** 0.00 *** 0.00 ***
Unemployment rate 0.11 * 0.10 * 0.10 * 0.13 ** 0.15 ** 0.08 0.09 * 0.09 * 0.09 0.11 * 0.12 **
Trade openness 0.00 0.00 0.00 0.00 0.00 0.01 0.00 0.00 0.01 0.00 0.00
Union density -0.07 ** -0.08 ** -0.08 ** -0.06 -0.09 *** -0.05 -0.08 ** -0.06 ** -0.06 -0.06 * -0.07 **
Skill-biased technological change 0.01 0.01 0.01 0.02 * 0.01 0.00 0.01 0.01 0.02 ** 0.02 * 0.02 **
Inflation with minimum inequality
* (**, ***) statistically significant at the 10% (5%, 1%) confidence level
13.3 12.4 13.6
Table 4 : Country impact - model with squared inflation
None Australia Canada Denmark France Japan New Zealand Norway Sweden UK US
14.3 14.4 11.6 10.4 13.517.0 15.3 14.1
17
FIGURE 2 – ESTIMATED COEFFICIENT FOR LONG-TERM INFLATION OVER SEVERAL SUBSAMPLES

18
6 CONCLUSION
Empirically, we find a strong negative link between inflation and income inequality in a
panel of 10 OECD countries over the period 1970-2010. The relationship between the
two variables is statistically significant over the whole sample and robust to the
exclusion of individual countries. When we allow for nonlinearity, the relationship turns
into a U-shape. At low inflation levels, the observed income inequality is high. It then
decreases to reach a minimum at an inflation rate of about 13%, and then rises as
inflation goes further up. Other studies also highlight this non-linear relationship (Galli
and van der Hoeven, 2001, Bulir, 2001, and Auda, 2010).
While the empirical evidence compiled in this paper and in other studies attests a solid
link between inflation and income inequality, we lack a theory that explains the channels
through which inflation changes incomes distribution. More theoretical and empirical
work is necessary to understand how inflation and income distribution interact and
influence each other.
Another important issue is that, in this paper, we look at the link between realized
inflation and income inequality. We thus neglect the important distinction between
anticipated inflation and inflation surprises. We also do not analyze the role played by
the inflation targets set by central banks to conduct their monetary policy. An
interesting expansion of this study would be to account for these additional dimensions
and their impact on income inequality. A better understanding of the role of anticipated
inflation and inflation targets for income inequality would also be an important pillar
for a reflection of income distribution issues in monetary policy frameworks.
Finally, in this paper, we only looked at the empirical link between inequality and other
factors. We did not impose any theoretical restrictions to our model. However, we know
that factors such as unemployment, business cycles and inflation are linked with each
other. Imposing further theoretical structure among such variables might help us to
better disentangle the individual from the common effect of each of these factors on
income inequality. A structural VAR might be a good first step to model such
interdependencies.
19
REFERENCES
Albanesi, S. (2007). “Inflation and inequality”, Journal of Monetary Economics, 54(4),
1088-1114.
Alvaredo, F., Atkinson, A, Piketty, T. and Saez, E. (2013). “The World Top Incomes
Database”, http://topincomes.g-mond.parisschoolofeconomics.eu/.
Areosa, M. and Areosa, W. (2006). “The Inequality channel of monetary transmission”,
Banco Central do Brasil Working Paper Series, 114.
Atkinson, A., Piketty, T. and Saez, E. (2011). “Top Incomes in the Long Run of History”,
Journal of Economic Literature, 49(1), 3-71.
Auda, H. (2010). “New tests of symmetry in regression models: application to the
relation between income inequality and inflation”, manuscript.
Autor, D., Katz, L. and Kearney, M. (2006). “The polarization of the U.S. labour market”,
American Economic Review, 96(2), 189-194.
Autor, D., Katz, L. and Kearney, M. (2008). “Trends in U.S. wage inequality: revising the
revisionists”, Review of Economics and Statistics, 90(2), 300-323.
Autor, D., Katz, L. and Krueger, A. (1998). “Computing Inequality: Have computers
changed the labour market?”, Quarterly Journal of Economics, 113(4), 1169-1213.
Autor, D., Levy, F. and Murnane, R. (2003). “The skill content of recent technological
change: an empirical exploration”, Quarterly Journal of Economics, 118(4), 1279-1333.
Bordo, M. (1983). "Some Aspects of the Monetary Economics of Richard Cantillon",
Journal of Monetary Economics, 12(2), 235–258.
Bulir, A. (2001). “Income Inequality: Does inflation matter?”, IMF Staff Papers, 48(1).
Bulir, A. and Gulde, A.-M. (1995). “Inflation and income distribution: Further evidence
on empirical links”, IMF Working Paper, no 95/86.
Card, D. and DiNardo, J. (2002). “Skill biased technological change and rising wage
inequality: some problems and puzzles”, NBER Working Paper Series, no 8769.
Carneiro, P. and Lee, S (2009). “Trends in quality-adjusted skill premia in the United
States, 1960-2000”, CEMMAP Working Paper, CWP02/09.
Castaneda, A., Diaz-Gimenez, J. and Rios-Rull, J.-V. (1998). “Exploring the income
distribution business cycle dynamics”, Journal of Monetary Economics, 42(1), 93-130.
Checchi, D. and Garcia-Penalosa, C. (2010). “Labour market institutions and the personal
distribution of income in the OECD”, Economica, 77(307), 413-450.
Chusseau, N., Dumont, M. and Hellier, J. (2008). “Explaining rising inequality: skill-
biased technical change and North-South trade”, Journal of Economic Surveys, 22(3),
409-457.
20
Coibion, O., Gorodnichenko, Y., Kueng, L. and Silvia, J. (2012). “Innocent Bystanders?
Monetary Policy and Inequality in the U.S.”, NBER Working Paper Series, no 18170.
Cysne, R., Maldonado, W. and Klinger Monteiro, P. (2005). “Inflation and income
inequality: A shopping-time approach”, Journal of Development Economics, 78(2), 516-
528.
Dafermos, Y. and Papatheodorou, C. (2013). “What drives inequality and poverty in the
EU? Exploring the impact of macroeconomic and institutional factors”, International
Review of Applied Economics, 27(1), 1-22.
Eklil, O. (2011). “The rise of income inequality and the possible role of trade in the
process”, Master thesis.
Erosa, A. and Ventura, G. (2002). “On inflation as a regressive consumption tax”, Journal
of Monetary Economics, 49(4), 761-795.
Faggio, G., Salvanes, K. and Van Reenen, J. (2010). “The evolution of inequality in
productivity and wages: panel data evidence”, Industrial and Corporate Change, 19(6),
1919-1951.
Federal Reserve (2013). Transcript of Chairman Bernanke’s Press Conference September
18, 2013.
Feenstra, Robert C., Robert Inklaar and Marcel P. Timmer (2013), "The Next Generation
of the Penn World Table" available for download at www.ggdc.net/pwt.
Galli, R. and van der Hoeven, R. (2001). “Is inflation bad for income inequality: The
importance of the initial rate of inflation”, manuscript.
Gallup, J. (2012). “Is there a Kuznets curve?”, manuscript.
Galor, O. and Moav, O. (2000). “Ability-biased technological transition, wage inequality,
and economic growth”, Quarterly Journal of Economics, 115(2), 469-497.
Gkinni, E. and Vasilaki, E. (2013). “Employment protection and income inequality: is
there a role for the informal sector?”, MPRA Paper, no 45464.
Goldin, C. and Katz, L. (2007). “Long-run changes in the U.S. wage structure: narrowing,
widening, polarizing”, NBER Working Paper Series, no 13568.
Goldin, C. and Katz, l. (2008). The Race between Education and Technology, Belknap
Press.
Greiner, A., Rubart, J. and Semmler, W. (2004). “Economic growth, skill-biased
technical change and wage inequality: a model and estimations for the US and Europe”,
Journal of Macroeconomics, 26(4), 597-621.
Guvenen, F. and Kuruscu, B. (2012). “Understanding the evolution of the US wage
distribution: a theoretical analysis”, Journal of the European Economic Association,
10(3), 482-517.
Haskel, J. and Slaughter, M. (2002). “Does the sector bias of skill-biased technical
change explain changing skill premia”, European Economic Review, 46(10), 1757-1783.
21
Heathcote, J., Perri, F. and Violante, G. (2010). “Unequal we stand: an empirical
analysis of economic inequality in the United States, 1967-2006”, Review of Economic
Dynamics, 13(1), 15-51.
Heer, B. and Maussner, A. (2004). “Distributional effects of monetary policies in a new
neoclassical model with progressive income taxation”, manuscript.
Heer, B. and Süssmuth, B. (2003). “Cold progression and its effects on income
distribution”, CESifo Working Paper, no 951.
Hossain, S. (2013). “Does economic development requires more income inequality? – Is
the Kuznets curve still valid?”, Developing Country Studies, 3(8), 196-205.
Im, K. S., Pesaran, M. H. and Shin, Y. (2003). “Testing for unit roots in heterogeneous
panels”, Journal of Econometrics, 115(1), 53-74.
International Communication Union (2014). http://www.itu.int/en/ITU-
D/Statistics/Pages/default.aspx.
Jorgenson, D. and Timmer, M. (2011). “Structural change in advanced nations: a new
set of stylised facts”, Scandinavian Journal of Economics, 113(1), 1-29.
Katz, L. and Margo, R. (2013). “Technical change and the relative demand for skilled
labour: the United States in historical perspective”, NBER Working Paper Series, no
18752.
Kuznets, S. (1955). “Economic growth and income inequality”, American Economic
Review, 1-28.
Kuznets, S. and Jenks, E. (1953). Shares of Upper Income Groups in Income Savings,
National Bureau of Economic Research.
Ledoit, O. (2011). “The redistributive effects of monetary policy”, University of Zurich
Department of Economics Working Paper No. 44.
Lemieux, T. (2006). “Increasing residual wage inequality: composition effect, noisy data,
or raising demand for skill?”, American Economic Review, 96(3), 461-498.
Levin, A., Lin, C.-F. and Chu, C.-S. (2002). “Unit root tests in panel data: asymptotic
and finit-sample properties”, Journal of Econometrics, 108(1), 1-24.
Lim, C. Y. and Sek, S. K. (2014). “Exploring the two-way relationship between income
inequality and growth”, Journal of Advanced Management Science, 2(1), 33-37.
Lim, G. C. and McNelis, P. (2014). “Income inequality, trade and financial openness”,
New Perspectives.
Liu, X. and Cao, H. (2008). “Inflation and income inequality in a modified cash-in-
advance economy”, manuscript.
Maestri, V. and Roventini, A. (2012). “Inequality and macroeconomic factors : a time-
series analysis for a set of OECD countries”, Working Paper.
Mendershausen, H. (1946). Changes in Income Distribution during the Great Depression,
National Bureau of Economic Research.
22
Meschi, E. and Vivarelli, M. (2007). “Trade openness and income inequality in developing
countries”. Working Paper, University of Warwick, Centre for the Study of Globalization
and Regionalization.
Michaels, G., Natraj, A. and Van Reenen, J. (2013). “Has ICT Polarized Skill Demand?
Evidence from Eleven Countries over 25 Years”, Review of Economics and Statistics,
doi:10.1162/REST_a_00366.
Mishel, L., Shierholz, H. and Schmitt, J. (2013). “Don’t blame the robots: assessing the
job polarization explanation of growing wage inequality”, Economic Policy Institute
Working Paper.
Moore, M. and Ranjan, P. (2005). “Globalization vs skill-biased technological change:
implications for unemployment and wage inequality”, Economic Journal, 503, 391-422.
OECD (2011). Divided We Stand: Why Inequality Keeps Rising, OECD Publishing.
OECD (2014). http://stats.oecd.org/index.aspx?queryid=21760.
Parker, J. and Vissing-Jorgensen, A. (2010). “The increase in income cyclicality of high-
income households and its relation to the rise of top income shares”, NBER Working
Paper Series, no 16577
Parker, S. (1998). “Income inequality and the business cycle: a survey of evidence and
some new results”, Journal of Post Keynesian Economics, 21(2).
Piketty, T. (2014). Capital in the Twenty-First Century, Belknap Press.
Roine, J., Vlachos, J. and Waldenström, D. (2009). “The long-run determinants of
inequality: what can we learn from top income data?”, Journal of Public Economics,
93(7-8), 974-988.
Romer, C. and Romer, D. (1998). “Monetary policy and the well-being of the poor”, NBER
Working Paper Series, no 6793.
Spilimbergo, A., Londono, J. L. and Szekely, M. (1999). “Income distribution, factor
endowments, and trade openness”, Journal of Development Economics, 59(1), 77-101.
Sun, H. (2011). Search, distributions, monetary and fiscal policy. Manuscript.
Williamson, S. (2008). “Monetary policy and distribution”, Journal of Monetary
Economics, 55(6), 1038-1053.
Van Reenen, J. (2011). “Wage inequality, technology and trade: 21st century evidence”,
Labour Economics, 18(6), 730-741.
Visser, J. (2013). ICTWSS database (version 4.0) available at http://www.uva-
aias.net/208.
Visser, J. and D. Cecchi (2009), “Inequality and the labour market: unions” in W.
Salverda, B. Nolan and T. Smeeding (eds.), Oxford Handbook of Economic Inequality,
Oxford University Press, pp. 230-256.
23
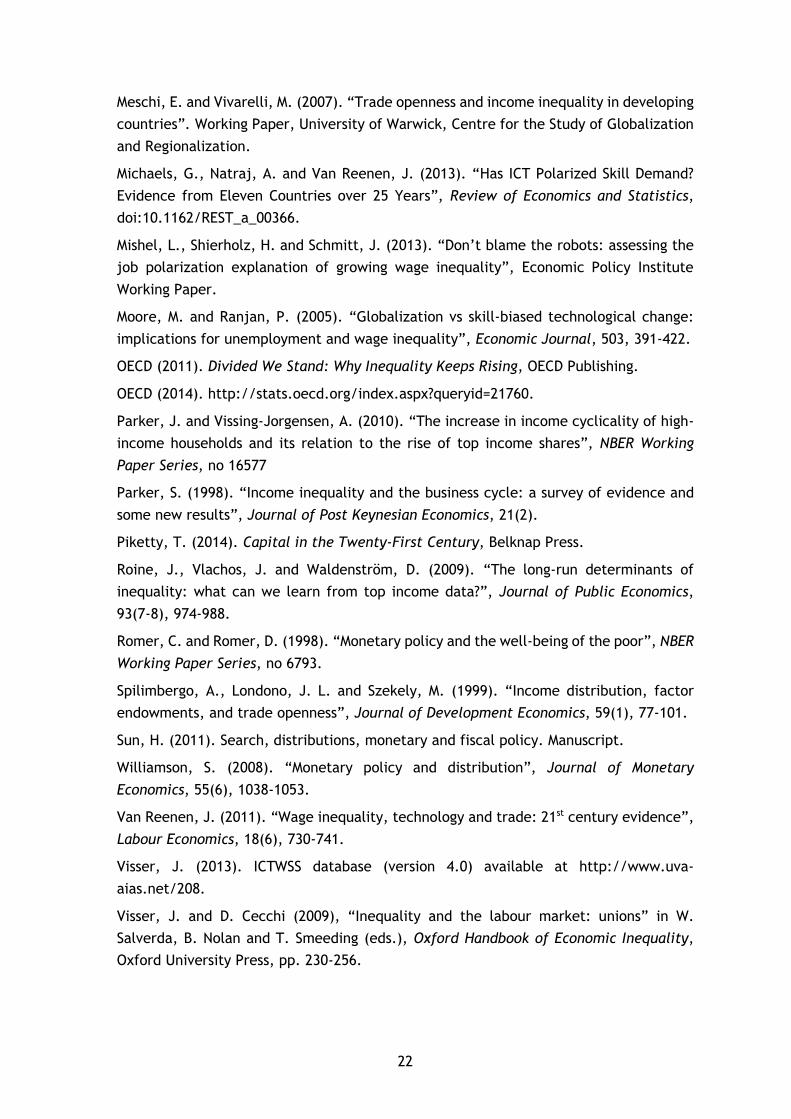
APPENDIX A: CHARTS
FIGURE 3 –INFLATION LONG-TERM TREND
Source: World Top Income Database (Alvaredo, Atkinson, Piketty and Saez, 2013) and own computation.
FIGURE 4 – INFLATION BUSINESS CYCLES
Source: World Top Income Database (Alvaredo, Atkinson, Piketty and Saez, 2013) and own computation.
FIGURE 5 – ECONOMIC DEVELOPMENT LEVEL
Source: Penn World Table (Feenstra, Inklaar and Timmer, 2013) and own computation.
24
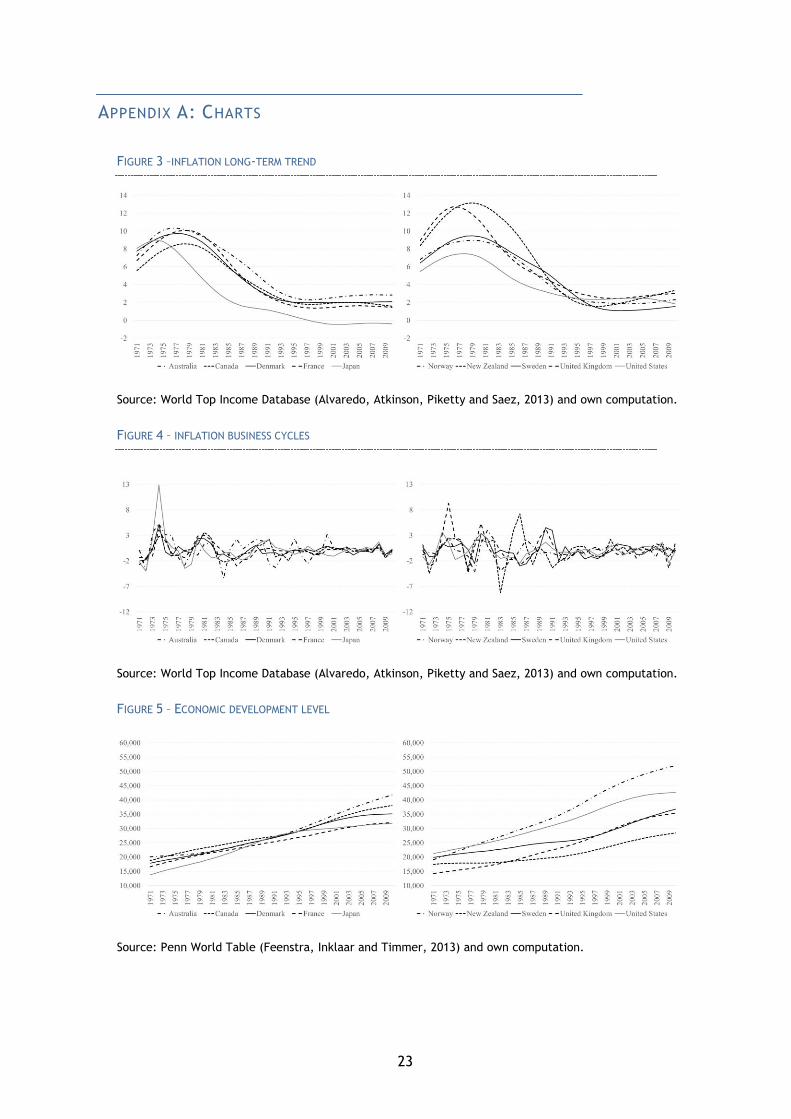
FIGURE 6 – BUSINESS CYCLES
Source: Penn World Table (Feenstra, Inklaar and Timmer, 2013) and own computation.
FIGURE 7 – UNEMPLOYMENT RATES
Source: OECD
FIGURE 8 – OPENNESS INTERNATIONAL TRADE (RATIO OF EXPORTS AND IMPORTS OVER GDP)
Source: Penn World Table (Feenstra, Inklaar and Timmer, 2013).
25
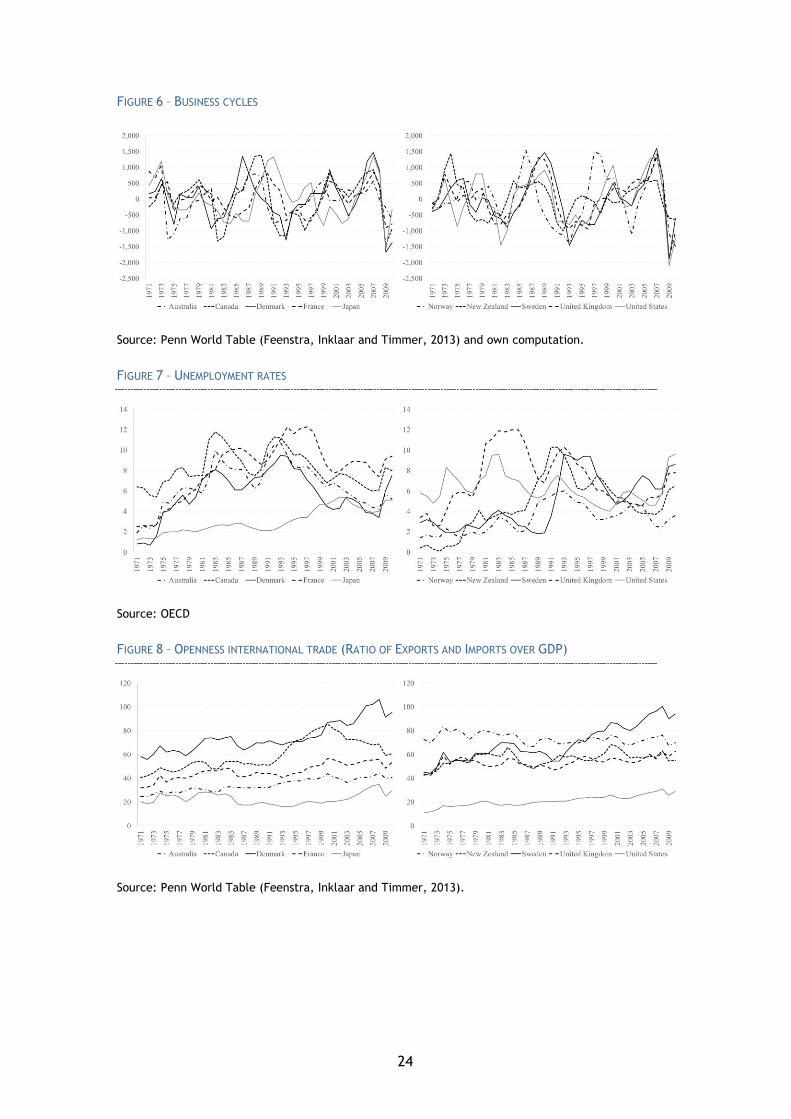
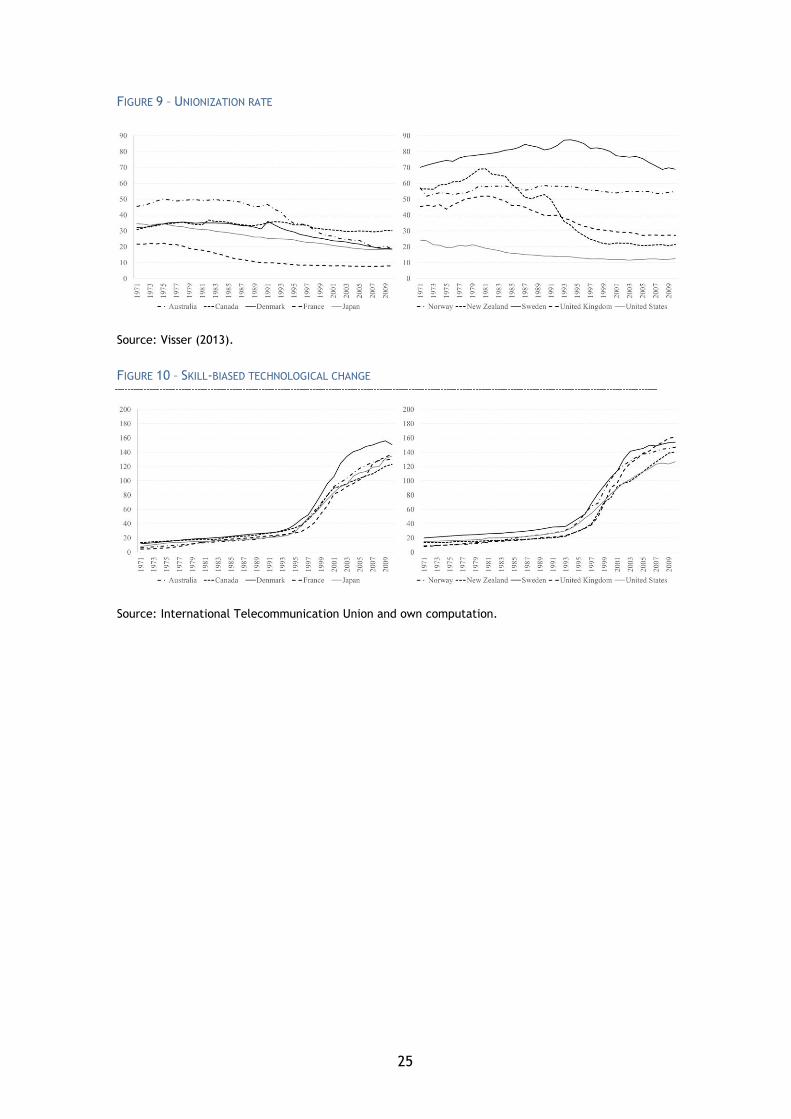
FIGURE 9 – UNIONIZATION RATE
Source: Visser (2013).
FIGURE 10 – SKILL-BIASED TECHNOLOGICAL CHANGE
Source: International Telecommunication Union and own computation.

© 2014 Council on Economic Policies Seefeldstrasse 60 8008 Zurich Switzerland Phone: +41 44 252 3300 www.cepweb.org [email protected]