economic feasibility report - city of evanston
TRANSCRIPT

Planned Development Application
1450 Sherman Avenue
Evanston, IL 60201
13 – ECONOMIC FEASIBILITY REPORT

SECTION 13 – ECONOMIC FEASIBILITY REPORT
Based on the supporting data attached, Albion Residential feels confident that
the unit mix underwritten is in line with submarket trends. In an effort to satisfy
market demands, Albion Residential has taken the approach to developing
smaller, high-quality units when compared to other residential apartment
communities in the market.
Significant growth and development driven by thriving employment and new
businesses continue to support the vision of a thriving and energetic downtown
core and transitional districts. The planned development will be an
irreplaceable transit oriented development that is set to attract several types of
renter demographics throughout Evanston.
The planned development is expected to attract three different renter
demographics. The first renter consists of educated young professionals who
are well compensated in the workplace. These younger generations have
become comfortable with the flexibility and lifestyle renting has to offer
compared to homeownership. Millennials account for a large majority of the
national renter pool making them a vital part of the local community.
The second renter demographic consists of small families who have chosen
Evanston for its vibrant entertainment scene, local shopping, and strong public
and private school system. Small families typically make up a significantly
small portion of the demographic mix of resident’s in apartment style
communities.
Lastly, baby boomers make up the final target demographic that have started
to consider apartment style living. Current trends indicate that Baby Boomers
are rapidly shifting towards trading in the responsibilities tied to
homeownership in exchange for a maintenance free urban-suburban lifestyle.

Macroeconomic Outlook
The United States economy is expected to add 2 million new hires and an
additional 371,000 units during 2017 supporting rental household formation
and demand. As a tighter labor market drives up wages, GDP growth has been
forecasted in the 2.5% range based on strong consumer spending combined
with the possible implementation of fiscal policies. National apartment vacancy
is expected to end the year at 4.0% as rapidly increasing household formation
generates robust net absorption. In addition, the average effective rent is
expected to climb 4.5% to $1,442 per month building on the rent growth
increases that were registered during 2016. Lastly, the rise in average sales
prices during 2016 compressed the average cap rate to the low 5% range. Rising
property valuations across the nation have prompted investors to search for
higher yields in urban suburban, secondary, and tertiary markets. Supporting
sale comparables throughout downtown Chicago and neighboring top-tier
suburbs continue to set record pricing for assets that are similar in quality and
nature to the planned development.
Homeownership rates have
continued to steadily decline
towards historical lows
indicating that more
Americans are becoming
renters than ever before. The
renter population in
suburban Chicago has
grown 23% due to a steep
decline in Chicago
homeownership. As of Q4
2016, the Chicago MSA registered a 64.5% homeownership rate furthering the
argument that the apartment industry will remain strong in the near term.
National Homeownership Rate and Renter Occupied Households

Chicago Employment
Following a solid year in 2016, Chicago is expected to create 70,000 jobs during
2017 increasing payrolls by 1.5%. Chicago suburbs are expected to perform
particularly well in areas where employment opportunities, large regional
malls, and easy expressway access bolster underlying renter demand.
Apartment developers will deliver 8,400 units during 2017 marking the greatest
level of multifamily completions since 2000. The effective rent in Chicago will
climb 4.5% during 2017 building on the 5.4% increase that was registered in
2016.
Evanston Employment
“A diverse economy in which 43% of Evanston residents who are
employed work within the community.” -2000 Comprehensive General
Plan
With a significant amount of employees
working and residening in Evanston,
The city relies heavily on its downtown
corporations, educational system, and
established healthcare professionals to
grow the economy. Evanston
employment is primarily made up of
“eds and meds” including NorthShore
University HealthSystem, Saint Francis
Hospital, Northwestern University, and
the Evanston Skokie School District.
The two local hospitals combined contribute approximately 5,000 well-paying
jobs. In addition to Northwestern University’s 3,500 full-time faculty and staff,
student workers contribute to the local economy by filling the void in service
based retail positions enabling local restaurants and businesses to grow.
“Evanston’s economy includes employers from many sectors, such as
education, health care, manufacturing high-technology research, and the
arts. Furthermore, the strong transit linkage to Chicago makes Evanston
an ideal home for workers commuting to the Loop.” -2000
Comprehensive General Plan
Chicago Outlook
Over the past 5 years 17,100 units have been delivered in the Chicago MSA.
During 2016 approximately 8,100 units were delivered and 7,700 are project to

be completed in 2017. With 452,431 units in the Chicago MSA, supply for 2016
and 2017 makes up approximately 3.4% of current total inventory.
Suburban absorption rates are projected to remain near record levels for the
next several years in anticipation of new product in the market and
employment growth. While there has been a significant number of deliveries
throughout suburban Chicago between 2001 to 2003, a moderate pace of
development has taken effect over the past decade. A strong push by local
developers and institutional investors has brought about several new projects
in various stages of development. Development projects appear to be heavily
dispersed throughout the suburbs causing new suburban product to have less of
an oversupply impact in their respective submarkets. In total, 22,301 units
through 2Q 2016 have been brought to the market since 1996 resulting in an
average of 1,062 suburban units completed per year.
Evanston Supply
Evanston’s density and tight topography near Lake Michigan has resulted in a
moderate supply trend over the past several years. With a finite number of
readily available sites near downtown, developers have been challenged to get
creative in redeveloping the dontown transitional and core areas.
Highlighted by tight vacancy, modest development activity, and conservative
downtown Evanston presents an excellent opportunity for new housing in an
urban suburban environment. Approximately 66% of Evanston residents have
received a college degree or higher indicating that local residents are highly
educated and well compensated in the workplace. Northwestern University
enrolls approximately 21,000 students annually, of which 40% live in housing
accommodations provided by the university. Despite solid income
demographics, the average monthly homeownership expenditure with a
mortgage in Evanston is approximately $2,443 putting homeownership out of
reach for many residents. The gap between monthly rent and income suggests
that renting is a feasible housing option for residents looking to live in
downtown Evanston.

Evanston posted modest rent growth during 2016 pushing average effective
rents to $2,110 per month. Evanston maintains an occupancy rate 95.06%,
which is expected to remain unchanged over the next several years as lease up
concessions and staggered new development absorption counterbalance
occupancy.

$1,000
$1,500
$2,000
$2,500
$3,000
$3,500
2/1/2017 3/1/2017 4/1/2017 5/1/2017
Average Asking Rents
AMLI Evanston
The Main at 847 Chicago
E2 Apartments
1717 Evanston
Reserve at Evanston
Park Evanston Apartments
Evanston Place Apartments
$0.00
$0.50
$1.00
$1.50
$2.00
$2.50
$3.00
$3.50
$4.00
2/1/2017 3/1/2017 4/1/2017 5/1/2017
Average Asking Rents PSF
AMLI Evanston
The Main at 847 Chicago
E2 Apartments
1717 Evanston
Reserve at Evanston
Park Evanston Apartments
Evanston Place Apartments
75.0%
80.0%
85.0%
90.0%
95.0%
100.0%
2/1/2017 3/1/2017 4/1/2017 5/1/2017
Occupancy
AMLI Evanston
The Main at 847 Chicago
E2 Apartments
1717 Evanston
Reserve at Evanston
Park Evanston Apartments
Evanston Place Apartments

$1,000
$1,500
$2,000
$2,500
$3,000
$3,500
2/1/2017 3/1/2017 4/1/2017 5/1/2017
Average Effective Rents
AMLI Evanston
The Main at 847 Chicago
E2 Apartments
1717 Evanston
Reserve at Evanston
Park Evanston Apartments
Evanston Place Apartments
$0.00
$0.50
$1.00
$1.50
$2.00
$2.50
$3.00
$3.50
$4.00
2/1/2017 3/1/2017 4/1/2017 5/1/2017
Average Effective Rents PSF
AMLI Evanston
The Main at 847 Chicago
E2 Apartments
1717 Evanston
Reserve at Evanston
Park Evanston Apartments
Evanston Place Apartments

Properties Units Avg. Unit SFAvg. Asking
Rent
Avg. Asking
Rent PSF
Avg. Effective
Rent
Avg. Effective
Rent PSFOccupancy
AMLI Evanston 214 1,124 $2,649 $2.36 $2,649 $2.36 88%The Main at 847 Chicago 112 887 $2,365 $2.67 $2,156 $2.43 87%E2 Apartments 354 887 $3,046 $3.44 $3,046 $3.44 98%1717 Evanston 175 871 $2,362 $2.71 $2,350 $2.70 90%Reserve at Evanston 193 841 $2,196 $2.61 $2,194 $2.61 93%Park Evanston Apartments 283 919 $2,006 $2.18 $2,006 $2.18 93%Evanston Place Apartments 189 878 $2,358 $2.68 $2,358 $2.68 97%

Albion at Evanston 5/16/2017
AMLI Evanston
Unit Type Units %
Unit Avg
SF 11/11/2016 12/13/2016 2/13/2017 3/14/2017 4/12/2017 5/15/2017
S 6 3% 500 $1,778 $1,779 $1,625 $1,625 $1,612 $1,583A 71 33% 831 $1,939 $1,953 $1,990 $1,982 $1,970 $2,029B 110 51% 1,254 $2,917 $2,896 $2,875 $2,850 $2,848 $2,865C 27 13% 1,505 $3,529 $3,712 $3,710 $3,676 $3,601 $3,640
Total/Average 214 100% 1,124 $2,638 $2,655 $2,652 $2,632 $2,617 $2,649
$PSF $2.35 $2.36 $2.36 $2.34 $2.33 $2.36
The Main at 847 Chicago
Unit Type Units %
Unit Avg
SF 11/11/2016 12/13/2016 2/13/2017 3/14/2017 4/12/2017 5/15/2017
S 7 6% 500 $1,465 $1,640 $1,665 $1,695 $1,695 $1,695A 56 50% 763 $2,070 $2,220 $2,111 $2,057 $2,066 $2,085B 42 38% 1,027 $2,669 $2,807 $2,698 $2,643 $2,647 $2,655C 7 6% 1,424 $3,485 $3,585 $3,515 $3,535 $3,535 $3,539
Total/Average 112 100% 887 $2,345 $2,489 $2,391 $2,347 $2,353 $2,365
$PSF $2.64 $2.81 $2.70 $2.65 $2.65 $2.67
E2 Apartments
Unit Type Units %
Unit Avg
SF 11/11/2016 12/13/2016 2/13/2017 3/14/2017 4/12/2017 5/15/2017
S 85 24% 505 $1,837 $1,760 $1,836 $1,791 $1,711 $1,609A 111 31% 695 $2,418 $2,406 $2,425 $2,421 $2,400 $2,425B 108 31% 1,126 $4,412 $4,369 $4,343 $4,375 $4,334 $4,416C 50 14% 1,444 $4,213 $3,762 $4,228 $4,057 $3,872 $3,907
Total/Average 354 100% 887 $3,140 $3,041 $3,123 $3,097 $3,033 $3,046
$PSF $3.54 $3.43 $3.52 $3.49 $3.42 $3.44
1717 Evanston
Unit Type Units %
Unit Avg
SF 11/11/2016 12/13/2016 2/13/2017 3/14/2017 4/12/2017 5/15/2017
S 13 7% 542 $1,529 $1,470 $1,460 $1,461 $1,613 $1,672A 109 62% 769 $2,010 $1,981 $2,171 $2,189 $2,253 $2,166B 40 23% 1,107 $2,936 $2,391 $2,708 $2,681 $2,754 $2,710C 13 7% 1,327 $3,437 $3,825 $3,871 $3,980 $3,579 $3,629
Total/Average 175 100% 871 $2,292 $2,174 $2,367 $2,380 $2,418 $2,362
$PSF $2.63 $2.50 $2.72 $2.73 $2.78 $2.71
Reserve at Evanston
Unit Type Units %
Unit Avg
SF 11/11/2016 12/13/2016 2/13/2017 3/14/2017 4/12/2017 5/15/2017
S 7 4% 601 $1,775 $1,775 $1,740 $1,684 $1,780 $1,809A 101 52% 674 $1,802 $1,865 $1,845 $1,756 $1,838 $1,882B 77 40% 1,031 $2,409 $2,497 $2,397 $2,413 $2,465 $2,459C 8 4% 1,325 $4,051 $4,051 $3,840 $3,701 $3,913 $3,975
Total/Average 193 100% 841 $2,136 $2,204 $2,144 $2,096 $2,172 $2,196
$PSF $2.54 $2.62 $2.55 $2.49 $2.58 $2.61
Park Evanston Apartments
Unit Type Units %
Unit Avg
SF 11/11/2016 12/13/2016 2/13/2017 3/14/2017 4/12/2017 5/15/2017
S 28 10% 532 $1,829 $1,856 $1,669 $1,550 $1,558 $1,410A 134 47% 764 $2,162 $2,001 $1,744 $1,903 $1,650 $1,572B 106 37% 1,134 $2,852 $3,076 $2,906 $2,909 $2,908 $2,476C 15 5% 1,507 $3,940 $4,033 $3,900 $3,852 $4,038 $3,681
Total/Average 283 100% 919 $2,482 $2,497 $2,286 $2,348 $2,239 $2,006
$PSF $2.70 $2.72 $2.49 $2.56 $2.44 $2.18
Evanston Place Apartments
Unit Type Units %
Unit Avg
SF 11/11/2016 12/13/2016 2/13/2017 3/14/2017 4/12/2017 5/15/2017
S 16 8% 567 $1,743 $1,763 $1,788 $1,788A 129 68% 831 $2,009 $2,014 $2,126 $2,086B 41 22% 1,101 $3,261 $3,287 $3,325 $3,322C 3 2% 1,515 $3,751 $3,840 $3,912 $3,892
Total/Average 189 100% 878 $0 $0 $2,286 $2,298 $2,386 $2,358
$PSF $0.00 $0.00 $2.60 $2.62 $2.72 $2.68
ASKING RENTS

Albion at Evanston 5/16/2017
AMLI Evanston
Unit Type Units %
Unit Avg
SF 11/11/2016 12/13/2016 2/13/2017 3/14/2017 4/12/2017 5/15/2017
S 6 3% 500 $1,778 $1,779 $1,625 $1,625 $1,612 $1,583A 71 33% 831 $1,939 $1,953 $1,990 $1,982 $1,970 $2,029B 110 51% 1254 $2,917 $2,896 $2,875 $2,850 $2,848 $2,865C 27 13% 1505 $3,529 $3,712 $3,710 $3,676 $3,601 $3,640
Total/Average 214 100% 1124 $2,638 $2,655 $2,652 $2,632 $2,617 $2,649
$PSF $2.35 $2.36 $2.36 $2.34 $2.33 $2.36
The Main at 847 Chicago
Unit Type Units %
Unit Avg
SF 11/11/2016 12/13/2016 2/13/2017 3/14/2017 4/12/2017 5/15/2017
S 7 6% 500 $1,640 $1,526 $1,554 $1,554 $1,483A 56 50% 763 $2,035 $1,935 $1,886 $1,929 $1,998B 42 38% 1027 $2,729 $2,473 $2,422 $2,481 $2,323C 7 6% 1424 $3,585 $3,222 $3,240 $3,240 $3,096
Total/Average 112 100% 887 $0 $2,367 $2,192 $2,151 $2,195 $2,156
$PSF $0.00 $2.67 $2.47 $2.43 $2.47 $2.43
E2 Apartments
Unit Type Units %
Unit Avg
SF 11/11/2016 12/13/2016 2/13/2017 3/14/2017 4/12/2017 5/15/2017
S 85 24% 505 $1,837 $1,760 $1,836 $1,791 $1,711 $1,609A 111 31% 695 $2,418 $2,406 $2,425 $2,421 $2,400 $2,425B 108 31% 1126 $4,412 $4,369 $4,343 $4,375 $4,334 $4,416C 50 14% 1444 $4,213 $3,762 $4,288 $4,057 $3,872 $3,907
Total/Average 354 100% 887 $3,140 $3,041 $3,132 $3,097 $3,033 $3,046
$PSF $3.54 $3.43 $3.53 $3.49 $3.42 $3.44
1717 Evanston
Unit Type Units %
Unit Avg
SF 11/11/2016 12/13/2016 2/13/2017 3/14/2017 4/12/2017 5/15/2017
S 13 7% 542 $1,529 $1,470 $1,460 $1,446 $1,600 $1,665A 109 62% 769 $2,010 $1,981 $2,171 $2,181 $2,245 $2,154B 40 23% 1107 $2,936 $2,391 $2,705 $2,670 $2,743 $2,700C 13 7% 1327 $3,437 $3,783 $3,871 $3,906 $3,549 $3,599
Total/Average 175 100% 871 $2,292 $2,171 $2,367 $2,366 $2,408 $2,350
$PSF $2.63 $2.49 $2.72 $2.72 $2.76 $2.70
Reserve at Evanston
Unit Type Units %
Unit Avg
SF 11/11/2016 12/13/2016 2/13/2017 3/14/2017 4/12/2017 5/15/2017
S 7 4% 601 $1,775 $1,760 $1,725 $1,668 $1,764 $1,793A 101 52% 674 $1,802 $1,865 $1,845 $1,756 $1,838 $1,882B 77 40% 1031 $2,409 $2,497 $2,397 $2,413 $2,465 $2,459C 8 4% 1325 $4,018 $4,018 $3,807 $3,668 $3,877 $3,939
Total/Average 193 100% 841 $2,135 $2,203 $2,142 $2,094 $2,170 $2,194
$PSF $2.54 $2.62 $2.55 $2.49 $2.58 $2.61
Park Evanston Apartments
Unit Type Units %
Unit Avg
SF 11/11/2016 12/13/2016 2/13/2017 3/14/2017 4/12/2017 5/15/2017
S 28 10% 532 $1,829 $1,856 $1,669 $1,550 $1,558 $1,410A 134 47% 764 $2,162 $2,001 $1,744 $1,903 $1,650 $1,572B 106 37% 1134 $2,852 $3,076 $2,906 $2,909 $2,908 $2,476C 15 5% 1507 $3,940 $4,033 $3,900 $3,852 $4,038 $3,681
Total/Average 283 100% 919 $2,482 $2,497 $2,286 $2,348 $2,239 $2,006
$PSF $2.70 $2.72 $2.49 $2.56 $2.44 $2.18
Evanston Place Apartments
Unit Type Units %
Unit Avg
SF 11/11/2016 12/13/2016 2/13/2017 3/14/2017 4/12/2017 5/15/2017
S 16 8% 567 $1,743 $1,763 $1,788 $1,788A 129 68% 831 $2,009 $2,014 $2,126 $2,086B 41 22% 1101 $3,261 $3,287 $3,325 $3,322C 3 2% 1515 $3,751 $3,840 $3,912 $3,892
Total/Average 189 100% 878 $0 $0 $2,286 $2,298 $2,386 $2,358
$PSF $0.00 $0.00 $2.60 $2.62 $2.72 $2.68
EFFECTIVE RENTS
Albion at Evanston 5/16/2017
AMLI Evanston
Unit Type Units %
Unit Avg
SF 11/11/2016 12/13/2016 2/13/2017 3/14/2017 4/12/2017 5/15/2017
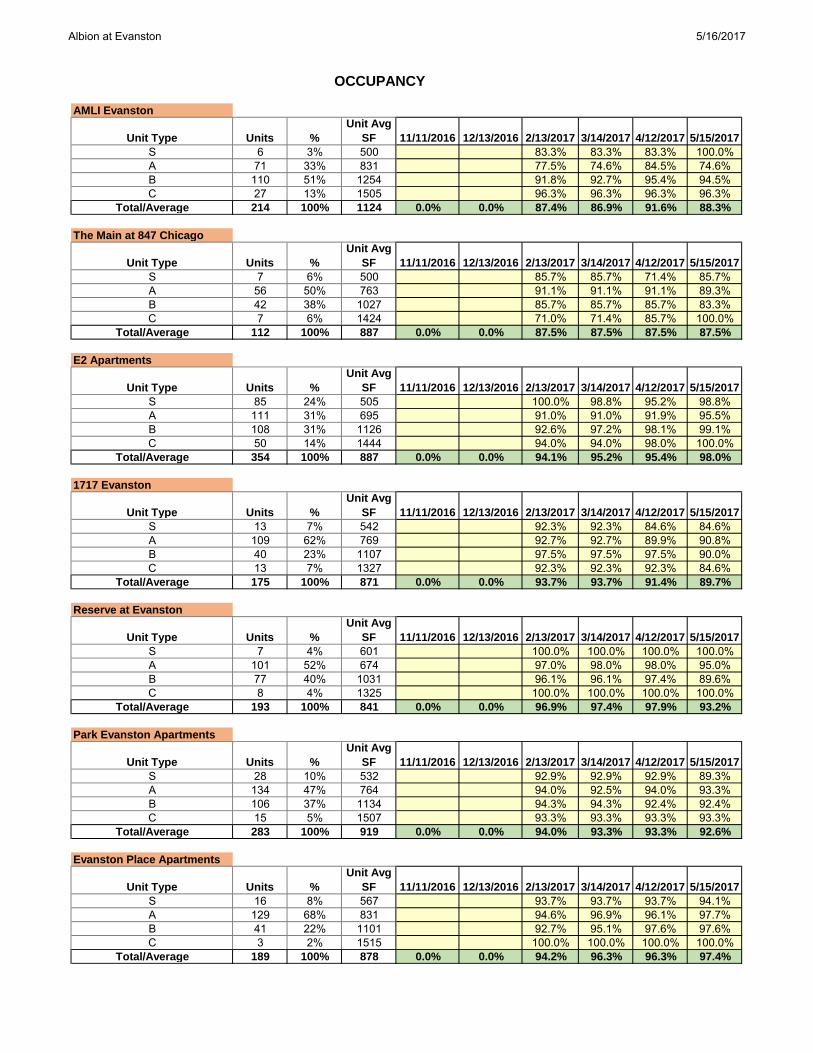
S 6 3% 500 83.3% 83.3% 83.3% 100.0%A 71 33% 831 77.5% 74.6% 84.5% 74.6%B 110 51% 1254 91.8% 92.7% 95.4% 94.5%C 27 13% 1505 96.3% 96.3% 96.3% 96.3%
Total/Average 214 100% 1124 0.0% 0.0% 87.4% 86.9% 91.6% 88.3%
The Main at 847 Chicago
Unit Type Units %
Unit Avg
SF 11/11/2016 12/13/2016 2/13/2017 3/14/2017 4/12/2017 5/15/2017
S 7 6% 500 85.7% 85.7% 71.4% 85.7%A 56 50% 763 91.1% 91.1% 91.1% 89.3%B 42 38% 1027 85.7% 85.7% 85.7% 83.3%C 7 6% 1424 71.0% 71.4% 85.7% 100.0%
Total/Average 112 100% 887 0.0% 0.0% 87.5% 87.5% 87.5% 87.5%
E2 Apartments
Unit Type Units %
Unit Avg
SF 11/11/2016 12/13/2016 2/13/2017 3/14/2017 4/12/2017 5/15/2017
S 85 24% 505 100.0% 98.8% 95.2% 98.8%A 111 31% 695 91.0% 91.0% 91.9% 95.5%B 108 31% 1126 92.6% 97.2% 98.1% 99.1%C 50 14% 1444 94.0% 94.0% 98.0% 100.0%
Total/Average 354 100% 887 0.0% 0.0% 94.1% 95.2% 95.4% 98.0%
1717 Evanston
Unit Type Units %
Unit Avg
SF 11/11/2016 12/13/2016 2/13/2017 3/14/2017 4/12/2017 5/15/2017
S 13 7% 542 92.3% 92.3% 84.6% 84.6%A 109 62% 769 92.7% 92.7% 89.9% 90.8%B 40 23% 1107 97.5% 97.5% 97.5% 90.0%C 13 7% 1327 92.3% 92.3% 92.3% 84.6%
Total/Average 175 100% 871 0.0% 0.0% 93.7% 93.7% 91.4% 89.7%
Reserve at Evanston
Unit Type Units %
Unit Avg
SF 11/11/2016 12/13/2016 2/13/2017 3/14/2017 4/12/2017 5/15/2017
S 7 4% 601 100.0% 100.0% 100.0% 100.0%A 101 52% 674 97.0% 98.0% 98.0% 95.0%B 77 40% 1031 96.1% 96.1% 97.4% 89.6%C 8 4% 1325 100.0% 100.0% 100.0% 100.0%
Total/Average 193 100% 841 0.0% 0.0% 96.9% 97.4% 97.9% 93.2%
Park Evanston Apartments
Unit Type Units %
Unit Avg
SF 11/11/2016 12/13/2016 2/13/2017 3/14/2017 4/12/2017 5/15/2017
S 28 10% 532 92.9% 92.9% 92.9% 89.3%A 134 47% 764 94.0% 92.5% 94.0% 93.3%B 106 37% 1134 94.3% 94.3% 92.4% 92.4%C 15 5% 1507 93.3% 93.3% 93.3% 93.3%
Total/Average 283 100% 919 0.0% 0.0% 94.0% 93.3% 93.3% 92.6%
Evanston Place Apartments
Unit Type Units %
Unit Avg
SF 11/11/2016 12/13/2016 2/13/2017 3/14/2017 4/12/2017 5/15/2017
S 16 8% 567 93.7% 93.7% 93.7% 94.1%A 129 68% 831 94.6% 96.9% 96.1% 97.7%B 41 22% 1101 92.7% 95.1% 97.6% 97.6%C 3 2% 1515 100.0% 100.0% 100.0% 100.0%
Total/Average 189 100% 878 0.0% 0.0% 94.2% 96.3% 96.3% 97.4%
OCCUPANCY

847 Chicago Ave
PREPARED BY
Kathleen Gummerson
Regional Sales & Marketing Director
Underwriting Report
The Main at 847 Chicago
112 Unit Apartment Building
Evanston, Illinois - Evanston Neighborhood

SUBJECT PROPERTY
Property Details 2
RENT COMPS
Map & List 7
Photo Comparison 9
Rent Comps Details 10
Unit Mix Summary 22
Ranking Chart By Bedroom 23
Changes in Rent Comps 27
Rent Trend Charts 29
Rent Trend Data 35
CONSTRUCTION
Overall Construction Map & Summary 37
Under Construction Map & List 38
Under Construction Details 40
Deliveries Past 12 Months Map & List 41
Delivered Property Details 43
Construction Summary 46
SALE COMPS
Map & List 52
Sale Comp Details 54
Sales Volume 64
Sales Pricing 65
Cap Rates 67
Top Buyers & Sellers 68
DEMOGRAPHICS
Overview 71
Age & Education 72
Ethnicity 73
SUBMARKET OVERVIEW
Evanston Overview 74
MARKET OVERVIEW
847 Chicago Ave - The Main at 847 Chicago
5/15/2017Copyrighted report licensed to Village Green - The Shelby - 775952.

847 Chicago Ave - The Main at 847 Chicago
Chicago Overview 93
5/15/2017Copyrighted report licensed to Village Green - The Shelby - 775952.

Subject Property
847 Chicago Ave - The Main at 847 ChicagoEvanston, Illinois - Evanston Neighborhood
PROPERTY MANAGERAtlantic Realty- The Main(847) 450-0115
PROPERTY
<1 Minute Walk
No. of Units: 112Stories: 9Avg. Unit Size: 887 SF
Year Built: Oct 2016Parking: -Distance to Transit:
Type: Apartments - AllRent Type: Market OWNER
Riverside Investment & Development Compa…
12 MONTH NET ABSORPTIONCurrent: 31 UnitsCompetitor Total: (6) UnitsCompetitor Avg: (1.1) UnitsSubmarket Total: 5 UnitsSubmarket Avg: 0.0 Units
ASKING RENTS PER UNIT/SF
$2.05 /SF$2.70 /SF$2.64 /SF
Current: $2,365 $2.67 /SFLast Quarter: $2,351 $2.65 /SFYear Ago: $2,340Competitors: $2,484Submarket: $1,663
VACANCY
400 Units79 Units-
Current: 72.3% 81 UnitsLast Quarter: 74.1% 83 UnitsYear Ago: -Competitors: 5.6%Submarket: 5.4%
UnitsBed Bath Avg SF Mix % Units Percent Per Unit Per SF Per Unit Per SF Concessions
Unit Mix Availability Avg Asking Rent Avg Effective Rent
UNIT BREAKDOWN
Studio 1 500 7 6.3% 1 14.3% $1,695 $3.39 $1,483 $2.97 12.5%
1 1 650 14 12.5% 2 14.3% $1,970 $3.03 $1,887 $2.90 4.2%
1 1 746 14 12.5% 1 7.1% $2,030 $2.72 $1,945 $2.61 4.2%
1 1 803 14 12.5% 1 7.1% $2,165 $2.70 $2,074 $2.58 4.2%
1 1 853 14 12.5% 2 14.3% $2,175 $2.55 $2,084 $2.44 4.2%
2 2 912 7 6.3% 2 28.6% $2,425 $2.66 $2,122 $2.33 12.5%
2 2 1,027 7 6.3% 1 14.3% $2,545 $2.48 $2,227 $2.17 12.5%
2 2 1,045 7 6.3% 1 14.3% $2,675 $2.56 $2,341 $2.24 12.5%
2 2 1,052 7 6.3% 1 14.3% $2,765 $2.63 $2,419 $2.30 12.5%
2 2 1,056 7 6.3% 1 14.3% $2,830 $2.68 $2,476 $2.34 12.5%
2 2 1,068 7 6.3% 1 14.3% $2,690 $2.52 $2,354 $2.20 12.5%
3 2 1,424 7 6.3% 0 0.0% $3,539 $2.49 $3,096 $2.17 12.5%
Totals Avg SF Units Mix % Units Percent Per Unit Per SF Per Unit Per SF Concessions
All Studios 500 7 6.3% 1 14.3% $1,695 $3.39 $1,483 $2.97 12.5%
All 1 Beds 763 56 50.0% 6 10.7% $2,085 $2.73 $1,998 $2.62 4.2%
All 2 Beds 1,027 42 37.5% 7 16.7% $2,655 $2.59 $2,323 $2.26 12.5%
All 3 Beds 1,424 7 6.3% 0 0.0% $3,539 $2.49 $3,096 $2.17 12.5%
Totals 887 112 100% 14 12.5% $2,365 $2.67 $2,156 $2.43 8.8%Updated May 15, 2017Estimate
5/15/2017Copyrighted report licensed to Village Green - The Shelby - 775952.
Page 2

Subject Property
SITE AMENITIES24 Hour Availability Elevator Fitness Center
UNIT AMENITIESAir Conditioning Tub/Shower Wheelchair Accessible (Rooms)
RECURRING EXPENSESDog Rent $20 Cat Rent $20 Unassigned Garage Parking …
ONE TIME EXPENSESDog Fee $300 Cat Fee $300 Admin Fee $500 Application Fee $50
PET POLICYCats Allowed - $0 Deposit, $20/Mo, 2 Maximum, One-Time Fee: $300Dogs Allowed - $0 Deposit, $20/Mo, 2 Maximum, Maximum Weight 60 lb, One-Time Fee: $300
5/15/2017Copyrighted report licensed to Village Green - The Shelby - 775952.
Page 3

Subject Property
BuidingPrimary
BuidingBuiding
5/15/2017Copyrighted report licensed to Village Green - The Shelby - 775952.
Page 4

Subject Property
BuidingBuiding
BuidingBuiding
5/15/2017Copyrighted report licensed to Village Green - The Shelby - 775952.
Page 5

847 Chicago Ave
PREPARED BY
Kathleen Gummerson
Regional Sales & Marketing Director
Rent Comparables
The Main at 847 Chicago
112 Unit Apartment Building
Evanston, Illinois - Evanston Neighborhood

Rent Comparables Summary847 Chicago Ave - The Main at 847 Chicago
No. Rent Comps
6Avg. Rent Per Unit
$2,484Avg. Rent Per SF
$2.70Avg. Vacancy Rate
5.6%RENT COMPS LOCATIONS
RENT COMPS SUMMARY STATISTICS
Unit Breakdown Low Average Median High
Total Units
Studio Units
One Bedroom Units
Two Bedroom Units
Three Bedroom Units
175
6
71
40
3
235
26
109
80
19
204
15
110
92
14
352
83
134
110
50
Property Attributes Low Average Median High
1990Year Built
Number of Floors
Average Unit Size
Vacancy Rate
Star Rating
4
841 SF
0.5%
2005
10
920 SF
5.6%
2008
8
883 SF
5.3%
2015
24
1,124 SF
9.8%
4.3
5/15/2017Copyrighted report licensed to Village Green - The Shelby - 775952.
Page 7

Rent Comparables Summary847 Chicago Ave - The Main at 847 Chicago
Property Name/Address Rating Yr Built Units Avg Unit SF Studio 1 Bed 2 Bed 3 Bed Rent/SF
Property Size Asking Rent Per Month Per Unit
-E2
352 888 $1,609 $2,425 $4,416 $3,907 $3.441890 Maple Ave
1 2015
-1717 Evanston
175 871 $1,672 $2,166 $2,710 $3,629 $2.711717 Ridge Ave
2 2013
-Evanston Place Apartments
190 876 $1,788 $2,086 $3,322 $3,892 $2.691715 Chicago Ave
3 1990
-The Main at 847 Chicago
112 886 $1,695 $2,085 $2,655 $3,539 $2.67847 Chicago Ave
2016
-Reserve at Evanston
193 840 $1,809 $1,882 $2,459 $3,975 $2.611930 Ridge Ave
4 2003
-AMLI Evanston
214 1,124 $1,583 $2,029 $2,865 $3,640 $2.36737 Chicago Ave
5 2013
-The Park Evanston Apart…
283 919 $1,410 $1,572 $2,476 $3,681 $2.181630 Chicago Ave
6 1997
5/15/2017Copyrighted report licensed to Village Green - The Shelby - 775952.
Page 8

Evanston Place1715 Chicago Ave190 Units / 9 Stories
Owner: AIMCORent/SF $2.69, Vacancy 0.5%
31717 Evanston1717 Ridge Ave175 Units / 8 Stories
Owner: -Rent/SF $2.71, Vacancy 4.0%
2E21890 Maple Ave352 Units / 16 Stories
Owner: Fifield Capital PartnersRent/SF $3.44, Vacancy 6.0%
1
AMLI Evanston737 Chicago Ave214 Units / 4 Stories
Owner: AMLI Residential Properties,…Rent/SF $2.36, Vacancy 9.8%
5Reserve at Evanston1930 Ridge Ave193 Units / 4 Stories
Owner: Barings Real Estate Adviser…Rent/SF $2.61, Vacancy 8.8%
4The Main at 847 Chicago847 Chicago Ave112 Units / 9 Stories
Owner: Riverside Investment &Rent/SF $2.67, Vacancy 72.3%
Subject Property
The Park Evanston1630 Chicago Ave283 Units / 24 Stories
Owner: TIAA-CREF Investment Man…Rent/SF $2.18, Vacancy 4.6%
6
Rent Comparables Photo Comparison847 Chicago Ave - The Main at 847 Chicago
5/15/2017Copyrighted report licensed to Village Green - The Shelby - 775952.
Page 9

Rent Comparables847 Chicago Ave - The Main at 847 Chicago
1 1890 Maple Ave - E2Evanston, Illinois - Evanston Neighborhood
PROPERTY MANAGERGreystar - E2(847) 733-1300
PROPERTY
1.3 Miles
Property Size: 352 Units, 16 FloorsAvg. Unit Size: 889 SFYear Built: Mar 2015Type: Apartments - AllRent Type:Parking: -Distance to Subject:Distance to Transit: 3 Minute Walk
MarketOWNER-
UnitsBed Bath Avg SF Mix % Units Percent Per Unit Per SF Per Unit Per SF Concessions
Unit Mix Availability Avg Asking Rent Avg Effective Rent
UNIT BREAKDOWN
Studio 1 504 78 22.2% 0 0.0% $1,608 $3.19 $1,608 $3.19 0.0%
Studio 1 508 3 0.9% 1 33.3% $1,613 $3.18 $1,613 $3.18 0.0%
Studio 1 542 2 0.6% 0 0.0% $1,643 $3.03 $1,643 $3.03 0.0%
1 1 606 5 1.4% 1 20.0% $1,910 $3.15 $1,910 $3.15 0.0%
1 1 616 4 1.1% 0 0.0% $1,940 $3.15 $1,940 $3.15 0.0%
1 1 661 2 0.6% 0 0.0% $1,643 $2.49 $1,643 $2.49 0.0%
1 1 700 92 26.1% 3 3.3% $2,516 $3.59 $2,516 $3.59 0.0%
1 1 723 2 0.6% 0 0.0% $1,993 $2.76 $1,993 $2.76 0.0%
1 1 740 2 0.6% 0 0.0% $2,398 $3.24 $2,398 $3.24 0.0%
1 1 748 2 0.6% 0 0.0% $2,058 $2.75 $2,058 $2.75 0.0%
1 1 758 2 0.6% 1 50.0% $2,078 $2.74 $2,078 $2.74 0.0%
2 1.5 1,078 2 0.6% 0 0.0% $2,740 $2.54 $2,740 $2.54 0.0%
2 2 1,010 2 0.6% 0 0.0% $3,027 $3.00 $3,027 $3.00 0.0%
2 2 1,030 2 0.6% 0 0.0% $2,860 $2.78 $2,860 $2.78 0.0%
2 2 1,111 2 0.6% 0 0.0% $2,955 $2.66 $2,955 $2.66 0.0%
2 2 1,125 92 26.1% 1 1.1% $4,657 $4.14 $4,657 $4.14 0.0%
2 2 1,175 2 0.6% 0 0.0% $3,205 $2.73 $3,205 $2.73 0.0%
2 2 1,196 2 0.6% 0 0.0% $3,110 $2.60 $3,110 $2.60 0.0%
2 2 1,211 2 0.6% 0 0.0% $3,135 $2.59 $3,135 $2.59 0.0%
2 2 1,220 2 0.6% 0 0.0% $3,195 $2.62 $3,195 $2.62 0.0%
3 2 1,391 43 12.2% 0 0.0% $3,857 $2.77 $3,857 $2.77 0.0%
3 2 1,464 1 0.3% 0 0.0% $4,042 $2.76 $4,042 $2.76 0.0%
3 2.5 1,770 3 0.9% 0 0.0% $4,118 $2.33 $4,118 $2.33 0.0%
3 3.5 1,876 3 0.9% 0 0.0% $4,368 $2.33 $4,368 $2.33 0.0%
5/15/2017Copyrighted report licensed to Village Green - The Shelby - 775952.
Page 10

Rent Comparables847 Chicago Ave - The Main at 847 Chicago
Totals Avg SF Units Mix % Units Percent Per Unit Per SF Per Unit Per SF Concessions
All Studios 505 83 23.6% 1 1.2% $1,609 $3.19 $1,609 $3.19 0.0%
All 1 Beds 695 111 31.5% 5 4.5% $2,425 $3.49 $2,425 $3.49 0.0%
All 2 Beds 1,126 108 30.7% 1 0.9% $4,416 $3.92 $4,416 $3.92 0.0%
All 3 Beds 1,444 50 14.2% 0 0.0% $3,907 $2.71 $3,907 $2.71 0.0%
Totals 889 352 100% 7 2.0% $3,054 $3.44 $3,054 $3.44 0.0%Updated May 15, 2017Estimate
SITE AMENITIESBasketball Court, Business Center, Clubhouse, Coffee Bar, Concierge, Controlled Access, Elevator, Fitness Center, Free Weights, Grill, LaundryFacilities, Lounge, Maintenance on site, Package Service, Pool, Property Manager on Site, Spa, Sundeck, Volleyball Court
UNIT AMENITIESAir Conditioning, Cable Ready, Dining Room, Dishwasher, Disposal, Hardwood Floors, Kitchen, Microwave, Stainless Steel Appliances, TileFloors, Tub/Shower, Walk-In Closets, Washer/Dryer, Wheelchair Accessible (Rooms)
RECURRING EXPENSESStorage Fee $50 Free Gas, Water, Trash Rem…
ONE TIME EXPENSESCat Deposit $500 Cat Fee $500 Admin Fee $400 Application Fee $50
PET POLICYCats Allowed - $500 Deposit, One-Time Fee: $500Dogs AllowedRestrictions: E2 welcomes your pets. Our homes accommodate two pets per home. Breed restrictions and weight limits apply. * Deposits: *Dogs: $500 non refundable deposit and $25 pet rent. * Cats: $250 non refundable deposit
5/15/2017Copyrighted report licensed to Village Green - The Shelby - 775952.
Page 11

Rent Comparables847 Chicago Ave - The Main at 847 Chicago
2 1717 Ridge Ave - 1717 EvanstonEvanston, Illinois - Evanston Neighborhood
PROPERTY MANAGERAtlantic Realty - 1717 Evanston(847) 328-1717
PROPERTY
1.2 Miles
Property Size: 175 Units, 8 FloorsAvg. Unit Size: 872 SFYear Built: Jul 2013Type: Apartments - AllRent Type:Parking: 200 Spaces; 1.1 per UnitDistance to Subject:Distance to Transit: 5 Minute Walk
Market/AffordableOWNERPurchased Sep 2013$70,250,000 ($401,429/Unit)
UnitsBed Bath Avg SF Mix % Units Percent Per Unit Per SF Per Unit Per SF Concessions
Unit Mix Availability Avg Asking Rent Avg Effective Rent
UNIT BREAKDOWN
Studio 1 531 7 4.0% 1 14.3% $1,700 $3.20 $1,693 $3.19 0.4%
Studio 1 575 6 3.4% 1 16.7% $1,640 $2.85 $1,633 $2.84 0.4%
1 1 559 1 0.6% 0 0.0% $1,730 $3.09 $1,719 $3.08 0.6%
1 1 621 1 0.6% 1 100% $1,599 $2.57 $1,590 $2.56 0.6%
1 1 656 10 5.7% 1 10.0% $2,474 $3.77 $2,459 $3.75 0.6%
1 1 670 1 0.6% 1 100% $1,894 $2.83 $1,882 $2.81 0.6%
1 1 681 10 5.7% 0 0.0% $2,135 $3.13 $2,122 $3.12 0.6%
1 1 707 1 0.6% 0 0.0% $1,579 $2.23 $1,570 $2.22 0.6%
1 1 714 5 2.9% 0 0.0% $1,768 $2.48 $1,757 $2.46 0.6%
1 1 722 1 0.6% 0 0.0% $2,051 $2.84 $2,039 $2.82 0.6%
1 1 728 5 2.9% 0 0.0% $1,798 $2.47 $1,788 $2.46 0.6%
1 1 751 5 2.9% 1 20.0% $1,919 $2.56 $1,908 $2.54 0.6%
1 1 755 1 0.6% 1 100% $1,953 $2.59 $1,941 $2.57 0.6%
1 1 766 5 2.9% 1 20.0% $1,888 $2.46 $1,877 $2.45 0.6%
1 1 771 1 0.6% 0 0.0% $2,347 $3.04 $2,334 $3.03 0.6%
1 1 786 11 6.3% 0 0.0% $2,368 $3.01 $2,354 $3.00 0.6%
1 1 795 11 6.3% 0 0.0% $2,237 $2.81 $2,224 $2.80 0.6%
1 1 799 13 7.4% 0 0.0% $2,460 $3.08 $2,446 $3.06 0.6%
1 1 819 4 2.3% 0 0.0% $2,323 $2.84 $2,309 $2.82 0.6%
1 1 821 2 1.1% 1 50.0% $2,143 $2.61 $2,130 $2.59 0.6%
1 1 831 2 1.1% 1 50.0% $1,849 $2.23 $1,838 $2.21 0.6%
1 1 833 6 3.4% 1 16.7% $1,995 $2.39 $1,983 $2.38 0.6%
1 1 838 6 3.4% 0 0.0% $2,083 $2.49 $2,071 $2.47 0.6%
1 1 851 2 1.1% 0 0.0% $2,338 $2.75 $2,324 $2.73 0.6%
1 1 902 1 0.6% 0 0.0% $2,117 $2.35 $2,105 $2.33 0.6%
1 1 933 2 1.1% 0 0.0% $2,192 $2.35 $2,179 $2.34 0.6%
1 1 991 2 1.1% 1 50.0% $2,233 $2.25 $2,220 $2.24 0.6%
2 2 987 6 3.4% 0 0.0% $2,156 $2.18 $2,148 $2.18 0.4%
2 2 1,006 9 5.1% 1 11.1% $2,526 $2.51 $2,516 $2.50 0.4%
2 2 1,137 6 3.4% 1 16.7% $2,788 $2.45 $2,777 $2.44 0.4%
2 2 1,173 6 3.4% 1 16.7% $2,898 $2.47 $2,887 $2.46 0.4%
5/15/2017Copyrighted report licensed to Village Green - The Shelby - 775952.
Page 12

Rent Comparables847 Chicago Ave - The Main at 847 Chicago
UnitsBed Bath Avg SF Mix % Units Percent Per Unit Per SF Per Unit Per SF Concessions
Unit Mix Availability Avg Asking Rent Avg Effective Rent
UNIT BREAKDOWN CONTINUED
2 2 1,179 6 3.4% 1 16.7% $2,858 $2.42 $2,847 $2.41 0.4%
2 2 1,189 1 0.6% 0 0.0% $2,837 $2.39 $2,826 $2.38 0.4%
2 2 1,200 6 3.4% 0 0.0% $3,105 $2.59 $3,093 $2.58 0.4%
3 2 1,239 6 3.4% 1 16.7% $3,413 $2.75 $3,385 $2.73 0.8%
3 2 1,367 6 3.4% 1 16.7% $3,776 $2.76 $3,745 $2.74 0.8%
3 2 1,609 1 0.6% 0 0.0% $4,045 $2.51 $4,011 $2.49 0.8%
Totals Avg SF Units Mix % Units Percent Per Unit Per SF Per Unit Per SF Concessions
All Studios 551 13 7.4% 2 15.4% $1,672 $3.03 $1,665 $3.02 0.4%
All 1 Beds 769 109 62.3% 10 9.2% $2,166 $2.82 $2,154 $2.80 0.6%
All 2 Beds 1,107 40 22.9% 4 10.0% $2,710 $2.45 $2,700 $2.44 0.4%
All 3 Beds 1,327 13 7.4% 2 15.4% $3,629 $2.74 $3,599 $2.71 0.8%
Totals 872 175 100% 18 10.3% $2,363 $2.71 $2,349 $2.70 0.6%Updated May 15, 2017Estimate
SITE AMENITIES24 Hour Availability, Business Center, Controlled Access, Elevator, Fitness Center, Free Weights, Guest Apartment, Laundry Facilities, LaundryService, Lounge, Maintenance on site, Package Service, Pool, Property Manager on Site, Storage Space, Sundeck
UNIT AMENITIESAir Conditioning, Cable Ready, Carpet, Den, Dining Room, Dishwasher, Disposal, Eat-in Kitchen, Fireplace, Heating, Kitchen, Loft Layout,Microwave, Range, Tub/Shower, Vinyl Flooring, Walk-In Closets, Washer/Dryer, Window Coverings
ONE TIME EXPENSESAdmin Fee $150 Application Fee $50
PET POLICYCats AllowedDogs AllowedRestrictions: 1717 welcomes pets. We do limit pets to up to two pets with a combined weight limit of 40 lbs.
5/15/2017Copyrighted report licensed to Village Green - The Shelby - 775952.
Page 13

Rent Comparables847 Chicago Ave - The Main at 847 Chicago
3 1715 Chicago Ave - Evanston Place ApartmentsEvanston, Illinois - Evanston Neighborhood
PROPERTY MANAGEROP - Evanston Place Apartments(847) 328-0644
PROPERTY
1.0 Miles
Property Size: 190 Units, 9 FloorsAvg. Unit Size: 876 SFYear Built: 1990Type: Apartments - AllRent Type:Parking: 500 Spaces; 2.6 per UnitDistance to Subject:Distance to Transit: 6 Minute Walk
MarketOWNER-
UnitsBed Bath Avg SF Mix % Units Percent Per Unit Per SF Per Unit Per SF Concessions
Unit Mix Availability Avg Asking Rent Avg Effective Rent
UNIT BREAKDOWN
Studio 1 567 17 8.9% 1 5.9% $1,788 $3.15 $1,788 $3.15 0.0%
1 1 657 11 5.8% 1 9.1% $1,904 $2.90 $1,904 $2.90 0.0%
1 1 757 18 9.5% 1 5.6% $1,980 $2.62 $1,980 $2.62 0.0%
1 1 768 2 1.1% 0 0.0% $1,981 $2.58 $1,981 $2.58 0.0%
1 1 812 20 10.5% 1 5.0% $2,113 $2.60 $2,113 $2.60 0.0%
1 1 835 20 10.5% 0 0.0% $2,089 $2.50 $2,089 $2.50 0.0%
1 1 878 20 10.5% 0 0.0% $2,144 $2.44 $2,144 $2.44 0.0%
1 1.5 852 20 10.5% 0 0.0% $2,054 $2.41 $2,054 $2.41 0.0%
1 1.5 958 18 9.5% 0 0.0% $2,254 $2.35 $2,254 $2.35 0.0%
2 1.5 958 2 1.1% 0 0.0% $2,819 $2.94 $2,819 $2.94 0.0%
2 2 966 10 5.3% 0 0.0% $2,899 $3.00 $2,899 $3.00 0.0%
2 2 1,034 8 4.2% 0 0.0% $2,919 $2.82 $2,919 $2.82 0.0%
2 2 1,064 2 1.1% 0 0.0% $3,286 $3.09 $3,286 $3.09 0.0%
2 2 1,216 10 5.3% 0 0.0% $3,709 $3.05 $3,709 $3.05 0.0%
2 2 1,221 9 4.7% 1 11.1% $3,838 $3.14 $3,838 $3.14 0.0%
3 2.5 1,968 1 0.5% 0 0.0% $5,094 $2.59 $5,094 $2.59 0.0%
3 3 1,289 2 1.1% 0 0.0% $3,291 $2.55 $3,291 $2.55 0.0%
Totals Avg SF Units Mix % Units Percent Per Unit Per SF Per Unit Per SF Concessions
All Studios 567 17 8.9% 1 5.9% $1,788 $3.15 $1,788 $3.15 0.0%
All 1 Beds 831 129 67.9% 3 2.3% $2,086 $2.51 $2,086 $2.51 0.0%
All 2 Beds 1,101 41 21.6% 1 2.4% $3,322 $3.02 $3,322 $3.02 0.0%
All 3 Beds 1,515 3 1.6% 0 0.0% $3,892 $2.57 $3,892 $2.57 0.0%
Totals 876 190 100% 5 2.6% $2,355 $2.69 $2,355 $2.69 0.0%Updated May 15, 2017Estimate
RECURRING EXPENSESDog Rent $20 Cat Rent $20 Assigned Garage Parking $70 Unassigned Garage Parking …
ONE TIME EXPENSESDog Fee $500 Cat Fee $500 Admin Fee $200 Application Fee $75
5/15/2017Copyrighted report licensed to Village Green - The Shelby - 775952.
Page 14

Rent Comparables847 Chicago Ave - The Main at 847 Chicago
PET POLICYCats Allowed - $20/Mo, 2 Maximum, Maximum Weight 300 lb, One-Time Fee: $500Dogs Allowed - $20/Mo, 2 Maximum, Maximum Weight 300 lb, One-Time Fee: $500Restrictions: Our pet-friendly apartments welcome most breeds of dogs. However, because certain dogs do not thrive in a communityenvironment, we cannot accommodate the following breeds, dogs resembling these breeds, or mixes of these breeds: Akita, AmericanStaffordshire Terrier, Bull Terrier, Chow, Doberman, German Shepherd, Husky, Pit Bull, Presa Canario, Rottweiler and Wolf Hybrid.
5/15/2017Copyrighted report licensed to Village Green - The Shelby - 775952.
Page 15

Rent Comparables847 Chicago Ave - The Main at 847 Chicago
4 1930 Ridge Ave - Reserve at EvanstonEvanston, Illinois - Evanston Neighborhood
PROPERTY MANAGERHabitat - Reserve at Evanston(847) 864-5900
PROPERTY
1.4 Miles
Property Size: 193 Units, 4 FloorsAvg. Unit Size: 841 SFYear Built: 2003Type: Apartments - AllRent Type:Parking: 20 Spaces; 0.1 per UnitDistance to Subject:Distance to Transit: 5 Minute Walk
Market/AffordableOWNERPurchased Jul 2011$55,625,000 ($288,212/Unit)
UnitsBed Bath Avg SF Mix % Units Percent Per Unit Per SF Per Unit Per SF Concessions
Unit Mix Availability Avg Asking Rent Avg Effective Rent
UNIT BREAKDOWN
Studio 1 550 3 1.6% 0 0.0% $1,777 $3.23 $1,761 $3.20 0.9%
Studio 1 640 4 2.1% 0 0.0% $1,834 $2.86 $1,817 $2.84 0.9%
1 1 575 15 7.8% 0 0.0% $1,993 $3.47 $1,993 $3.47 0.0%
1 1 630 15 7.8% 1 6.7% $1,607 $2.55 $1,607 $2.55 0.0%
1 1 645 14 7.3% 1 7.1% $1,850 $2.87 $1,850 $2.87 0.0%
1 1 675 14 7.3% 1 7.1% $1,814 $2.69 $1,814 $2.69 0.0%
1 1 705 14 7.3% 1 7.1% $1,957 $2.78 $1,957 $2.78 0.0%
1 1 715 15 7.8% 1 6.7% $1,899 $2.66 $1,899 $2.66 0.0%
1 1 780 14 7.3% 0 0.0% $2,066 $2.65 $2,066 $2.65 0.0%
2 1 870 7 3.6% 1 14.3% $2,241 $2.58 $2,241 $2.58 0.0%
2 1 890 7 3.6% 0 0.0% $2,235 $2.51 $2,235 $2.51 0.0%
2 2 1,010 7 3.6% 1 14.3% $2,433 $2.41 $2,433 $2.41 0.0%
2 2 1,015 7 3.6% 0 0.0% $2,096 $2.07 $2,096 $2.07 0.0%
2 2 1,040 7 3.6% 0 0.0% $2,473 $2.38 $2,473 $2.38 0.0%
2 2 1,050 7 3.6% 1 14.3% $2,584 $2.46 $2,584 $2.46 0.0%
2 2 1,080 7 3.6% 1 14.3% $2,580 $2.39 $2,580 $2.39 0.0%
2 2 1,090 8 4.1% 1 12.5% $2,408 $2.21 $2,408 $2.21 0.0%
2 2 1,100 20 10.4% 3 15.0% $2,678 $2.43 $2,678 $2.43 0.0%
3 2 1,205 4 2.1% 0 0.0% $3,955 $3.28 $3,919 $3.25 0.9%
3 2 1,445 4 2.1% 0 0.0% $3,994 $2.76 $3,958 $2.74 0.9%
Totals Avg SF Units Mix % Units Percent Per Unit Per SF Per Unit Per SF Concessions
All Studios 601 7 3.6% 0 0.0% $1,809 $3.01 $1,793 $2.98 0.9%
All 1 Beds 674 101 52.3% 5 5.0% $1,882 $2.79 $1,882 $2.79 0.0%
All 2 Beds 1,031 77 39.9% 8 10.4% $2,459 $2.38 $2,459 $2.38 0.0%
All 3 Beds 1,325 8 4.1% 0 0.0% $3,975 $3.00 $3,939 $2.97 0.9%
Totals 841 193 100% 13 6.7% $2,196 $2.61 $2,194 $2.61 0.1%Updated May 15, 2017Estimate
SITE AMENITIESBreakfast/Coffee Concierge, Business Center, Fitness Center, Grill, Laundry Facilities, Pool, Storage Space
5/15/2017Copyrighted report licensed to Village Green - The Shelby - 775952.
Page 16

Rent Comparables847 Chicago Ave - The Main at 847 Chicago
UNIT AMENITIESAir Conditioning, Cable Ready, Dishwasher, Disposal, Granite Countertops, Heating, High Speed Internet Access, Kitchen, Microwave, Oven,Walk-In Closets, Washer/Dryer
ONE TIME EXPENSESDog Fee $250 Cat Fee $250 Admin Fee $150 Application Fee $60
PET POLICYCats Allowed - 2 Maximum, Maximum Weight 75 lb, One-Time Fee: $250Dogs Allowed - 2 Maximum, Maximum Weight 75 lb, One-Time Fee: $250
5/15/2017Copyrighted report licensed to Village Green - The Shelby - 775952.
Page 17

Rent Comparables847 Chicago Ave - The Main at 847 Chicago
5 737 Chicago Ave - AMLI EvanstonEvanston, Illinois - Evanston Neighborhood
PROPERTY MANAGERAMLI Evanston(847) 440-9966
PROPERTY
0.1 Miles
Property Size: 214 Units, 4 FloorsAvg. Unit Size: 1,124 SFYear Built: Apr 2013Type: Apartments - AllRent Type:Parking: 250 Spaces; 1.2 per UnitDistance to Subject:Distance to Transit: 3 Minute Walk
MarketOWNER-
UnitsBed Bath Avg SF Mix % Units Percent Per Unit Per SF Per Unit Per SF Concessions
Unit Mix Availability Avg Asking Rent Avg Effective Rent
UNIT BREAKDOWN
Studio 1 500 6 2.8% 0 0.0% $1,583 $3.17 $1,583 $3.17 0.0%
1 1 632 3 1.4% 0 0.0% $1,746 $2.76 $1,746 $2.76 0.0%
1 1 652 3 1.4% 1 33.3% $1,917 $2.94 $1,917 $2.94 0.0%
1 1 705 3 1.4% 1 33.3% $2,035 $2.89 $2,035 $2.89 0.0%
1 1 732 3 1.4% 0 0.0% $1,821 $2.49 $1,821 $2.49 0.0%
1 1 742 3 1.4% 0 0.0% $1,938 $2.61 $1,938 $2.61 0.0%
1 1 759 3 1.4% 2 66.7% $1,962 $2.58 $1,962 $2.58 0.0%
1 1 762 3 1.4% 3 100% $1,958 $2.57 $1,958 $2.57 0.0%
1 1 769 3 1.4% 1 33.3% $1,969 $2.56 $1,969 $2.56 0.0%
1 1 773 3 1.4% 0 0.0% $1,930 $2.50 $1,930 $2.50 0.0%
1 1 785 4 1.9% 3 75.0% $1,971 $2.51 $1,971 $2.51 0.0%
1 1 796 4 1.9% 0 0.0% $1,890 $2.37 $1,890 $2.37 0.0%
1 1 800 4 1.9% 1 25.0% $2,094 $2.62 $2,094 $2.62 0.0%
1 1 809 4 1.9% 1 25.0% $2,101 $2.60 $2,101 $2.60 0.0%
1 1 810 4 1.9% 0 0.0% $1,810 $2.23 $1,810 $2.23 0.0%
1 1 829 4 1.9% 1 25.0% $2,084 $2.51 $2,084 $2.51 0.0%
1 1 888 4 1.9% 0 0.0% $1,991 $2.24 $1,991 $2.24 0.0%
1 1 922 2 0.9% 1 50.0% $2,255 $2.45 $2,255 $2.45 0.0%
1 1 924 2 0.9% 2 100% $1,809 $1.96 $1,809 $1.96 0.0%
1 1 932 4 1.9% 0 0.0% $2,138 $2.29 $2,138 $2.29 0.0%
1 1 1,053 4 1.9% 1 25.0% $2,450 $2.33 $2,450 $2.33 0.0%
1 1 1,237 4 1.9% 0 0.0% $2,497 $2.02 $2,497 $2.02 0.0%
2 1 1,000 6 2.8% 0 0.0% $2,240 $2.24 $2,240 $2.24 0.0%
2 2 1,064 12 5.6% 3 25.0% $2,577 $2.42 $2,577 $2.42 0.0%
2 2 1,163 6 2.8% 1 16.7% $2,990 $2.57 $2,990 $2.57 0.0%
2 2 1,170 6 2.8% 1 16.7% $2,801 $2.39 $2,801 $2.39 0.0%
2 2 1,200 22 10.3% 0 0.0% $2,650 $2.21 $2,650 $2.21 0.0%
2 2 1,261 8 3.7% 0 0.0% $2,783 $2.21 $2,783 $2.21 0.0%
2 2 1,262 10 4.7% 0 0.0% $2,530 $2.00 $2,530 $2.00 0.0%
2 2 1,274 10 4.7% 0 0.0% $2,521 $1.98 $2,521 $1.98 0.0%
2 2 1,278 10 4.7% 0 0.0% $3,090 $2.42 $3,090 $2.42 0.0%
5/15/2017Copyrighted report licensed to Village Green - The Shelby - 775952.
Page 18

Rent Comparables847 Chicago Ave - The Main at 847 Chicago
UnitsBed Bath Avg SF Mix % Units Percent Per Unit Per SF Per Unit Per SF Concessions
Unit Mix Availability Avg Asking Rent Avg Effective Rent
UNIT BREAKDOWN CONTINUED
2 2 1,460 10 4.7% 0 0.0% $3,369 $2.31 $3,369 $2.31 0.0%
2 2 1,590 10 4.7% 1 10.0% $4,040 $2.54 $4,040 $2.54 0.0%
3 2 1,462 14 6.5% 0 0.0% $3,683 $2.52 $3,683 $2.52 0.0%
3 2 1,542 5 2.3% 0 0.0% $3,305 $2.14 $3,305 $2.14 0.0%
3 2 1,557 8 3.7% 1 12.5% $3,773 $2.42 $3,773 $2.42 0.0%
Totals Avg SF Units Mix % Units Percent Per Unit Per SF Per Unit Per SF Concessions
All Studios 500 6 2.8% 0 0.0% $1,583 $3.17 $1,583 $3.17 0.0%
All 1 Beds 831 71 33.2% 18 25.4% $2,029 $2.44 $2,029 $2.44 0.0%
All 2 Beds 1,254 110 51.4% 6 5.5% $2,865 $2.29 $2,865 $2.29 0.0%
All 3 Beds 1,505 27 12.6% 1 3.7% $3,640 $2.42 $3,640 $2.42 0.0%
Totals 1,124 214 100% 25 11.7% $2,650 $2.36 $2,650 $2.36 0.0%Updated May 15, 2017Estimate
SITE AMENITIESEnergy Star Labeled, Fitness Center, Recycling
UNIT AMENITIESAir Conditioning, Fireplace, Granite Countertops, Heating, Lawn, Oven, Range, Stainless Steel Appliances, Washer/Dryer
ONE TIME EXPENSESAdmin Fee $400 Application Fee $50
PET POLICYCats AllowedDogs AllowedRestrictions: Max number of 2 pets per apartment. Dogs up to 75 lb. Some breed restrictions apply. One-time pet fee $350 upon move-in.Monthly $25 pet rent. Please contact office for details.
5/15/2017Copyrighted report licensed to Village Green - The Shelby - 775952.
Page 19

Rent Comparables847 Chicago Ave - The Main at 847 Chicago
6 1630 Chicago Ave - The Park Evanston ApartmentsEvanston, Illinois - Evanston Neighborhood
PROPERTY MANAGERLincoln - The Park Evanston Apartments(847) 733-1630
PROPERTY
0.9 Miles
Property Size: 283 Units, 24 FloorsAvg. Unit Size: 919 SFYear Built: 1997Type: Apartments - AllRent Type:Parking: 296 Spaces; 1.0 per UnitDistance to Subject:Distance to Transit: 4 Minute Walk
MarketOWNERPurchased Jan 2008$101,125,000 ($357,332/Unit)
UnitsBed Bath Avg SF Mix % Units Percent Per Unit Per SF Per Unit Per SF Concessions
Unit Mix Availability Avg Asking Rent Avg Effective Rent
UNIT BREAKDOWN
Studio 1 514 1 0.4% 0 0.0% $1,425 $2.77 $1,425 $2.77 0.0%
Studio 1 531 14 4.9% 3 21.4% $1,421 $2.68 $1,421 $2.68 0.0%
Studio 1 535 13 4.6% 0 0.0% $1,397 $2.61 $1,397 $2.61 0.0%
1 1 589 2 0.7% 0 0.0% $1,405 $2.39 $1,405 $2.39 0.0%
1 1 599 23 8.1% 1 4.4% $1,380 $2.30 $1,380 $2.30 0.0%
1 1 690 13 4.6% 1 7.7% $1,443 $2.09 $1,443 $2.09 0.0%
1 1 708 15 5.3% 1 6.7% $1,587 $2.24 $1,587 $2.24 0.0%
1 1 737 14 4.9% 1 7.1% $1,441 $1.96 $1,441 $1.96 0.0%
1 1 754 21 7.4% 1 4.8% $1,462 $1.94 $1,462 $1.94 0.0%
1 1 764 2 0.7% 1 50.0% $1,463 $1.91 $1,463 $1.91 0.0%
1 1 769 2 0.7% 1 50.0% $1,522 $1.98 $1,522 $1.98 0.0%
1 1 795 23 8.1% 1 4.4% $1,499 $1.89 $1,499 $1.89 0.0%
1 1.5 1,071 19 6.7% 1 5.3% $2,225 $2.08 $2,225 $2.08 0.0%
2 1.5 1,017 7 2.5% 0 0.0% $1,975 $1.94 $1,975 $1.94 0.0%
2 2 1,092 12 4.2% 1 8.3% $2,543 $2.33 $2,543 $2.33 0.0%
2 2 1,098 23 8.1% 2 8.7% $2,568 $2.34 $2,568 $2.34 0.0%
2 2 1,116 21 7.4% 1 4.8% $2,407 $2.16 $2,407 $2.16 0.0%
2 2 1,143 14 4.9% 1 7.1% $2,318 $2.03 $2,318 $2.03 0.0%
2 2 1,149 15 5.3% 1 6.7% $2,369 $2.06 $2,369 $2.06 0.0%
2 2 1,266 7 2.5% 1 14.3% $2,520 $1.99 $2,520 $1.99 0.0%
2 2 1,315 7 2.5% 1 14.3% $3,269 $2.49 $3,269 $2.49 0.0%
3 2.5 1,434 7 2.5% 1 14.3% $3,761 $2.62 $3,761 $2.62 0.0%
3 2.5 1,571 8 2.8% 0 0.0% $3,611 $2.30 $3,611 $2.30 0.0%
5/15/2017Copyrighted report licensed to Village Green - The Shelby - 775952.
Page 20

Rent Comparables847 Chicago Ave - The Main at 847 Chicago
Totals Avg SF Units Mix % Units Percent Per Unit Per SF Per Unit Per SF Concessions
All Studios 532 28 9.9% 3 10.7% $1,410 $2.65 $1,410 $2.65 0.0%
All 1 Beds 764 134 47.3% 9 6.7% $1,572 $2.06 $1,572 $2.06 0.0%
All 2 Beds 1,134 106 37.5% 8 7.6% $2,476 $2.18 $2,476 $2.18 0.0%
All 3 Beds 1,507 15 5.3% 1 6.7% $3,681 $2.44 $3,681 $2.44 0.0%
Totals 919 283 100% 21 7.4% $2,007 $2.18 $2,007 $2.18 0.0%Updated May 15, 2017Estimate
SITE AMENITIESBusiness Center, Cardio Machines, Fitness Center, Guest Apartment, Laundry Facilities, Pool, Weight Machines
UNIT AMENITIESAir Conditioning, Dishwasher, Microwave, Walk-In Closets, Washer/Dryer
RECURRING EXPENSESDog Rent $0 Unassigned Garage Parking … Storage Fee $30 Free Trash Removal
ONE TIME EXPENSESCat Fee $250 Application Fee $50
PET POLICYCats Allowed - 2 Maximum, One-Time Fee: $250Dogs Allowed - $0 Deposit, $0/Mo, One-Time Fee: $0
5/15/2017Copyrighted report licensed to Village Green - The Shelby - 775952.
Page 21

Rent Comparables by Bedroom847 Chicago Ave - The Main at 847 Chicago
Studio Comps
$1,606One Bed Comps
$2,014Two Bed Comps
$3,088Three Bed Comps
$3,789Subject
$1,695Subject
$2,085Subject
$2,655Subject
$3,539
1 Bedroom 2 Bedroom 3 BedroomCurrent Conditions in Rent Comps Studio
Total Number of Units 154 655 482 116
Vacancy Rate 6.6% 5.0% 5.9% 7.0%
Asking Rent Per Unit $1,606 $2,014 $3,088 $3,789
Asking Rent Per SF $3.06 $2.65 $2.71 $2.62
Effective Rents Per Unit $1,605 $2,012 $3,087 $3,783
Effective Rents Per SF $3.06 $2.65 $2.71 $2.61
Concessions 0.1% 0.1% 0.0% 0.2%Changes Past Year in Rent Comps Studio 1 Bedroom 2 Bedroom 3 Bedroom
Year-Over-Year Effective Rent Growth -5.6% -3.1% 0.6% -0.7%
Year-Over-Year Vacancy Rate Change
12 Month Net Absorption in Units
0.1%
1
1.5%
-8 -3
1.7% 0.3%
4
EXISTING UNITS VACANT UNITS
ASKING RENT PER UNIT PER MONTH 12 MONTH NET ABSORPTION IN UNITS
5/15/2017Copyrighted report licensed to Village Green - The Shelby - 775952.
Page 22

Studio Rent Comparables847 Chicago Ave - The Main at 847 Chicago
Property Name/Address Rating Studio Rent Per Unit YearQuarterRent/SF
Change in Rent
1930 Ridge AveReserve at Evanston
10.7%2.6%$3.01$1,809
$1,776 $1,833
1715 Chicago AveEvanston Place Apartments
-3.6%1.4%$3.15$1,788
847 Chicago AveThe Main at 847 Chicago
20.6%0.0%$3.39$1,695
1717 Ridge Ave1717 Evanston
-1.5%6.9%$3.03$1,672
$1,640 $1,700
1890 Maple AveE2
-4.6%-8.8%$3.19$1,609
$1,608 $1,643
737 Chicago AveAMLI Evanston
0.0%-2.3%$3.17$1,583
1630 Chicago AveThe Park Evanston Apartments
-19.4%-0.9%$2.65$1,410
$1,397 $1,425
$600 $1,100 $1,600 $2,100 $2,600
5/15/2017Copyrighted report licensed to Village Green - The Shelby - 775952.
Page 23

One Bedroom Rent Comparables847 Chicago Ave - The Main at 847 Chicago
Property Name/Address Rating One Bedroom Rent Per Unit YearQuarterRent/SF
Change in Rent
1890 Maple AveE2
4.9%0.8%$3.49$2,425
$1,643 $2,516
1717 Ridge Ave1717 Evanston
-0.2%-1.4%$2.82$2,166
$1,579 $2,474
1715 Chicago AveEvanston Place Apartments
-6.4%0.5%$2.51$2,086
$1,904 $2,254
847 Chicago AveThe Main at 847 Chicago
0.7%1.1%$2.73$2,085
$1,970 $2,175
737 Chicago AveAMLI Evanston
4.3%2.8%$2.44$2,029
$1,746 $2,497
1930 Ridge AveReserve at Evanston
4.6%6.9%$2.79$1,882
$1,607 $2,065
1630 Chicago AveThe Park Evanston Apartments
-19.7%-9.7%$2.06$1,572
$1,380 $2,225
$500 $1,250 $2,000 $2,750 $3,500
5/15/2017Copyrighted report licensed to Village Green - The Shelby - 775952.
Page 24

Two Bedroom Rent Comparables847 Chicago Ave - The Main at 847 Chicago
Property Name/Address Rating Two Bedroom Rent Per Unit YearQuarterRent/SF
Change in Rent
1890 Maple AveE2
9.2%73.0%$3.92$4,416
$2,740 $4,657
1715 Chicago AveEvanston Place Apartments
-8.2%0.3%$3.02$3,322
$2,819 $3,838
737 Chicago AveAMLI Evanston
0.0%1.3%$2.29$2,865
$2,240 $4,040
1717 Ridge Ave1717 Evanston
-3.7%-1.5%$2.45$2,710
$2,156 $3,105
847 Chicago AveThe Main at 847 Chicago
-0.4%0.3%$2.59$2,655
$2,425 $2,830
1630 Chicago AveThe Park Evanston Apartments
-11.7%-14.8%$2.18$2,476
$1,975 $3,269
1930 Ridge AveReserve at Evanston
8.6%0.8%$2.38$2,459
$2,096 $2,677
$1,000 $2,250 $3,500 $4,750 $6,000
5/15/2017Copyrighted report licensed to Village Green - The Shelby - 775952.
Page 25

Three Bedroom Rent Comparables847 Chicago Ave - The Main at 847 Chicago
Property Name/Address Rating Three Bedroom Rent Per Unit YearQuarterRent/SF
Change in Rent
1930 Ridge AveReserve at Evanston
10.9%2.6%$3.00$3,975
$3,955 $3,994
1890 Maple AveE2
-7.7%1.6%$2.71$3,907
$3,857 $4,368
1715 Chicago AveEvanston Place Apartments
-2.3%0.3%$2.57$3,892
$3,291 $5,094
1630 Chicago AveThe Park Evanston Apartments
-6.2%-5.0%$2.44$3,681
$3,611 $3,761
737 Chicago AveAMLI Evanston
5.7%2.6%$2.42$3,640
$3,305 $3,773
1717 Ridge Ave1717 Evanston
17.0%2.3%$2.74$3,629
$3,413 $4,045
847 Chicago AveThe Main at 847 Chicago
1.6%0.1%$2.49$3,539
$3,538
$2,500 $3,375 $4,250 $5,125 $6,000
5/15/2017Copyrighted report licensed to Village Green - The Shelby - 775952.
Page 26

Changes in Rent Comparables847 Chicago Ave - The Main at 847 Chicago
VACANCY CHANGES PAST QUARTER & YEAR
Past QtrLast YearLast QtrNow
Vacancy Levels Change
Property Name - Address Rating Units Past Year
3.9% 0.7%-0.6%3.2%175 4.5%1717 Evanston - 1717 Ridge Ave
0.5% -2.5%-0.2%3.0%190 0.7%Evanston Place Apartments - 1715 Chicago Ave
8.7% 4.9%-0.1%3.8%193 8.8%Reserve at Evanston - 1930 Ridge Ave
5.9% -3.3%0%9.2%352 5.9%E2 - 1890 Maple Ave
4.6% 3.5%0%1.1%283 4.6%The Park Evanston Apartments - 1630 Chicago …
9.8% 6.8%0%3.0%214 9.8%AMLI Evanston - 737 Chicago Ave
ASKING RENT CHANGES PAST QUARTER & YEAR - STUDIO
Past QtrLast YearLast QtrNow
Rents Levels Change
Property Name - Address Rating Units Past Year
$1,609 -4.6%-8.8%$1,68683 $1,764E2 - 1890 Maple Ave
$1,583 0%-2.3%$1,5836 $1,620AMLI Evanston - 737 Chicago Ave
$1,410 -19.4%-0.9%$1,74928 $1,423The Park Evanston Apartments - 1630 Chicago …
$1,788 -3.6%1.4%$1,85417 $1,763Evanston Place Apartments - 1715 Chicago Ave
$1,809 10.7%2.6%$1,6347 $1,764Reserve at Evanston - 1930 Ridge Ave
$1,672 -1.5%6.9%$1,69713 $1,5641717 Evanston - 1717 Ridge Ave
ASKING RENT CHANGES PAST QUARTER & YEAR - ONE BEDROOM
Past QtrLast YearLast QtrNow
Rents Levels Change
Property Name - Address Rating Units Past Year
$1,572 -19.7%-9.7%$1,958134 $1,741The Park Evanston Apartments - 1630 Chicago …
$2,166 -0.2%-1.3%$2,171109 $2,1961717 Evanston - 1717 Ridge Ave
$2,086 -6.4%0.5%$2,230129 $2,075Evanston Place Apartments - 1715 Chicago Ave
$2,425 4.9%0.8%$2,312111 $2,404E2 - 1890 Maple Ave
$2,029 4.3%2.8%$1,94571 $1,974AMLI Evanston - 737 Chicago Ave
$1,882 4.6%6.9%$1,799101 $1,761Reserve at Evanston - 1930 Ridge Ave
5/15/2017Copyrighted report licensed to Village Green - The Shelby - 775952.
Page 27

Changes in Rent Comparables847 Chicago Ave - The Main at 847 Chicago
ASKING RENT CHANGES PAST QUARTER & YEAR - TWO BEDROOM
Past QtrLast YearLast QtrNow
Rents Levels Change
Property Name - Address Rating Units Past Year
$2,476 -11.7%-14.8%$2,804106 $2,907The Park Evanston Apartments - 1630 Chicago …
$2,710 -3.7%-1.5%$2,81540 $2,7501717 Evanston - 1717 Ridge Ave
$3,322 -8.2%0.3%$3,61741 $3,312Evanston Place Apartments - 1715 Chicago Ave
$2,459 8.6%0.8%$2,26377 $2,438Reserve at Evanston - 1930 Ridge Ave
$2,865 0%1.3%$2,866110 $2,829AMLI Evanston - 737 Chicago Ave
$4,416 9.2%73.0%$4,045108 $2,552E2 - 1890 Maple Ave
ASKING RENT CHANGES PAST QUARTER & YEAR - THREE BEDROOM
Past QtrLast YearLast QtrNow
Rents Levels Change
Property Name - Address Rating Units Past Year
$3,681 -6.1%-5.0%$3,92215 $3,876The Park Evanston Apartments - 1630 Chicago …
$3,892 -2.3%0.3%$3,9833 $3,882Evanston Place Apartments - 1715 Chicago Ave
$3,907 -7.7%1.6%$4,23450 $3,846E2 - 1890 Maple Ave
$3,629 17.0%2.3%$3,10213 $3,5471717 Evanston - 1717 Ridge Ave
$3,975 10.9%2.6%$3,5868 $3,875Reserve at Evanston - 1930 Ridge Ave
$3,640 5.7%2.6%$3,44227 $3,547AMLI Evanston - 737 Chicago Ave
5/15/2017Copyrighted report licensed to Village Green - The Shelby - 775952.
Page 28

Rent Trends847 Chicago Ave - The Main at 847 Chicago
PROPERTY ATTRIBUTES The Main at 847 Chicago Rent Comps Evanston 3-5 Star Chicago 3-5 Star
Existing Units 6,100 449,665
Building Rating
Under Construction as % of Inventory - 2.4% 4.6%
1,407112
-
3.23.24.3
UNIT MIX The Main at 847 Chicago Rent Comps Evanston 3-5 Star Chicago 3-5 Star
Studio - 1 Bath 6% 11% 13% 10%
1 Bedroom - 1 Bath 50% 43% 33% 32%
2 Bedroom - 2 Bath 38% 32% 15% 11%
3 Bedroom - 2 Bath 6% 7% 4% 3%
ASKING RENTS PER SF The Main at 847 Chicago Rent Comps Evanston 3-5 Star Chicago 3-5 Star
Studio - 1 Bath $3.39 $3.06 $2.55 $2.51
1 Bedroom - 1 Bath $2.73 $2.70 $2.19 $1.80
2 Bedroom - 2 Bath $2.59 $2.73 $2.60 $1.69
3 Bedroom - 2 Bath $2.49 $2.68 $2.33 $1.52
Concessions 8.8% 0.1% 0.6% 1.7%
AVERAGE EFFECTIVE RENT GROWTH The Main at 847 Chicago Rent Comps Evanston 3-5 Star Chicago 3-5 Star
Current Quarter -1.7% 4.4% 1.9% 1.4%
1 Year Rent Growth - -1.4% 0.8% 2.9%
3 Year Rent Growth - 21.0% 15.2% 14.2%
5 Year Rent Growth - 21.5% 20.6% 23.1%
All-Time Average - 2.3% 2.2% 2.4%
Vacancy Rate The Main at 847 Chicago Rent Comps Evanston 3-5 Star Chicago 3-5 Star
Current Quarter 72.3% 5.6% 5.9% 6.5%
Last Quarter 74.1% 5.8% 6.1% 6.7%
1 Year Ago - 4.3% 3.7% 6.2%
3 Years Ago - 7.0% 5.4% 5.3%
5 Years Ago - 7.6% 5.7% 6.0%
5/15/2017Copyrighted report licensed to Village Green - The Shelby - 775952.
Page 29

Rent Trends847 Chicago Ave - The Main at 847 Chicago
STUDIO ASKING RENT PER SQUARE FOOT
ONE BEDROOM ASKING RENT PER SQUARE FOOT
5/15/2017Copyrighted report licensed to Village Green - The Shelby - 775952.
Page 30

Rent Trends847 Chicago Ave - The Main at 847 Chicago
TWO BEDROOM ASKING RENT PER SQUARE FOOT
THREE BEDROOM ASKING RENT PER SQUARE FOOT
5/15/2017Copyrighted report licensed to Village Green - The Shelby - 775952.
Page 31

Rent Trends847 Chicago Ave - The Main at 847 Chicago
OVERALL ASKING RENT PER SQUARE FOOT
OVERALL EFFECTIVE RENT PER SQUARE FOOT
5/15/2017Copyrighted report licensed to Village Green - The Shelby - 775952.
Page 32

Rent Trends847 Chicago Ave - The Main at 847 Chicago
ANNUAL EFFECTIVE RENT GROWTH
CONCESSIONS
5/15/2017Copyrighted report licensed to Village Green - The Shelby - 775952.
Page 33

Rent Trends847 Chicago Ave - The Main at 847 Chicago
VACANCY RATES
OCCUPANCY RATES
5/15/2017Copyrighted report licensed to Village Green - The Shelby - 775952.
Page 34

Rent Trends847 Chicago Ave - The Main at 847 Chicago
RENT COMPARABLES HISTORICAL DATA BY YEAR
RENT COMPARABLES HISTORICAL DATA BY QUARTER PAST 3 YEARS
Rental Rates Per SF Vacancy
Year Units EffectiveAsking Growth Concessions Units Percent Change Net Absorption
2017 1,407 $2.70 -1.1% 0.1% 79 5.6% 0.4% 2$2.70
2016 1,407 $2.73 12.1% 0.2% 74 5.3% -1.0% (18)$2.73
2015 1,407 $2.43 9.0% 0.6% 88 6.3% 1.0% 10$2.45
2014 1,055 $2.23 0.2% 0.0% 55 5.3% -11.1% (22)$2.23
2013 1,055 $2.23 5.4% 0.5% 172 16.3% 10.2% 62$2.24
2012 666 $2.11 -2.7% 3.5% 41 6.1% 0.5% 3$2.19
2011 666 $2.17 1.4% 0.6% 37 5.6% -0.2% 1$2.18
2010 666 $2.14 0.8% 0.6% 39 5.8% -1.1% 2$2.15
2009 666 $2.12 -3.0% 0.7% 46 6.9% 1.0% 0$2.14
2008 666 $2.19 2.1% 0.6% 40 6.0% -0.3% 0$2.20
Rental Rates Per SF Vacancy
Quarter Units EffectiveAsking Growth Concessions Units Percent Change Net Absorption
2017 Q2 1,407 $2.70 4.4% 0.1% 79 5.6% -0.1% 2$2.70
2017 Q1 1,407 $2.58 -5.3% 0.1% 81 5.8% 0.5% (7)$2.59
2016 Q4 1,407 $2.73 -1.4% 0.2% 74 5.3% 1.3% (18)$2.73
2016 Q3 1,407 $2.77 1.1% 0.2% 57 4.0% -0.3% 4$2.77
2016 Q2 1,407 $2.74 7.0% 0.4% 61 4.3% -0.9% 12$2.75
2016 Q1 1,407 $2.56 5.1% 0.5% 73 5.2% -1.1% 15$2.57
2015 Q4 1,407 $2.43 3.0% 0.6% 88 6.3% -0.7% 10$2.45
2015 Q3 1,407 $2.36 -3.0% 1.6% 98 7.0% -15.3% 215$2.40
2015 Q2 1,407 $2.43 2.8% 0.9% 313 22.3% -2.3% 32$2.45
2015 Q1 1,407 $2.37 6.0% 0.4% 345 24.6% 19.3% 62$2.38
2014 Q4 1,055 $2.23 0.9% 0.0% 55 5.3% 2.0% (22)$2.23
2014 Q3 1,055 $2.21 -0.7% 0.0% 34 3.2% -3.7% 40$2.21
5/15/2017Copyrighted report licensed to Village Green - The Shelby - 775952.
Page 35

847 Chicago Ave
PREPARED BY
Kathleen Gummerson
Regional Sales & Marketing Director
Construction Survey
The Main at 847 Chicago
112 Unit Apartment Building
Evanston, Illinois - Evanston Neighborhood

Overall Construction Summary847 Chicago Ave - The Main at 847 Chicago
All-Time Annual Average
120Delivered Past 4 Quarters
112Deliveries Next 4 Quarters
148Proposed Next 4 Quarters
665MAP OF 12 MONTH DELIVERIES, UNDER CONSTRUCTION, PROPOSED
PAST AND FUTURE DELIVERIES
5/15/2017Copyrighted report licensed to Village Green - The Shelby - 775952.
Page 37

Under Construction Properties847 Chicago Ave - The Main at 847 Chicago
Properties
2Units
148Percent Of Inventory
0.5%Avg. No. Units
74UNDER CONSTRUCTION PROPERTIES
UNDER CONSTRUCTION SUMMARY STATISTICS
MedianLow Average High
Property Size in Units 47
Number of Stories
Average Unit Size
Star Rating
4
1,088 SF
74
8
1,088 SF
74
8
1,088 SF
101
12
1,088 SF
Estimated Delivery Date Jun 2017 Jun 2017 Jun 2017 Jun 2017
Months to Delivery 1 1 1 1
Construction Period in Months 12 15 16 19
5/15/2017Copyrighted report licensed to Village Green - The Shelby - 775952.
Page 38

Under Construction Properties847 Chicago Ave - The Main at 847 Chicago
COMPLETIONS WITHIN NEXT 3 MONTHS
Property Name/Address Rating Units Stories Start Complete Developer/Owner
Jun-20161571 Maple AveCentrum Evanston
101 12 Jun-2017Condor PartnersCentrum Partners LLC
1
Nov-20151620 Central St1620 Central
47 4 Jun-2017McHugh Homes, Inc.Real Capital Solutions, Inc.
2
5/15/2017Copyrighted report licensed to Village Green - The Shelby - 775952.
Page 39

Under Construction Properties847 Chicago Ave - The Main at 847 Chicago
1 1571 Maple Ave - Centrum EvanstonEvanston, Illinois - Evanston Neighborhood
CONSTRUCTION INFOStart Date: Jun-2016Completion Date: Jun-2017Build Time: 12 MonthsTime to Delivery: 1 Month
PROPERTYProperty Size: 101 UnitsStories: 12Average Unit Size: -Rent Type: Market
OWNERCentrum Partners LLC
DEVELOPERCondor Partners
SITE AMENITIESFitness Center, Lounge
UNIT AMENITIESHeating, Kitchen, Range
2 1620 Central St - 1620 CentralEvanston, Illinois - Evanston Neighborhood
CONSTRUCTION INFOStart Date: Nov-2015Completion Date: Jun-2017Build Time: 19 MonthsTime to Delivery: 1 Month
PROPERTYProperty Size: 47 UnitsStories: 4Average Unit Size: 1,088 SFRent Type: Market
OWNERReal Capital Solutions, Inc.
DEVELOPERMcHugh Homes, Inc.
UNIT AMENITIESGranite Countertops, Tub/Shower, Vaulted Ceiling, Washer/Dryer
5/15/2017Copyrighted report licensed to Village Green - The Shelby - 775952.
Page 40

Deliveries Past 12 Months Summary847 Chicago Ave - The Main at 847 Chicago
Properties
2Units
124Vacancy Rate
65.3%Avg. Asking Rent/Unit
$2,386DELIVERIES IN PAST 12 MONTHS
DELIVERIES PAST 12 MONTHS SUMMARY STATISTICSUnit Mix Low Average Median High
Property Size in Units 12 62 62 112Studio Units 7 7 7 7One Bedroom Units 56 56 56 56Two Bedroom Units 42 42 42 42Three Bedroom Units 7 10 10 12Property Attributes Low Average Median High
Number of Stories 3 6 6 9Average Unit Size 886 1,058 1,058 1,230Rating 3.0
Leasing Performance Low Average Median High
Vacancy Rate 8.3% 65.3% 39.9% 71.4%Asking Rent Per Unit $2,365 $2,386 $2,471 $2,576Effective Rent Per Unit $2,156 $2,193 $2,346 $2,536Asking Rent Per SF $2.10 $2.59 $2.38 $2.67Effective Rent Per SF $2.06 $2.38 $2.25 $2.43Concessions 1.5% 5.6% 5.6% 9.7%
5/15/2017Copyrighted report licensed to Village Green - The Shelby - 775952.
Page 41

Deliveries Past 12 Months Summary847 Chicago Ave - The Main at 847 Chicago
Property Name/Address Rating Units Stories Start Complete Developer/Owner
Nov-151301-1325 W Devon Ave
12 3 Jun-16Three Corners DevelopmentMadison Constuction
1
Jun-15847 Chicago AveThe Main at 847 Chicago
112 9 Oct-16Riverside Investment & Developmen…Riverside Investment & Developmen…
5/15/2017Copyrighted report licensed to Village Green - The Shelby - 775952.
Page 42

Deliveries Past 12 Months847 Chicago Ave - The Main at 847 Chicago
1 1301-1325 W Devon AveChicago, Illinois - Edgewater Neighborhood
PROPERTY MANAGERLelyn Group, The, Inc - Unnamed 12 Unit Co…-
PROPERTY
2.6 Miles
Property Size: 12 Units, 3 FloorsAvg. Unit Size: 1,230 SFYear Built: Jun 2016Type: Apartments - AllRent Type:Parking: 12 Spaces; 1.0 per UnitDistance to Subject:Distance to Transit: 5 Minute Walk
MarketOWNER-
UnitsBed Bath Avg SF Mix % Units Percent Per Unit Per SF Per Unit Per SF Concessions
Unit Mix Availability Avg Asking Rent Avg Effective Rent
UNIT BREAKDOWN
3 2 1,230 12 100% 1 8.3% $2,576 $2.09 $2,536 $2.06 1.5%
Totals Avg SF Units Mix % Units Percent Per Unit Per SF Per Unit Per SF Concessions
All 3 Beds 1,230 12 100% 1 8.3% $2,576 $2.09 $2,536 $2.06 1.5%
Totals 1,230 12 100% 1 8.3% $2,576 $2.09 $2,536 $2.06 1.5%Updated May 13, 2017Estimate
UNIT AMENITIESAir Conditioning, Wheelchair Accessible (Rooms)
ONE TIME EXPENSESApplication Fee $35 Move-In Fee $300
5/15/2017Copyrighted report licensed to Village Green - The Shelby - 775952.
Page 43
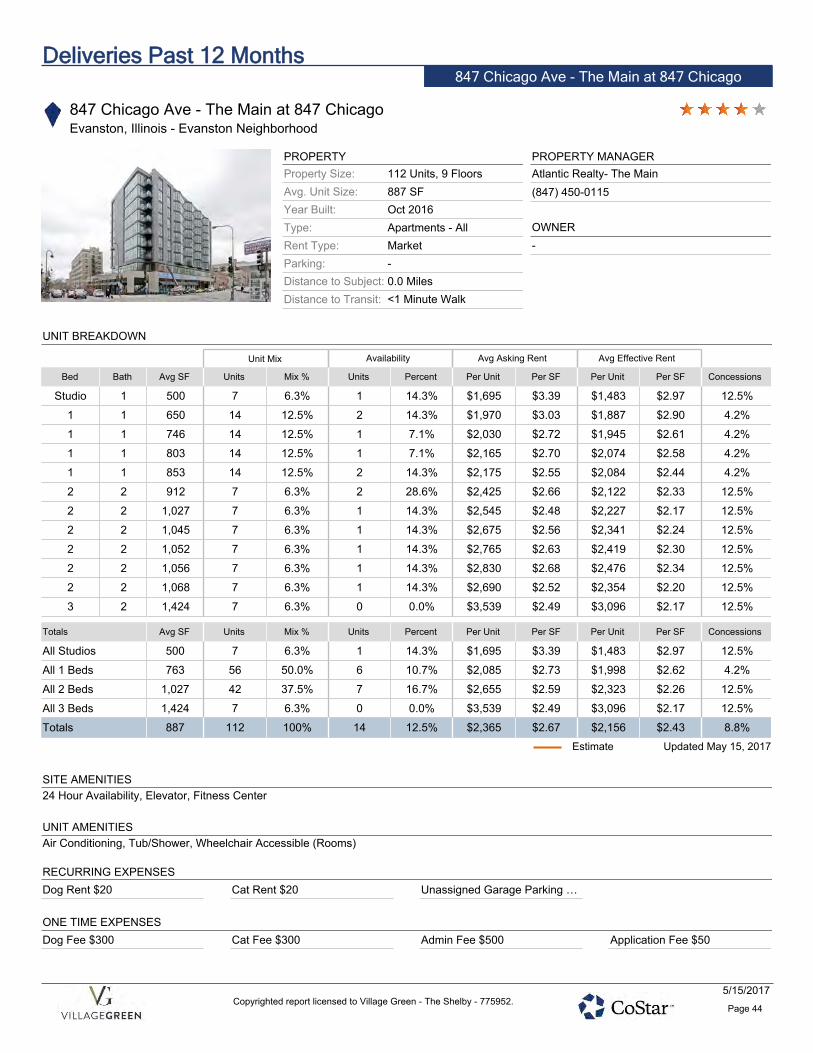
Deliveries Past 12 Months847 Chicago Ave - The Main at 847 Chicago
847 Chicago Ave - The Main at 847 ChicagoEvanston, Illinois - Evanston Neighborhood
PROPERTY MANAGERAtlantic Realty- The Main(847) 450-0115
PROPERTY
0.0 Miles
Property Size: 112 Units, 9 FloorsAvg. Unit Size: 887 SFYear Built: Oct 2016Type: Apartments - AllRent Type:Parking: -Distance to Subject:Distance to Transit: <1 Minute Walk
MarketOWNER-
UnitsBed Bath Avg SF Mix % Units Percent Per Unit Per SF Per Unit Per SF Concessions
Unit Mix Availability Avg Asking Rent Avg Effective Rent
UNIT BREAKDOWN
Studio 1 500 7 6.3% 1 14.3% $1,695 $3.39 $1,483 $2.97 12.5%
1 1 650 14 12.5% 2 14.3% $1,970 $3.03 $1,887 $2.90 4.2%
1 1 746 14 12.5% 1 7.1% $2,030 $2.72 $1,945 $2.61 4.2%
1 1 803 14 12.5% 1 7.1% $2,165 $2.70 $2,074 $2.58 4.2%
1 1 853 14 12.5% 2 14.3% $2,175 $2.55 $2,084 $2.44 4.2%
2 2 912 7 6.3% 2 28.6% $2,425 $2.66 $2,122 $2.33 12.5%
2 2 1,027 7 6.3% 1 14.3% $2,545 $2.48 $2,227 $2.17 12.5%
2 2 1,045 7 6.3% 1 14.3% $2,675 $2.56 $2,341 $2.24 12.5%
2 2 1,052 7 6.3% 1 14.3% $2,765 $2.63 $2,419 $2.30 12.5%
2 2 1,056 7 6.3% 1 14.3% $2,830 $2.68 $2,476 $2.34 12.5%
2 2 1,068 7 6.3% 1 14.3% $2,690 $2.52 $2,354 $2.20 12.5%
3 2 1,424 7 6.3% 0 0.0% $3,539 $2.49 $3,096 $2.17 12.5%
Totals Avg SF Units Mix % Units Percent Per Unit Per SF Per Unit Per SF Concessions
All Studios 500 7 6.3% 1 14.3% $1,695 $3.39 $1,483 $2.97 12.5%
All 1 Beds 763 56 50.0% 6 10.7% $2,085 $2.73 $1,998 $2.62 4.2%
All 2 Beds 1,027 42 37.5% 7 16.7% $2,655 $2.59 $2,323 $2.26 12.5%
All 3 Beds 1,424 7 6.3% 0 0.0% $3,539 $2.49 $3,096 $2.17 12.5%
Totals 887 112 100% 14 12.5% $2,365 $2.67 $2,156 $2.43 8.8%Updated May 15, 2017Estimate
SITE AMENITIES24 Hour Availability, Elevator, Fitness Center
UNIT AMENITIESAir Conditioning, Tub/Shower, Wheelchair Accessible (Rooms)
RECURRING EXPENSESDog Rent $20 Cat Rent $20 Unassigned Garage Parking …
ONE TIME EXPENSESDog Fee $300 Cat Fee $300 Admin Fee $500 Application Fee $50
5/15/2017Copyrighted report licensed to Village Green - The Shelby - 775952.
Page 44

Deliveries Past 12 Months847 Chicago Ave - The Main at 847 Chicago
PET POLICYCats Allowed - $0 Deposit, $20/Mo, 2 Maximum, One-Time Fee: $300Dogs Allowed - $0 Deposit, $20/Mo, 2 Maximum, Maximum Weight 60 lb, One-Time Fee: $300
5/15/2017Copyrighted report licensed to Village Green - The Shelby - 775952.
Page 45

Construction Summary847 Chicago Ave - The Main at 847 Chicago
UNITS UNDER CONSTRUCTION
PROJECTED DELIVERY DATES OF UNITS UNDER CONSTRUCTION
5/15/2017Copyrighted report licensed to Village Green - The Shelby - 775952.
Page 46

Construction Summary847 Chicago Ave - The Main at 847 Chicago
CONSTRUCTION DELIVERIES IN UNITS
CONSTRUCTION STARTS IN UNITS
5/15/2017Copyrighted report licensed to Village Green - The Shelby - 775952.
Page 47

Construction Summary847 Chicago Ave - The Main at 847 Chicago
PERCENT OCCUPIED AT DELIVERY
UNITS OCCUPIED IN DELIVERIES OVER TIME
5/15/2017Copyrighted report licensed to Village Green - The Shelby - 775952.
Page 48

Construction Summary847 Chicago Ave - The Main at 847 Chicago
NEW CONSTRUCTION OCCUPANCY AFTER DELIVERY BY YEAR BUILT
NET ABSORPTION IN UNITS
5/15/2017Copyrighted report licensed to Village Green - The Shelby - 775952.
Page 49

Construction Summary847 Chicago Ave - The Main at 847 Chicago
ASKING RENTAL RATES PER UNIT
CONCESSIONS IN DELIVERIES PER YEAR
5/15/2017Copyrighted report licensed to Village Green - The Shelby - 775952.
Page 50

847 Chicago Ave
PREPARED BY
Kathleen Gummerson
Regional Sales & Marketing Director
Sale Comparables
The Main at 847 Chicago
112 Unit Apartment Building
Evanston, Illinois - Evanston Neighborhood

Sale Comparables SummaryThe Main at 847 Chicago - 847 Chicago Ave
Sale Comparables
7Avg. Price/Unit (thous.)
$155Average Price (mil.)
$15.3Average Vacancy at Sale
5.1%SALE COMPARABLE LOCATIONS
Sales Attributes Low Average Median High
Sale Price $5,690,000 $15,334,285 $6,300,000 $45,000,000
Price Per Unit $73,717 $155,114 $97,033 $296,052
Cap Rate 5.3% 6.1% 6.4% 6.7%
Vacancy at Sale 1.8% 5.1% 4.5% 10.5%
Time Since Sale in Months 5.2 13.7 15.8 23.1
Property Attributes Low Average Median High
Property Size in Units 59 98 79 160
Number of Floors 3 7 7 14
Average Unit SF 505 636 610 904
Year Built 1922 1942 1932 2009
Star Rating 3.1
5/15/2017Copyrighted report licensed to Village Green - The Shelby - 775952.
Page 52

Sale Comparables SummaryThe Main at 847 Chicago - 847 Chicago Ave
Property Information
RatingProperty Name/Address Yr Built Units Vacancy Sale Date Price Price/Unit Price/SF
Sale Information
1033 W Loyola AveCampus Towers
-1 1932 98 4.1% 12/9/2016 $20,000,000 $204,081 $218
6807 N Sheridan RdSheridan Court Apartments
-2 1922 160 1.8% 12/6/2016 $18,875,000 $117,968 $172
7645 N Sheridan RdSheridan Beach Apartments
-3 1923 78 2.6% 10/18/2016 $5,750,000 $73,717 $102
6930 N Greenview Ave-4 1932 66 4.6% 1/20/2016 $5,690,000 $86,212 $119
6464 N Sheridan RdThe Morgan At Loyola Station
-5 2009 152 10.5% 10/29/2015 $45,000,000 $296,052 $281
1429-1431 W Lunt AveLunt Court Apartments
-6 1925 79 5.1% 8/7/2015 $6,300,000 $79,746 $136
2529 W Fitch AveFitch Commons
-7 1955 59 8.3% 6/12/2015 $5,725,000 $97,033 $72
5/15/2017Copyrighted report licensed to Village Green - The Shelby - 775952.
Page 53

Sale Comparables847 Chicago Ave - The Main at 847 Chicago
Campus Towers - 1033 W Loyola AveChicago, IL 60626 - Rogers Park Neighborhood
1
SALE
Sale Date: 12/9/2016Sale Price: $20,000,000Price Per Unit: $204,081Price Per SF: $218Cap Rate: 6.4%
PROPERTY
Property Size: 98 Units, 14 FloorsAverage Unit Size: 653 SFYear Built: 1932Vacancy At Sale: 4.1%Parking Spaces: -
CONTACTS
Buyer: Lubert-Adler Partners, L.P., The Laramar Group, LLCSeller: LDP ManagementBuyer Broker: Apartment Investment Advisers, LLC - Bill CassinListing Broker: Apartment Investment Advisers, LLC - Bill Cassin
FINANCING$15,000,000 from Wintrust Bank: Construction
UnitsBed Bath Avg SF Mix % Units Vac % Per Unit Per SF Per Unit Per SF Concessions
Unit Mix Vacancy Avg Asking Rent Avg Effective Rent
UNIT MIX AT SALE
Studio 1 580 32 32.7% 1 3.1% $998 $1.72 $993 $1.71 0.6%
1 1 615 33 33.7% 1 3.0% $1,272 $2.07 $1,265 $2.06 0.6%
2 1 750 13 13.3% 1 7.7% $1,472 $1.96 $1,464 $1.95 0.5%
2 2 750 18 18.4% 1 5.6% $1,472 $1.96 $1,464 $1.95 0.5%
3 1 955 2 2.0% 0 0.0% $1,846 $1.93 $1,836 $1.92 0.5%
Totals 653 98 100% 4 4.1% $1,258 $1.93 $1,251 $1.91 0.5%
SITE AMENITIESControlled Access, Laundry Facilities, Property Manager on Site, Vintage Building
UNIT AMENITIESHeating, Kitchen
TRANSACTION NOTESOn December 9, 2016, the 98 unit multi-family asset located at 1033 W Loyola Ave, Chicago, IL, sold for $20,000,000, or $204,082 per unit. Theasset traded between LDP Management and a JV buyer group comprised of The Laramar Group, LLC/Lubert-Adler Partners, L.P.
The buyer group secured acquisition financing in the amount of $15,000,000.
An in-place cap rate of 6.43% was reported.
Information was confirmed the the seller and the brokerage firm involved.
5/15/2017Copyrighted report licensed to Village Green - The Shelby - 775952.
Page 54

Sale Comparables847 Chicago Ave - The Main at 847 Chicago
Sheridan Court Apartments - 6807 N Sheridan RdChicago, IL 60626 - Rogers Park Neighborhood
2
SALE
Sale Date: 12/6/2016Sale Price: $18,875,000Price Per Unit: $117,968Price Per SF: $172Cap Rate: 5.3%
PROPERTY
Property Size: 168 Units, 9 FloorsAverage Unit Size: 506 SFYear Built: 1922Vacancy At Sale: 1.8%Parking Spaces: -
CONTACTS
Buyer: Spirit Investment Partners LLC, The Bascom GroupSeller: Kopley GroupListing Broker: KIG - Todd Stofflet
FINANCING$20,694,000 from First Midwest Bank: Acquisition & Development
UnitsBed Bath Avg SF Mix % Units Vac % Per Unit Per SF Per Unit Per SF Concessions
Unit Mix Vacancy Avg Asking Rent Avg Effective Rent
UNIT MIX AT SALE
Studio 1 400 36 21.4% 1 2.8% $806 $2.01 $803 $2.01 0.4%
Studio 1 425 30 17.9% 1 3.3% $835 $1.97 $832 $1.96 0.4%
Studio 1 468 30 17.9% 1 3.3% $1,456 $3.11 $1,451 $3.10 0.4%
Studio 1 527 24 14.3% 1 4.2% $1,450 $2.75 $1,444 $2.74 0.4%
1 1 630 24 14.3% 0 0.0% $1,570 $2.49 $1,564 $2.48 0.4%
1 1 672 24 14.3% 0 0.0% $1,570 $2.34 $1,564 $2.33 0.4%
Totals 506 168 100% 3 1.8% $1,238 $2.44 $1,233 $2.43 0.4%
SITE AMENITIES24 Hour Availability, Controlled Access, Laundry Facilities, Maintenance on site, On-Site Retail, Property Manager on Site, Security System,Shuttle to Train, Video Patrol, Vintage Building
UNIT AMENITIESCable Ready, Ceiling Fans, Intercom, Storage Units
5/15/2017Copyrighted report licensed to Village Green - The Shelby - 775952.
Page 55

Sale Comparables847 Chicago Ave - The Main at 847 Chicago
TRANSACTION NOTESOn December 6, 2016, the 160 unit multi-family asset located at 6801 N Sheridan Rd, Chicago, IL, sold for $18,875,000, or $117,969 per unit.The asset traded between Kopley Group and a JV buyer group comprised of The Bascom Group, LLC/Spirit Investment Partners, LLC.
The property delivered in 1922, and features 160 studio and 1-bedroom units. The asset also features 10,150 SF of fully leased ground-levelretail space.
The buyers plan to add amenities to the building, including a resident lounge, fitness center and rooftop terrace. They will also completelyrenovate the units.
Per a press release, "The transformation of Rogers Park into a popular neighborhood for millennials and young professionals combined with alimited supply of large luxury properties existing or planned for the submarket is what attracted the new buyers to the opportunity."
The press release continues with a statement from a principal at the new ownership, "This building has been neglected for a long time and isunderperforming its potential. We're excited to unlock that potential and create a real amenity for the neighborhood. We love the long termgrowth story in North Chicago and want to add more properties to our growing local portfolio."
The JV buyer group also purchased 5200 N Sheridan Rd, Chicago, IL in November 2015. See CoStar Comp ID 3442638 for more information.
At the time of publication, financing was unknown. Per the press release, representatives for the buyer group, "...arranged a first mortgage loanfrom local lender First Midwest Bank and mezzanine loan from New York-based Hillcrest Real Estate."
Information was confirmed with the listing brokerage firm and the buyer.
5/15/2017Copyrighted report licensed to Village Green - The Shelby - 775952.
Page 56

Sale Comparables847 Chicago Ave - The Main at 847 Chicago
Sheridan Beach Apartments - 7645 N Sheridan RdChicago, IL 60626 - Rogers Park Neighborhood
3
SALE
Sale Date: 10/18/2016Sale Price: $5,750,000Price Per Unit: $73,717Price Per SF: $102Cap Rate: -
PROPERTY
Property Size: 78 Units, 4 FloorsAverage Unit Size: 575 SFYear Built: 1923Vacancy At Sale: 2.6%Parking Spaces: -
CONTACTS
Buyer: Becovic Management GroupSeller: Sami & Hodo Menetti
FINANCING$5,520,000 from Northbrook Bank & Trust: Acquisition & Development
UnitsBed Bath Avg SF Mix % Units Vac % Per Unit Per SF Per Unit Per SF Concessions
Unit Mix Vacancy Avg Asking Rent Avg Effective Rent
UNIT MIX AT SALE
Studio 1 500 54 69.2% 2 3.7% $762 $1.52 $757 $1.51 0.5%
1 1 650 15 19.2% 0 0.0% $947 $1.46 $945 $1.45 0.2%
2 1 900 9 11.5% 0 0.0% $1,014 $1.13 $1,012 $1.12 0.3%
Totals 575 78 100% 2 2.6% $826 $1.44 $823 $1.43 0.4%
SITE AMENITIESLaundry Facilities, Security System, Vintage Building
UNIT AMENITIESAir Conditioning, Balcony, Cable Ready, Dishwasher, Disposal, Hardwood Floors, Kitchen, Oven, Refrigerator, Washer/Dryer, WheelchairAccessible (Rooms)
TRANSACTION NOTESOn October 18, 2016 the apartment building located at 7645 N Sheridan Rd in Chicago, IL sold for recorded price $5.75 million or $73,718 perunit. The asset was purchased by Becovic Management Group in a court appointed sale.
The five story apartments totals 56,385 square feet with 78 rentable units. The building is comprised of 9 two bedroom and 15 one bedroom unitsand 54 studio. The building was originally constructed in 1923 and renovated in 2004.
5/15/2017Copyrighted report licensed to Village Green - The Shelby - 775952.
Page 57

Sale Comparables847 Chicago Ave - The Main at 847 Chicago
6930 N Greenview AveChicago, IL 60626 - Rogers Park Neighborhood
4
SALE
Sale Date: 1/20/2016Sale Price: $5,690,000Price Per Unit: $86,212Price Per SF: $119Cap Rate: 6.4%
PROPERTY
Property Size: 66 Units, 7 FloorsAverage Unit Size: 505 SFYear Built: 1932Vacancy At Sale: 4.6%Parking Spaces: -
CONTACTS
Buyer: J and J EquitiesSeller: James & Pamela HodurBuyer Broker: Coldwell Banker Commercial - James HodurListing Broker: Coldwell Banker Commercial - James Hodur
FINANCING$4,650,000 from Wintrust Bank: Construction
UnitsBed Bath Avg SF Mix % Units Vac % Per Unit Per SF Per Unit Per SF Concessions
Unit Mix Vacancy Avg Asking Rent Avg Effective Rent
UNIT MIX AT SALE
Studio 1 478 48 72.7% 2 4.2% $729 $1.53 $725 $1.52 0.6%
1 1 578 18 27.3% 1 5.6% $914 $1.58 $909 $1.57 0.6%
Totals 505 66 100% 3 4.6% $779 $1.54 $775 $1.53 0.6%
SITE AMENITIESLaundry Facilities
UNIT AMENITIESAir Conditioning, Heating, Kitchen, Refrigerator
TRANSACTION NOTESOn 1/20/2016, the 66 unit multi-family property located at 6930 N Greenview Avenue in Chicago, Illinois, sold for $5,690,000. The 48,000 SFbuilding sold for $118.54 per SF.
This property was on market for approximately 7 months, with an initial asking price of $5,999,000. The transaction was in escrow forapproximately 90 days. This deal was financed via a $4,650,000 loan from Wintrust Bank. A down payment of $1,040,000 was made at the timeof purchase.
The buyer intends to use the property for its revenue stream. At the time of purchase, the property was 90% occupied. This yielded a NetOperating Income of $364,423 for 2015 and an actual CAP Rate of 6.4.
The details of this transaction were verified via public record, deed, and buyer and seller contacts deemed reliable
5/15/2017Copyrighted report licensed to Village Green - The Shelby - 775952.
Page 58

Sale Comparables847 Chicago Ave - The Main at 847 Chicago
The Morgan At Loyola Station - 6464 N Sheridan RdChicago, IL 60626 - Rogers Park Neighborhood
5
SALE
Sale Date: 10/29/2015Sale Price: $45,000,000Price Per Unit: $296,052Price Per SF: $281Cap Rate: 5.8%
PROPERTY
Property Size: 152 Units, 8 FloorsAverage Unit Size: 904 SFYear Built: Apr 2009Vacancy At Sale: 10.5%Parking Spaces: 85 Spaces; 0.6 per Unit
CONTACTS
Buyer: The Laramar Group, LLCSeller: McCaffery Interests, Inc.Listing Broker: CBRE - Dan Cohen, John Jaeger, Keely Polczynski, Martha Jane Za…
FINANCING$30,500,000 from Allianz Life Insurance Company of North America
UnitsBed Bath Avg SF Mix % Units Vac % Per Unit Per SF Per Unit Per SF Concessions
Unit Mix Vacancy Avg Asking Rent Avg Effective Rent
UNIT MIX AT SALE
Studio 1 647 32 21.1% 4 12.5% $1,552 $2.40 $1,552 $2.40 0.0%
1 1 718 12 7.9% 1 8.3% $1,624 $2.26 $1,624 $2.26 0.0%
1 1 770 16 10.5% 2 12.5% $1,702 $2.21 $1,702 $2.21 0.0%
1 1 914 15 9.9% 1 6.7% $1,802 $1.97 $1,802 $1.97 0.0%
1 1 924 16 10.5% 2 12.5% $1,782 $1.93 $1,782 $1.93 0.0%
1 1 942 13 8.6% 1 7.7% $1,807 $1.92 $1,807 $1.92 0.0%
1 1 1,023 12 7.9% 1 8.3% $2,252 $2.20 $2,252 $2.20 0.0%
2 2 1,159 11 7.2% 1 9.1% $2,322 $2.00 $2,322 $2.00 0.0%
2 2 1,167 12 7.9% 1 8.3% $2,322 $1.99 $2,322 $1.99 0.0%
2 2 1,225 13 8.6% 2 15.4% $2,455 $2.00 $2,455 $2.00 0.0%
Totals 904 152 100% 16 10.5% $1,893 $2.10 $1,893 $2.10 0.0%
SITE AMENITIESClubhouse, Concierge, Dry Cleaning Service, Elevator, Fitness Center, Laundry Facilities, Maid Service, Maintenance on site, Package Service,Property Manager on Site, Sundeck
UNIT AMENITIESAir Conditioning, Dishwasher, Disposal, Eat-in Kitchen, Fireplace, Granite Countertops, Heating, Microwave, Oven, Range, Refrigerator, Walk-InClosets, Washer/Dryer, Wheelchair Accessible (Rooms), Wi-Fi, Window Coverings
5/15/2017Copyrighted report licensed to Village Green - The Shelby - 775952.
Page 59

Sale Comparables847 Chicago Ave - The Main at 847 Chicago
TRANSACTION NOTESOn October 29, 2015, the leasehold interest of the 152 unit multi-family property located at 6464 N Sheridan Rd, Chicago, IL, sold for$45,000,000. The interest traded between McCaffery Interests and The Laramar Group.
The property totals 160,008 SF, with the retail portion consisting of 32,346 SF.
The Laramar Group now owns The Morgan at Loyola Station on a fee simple basis. The asset delivered in 2009.
The new owner secured financing in the amount of $30,500,000 on the acquisition.
The property was marketed at $45,000,000 with a 5.75% cap rate.
Information was confirmed with the listing broker.
5/15/2017Copyrighted report licensed to Village Green - The Shelby - 775952.
Page 60

Sale Comparables847 Chicago Ave - The Main at 847 Chicago
Lunt Court Apartments - 1429-1431 W Lunt AveChicago, IL 60626 - Rogers Park Neighborhood
6
SALE
Sale Date: 8/7/2015Sale Price: $6,300,000Price Per Unit: $79,746Price Per SF: $136Cap Rate: 6.7%
PROPERTY
Property Size: 79 Units, 3 FloorsAverage Unit Size: 610 SFYear Built: 1925Vacancy At Sale: 5.1%Parking Spaces: -
CONTACTS
Buyer: Time Equities, Inc.Seller: Matthew MeansBuyer Broker: Kiser Group - Brian SemelListing Broker: Kiser Group - Brian Semel
FINANCING$1,525,000 from Berkadia Commercial Mortgage LLC: due in 7 yrs$3,184,270 from Fannie Mae
UnitsBed Bath Avg SF Mix % Units Vac % Per Unit Per SF Per Unit Per SF Concessions
Unit Mix Vacancy Avg Asking Rent Avg Effective Rent
UNIT MIX AT SALE
Studio 1 440 6 7.6% 0 0.0% $686 $1.56 $682 $1.55 0.7%
Studio 1 450 29 36.7% 2 6.9% $660 $1.47 $655 $1.46 0.7%
Studio 1 1,000 1 1.3% 0 0.0% $1,419 $1.42 $1,409 $1.41 0.7%
1 1 - - - - - $871 - $866 - 0.6%
1 1 700 36 45.6% 2 5.6% $849 $1.21 $844 $1.21 0.6%
2 1 - - - - - $1,100 - $1,097 - 0.3%
2 1 900 7 8.9% 0 0.0% $1,097 $1.22 $1,094 $1.22 0.3%
Totals 610 79 100% 4 5.1% $801 $1.31 $796 $1.30 0.6%
SITE AMENITIESControlled Access
UNIT AMENITIESHeating, Kitchen, Range, Refrigerator, Tub/Shower
5/15/2017Copyrighted report licensed to Village Green - The Shelby - 775952.
Page 61

Sale Comparables847 Chicago Ave - The Main at 847 Chicago
TRANSACTION NOTESOn August 7th, 2015, the 46,390 SF multi-family property located at 1429-1433 W Lunt Avenue in Chicago, IL sold for $6,300,000. Known as theLunt Court Apartments, the 4 story apartment building was built in 1925 and features 36 studios, 36 one-bedroom one-bathroom units, and 7 two-bedroom one-bathroom units.
The property was on the market for 176 days before going under contract for 170 days. The initial sale price was unknown at the time ofpublication.
The selller was motivated to divest the property because he liked the market and saw it as a good time to sell. The buyer purchased the propertyas an investment.
The buyer assumed a loan from the seller.
The 2015 net operating income is $424,056.60, yielding an actual cap rate of 6.73%. The 2014 taxes were $56,775.
The information provided has been verified by public record as well as a buyer and seller contact deemed reliable.
5/15/2017Copyrighted report licensed to Village Green - The Shelby - 775952.
Page 62

Sale Comparables847 Chicago Ave - The Main at 847 Chicago
Fitch Commons - 2529 W Fitch AveChicago, IL 60645 - West Rogers Park Neighborhood
7
SALE
Sale Date: 6/12/2015Sale Price: $5,725,000Price Per Unit: $97,033Price Per SF: $72Cap Rate: -
PROPERTY
Property Size: 60 Units, 5 FloorsAverage Unit Size: 700 SFYear Built: 1955Vacancy At Sale: 8.3%Parking Spaces: -
CONTACTS
Buyer: CLK PropertiesSeller: Cedar Street Companies
UnitsBed Bath Avg SF Mix % Units Vac % Per Unit Per SF Per Unit Per SF Concessions
Unit Mix Vacancy Avg Asking Rent Avg Effective Rent
UNIT MIX AT SALE
1 1 600 20 33.3% 2 10.0% $950 $1.58 $942 $1.57 0.8%
1 1 700 20 33.3% 2 10.0% $899 $1.28 $892 $1.27 0.8%
1 1 800 20 33.3% 2 10.0% $998 $1.25 $990 $1.24 0.8%
Totals 700 60 100% 5 8.3% $949 $1.36 $942 $1.35 0.8%
SITE AMENITIESControlled Access, Laundry Facilities
UNIT AMENITIESAir Conditioning, Ceiling Fans, Hardwood Floors, Heating, High Speed Internet Access, Kitchen, Microwave, Range, Tub/Shower, Washer/Dryer
TRANSACTION NOTESOn June 12, 2015 the 60 unit multifamily property at 2541 W Fitch Ave in Chicago, IL was sold by the Cedar Street Companies to CLK Propertiesfor $5,725,000, or $97,034 per unit. The two buildings that make up the property are 79,655 SF in total and consist of all studio and one-bedroomunits. The property is located in the Western part of Chicago's Rogers Park neighborhood and was built in 1955.
The transaction was in escrow for 120 days. The long escrow period was attributed to the fact that the buyer assumed the loan on the property.
According to Peter Glass, Executive Vice President at CLK, they were attracted to the property because of the state of the Rogers Parkmultifamily market and the potential for rent increase.
The information contained in this report was verified with the buyer, and through public record. No contact within the selling party could bereached for comment. There were no brokers involved in the transaction.
5/15/2017Copyrighted report licensed to Village Green - The Shelby - 775952.
Page 63

Sales Volume847 Chicago Ave - The Main at 847 Chicago
CHICAGO METRO SALES VOLUME IN UNITS
EVANSTON SUBMARKET SALES VOLUME IN UNITS
EVANSTON NEIGHBORHOOD SALES VOLUME IN UNITS
5/15/2017Copyrighted report licensed to Village Green - The Shelby - 775952.
Page 64

Sales Pricing847 Chicago Ave - The Main at 847 Chicago
NATIONAL PRICE INDICES
REGIONAL MULTI-FAMILY PRICE INDICES
5/15/2017Copyrighted report licensed to Village Green - The Shelby - 775952.
Page 65

Sales Pricing847 Chicago Ave - The Main at 847 Chicago
CHICAGO PRICE PER UNIT INDEX
UNITED STATES PAST YEAR BY PRICE PER UNIT CHICAGO PAST YEAR BY PRICE PER UNIT
PRICE PER UNIT SUMMARY FOR SALES IN PAST YEAR
Geography HighTop 25%AverageMedianBottom 25%LowTransactions
$12,300,000United States 18,888 $5,000 $32,140 $104,906 $132,651 $359,795
$542,500Chicago 799 $5,000 $31,135 $85,000 $146,634 $275,695
$297,297Evanston 9 $126,923 $143,319 $171,428 $210,935 $238,453
$296,052Selected Sale Comps 7 $73,717 $76,731 $97,033 $155,114 $250,066
5/15/2017Copyrighted report licensed to Village Green - The Shelby - 775952.
Page 66

Cap Rates847 Chicago Ave - The Main at 847 Chicago
CAP RATE TRENDS
UNITED STATES CAP RATES PAST YEAR CHICAGO CAP RATES PAST YEAR
CAP RATE SUMMARY STATISTICS IN PAST YEAR
Geography HighTop 25%AverageMedianBottom 25%LowTransactions
20.0%United States 9,895 0.6% 3.9% 5.8% 6.2% 9.2%
20.0%Chicago 391 2.9% 5.2% 7.3% 7.9% 11.5%
6.9%Evanston 6 5.0% 5.2% 5.9% 5.9% 6.5%
6.7%Selected Sale Comps 5 5.3% 5.5% 6.4% 6.1% 6.6%
5/15/2017Copyrighted report licensed to Village Green - The Shelby - 775952.
Page 67

Buyers847 Chicago Ave - The Main at 847 Chicago
TOP CHICAGO MULTI-FAMILY BUYERS PAST TWO YEARS
Purchased at least one asset in Evanston Multi-Family submarket
Properties Bought
Company Name Bldgs VolumeUnits
Properties Sold
Units BldgsVolume
Hudson Americas, LP 9 3,563 $480,677,374 13 3,974 $530,752,374
Group Fox 4 1,393 $459,600,000 0 0 -
Crescent Heights 2 898 $363,180,180 1 160 $134,600,000
Invesco 2 704 $336,062,000 0 0 -
Angelo, Gordon & Co. 2 560 $251,600,000 1 330 $85,000,000
Redwood Capital Group, LLC 3 1,302 $212,200,000 4 1,856 $191,390,500
Alcion Ventures 8 501 $195,820,000 0 0 -
Golub & Company 6 490 $193,270,000 0 0 -
TLC Management Co. 4 1,285 $189,059,500 0 0 -
The Laramar Group, LLC 15 909 $175,955,997 1 281 $30,500,000
The Connor Group 4 1,690 $173,894,500 2 736 $6,794,500
LaSalle Investment Management Inc. 2 438 $164,000,000 1 615 $225,000,000
Waterton Associates LLC 2 481 $157,000,000 3 1,060 $286,000,000
Pensam Capital 4 1,286 $150,730,500 0 0 -
Friedkin Investment Co. 4 737 $149,293,000 4 1,364 $191,500,000
JP Morgan Chase & Co. 1 198 $140,000,000 0 0 -
Harlem Irving Companies 1 160 $134,600,000 0 0 -
JDL Development 1 160 $134,600,000 0 0 -
Marquette Companies 2 609 $133,925,000 1 278 $92,500,000
Beal Properties, LLC 10 597 $133,031,000 3 40 $6,317,500
Prudential Financial, Inc. 1 342 $127,078,770 0 0 -
CLK Properties 11 730 $115,647,000 0 0 -
Resource America, Inc. 2 555 $114,950,000 0 0 -
Berkshire Group 1 292 $114,000,000 1 642 $86,300,000
Sinatra and Company 3 996 $113,250,000 0 0 -
TYPES OF MULTI-FAMILY CHICAGO BUYERS PAST TWO YEARS
Company Type Bldgs Billions Avg PricePrice/Unit
Average Purchase
Units
Buying Volume
Private 1,199 51,643 $130,361 $5,614,875$6.73
Institutional 152 17,328 $178,463 $20,344,825$3.09
Private Equity 27 3,594 $172,107 $22,909,445$.61
REIT/Public 2 778 $146,266 $56,897,750$.11
$0 $1.7 $3.4 $5.1 $6.8
5/15/2017Copyrighted report licensed to Village Green - The Shelby - 775952.
Page 68

Sellers847 Chicago Ave - The Main at 847 Chicago
TOP CHICAGO MULTI-FAMILY SELLERS PAST TWO YEARS
Sold at least one asset in Evanston Multi-Family submarket
Properties Sold
Company Name Bldgs VolumeUnits
Properties Bought
Units BldgsVolume
Hudson Americas, LP 13 3,974 $530,752,374 9 3,563 $480,677,374
Heitman 3 1,182 $412,880,180 1 206 $47,775,000
Florida State Board of Administration 2 863 $346,180,180 0 0 -
Waterton Associates LLC 3 1,060 $286,000,000 2 481 $157,000,000
DRW Trading Group 2 409 $247,712,000 0 0 -
LaSalle Investment Management Inc. 1 615 $225,000,000 2 438 $164,000,000
American Realty Advisors 3 1,066 $208,350,000 1 216 $99,600,000
Friedkin Investment Co. 4 1,364 $191,500,000 4 737 $149,293,000
Redwood Capital Group, LLC 4 1,856 $191,390,500 3 1,302 $212,200,000
McCaffery Interests, Inc. 2 494 $172,078,770 0 0 -
Lennar 2 465 $156,950,000 0 0 -
Kensington Realty Advisors, Inc. 3 1,019 $152,850,000 0 0 -
Lawrence A. Ventresca & Co. 2 448 $149,600,000 0 0 -
Marc Realty 7 604 $146,241,551 4 24 $2,225,000
Jackson Square Properties 3 980 $143,900,000 0 0 -
Investcorp Bank B.S.C. 3 1,514 $141,390,500 1 642 $86,300,000
Integrated Development Group 1 198 $140,000,000 0 0 -
National Real Estate Advisors 1 198 $140,000,000 0 0 -
DK Real Estate Services 3 580 $137,067,000 1 448 $48,250,000
Crescent Heights 1 160 $134,600,000 2 898 $363,180,180
Smithfield Properties 2 328 $128,295,000 0 0 -
Canyon Partners LLC 1 342 $127,078,770 2 1,114 $108,500,000
Monogram Residential Trust 1 298 $126,000,000 0 0 -
The Carlyle Group 3 265 $122,750,000 1 150 $33,600,000
Benjamin E. Sherman & Sons, Inc. 3 676 $118,400,000 0 0 -
TYPES OF MULTI-FAMILY CHICAGO SELLERS PAST TWO YEARS
Company Type Bldgs Billions Avg PricePrice/Unit
Average Sale
Units
Selling Volume
Private 1,137 45,004 $133,690 $5,291,634$6.01
Institutional 173 20,713 $204,170 $24,445,035$4.22
REIT/Public 10 3,054 $149,073 $45,527,050$.45
Private Equity 12 677 $332,858 $18,778,791$.22
$0 $1.6 $3.2 $4.8 $6.4
5/15/2017Copyrighted report licensed to Village Green - The Shelby - 775952.
Page 69

847 Chicago Ave
PREPARED BY
Kathleen Gummerson
Regional Sales & Marketing Director
Demographics
The Main at 847 Chicago
158,000 SF Multi-Family Building
Evanston, Illinois - Evanston Neighborhood

Demographic Overview847 Chicago Ave - The Main at 847 Chicago
Population (1 mi)
34,265Avg. HH Size (1 mi)
2.0Avg. Age (1 mi)
38Med. HH Inc. (1 mi)
$67,658DEMOGRAPHIC RADIUS RINGS
DEMOGRAPHIC SUMMARY
5 Mile3 Mile1 MilePopulation
517,338239,95434,2652017 Population
520,097241,74834,4362022 Population
0.5%0.8%0.5%Pop Growth 2017-2022
3937382017 Average Age
Households
209,39093,32916,0472017 Households
210,12093,88316,1082022 Households
0.4%0.6%0.4%Household Growth 2017-2022
$59,156$54,514$67,658Median Household Income
2.32.42.0Average Household Size
111Average HH Vehicles
Housing
$321,031$293,472$349,500Median Home Value
195119501948Median Year Built
5/15/2017Copyrighted report licensed to Village Green - The Shelby - 775952.
Page 71

Age & Education847 Chicago Ave - The Main at 847 Chicago
POPULATION BY AGE GROUP IN 1 MILE RADIUS
POPULATION BY EDUCATION IN 1 MILE RADIUSPOPULATION BY AGE IN 1 MILE RADIUS
5/15/2017Copyrighted report licensed to Village Green - The Shelby - 775952.
Page 72

POPULATION BY RACE
MILITARY POPULATION
Ethnicity847 Chicago Ave - The Main at 847 Chicago
5 Mile3 MileRace 1 Mile
2017 Population
345,63767.28%White 154,444 64.36% 66.81%23,055
60,60019.53%Black 38,389 16.00% 11.71%6,691
91,4238.84%Asian 37,421 15.60% 17.67%3,029
3,751< 1%American Indian & Alaskan 1,787 < 1% < 1%174
362< 1%Hawaiian & Pacific Islander 187 < 1% < 1%17
15,5653.79%Other 7,726 3.22% 3.01%1,299
0 4,800 9,600 14,400 19,200 24,000
HISPANIC POPULATION IN 1 MILE RADIUSPOPULATION BY RACE IN 1 MILE RADIUS
5 Mile3 Mile1 Mile
2017 Population
69< 1%Military 38 < 1% < 1%5
266,34999.97%Non-Military Workforce 120,518 99.97% 99.97%18,835
0 4,000 8,000 12,000 16,000 20,000
5/15/2017Copyrighted report licensed to Village Green - The Shelby - 775952.
Page 73

847 Chicago Ave
PREPARED BY
Kathleen Gummerson
Regional Sales & Marketing Director
Evanston Overview
The Main at 847 Chicago
112 Unit Apartment Building
Evanston, Illinois - Evanston Neighborhood

Market Analyst: Brandon Frankel - [email protected]
Evanston provides a bevy of drivers that continue to attract renters to the submarket. While recent new construction has increased Evanston’s 4 & 5 Star inventory by nearly 50%, these assets have leased quickly, limiting vacancy expansion. Near-term supply competition does exist in 2017, but it is minimal compared to the supply Evanston has seen deliver over the past two years. Morerover, given successful stabilization of recent deliveries, developers currently building in Evanston are not overly worried about such competition. Healthy vacancy levels enabled landlords to increase rents more in 2016 than in any other year of the current cycle, and rents are now over 10% above their prerecession peak. Most deals in Evanston over the past 12 months have included buildings with fewer than 50 units, located to the east of Ridge Road, and traded for well above the metro's median price per unit.
12 Mo. Deliveries in Units 12 Mo. Net Absorption Vacancy Rate 12 Mo. Rent Growth
112 0 5.5% 3.5%
Annual Trends 12 Month Change Hist. Avg. Fcst. Avg. Peak When Trough When
Vacancy 2.0% 6.2% 4.8% 8.7% 2003 Q2 3.5% 2000 Q1
Net Absorption 0 74 103 380 2014 Q2 (76) 2003 Q1
Net Deliveries 112 83 76 469 2014 Q1 0 2011 Q4
Rent Growth 3.5% 1.9% 3.7% 7.8% 2007 Q2 -2.7% 2009 Q4
Effective Rent Growth 5.0% 1.9% 3.8% 7.8% 2007 Q2 -2.7% 2009 Q4
Sales ($ millions) $73 $43 N/A $124 2008 Q1 $2 2009 Q1
KEY INDICATORS
Current Quarter Units Vacancy Rate Asking Rent Effective Rent Net Absorption Net Deliveries Under Construction
4 & 5 Star 1,879 9.9% $2,357 $2,342 5 0 101
3 Star 2,185 2.8% $1,411 $1,405 3 0 0
1 & 2 Star 2,661 4.6% $1,275 $1,264 (1) 0 0
SUBMARKET 6,725 5.5% $1,673 $1,662 7 0 101
© 2017 CoStar Group Page 1As of May 14, 2017
OverviewEvanston Apartment

FUNDAMENTALS
Strong apartment demand continues in Evanston. However, due to the number of student renters in Evanston, apartment demand tends to fluctuate seasonally. While demand was negative in 16Q1, since 2010, more than half of first quarters experienced negative absorption. The third quarter tends to be the strongest for demand, because the majority of student renters in Evanston are on leases that adhere to the academic calendar.
Northwestern University drives student demand, enrolling about 21,000, 40% of whom live in housing owned, operated, or affiliated with the University. Therefore, nearly 13,000 students live in off-campus, market-rate housing. Historically, the undergraduate population has aided occupancies in 3 Star assets, but 4 & 5 Star deliveries are beginning to absorb a larger portion of undergraduate renters. Still, high occupancy in 4 & 5 Star assets—currently at 91%—stems mostly from the large graduate student population. While affordability is an issue for many undergraduates, parents often pay their childrens' housing costs.
Downsizing Baby Boomers and affluent singles also comprise a significant share of the renter cohort in Evanston. These renters capitalize on the presence of the submarket’s “Big 7 Employers,” which include the NorthShore University HealthSystem, Saint Francis Hospital, and Northwestern University. Both healthcare companies have hospitals in Evanston and employ a total of about 5,000 healthcare professionals, some of whom contribute to demand for high-end apartment units. Northwestern University is also a part of the seven, with approximately 5,000 employees.
Many businesses and retailers thrive in Evanston. In 2015 alone, Evanston opened nearly 70 new businesses, including Accuity, which relocated from Skokie, moving its 200 employees into 36,000 SF at 1007 Church St. The company cited Evanston’s access to public transportation and its intellectual capital as reasons for the move. ZS Associates, an Evanston-based consulting firm, relocated its headquarters to a 48,200 SF space at One Rotary Center in 17Q1. The company will remain in Evanston where it employs over 300 workers. Evanston continues to draw retailers—Valli Produce expanded and moved in to the old Dominick’s site at 1910 Dempster St., and Whole Foods opened its third Evanston location, a 53,000 SF space at 2748 Green Bay Rd.
Evanston’s renters are also attracted to its transportation infrastructure. The community is walkable and safe, and the average walkability score for Evanston’s 4 & 5 Star assets is 89, meaning that in most cases daily errands do not require a car. Bicycling is increasingly common in Evanston—in fact, ten Divvy Bike stations were installed in 2016. Finally, Evanston maintains both a CTA line (Purple) and Metra line, enabling its residents to easily travel to the Loop, or as far north as Kenosha.
© 2017 CoStar Group Page 2As of May 14, 2017
OverviewEvanston Apartment

NET ABSORPTION, NET DELIVERIES AND VACANCY RATE
© 2017 CoStar Group Page 3As of May 14, 2017
OverviewEvanston Apartment

NET DELIVERIES
Renters are actively filling Evanston’s new supply, resulting in healthy vacancy levels. While many Chicago submarkets are beginning to experience slower leasing in new developments, Evanston’s new supply continues to stabilize in an average of about nine months.
For instance, two deliveries in 2013, 1717 Evanston and Central Station, took about nine months to stabilize, which was not only average for Evanston at the time, but also for most submarkets close to Downtown. However, more recent completions in Downtown now take more than one year to stabilize. North Water Apartments, a 398-unit 5 Star development, is 75% occupied one year after opening, averaging just over 25 units (6%) absorption per month. And the Jones Chicago, a 188-unit 5 Star asset also located Downtown, reached 90% occupancy after 14 months in lease-up, averaging 12 units (6%) of absorption per month. Both of these assets delivered in mid-to-late 2014.
E2, one of Evanston's more recent deliveries, was 67% leased just four months after opening and reached 90% occupancy seven months after its March 2015 completion. The 354-unit 5 Star community averaged a physical absorption rate of 50 units per month after delivery. In 16Q4, The Main at 847 Chicago brought 112 new units to the submarket. While its lease-up pace is still in question, the building is 26% occupied as of February, 2017, suggesting a physical absorption rate of 6 units (5%) per month. Granted, the community opened in the winter, which typically equates to slower leasing velocity.
Evanston does have several new developments under construction, which will increase its 4 & 5 Star inventory by nearly 10% in 2017. Centrum Evanston will add 101 4-Star units, and 1620 Central St. another 47 4-Star units. However, Evanston so far has bucked the trend of longer lease-up periods as the cycle moves into its later phase. Riverside Investment & Development and Real Capital Solutions, the developers of these two new projects, remain optimistic that absorption of their deliveries will be similar to that of E2.
SUPPLY
© 2017 CoStar Group Page 4As of May 14, 2017
OverviewEvanston Apartment

CONSTRUCTION ACTIVITY
12 MONTH AVERAGE DELIVERIES IN UNITS AVERAGE BUILDING SIZE IN UNITS
© 2017 CoStar Group Page 5As of May 14, 2017
OverviewEvanston Apartment

UNDER CONSTRUCTION PROJECTS
No. Property Name Address Stories Units Start Yr. Deliv. Yr Owner/Developer
7 Centrum Evanston 1571 Maple Ave 12 101 2016 2017Centrum Partners LLCCondor Partners
DELIVERED PROJECTS
No. Property Name Address Stories Units Start Yr. Deliv. Yr Owner/Developer
6 The Main at 847 Chicago 847 Chicago Ave 9 112 2015 2016Riverside Investment &...Riverside Investment &...
1 E2 1890 Maple Ave 16 352 2013 2015Fifield Capital Partne...Carroll Properties, In...
8 Central Station 1720 Central St 4 80 2012 2013M & R DevelopmentM & R Development
5 1717 Evanston 1717 Ridge Ave 8 175 2012 2013Focus Development, Inc...
4 AMLI Evanston 737 Chicago Ave 4 214 2012 2013AMLI Residential Prope...
3 415 Premier Apartments 415 W Howard St 17 221 2006 2008Crescent Real Estate E...
PROPOSED PROJECTS
No. Property Name Address Stories Units Start Yr. Deliv. Yr Owner/Developer
2 601 Davis 601 Davis St 33 318 N/AVermillion Development...
© 2017 CoStar Group Page 6As of May 14, 2017
OverviewEvanston Apartment

RENTS
Rent growth in 2016 was spectacular. Assets helping drive rent escalations include most 4 & 5 Star buildings, and properties close to the CTA–Davis Purple Line and the Central Street Metra station. Landlords of 4 & 5 Star assets increased rents by about 8% in 2016, while rents in 1 & 2 Star and 3 Star assets grew slowly. This indicates Northwestern undergraduates’ increasing attraction to 4 & 5 Star buildings.
Evanston’s affluent renter base can afford the high price per SF for new developments. Assets delivered in the past several years, such as E2 and 1717 Evanston, have asked for upwards of $3.20 per SF for one-bedrooms, similar to Downtown’s asking rents. While that's often out of reach for renters in many other submarkets, Evanston’s population can largely cover the bill. To limit rent to 30% of gross pay, a household would need to make about $81,000 per year to afford $3/SF rent. Not only does Evanston’s median household income exceed $70,000, but more than one-third of the submarket’s household’s make over $100,000 per year.
Owners of communities with 1, 2 & 3 Star ratings ask for significantly less, typically $1.50–$1.75 per SF. The bulk of these properties are located to the eastern portion of the submarket, closer to Lake Michigan. These low-rise apartments tend to range from six to 24 units, and nearly all have single-digit vacancies as of February, 2017.
© 2017 CoStar Group Page 7As of May 14, 2017
OverviewEvanston Apartment

ASKING RENT LEVELS AND ANNUAL GROWTH
© 2017 CoStar Group Page 8As of May 14, 2017
OverviewEvanston Apartment

EXPENSES
Operating Expenses Per SF Capital Expenditures Per SF
Market Mgmt. Admin. Payroll Water Utilities Maint. Insurance Taxes Appliance Structual Other Total
4 & 5 Star
Chicago $0.82 $1.15 $2.63 $0.34 $1.17 $2.14 $0.37 $3.00 $0.10 $0.44 $0.94 $13.10
Suburban $0.79 $0.79 $1.95 $0.49 $1.18 $1.53 $0.31 $2.78 $0.09 $0.44 $0.94 $11.30
Submarket $1.00 $0.74 $0.77 $0.39 $1.39 $0.93 $0.25 $3.22 $0.09 $0.44 $0.93 $10.15
3 Star
Chicago $0.77 $1.10 $1.07 $0.29 $1.10 $1.79 $0.33 $1.79 $0.09 $0.41 $0.65 $9.39
Suburban $0.64 $0.67 $0.96 $0.39 $1.05 $1.03 $0.28 $1.56 $0.08 $0.39 $0.66 $7.71
Submarket $0.83 $0.69 $0.74 $0.27 $1.20 $0.89 $0.24 $2.27 $0.09 $0.42 $0.69 $8.32
1 & 2 Star
Chicago $0.52 $0.71 $0.97 $0.27 $0.85 $1.22 $0.30 $1.06 $0.08 $0.39 $0.60 $6.99
Suburban $0.48 $0.46 $0.91 $0.35 $0.82 $0.81 $0.26 $1.22 $0.06 $0.37 $0.62 $6.36
Submarket $0.62 $0.55 $0.70 $0.26 $0.70 $0.85 $0.23 $1.32 $0.07 $0.40 $0.66 $6.36
* Expenses are estimated using NCREIF and IREM data using the narrowest possible geographical definition ranging from zip code to region.
© 2017 CoStar Group Page 9As of May 14, 2017
OverviewEvanston Apartment

SALES
SALES VOLUME AND MEDIAN PRICE
Few deals occurred in 2016, but private buyers historically predominate in Evanston, purchasing smaller assets for high prices. In 2016, the median price per unit nearly reached a record high, closing in on the median in both the Downtown and North Lakefront submarkets. Cap rates continue to compress in Evanston, averaging close to 6% in the last four quarters.
The trade with the highest price per unit happened adjacent to the Northwestern campus, at 717 Emerson St. The six-unit 2 Star asset traded in December 2015 for $1.975 million ($329,167/unit), at a 6% cap rate. The price per unit is the fourth highest of the current cycle for Evanston's apartment trades, with the 1717 Evanston building marking the highest price per unit at just over $400,000. The unit mix at 717 Emerson helps explain its high pricing—the building consists of five two-bedroom units and one four-bedroom unit. Both the buyer and seller were local investors, a common theme in Evanston.
More representative of the location of Evanston’s recent trades is the deal at 550 Sheridan Square, known as the Raymond Community Apartments. The 37-unit 3 Star apartment building sold for $11 million ($297,297/unit) in 16Q3 at a 4.95% cap rate. While pricing was well above the submarket median, the building is in an area where the majority of deals occurred over the past year. The property lies in Southeast Evanston, adjacent to Evanston South Beach, but farther away from retailers. Constructed in 1968, the 3 Star asset last traded in 15Q3 as part of a portfolio deal including over 25 assets. The buyer at the time, Speedwagon Properties, continues to be a major investor in the Kenosha submarket.
© 2017 CoStar Group Page 10As of May 14, 2017
OverviewEvanston Apartment

HISTORICAL SALES TRANSACTIONS
12 MONTH AVERAGE SALES VOLUME IN MILLIONS 12 MONTH SALES VOLUME IN MILLIONS BY OWNER TYPE
© 2017 CoStar Group Page 11As of May 14, 2017
OverviewEvanston Apartment

HISTORICAL SALES TRANSACTIONS
No. Property Sale Date Price Units Price Per Unit Built Buyer Name
13 1520 Central St 12/20/2016 $4,438,000 29 $153,035 1962 Martin Merel (Private)
2 415 Premier Apartments, 415 Howard St 9/15/2016 $47,750,000 225 $212,222 2008 Crescent Real Estate Equities LLC
(Institutional)
4 Raymond Community Apartments, 550 Sheridan Sq 8/22/2016 $11,000,000 37 $297,297 1968 SRE Holdings, LLC (Private)
14 The Janice Condominiums, 619 Brummel St 11/12/2015 $3,925,000 23 $170,652 1925 Jeffrey F Oitker (Unknown)
8 Raymond Community Apartments, 550 Sheridan Sq 7/31/2015 $7,200,000 37 $194,595 1968 Speedwagon Properties (Private)
9 Hinman Avenue Apartments, 1700 Hinman Ave 7/31/2015 $5,500,000 21 $261,905 Speedwagon Properties (Private)
15Raymond & Associates/Speedwagon, 1740 Hinman Ave
7/31/2015 $3,600,000 23 $156,522 1978 Speedwagon Properties (Private)
17Raymond & Associates/Speedwagon, 1520 Central St
7/31/2015 $3,280,500 29 $113,121 1962 Speedwagon Properties (Private)
24Raymond & Associates/Speedwagon, 2620 Central St
7/31/2015 $1,098,000 21 $52,286 Speedwagon Properties (Private)
5 525 Kedzie St 6/23/2015 $9,350,000 36 $259,722 2009 Essex Realty Group (Private)
3 415 Premier Apartments, 415 Howard St 3/26/2015 $40,207,000 221 $181,932 2008 Crossbeam Concierge (Institutional)
21 1216 Harvard Ter 7/18/2014 $2,350,000 21 $111,905 1950 Cmhdc Development Services (Private)
6 Judson Park, 834 Judson Ave 6/17/2014 $7,900,000 25 $316,000 1927 Hideya Kamada (Private)
23 139 Ashland Ave 10/2/2013 $1,350,000 24 $56,250 1960 123 Remodeling (Private)
7 525 Kedzie St 10/1/2013 $7,300,000 36 $202,778 2009 ISIAH International (Institutional)
1 1717 Evanston, 1717 Ridge Ave 9/9/2013 $70,250,000 175 $401,429 2013 Invesco Advisors, Inc. (Institutional)
10 632 Hinman Ave 6/6/2013 $5,000,000 25 $200,000 1917 Benjamin E. Sherman & Sons (Private)
12 905 Elmwood Ave 5/13/2013 $4,700,000 53 $88,679 1926 Sanford Kahn, Ltd. (Private)
20 548 Elmwood Ave 1/17/2013 $2,544,000 24 $106,000 Sanford Kahn, Ltd. (Private)
11 525 Kedzie St 1/16/2013 $4,850,000 36 $134,722 2009 Marc Realty Residential IV, LLC (Private)
22 548 Sherman Ave 12/4/2012 $2,226,000 21 $106,000 Sanford Kahn, Ltd. (Private)
25 1919 Howard St 8/29/2012 $841,000 25 $33,640 1970 Andrzej J. Gajda (Private)
19 809 Seward St 5/1/2012 $2,575,000 25 $103,000 1923 Robert Mitchell (Private)
18 828 Reba Pl 2/2/2012 $2,600,000 25 $104,000 Sanford Kahn (Private)
16 908 Reba Pl 2/1/2012 $3,560,000 31 $114,839 Sanford Kahn (Private)
© 2017 CoStar Group Page 12As of May 14, 2017
OverviewEvanston Apartment

SUBMARKET SUPPLY AND DEMAND HISTORY AND FORECAST
Inventory Net Absorption
Year Units Growth % Growth Units % Growth Construction Ratio
2021 7,078 70 1.0% 157 2.3% 0.4
2020 7,008 73 1.1% 148 2.3% 0.5
2019 6,935 42 0.6% 64 1.0% 0.7
2018 6,893 74 1.1% 88 1.4% 0.8
2017 6,819 94 1.4% 70 1.1% 1.4
2016 6,725 112 1.7% 25 0.4% 4.5
2015 6,613 352 5.6% 367 6.1% 1.0
2014 6,261 0 0.0% 175 3.0% 0.0
2013 6,261 469 8.1% 314 5.7% 1.5
2012 5,792 0 0.0% 27 0.5% 0.0
2011 5,792 0 0.0% 23 0.4% 0.0
2010 5,792 0 0.0% 32 0.6% 0.0
2009 5,792 36 0.6% (16) -0.3% --
2008 5,756 221 4.0% 218 4.2% 1.0
2007 5,535 0 0.0% 28 0.5% 0.0
2006 5,535 0 0.0% 33 0.6% 0.0
2005 5,535 0 0.0% 53 1.0% 0.0
SUBMARKET VACANCY AND RENT HISTORY AND FORECAST
Vacancy Asking Rent Effective Rent
Year Units Percent Ppts Chg Per Unit Per SF % Growth Per Unit Per SF
2021 197 2.8% (1.3) $2,000 $2.40 4.4% $1,984 $2.38
2020 284 4.1% (1.1) $1,917 $2.30 4.5% $1,892 $2.27
2019 359 5.2% (0.3) $1,835 $2.20 4.3% $1,805 $2.17
2018 381 5.5% (0.3) $1,759 $2.11 3.4% $1,730 $2.08
2017 395 5.8% 0.3 $1,702 $2.04 1.8% $1,675 $2.01
2016 370 5.5% 1.2 $1,672 $1.99 5.8% $1,638 $1.95
2015 283 4.3% (0.5) $1,581 $1.88 4.7% $1,559 $1.86
2014 298 4.8% (2.8) $1,510 $1.81 -0.1% $1,495 $1.79
2013 472 7.5% 2.1 $1,512 $1.81 2.3% $1,487 $1.78
2012 317 5.5% (0.5) $1,479 $1.80 1.3% $1,464 $1.78
2011 344 5.9% (0.4) $1,459 $1.78 0.9% $1,445 $1.76
2010 367 6.3% (0.6) $1,446 $1.76 0.8% $1,432 $1.75
2009 399 6.9% 0.9 $1,435 $1.75 -2.7% $1,421 $1.73
2008 347 6.0% (0.2) $1,475 $1.81 2.1% $1,461 $1.79
2007 344 6.2% (0.5) $1,445 $1.77 5.5% $1,431 $1.76
2006 372 6.7% (0.6) $1,370 $1.68 5.9% $1,356 $1.66
2005 404 7.3% (1.0) $1,293 $1.59 1.3% $1,280 $1.57
© 2017 CoStar Group Page 13As of May 14, 2017
OverviewEvanston Apartment

SUBMARKET SALES HISTORY
Volume Price
Year No. of Sales Units Volume Turnover Median Per Unit Avg Price
YTD 2 25 $4,470,000 0.4% $168,947 $2,235,000
2016 9 531 $69,264,450 7.9% $163,828 $7,696,050
2015 22 742 $100,398,003 11.2% $170,652 $4,780,857
2014 10 171 $27,165,001 2.7% $114,286 $2,716,500
2013 23 538 $105,106,499 8.6% $149,444 $7,507,607
2012 12 638 $30,153,999 11.0% $62,857 $2,741,273
2011 10 287 $64,790,001 5.0% $129,546 $9,255,714
2010 7 136 $16,365,000 2.3% $125,000 $2,337,857
2009 9 151 $10,717,500 2.6% $104,385 $1,339,688
2008 6 620 $110,019,997 10.8% $80,965 $18,336,666
2007 6 161 $16,400,999 2.9% $84,750 $2,343,000
2006 13 248 $36,872,002 4.5% $142,760 $2,633,714
2005 8 143 $19,282,499 2.6% $122,334 $2,410,313
© 2017 CoStar Group Page 14As of May 14, 2017
OverviewEvanston Apartment

4 & 5 STAR SUPPLY AND DEMAND HISTORY
Inventory Net Absorption
Year Units Growth % Growth Units % Growth Construction Ratio
2017 -- -- -- -- -- --2016 1,879 112 6.3% 35 2.1% 3.22015 1,767 352 24.9% 328 24.8% 1.12014 1,415 0 0.0% 150 12.8% 0.02013 1,415 469 49.6% 283 31.7% 1.72012 946 0 0.0% 3 0.3% 0.02011 946 0 0.0% 3 0.3% 0.02010 946 0 0.0% 12 1.4% 0.02009 946 36 4.0% 26 3.1% 1.42008 910 221 32.1% 202 31.3% 1.12007 689 0 0.0% (2) -0.3% --2006 689 0 0.0% 7 1.1% 0.02005 689 0 0.0% 4 0.6% 0.0
4 & 5 STAR VACANCY AND RENT HISTORY
Vacancy Asking Rent Effective Rent
Year Percent Ppts Chg Per Unit Per SF % Growth Per Unit Per SF
2021 6.0% (1.6) $2,755 $3.08 3.9% --2020 7.6% (1.4) $2,651 $2.96 3.9% --2019 9.0% (0.4) $2,553 $2.85 3.5% --2018 9.5% (0.5) $2,466 $2.75 2.5% --2017 9.9% (0.2) $2,405 $2.69 -0.2% --2016 10.2% 3.7 $2,409 $2.62 8.9% $2,385 $2.602015 6.5% 0.1 $2,211 $2.40 6.4% $2,189 $2.382014 6.4% (10.6) $2,079 $2.24 -0.3% $2,058 $2.222013 17.0% 11.3 $2,085 $2.25 1.8% $2,064 $2.232012 5.7% (0.3) $2,047 $2.30 1.5% $1,992 $2.242011 6.0% (0.3) $2,018 $2.27 1.4% $1,998 $2.242010 6.3% (1.3) $1,990 $2.23 0.7% $1,970 $2.212009 7.6% 0.8 $1,976 $2.22 -3.5% $1,956 $2.202008 6.8% 0.6 $2,047 $2.35 2.1% $2,027 $2.332007 6.2% 0.3 $2,004 $2.27 5.7% $1,984 $2.252006 6.0% (1.0) $1,897 $2.15 6.1% $1,878 $2.132005 7.0% (0.6) $1,787 $2.03 1.3% $1,770 $2.01
© 2017 CoStar Group Page 15As of May 14, 2017
OverviewEvanston Apartment

4 & 5 STAR SALES HISTORY
Volume Price
Year Sales Units Volume Turnover Per Unit Avg Price
YTD 0 0 $0 0.0% -- --2016 1 225 $47,750,000 12.0% $212,222 $47,750,0002015 4 478 $53,481,998 27.1% $181,932 $17,827,3342014 1 49 $7,250,000 3.5% $147,959 $7,250,0002013 2 247 $82,400,002 17.5% $202,778 $27,466,6662012 1 38 $0 4.0% -- --2011 1 193 $55,625,000 20.4% $288,212 $55,625,0002010 2 68 $7,250,000 7.2% $82,035 $3,625,0002009 0 0 $0 0.0% -- --2008 1 283 $101,125,000 31.1% $357,332 $101,125,0002007 0 0 $0 0.0% -- --2006 0 0 $0 0.0% -- --2005 0 0 $0 0.0% -- --
© 2017 CoStar Group Page 16As of May 14, 2017
OverviewEvanston Apartment

3 STAR SUPPLY AND DEMAND HISTORY
Inventory Net Absorption
Year Units Growth % Growth Units % Growth Construction Ratio
2017 -- -- -- -- -- --2016 2,185 0 0.0% 3 0.1% 0.02015 2,185 0 0.0% 11 0.5% 0.02014 2,185 0 0.0% 22 1.1% 0.02013 2,185 0 0.0% 2 0.1% 0.02012 2,185 0 0.0% 16 0.8% 0.02011 2,185 0 0.0% 8 0.4% 0.02010 2,185 0 0.0% 9 0.4% 0.02009 2,185 0 0.0% (17) -0.8% --2008 2,185 0 0.0% 7 0.3% 0.02007 2,185 0 0.0% 9 0.4% 0.02006 2,185 0 0.0% 17 0.8% 0.02005 2,185 0 0.0% 17 0.8% 0.0
3 STAR VACANCY AND RENT HISTORY
Vacancy Asking Rent Effective Rent
Year Percent Ppts Chg Per Unit Per SF % Growth Per Unit Per SF
2021 0.8% (0.9) $1,734 $2.17 4.8% --2020 1.7% (0.9) $1,655 $2.07 5.2% --2019 2.6% (0.2) $1,573 $1.97 5.2% --2018 2.9% (0.2) $1,496 $1.87 4.4% --2017 3.1% (0.1) $1,433 $1.79 3.5% --2016 3.1% (0.1) $1,385 $1.73 3.9% $1,371 $1.722015 3.2% (0.5) $1,333 $1.67 3.8% $1,320 $1.652014 3.7% (1.0) $1,284 $1.61 -0.3% $1,272 $1.592013 4.7% (0.1) $1,288 $1.61 2.4% $1,276 $1.602012 4.8% (0.7) $1,258 $1.57 1.5% $1,245 $1.562011 5.6% (0.4) $1,239 $1.55 0.7% $1,227 $1.532010 5.9% (0.4) $1,230 $1.54 0.7% $1,218 $1.522009 6.3% 0.8 $1,222 $1.53 -2.7% $1,209 $1.512008 5.5% (0.3) $1,255 $1.57 2.0% $1,243 $1.562007 5.9% (0.4) $1,231 $1.54 5.5% $1,218 $1.522006 6.3% (0.7) $1,167 $1.46 5.8% $1,155 $1.452005 7.1% (0.8) $1,103 $1.38 1.3% $1,092 $1.37
© 2017 CoStar Group Page 17As of May 14, 2017
OverviewEvanston Apartment

3 STAR SALES HISTORY
Volume Price
Year Sales Units Volume Turnover Per Unit Avg Price
YTD 0 0 $0 0.0% -- --2016 2 43 $12,212,000 2.0% $249,649 $6,106,0002015 5 88 $14,893,105 4.0% $194,595 $2,978,6212014 2 30 $9,890,000 1.4% $357,000 $4,945,0002013 8 185 $15,077,500 8.5% $126,423 $2,512,9172012 3 190 $13,975,000 8.7% $103,000 $4,658,3342011 3 32 $2,325,000 1.5% $86,126 $1,162,5002010 0 0 $0 0.0% -- --2009 2 24 $1,200,000 1.1% $300,000 $1,200,0002008 2 63 $6,750,000 2.9% $256,798 $3,375,0002007 2 55 $8,478,000 2.5% $148,909 $4,239,0002006 5 135 $23,027,500 6.2% $171,361 $3,837,9172005 2 37 $7,250,000 1.7% $188,333 $3,625,000
© 2017 CoStar Group Page 18As of May 14, 2017
OverviewEvanston Apartment

847 Chicago Ave
PREPARED BY
Kathleen Gummerson
Regional Sales & Marketing Director
Chicago Overview
The Main at 847 Chicago
112 Unit Apartment Building
Evanston, Illinois - Evanston Neighborhood

Market Analyst: Brandon Frankel - [email protected]
While Chicago’s supply wave severely intensified in 2016, the metro’s apartment fundamentals remain sturdy. Renter preferences continue to change, but developers are targeting new apartment construction in desirable locations, such as along the N. Milwaukee Avenue corridor in the North Lakefront submarket. While employment growth continues to expand Chicago’s renter-base, corporate relocations play a role in determining hotspots for optimal renter demand. However, with new deliveries beginning to outpace demand, and household income growth lagging rent growth, landlords are tempering new rent escalations. Finally, while Downtown Chicago garners the lion’s share of institutional investment, suburban assets are progressively more attractive, especially those within proximity of a transit station.
12 Mo. Deliveries in Units 12 Mo. Net Absorption Vacancy Rate 12 Mo. Rent Growth
7,765 4,382 6.4% 2.6%
Annual Trends 12 Month Change Hist. Avg. Fcst. Avg. Peak When Trough When
Vacancy 0.6% 6.6% 7.3% 8.8% 2004 Q3 3.5% 2000 Q1
Net Absorption 4,382 2,275 4,390 7,039 2015 Q1 (4,045) 2004 Q1
Net Deliveries 7,765 3,027 5,500 8,475 2016 Q4 497 2012 Q2
Rent Growth 2.6% 2.2% 2.1% 6.6% 2007 Q2 -2.4% 2009 Q4
Effective Rent Growth 4.7% 2.0% 2.1% 6.5% 2007 Q2 -2.5% 2009 Q4
Sales ($ millions) $3,785 $2,353 N/A $5,409 2016 Q4 $506 2009 Q3
KEY INDICATORS
Current Quarter Units Vacancy Rate Asking Rent Effective Rent Net Absorption Net Deliveries Under Construction
4 & 5 Star 78,574 9.9% $2,010 $1,964 517 220 14,813
3 Star 173,833 5.6% $1,161 $1,142 (11) 87 1,401
1 & 2 Star 165,366 5.6% $922 $915 (20) 0 9
Market 417,773 6.4% $1,283 $1,260 486 307 16,223
© 2017 CoStar Group Page 1As of May 14, 2017
OverviewChicago Apartment

FUNDAMENTALS
Chicago’s vacancy picture remains favorable on the whole, with a few recently supply-inundated submarkets witnessing vacancy expansions. For instance, the Downtown and Naperville/Lisle submarkets’ 2016 vacancy increases are considerably higher when compared to the metros slow vacancy ascent. Commonalities among these submarkets include substantial and growing employment bases, which drive renter-demand and subsequent apartment development. Many of Chicago’s submarkets with tight vacancies are largely overlooked by developers so far this cycle, the majority of which are distant from Downtown. Moreover, Chicago’s vacancy is slightly higher than competing Midwestern metros, such as Minneapolis and Milwaukee. However, supply-side pressure played a role in vacancy expansion, while vacancies were more stagnant in both Minneapolis and Milwaukee.
Chicago’s residents continue to move to warmer climates. Net migration ran negative once again in 2016, with about 30,000 residents moving out. High rents, cold weather, and an insufficient state budget all factor into Chicago’s negative net migration trend. The Chicago metropolitan area has not has a positive net migration quarter since 2000.
Sustained employment gains in Chicago persevered in 2016. The metro added nearly 60,000 new jobs in 2016, only slightly below employment increases in both 2014 and 2015. Job growth continues to benefit from hiring in certain sectors including professional and business services, leisure and hospitality, and construction. Together, the three sectors account for nearly 75% of new job creation in 2016. Inhibiting Chicago’s employment growth is the manufacturing and government sectors, whose growth remained stagnant in 2016. Local government employment ran negative in 2016, and federal and state payrolls in the metro are still shrinking. Given Illinois’ budgetary woes and ongoing pension reform battle, the government sector will likely remain a drag on the economy for some time to come.
Chicago’s renter-base seeks apartment communities in walkable, transit-oriented locations within proximity to employment nodes. For instance, CTA accessible lots with heavy retail presences are found in neighborhoods including Fulton Market and Wicker Park, two of the most heavily targeted areas by developers this cycle. Both neighborhoods boast an average walk score of 93, within the numeric range defined as a “Walkers Paradise”.
Leasing velocity continues to be steady in new deliveries, assuming completions are during warmer months. In suburban Naperville for instance, the Avant at the Arboretum, a 4 Star 310-unit apartment community, completed in 13Q4 and suffered a two-year lease-up period, slowed considerably by its end-of-year delivery. Chicago renters are less inclined to move during the cold winters, not to mention the family renters that may need to change their child’s school in the middle of the school year. Overall, newly constructed 4 & 5 Star communities Downtown are retaining a one-year average lease-up, with new 4 & 5 Star suburban apartments taking slightly longer.
Chicago’s suburban corporations are increasingly seeking space Downtown, reinforcing 4 & 5 Star apartment demand. However, the impact on suburban demand has been muted, as Loop-focused moves are often followed by companies taking the newly vacant suburban space. For example, Kraft-Heinz moved-into its 170,000 SF space in the Aon Center in 16Q1, leaving behind its old 700,000 SF suburban Northfield location. Medline Industries subsequently purchased the building in March, 2016 and began moving into Kraft-Heinz’s former space in 16Q4. In 2013, Capital One ditched its 558,859 SF location in suburban Mettawa for its current location at 77 S. Wacker Drive Downtown. By 14Q3, the pharmaceutical company AbbVie began moving 2,000 employees to Mettawa as part of a sublease which backfilled the entire old Capital One space. More recently, McDonald’s, announced its move from suburban Oak Brook to Fulton Market in 16Q2, which will occupy 500,000 SF upon the buildings anticipated completion in 2018. While no tenant has yet divulged plans to backfill the space, CEO Steve Easterbrook highlighted an upgraded talent pool as a key reason for the move, a common reason for relocations Downtown.
© 2017 CoStar Group Page 2As of May 14, 2017
OverviewChicago Apartment

NET ABSORPTION, NET DELIVERIES AND VACANCY RATE
© 2017 CoStar Group Page 3As of May 14, 2017
OverviewChicago Apartment

Employment growth in Chicago increasingly relies on the health of the professional and business services sector. Fortunately, the tech and management jobs that help comprise this sector grew at a rapid pace in 2016. As a result, nearly 50% of Chicago’s net employment gains in 2016 were from the professional and business services sector. Tech companies continue to explore Chicago’s West Loop and River North neighborhoods, while the growing Goose Island area provides the engine for future tech expansions. However, while Chicago gained 60,000 jobs in 2016, the metro actually took a step back from its more impressive 75,000 jobs gained in 2015. Moreover, 2016’s employment gains represent the lowest employment increase the metro has witnessed since 2011. The largest culprit in this drop-off, government employment, fell by nearly 10,000 jobs in 2016 when compared with 2015. More specifically, while state government witnessed employment stagnation, local government job growth ran negative in 2016.
Fully recovered from the downturn, Chicago has intrinsic advantages that should provide the city with a solid economic future. Two of the Windy City’s major advantages are its central, well-served location for national and international travel and its diverse workforce, which furnishes an employee base that has a broad set of skills. Plus, this is a downright cheap place to run a business compared with New York or San Francisco. These attributes recently helped the metro land the headquarters of Fortune 500 companies Archer Daniels Midland and ConAgra Foods. They also helped spur full recoveries in the advertising/PR, management, computer programming, and administrative/support-services subsectors, making the professional and business services sector one of the biggest drivers of job growth in Chicago. It should remain a major economic engine throughout the forecast, along with the education and health services and leisure and hospitality sectors. Billions have been invested during the hospital and medical-facility building boom across the city and suburbs. Enrollments at the metro’s major universities have increased in recent years, and these institutions have invested in their campuses—the University of Chicago has $1.5 billion in capital projects in the pipeline. Tourism and spending in Chicago have fully bounced back, and this industry is contributing billions to the local economy.
Pension shortfalls are a looming risk to the already moderate job growth forecast. After the $225 million property tax hike began enforcement in early 2016 to help cover pension shortfalls, in summer 2016 Mayor Rahm Emanuel floated the idea of increasing water and sewer rates. City employees are also likely to be contributing a bigger portion of their paychecks to pensions. Chicago already has one of the highest tax rates of major cities in the country, and Moody’s Investors Service reduced its credit rating last year. Continued escalation of taxes could further affect landlords’ operating expenses, cause households’ disposable income to dip, and reduce residential and business growth. Even though job gains here through the end of 2021 will probably rank in the bottom half of the pack, on an absolute basis, over 200,000 jobs could be created. That would be among the highest number of jobs added in the country and form the base for CRE investments.
Infrastructure improvements will create CRE opportunities throughout Chicagoland. Multiple transit initiatives are taking place across the metro to open new areas to investment or strengthen existing locations. For instance, the Red and Purple Modernization Program (RPM), is an initiative designed to rebuild the Red Line from Belmont to Howard and the Purple Line from Belmont to Linden. The project, scheduled to begin this year, scored success when it was announced in early 2017 that $1.1 billion in federal grants would help fund the project, along with tax increment financing. Additionally, in early 2017 Mayor Emanuel announced a $50 million project to improve the Garfield Green Line station in Washington Park. While the Garfield Gateway project will not begin until 2018, additional transit upgrades are already underway. In the East Loop, work started in 15Q2 on a $75 million station at Washington and Wabash that will replace and consolidate two nearby Wabash stations. The CTA expects it to be one of the busiest stations in the system upon completion in 2017. In Southwest Chicago, city officials announced the start of a $23 million overhaul of the Illinois Medical District Blue Line station in 17Q1. Upgrades to the station and its concourse will be made to one of the busiest stations on the Blue Line, adding to the 40-plus CTA stations that have been renovated since 2011.
ECONOMIC OVERVIEW
© 2017 CoStar Group Page 4As of May 14, 2017
OverviewChicago Apartment

JOB GROWTH IN THOUSANDS LAST 6 MONTHS BY INDUSTRY
EMPLOYMENT BY INDUSTRY
Current Jobs Current Growth 10-Year Growth Forecast Growth
NAICS Industry Jobs LQ Metro U.S. Metro U.S. Metro U.S.
Manufacturing 413 1.04 -0.3% 0.3% -1.5% -1.3% -0.4% -1.0%
Trade, Transportation and Utilities 947 1.08 0.6% 0.7% 0.2% 0.4% 0.6% 0.6%
Retail Trade 470 0.92 0.1% 0.4% -0.1% 0.3% 0.7% 0.7%
Financial Activities 308 1.14 3.6% 2.2% -1.0% 0.0% 0.5% 0.6%
Government 551 0.77 0.6% 0.7% -0.2% 0.1% 0.4% 0.7%
Natural Resources, Mining and Construction 175 0.72 0.2% 2.4% -2.5% -1.2% 1.9% 1.9%
Education and Health Services 720 0.98 1.4% 2.3% 2.2% 2.2% 0.8% 1.3%
Professional and Business Services 819 1.24 -0.1% 3.2% 1.1% 1.4% 1.6% 1.5%
Information 82 0.93 1.5% -1.2% -1.2% -0.9% 0.3% 0.1%
Leisure and Hospitality 471 0.93 1.3% 1.7% 1.6% 1.7% 0.8% 1.3%
Other Services 193 1.05 -0.4% 1.0% -0.3% 0.4% 0.3% 0.3%
Total Employment 4,678 1.00 0.7% 1.5% 0.3% 0.6% 0.7% 0.8%
© 2017 CoStar Group Page 5As of May 14, 2017
OverviewChicago Apartment

ANNUAL JOB GROWTH
DEMOGRAPHIC TRENDS
Current Level Current Growth 10-Year Growth Forecast Growth
Demographic Category Metro U.S. Metro U.S. Metro U.S. Metro U.S.
Population 9,544 324,950 0.1% 0.7% 0.2% 0.8% 0.1% 0.7%
Households 3,625 125,118 0.7% 1.2% 0.5% 0.9% 0.7% 1.1%
Median Household Income $67,312 $58,196 3.1% 2.6% 1.2% 1.6% 3.3% 3.2%
Labor Force 4,893 160,201 -1.0% 0.6% 0.2% 0.5% 0.5% 0.7%
Unemployment 4.7% 4.5% 5.6% 4.8% 7.9% 7.0% 4.4% 4.7%
POPULATION GROWTH LABOR FORCE GROWTH INCOME GROWTH
© 2017 CoStar Group Page 6As of May 14, 2017
OverviewChicago Apartment

CUMULATIVE NET ABSORPTION
© 2017 CoStar Group Page 7As of May 14, 2017
OverviewChicago Apartment

NET DELIVERIES
Chicago’s 2016 supply surge was heavily concentrated Downtown. More than half of new units delivered in 2016 were located in a Downtown neighborhood, albeit scattered throughout the submarket. However, development proposals in Downtown’s gentrifying neighborhoods, Pilsen and Little Italy, are accelerating as its east-to-west development trajectory progresses. As available land in the Loop lessens, developers are increasingly relying on the revitalizations of those neighborhoods which involve the conversions of industrial, office and condo properties to feed renter appetite for residential units Downtown and in close-in neighborhoods.
Suburban developers take advantage of Chicago’s Transit Oriented Development reform, targeting lots nearby public transportation for development. The 2015 reform allows for apartment developers building within ½ mile of a transit station to potentially provide less parking than the 1:2 parking to unit ratio agreed upon in the 2013 ordinance, in effect reducing construction costs. Since the start of 2016, all apartment deliveries within the geographic boundaries of the ordinance took advantage of new regulations. The first known developer to benefit from the 2015 ordinance supplement, Centrum Partners, completed its 35-unit community in 16Q2 in the North Lakefront submarket. The apartment, Centrum Lakeview, is adjacent to the Paulina Brown Line station and contains seven parking spaces—had this been built without the new ordinance, Centrum would have needed to build at minimum an additional ten spaces.
In Chicago’s new communities, one-bedrooms are the most commonly constructed unit-type. However, Downtown developers are more inclined to build studios than suburban developers, as 2016’s deliveries Downtown averaged 10% more studios per building than suburban new construction. In effect, Downtown’s average unit size runs smaller than in suburban Chicago, about 5% below that of suburban units in 2016. Meanwhile, one-, two, and three-bedroom unit allocations are relatively comparable in Downtown and suburban Chicago.
SUPPLY
© 2017 CoStar Group Page 8As of May 14, 2017
OverviewChicago Apartment

UNDER CONSTRUCTION PROJECTS
Property Name Submarket Stories Units Start Yr. Deliv. Yr Developer/Owner
Alta Roosevelt Downtown Chicago 33 496 2016 2019 Wood Partners
One Bennett Park Downtown Chicago 70 340 2016 2019 The Related Companie...
Ancora (Part of Riverli... Downtown Chicago 29 420 2016 2019 CMK Companies
Buckingham Place Des Plains/Arlington Heig... 5 270 2017 2019 Dearborn-Buckingham ...
SoMi Downtown Chicago 46 500 2017 2018 MB Real Estate
One South Halsted Downtown Chicago 44 492 2017 2018 F & F Realty, Ltd.
347 N Halsted St Downtown Chicago 38 373 2016 2018 Cardiff Mason Develo...
Atrium Village Phase I North Lakefront 30 405 2016 2018 Onni Group
1136 S Wabash Ave Downtown Chicago 24 320 2016 2018 Kgiles LLC
48 E Cermak Rd Downtown Chicago 19 250 2016 2018 Draper and Kramer De...
Solstice on the Park South Lakefront 24 250 2016 2018 Silliman Group, LLC
One Grant Park Downtown Chicago 76 792 2016 2018 Crescent Heights
North Park Downtown Chicago 50 444 2016 2018 Jupiter Realty Corpo...
IMD Gateway Southwest Chicago 16 200 2017 2018 Higgins Development ...
Grande Park Apartments Kendall County 3 200 2016 2018 Wilmette Development...
1001 W Chicago Ave Downtown Chicago 13 363 2016 2018 Bond Companies
170 N Green St Downtown Chicago 17 322 2017 2018 Bridgford Foods Corp...
Lakeside Village of Oak... Northeast DuPage County 4 315 2017 2018 InterForum Holdings
Promenade at Founders S... Porter County 3 304 2017 2018 Holladay Properties
3Eleven Downtown Chicago 25 245 2016 2018 John Buck Company
Cedar Street - FLATS F... Downtown Chicago 10 200 2016 2018 Cedar Street Compani...
Millennium On Lasalle Downtown Chicago 13 207 2016 2017 DLC Residential
The Sinclair North Lakefront 35 390 2015 2017 Fifield Capital Part...
Optima Signature Downtown Chicago 57 381 2015 2017 Optima, Inc.
Landmark West Loop - 10... Downtown Chicago 30 300 2016 2017 Related Midwest, LLC
The Residences at Hamil... Northeast DuPage County 4 297 2016 2017 M & R Development
Springs at Kenosha Apar... Kenosha 2 280 2016 2017 Continental Properti...
The Emerson West Cook 20 271 2016 2017 Clark Street Develop...
LINEA Downtown Chicago 33 265 2016 2017 Moceri & Roszak
Six Forty North Wells Downtown Chicago 22 251 2016 2017 JDL Development
Fountain Ridge Kenosha 227 2016 2017 Lexington Management
Marq on Main Naperville/Lisle 5 201 2016 2017 Marquette Companies
Springs at Orchard Road... Aurora 2 240 2016 2017 Continental Properti...
Deer Park Crossing Southwest Lake County 4 236 2016 2017 REVA Development Par...
© 2017 CoStar Group Page 9As of May 14, 2017
OverviewChicago Apartment

RENTS
Against the backdrop of 2015’s strong rent growth, Chicago’s 2016 rent growth appears sluggish. Rents grew by just under 2% in 2016, about half the gains witnessed in 2015. While the unceasing onslaught of supply is one catalyst for weaker growth, post-recession rent growth is nearly double that of post-recession median household income growth. Rents are increasingly becoming out of reach for a large numbers of renters, a possible reason for the recent slowdown, not to mention migration exodus.
Chicago’s Downtown achieves a significant premium over close-in submarkets, providing renters an opportunity to save money while maintaining proximity to Downtown. While the median asking rents across the metro falls below $1,300/month, Chicago’s Downtown landlords ask for about $2,300/month on average. With landlords in adjacent submarkets such as North Lakefront (60% cheaper) and South Lakefront (half the Downtown average), providing significant discounts, many renters are willing to spend more time in commute to live there. Moreover, a large market for renting single-family homes prevails in North Lakefront, as renters chose to share space with a roommate for a discounted rent.
© 2017 CoStar Group Page 10As of May 14, 2017
OverviewChicago Apartment

ASKING RENT LEVELS AND ANNUAL GROWTH
© 2017 CoStar Group Page 11As of May 14, 2017
OverviewChicago Apartment

EXPENSES
Operating Expenses Per SF Capital Expenditures Per SF
Market Mgmt. Admin. Payroll Water Utilities Maint. Insurance Taxes Appliance Structual Other Total
4 & 5 Star
Chicago $0.82 $1.15 $2.63 $0.34 $1.17 $2.14 $0.37 $3.00 $0.10 $0.44 $0.94 $13.10
CBD $0.75 $1.25 $3.67 $0.25 $0.94 $2.57 $0.39 $3.06 $0.10 $0.44 $0.95 $14.36
Suburban $0.90 $1.04 $1.59 $0.44 $1.41 $1.71 $0.34 $2.93 $0.11 $0.44 $0.93 $11.84
3 Star
Chicago $0.77 $1.10 $1.07 $0.29 $1.10 $1.79 $0.33 $1.79 $0.09 $0.41 $0.65 $9.39
CBD $0.69 $1.18 $1.26 $0.24 $0.90 $2.33 $0.35 $1.81 $0.09 $0.42 $0.66 $9.92
Suburban $0.84 $1.02 $0.88 $0.35 $1.30 $1.25 $0.31 $1.76 $0.09 $0.41 $0.64 $8.85
1 & 2 Star
Chicago $0.52 $0.71 $0.97 $0.27 $0.85 $1.22 $0.30 $1.06 $0.08 $0.39 $0.60 $6.99
CBD $0.49 $0.82 $1.08 $0.22 $0.85 $1.50 $0.33 $0.98 $0.09 $0.40 $0.62 $7.39
Suburban $0.55 $0.60 $0.86 $0.31 $0.85 $0.95 $0.27 $1.14 $0.07 $0.39 $0.59 $6.58
* Expenses are estimated using NCREIF and IREM data using the narrowest possible geographical definition ranging from zip code to region.
© 2017 CoStar Group Page 12As of May 14, 2017
OverviewChicago Apartment

SALES
SALES VOLUME AND MEDIAN PRICE
While Chicago’s Downtown assets remain heavily targeted by investors, suburban assets are increasingly attractive to dealmakers. The nearly $420,000/unit paid for the 115-unit 4 Star Park 205 in 15Q4 is one of the highest per-unit prices ever paid for a suburban multifamily asset in Chicago. The community delivered just a few months before trading hands to L&B Realty Advisors, and is next to Whole Foods and the Park Ridge Metra Station. While the price per unit is five times that of the Chicago metro price per unit in 2016, the 5% pro forma cap rate coincides with the metro average. Additionally, the Woodview Apartments, a 241-unit 5 Star suburban asset, traded in 16Q4 for over $330,000/unit at a 5% cap rate. Similar to Park 205, the Woodview Apartments deal represents new construction selling shortly after delivering. The community was purchased by LaSalle Investment Management, and is located along I-94 in Deerfield.
Pricing Downtown continues to soar, setting records in the process. Most recently, 850 N. Lake Shore Drive, a 198-unit 5 Star community located in Downtown’s Streeterville neighborhood sold for over $700,000/unit in 16Q2. The selling group, a joint venture comprised of Integrated Development Group and National Real Estate Advisors, had redeveloped the asset prior to trading it. As part of the refurbishment process, the JV knocked down walls to create larger units and high-quality finishes. The JV initially purchased the asset from Northwestern University in 2008, which was using the building for student housing. The community not only sold for more than three times the Downtown Submarket average over the past 12 months, but achieved higher pricing than the notable sales of 5 Star assets 111 West Wacker ($651,240/unit in 15Q1) and North Water Apartments ($603,799/unit in 16Q1).
© 2017 CoStar Group Page 13As of May 14, 2017
OverviewChicago Apartment

HISTORICAL SALES TRANSACTIONS
Property Submarket Sale Date Price Units Price Per Unit Built Buyer Name
Mont Clare, 7171 W Gunnison St West Cook 4/25/2017 $30,500,000 281 $108,541 1966 Rockwell Partners
The Preserve At Osprey Lake, 2025 Greystem Cir Northeast Lake County 4/13/2017 $40,411,520 483 $83,668 2000 Blackstone Real Estate
Income...
325 W Fullerton Pkwy North Lakefront 4/13/2017 $18,700,000 48 $389,583 1917 Newcastle Limited
Ashford at Geneva, 350 Brittany Ct Fox River Valley 3/30/2017 $35,450,000 226 $156,858 1990 Oak Residential
Partners, LLC
Princeton Park Homes, 9119 S Stewart Ave Southwest Chicago 3/29/2017 $23,742,500 908 $26,148 1946 EquiShares Real
Estate Compan...
Madison at Racine, 1164 W Madison St Downtown Chicago 3/14/2017 $99,600,000 216 $461,111 2014 American Realty
Advisors
The Aberdeen West Loop, 4 N Aberdeen St Downtown Chicago 3/8/2017 $40,000,000 103 $388,350 2014 Waterton Associates
LLC
East Park Tower, 5242 S Hyde Park Blvd South Lakefront 3/1/2017 $23,500,000 140 $167,857 1922 Blumberg & Freilich
Equities
Astor House, 1340 N Astor St North Lakefront 2/23/2017 $82,600,000 218 $378,899 1969 Group Fox
65 East Scott Street Building, 65 E Scott St North Lakefront 2/23/2017 $67,000,000 230 $291,304 1971 Group Fox
3905-3929 N Western Ave, 3905 N Western Ave North Lakefront 2/21/2017 $14,125,000 30 $470,833 Vestian Group Inc.
Dwell at Naperville, 1995 Yellowstone Dr Naperville/Lisle 2/16/2017 $84,000,000 400 $210,000 1998 Redwood Capital
Group, LLC
4651 N Greenview Ave North Lakefront 2/16/2017 $12,200,000 36 $338,889 The Laramar Group, LLC, Luber...
625 W Wrightwood Ave North Lakefront 1/20/2017 $19,733,500 87 $226,822 Beal Properties, LLC
Hawthorn Ridge, 3211 Fox St Naperville/Lisle 1/12/2017 $13,300,000 176 $75,568 1976 Heartland Realty
Investors, I...
The Park Towers Apartments, 3905 Tower Dr
Southern Cook County 12/31/2016 $23,090,440 270 $85,520 1974 Morgan Communities
Axis Apartments & Lofts, 441 E Erie St Downtown Chicago 12/29/2016 $225,000,000 615 $365,854 1986 Group Fox
Village Park of Palatine, 860 W Panorama Dr
Far Northwest Suburban Cook 12/28/2016 $48,250,000 448 $107,701 1977 LEM Capital, Origin
Investmen...
The Apartments At Windbrooke Crossing, 1160 Windbrooke Dr
Southwest Lake County 12/22/2016 $48,250,000 236 $204,449 1986 Resource Real Estate
Opportun...
Van Buren Morgan Place, 1002 W Van Buren St Downtown Chicago 12/22/2016 $11,950,000 26 $459,615 2014 Arbor Investment
Management, ...
Fox Valley Villages, 710 S Eola Rd Naperville/Lisle 12/21/2016 $53,750,000 420 $127,976 1986 Stadt-Sinatra
Management, LLC...
River Run, 1015 Preserve Ave North Will County 12/20/2016 $47,775,000 206 $231,918 2003 Marquette Companies,
Heitman
© 2017 CoStar Group Page 14As of May 14, 2017
OverviewChicago Apartment

Average Annual Forecast Return -0.5% 9.4%
Historical Volatility 5.9% 11.0%
Risk-Adjusted Return -0.1 1.3
Metro National Metro National Metro National
Average Annual Forecast Return 3.3% 3.5% Historical Volatility 7.7% 7.1% Risk-Adjusted
Return 0.4 0.5
Forecast Appreciation Return -2.1% -1.7% Forecast Income Return Change 0.6 0.4
PERFORMANCE
Year Price Growth Appreciation Return Income Return NOI Growth Rent Growth Total Return Cap Rate
2021 1.8% -0.4% 5.5% 2.5% 1.6% 5.1% 5.6%2020 1.5% -0.7% 5.5% 2.5% 1.9% 4.7% 5.5%2019 0.4% -1.7% 5.4% 1.7% 2.3% 3.7% 5.5%2018 -2.0% -4.1% 5.3% 1.0% 2.1% 1.1% 5.4%2017 -4.0% -6.0% 5.1% 1.9% 3.0% -1.1% 5.2%2016 6.3% 4.0% 5.0% 2.9% 2.2% 9.1% 4.9%2015 7.9% 5.5% 5.3% 2.4% 3.5% 11.0% 5.1%2014 8.0% 5.6% 5.5% 2.4% 2.3% 11.4% 5.4%2013 12.3% 9.8% 6.0% 3.3% 2.7% 16.2% 5.7%2012 10.2% 7.8% 6.4% 3.3% 2.1% 14.5% 6.2%2011 19.2% 16.5% 7.2% 2.9% 1.3% 24.5% 6.6%2010 2.0% -0.2% 7.8% -0.1% 1.7% 7.6% 7.6%2009 -16.5% -18.1% 7.2% -4.0% -2.4% -11.9% 7.8%
© 2017 CoStar Group Page 15As of May 14, 2017
OverviewChicago Apartment

CHICAGO SUBMARKETS
© 2017 CoStar Group Page 16As of May 14, 2017
OverviewChicago Apartment

SUBMARKET INVENTORIES
Inventory 12 Month Deliveries Under Construction
No. Market Bldgs Units % Metro Rank Bldgs Units Percent Rank Bldgs Units Percent Rank
1 Aurora 86 3,939 0.9% 27 2 89 2.3% 8 1 240 6.1% 5
2 DeKalb 58 4,060 1.0% 25 0 0 0.0% 1 16 0.4% 22
3 DeKalb County 4 116 0.0% 41 0 0 0.0% 0 0.0%
4 Des Plains/Arlington ... 279 15,563 3.7% 10 1 0 0.0% 2 315 2.0% 12
5 Downtown Chicago 259 35,343 8.5% 3 17 3,531 10.0% 3 37 8,790 24.9% 1
6 East Suburban McHenry 60 2,400 0.6% 33 1 0 0.0% 1 40 1.7% 15
7 Elgin/Dundee 94 3,683 0.9% 28 0 0 0.0% 1 45 1.2% 17
8 Evanston 196 6,725 1.6% 21 2 112 1.7% 12 1 101 1.5% 16
9 Far North Chicago 988 26,969 6.4% 4 2 20 0.1% 21 0 0.0%
10 Far North Suburban Co... 53 2,498 0.6% 32 2 383 15.3% 2 2 89 3.6% 10
11 Far Northwest Suburba... 147 16,177 3.9% 9 0 0 0.0% 1 192 1.2% 18
12 Fox River Valley 39 3,131 0.7% 29 0 0 0.0% 0 0.0%
13 Glen Ellyn to West Ch... 105 8,932 2.1% 15 1 149 1.7% 11 0 0.0%
14 Grundy County 14 577 0.1% 38 0 0 0.0% 0 0.0%
15 Jasper County 1 71 0.0% 42 0 0 0.0% 0 0.0%
16 Kendall County 17 1,334 0.3% 37 0 0 0.0% 1 200 15.0% 2
17 Kenosha 170 7,292 1.8% 18 4 148 2.0% 9 5 675 9.3% 3
18 Naperville/Lisle 111 17,735 4.3% 8 3 154 0.9% 16 3 384 2.2% 11
19 Near North Suburban C... 140 4,862 1.2% 24 1 6 0.1% 19 0 0.0%
20 Newton County 4 40 0.0% 43 0 0 0.0% 0 0.0%
21 North DuPage County 54 6,842 1.6% 20 0 0 0.0% 0 0.0%
22 North Lake County IN 135 8,823 2.1% 16 0 0 0.0% 0 0.0%
23 North Lakefront 2,254 64,631 15.5% 1 42 1,256 1.9% 10 26 2,597 4.0% 9
24 North Will County 129 7,797 1.9% 17 3 232 3.0% 7 2 69 0.9% 21
25 Northeast DuPage Coun... 239 10,235 2.4% 13 2 357 3.5% 6 2 612 6.0% 6
26 Northeast Lake County 211 11,081 2.6% 11 0 0 0.0% 0 0.0%
27 Northwest Chicago 979 17,746 4.2% 7 5 128 0.7% 18 0 0 0.0% 24
28 Northwest Lake County 63 3,035 0.7% 30 0 0 0.0% 0 0.0%
29 Porter County 77 6,943 1.7% 19 2 260 3.7% 5 2 363 5.2% 7
30 South Chicago 99 2,393 0.6% 34 0 0 0.0% 0 0.0%
31 South Lake County IN 59 5,957 1.4% 23 0 0 0.0% 0 0.0%
32 South Lakefront 1,197 35,824 8.5% 2 1 267 0.7% 17 3 326 0.9% 20
33 South Will County 25 389 0.1% 39 0 0 0.0% 0 0.0%
34 Southeast DuPage Coun... 111 6,584 1.6% 22 0 0 0.0% 4 266 4.0% 8
35 Southeast Lake County 45 2,226 0.5% 35 2 26 1.2% 14 1 39 1.8% 14
36 Southern Cook County 357 9,168 2.2% 14 2 10 0.1% 20 1 21 0.2% 23
37 Southwest Chicago 1,193 19,124 4.6% 5 1 181 0.9% 15 1 200 1.0% 19
38 Southwest Cook County 454 10,918 2.6% 12 0 0 0.0% 0 0.0%
39 Southwest Lake County 49 3,974 0.9% 26 0 0 0.0% 2 300 7.5% 4
40 University Park 10 1,798 0.4% 36 0 0 0.0% 0 0.0%
41 West Cook 1,095 18,156 4.4% 6 3 282 1.6% 13 2 343 1.9% 13
42 Western Kane County 5 161 0.0% 40 1 66 41.0% 1 0 0.0%
43 Western McHenry Count... 52 2,521 0.6% 31 1 108 4.3% 4 0 0.0%
© 2017 CoStar Group Page 17As of May 14, 2017
OverviewChicago Apartment

SUBMARKET RENTS
Asking Rents Effective Rents
No. Market Per Unit Per SF Rank Yr Growth Per Unit Per SF Rank Yr Growth Concessions Rank
1 Aurora $935 $0.85 29 3.2% $920 $0.84 29 5.0% 1.6% 21
2 DeKalb $803 $0.73 39 3.9% $790 $0.72 39 6.2% 1.7% 18
3 DeKalb County $681 $0.62 41 0.2% $673 $0.61 41 1.8% 1.3% 36
4 Des Plains/Arlington ... $1,249 $1.14 12 3.3% $1,235 $1.12 12 5.4% 1.4% 31
5 Downtown Chicago $2,383 $2.17 1 2.2% $2,352 $2.14 1 5.0% 2.1% 4
6 East Suburban McHenry $1,033 $0.94 21 2.1% $1,021 $0.93 21 3.8% 1.7% 14
7 Elgin/Dundee $1,038 $0.94 20 3.1% $1,031 $0.94 20 4.9% 1.1% 39
8 Evanston $1,673 $1.52 3 3.5% $1,662 $1.51 3 5.0% 1.6% 25
9 Far North Chicago $1,014 $0.92 22 3.4% $1,001 $0.91 23 5.0% 1.2% 38
10 Far North Suburban Co... $1,785 $1.62 2 4.3% $1,724 $1.57 2 7.9% 2.1% 3
11 Far Northwest Suburba... $1,242 $1.13 13 2.7% $1,221 $1.11 14 5.0% 1.6% 20
12 Fox River Valley $1,282 $1.17 11 0.8% $1,268 $1.15 11 2.3% 1.5% 29
13 Glen Ellyn to West Ch... $1,238 $1.13 14 3.3% $1,225 $1.11 13 5.2% 1.5% 26
14 Grundy County $937 $0.85 28 1.9% $929 $0.84 28 3.5% 0.9% 42
15 Jasper County $518 $0.47 42 -4.1% $507 $0.46 42 -1.6% 2.0% 6
16 Kendall County $1,176 $1.07 15 2.0% $1,161 $1.06 15 4.5% 1.7% 16
17 Kenosha $875 $0.80 33 4.1% $863 $0.78 33 5.6% 1.4% 34
18 Naperville/Lisle $1,311 $1.19 10 3.4% $1,298 $1.18 10 5.1% 1.7% 15
19 Near North Suburban C... $1,337 $1.22 9 2.5% $1,316 $1.20 9 5.0% 1.5% 28
20 Newton County $0.00 $0.00
21 North DuPage County $1,157 $1.05 16 3.4% $1,149 $1.04 16 4.3% 1.1% 41
22 North Lake County IN $845 $0.77 37 3.4% $831 $0.76 37 6.0% 1.9% 8
23 North Lakefront $1,492 $1.36 6 2.5% $1,470 $1.34 6 4.2% 1.6% 23
24 North Will County $1,149 $1.04 18 2.7% $1,138 $1.03 18 4.8% 1.8% 9
25 Northeast DuPage Coun... $1,342 $1.22 8 3.3% $1,326 $1.21 8 5.1% 1.6% 22
26 Northeast Lake County $965 $0.88 27 2.9% $955 $0.87 27 4.7% 1.4% 32
27 Northwest Chicago $977 $0.89 26 1.5% $957 $0.87 26 3.4% 1.7% 17
28 Northwest Lake County $1,003 $0.91 24 1.5% $998 $0.91 24 3.1% 1.1% 40
29 Porter County $871 $0.79 34 2.8% $859 $0.78 34 4.7% 1.7% 19
30 South Chicago $863 $0.78 36 2.0% $848 $0.77 36 3.8% 1.8% 10
31 South Lake County IN $901 $0.82 30 1.9% $886 $0.81 30 4.5% 1.9% 7
32 South Lakefront $1,070 $0.97 19 1.8% $1,056 $0.96 19 4.3% 1.8% 13
33 South Will County $829 $0.75 38 2.1% $810 $0.74 38 4.5% 1.8% 12
34 Southeast DuPage Coun... $1,157 $1.05 17 0.9% $1,142 $1.04 17 2.6% 1.5% 27
35 Southeast Lake County $1,588 $1.44 5 2.6% $1,554 $1.41 5 5.4% 1.8% 11
36 Southern Cook County $864 $0.79 35 1.0% $851 $0.77 35 2.8% 1.4% 30
37 Southwest Chicago $781 $0.71 40 2.3% $767 $0.70 40 5.0% 2.0% 5
38 Southwest Cook County $986 $0.90 25 2.6% $973 $0.88 25 4.9% 1.6% 24
39 Southwest Lake County $1,356 $1.23 7 5.1% $1,332 $1.21 7 7.2% 1.4% 33
40 University Park $882 $0.80 32 1.4% $864 $0.79 32 3.5% 2.2% 2
41 West Cook $1,014 $0.92 23 2.2% $1,002 $0.91 22 3.5% 1.3% 35
42 Western Kane County $1,635 $1.49 4 1.4% $1,599 $1.45 4 2.9% 2.3% 1
43 Western McHenry Count... $885 $0.80 31 1.8% $877 $0.80 31 2.9% 1.2% 37
© 2017 CoStar Group Page 18As of May 14, 2017
OverviewChicago Apartment

SUBMARKET VACANCY AND NET ABSORPTION
Vacancy 12 Month Absorption
No. Market Units Percent Rank Units Percent Share of Metro Rank Constrct. Ratio
1 Aurora 248 6.3% 26 32 0.8% 0.0% 18 2.8
2 DeKalb 272 6.7% 29 0 0.0% -1.4% 24 0.0
3 DeKalb County 5 4.2% 9 0 0.2% -0.7% 25 0.0
4 Des Plains/Arlington ... 778 5.0% 14 79 0.5% 0.1% 13 0.0
5 Downtown Chicago 3,888 11.0% 40 2,501 7.1% 4.7% 1 1.4
6 East Suburban McHenry 139 5.8% 22 -30 -1.2% -0.8% 34 0.0
7 Elgin/Dundee 140 3.8% 5 34 0.9% -0.1% 17 0.0
8 Evanston 370 5.5% 18 0 0.0% -0.8% 26 -373.7
9 Far North Chicago 1,106 4.1% 7 46 0.2% -0.9% 15 0.4
10 Far North Suburban Co... 297 11.9% 41 355 14.2% 15.3% 3 1.1
11 Far Northwest Suburba... 1,035 6.4% 27 -3 0.0% -1.1% 30 0.0
12 Fox River Valley 163 5.2% 15 -21 -0.7% -2.1% 32 0.0
13 Glen Ellyn to West Ch... 500 5.6% 20 124 1.4% -0.3% 10 1.2
14 Grundy County 17 3.0% 1 5 0.9% -0.1% 22 0.0
15 Jasper County 7 10.0% 38 -1 -1.3% -1.9% 29 0.0
16 Kendall County 91 6.8% 30 3 0.3% -1.0% 23 0.0
17 Kenosha 270 3.7% 4 178 2.4% 1.7% 7 0.8
18 Naperville/Lisle 1,100 6.2% 24 -160 -0.9% -1.2% 42 -1.0
19 Near North Suburban C... 267 5.5% 17 138 2.8% -0.5% 9 0.0
20 Newton County 2 4.7% 11 0 -1.0% -1.1% 27 0.0
21 North DuPage County 246 3.6% 2 -31 -0.5% -2.2% 35 0.0
22 North Lake County IN 785 8.9% 36 -110 -1.2% -1.9% 41 0.0
23 North Lakefront 3,425 5.3% 16 750 1.2% 0.1% 2 1.7
24 North Will County 616 7.9% 34 -28 -0.4% 0.1% 33 -8.4
25 Northeast DuPage Coun... 645 6.3% 25 143 1.4% 1.1% 8 2.5
26 Northeast Lake County 543 4.9% 13 -15 -0.1% -0.9% 31 0.0
27 Northwest Chicago 1,136 6.4% 28 -62 -0.3% -1.4% 36 -2.1
28 Northwest Lake County 112 3.7% 3 14 0.5% -0.7% 20 0.0
29 Porter County 417 6.0% 23 185 2.7% -0.4% 5 1.4
30 South Chicago 189 7.9% 35 -72 -3.0% -3.6% 38 0.0
31 South Lake County IN 548 9.2% 37 -92 -1.5% -1.8% 39 0.0
32 South Lakefront 2,651 7.4% 32 278 0.8% -0.2% 4 1.0
33 South Will County 29 7.5% 33 -1 -0.2% -0.5% 28 0.0
34 Southeast DuPage Coun... 369 5.6% 19 -71 -1.1% -1.9% 37 0.0
35 Southeast Lake County 154 6.9% 31 89 4.0% 2.2% 11 0.3
36 Southern Cook County 431 4.7% 10 42 0.5% -0.3% 16 0.2
37 Southwest Chicago 1,912 10.0% 39 -174 -0.9% -1.4% 43 -1.0
38 Southwest Cook County 633 5.8% 21 65 0.6% -0.3% 14 0.0
39 Southwest Lake County 191 4.8% 12 8 0.2% -0.3% 21 0.0
40 University Park 221 12.3% 42 -94 -5.3% -7.2% 40 0.0
41 West Cook 708 3.9% 6 178 1.0% 0.7% 6 1.6
42 Western Kane County 44 27.1% 43 15 9.4% 26.6% 19 4.4
43 Western McHenry Count... 103 4.1% 8 83 3.3% 2.5% 12 1.3
© 2017 CoStar Group Page 19As of May 14, 2017
OverviewChicago Apartment

MARKET FUNDAMENTALS HISTORY AND FORECAST
Inventory Net Absorption Vacancy
Year Units Growth % Growth Units % Growth Constrct. Ratio Units Percent Ppts Chg
2021 442,712 2,350 0.5% 2,772 0.7% 0.8 32,014 7.2% (0.1)
2020 440,362 2,446 0.6% 2,891 0.7% 0.8 32,436 7.4% (0.1)
2019 437,916 4,634 1.1% 3,839 1.0% 1.2 32,880 7.5% 0.1
2018 433,282 9,248 2.2% 6,502 1.6% 1.4 32,085 7.4% 0.5
2017 424,034 7,851 1.9% 5,562 1.4% 1.4 29,340 6.9% 0.4
2016 416,183 8,475 2.1% 4,164 1.1% 2.0 27,051 6.5% 0.9
2015 407,708 4,612 1.1% 5,432 1.4% 0.8 22,740 5.6% (0.3)
2014 403,096 4,908 1.2% 6,650 1.8% 0.7 23,559 5.8% (0.5)
2013 398,188 5,499 1.4% 3,677 1.0% 1.5 25,301 6.4% 0.4
2012 392,689 830 0.2% 3,121 0.9% 0.3 23,479 6.0% (0.6)
2011 391,859 525 0.1% 1,590 0.4% 0.3 25,770 6.6% (0.3)
2010 391,334 3,139 0.8% 6,431 1.8% 0.5 26,835 6.9% (0.9)
2009 388,195 2,794 0.7% (418) -0.1% -- 30,127 7.8% 0.8
2008 385,401 2,396 0.6% 3,281 0.9% 0.7 26,916 7.0% (0.3)
2007 383,005 2,816 0.7% 3,108 0.9% 0.9 27,801 7.3% (0.1)
2006 380,189 2,033 0.5% 4,162 1.2% 0.5 28,093 7.4% (0.6)
2005 378,156 1,147 0.3% 3,912 1.1% 0.3 30,222 8.0% (0.8)
MARKET RENT HISTORY AND FORECAST
Asking Rent Effective Rent
Year Per Unit Per SF Index % Growth Per Unit Per SF % Growth Concessions
2021 $1,402 $1.75 127 1.6% $1,375 $1.72 1.7% 1.9%
2020 $1,379 $1.72 125 1.9% $1,352 $1.69 2.0% 2.0%
2019 $1,353 $1.69 123 2.3% $1,326 $1.65 2.2% 2.0%
2018 $1,323 $1.65 120 2.1% $1,297 $1.62 1.9% 2.0%
2017 $1,296 $1.62 118 3.0% $1,273 $1.59 3.6% 1.8%
2016 $1,258 $1.56 114 2.2% $1,229 $1.53 1.5% 2.3%
2015 $1,231 $1.53 112 3.5% $1,211 $1.51 2.9% 1.6%
2014 $1,190 $1.48 108 2.3% $1,177 $1.47 2.8% 1.0%
2013 $1,163 $1.45 105 2.7% $1,145 $1.43 2.1% 1.5%
2012 $1,132 $1.42 103 2.1% $1,122 $1.40 2.0% 0.9%
2011 $1,109 $1.39 100 1.3% $1,099 $1.38 1.4% 0.8%
2010 $1,094 $1.37 99 1.7% $1,084 $1.36 1.7% 0.9%
2009 $1,076 $1.35 98 -2.4% $1,066 $1.34 -2.5% 0.9%
2008 $1,103 $1.39 100 2.1% $1,093 $1.37 2.1% 0.9%
2007 $1,081 $1.36 98 5.6% $1,071 $1.35 5.7% 0.9%
2006 $1,023 $1.29 93 4.7% $1,014 $1.28 4.7% 0.9%
2005 $977 $1.23 89 1.3% $968 $1.22 1.3% 0.9%
© 2017 CoStar Group Page 20As of May 14, 2017
OverviewChicago Apartment

MARKET SALES HISTORY
Volume Price Cap Rates
Year Sales Units Volume Turnover Median Per Unit Avg Price Index Overall
2017 213 8,170 $890,470 1.9% $100,500 $4,892,691 150 5.2%
2016 1,058 42,481 $5,408,712 10.2% $85,833 $5,803,340 156 4.9%
2015 961 54,022 $4,442,403 13.3% $76,667 $4,881,761 147 5.1%
2014 971 33,388 $2,941,896 8.3% $70,833 $3,272,409 136 5.4%
2013 858 34,727 $2,888,200 8.7% $62,981 $3,683,929 126 5.7%
2012 764 38,232 $2,466,453 9.7% $56,667 $3,720,140 112 6.2%
2011 629 28,259 $2,145,461 7.2% $52,959 $3,831,181 102 6.6%
2010 500 13,850 $1,061,866 3.5% $57,782 $2,391,589 85 7.6%
2009 532 15,131 $704,619 3.9% $57,500 $1,502,385 84 7.8%
2008 485 21,061 $1,249,674 5.5% $75,000 $2,808,257 100 6.8%
2007 575 32,417 $2,810,966 8.5% $75,000 $5,120,156 119 5.7%
2006 672 32,867 $2,657,259 8.6% $85,000 $3,930,857 120 5.3%
2005 751 36,591 $3,075,948 9.7% $83,927 $4,079,507 109 5.6%
© 2017 CoStar Group Page 21As of May 14, 2017
OverviewChicago Apartment

4 & 5 STAR SUPPLY AND DEMAND HISTORY AND FORECAST
Inventory Net Absorption
Year Units Growth % Growth Units % Growth Construction Ratio
2017 -- -- -- -- -- --2016 77,252 8,070 11.7% 4,975 7.8% 1.62015 69,182 4,493 6.9% 4,575 7.7% 1.02014 64,689 4,535 7.5% 4,865 9.0% 0.92013 60,154 5,422 9.9% 2,862 5.6% 1.92012 54,732 824 1.5% 1,273 2.5% 0.62011 53,908 312 0.6% 570 1.2% 0.52010 53,596 2,989 5.9% 3,444 7.5% 0.92009 50,607 2,600 5.4% 1,867 4.2% 1.42008 48,007 2,072 4.5% 1,998 4.7% 1.02007 45,935 2,404 5.5% 2,150 5.4% 1.12006 43,531 1,467 3.5% 1,423 3.7% 1.02005 42,064 745 1.8% 1,088 2.9% 0.7
4 & 5 STAR VACANCY AND RENT HISTORY AND FORECAST
Vacancy Asking Rent Effective Rent
Year Percent Ppts Chg Per Unit Per SF % Growth Per Unit Per SF
2021 10.0% (0.8) $2,083 $2.42 1.0% --2020 10.8% (0.6) $2,063 $2.39 0.9% --2019 11.3% 0.1 $2,044 $2.37 0.7% --2018 11.2% 0.8 $2,030 $2.35 0.3% --2017 10.4% (0.7) $2,023 $2.35 3.3% --2016 11.1% 3.2 $1,958 $2.22 1.2% $1,891 $2.152015 8.0% (0.7) $1,935 $2.19 3.2% $1,892 $2.142014 8.6% (1.2) $1,876 $2.12 2.2% $1,849 $2.092013 9.8% 3.7 $1,835 $2.08 3.4% $1,791 $2.032012 6.1% (0.9) $1,775 $2.02 3.0% $1,755 $2.002011 7.1% (0.5) $1,723 $1.96 2.2% $1,706 $1.942010 7.6% (1.3) $1,687 $1.92 2.4% $1,669 $1.902009 8.9% 1.0 $1,647 $1.89 -3.0% $1,630 $1.872008 7.9% (0.2) $1,698 $1.95 2.2% $1,681 $1.932007 8.1% 0.1 $1,662 $1.91 6.3% $1,645 $1.892006 7.9% (0.2) $1,563 $1.80 5.2% $1,547 $1.782005 8.1% (1.0) $1,486 $1.72 1.6% $1,471 $1.70
© 2017 CoStar Group Page 22As of May 14, 2017
OverviewChicago Apartment

4 & 5 STAR SALES HISTORY
Volume Price
Year Sales Units Volume Turnover Per Unit Avg Price
YTD 10 1,118 $194,127,518 0.0% $450,000 $27,732,5042016 59 10,721 $2,738,795,166 13.9% $291,667 $48,049,0402015 38 9,409 $1,552,657,593 13.6% $181,932 $50,085,7322014 33 9,070 $798,960,266 14.0% $151,082 $33,290,0102013 40 7,008 $1,191,362,793 11.7% $183,118 $29,784,0702012 32 7,775 $1,167,884,033 14.2% $174,889 $46,715,3602011 42 9,852 $1,181,956,543 18.3% $128,458 $34,763,4282010 27 5,019 $595,942,200 9.4% $111,449 $24,830,9242009 20 4,609 $275,841,492 9.1% $70,833 $14,517,9742008 13 4,070 $324,889,709 8.5% $86,977 $27,074,1422007 20 7,382 $919,239,136 16.1% $109,549 $57,452,4482006 19 6,490 $511,433,990 14.9% $120,852 $31,964,6242005 18 6,141 $801,612,854 14.6% $123,223 $50,100,804
© 2017 CoStar Group Page 23As of May 14, 2017
OverviewChicago Apartment

3 STAR SUPPLY AND DEMAND HISTORY AND FORECAST
Inventory Net Absorption
Year Units Growth % Growth Units % Growth Construction Ratio
2017 -- -- -- -- -- --2016 173,598 381 0.2% (449) -0.3% --2015 173,217 98 0.1% 416 0.3% 0.22014 173,119 337 0.2% 959 0.6% 0.42013 172,782 77 0.0% 270 0.2% 0.32012 172,705 6 0.0% 1,057 0.7% 0.02011 172,699 213 0.1% 444 0.3% 0.52010 172,486 98 0.1% 1,901 1.2% 0.12009 172,388 194 0.1% (1,127) -0.7% --2008 172,194 318 0.2% 896 0.6% 0.42007 171,876 387 0.2% 377 0.2% 1.02006 171,489 637 0.4% 1,811 1.1% 0.42005 170,852 402 0.2% 1,473 0.9% 0.3
3 STAR VACANCY AND RENT HISTORY AND FORECAST
Vacancy Asking Rent Effective Rent
Year Percent Ppts Chg Per Unit Per SF % Growth Per Unit Per SF
2021 6.3% 0.0 $1,241 $1.54 1.4% --2020 6.3% 0.0 $1,224 $1.52 1.8% --2019 6.2% 0.2 $1,202 $1.49 1.8% --2018 6.0% 0.2 $1,181 $1.46 1.0% --2017 5.9% 0.6 $1,169 $1.45 2.3% --2016 5.3% 0.5 $1,142 $1.41 2.8% $1,120 $1.392015 4.9% (0.2) $1,111 $1.38 4.3% $1,093 $1.362014 5.0% (0.4) $1,065 $1.32 2.7% $1,053 $1.312013 5.4% (0.1) $1,037 $1.29 2.8% $1,023 $1.272012 5.5% (0.6) $1,009 $1.25 2.1% $997 $1.242011 6.1% (0.1) $988 $1.23 1.0% $978 $1.212010 6.3% (1.0) $978 $1.21 1.2% $968 $1.202009 7.3% 0.8 $967 $1.20 -2.4% $956 $1.192008 6.6% (0.3) $991 $1.23 1.9% $980 $1.222007 6.9% 0.0 $972 $1.21 5.5% $962 $1.202006 6.9% (0.7) $922 $1.15 4.7% $912 $1.142005 7.6% (0.6) $881 $1.10 1.1% $871 $1.08
© 2017 CoStar Group Page 24As of May 14, 2017
OverviewChicago Apartment

3 STAR SALES HISTORY
Volume Price
Year Sales Units Volume Turnover Per Unit Avg Price
YTD 70 3,757 $483,991,211 0.0% $138,750 $7,934,2822016 311 20,218 $1,878,726,196 11.6% $103,226 $7,143,4462015 216 16,999 $1,843,306,274 9.8% $82,500 $8,862,0502014 235 14,009 $1,465,924,316 8.1% $80,417 $6,603,2632013 172 16,931 $1,078,957,031 9.8% $82,143 $7,145,4112012 162 20,490 $899,063,843 11.9% $85,870 $6,287,1602011 127 9,951 $601,654,724 5.8% $59,111 $5,570,8772010 66 3,871 $203,153,427 2.2% $67,742 $3,693,6992009 63 3,322 $164,334,076 1.9% $61,538 $3,222,2372008 76 8,964 $474,550,262 5.2% $83,007 $6,779,2902007 145 15,636 $1,329,557,739 9.1% $87,500 $9,429,4872006 138 11,996 $1,047,761,963 7.0% $93,158 $7,761,2002005 168 16,018 $1,217,552,490 9.4% $83,912 $7,334,654
© 2017 CoStar Group Page 25As of May 14, 2017
OverviewChicago Apartment

5/17/2017 Evanston city, Illinois
https://www.census.gov/quickfacts/table/PST045216/1724582,1714000,17,00 1/3
U.S. Census Quick Facts
QuickFacts Evanston city, Illinois
EVANSTONCITY, ILLINOIS
CHICAGO CITY, ILLINOIS ILLINOIS UNITED
STATES
People
Population
Age and Sex
Race and HispanicOrigin
PopulationCharacteristics
Housing
QuickFacts provides statistics for all states and counties, and for cities and towns with a population of 5,000 or more.
All Topics
Population estimates, July 1, 2016, (V2016) NA NA 12,801,539 323,127,513Population estimates, July 1, 2015, (V2015) 75,527 2,720,546 12,859,995 321,418,820Population estimates base, April 1, 2010, (V2016) NA NA 12,831,574 308,758,105Population estimates base, April 1, 2010, (V2015) 74,486 2,695,605 12,831,549 308,758,105Population, percent change - April 1, 2010(estimates base) to July 1, 2016, (V2016) NA NA -0.2% 4.7%
Population, percent change - April 1, 2010(estimates base) to July 1, 2015, (V2015) 1.4% 0.9% 0.2% 4.1%
Population, Census, April 1, 2010 74,486 2,695,598 12,830,632 308,745,538
Persons under 5 years, percent, July 1, 2015,(V2015) X X 6.1% 6.2%
Persons under 5 years, percent, April 1, 2010 5.8% 6.9% 6.5% 6.5%Persons under 18 years, percent, July 1, 2015,(V2015) X X 23.0% 22.9%
Persons under 18 years, percent, April 1, 2010 19.3% 23.1% 24.4% 24.0%Persons 65 years and over, percent, July 1, 2015,(V2015) X X 14.2% 14.9%
Persons 65 years and over, percent, April 1, 2010 12.2% 10.3% 12.5% 13.0%Female persons, percent, July 1, 2015, (V2015) X X 50.9% 50.8%Female persons, percent, April 1, 2010 52.4% 51.5% 51.0% 50.8%
White alone, percent, July 1, 2015, (V2015) (a) X X 77.3% 77.1%White alone, percent, April 1, 2010 (a) 65.6% 45.0% 71.5% 72.4%Black or African American alone, percent, July 1,2015, (V2015) (a) X X 14.7% 13.3%
Black or African American alone, percent, April 1,2010 (a) 18.1% 32.9% 14.5% 12.6%
American Indian and Alaska Native alone, percent,July 1, 2015, (V2015) (a) X X 0.6% 1.2%
American Indian and Alaska Native alone, percent,April 1, 2010 (a) 0.2% 0.5% 0.3% 0.9%
Asian alone, percent, July 1, 2015, (V2015) (a) X X 5.5% 5.6%Asian alone, percent, April 1, 2010 (a) 8.6% 5.5% 4.6% 4.8%Native Hawaiian and Other Pacific Islander alone,percent, July 1, 2015, (V2015) (a) X X 0.1% 0.2%
Native Hawaiian and Other Pacific Islander alone,percent, April 1, 2010 (a) Z Z Z 0.2%
Two or More Races, percent, July 1, 2015, (V2015) X X 1.9% 2.6%Two or More Races, percent, April 1, 2010 3.8% 2.7% 2.3% 2.9%Hispanic or Latino, percent, July 1, 2015, (V2015)(b) X X 16.9% 17.6%
Hispanic or Latino, percent, April 1, 2010 (b) 9.0% 28.9% 15.8% 16.3%White alone, not Hispanic or Latino, percent, July 1,2015, (V2015) X X 61.9% 61.6%
White alone, not Hispanic or Latino, percent, April 1,2010 61.2% 31.7% 63.7% 63.7%
Veterans, 2011-2015 2,173 82,840 668,933 20,108,332Foreign born persons, percent, 2011-2015 19.2% 21.1% 14.0% 13.2%
Housing units, July 1, 2015, (V2015) X X 5,317,383 134,789,944Housing units, April 1, 2010 33,181 1,194,337 5,296,715 131,704,730Owner-occupied housing unit rate, 2011-2015 54.9% 44.3% 66.4% 63.9%Median value of owner-occupied housing units,2011-2015 $348,600 $222,900 $173,800 $178,600
Median selected monthly owner costs -with amortgage, 2011-2015 $2,443 $1,859 $1,636 $1,492
Median selected monthly owner costs -without amortgage, 2011-2015 $937 $622 $574 $458
Median gross rent, 2011-2015 $1,200 $965 $907 $928Building permits, 2015 X X 19,571 1,182,582
U.S. Department of Commerce (//www.commerce.gov/) | Blogs (//www.census.gov/about/contact-us/social_media.html) | Index A-Z (//www.census.gov/about/index.html) | Glossary
(//www.census.gov/glossary/) | FAQs (//ask.census.gov/)
Search
United States Census Bureau
(//www.census.gov/en.html)

5/17/2017 Evanston city, Illinois
https://www.census.gov/quickfacts/table/PST045216/1724582,1714000,17,00 2/3
Families and LivingArrangements
Education
Health
Economy
Transportation
Income and Poverty
Businesses
Geography
ABOUT US(//www.census.gov/about.html)
Households, 2011-2015 29,263 1,035,436 4,786,388 116,926,305Persons per household, 2011-2015 2.34 2.57 2.63 2.64Living in same house 1 year ago, percent ofpersons age 1 year+, 2011-2015 78.6% 83.9% 86.8% 85.1%
Language other than English spoken at home,percent of persons age 5 years+, 2011-2015 22.6% 36.3% 22.7% 21.0%
High school graduate or higher, percent of personsage 25 years+, 2011-2015 94.0% 82.3% 87.9% 86.7%
Bachelor's degree or higher, percent of persons age25 years+, 2011-2015 66.4% 35.6% 32.3% 29.8%
With a disability, under age 65 years, percent, 2011-2015 5.1% 7.3% 7.1% 8.6%
Persons without health insurance, under age 65years, percent 7.6% 18.5% 8.1% 10.5%
In civilian labor force, total, percent of populationage 16 years+, 2011-2015 63.9% 66.3% 65.6% 63.3%
In civilian labor force, female, percent of populationage 16 years+, 2011-2015 60.0% 61.9% 60.7% 58.5%
Total accommodation and food services sales, 2012($1,000) (c) 274,749 8,996,441 27,937,381 708,138,598
Total health care and social assistancereceipts/revenue, 2012 ($1,000) (c) 1,479,404 20,064,843 83,431,778 2,040,441,203
Total manufacturers shipments, 2012 ($1,000) (c) 255,006 26,503,402 281,037,755 5,696,729,632Total merchant wholesaler sales, 2012 ($1,000) (c) 468,721 33,134,983 295,456,992 5,208,023,478Total retail sales, 2012 ($1,000) (c) 940,114 22,627,328 166,634,514 4,219,821,871Total retail sales per capita, 2012 (c) $12,463 $8,335 $12,942 $13,443
Mean travel time to work (minutes), workers age 16years+, 2011-2015 30.0 34.1 28.4 25.9
Median household income (in 2015 dollars), 2011-2015 $70,041 $48,522 $57,574 $53,889
Per capita income in past 12 months (in 2015dollars), 2011-2015 $42,790 $29,486 $30,494 $28,930
Persons in poverty, percent 13.4% 22.3% 13.6% 13.5%
Total employer establishments, 2015 X X 318,2661 7,663,938
Total employment, 2015 X X 5,427,5491 124,085,947
Total annual payroll, 2015 ($1,000) X X 289,183,5461 6,253,488,252
Total employment, percent change, 2014-2015 X X 2.2%1 2.5%
Total nonemployer establishments, 2014 X X 955,153 23,836,937All firms, 2012 8,459 291,007 1,135,017 27,626,360Men-owned firms, 2012 3,980 147,997 609,648 14,844,597Women-owned firms, 2012 3,758 123,632 417,500 9,878,397Minority-owned firms, 2012 1,988 140,109 311,684 7,952,386Nonminority-owned firms, 2012 6,194 142,470 795,129 18,987,918Veteran-owned firms, 2012 534 19,747 89,110 2,521,682Nonveteran-owned firms, 2012 7,520 263,026 1,006,885 24,070,685
Population per square mile, 2010 9,575.3 11,841.8 231.1 87.4Land area in square miles, 2010 7.78 227.63 55,518.93 3,531,905.43FIPS Code 1724582 1714000 17 00
1. Includes data not distributed by county.
This geographic level of poverty and health estimates are not comparable to other geographic levels of these estimates
Some estimates presented here come from sample data, and thus have sampling errors that may render some apparent differences between geographies statistically indistinguishable. Click the QuickInfo icon to the left of each row in TABLE view to learn about sampling error.
The vintage year (e.g., V2015) refers to the final year of the series (2010 thru 2015).Different vintage years of estimates are not comparable.
(a) Includes persons reporting only one race(b) Hispanics may be of any race, so also are included in applicable race categories(c) Economic Census - Puerto Rico data are not comparable to U.S. Economic Census data
D Suppressed to avoid disclosure of confidential informationF Fewer than 25 firmsFN Footnote on this item in place of dataNA Not availableS Suppressed; does not meet publication standardsX Not applicableZ Value greater than zero but less than half unit of measure shown
QuickFacts data are derived from: Population Estimates, American Community Survey, Census of Population and Housing, Current Population Survey, Small Area Health Insurance Estimates, SmallArea Income and Poverty Estimates, State and County Housing Unit Estimates, County Business Patterns, Nonemployer Statistics, Economic Census, Survey of Business Owners, Building Permits.

Planned Development Application
1450 Sherman Avenue
Evanston, IL 60201
14 – TRAFFIC CIRCULATION IMPACT STUDY

Planned Development Application
1450 Sherman Avenue
Evanston, IL 60201
CLARK CONSTRUCTION SITE LOGISTICS PLAN

A.O.R.30"X42"
DNUP
A.O.
R.30
"X42
"
DNUP
T
0.1
12
34
56
78
91
01
11
2
A B B.7 C C.5 D E F
A B B.7 C C.2 D E FC.8
D.9
10'-9"21'-9"
27'-6"27'-6"
27'-6"27'-6"
27'-6"27'-6"
27'-6"27'-6"
27'-6"21'-9"
16'-6" 16'-3" 9'-9" 17'-9" 16'-3" 26'-0" 14'-6"
TW
O-W
AY
TR
AFFIC
SH
ERM
AN
AV
ENU
E
TWO-WAY TRAFFIC
LAKE STREET
EXISTING2-STORY BLDG.
N.I.C.
EXISTING1-STORY BLDG.
N.I.C.
CTA PURPLE LINE
N.I.C.
RESIDENTIALLOBBY5100 SF
RETAIL5,250 SF
PARKING12 SPACES
TRASH
PUBLIC ALLEY
GARAGE
ENTRY
RES
ENTRY
RETAIL
ENTRY
PARK
39'-10"300'-0"
73'-3"
124'-0"
BIKEROOM
SERVICE
RETAIL
ENTRY
SERVICERETAIL3,565 SF
SERVICE
RETAIL
ENTRY
SHOP
MAIL / PACKAGE
25'-6"SERVICERETAIL2,835 SF
24'-0"
RAMP UP
W.S.
GASMETERS
WATER
BOOST
MAINELECROOM
EMERDIST
COMED VAULT
FIREPUMP
10' x 35' x 14' LOADING
10' x 35' x 14' LOADING
GEN
TRANS-FORMER
14'-7"
14'-0"
16'-7"
FREEZERS
31,870 GSF
SC
ALE
DA
TE
DR
AW
ING
SK
#
14
54
SH
ERM
AN
AV
E.
EVA
NS
TO
N, IL
PLA
NS
AN
D A
LL
SP
ECIFIC
AT
ION
AR
E
SU
BJEC
T T
O R
EVIS
ION
AS
DEEM
ED N
ECES
SA
RY
OR
AD
VIS
AB
LE BY
BU
ILDER
,
AR
CH
ITEC
T, O
R A
S
REQ
UIR
ED B
Y LA
W.
5/1
6/2
01
7
PR
OJEC
T
NO
RT
HFIRST FLOOR
1/32"=1'-0"

Planned Development Application
1450 Sherman Avenue
Evanston, IL 60201
VEHICULAR CIRCULATION

EXISTING2-STORY BLDG.
N.I.C.
EXISTING1-STORY BLDG.
N.I.C.
CTA PURPLE LINE
N.I.C.
METRA PACIFIC NORTH LINE
N.I.C.
TWO-WAY TRAFFIC
SHERMAN AVENUE
TW
O-W
AY
TR
AFFIC
LAK
E ST
REET
RESIDENTIALLOBBY
4,160 SF
RETAIL4,765 SF
PARKING28 SPACES
PUBLIC ALLEY
GA
RA
GE
ENT
RY
RES
ENT
RY
RET
AIL
ENT
RY
PARK
SER
VIC
E
RET
AIL
ENT
RY
SERVICERETAIL2,575 SF
SER
VIC
E
RET
AIL
ENT
RY
SERVICERETAIL
1,780 SF
RAMP UP
MAIN ELECROOM
10' x 35' x 14' LOADING
FREEZERSHC10' x 35' x 14'
LOADING
COMEDVAULT TRANSF.
ROOM
WATERSERVICE
WATERBOOSTER
GENERATORROOM
MOVE INLOBBY
RETAILTRASH
FIRE PUMPROOM
TRASHROOM
24'-0
"
73'-3
"
39'-9 5/8" 295'-3 3/8"
4'-9"
14'-0"
10' x 35' x 14' LOADING
MAIL/PACKAGEOFFICE
TELECOM
GASROOM
A.O.R.30"X42"
DNUP
A.O.R.30"X42"
DN UP
10'-9"21'-9"27'-6"27'-6"27'-6"27'-6"27'-6"27'-6"27'-6"27'-6"27'-6"21'-9"
16'-6
"16
'-3"
9'-9"
17'-9
"16
'-3"
26'-0
"14
'-6"
12 11 10 9 8 7 6 5 4 3 2 1 0.1
A A
B B
B.7
CC
C.2
C.5
C.8
D D
D.9
E
F
E
F
SCALE
DATE
DRAWING SK#
1454 SHERMAN AVE.
EVANSTON, IL
PLANS AND ALL
SPECIFICATION ARE
SUBJECT TO REVISION AS
DEEMED NECESSARY OR
ADVISABLE BY BUILDER,
ARCHITECT, OR AS
REQUIRED BY LAW. 5/31/2017
PROJECT
NORTH FIRST FLOOR1/32"=1'-0"

Planned Development Application
1450 Sherman Avenue
Evanston, IL 60201
KLOA TRAFFIC AND PARKING STUDY

Traffic Impact Study
1454 Sherman Mixed-Use Development Evanston, Illinois
Prepared for
Prepared by
June 6, 2017

1454 Sherman Evanston, Illinois i
Executive Summary A traffic impact study was conducted for the proposed mixed-use development to be located at 1454 Sherman Avenue in Evanston, Illinois. The site is currently developed with retail/commercial land uses and is bound by retail buildings/Grove Street to the north, Lake Street to the south, Sherman Avenue to the east, and a public alley/Union Pacific and CTA rail lines to the west. The plans call for approximately 292 apartment units on a three-level podium that will include approximately 9,100 square feet of retail space fronting Sherman Avenue, and a three-level parking garage to include a total of approximately 172 parking spaces. Further, a three-dock loading area for trucks will be provided off the public alley. Access to the parking garage will be from Sherman Avenue. The main pedestrian entrance/lobby to the apartments and to the individual retail spaces will be from Sherman Avenue. Alternative Modes of Transportation Accessibility to and from the area is enhanced by the various alternative modes of transportation serving the area including the following.
CTA Davis Street Purple Line Station – located approximately 7 minutes walking distance to the north of the proposed development
CTA Dempster Street Purple Line Station – located approximately 4 minutes walking distance to the south of the proposed development
Metra Rail Davis Street UP-North Line Station – located approximately 7 minutes walking distance to the north of the proposed development
CTA Bus Routes 201 and 205 in the vicinity of the site Divvy bike station at the intersection of Benson Avenue and Church Street Zipcar car sharing station at 1603 Orrington
All of the streets in the immediate area have sidewalks on both sides of the street.
Crosswalks on Sherman Avenue at its intersections with Lake Street and at Grove
Street are standard, parallel-line crosswalks. High-visibility crosswalks are recommended at these two intersections on all four legs.
The signalized intersection of Sherman Avenue and Grove Street should be
improved to include countdown pedestrian signals on all four legs of the intersection.

1454 Sherman Evanston, Illinois ii
Total Projected Traffic Conditions Traffic capacity analyses were conducted for both existing and future conditions using existing vehicle, pedestrian, and bicycle counts as a foundation for the following four intersections.
Sherman Avenue and Grove Street (signalized) Sherman Avenue and Lake Street (all-way stop sign) Elmwood Avenue and Grove Street (unsignalized) Elmwood Avenue and Lake Street (all-way stop sign)
Further, the three access drives on the east side of Sherman Avenue, opposite the site frontage were also counted. The traffic volume counts were conducted on Thursday, March 9, 2017 during the morning (7:00 to 9:00 A.M.) and the evening (4:00 to 6:00 P.M.) peak commuting periods. From this data, the weekday morning peak hour generally occurs between 8:00 and 9:00 A.M. and the weekday evening peak hour generally occurs between 5:00 and 6:00 P.M. The projected traffic conditions include the existing traffic volumes, background growth in the area from regional growth and planned developments, and the vehicle traffic estimated to be generated by the proposed development. Census data shows that over 50 percent of residents in the area use alternative modes of transportation and do not drive to/from work. Further, the Census data shows that 52 percent of the residents renting in the area do not own a vehicle. As such, the alternative modes of transportation serving the area has resulted in a significant reduction in the traffic generated by area residential developments, particularly during the critical weekday morning and evening commuter peak periods. Therefore, estimated vehicle traffic volumes for this area were reduced by 50 percent. It is important to note that the existing traffic volumes captured traffic being generated by the existing retail/commercial uses on the subject development site, but were not discounted. As such, adding the projected retail trip generation vehicles to the existing peak hour volumes represents a conservative study. The results of the capacity analyses show that with the addition of the development traffic and the background traffic, all of the intersections outlined above are projected to continue to operate at generally the same acceptable levels of service.

1454 Sherman Evanston, Illinois iii
Garage Access
The access drive to the garage ramp is proposed to be located off Sherman Avenue, approximately in the same location as the existing access drive serving the retail parking lot for the existing land uses on the site.
The proposed access drive will operate at acceptable levels of service and delay relative to the three existing access drives on Sherman Avenue on the east side of the street.
No loss of on-street parking on the west side of Sherman Avenue is anticipated since the proposed access drive will replace the access driveway that serves the existing surface parking lot.
Sherman Avenue provides two through lanes southbound and one lane northbound between Grove Street and Lake Street. No improvements are needed or recommended on Sherman Avenue at the proposed access drive to accommodate the peak hour turning volumes.
The access will provide one lane inbound and one lane outbound under stop sign control.
The access has ample visibility for vehicles exiting the garage. The access will be gated and have flashing lights and audible warning signals to
alert pedestrians on Sherman Avenue of an approaching exiting vehicle. A high-visibility crosswalk is recommended across the proposed access drive.
Loading/Refuse Access Three loading docks for the shared use of the residential and retail uses will be located off the public alley on the west face of the building. The refuse will be located off the public alley as well. It is expected that all trucks will enter the public alley from Lake Street and proceed north to the loading dock area. Upon exiting, the truck will proceed north on the public alley and exit onto Grove Street. Parking The development will provide a total of approximately 172 parking spaces, at a parking ratio of 0.59 spaces per unit. Approximately 12 parking spaces on the first floor will be reserved for retail/public use during the day, and two of those spaces will be dedicated car-sharing spaces. The on-site parking supply (0.59 parking ratio) considers the following. The development is a transit-oriented development (TOD) and is located in the
city’s transit-oriented downtown development district. TOD districts are urban environments which promote pedestrian mobility and interactivity with convenient and nearby goods and services without requiring the use of an automobile.

1454 Sherman Evanston, Illinois iv
Census tract data shows that 52 percent of renter households in the area do not own a vehicle.
Further, the Census tract data for renter households with two or more bedrooms
shows that 50 percent of the households own vehicles. Therefore, the proposed 0.59 parking ratio is consistent with the residential and vehicle ownership characteristics of the area.
Two car-sharing stations are proposed to be located within the garage, and are also located in proximity to the site. This will further encourage residents to not own a vehicle. Information provided by ZipCar states that one shared car removes approximately 15 private vehicles from the street system.
The E2 residential development, located at 1890 Maple Avenue, provides a parking
supply of 1.0 (353 parking spaces for 353 rental units). The peak garage parking occupancy was determined to be 45 percent. As such, there are over 190 parking spaces available at any given time.
Limited observations of the Holiday Inn parking garage located on the east side of
Sherman Avenue across from the proposed development show a low parking occupancy.
The Sherman Plaza parking garage is located approximately 800 feet from the proposed development and provides approximately 1,282 public parking spaces. A car count report obtained from the City of Evanston shows that over a five month period (January 2017 to May 2017) the parking garage had an average occupancy of 51 percent during the morning peak period and an average occupancy of 54 percent during the afternoon peak period. As such, on average, 500 parking spaces or more are available at any given time.
The Maple Avenue garage (Maple Avenue and Clark Street) is located less than
one-fourth of a mile from the proposed development and provides approximately 1,340 public parking spaces. A car count report obtained from the City of Evanston shows that over a five month period (January 2017 to May 2017) the parking garage had an average occupancy of 40 percent during the morning peak period and an average occupancy of 48 percent during the afternoon peak period. As such, on average, over 650 parking spaces are available at any given time. It is important to note that the garage has a slightly higher occupancy during the evenings because of the nearby theater.
Paybox parking is provided on Sherman Avenue and on Grove Street in the vicinity
of the site.

1454 Sherman Evanston, Illinois v
A bicycle storage room will be provided on the ground floor, thereby further increasing the incentive to commute via bicycling rather than driving.
Divvy bicycle stations are located in proximity to the site.

1454 Sherman Evanston, Illinois 1
1. Introduction This report summarizes the methodologies, results and findings of a traffic impact study conducted by Kenig, Lindgren, O’Hara, Aboona, Inc. (KLOA, Inc.) for the proposed mixed-use development to be located at 1454 Sherman Avenue in Evanston, Illinois. The site is currently developed with retail/commercial land uses and is bound by retail buildings/Grove Street to the north, Lake Street to the south, Sherman Avenue to the east, and a public alley/Union Pacific and CTA rail lines to the west. The plans call for approximately 292 apartment units on a three-level podium that will include approximately 9,100 square feet of retail space fronting Sherman Avenue, and a three-level parking garage to include a total of approximately 172 parking spaces. Further, a three-dock loading area for trucks will be provided off the public alley. Access to the parking garage will be from Sherman Avenue. The main pedestrian entrance/lobby to the apartments and to the individual retail spaces will be from Sherman Avenue. The proposed development is located in an area that promotes pedestrian and bicycle activity. Sidewalks, bicycle lanes, and crosswalks are located on the surrounding roadway network. Goods and services and major public transportation stations are also conveniently located nearby, thereby further reducing the need for a vehicle. The following sections of this report present the following. Existing street conditions including vehicle, pedestrian, and bicycle traffic
volumes for the weekday morning and weekday evening peak hours A detailed description of the proposed development Vehicle trip generation for the proposed development Directional distribution of development-generated traffic Future transportation conditions including access to and from the development

1454 Sherman Evanston, Illinois 2
Traffic capacity analyses were conducted for the weekday morning and weekday evening peak hours for the following two conditions. 1. Existing Condition - Analyzes the capacity of the existing street system using
existing peak hour traffic volumes in the surrounding area. 2. Future Condition – The future projected traffic volumes include the existing
traffic volumes, regional growth in traffic, and the traffic estimated to be generated by the proposed subject development.
The purpose of this study is as follows:
1. To examine existing vehicle, pedestrian, and bicycle traffic conditions to establish a base condition
2. Determine the vehicle trips to be generated by the proposed development
and then determine its impact on the surrounding neighborhood street network
3. Recommend improvements to effectively mitigate and accommodate the
projected traffic conditions resulting from the proposed development.

1454 Sherman Evanston, Illinois 3
2. Existing Conditions Transportation conditions in the vicinity of the site were inventoried to obtain a basis for projecting future conditions. Four components of existing conditions were considered:
1. The geographic location of the site
2. The locations and availability of alternative modes of transportation, including public transportation, bicycle lanes, and pedestrian amenities
3. The characteristics of the adjacent street system, including lane geometry, traffic
orientation (e.g. one-way street pairings) and intersection traffic controls 4. The weekday peak-hour vehicle, bicycle, and pedestrian traffic volumes at the
study intersections Site Location The development site is located at 1454 Sherman Avenue in Evanston, Illinois. The site is currently developed with retail/commercial land uses and is bound by retail buildings/Grove Street to the north, Lake Street to the south, Sherman Avenue to the east, and a public alley/Union Pacific and CTA rail lines to the west. Figure 1 shows the site location with respect to the surrounding street system. Figure 2 shows an aerial view of the site area.

1454 Sherman Evanston, Illinois 4
SITE LOCATION Figure 1
SITE

1454 Sherman Evanston, Illinois 5
AERIAL VIEW OF SITE AREA Figure 2
SITE

1454 Sherman Evanston, Illinois 6
Existing Street System Characteristics The characteristics of the existing streets in the study area are illustrated in Figure 3 and described below. All of the streets are under the jurisdiction of the City of Evanston. Sherman Avenue is a north-south street that provides two southbound lanes and one northbound lane in the vicinity of the site. Restricted parking, loading areas, and paybox parking is provided on both sides of the street. There are no exclusive left-turn lanes on Sherman Avenue between Lake Street and Grove Street. Grove Street is a two-lane, east-west street. Paybox parking is provided on both sides of the street with time restrictions during the early morning hours. There are no exclusive left-turn lanes on Grove Street between Elmwood Avenue and Sherman Avenue. Lake Street is a two-lane, east-west street that provides an established bicycle lane for both directions of travel. Restricted/permit parking is available on both sides of the street. Elmwood Avenue is a north-south, two-lane street that has restricted parking on both sides of the street. Public Alley runs north-south and north of Grove Street and south of Lake Street, providing delivery/refuse access to the developments fronting Sherman Avenue.

SITE
12' 10" CLEARANCE
WEIGHT LIMIT
4 TON GROSS
& HOLIDAYS
EXCEPT SUNDAYS
30 MIN 9AM-6PM
PARKING
VISITOR
30 MIN
ONLY
VEHICLES
FIRE DEPT
1PM
8AM-
SUN
EXCEPT CARS
WEIGHT LIMIT
4 TON GROSS
LOT
PARKING
PERMIT
DEPARTMENT
POLICE
EVANSTON
ANY TIME
OR PARKING
NO STANDING
GARAGE
PARKING
PUBLIC
VEHICLES ONLY
EMERGENCY
M-F 8AM-5PM
VEHICLES ONLY
EMERGENCY
M-F 8AM-5PM
6AM
3AM-
6AM
3AM-
6AM
3AM-
6AM
3AM-
6AM
3AM-
6AM
3AM-
6AM
3AM-
3AM-6AM
& HOLIDAYS
EXCEPT SUN
2 HR 9AM-6PMRETAIL
INN
HOLIDAY
N
NOT TO SCALE
UNIO
N
PA
CIFIC
NO
RT
H
LIN
E
CT
A
PU
RP
LE
LIN
E
PROPOSED
ACCESS DRIVE
AV
EN
UE
EL
MW
OO
D
STREET
LAKE
AV
EN
UE
SH
ER
MA
N
ACCESS
GARAGE
ENTRANCE
GARAGE
EXIT
GARAGE
STREET
GROVE
ALLE
Y
- SPEED BUMP
& PERMIT F
SUN & HOLIDAYS
9AM-6PM EXCEPT
- 2 HR PARKING
& PERMIT B
SUN & HOLIDAYS
9AM-6PM EXCEPT
- 2 HR PARKING
PP
PPP
P
P P
P
P
P
P
P
P
P
P
PP
P
P P
P
P
P
P
P P P
P
P
P P
L
P
P
P
P
P
P
P
P
P P
P
P
P
LEGEND
- TRAVEL LANE
- TRAFFIC SIGNAL
- STOP SIGN
- NO PARKINGP
P
- BUS STOP
- BIKE LANE
P - PAYBOX PARKING
- LOADING AREAL
- CROSSWALK
PARKING- ON-STREET
FP
PB
F
F F
F
B
B
Existing Roadway Characteristics
Figure: 3
Kenig,Lindgren,O'Hara,Aboona,Inc.
Job No: 17-066
Evanston, Illinois
1454 Sherman
7

1454 Sherman Evanston, Illinois 8
Alternative Modes of Transportation Accessibility to and from the area is enhanced by the various alternative modes of transportation serving the area including the following. CTA Davis Street Purple Line Station – located approximately 7 minutes
walking distance to the north of the proposed development CTA Dempster Street Purple Line Station – located approximately 4 minutes
walking distance to the south of the proposed development
Metra Rail Davis Street UP-North Line Station – located approximately 7 minutes walking distance to the north of the proposed development
CTA Bus Routes 201 and 205 in the vicinity of the site
Pedestrian Facilities Sidewalks are provided on the entire surrounding street network. Standard crosswalks are provided at all of the study intersections. High-visibility crosswalks are recommended at the intersections of Sherman Avenue with Grove Street and Lake Street. The signalized intersection of Sherman Avenue and Grove Street should be improved to include countdown pedestrian signals on all four legs of the intersection. Bicycle Facilities It is important to note that the surrounding streets are within a public transit-oriented area, which naturally promotes and encourages pedestrian and bicycle activity. As noted, there is an established bicycle lane for both directions of travel on Lake Street. Mode-Sharing Transportation Availability The proposed development will provide two car-sharing spaces. Based on the ZipCar website, each shared car removes approximately 15 personal vehicles from the road. Car-sharing vehicle sites are also available within walking distance of the site, including the car sharing station located at 1603 Orrington. Also, there are approximately 10 bicycle sharing (e.g. Divvy) stations in the City of Evanston, with the closest at the intersection of Benson Avenue and Church Street. Further, bicycle racks are located at major retail and residential developments within the

1454 Sherman Evanston, Illinois 9
surrounding area of the proposed development. Lastly, the proposed development will provide bicycle racks to the general public on Sherman Avenue, as well as a secured bicycle storage room for the residents of the site. Census data shows that over 50 percent of residents in the area use alternative modes of transportation and do not drive to/from work. Further, the Census data shows that 52 percent of the residents renting in the area do not own a vehicle. Therefore, the alternative modes of transportation serving the area has resulted in a significant reduction in the traffic generated by area residential developments, particularly during the critical weekday morning and evening commuter peak periods. Existing Traffic Volumes Turning movement vehicle, pedestrian, and bicycle traffic counts were conducted on Thursday, March 9, 2017 during the morning (7:00 to 9:00 A.M.) and the evening (4:00 to 6:00 P.M.) peak commuting periods of traffic at the following four intersections.
Sherman Avenue and Grove Street (signalized) Sherman Avenue and Lake Street (all-way stop sign) Elmwood Avenue and Grove Street (unsignalized) Elmwood Avenue and Lake Street (all-way stop sign)
Further, the three access drives on the east side of Sherman Avenue, opposite the site frontage were also counted. From this data, the weekday morning peak hour generally occurs between 8:00 and 9:00 A.M. and the weekday evening peak hour generally occurs between 5:00 and 6:00 P.M. These two respective peak hours will be used for the traffic capacity analyses and are presented later in this report. It is important to note that the existing peak hour traffic volumes include the traffic generated by the existing retail development located on-site. These traffic volumes were not removed when projecting future traffic conditions to provide for a conservative analysis. The existing peak hour vehicle traffic volumes are shown in Figure 4. The existing peak hour pedestrian and bicycle traffic volumes are shown in Figure 5.

SITE
N
NOT TO SCALE
PROPOSED
ACCESS DRIVE
AV
EN
UE
EL
MW
OO
D
STREET
LAKE
AV
EN
UE
SH
ER
MA
N
ACCESS
GARAGE
ENTRANCE
GARAGE
EXIT
GARAGE
STREET
GROVE
ALLE
YC
TA
PU
RP
LE
LIN
EU
NIO
N
PA
CIFIC
NO
RT
H
LIN
E
30 (7
4)
60 (1
56)
27 (6
0)
11 (1
4)
129 (7
7)
11 (24)
24 (1
3)
19 (1
9)
18 (13)
12 (1
7)
25 (1
4)
36 (4
8)
43 (9
3)
15 (1
7)
12 (2
5)
53 (40)65 (104)16 (33)
48 (48)93 (91)
66 (59)
17 (10)
2 (4)
2 (0)
12 (7)
4 (6)
101 (213)
4 (14)
3 (7)
193 (117)
5 (9)
4 (3)
5 (4)
4 (1
0)
5 (1
3)
6 (10)
135 (178)
8 (14)
20 (6)
201 (181)
16 (3)
107 (113)
6 (6)
141 (117)
13 (8)
102 (2
41)
8 (18)
169 (1
19)
192 (1
60)
3 (2)
1 (0)
1 (1)
0 (1)
119 (2
83)
193 (1
56)
10 (4)
119 (2
84)
8 (8)
193 (1
56)
126 (2
92)
3 (5)
1 (14)
LEGEND
00
(00)
- AM PEAK HOUR (8:00-9:00 AM)
- PM PEAK HOUR (5:00-6:00 PM)
Figure: 4
Kenig,Lindgren,O'Hara,Aboona,Inc.
Job No: 17-066
Existing Traffic VolumesEvanston, Illinois
1454 Sherman
10

SITE
N
NOT TO SCALE
PROPOSED
ACCESS DRIVE
AV
EN
UE
EL
MW
OO
D
STREET
LAKE
AV
EN
UE
SH
ER
MA
N
ACCESS
GARAGE
ENTRANCE
GARAGE
EXIT
GARAGE
STREET
GROVE
ALLE
YC
TA
PU
RP
LE
LIN
EU
NIO
N
PA
CIFIC
NO
RT
H
LIN
E
35 (55)
26 (46)
67 (1
07)
75 (1
56)
22 (18)
24 (3
4)
10 (1
6)
22 (34)
26 (23)
66 (8
2)
20 (3
4)
0 (0)
0 (2)
2 (1)
1 (2)
5 (1
0)
6 (1
1)
1 (9)
1 (2)
9 (3)
2 (1)
2 (2)
10 (3)
1 (6)
LEGEND
00
(00)
- AM PEAK HOUR (8:00-9:00 AM)
- PM PEAK HOUR (5:00-6:00 PM)
- PEDESTRIAN VOLUME
- BICYCLE VOLUME
00 (00)
00 (00)
42 (90)
100 (92)
2 (1)
Figure: 5
Kenig,Lindgren,O'Hara,Aboona,Inc.
Job No: 17-066
Traffic VolumesExisting Pedestrian and Bicycle
8 (24)
6 (4)
5 (1)
2 (0)
0 (0)
Evanston, Illinois
1454 Sherman
11

1454 Sherman Evanston, Illinois 12
3. Traffic Characteristics of 1454 Sherman To evaluate the impact of the subject development on the area street system, it was necessary to quantify the number of vehicle trips the overall site will generate during the weekday morning and the weekday evening peak hours and then determine the directions from which this traffic will approach and depart the site. Proposed Site and Development Plan The site is currently an existing retail development. The existing building will be removed in its entirety to accommodate this proposed development. The plans call for approximately 292 apartment units on a three-level podium that will include approximately 9,100 square feet of retail space on the first/ground floor, fronting Sherman Avenue. Parking The three-level podium will contain a parking garage, providing a total of approximately 172 parking spaces. The first floor will provide a total of 28 parking spaces, which includes 8 tandem spaces (16 parking spaces) for the exclusive use of residents. The remaining 12 parking spaces will be reserved for retail/public use during the day, and two of those spaces will be dedicated car-sharing spaces. A parking evaluation is provided later in this report.

1454 Sherman Evanston, Illinois 13
Vehicle Access to the Development The existing retail development has a single access driveway on Sherman Avenue. The subject development proposes a single access driveway approximately in the same location as the existing driveway apron to provide access to the ground floor parking, as well as access the secured residential garage on the upper levels. The access will provide one lane inbound and one lane outbound under stop sign control. Loading/Refuse Access Three loading dock areas for trucks serving both the residents and the commercial space will be provided off the public alley. The refuse will be located off the public alley as well. It is expected that all trucks will access the alley from Lake Street, proceed north and pull in to the respective loading docks areas. When departing, the trucks will reverse from the loading dock area and then pull forward to exit onto Grove Street to the north. Pedestrian Access to the Development The main pedestrian entrance/lobby to the apartments and to the retail space will be from Sherman Avenue. Bicycle Storage A bicycle storage room for the residents will be located on the ground level. A minimum of 128 bicycle spaces will be provided, thereby satisfying the City of Evanston’s required ratio of one bicycle space per 1.5 dwelling units. Providing this bicycle storage room will further increase the incentive to commute via bicycling rather than driving or owning a vehicle. Directional Distribution of Development Traffic The directional distribution of how development traffic will approach and depart the site was estimated based on a combination of existing travel patterns and the orientation and physical restrictions of the surrounding street system. The estimated directional distribution for the proposed development was established and is illustrated in Figure 6.

SITE
N
NOT TO SCALE
AV
EN
UE
EL
MW
OO
D
STREET
LAKE
AV
EN
UE
SH
ER
MA
N
ACCESS
GARAGE
ENTRANCE
GARAGE
EXIT
GARAGE
STREET
GROVE
ACCESS DRIVE
PROPOSED
ALLE
YC
TA
PU
RP
LE
LIN
EU
NIO
N
PA
CIFIC
NO
RT
H
LIN
E
LEGEND
00%
(5%)
(5%)
15%
(5%)
35
%
25
%35
%
65
%
15%
15%
5% 5%5%
(25
%)
(35%)
(65%)
(15%)
(15
%)
(35
%)
(15
%)
- PERCENT INBOUND DISTRIBUTION
- PERCENT OUTBOUND DISTRIBUTION(00%)
Figure: 6
Kenig,Lindgren,O'Hara,Aboona,Inc.
Job No: 17-066
Estimated Directional DistributionEvanston, Illinois
1454 Sherman
14

1454 Sherman Evanston, Illinois 15
Development Traffic Generation The estimates of vehicle traffic to be generated by the development are based upon the proposed land use types and sizes. The volume of traffic generated was estimated using data published in the Institute of Transportation Engineers (ITE) Trip Generation Manual, 9th Edition. However, the ITE trip rates are based on suburban rates where the primary mode of transportation is the automobile. Given the Census data noted earlier, the location of the development within a dense, urban area and its proximity to alternative modes of transportation, the trip rates provided in the Trip Generation Manual were reduced by 50 percent. Table 1 tabulates the total trips anticipated from this proposed development for the weekday morning and weekday evening peak hours. It is important to note that the existing traffic volumes captured traffic being generated by the existing retail/commercial uses on the subject development site, but were not discounted. As such, adding the projected retail trip generation vehicles to the existing peak hour volumes represents a conservative study. Development Traffic Assignment The peak hour traffic volumes projected to be generated by the proposed development (refer to Table 1) were assigned to the area streets based on the directional distribution analysis (Figure 6). Figure 7 shows the assignment of the development-generated traffic volumes. It is important to note that while it was assumed for purposes of the analyses that all of the retail traffic would use the garage, it is anticipated that the majority of the retail traffic will utilize available on-street and off-street parking in the area.

1454 Sherman Evanston, Illinois 16
Table 1 ESTIMATED DEVELOPMENT-GENERATED TRAFFIC VOLUMES
ITE Land-
Use Code
Weekday A.M.Peak Hour
Weekday P.M.Peak Hour Weekday
Type/Size In Out In Out Two-Way Traffic
220 Apartments 292 units 30 120 118 64 1,805
Less 50% Reduction1: -16 -62 -61 -33 -939
Total Residential Trips: 14 58 57 31 866
826 Retail 9,100 s.f. 3 4 20 25 465
Less 50% Reduction1: -2 -2 -11 -13 -242
Total Retail Trips: 1 2 9 12 223
Total Development Trips: 15 60 66 43 1,089
1Based on Census data that over 50 percent of residents either do not own a vehicle or use alternative modes of transportation to commute.

SITE
N
NOT TO SCALE
AV
EN
UE
EL
MW
OO
D
STREET
LAKE
AV
EN
UE
SH
ER
MA
N
ACCESS
GARAGE
ENTRANCE
GARAGE
EXIT
GARAGE
STREET
GROVE
ACCESS DRIVE
PROPOSED
ALLE
YC
TA
PU
RP
LE
LIN
EU
NIO
N
PA
CIFIC
NO
RT
H
LIN
E
15 (1
1)
21 (1
5)
1 (3)
3 (2)
4 (1
6)
1 (3)1 (3)
3 (2)
3 (2)
6 (2
2)
2 (10)
9 (6)
2 (10)
5 (2
4)
2 (10)
21 (15)
39 (28)
9 (6)
2 (1
6)
9 (6)
9 (4
4)
9 (4
4)
39 (2
8)
6 (2
2)
LEGEND
00
(00)
- AM PEAK HOUR (8:00-9:00 AM)
- PM PEAK HOUR (5:00-6:00 PM)
Figure: 7
Kenig,Lindgren,O'Hara,Aboona,Inc.
Job No: 17-066
Traffic VolumesEstimated Development-Generated
Evanston, Illinois
1454 Sherman
17

1454 Sherman Evanston, Illinois 18
4. Total Projected Traffic Conditions The total projected traffic volumes include the existing traffic volumes, traffic estimated to be generated by regional growth in the area, and the traffic estimated to be generated by the proposed subject development. Regional Growth in Traffic To account for the increase in existing traffic related to regional growth in the area (i.e. not attributable to any particular planned development) for Year 2019 conditions, the existing traffic volumes were increased by a total of one percent. This percentage increase is based on population forecasts provided by the Chicago Metropolitan Agency for Planning (CMAP) in the Goto 2040 projection spreadsheet dated October 11, 2014 that is located on the CMAP website. Total Projected Traffic Volumes Total projected traffic volumes include the existing traffic volumes increased by a regional growth factor of one percent, and the traffic estimated to be generated by the proposed subject development (refer to Figure 7). Figure 8 shows the total projected traffic volumes.

SITE
N
NOT TO SCALE
AV
EN
UE
EL
MW
OO
D
STREET
LAKE
AV
EN
UE
SH
ER
MA
N
ACCESS
GARAGE
ENTRANCE
GARAGE
EXIT
GARAGE
STREET
GROVE
ACCESS DRIVE
PROPOSED
ALLE
YC
TA
PU
RP
LE
LIN
EU
NIO
N
PA
CIFIC
NO
RT
H
LIN
E
40 (8
1)
82 (1
74)
37 (6
7)
12 (1
5)
14 (35)
25 (1
4)
20 (2
0)
19 (14)
13 (1
8)
26 (1
5)
37 (4
9)
44 (9
4)
19 (2
0)
16 (2
8)
54 (41)66 (105)18 (37)
49 (49)94 (92)10 (22)
69 (70)
18 (11)
21 (15)
39 (28)
13 (8)
3 (1)
3 (5)
5 (7)
105 (217)
5 (15)
4 (8)
196 (121)
6 (10)
5 (4)
107 (2
58)
187 (1
31)
135 (3
17)
3 (5)
1 (14)
219 (1
74)
8 (8)
122 (3
01)
6 (2
2)
9 (4
4)
198 (1
59)
10 (4)
1 (0)
1 (1)
3 (2)
217 (2
07)
108 (114)
7 (7)
142 (118)
135 (1
02)
14 (9)
6 (1
4)
5 (1
1)
6 (5)
7 (11)
145 (186)
9 (15)
21 (7)
205 (193)
17 (4)
LEGEND
00
(00)
- AM PEAK HOUR (8:00-9:00 AM)
- PM PEAK HOUR (5:00-6:00 PM)
Total Projected Traffic Volumes
Figure: 8
Kenig,Lindgren,O'Hara,Aboona,Inc.
Job No: 17-066
161 (3
28)
0 (1)
Evanston, Illinois
1454 Sherman
19

1454 Sherman Evanston, Illinois 20
5. Traffic Analysis and Recommendations Capacity analyses were performed for the key intersections included in the study area to determine the ability of the existing street system to accommodate existing and future traffic demands. Traffic capacity analyses were performed for the existing and total projected peak hour traffic conditions. The traffic analyses were performed using the methodologies outlined in the Transportation Research Board’s Highway Capacity Manual (HCM), 2010 and using Synchro/SimTraffic software. The analyses for the traffic-signal controlled intersection of Sherman Avenue and Grove Street were accomplished using existing signal timing data provided by the City of Evanston to determine the average overall vehicle delay, volume-to-capacity ratios, and levels of service. The analysis for the unsignalized intersections determines the average control delay to vehicles stopped at an intersection. Control delay is the elapsed time from a vehicle joining the queue at a stop sign (includes the time required to decelerate to a stop) until its departure from the stop sign and resumption of free flow speed. The methodology analyzes each intersection approach controlled by a stop sign and considers traffic volumes on all approaches and lane characteristics. The ability of an intersection to accommodate traffic flow is expressed in terms of level of service, which is assigned a letter grade from A to F based on the average control delay experienced by vehicles passing through the intersection. Control delay is that portion of the total delay attributed to the traffic signal or stop sign control operation, and includes initial deceleration delay, queue move-up time, stopped delay, and final acceleration delay. Level of Service A is the highest grade (best traffic flow and least delay), Level of Service E represents saturated or at-capacity conditions, and Level of Service F is the lowest grade (oversaturated conditions, extensive delays).

1454 Sherman Evanston, Illinois 21
The Highway Capacity Manual definitions for levels of service and the corresponding control delay for both signalized and unsignalized intersections are shown in Table 2. A summary of the level of service/delay results for both existing and future conditions are presented in Table 3 and Table 4, respectively. A discussion of the intersections and recommendations follows.

1454 Sherman Evanston, Illinois 22
Table 2 LEVEL OF SERVICE CRITERIA Unsignalized Intersections
Level of Service Average Control Delay (seconds per vehicle) A 0 - 10
B > 10 - 15
C > 15 – 25
D > 25 – 35
E > 35 – 50
F > 50
Signalized Intersections
Level of Service
Interpretation
Average Control Delay
(seconds per vehicle) A Favorable progression. Most vehicles arrive during the green
indication and travel through the intersection without stopping.
10
B Good progression, with more vehicles stopping than for Level of Service A.
> 10 - 20
C Individual cycle failures (i.e. one or more queued vehicles are not able to depart as a result of insufficient capacity during the cycle) may begin to appear. Number of vehicles stopping is significant, although many vehicles still pass through the intersection without stopping.
> 20 - 35
D The volume-to-capacity ratio is high and either progression is ineffective or the cycle length is too long. Many vehicles stop and individual cycle failures are noticeable.
> 35 – 55
E Progression is unfavorable. The volume-to-capacity ratio is high and the cycle length is long. Individual cycle failures are frequent.
> 55 – 80
F The volume-to-capacity ratio is very high, progression is very poor, and the cycle length is long. Most cycles fail to clear the queue.
> 80
Source: Highway Capacity Manual, 2010.

1454 Sherman Evanston, Illinois 23
Table 3 CAPACITY ANALYSES RESULTS—EXISTING CONDITIONS
Weekday A.M. Peak Hour
Weekday P.M. Peak Hour
Intersection LOS – Delay LOS – Delay
Grove Street and Sherman Avenue (signal) B – 12.4 B – 12.8
Lake Street and Sherman Avenue (all-way stop sign) B – 10.4 B – 10.2
Lake Street and Elmwood Avenue (all-way stop sign) A – 8.9 A – 8.8
Grove Street and Elmwood Avenue (stop sign)
NBA: B – 11.3 SBA: A – 9.9 NBA: A – 8.3
SBA: A – 7.9
LOS = Level of Service Delay is measured in seconds. NBA = Northbound approach. SBA = Southbound approach.

1454 Sherman Evanston, Illinois 24
Table 4 CAPACITY ANALYSES RESULTS—FUTURE CONDITIONS
Weekday A.M. Peak Hour
Weekday P.M. Peak Hour
Intersection LOS – Delay LOS – Delay
Grove Street and Sherman Avenue (signal) B – 12.6 B – 13.0
Lake Street and Sherman Avenue (all-way stop sign) B – 10.7 B – 10.9
Lake Street and Elmwood Avenue (all-way stop sign) A – 9.0 A – 9.0
Grove Street and Elmwood Avenue (stop sign)
NBA: B – 11.5 SBA: B – 10.2 NBA: B – 12.7
SBA: B – 11.9
Garage Access Drive and Sherman Avenue (stop sign) EBA: B – 12.7 EBA: C – 15.1
LOS = Level of Service Delay is measured in seconds. NBA = Northbound approach. SBA = Southbound approach. EBA = Eastbound approach.

1454 Sherman Evanston, Illinois 25
Discussion and Recommendations The results of the capacity analyses show that with the addition of the development traffic and the increase in existing traffic due to regional growth, all of the intersections are projected to continue to operate at generally the same good levels of service (LOS). The following is a discussion of each analyzed intersection. Grove Street and Sherman Avenue The traffic capacity analyses show that this signalized intersection is currently operating at an acceptable Level of Service (LOS) and will maintain this acceptable LOS under future conditions. Consideration should be given to restriping the existing crosswalks to high-visibility and providing countdown pedestrian signals on all four legs of the intersection. No further street or traffic control improvements are recommended at this intersection in conjunction with the proposed development. Lake Street and Sherman Avenue The traffic capacity analyses show that this all-way stop sign controlled intersection is currently operating at an acceptable Level of Service (LOS) and will maintain this acceptable LOS under future conditions. High-visibility crosswalks are recommended on all four legs of the intersection. No street or traffic control improvements are recommended at this intersection in conjunction with the proposed development. Lake Street and Elmwood Avenue The traffic capacity analyses show that this all-way stop sign controlled intersection is currently operating at an acceptable Level of Service (LOS) and will maintain this acceptable LOS under future conditions. No further street or traffic control improvements are recommended at this intersection in conjunction with the proposed development. Grove Street and Elmwood Avenue The traffic capacity analyses show that this intersection is currently operating at an acceptable Level of Service (LOS) and will maintain this acceptable LOS under future conditions. No further street or traffic control improvements are recommended at this intersection in conjunction with the proposed development.

1454 Sherman Evanston, Illinois 26
Garage Access and Sherman Avenue
The access drive to the garage ramp is proposed to be located off Sherman Avenue, approximately in the same location as the existing access drive serving the retail parking lot for the existing land uses on the site.
The proposed access drive will operate at acceptable levels of service and delay relative to the three existing access drives on Sherman Avenue on the east side of the street.
No loss of on-street parking on the west side of Sherman Avenue is anticipated since the proposed access drive will replace the access driveway that serves the existing surface parking lot.
Sherman Avenue provides two through lanes southbound and one lane northbound between Grove Street and Lake Street. No improvements are needed or recommended on Sherman Avenue at the proposed access drive to accommodate the peak hour turning volumes.
The existing garage access drives on the east side of Sherman Avenue will not be impacted by the proposed access drive serving the subject development.
The access will provide one lane inbound and one lane outbound under stop sign control.
The access has ample visibility for vehicles exiting the garage. The access will be gated and have flashing lights and audible warning signals to
alert pedestrians on Sherman Avenue of an approaching exiting vehicle. A high-visibility crosswalk is recommended across the proposed access drive.
Loading/Refuse Access Three loading docks for the shared use of the residential and retail uses will be located off the public alley on the west face of the building. The refuse will be located off the public alley as well. It is expected that all trucks will enter the public alley from Lake Street and proceed north to the loading dock area. Upon exiting, the truck will proceed north on the public alley and exit onto Grove Street.

1454 Sherman Evanston, Illinois 27
Parking The development will provide a total of approximately 172 parking spaces, at a parking ratio of 0.59 spaces per unit. Approximately 12 parking spaces on the first floor will be reserved for retail/public use during the day, and two of those spaces will be dedicated car-sharing spaces. The on-site parking supply (0.59 parking ratio) considers the following. The development is a transit-oriented development (TOD) and is located in the
city’s transit-oriented downtown development district. TOD districts are urban environments which promote pedestrian mobility and interactivity with convenient and nearby goods and services without requiring the use of an automobile.
Census tract data shows that 52 percent of renter households in the area do not own a vehicle.
Further, the Census tract data for renter households with two or more bedrooms
shows that 50 percent of the households own vehicles. Therefore, the proposed 0.59 parking ratio is consistent with the residential and vehicle ownership characteristics of the area.
Two car-sharing stations are proposed to be located within the garage, and are also located in proximity to the site. This will further encourage residents to not own a vehicle. Information provided by ZipCar states that one shared car removes approximately 15 private vehicles from the street system.
The E2 residential development, located at 1890 Maple Avenue, provides a parking
supply of 1.0 (353 parking spaces for 353 rental units). The peak garage parking occupancy was determined to be 45 percent. As such, there are over 190 parking spaces available at any given time.
Limited observations of the Holiday Inn parking garage located on the east side of
Sherman Avenue across from the proposed development show a low parking occupancy.
The Sherman Plaza parking garage is located approximately 800 feet from the proposed development and provides approximately 1,282 public parking spaces. A car count report obtained from the City of Evanston shows that over a five month period (January 2017 to May 2017) the parking garage had an average occupancy of 51 percent during the morning peak period and an average occupancy of 54 percent during the afternoon peak period. As such, on average, 500 parking spaces or more are available at any given time.

1454 Sherman Evanston, Illinois 28
The Maple Avenue garage (Maple Avenue and Clark Street) is located less than
one-fourth of a mile from the proposed development and provides approximately 1,340 public parking spaces. A car count report obtained from the City of Evanston shows that over a five month period (January 2017 to May 2017) the parking garage had an average occupancy of 40 percent during the morning peak period and an average occupancy of 48 percent during the afternoon peak period. As such, on average, over 650 parking spaces are available at any given time. It is important to note that the garage has a slightly higher occupancy during the evenings because of the nearby theater.
Paybox parking is provided on Sherman Avenue and on Grove Street in the vicinity
of the site. A bicycle storage room will be provided on the ground floor, thereby further
increasing the incentive to commute via bicycling rather than driving.
Divvy bicycle stations are located in proximity to the site.

1454 Sherman Evanston, Illinois 29
6. Conclusion The plans for the proposed mixed-use development, to be located at 1454 Sherman Avenue, call for approximately 292 apartment units and approximately 9,100 square-feet of retail space. The site will provide a total of approximately 172 parking spaces: Access to the development will be provided off Sherman Avenue. Based on the preceding analyses and recommendations, the following conclusions have been made. The proposed development is located in an urban environment which promotes
pedestrian mobility and interactivity with convenient and nearby goods and services without requiring the use of an automobile.
Accessibility to and from the development and surrounding area is enhanced by the various alternative modes of transportation serving the area, including Metra, the CTA Purple Line, bus transit, and pedestrian and bicycle amenities.
Based on Census data, the amount of traffic typically generated by an apartment development, such as what is proposed, was reduced by 50 percent to account for resident renters in the area that do not own a vehicle, the alternative modes of transportation serving the area, and the convenience and accessibility of nearby goods and services that can easily be obtained without the use of a vehicle.
The development-generated traffic can be accommodated without significant impact
to the external street system. All of the intersections within the study limits are generally projected to operate at current levels of service with the addition of the subject development generated traffic and the existing traffic increased by a regional growth factor to establish future conditions.
High-visibility crosswalks should be provided at the intersections of Sherman
Avenue with Lake Street and Grove Street.
Countdown pedestrian signals should be considered at the signalized intersection of Sherman Avenue and Grove Street.

1454 Sherman Evanston, Illinois 30
The access drive to the garage ramp is proposed to be located off Sherman Avenue, approximately in the same location as the existing access drive serving the retail parking lot for the existing land uses on the site and will provide one lane inbound and one lane outbound under stop sign control. No loss of on-street parking on the west side of Sherman Avenue is anticipated.
The proposed access drive will operate at acceptable levels of service and delay relative to the three existing access drives on Sherman Avenue on the east side of the street. No improvements are needed or recommended on Sherman Avenue at the proposed access drive to accommodate the peak hour turning volumes. A high-visibility crosswalk is recommended across the proposed access drive.
The access will be gated and have flashing lights and audible warning signals to
alert pedestrians on Sherman Avenue of an approaching exiting vehicle. The access has ample visibility for vehicles exiting the garage.
Three loading docks and refuse collection will be located off the north-south public
alley on the west face of the proposed building. A bicycle storage room for the residents will be located on the ground level.
Providing this bicycle storage room will further increase the incentive to commute via bicycling rather than driving.
The development will provide a total of approximately 172 parking spaces, at a
parking ratio of 0.59 spaces per unit. Based on Census tract data, occupancy surveys of existing garages in the area, and that the site is designated as a transit-oriented development, the proposed 0.59 parking ratio is consistent with the residential and vehicle ownership characteristics of the area.

1454 Sherman Evanston, Illinois
Appendix
A - 1

1454 Sherman Evanston, Illinois
Site Plan
A - 2

EXISTING2-STORY BLDG.
N.I.C.
EXISTING1-STORY BLDG.
N.I.C.
CTA PURPLE LINE
N.I.C.
TWO-WAY TRAFFIC
SHERMAN AVENUE
TW
O-W
AY
TR
AFFIC
LAK
E ST
REET
339.83'
149.7
7'
40.82'
44.34'
82.70'
40.89'
143.46'
4.78'
61.80'
RESIDENTIALLOBBY
3,660 SF
RETAIL4,765 SF
PARKING28 SPACES
PARK SERVICERETAIL2,575 SF
SERVICERETAIL
1,780 SF
RAMP UP
MAIN ELECROOM
10' x 35' x 14' LOADING
FREEZERSHC10' x 35' x 14'
LOADING
COMEDVAULT TRANSF.
ROOM
WATERSERVICE
WATERBOOSTER
GENERATORROOM
MOVE INLOBBY
RETAILTRASH
FIRE PUMPROOM
TRASHROOM
24'-0
"
10' x 35' x 14' LOADING
MAIL/PACKAGE
OFFICE
GASROOM
TELECOM
A.O.R.30"X42"
DNUP
A.O.R.30"X42"
DN UP
GARAGE
ENTRY
RES
ENTRY
RETAIL
ENTRYSERVICE
RETAIL ENTRY
SERVICE
RETAIL ENTRY
PUBLIC ALLEY
14'-0"
39'-9 1/2"TO P.L.
99'-3 1/2" 22'-0" 31'-6" 25'-0" 117'-6"295'-3 1/2" 4'-9"
TO P.L.
LINE OF TOWER ABOVE
18'-7 3/8"
122'-
6"27
'-3 1/
2"TO
P.L.
106'-6"75'-6"18'-6"25'-0 1/4"69'-9 1/4"39'-10"TO P.L.
73'-3
"
8'-6"TYP. 18
'-0"
11'-0"5'-0"
4'-11 3/8"TO P.L.
PROPERTYLINE
BIKE ROOM
NSCALE: 1/32" = 1'-0"
06-12-2017
1454 Sherman Ave.Evanston, IL
- First Floor Plan
FLOOR
1ST
2ND
3RD
STANDARD TANDEM ADA ADA -VAN TOTAL
8 0 119 28
0 270 0 72
0 3 069 72
172158158TOTAL
PARKING COUNT
1ST FLOOR = 31,870 GSF

1454 Sherman Evanston, Illinois
Traffic Counts
A - 4

KKen
ig L
indg
ren
O'H
ara
Abo
ona,
Inc.
9575
W. H
iggi
ns R
d., S
uite
400
Ros
emon
t, Ill
inoi
s, U
nite
d St
ates
600
18(8
47)5
18-9
990
Cou
nt N
ame:
Gro
ve/S
herm
anSi
te C
ode:
Star
t Dat
e: 0
3/09
/201
7Pa
ge N
o: 1
Turn
ing M
ovem
ent D
ata
Sta
rt T
ime
Gro
ve S
treet
Gro
ve S
treet
Sherm
an A
venue
Sherm
an A
venue
Eastb
ound
Westb
ound
Nort
hbound
South
bound
U-T
urn
Left
Thru
Rig
ht
Peds
App.
Tota
lU
-Turn
Left
Thru
Rig
ht
Peds
App.
Tota
lU
-Turn
Left
Thru
Rig
ht
Peds
App.
Tota
lU
-Turn
Left
Thru
Rig
ht
Peds
App.
Tota
lIn
t. T
ota
l
7:0
0 A
M0
312
26
17
00
10
12
11
02
16
10
19
08
17
97
34
81
7:1
5 A
M0
10
15
29
27
02
11
58
18
01
27
04
28
06
18
211
26
99
7:3
0 A
M0
12
14
35
29
01
10
612
17
03
33
06
36
04
16
613
26
108
7:4
5 A
M0
15
70
16
22
01
14
517
20
05
42
67
53
08
19
523
32
127
Hourly T
ota
l0
40
48
736
95
04
45
17
39
66
011
118
717
136
026
70
22
54
118
415
8:0
0 A
M0
13
14
119
28
03
25
517
33
03
41
38
47
06
24
718
37
145
8:1
5 A
M0
16
15
519
36
01
22
11
13
34
07
52
311
62
012
26
435
42
174
8:3
0 A
M0
18
13
419
35
02
22
21
21
45
02
43
213
47
012
24
15
25
51
178
8:4
5 A
M0
724
618
37
02
24
12
16
38
03
42
410
49
013
29
10
22
52
176
Hourly T
ota
l0
54
66
16
75
136
08
93
49
67
150
015
178
12
42
205
043
103
36
100
182
673
***
BR
EA
K *
**-
--
--
--
--
--
--
--
--
--
--
--
--
4:0
0 P
M0
824
418
36
02
411
30
17
05
23
414
32
018
60
11
20
89
174
4:1
5 P
M0
422
11
11
37
02
11
820
21
03
26
617
35
014
46
12
13
72
165
4:3
0 P
M0
624
927
39
03
22
929
34
01
26
510
32
016
36
16
20
68
173
4:4
5 P
M0
12
17
736
36
01
23
12
25
36
13
28
310
35
017
44
12
25
73
180
Hourly T
ota
l0
30
87
31
92
148
08
60
40
104
108
112
103
18
51
134
065
186
51
78
302
692
5:0
0 P
M0
828
950
45
04
26
15
30
45
03
22
11
22
36
028
64
11
43
103
229
5:1
5 P
M0
13
25
639
44
06
26
929
41
08
38
418
50
123
65
10
22
99
234
5:3
0 P
M0
635
10
34
51
05
14
818
27
03
33
924
45
019
59
13
12
91
214
5:4
5 P
M0
13
17
833
38
05
25
16
30
46
03
28
226
33
125
58
14
15
98
215
Hourly T
ota
l0
40
105
33
156
178
020
91
48
107
159
017
121
26
90
164
295
246
48
92
391
892
Gra
nd T
ota
l0
164
306
87
359
557
040
289
154
317
483
155
520
63
200
639
2229
605
157
324
993
2672
Appro
ach %
0.0
29.4
54.9
15.6
--
0.0
8.3
59.8
31.9
--
0.2
8.6
81.4
9.9
--
0.2
23.1
60.9
15.8
--
-
Tota
l %
0.0
6.1
11.5
3.3
-20.8
0.0
1.5
10.8
5.8
-18.1
0.0
2.1
19.5
2.4
-23.9
0.1
8.6
22.6
5.9
-37.2
-
Lig
hts
0156
296
84
-536
037
278
150
-465
154
500
61
-616
1218
578
153
-950
2567
% L
ights
-95.1
96.7
96.6
-96.2
-92.5
96.2
97.4
-96.3
100.0
98.2
96.2
96.8
-96.4
50.0
95.2
95.5
97.5
-95.7
96.1
Buses
02
00
-2
00
22
-4
00
30
-3
01
01
-2
11
% B
uses
-1.2
0.0
0.0
-0.4
-0.0
0.7
1.3
-0.8
0.0
0.0
0.6
0.0
-0.5
0.0
0.4
0.0
0.6
-0.2
0.4
Sin
gle
-Unit T
rucks
03
62
-11
00
61
-7
01
01
-2
05
93
-17
37
% S
ingle
-Unit
Tru
cks
-1.8
2.0
2.3
-2.0
-0.0
2.1
0.6
-1.4
0.0
1.8
0.0
1.6
-0.3
0.0
2.2
1.5
1.9
-1.7
1.4
Art
icula
ted T
rucks
00
00
-0
00
00
-0
00
00
-0
00
10
-1
1
% A
rtic
ula
ted
Tru
cks
-0.0
0.0
0.0
-0.0
-0.0
0.0
0.0
-0.0
0.0
0.0
0.0
0.0
-0.0
0.0
0.0
0.2
0.0
-0.1
0.0
Bic
ycle
s o
n R
oad
03
41
-8
03
31
-7
00
17
1-
18
15
17
0-
23
56
% B
icycle
s o
nR
oad
-1.8
1.3
1.1
-1.4
-7.5
1.0
0.6
-1.4
0.0
0.0
3.3
1.6
-2.8
50.0
2.2
2.8
0.0
-2.3
2.1
Pedestr
ians
--
--
359
--
--
-317
--
--
-200
--
--
-324
--
A - 5

KKen
ig L
indg
ren
O'H
ara
Abo
ona,
Inc.
9575
W. H
iggi
ns R
d., S
uite
400
Ros
emon
t, Ill
inoi
s, U
nite
d St
ates
600
18(8
47)5
18-9
990
Cou
nt N
ame:
Gro
ve/S
herm
anSi
te C
ode:
Star
t Dat
e: 0
3/09
/201
7Pa
ge N
o: 3
Turn
ing M
ovem
ent P
eak H
our
Data
(8:0
0 A
M)
Sta
rt T
ime
Gro
ve S
treet
Gro
ve S
treet
Sherm
an A
venue
Sherm
an A
venue
Eastb
ound
Westb
ound
Nort
hbound
South
bound
U-T
urn
Left
Thru
Rig
ht
Peds
App.
Tota
lU
-Turn
Left
Thru
Rig
ht
Peds
App.
Tota
lU
-Turn
Left
Thru
Rig
ht
Peds
App.
Tota
lU
-Turn
Left
Thru
Rig
ht
Peds
App.
Tota
lIn
t. T
ota
l
8:0
0 A
M0
13
14
119
28
03
25
517
33
03
41
38
47
06
24
718
37
145
8:1
5 A
M0
16
15
519
36
01
22
11
13
34
07
52
311
62
012
26
435
42
174
8:3
0 A
M0
18
13
419
35
02
22
21
21
45
02
43
213
47
012
24
15
25
51
178
8:4
5 A
M0
724
618
37
02
24
12
16
38
03
42
410
49
013
29
10
22
52
176
Tota
l0
54
66
16
75
136
08
93
49
67
150
015
178
12
42
205
043
103
36
100
182
673
Appro
ach %
0.0
39.7
48.5
11.8
--
0.0
5.3
62.0
32.7
--
0.0
7.3
86.8
5.9
--
0.0
23.6
56.6
19.8
--
-
Tota
l %
0.0
8.0
9.8
2.4
-20.2
0.0
1.2
13.8
7.3
-22.3
0.0
2.2
26.4
1.8
-30.5
0.0
6.4
15.3
5.3
-27.0
-
PH
F0.0
00
0.7
50
0.6
88
0.6
67
-0.9
19
0.0
00
0.6
67
0.9
30
0.5
83
-0.8
33
0.0
00
0.5
36
0.8
56
0.7
50
-0.8
27
0.0
00
0.8
27
0.8
88
0.6
00
-0.8
75
0.9
45
Lig
hts
050
61
16
-127
08
89
48
-145
015
168
12
-195
038
97
35
-170
637
% L
ights
-92.6
92.4
100.0
-93.4
-100.0
95.7
98.0
-96.7
-100.0
94.4
100.0
-95.1
-88.4
94.2
97.2
-93.4
94.7
Buses
00
00
-0
00
10
-1
00
10
-1
01
00
-1
3
% B
uses
-0.0
0.0
0.0
-0.0
-0.0
1.1
0.0
-0.7
-0.0
0.6
0.0
-0.5
-2.3
0.0
0.0
-0.5
0.4
Sin
gle
-Unit T
rucks
03
40
-7
00
30
-3
00
00
-0
04
51
-10
20
% S
ingle
-Unit
Tru
cks
-5.6
6.1
0.0
-5.1
-0.0
3.2
0.0
-2.0
-0.0
0.0
0.0
-0.0
-9.3
4.9
2.8
-5.5
3.0
Art
icula
ted T
rucks
00
00
-0
00
00
-0
00
00
-0
00
00
-0
0
% A
rtic
ula
ted
Tru
cks
-0.0
0.0
0.0
-0.0
-0.0
0.0
0.0
-0.0
-0.0
0.0
0.0
-0.0
-0.0
0.0
0.0
-0.0
0.0
Bic
ycle
s o
n R
oad
01
10
-2
00
01
-1
00
90
-9
00
10
-1
13
% B
icycle
s o
nR
oad
-1.9
1.5
0.0
-1.5
-0.0
0.0
2.0
-0.7
-0.0
5.1
0.0
-4.4
-0.0
1.0
0.0
-0.5
1.9
Pedestr
ians
--
--
75
--
--
-67
--
--
-42
--
--
-100
--
% P
edestr
ians
--
--
100.0
--
--
-100.0
--
--
-100.0
--
--
-100.0
--
A - 6

KKen
ig L
indg
ren
O'H
ara
Abo
ona,
Inc.
9575
W. H
iggi
ns R
d., S
uite
400
Ros
emon
t, Ill
inoi
s, U
nite
d St
ates
600
18(8
47)5
18-9
990
Cou
nt N
ame:
Gro
ve/S
herm
anSi
te C
ode:
Star
t Dat
e: 0
3/09
/201
7Pa
ge N
o: 4
Turn
ing M
ovem
ent P
eak H
our
Data
(5:0
0 P
M)
Sta
rt T
ime
Gro
ve S
treet
Gro
ve S
treet
Sherm
an A
venue
Sherm
an A
venue
Eastb
ound
Westb
ound
Nort
hbound
South
bound
U-T
urn
Left
Thru
Rig
ht
Peds
App.
Tota
lU
-Turn
Left
Thru
Rig
ht
Peds
App.
Tota
lU
-Turn
Left
Thru
Rig
ht
Peds
App.
Tota
lU
-Turn
Left
Thru
Rig
ht
Peds
App.
Tota
lIn
t. T
ota
l
5:0
0 P
M0
828
950
45
04
26
15
30
45
03
22
11
22
36
028
64
11
43
103
229
5:1
5 P
M0
13
25
639
44
06
26
929
41
08
38
418
50
123
65
10
22
99
234
5:3
0 P
M0
635
10
34
51
05
14
818
27
03
33
924
45
019
59
13
12
91
214
5:4
5 P
M0
13
17
833
38
05
25
16
30
46
03
28
226
33
125
58
14
15
98
215
Tota
l0
40
105
33
156
178
020
91
48
107
159
017
121
26
90
164
295
246
48
92
391
892
Appro
ach %
0.0
22.5
59.0
18.5
--
0.0
12.6
57.2
30.2
--
0.0
10.4
73.8
15.9
--
0.5
24.3
62.9
12.3
--
-
Tota
l %
0.0
4.5
11.8
3.7
-20.0
0.0
2.2
10.2
5.4
-17.8
0.0
1.9
13.6
2.9
-18.4
0.2
10.7
27.6
5.4
-43.8
-
PH
F0.0
00
0.7
69
0.7
50
0.8
25
-0.8
73
0.0
00
0.8
33
0.8
75
0.7
50
-0.8
64
0.0
00
0.5
31
0.7
96
0.5
91
-0.8
20
0.5
00
0.8
48
0.9
46
0.8
57
-0.9
49
0.9
53
Lig
hts
040
104
32
-176
018
89
47
-154
017
118
25
-160
192
240
48
-381
871
% L
ights
-100.0
99.0
97.0
-98.9
-90.0
97.8
97.9
-96.9
-100.0
97.5
96.2
-97.6
50.0
96.8
97.6
100.0
-97.4
97.6
Buses
00
00
-0
00
01
-1
00
10
-1
00
00
-0
2
% B
uses
-0.0
0.0
0.0
-0.0
-0.0
0.0
2.1
-0.6
-0.0
0.8
0.0
-0.6
0.0
0.0
0.0
0.0
-0.0
0.2
Sin
gle
-Unit T
rucks
00
01
-1
00
20
-2
00
00
-0
00
10
-1
4
% S
ingle
-Unit
Tru
cks
-0.0
0.0
3.0
-0.6
-0.0
2.2
0.0
-1.3
-0.0
0.0
0.0
-0.0
0.0
0.0
0.4
0.0
-0.3
0.4
Art
icula
ted T
rucks
00
00
-0
00
00
-0
00
00
-0
00
00
-0
0
% A
rtic
ula
ted
Tru
cks
-0.0
0.0
0.0
-0.0
-0.0
0.0
0.0
-0.0
-0.0
0.0
0.0
-0.0
0.0
0.0
0.0
0.0
-0.0
0.0
Bic
ycle
s o
n R
oad
00
10
-1
02
00
-2
00
21
-3
13
50
-9
15
% B
icycle
s o
nR
oad
-0.0
1.0
0.0
-0.6
-10.0
0.0
0.0
-1.3
-0.0
1.7
3.8
-1.8
50.0
3.2
2.0
0.0
-2.3
1.7
Pedestr
ians
--
--
156
--
--
-107
--
--
-90
--
--
-92
--
% P
edestr
ians
--
--
100.0
--
--
-100.0
--
--
-100.0
--
--
-100.0
--
A - 7

KKen
ig L
indg
ren
O'H
ara
Abo
ona,
Inc.
9575
W. H
iggi
ns R
d., S
uite
400
Ros
emon
t, Ill
inoi
s, U
nite
d St
ates
600
18(8
47)5
18-9
990
Cou
nt N
ame:
Lak
e/Sh
erm
anSi
te C
ode:
Star
t Dat
e: 0
3/09
/201
7Pa
ge N
o: 1
Turn
ing M
ovem
ent D
ata
Sta
rt T
ime
Lake S
treet
Lake S
treet
Sherm
an A
venue
Sherm
an A
venue
Eastb
ound
Westb
ound
Nort
hbound
South
bound
U-T
urn
Left
Thru
Rig
ht
Peds
App.
Tota
lU
-Turn
Left
Thru
Rig
ht
Peds
App.
Tota
lU
-Turn
Left
Thru
Rig
ht
Peds
App.
Tota
lU
-Turn
Left
Thru
Rig
ht
Peds
App.
Tota
lIn
t. T
ota
l
7:0
0 A
M0
412
15
17
00
53
18
02
18
21
22
07
13
33
23
70
7:1
5 A
M0
14
13
32
30
00
14
07
14
00
24
14
25
05
14
54
24
93
7:3
0 A
M0
16
18
10
35
02
20
09
22
01
17
13
19
06
11
92
26
102
7:4
5 A
M0
23
19
31
45
00
32
59
37
03
31
07
34
04
96
319
135
Hourly T
ota
l0
57
62
88
127
02
71
826
81
06
90
415
100
022
47
23
12
92
400
8:0
0 A
M0
14
31
56
50
02
31
521
38
14
29
40
38
08
13
56
26
152
8:1
5 A
M0
17
38
610
61
02
30
411
36
03
43
11
47
08
14
85
30
174
8:3
0 A
M0
16
35
42
55
00
17
017
17
01
32
413
37
05
16
10
631
140
8:4
5 A
M0
27
39
22
68
02
30
317
35
02
27
48
33
06
18
79
31
167
Hourly T
ota
l0
74
143
17
20
234
06
108
12
66
126
110
131
13
22
155
027
61
30
26
118
633
***
BR
EA
K *
**-
--
--
--
--
--
--
--
--
--
--
--
--
4:0
0 P
M0
15
30
64
51
04
23
316
30
00
14
26
16
022
27
11
460
157
4:1
5 P
M0
20
28
53
53
03
20
310
26
02
15
14
18
014
34
17
465
162
4:3
0 P
M0
10
32
39
45
01
23
312
27
00
17
24
19
08
26
16
350
141
4:4
5 P
M0
12
25
711
44
01
31
328
35
02
26
28
30
014
24
916
47
156
Hourly T
ota
l0
57
115
21
27
193
09
97
12
66
118
04
72
722
83
058
111
53
27
222
616
5:0
0 P
M0
18
28
49
50
02
36
225
40
04
17
410
25
118
36
20
475
190
5:1
5 P
M0
13
32
39
48
03
32
921
44
01
26
110
28
015
43
28
886
206
5:3
0 P
M0
14
26
33
43
01
21
620
28
02
21
15
24
013
40
10
563
158
5:4
5 P
M0
14
33
113
48
00
25
816
33
07
14
29
23
015
41
17
673
177
Hourly T
ota
l0
59
119
11
34
189
06
114
25
82
145
014
78
834
100
161
160
75
23
297
731
Gra
nd T
ota
l0
247
439
57
89
743
023
390
57
240
470
134
371
32
93
438
1168
379
181
88
729
2380
Appro
ach %
0.0
33.2
59.1
7.7
--
0.0
4.9
83.0
12.1
--
0.2
7.8
84.7
7.3
--
0.1
23.0
52.0
24.8
--
-
Tota
l %
0.0
10.4
18.4
2.4
-31.2
0.0
1.0
16.4
2.4
-19.7
0.0
1.4
15.6
1.3
-18.4
0.0
7.1
15.9
7.6
-30.6
-
Lig
hts
0234
428
55
-717
023
378
54
-455
133
358
32
-424
1156
363
176
-696
2292
% L
ights
-94.7
97.5
96.5
-96.5
-100.0
96.9
94.7
-96.8
100.0
97.1
96.5
100.0
-96.8
100.0
92.9
95.8
97.2
-95.5
96.3
Buses
01
30
-4
00
70
-7
01
30
-4
03
00
-3
18
% B
uses
-0.4
0.7
0.0
-0.5
-0.0
1.8
0.0
-1.5
0.0
2.9
0.8
0.0
-0.9
0.0
1.8
0.0
0.0
-0.4
0.8
Sin
gle
-Unit T
rucks
00
30
-3
00
30
-3
00
30
-3
04
51
-10
19
% S
ingle
-Unit
Tru
cks
-0.0
0.7
0.0
-0.4
-0.0
0.8
0.0
-0.6
0.0
0.0
0.8
0.0
-0.7
0.0
2.4
1.3
0.6
-1.4
0.8
Art
icula
ted T
rucks
00
00
-0
00
00
-0
00
00
-0
01
00
-1
1
% A
rtic
ula
ted
Tru
cks
-0.0
0.0
0.0
-0.0
-0.0
0.0
0.0
-0.0
0.0
0.0
0.0
0.0
-0.0
0.0
0.6
0.0
0.0
-0.1
0.0
Bic
ycle
s o
n R
oad
012
52
-19
00
23
-5
00
70
-7
04
11
4-
19
50
% B
icycle
s o
nR
oad
-4.9
1.1
3.5
-2.6
-0.0
0.5
5.3
-1.1
0.0
0.0
1.9
0.0
-1.6
0.0
2.4
2.9
2.2
-2.6
2.1
Pedestr
ians
--
--
89
--
--
-240
--
--
-93
--
--
-88
--
A - 8

KKen
ig L
indg
ren
O'H
ara
Abo
ona,
Inc.
9575
W. H
iggi
ns R
d., S
uite
400
Ros
emon
t, Ill
inoi
s, U
nite
d St
ates
600
18(8
47)5
18-9
990
Cou
nt N
ame:
Lak
e/Sh
erm
anSi
te C
ode:
Star
t Dat
e: 0
3/09
/201
7Pa
ge N
o: 3
Turn
ing M
ovem
ent P
eak H
our
Data
(8:0
0 A
M)
Sta
rt T
ime
Lake S
treet
Lake S
treet
Sherm
an A
venue
Sherm
an A
venue
Eastb
ound
Westb
ound
Nort
hbound
South
bound
U-T
urn
Left
Thru
Rig
ht
Peds
App.
Tota
lU
-Turn
Left
Thru
Rig
ht
Peds
App.
Tota
lU
-Turn
Left
Thru
Rig
ht
Peds
App.
Tota
lU
-Turn
Left
Thru
Rig
ht
Peds
App.
Tota
lIn
t. T
ota
l
8:0
0 A
M0
14
31
56
50
02
31
521
38
14
29
40
38
08
13
56
26
152
8:1
5 A
M0
17
38
610
61
02
30
411
36
03
43
11
47
08
14
85
30
174
8:3
0 A
M0
16
35
42
55
00
17
017
17
01
32
413
37
05
16
10
631
140
8:4
5 A
M0
27
39
22
68
02
30
317
35
02
27
48
33
06
18
79
31
167
Tota
l0
74
143
17
20
234
06
108
12
66
126
110
131
13
22
155
027
61
30
26
118
633
Appro
ach %
0.0
31.6
61.1
7.3
--
0.0
4.8
85.7
9.5
--
0.6
6.5
84.5
8.4
--
0.0
22.9
51.7
25.4
--
-
Tota
l %
0.0
11.7
22.6
2.7
-37.0
0.0
0.9
17.1
1.9
-19.9
0.2
1.6
20.7
2.1
-24.5
0.0
4.3
9.6
4.7
-18.6
-
PH
F0.0
00
0.6
85
0.9
17
0.7
08
-0.8
60
0.0
00
0.7
50
0.8
71
0.6
00
-0.8
29
0.2
50
0.6
25
0.7
62
0.8
13
-0.8
24
0.0
00
0.8
44
0.8
47
0.7
50
-0.9
52
0.9
09
Lig
hts
066
140
17
-223
06
103
11
-120
110
128
13
-152
024
58
30
-112
607
% L
ights
-89.2
97.9
100.0
-95.3
-100.0
95.4
91.7
-95.2
100.0
100.0
97.7
100.0
-98.1
-88.9
95.1
100.0
-94.9
95.9
Buses
00
10
-1
00
40
-4
00
10
-1
02
00
-2
8
% B
uses
-0.0
0.7
0.0
-0.4
-0.0
3.7
0.0
-3.2
0.0
0.0
0.8
0.0
-0.6
-7.4
0.0
0.0
-1.7
1.3
Sin
gle
-Unit T
rucks
00
00
-0
00
00
-0
00
00
-0
01
20
-3
3
% S
ingle
-Unit
Tru
cks
-0.0
0.0
0.0
-0.0
-0.0
0.0
0.0
-0.0
0.0
0.0
0.0
0.0
-0.0
-3.7
3.3
0.0
-2.5
0.5
Art
icula
ted T
rucks
00
00
-0
00
00
-0
00
00
-0
00
00
-0
0
% A
rtic
ula
ted
Tru
cks
-0.0
0.0
0.0
-0.0
-0.0
0.0
0.0
-0.0
0.0
0.0
0.0
0.0
-0.0
-0.0
0.0
0.0
-0.0
0.0
Bic
ycle
s o
n R
oad
08
20
-10
00
11
-2
00
20
-2
00
10
-1
15
% B
icycle
s o
nR
oad
-10.8
1.4
0.0
-4.3
-0.0
0.9
8.3
-1.6
0.0
0.0
1.5
0.0
-1.3
-0.0
1.6
0.0
-0.8
2.4
Pedestr
ians
--
--
20
--
--
-66
--
--
-22
--
--
-26
--
% P
edestr
ians
--
--
100.0
--
--
-100.0
--
--
-100.0
--
--
-100.0
--
A - 9

KKen
ig L
indg
ren
O'H
ara
Abo
ona,
Inc.
9575
W. H
iggi
ns R
d., S
uite
400
Ros
emon
t, Ill
inoi
s, U
nite
d St
ates
600
18(8
47)5
18-9
990
Cou
nt N
ame:
Lak
e/Sh
erm
anSi
te C
ode:
Star
t Dat
e: 0
3/09
/201
7Pa
ge N
o: 4
Turn
ing M
ovem
ent P
eak H
our
Data
(5:0
0 P
M)
Sta
rt T
ime
Lake S
treet
Lake S
treet
Sherm
an A
venue
Sherm
an A
venue
Eastb
ound
Westb
ound
Nort
hbound
South
bound
U-T
urn
Left
Thru
Rig
ht
Peds
App.
Tota
lU
-Turn
Left
Thru
Rig
ht
Peds
App.
Tota
lU
-Turn
Left
Thru
Rig
ht
Peds
App.
Tota
lU
-Turn
Left
Thru
Rig
ht
Peds
App.
Tota
lIn
t. T
ota
l
5:0
0 P
M0
18
28
49
50
02
36
225
40
04
17
410
25
118
36
20
475
190
5:1
5 P
M0
13
32
39
48
03
32
921
44
01
26
110
28
015
43
28
886
206
5:3
0 P
M0
14
26
33
43
01
21
620
28
02
21
15
24
013
40
10
563
158
5:4
5 P
M0
14
33
113
48
00
25
816
33
07
14
29
23
015
41
17
673
177
Tota
l0
59
119
11
34
189
06
114
25
82
145
014
78
834
100
161
160
75
23
297
731
Appro
ach %
0.0
31.2
63.0
5.8
--
0.0
4.1
78.6
17.2
--
0.0
14.0
78.0
8.0
--
0.3
20.5
53.9
25.3
--
-
Tota
l %
0.0
8.1
16.3
1.5
-25.9
0.0
0.8
15.6
3.4
-19.8
0.0
1.9
10.7
1.1
-13.7
0.1
8.3
21.9
10.3
-40.6
-
PH
F0.0
00
0.8
19
0.9
02
0.6
88
-0.9
45
0.0
00
0.5
00
0.7
92
0.6
94
-0.8
24
0.0
00
0.5
00
0.7
50
0.5
00
-0.8
93
0.2
50
0.8
47
0.9
30
0.6
70
-0.8
63
0.8
87
Lig
hts
059
117
10
-186
06
113
24
-143
014
76
8-
98
157
156
74
-288
715
% L
ights
-100.0
98.3
90.9
-98.4
-100.0
99.1
96.0
-98.6
-100.0
97.4
100.0
-98.0
100.0
93.4
97.5
98.7
-97.0
97.8
Buses
00
00
-0
00
00
-0
00
10
-1
00
00
-0
1
% B
uses
-0.0
0.0
0.0
-0.0
-0.0
0.0
0.0
-0.0
-0.0
1.3
0.0
-1.0
0.0
0.0
0.0
0.0
-0.0
0.1
Sin
gle
-Unit T
rucks
00
00
-0
00
00
-0
00
00
-0
03
00
-3
3
% S
ingle
-Unit
Tru
cks
-0.0
0.0
0.0
-0.0
-0.0
0.0
0.0
-0.0
-0.0
0.0
0.0
-0.0
0.0
4.9
0.0
0.0
-1.0
0.4
Art
icula
ted T
rucks
00
00
-0
00
00
-0
00
00
-0
00
00
-0
0
% A
rtic
ula
ted
Tru
cks
-0.0
0.0
0.0
-0.0
-0.0
0.0
0.0
-0.0
-0.0
0.0
0.0
-0.0
0.0
0.0
0.0
0.0
-0.0
0.0
Bic
ycle
s o
n R
oad
00
21
-3
00
11
-2
00
10
-1
01
41
-6
12
% B
icycle
s o
nR
oad
-0.0
1.7
9.1
-1.6
-0.0
0.9
4.0
-1.4
-0.0
1.3
0.0
-1.0
0.0
1.6
2.5
1.3
-2.0
1.6
Pedestr
ians
--
--
34
--
--
-82
--
--
-34
--
--
-23
--
% P
edestr
ians
--
--
100.0
--
--
-100.0
--
--
-100.0
--
--
-100.0
--
A - 10

KKen
ig L
indg
ren
O'H
ara
Abo
ona,
Inc.
9575
W. H
iggi
ns R
d., S
uite
400
Ros
emon
t, Ill
inoi
s, U
nite
d St
ates
600
18(8
47)5
18-9
990
Cou
nt N
ame:
Lak
e/El
mw
ood
Site
Cod
e:St
art D
ate:
03/
09/2
017
Page
No:
1
Turn
ing M
ovem
ent D
ata
Sta
rt T
ime
Lake S
treet
Lake S
treet
Elm
wood A
venue
Elm
wood A
venue
Eastb
ound
Westb
ound
Nort
hbound
South
bound
U-T
urn
Left
Thru
Rig
ht
Peds
App.
Tota
lU
-Turn
Left
Thru
Rig
ht
Peds
App.
Tota
lU
-Turn
Left
Thru
Rig
ht
Peds
App.
Tota
lU
-Turn
Left
Thru
Rig
ht
Peds
App.
Tota
lIn
t. T
ota
l
7:0
0 A
M0
619
02
25
00
11
02
11
05
30
78
01
11
13
47
7:1
5 A
M0
325
02
28
01
19
05
20
01
21
04
02
01
23
55
7:3
0 A
M0
138
20
41
02
26
40
32
04
33
210
00
02
12
85
7:4
5 A
M1
042
63
49
00
34
55
39
09
50
914
00
10
31
103
Hourly T
ota
l1
10
124
87
143
03
90
912
102
019
13
418
36
03
24
79
290
8:0
0 A
M0
349
93
61
02
42
03
44
04
46
314
00
10
21
120
8:1
5 A
M0
848
64
62
04
29
410
37
013
94
526
01
01
12
127
8:3
0 A
M0
556
02
61
00
30
15
31
04
22
10
80
12
21
5105
8:4
5 A
M0
453
41
61
02
36
16
39
04
57
416
03
12
46
122
Hourly T
ota
l0
20
206
19
10
245
08
137
624
151
025
20
19
22
64
05
45
814
474
***
BR
EA
K *
**-
--
--
--
--
--
--
--
--
--
--
--
--
4:0
0 P
M0
455
15
60
05
35
09
40
02
42
38
14
52
512
120
4:1
5 P
M0
339
71
49
03
31
51
39
03
41
38
04
43
311
107
4:3
0 P
M0
237
10
40
02
33
34
38
04
11
16
07
67
220
104
4:4
5 P
M0
342
42
49
02
37
25
41
04
12
57
03
23
28
105
Hourly T
ota
l0
12
173
13
8198
012
136
10
19
158
013
10
612
29
118
17
15
12
51
436
5:0
0 P
M0
148
32
52
04
60
16
65
03
72
112
00
23
35
134
5:1
5 P
M0
249
11
52
04
45
216
51
03
50
58
00
42
46
117
5:3
0 P
M0
241
44
47
02
29
24
33
03
00
73
01
12
54
87
5:4
5 P
M0
146
69
53
04
44
58
53
04
81
513
03
36
12
12
131
Hourly T
ota
l0
6184
14
16
204
014
178
10
34
202
013
20
318
36
04
10
13
24
27
469
Gra
nd T
ota
l1
48
687
54
41
790
037
541
35
89
613
070
63
32
70
165
130
33
37
51
101
1669
Appro
ach %
0.1
6.1
87.0
6.8
--
0.0
6.0
88.3
5.7
--
0.0
42.4
38.2
19.4
--
1.0
29.7
32.7
36.6
--
-
Tota
l %
0.1
2.9
41.2
3.2
-47.3
0.0
2.2
32.4
2.1
-36.7
0.0
4.2
3.8
1.9
-9.9
0.1
1.8
2.0
2.2
-6.1
-
Lig
hts
143
668
51
-763
035
527
35
-597
065
57
29
-151
128
32
36
-97
1608
% L
ights
100.0
89.6
97.2
94.4
-96.6
-94.6
97.4
100.0
-97.4
-92.9
90.5
90.6
-91.5
100.0
93.3
97.0
97.3
-96.0
96.3
Buses
00
40
-4
00
70
-7
02
00
-2
00
00
-0
13
% B
uses
0.0
0.0
0.6
0.0
-0.5
-0.0
1.3
0.0
-1.1
-2.9
0.0
0.0
-1.2
0.0
0.0
0.0
0.0
-0.0
0.8
Sin
gle
-Unit T
rucks
05
51
-11
00
40
-4
00
10
-1
00
11
-2
18
% S
ingle
-Unit
Tru
cks
0.0
10.4
0.7
1.9
-1.4
-0.0
0.7
0.0
-0.7
-0.0
1.6
0.0
-0.6
0.0
0.0
3.0
2.7
-2.0
1.1
Art
icula
ted T
rucks
00
00
-0
00
00
-0
00
00
-0
00
00
-0
0
% A
rtic
ula
ted
Tru
cks
0.0
0.0
0.0
0.0
-0.0
-0.0
0.0
0.0
-0.0
-0.0
0.0
0.0
-0.0
0.0
0.0
0.0
0.0
-0.0
0.0
Bic
ycle
s o
n R
oad
00
10
2-
12
02
30
-5
03
53
-11
02
00
-2
30
% B
icycle
s o
nR
oad
0.0
0.0
1.5
3.7
-1.5
-5.4
0.6
0.0
-0.8
-4.3
7.9
9.4
-6.7
0.0
6.7
0.0
0.0
-2.0
1.8
Pedestr
ians
--
--
41
--
--
-89
--
--
-70
--
--
-51
--
A - 11

KKen
ig L
indg
ren
O'H
ara
Abo
ona,
Inc.
9575
W. H
iggi
ns R
d., S
uite
400
Ros
emon
t, Ill
inoi
s, U
nite
d St
ates
600
18(8
47)5
18-9
990
Cou
nt N
ame:
Lak
e/El
mw
ood
Site
Cod
e:St
art D
ate:
03/
09/2
017
Page
No:
3
Turn
ing M
ovem
ent P
eak H
our
Data
(8:0
0 A
M)
Sta
rt T
ime
Lake S
treet
Lake S
treet
Elm
wood A
venue
Elm
wood A
venue
Eastb
ound
Westb
ound
Nort
hbound
South
bound
U-T
urn
Left
Thru
Rig
ht
Peds
App.
Tota
lU
-Turn
Left
Thru
Rig
ht
Peds
App.
Tota
lU
-Turn
Left
Thru
Rig
ht
Peds
App.
Tota
lU
-Turn
Left
Thru
Rig
ht
Peds
App.
Tota
lIn
t. T
ota
l
8:0
0 A
M0
349
93
61
02
42
03
44
04
46
314
00
10
21
120
8:1
5 A
M0
848
64
62
04
29
410
37
013
94
526
01
01
12
127
8:3
0 A
M0
556
02
61
00
30
15
31
04
22
10
80
12
21
5105
8:4
5 A
M0
453
41
61
02
36
16
39
04
57
416
03
12
46
122
Tota
l0
20
206
19
10
245
08
137
624
151
025
20
19
22
64
05
45
814
474
Appro
ach %
0.0
8.2
84.1
7.8
--
0.0
5.3
90.7
4.0
--
0.0
39.1
31.3
29.7
--
0.0
35.7
28.6
35.7
--
-
Tota
l %
0.0
4.2
43.5
4.0
-51.7
0.0
1.7
28.9
1.3
-31.9
0.0
5.3
4.2
4.0
-13.5
0.0
1.1
0.8
1.1
-3.0
-
PH
F0.0
00
0.6
25
0.9
20
0.5
28
-0.9
88
0.0
00
0.5
00
0.8
15
0.3
75
-0.8
58
0.0
00
0.4
81
0.5
56
0.6
79
-0.6
15
0.0
00
0.4
17
0.5
00
0.6
25
-0.5
83
0.9
33
Lig
hts
017
199
18
-234
08
131
6-
145
024
18
16
-58
05
34
-12
449
% L
ights
-85.0
96.6
94.7
-95.5
-100.0
95.6
100.0
-96.0
-96.0
90.0
84.2
-90.6
-100.0
75.0
80.0
-85.7
94.7
Buses
00
10
-1
00
30
-3
00
00
-0
00
00
-0
4
% B
uses
-0.0
0.5
0.0
-0.4
-0.0
2.2
0.0
-2.0
-0.0
0.0
0.0
-0.0
-0.0
0.0
0.0
-0.0
0.8
Sin
gle
-Unit T
rucks
03
10
-4
00
10
-1
00
10
-1
00
11
-2
8
% S
ingle
-Unit
Tru
cks
-15.0
0.5
0.0
-1.6
-0.0
0.7
0.0
-0.7
-0.0
5.0
0.0
-1.6
-0.0
25.0
20.0
-14.3
1.7
Art
icula
ted T
rucks
00
00
-0
00
00
-0
00
00
-0
00
00
-0
0
% A
rtic
ula
ted
Tru
cks
-0.0
0.0
0.0
-0.0
-0.0
0.0
0.0
-0.0
-0.0
0.0
0.0
-0.0
-0.0
0.0
0.0
-0.0
0.0
Bic
ycle
s o
n R
oad
00
51
-6
00
20
-2
01
13
-5
00
00
-0
13
% B
icycle
s o
nR
oad
-0.0
2.4
5.3
-2.4
-0.0
1.5
0.0
-1.3
-4.0
5.0
15.8
-7.8
-0.0
0.0
0.0
-0.0
2.7
Pedestr
ians
--
--
10
--
--
-24
--
--
-22
--
--
-8
--
% P
edestr
ians
--
--
100.0
--
--
-100.0
--
--
-100.0
--
--
-100.0
--
A - 12
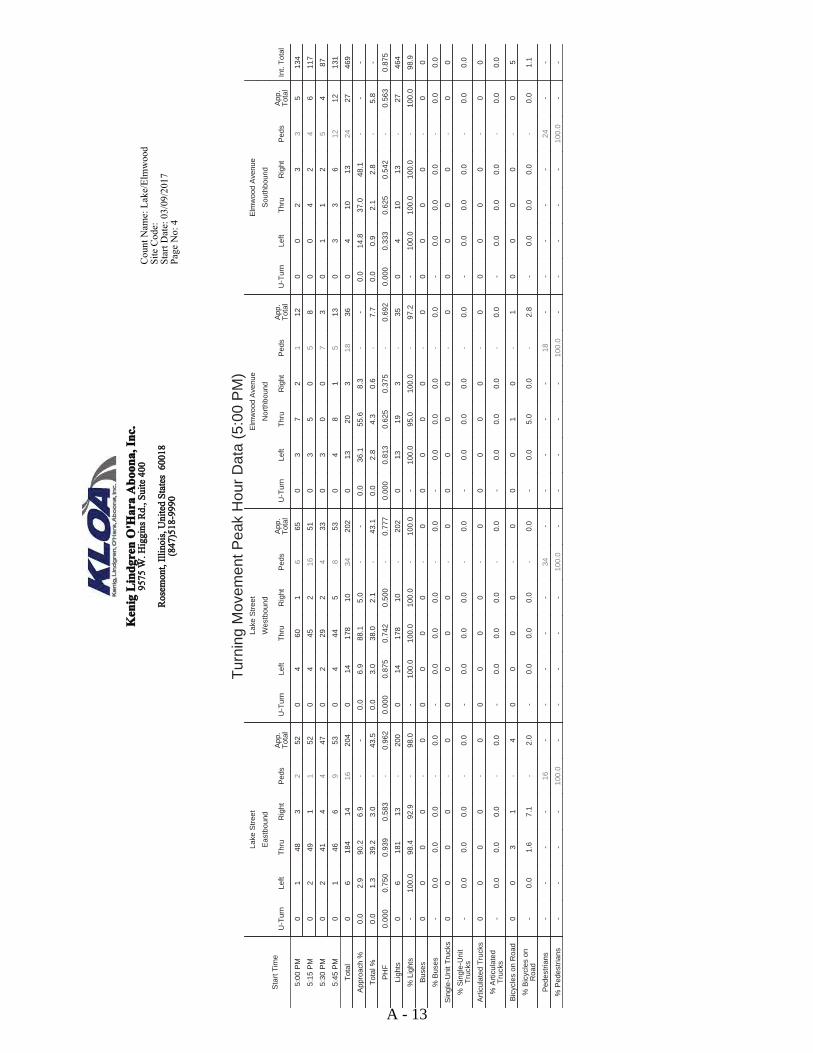
KKen
ig L
indg
ren
O'H
ara
Abo
ona,
Inc.
9575
W. H
iggi
ns R
d., S
uite
400
Ros
emon
t, Ill
inoi
s, U
nite
d St
ates
600
18(8
47)5
18-9
990
Cou
nt N
ame:
Lak
e/El
mw
ood
Site
Cod
e:St
art D
ate:
03/
09/2
017
Page
No:
4
Turn
ing M
ovem
ent P
eak H
our
Data
(5:0
0 P
M)
Sta
rt T
ime
Lake S
treet
Lake S
treet
Elm
wood A
venue
Elm
wood A
venue
Eastb
ound
Westb
ound
Nort
hbound
South
bound
U-T
urn
Left
Thru
Rig
ht
Peds
App.
Tota
lU
-Turn
Left
Thru
Rig
ht
Peds
App.
Tota
lU
-Turn
Left
Thru
Rig
ht
Peds
App.
Tota
lU
-Turn
Left
Thru
Rig
ht
Peds
App.
Tota
lIn
t. T
ota
l
5:0
0 P
M0
148
32
52
04
60
16
65
03
72
112
00
23
35
134
5:1
5 P
M0
249
11
52
04
45
216
51
03
50
58
00
42
46
117
5:3
0 P
M0
241
44
47
02
29
24
33
03
00
73
01
12
54
87
5:4
5 P
M0
146
69
53
04
44
58
53
04
81
513
03
36
12
12
131
Tota
l0
6184
14
16
204
014
178
10
34
202
013
20
318
36
04
10
13
24
27
469
Appro
ach %
0.0
2.9
90.2
6.9
--
0.0
6.9
88.1
5.0
--
0.0
36.1
55.6
8.3
--
0.0
14.8
37.0
48.1
--
-
Tota
l %
0.0
1.3
39.2
3.0
-43.5
0.0
3.0
38.0
2.1
-43.1
0.0
2.8
4.3
0.6
-7.7
0.0
0.9
2.1
2.8
-5.8
-
PH
F0.0
00
0.7
50
0.9
39
0.5
83
-0.9
62
0.0
00
0.8
75
0.7
42
0.5
00
-0.7
77
0.0
00
0.8
13
0.6
25
0.3
75
-0.6
92
0.0
00
0.3
33
0.6
25
0.5
42
-0.5
63
0.8
75
Lig
hts
06
181
13
-200
014
178
10
-202
013
19
3-
35
04
10
13
-27
464
% L
ights
-100.0
98.4
92.9
-98.0
-100.0
100.0
100.0
-100.0
-100.0
95.0
100.0
-97.2
-100.0
100.0
100.0
-100.0
98.9
Buses
00
00
-0
00
00
-0
00
00
-0
00
00
-0
0
% B
uses
-0.0
0.0
0.0
-0.0
-0.0
0.0
0.0
-0.0
-0.0
0.0
0.0
-0.0
-0.0
0.0
0.0
-0.0
0.0
Sin
gle
-Unit T
rucks
00
00
-0
00
00
-0
00
00
-0
00
00
-0
0
% S
ingle
-Unit
Tru
cks
-0.0
0.0
0.0
-0.0
-0.0
0.0
0.0
-0.0
-0.0
0.0
0.0
-0.0
-0.0
0.0
0.0
-0.0
0.0
Art
icula
ted T
rucks
00
00
-0
00
00
-0
00
00
-0
00
00
-0
0
% A
rtic
ula
ted
Tru
cks
-0.0
0.0
0.0
-0.0
-0.0
0.0
0.0
-0.0
-0.0
0.0
0.0
-0.0
-0.0
0.0
0.0
-0.0
0.0
Bic
ycle
s o
n R
oad
00
31
-4
00
00
-0
00
10
-1
00
00
-0
5
% B
icycle
s o
nR
oad
-0.0
1.6
7.1
-2.0
-0.0
0.0
0.0
-0.0
-0.0
5.0
0.0
-2.8
-0.0
0.0
0.0
-0.0
1.1
Pedestr
ians
--
--
16
--
--
-34
--
--
-18
--
--
-24
--
% P
edestr
ians
--
--
100.0
--
--
-100.0
--
--
-100.0
--
--
-100.0
--
A - 13

KKen
ig L
indg
ren
O'H
ara
Abo
ona,
Inc.
9575
W. H
iggi
ns R
d., S
uite
400
Ros
emon
t, Ill
inoi
s, U
nite
d St
ates
600
18(8
47)5
18-9
990
Cou
nt N
ame:
Gro
ve/E
lmw
ood
Site
Cod
e:St
art D
ate:
03/
09/2
017
Page
No:
1
Turn
ing M
ovem
ent D
ata
Sta
rt T
ime
Gro
ve S
treet
Gro
ve S
treet
Elm
wood A
venue
Elm
wood A
venue
Eastb
ound
Westb
ound
Nort
hbound
South
bound
U-T
urn
Left
Thru
Rig
ht
Peds
App.
Tota
lU
-Turn
Left
Thru
Rig
ht
Peds
App.
Tota
lU
-Turn
Left
Thru
Rig
ht
Peds
App.
Tota
lU
-Turn
Left
Thru
Rig
ht
Peds
App.
Tota
lIn
t. T
ota
l
7:0
0 A
M0
121
43
26
01
16
10
18
02
11
14
01
08
09
57
7:1
5 A
M0
041
31
44
10
11
01
12
00
02
52
02
12
25
63
7:3
0 A
M1
133
10
36
01
10
21
13
05
04
49
01
03
94
62
7:4
5 A
M0
031
11
32
01
11
00
12
00
43
57
03
05
88
59
Hourly T
ota
l1
2126
95
138
13
48
32
55
07
510
15
22
07
118
19
26
241
8:0
0 A
M0
154
02
55
00
31
01
31
02
25
79
00
13
34
99
8:1
5 A
M0
145
23
48
01
20
33
24
03
110
814
00
02
11
288
8:3
0 A
M0
045
20
47
01
28
01
29
04
16
15
11
01
04
85
92
8:4
5 A
M0
150
11
52
02
22
10
25
03
06
59
01
13
45
91
Hourly T
ota
l0
3194
56
202
04
101
45
109
012
427
35
43
02
212
26
16
370
***
BR
EA
K *
**-
--
--
--
--
--
--
--
--
--
--
--
--
4:0
0 P
M0
128
80
37
02
29
20
33
06
02
68
00
12
16
381
4:1
5 P
M0
035
60
41
14
33
10
39
03
13
77
03
14
58
95
4:3
0 P
M0
229
62
37
08
56
23
66
02
14
87
04
20
11
6116
4:4
5 P
M0
026
25
28
02
50
13
53
06
02
11
80
10
39
493
Hourly T
ota
l0
3118
22
7143
116
168
66
191
017
211
32
30
08
49
41
21
385
5:0
0 P
M0
333
01
36
04
57
14
62
03
13
15
70
00
215
2107
5:1
5 P
M0
230
34
35
05
59
14
65
08
03
19
11
01
03
10
4115
5:3
0 P
M0
232
14
35
02
46
20
50
00
12
93
02
00
15
290
5:4
5 P
M0
024
52
29
04
52
22
58
07
16
12
14
01
02
63
104
Hourly T
ota
l0
7119
911
135
015
214
610
235
018
314
55
35
04
07
46
11
416
Gra
nd T
ota
l1
15
557
45
29
618
238
531
19
23
590
054
14
62
137
130
021
746
132
74
1412
Appro
ach %
0.2
2.4
90.1
7.3
--
0.3
6.4
90.0
3.2
--
0.0
41.5
10.8
47.7
--
0.0
28.4
9.5
62.2
--
-
Tota
l %
0.1
1.1
39.4
3.2
-43.8
0.1
2.7
37.6
1.3
-41.8
0.0
3.8
1.0
4.4
-9.2
0.0
1.5
0.5
3.3
-5.2
-
Lig
hts
115
544
42
-602
236
516
19
-573
050
14
54
-118
021
746
-74
1367
% L
ights
100.0
100.0
97.7
93.3
-97.4
100.0
94.7
97.2
100.0
-97.1
-92.6
100.0
87.1
-90.8
-100.0
100.0
100.0
-100.0
96.8
Buses
00
10
-1
00
30
-3
00
00
-0
00
00
-0
4
% B
uses
0.0
0.0
0.2
0.0
-0.2
0.0
0.0
0.6
0.0
-0.5
-0.0
0.0
0.0
-0.0
-0.0
0.0
0.0
-0.0
0.3
Sin
gle
-Unit T
rucks
00
72
-9
00
80
-8
03
03
-6
00
00
-0
23
% S
ingle
-Unit
Tru
cks
0.0
0.0
1.3
4.4
-1.5
0.0
0.0
1.5
0.0
-1.4
-5.6
0.0
4.8
-4.6
-0.0
0.0
0.0
-0.0
1.6
Art
icula
ted T
rucks
00
00
-0
00
00
-0
00
00
-0
00
00
-0
0
% A
rtic
ula
ted
Tru
cks
0.0
0.0
0.0
0.0
-0.0
0.0
0.0
0.0
0.0
-0.0
-0.0
0.0
0.0
-0.0
-0.0
0.0
0.0
-0.0
0.0
Bic
ycle
s o
n R
oad
00
51
-6
02
40
-6
01
05
-6
00
00
-0
18
% B
icycle
s o
nR
oad
0.0
0.0
0.9
2.2
-1.0
0.0
5.3
0.8
0.0
-1.0
-1.9
0.0
8.1
-4.6
-0.0
0.0
0.0
-0.0
1.3
Pedestr
ians
--
--
29
--
--
-23
--
--
-137
--
--
-132
--
A - 14

KKen
ig L
indg
ren
O'H
ara
Abo
ona,
Inc.
9575
W. H
iggi
ns R
d., S
uite
400
Ros
emon
t, Ill
inoi
s, U
nite
d St
ates
600
18(8
47)5
18-9
990
Cou
nt N
ame:
Gro
ve/E
lmw
ood
Site
Cod
e:St
art D
ate:
03/
09/2
017
Page
No:
3
Turn
ing M
ovem
ent P
eak H
our
Data
(8:0
0 A
M)
Sta
rt T
ime
Gro
ve S
treet
Gro
ve S
treet
Elm
wood A
venue
Elm
wood A
venue
Eastb
ound
Westb
ound
Nort
hbound
South
bound
U-T
urn
Left
Thru
Rig
ht
Peds
App.
Tota
lU
-Turn
Left
Thru
Rig
ht
Peds
App.
Tota
lU
-Turn
Left
Thru
Rig
ht
Peds
App.
Tota
lU
-Turn
Left
Thru
Rig
ht
Peds
App.
Tota
lIn
t. T
ota
l
8:0
0 A
M0
154
02
55
00
31
01
31
02
25
79
00
13
34
99
8:1
5 A
M0
145
23
48
01
20
33
24
03
110
814
00
02
11
288
8:3
0 A
M0
045
20
47
01
28
01
29
04
16
15
11
01
04
85
92
8:4
5 A
M0
150
11
52
02
22
10
25
03
06
59
01
13
45
91
Tota
l0
3194
56
202
04
101
45
109
012
427
35
43
02
212
26
16
370
Appro
ach %
0.0
1.5
96.0
2.5
--
0.0
3.7
92.7
3.7
--
0.0
27.9
9.3
62.8
--
0.0
12.5
12.5
75.0
--
-
Tota
l %
0.0
0.8
52.4
1.4
-54.6
0.0
1.1
27.3
1.1
-29.5
0.0
3.2
1.1
7.3
-11.6
0.0
0.5
0.5
3.2
-4.3
-
PH
F0.0
00
0.7
50
0.8
98
0.6
25
-0.9
18
0.0
00
0.5
00
0.8
15
0.3
33
-0.8
79
0.0
00
0.7
50
0.5
00
0.6
75
-0.7
68
0.0
00
0.5
00
0.5
00
0.7
50
-0.8
00
0.9
34
Lig
hts
03
190
4-
197
04
98
4-
106
010
422
-36
02
212
-16
355
% L
ights
-100.0
97.9
80.0
-97.5
-100.0
97.0
100.0
-97.2
-83.3
100.0
81.5
-83.7
-100.0
100.0
100.0
-100.0
95.9
Buses
00
00
-0
00
10
-1
00
00
-0
00
00
-0
1
% B
uses
-0.0
0.0
0.0
-0.0
-0.0
1.0
0.0
-0.9
-0.0
0.0
0.0
-0.0
-0.0
0.0
0.0
-0.0
0.3
Sin
gle
-Unit T
rucks
00
31
-4
00
20
-2
02
03
-5
00
00
-0
11
% S
ingle
-Unit
Tru
cks
-0.0
1.5
20.0
-2.0
-0.0
2.0
0.0
-1.8
-16.7
0.0
11.1
-11.6
-0.0
0.0
0.0
-0.0
3.0
Art
icula
ted T
rucks
00
00
-0
00
00
-0
00
00
-0
00
00
-0
0
% A
rtic
ula
ted
Tru
cks
-0.0
0.0
0.0
-0.0
-0.0
0.0
0.0
-0.0
-0.0
0.0
0.0
-0.0
-0.0
0.0
0.0
-0.0
0.0
Bic
ycle
s o
n R
oad
00
10
-1
00
00
-0
00
02
-2
00
00
-0
3
% B
icycle
s o
nR
oad
-0.0
0.5
0.0
-0.5
-0.0
0.0
0.0
-0.0
-0.0
0.0
7.4
-4.7
-0.0
0.0
0.0
-0.0
0.8
Pedestr
ians
--
--
6-
--
--
5-
--
--
35
--
--
-26
--
% P
edestr
ians
--
--
100.0
--
--
-100.0
--
--
-100.0
--
--
-100.0
--
A - 15

KKen
ig L
indg
ren
O'H
ara
Abo
ona,
Inc.
9575
W. H
iggi
ns R
d., S
uite
400
Ros
emon
t, Ill
inoi
s, U
nite
d St
ates
600
18(8
47)5
18-9
990
Cou
nt N
ame:
Gro
ve/E
lmw
ood
Site
Cod
e:St
art D
ate:
03/
09/2
017
Page
No:
4
Turn
ing M
ovem
ent P
eak H
our
Data
(5:0
0 P
M)
Sta
rt T
ime
Gro
ve S
treet
Gro
ve S
treet
Elm
wood A
venue
Elm
wood A
venue
Eastb
ound
Westb
ound
Nort
hbound
South
bound
U-T
urn
Left
Thru
Rig
ht
Peds
App.
Tota
lU
-Turn
Left
Thru
Rig
ht
Peds
App.
Tota
lU
-Turn
Left
Thru
Rig
ht
Peds
App.
Tota
lU
-Turn
Left
Thru
Rig
ht
Peds
App.
Tota
lIn
t. T
ota
l
5:0
0 P
M0
333
01
36
04
57
14
62
03
13
15
70
00
215
2107
5:1
5 P
M0
230
34
35
05
59
14
65
08
03
19
11
01
03
10
4115
5:3
0 P
M0
232
14
35
02
46
20
50
00
12
93
02
00
15
290
5:4
5 P
M0
024
52
29
04
52
22
58
07
16
12
14
01
02
63
104
Tota
l0
7119
911
135
015
214
610
235
018
314
55
35
04
07
46
11
416
Appro
ach %
0.0
5.2
88.1
6.7
--
0.0
6.4
91.1
2.6
--
0.0
51.4
8.6
40.0
--
0.0
36.4
0.0
63.6
--
-
Tota
l %
0.0
1.7
28.6
2.2
-32.5
0.0
3.6
51.4
1.4
-56.5
0.0
4.3
0.7
3.4
-8.4
0.0
1.0
0.0
1.7
-2.6
-
PH
F0.0
00
0.5
83
0.9
02
0.4
50
-0.9
38
0.0
00
0.7
50
0.9
07
0.7
50
-0.9
04
0.0
00
0.5
63
0.7
50
0.5
83
-0.6
25
0.0
00
0.5
00
0.0
00
0.5
83
-0.6
88
0.9
04
Lig
hts
07
116
9-
132
014
211
6-
231
017
314
-34
04
07
-11
408
% L
ights
-100.0
97.5
100.0
-97.8
-93.3
98.6
100.0
-98.3
-94.4
100.0
100.0
-97.1
-100.0
-100.0
-100.0
98.1
Buses
00
00
-0
00
00
-0
00
00
-0
00
00
-0
0
% B
uses
-0.0
0.0
0.0
-0.0
-0.0
0.0
0.0
-0.0
-0.0
0.0
0.0
-0.0
-0.0
-0.0
-0.0
0.0
Sin
gle
-Unit T
rucks
00
10
-1
00
20
-2
00
00
-0
00
00
-0
3
% S
ingle
-Unit
Tru
cks
-0.0
0.8
0.0
-0.7
-0.0
0.9
0.0
-0.9
-0.0
0.0
0.0
-0.0
-0.0
-0.0
-0.0
0.7
Art
icula
ted T
rucks
00
00
-0
00
00
-0
00
00
-0
00
00
-0
0
% A
rtic
ula
ted
Tru
cks
-0.0
0.0
0.0
-0.0
-0.0
0.0
0.0
-0.0
-0.0
0.0
0.0
-0.0
-0.0
-0.0
-0.0
0.0
Bic
ycle
s o
n R
oad
00
20
-2
01
10
-2
01
00
-1
00
00
-0
5
% B
icycle
s o
nR
oad
-0.0
1.7
0.0
-1.5
-6.7
0.5
0.0
-0.9
-5.6
0.0
0.0
-2.9
-0.0
-0.0
-0.0
1.2
Pedestr
ians
--
--
11
--
--
-10
--
--
-55
--
--
-46
--
% P
edestr
ians
--
--
100.0
--
--
-100.0
--
--
-100.0
--
--
-100.0
--
A - 16

1454 Sherman Evanston, Illinois
Garage Parking Counts
A - 17

Car Count at 10:00 am Car Count at 02:00 pm
1/2/2017 350 410
1/3/2017 751 810
1/6/2017 700 890
1/7/2017 345 427
1/8/2017 170 311
1/9/2017 685
1/10/2017 732
1/11/2017 872
1/13/2017 848 879
1/14/2017 335 369
1/15/2017 218 325
1/16/2017 386 430
1/17/2017 878 907
1/18/2017 837 849
1/19/2017 853 820
1/20/2017 855 819
1/21/2017 388 412
1/22/2017 185 300
1/23/2017 587 746
1/24/2017 903 906
1/25/2017 889 902
1/26/2017 892 927
1/27/2017 849 869
1/28/2017 439 449
1/29/2017 170 267
1/30/2017 838 918
1/31/2017 936 993
2/1/2017 916 939
2/2/2017 984 992
2/3/2017 842 893
2/4/2017 460 432
2/5/2017 280 327
A - 18

Car Count at 10:00 am Car Count at 02:00 pm
2/6/2017 591 624
2/8/2017 905 845
2/9/2017 869 847
2/10/2017 829 905
2/11/2017 295 386
2/12/2017 180 359
2/13/2017 926 935
2/14/2017 958 1073
2/15/2017 956 918
2/16/2017 876 854
2/17/2017 886 900
2/18/2017 298 381
2/19/2017 217 352
2/20/2017 650 745
2/21/2017 929 942
2/22/2017 919 963
2/23/2017 976
2/24/2017 831 871
2/25/2017 305 375
2/26/2017 205 376
2/27/2017 879 908
2/28/2017 963 966
3/1/2017 887 906
3/2/2017 907 923
3/7/2017 863 882
3/8/2017 902 932
3/11/2017 286 379
3/12/2017 198 286
3/13/2017 864 886
3/15/2017 937 954
3/16/2017 872 961
3/17/2017 819
3/18/2017 305 396
3/19/2017 215 325
A - 19

Car Count at 10:00 am Car Count at 02:00 pm
3/20/2017 895 925
3/22/2017 935 942
3/23/2017 844 684
3/24/2017 846 806
3/25/2017 325 387
3/26/2017 225 335
3/29/2017 791 794
3/30/2017 805 820
3/31/2017 456 467
4/1/2017 336 389
4/2/2017 226 318
4/3/2017 856 943
4/4/2017 897 928
4/6/2017 892 953
4/7/2017 326 341
4/8/2017 326 341
4/9/2017 237 326
4/10/2017 868 936
4/11/2017 685 855
4/12/2017 867 898
4/13/2017 769 810
4/14/2017 652 596
4/15/2017 311 372
4/16/2017 174 349
4/17/2017 632
4/18/2017 835 765
4/19/2017 58 213
4/20/2017 941 547
4/21/2017 869 617
4/22/2017 334 369
4/23/2017 241 306
4/24/2017 807 945
4/25/2017 935 922
4/27/2017 821 906
A - 20

Car Count at 10:00 am Car Count at 02:00 pm
4/28/2017 872 853
4/29/2017 257 345
4/30/2017 201 311
5/1/2017 897 926
5/2/2017 902
5/3/2017 859 953
5/4/2017 872 952
5/5/2017 866 928
5/6/2017 276 358
5/7/2017 198 336
5/8/2017 861 949
5/9/2017 930 929
5/10/2017 890 918
5/11/2017 756 852
5/12/2017 825 739
5/13/2017 296 377
5/14/2017 285 321
5/15/2017 910 930
A - 21

Car Count at 10:00 am Car Count at 02:00 pm
1/2/2017 430 986
1/3/2017 650 1050
1/4/2017 702 985
1/5/2017 689 870
1/9/2017 601 835
1/10/2017 676 1102
1/11/2017 652 835
1/12/2017 646 874
1/13/2017 635 851
1/14/2017 346 436
1/15/2017 556 973
1/17/2017 659 904
1/19/2017 652 876
1/20/2017 644 826
1/21/2017 347 415
1/22/2017 340
1/23/2017 648 874
1/25/2017 700 878
1/26/2017 692 715
1/27/2017 562 645
1/28/2017 225 583
1/29/2017 187 503
1/30/2017 625 720
1/31/2017 684 712
2/1/2017 722
2/2/2017 703 627
2/3/2017 614
2/4/2017 195 305
2/5/2017 360 904
2/6/2017 599 536
2/7/2017 667 675
2/8/2017 561 615
A - 22

Car Count at 10:00 am Car Count at 02:00 pm
2/9/2017 700
2/10/2017 700
2/11/2017 338 415
2/12/2017 1064 763
2/13/2017 707 655
2/15/2017 609 537
2/16/2017 669
2/17/2017 678
2/18/2017 205 310
2/19/2017 292 467
2/20/2017 431 485
2/21/2017 651 743
2/22/2017 667 752
2/23/2017 726 684
2/24/2017 670 637
2/25/2017 192 321
2/26/2017 428 523
2/27/2017 687 648
2/28/2017 665 546
3/1/2017 683 624
3/2/2017 676 645
3/3/2017 636 594
3/4/2017 192 344
3/5/2017 198 506
3/6/2017 701 787
3/7/2017 715 685
3/8/2017 669
3/9/2017 683 692
3/10/2017 675 723
3/11/2017 195 414
3/12/2017 300
3/14/2017 726 685
3/15/2017 692 715
3/16/2017 672 696
A - 23

Car Count at 10:00 am Car Count at 02:00 pm
3/17/2017 705 683
3/18/2017 260 415
3/21/2017 820 767
3/22/2017 489
3/23/2017 681 670
3/24/2017 720 700
3/25/2017 168 462
3/26/2017 202 529
3/28/2017 685 710
3/29/2017 702 725
3/30/2017 584 615
3/31/2017 677 693
4/1/2017 195 404
4/2/2017 177 409
4/3/2017 165 435
4/4/2017 216 241
4/5/2017 726 685
4/6/2017 662 635
4/7/2017 730 698
4/8/2017 189 394
4/9/2017 148 366
4/11/2017 665 631
4/12/2017 670 713
4/13/2017 587 643
4/14/2017 815 930
4/15/2017 165 365
4/16/2017 225 400
4/18/2017 630 685
4/19/2017 684 667
4/20/2017 584 647
4/21/2017 681 715
4/22/2017 197 402
4/23/2017 187 287
4/24/2017 712 668
A - 24

Car Count at 10:00 am Car Count at 02:00 pm
4/25/2017 693 694
4/26/2017 594 715
4/27/2017 674 726
4/28/2017 706 757
4/29/2017 186 424
4/30/2017 156 625
5/1/2017 685 769
5/2/2017 713 818
5/3/2017 695
5/4/2017 673 743
5/5/2017 623 697
5/6/2017 325 415
5/7/2017 244 472
5/8/2017 527 667
5/9/2017 584 637
5/10/2017 596 692
5/11/2017 715 781
5/12/2017 726 315
5/13/2017 268 325
5/14/2017 428 685
5/15/2017 550 823
5/16/2017 652 695
A - 25

1454 Sherman Evanston, Illinois
Capacity Analyses
A - 26

Lanes, Volumes, Timings
1: Sherman Ave & Grove St 6/1/2017
Weekday AM - Existing Synchro 8 Report17-066; Evanston, IL
Lane Group EBL EBT EBR WBL WBT WBR NBL NBT NBR SBL SBT SBRLane ConfigurationsVolume (vph) 53 65 16 8 93 48 15 169 12 43 102 36Ideal Flow (vphpl) 1900 1900 1900 1900 1900 1900 1900 1900 1900 1900 1900 1900Lane Width (ft) 11 11 11 11 11 11 11 11 11 11 11 11Grade (%) 0% 0% 0% 0%Storage Length (ft) 0 0 0 0 0 0 0 0Storage Lanes 0 0 0 0 0 0 0 0Taper Length (ft) 25 25 25 25Lane Util. Factor 1.00 1.00 1.00 1.00 1.00 1.00 1.00 1.00 1.00 0.95 0.95 0.95Ped Bike Factor 0.92 0.92 0.98 0.94Frt 0.984 0.956 0.992 0.970Flt Protected 0.981 0.997 0.996 0.988Satd. Flow (prot) 0 1642 0 0 1550 0 0 1720 0 0 3010 0Flt Permitted 0.842 0.987 0.975 0.860Satd. Flow (perm) 0 1313 0 0 1531 0 0 1666 0 0 2552 0Right Turn on Red Yes Yes Yes YesSatd. Flow (RTOR) 10 36 7 38Link Speed (mph) 25 25 25 25Link Distance (ft) 57 229 167 143Travel Time (s) 1.6 6.2 4.6 3.9Confl. Peds. (#/hr) 100 42 42 100 75 67 67 75Confl. Bikes (#/hr) 2 1 9 1Peak Hour Factor 0.95 0.95 0.95 0.95 0.95 0.95 0.95 0.95 0.95 0.95 0.95 0.95Growth Factor 100% 100% 100% 100% 100% 100% 100% 100% 100% 100% 100% 100%Heavy Vehicles (%) 8% 8% 0% 0% 5% 2% 0% 5% 0% 12% 6% 3%Bus Blockages (#/hr) 0 0 0 0 0 0 0 0 0 0 0 0Parking (#/hr) 10 10 10 10Mid-Block Traffic (%) 0% 0% 0% 0%Shared Lane Traffic (%)Lane Group Flow (vph) 0 141 0 0 157 0 0 207 0 0 190 0Turn Type Perm NA Perm NA Perm NA Perm NAProtected Phases 4 8 2 6Permitted Phases 4 8 2 6Detector Phase 4 4 8 8 2 2 6 6Switch PhaseMinimum Initial (s) 4.0 4.0 4.0 4.0 4.0 4.0 4.0 4.0Minimum Split (s) 21.0 21.0 21.0 21.0 21.0 21.0 21.0 21.0Total Split (s) 32.0 32.0 32.0 32.0 43.0 43.0 43.0 43.0Total Split (%) 42.7% 42.7% 42.7% 42.7% 57.3% 57.3% 57.3% 57.3%Yellow Time (s) 4.0 4.0 4.0 4.0 4.0 4.0 4.0 4.0All-Red Time (s) 1.0 1.0 1.0 1.0 1.0 1.0 1.0 1.0Lost Time Adjust (s) 0.0 0.0 0.0 0.0Total Lost Time (s) 5.0 5.0 5.0 5.0Lead/LagLead-Lag Optimize?Recall Mode Max Max Max Max Max Max Max MaxAct Effct Green (s) 27.0 27.0 38.0 38.0Actuated g/C Ratio 0.36 0.36 0.51 0.51v/c Ratio 0.29 0.27 0.24 0.14
A - 27

Lanes, Volumes, Timings
1: Sherman Ave & Grove St 6/1/2017
Weekday AM - Existing Synchro 8 Report17-066; Evanston, IL
Lane Group EBL EBT EBR WBL WBT WBR NBL NBT NBR SBL SBT SBRControl Delay 18.0 14.5 11.0 8.2Queue Delay 0.0 0.0 0.0 0.0Total Delay 18.0 14.5 11.0 8.2LOS B B B AApproach Delay 18.0 14.5 11.0 8.2Approach LOS B B B AQueue Length 50th (ft) 42 38 49 18Queue Length 95th (ft) 85 81 88 34Internal Link Dist (ft) 1 149 87 63Turn Bay Length (ft)Base Capacity (vph) 479 574 847 1311Starvation Cap Reductn 0 0 0 0Spillback Cap Reductn 0 0 0 0Storage Cap Reductn 0 0 0 0Reduced v/c Ratio 0.29 0.27 0.24 0.14
Intersection SummaryArea Type: OtherCycle Length: 75Actuated Cycle Length: 75Offset: 0 (0%), Referenced to phase 2:NBTL and 6:SBTL, Start of GreenNatural Cycle: 45Control Type: PretimedMaximum v/c Ratio: 0.29Intersection Signal Delay: 12.4 Intersection LOS: BIntersection Capacity Utilization 57.8% ICU Level of Service BAnalysis Period (min) 15
Splits and Phases: 1: Sherman Ave & Grove St
A - 28

HCM Unsignalized Intersection Capacity Analysis
2: Sherman Ave & Lake St 6/1/2017
Weekday AM - Existing Synchro 8 Report17-066; Evanston, IL
Movement EBL EBT EBR WBL WBT WBR NBL NBT NBR SBL SBT SBRLane ConfigurationsSign Control Stop Stop Stop StopVolume (vph) 66 141 17 6 107 11 11 129 13 27 60 30Peak Hour Factor 0.91 0.91 0.91 0.91 0.91 0.91 0.91 0.91 0.91 0.91 0.91 0.91Hourly flow rate (vph) 73 155 19 7 118 12 12 142 14 30 66 33
Direction, Lane # EB 1 WB 1 WB 2 NB 1 SB 1 SB 2Volume Total (vph) 246 65 71 168 63 66Volume Left (vph) 73 7 0 12 30 0Volume Right (vph) 19 0 12 14 0 33Hadj (s) 0.09 0.13 -0.03 -0.01 0.37 -0.31Departure Headway (s) 5.7 5.8 5.7 5.8 6.2 5.5Degree Utilization, x 0.39 0.11 0.11 0.27 0.11 0.10Capacity (veh/h) 606 577 593 585 537 601Control Delay (s) 12.2 8.3 8.2 10.9 8.8 8.0Approach Delay (s) 12.2 8.2 10.9 8.3Approach LOS B A B A
Intersection SummaryDelay 10.4Level of Service BIntersection Capacity Utilization 40.9% ICU Level of Service AAnalysis Period (min) 15
A - 29

HCM Unsignalized Intersection Capacity Analysis
3: Elmwood Ave & Lake St 6/1/2017
Weekday AM - Existing Synchro 8 Report17-066; Evanston, IL
Movement EBL EBT EBR WBL WBT WBR NBL NBT NBR SBL SBT SBRLane ConfigurationsSign Control Stop Stop Stop StopVolume (vph) 20 201 18 8 135 6 24 19 16 5 4 5Peak Hour Factor 0.93 0.93 0.93 0.93 0.93 0.93 0.93 0.93 0.93 0.93 0.93 0.93Hourly flow rate (vph) 22 216 19 9 145 6 26 20 17 5 4 5
Direction, Lane # EB 1 WB 1 NB 1 SB 1Volume Total (vph) 257 160 63 15Volume Left (vph) 22 9 26 5Volume Right (vph) 19 6 17 5Hadj (s) 0.04 0.05 0.07 0.10Departure Headway (s) 4.3 4.4 4.9 5.0Degree Utilization, x 0.31 0.20 0.09 0.02Capacity (veh/h) 813 782 671 645Control Delay (s) 9.2 8.5 8.4 8.1Approach Delay (s) 9.2 8.5 8.4 8.1Approach LOS A A A A
Intersection SummaryDelay 8.9Level of Service AIntersection Capacity Utilization 34.9% ICU Level of Service AAnalysis Period (min) 15
A - 30

HCM Unsignalized Intersection Capacity Analysis
4: Elmwood Ave & Grove St 6/1/2017
Weekday AM - Existing Synchro 8 Report17-066; Evanston, IL
Movement EBL EBT EBR WBL WBT WBR NBL NBT NBR SBL SBT SBRLane ConfigurationsVolume (veh/h) 3 193 5 4 101 4 12 4 25 2 2 12Sign Control Free Free Stop StopGrade 0% 0% 0% 0%Peak Hour Factor 0.93 0.93 0.93 0.93 0.93 0.93 0.93 0.93 0.93 0.93 0.93 0.93Hourly flow rate (vph) 3 208 5 4 109 4 13 4 27 2 2 13Pedestrians 6 5 35 26Lane Width (ft) 11.0 11.0 11.0 11.0Walking Speed (ft/s) 4.0 4.0 4.0 4.0Percent Blockage 0 0 3 2Right turn flare (veh)Median type None NoneMedian storage veh)Upstream signal (ft) 452pX, platoon unblockedvC, conflicting volume 139 248 391 399 250 396 400 143vC1, stage 1 conf volvC2, stage 2 conf volvCu, unblocked vol 139 248 391 399 250 396 400 143tC, single (s) 4.1 4.1 7.3 6.5 6.4 7.1 6.5 6.2tC, 2 stage (s)tF (s) 2.2 2.2 3.7 4.0 3.5 3.5 4.0 3.3p0 queue free % 100 100 97 99 96 100 100 99cM capacity (veh/h) 1428 1294 496 514 728 509 514 888
Direction, Lane # EB 1 WB 1 NB 1 SB 1Volume Total 216 117 44 17Volume Left 3 4 13 2Volume Right 5 4 27 13cSH 1428 1294 618 750Volume to Capacity 0.00 0.00 0.07 0.02Queue Length 95th (ft) 0 0 6 2Control Delay (s) 0.1 0.3 11.3 9.9Lane LOS A A B AApproach Delay (s) 0.1 0.3 11.3 9.9Approach LOS B A
Intersection SummaryAverage Delay 1.9Intersection Capacity Utilization 25.8% ICU Level of Service AAnalysis Period (min) 15
A - 31

Lanes, Volumes, Timings
1: Sherman Ave & Grove St 6/1/2017
Weekday PM - Existing Synchro 8 Report17-066; Evanston, IL
Lane Group EBL EBT EBR WBL WBT WBR NBL NBT NBR SBL SBT SBRLane ConfigurationsVolume (vph) 40 104 33 18 91 48 17 119 25 93 241 48Ideal Flow (vphpl) 1900 1900 1900 1900 1900 1900 1900 1900 1900 1900 1900 1900Lane Width (ft) 11 11 11 11 11 11 11 11 11 11 11 11Grade (%) 0% 0% 0% 0%Storage Length (ft) 0 0 0 0 0 0 0 0Storage Lanes 0 0 0 0 0 0 0 0Taper Length (ft) 25 25 25 25Lane Util. Factor 1.00 1.00 1.00 1.00 1.00 1.00 1.00 1.00 1.00 0.95 0.95 0.95Ped Bike Factor 0.94 0.92 0.94 0.91Frt 0.975 0.959 0.979 0.981Flt Protected 0.989 0.994 0.995 0.988Satd. Flow (prot) 0 1706 0 0 1579 0 0 1680 0 0 3156 0Flt Permitted 0.908 0.959 0.946 0.835Satd. Flow (perm) 0 1511 0 0 1509 0 0 1562 0 0 2543 0Right Turn on Red Yes Yes Yes YesSatd. Flow (RTOR) 17 33 18 31Link Speed (mph) 25 25 25 25Link Distance (ft) 57 229 167 143Travel Time (s) 1.6 6.2 4.6 3.9Confl. Peds. (#/hr) 92 90 90 92 156 107 107 156Confl. Bikes (#/hr) 1 2 3 9Peak Hour Factor 0.95 0.95 0.95 0.95 0.95 0.95 0.95 0.95 0.95 0.95 0.95 0.95Growth Factor 100% 100% 100% 100% 100% 100% 100% 100% 100% 100% 100% 100%Heavy Vehicles (%) 0% 1% 3% 10% 2% 2% 0% 2% 4% 3% 2% 0%Bus Blockages (#/hr) 0 0 0 0 0 0 0 0 0 0 0 0Parking (#/hr) 10 10 10 10Mid-Block Traffic (%) 0% 0% 0% 0%Shared Lane Traffic (%)Lane Group Flow (vph) 0 186 0 0 166 0 0 169 0 0 403 0Turn Type Perm NA Perm NA Perm NA Perm NAProtected Phases 4 8 2 6Permitted Phases 4 8 2 6Detector Phase 4 4 8 8 2 2 6 6Switch PhaseMinimum Initial (s) 4.0 4.0 4.0 4.0 4.0 4.0 4.0 4.0Minimum Split (s) 21.0 21.0 21.0 21.0 21.0 21.0 21.0 21.0Total Split (s) 32.0 32.0 32.0 32.0 43.0 43.0 43.0 43.0Total Split (%) 42.7% 42.7% 42.7% 42.7% 57.3% 57.3% 57.3% 57.3%Yellow Time (s) 4.0 4.0 4.0 4.0 4.0 4.0 4.0 4.0All-Red Time (s) 1.0 1.0 1.0 1.0 1.0 1.0 1.0 1.0Lost Time Adjust (s) 0.0 0.0 0.0 0.0Total Lost Time (s) 5.0 5.0 5.0 5.0Lead/LagLead-Lag Optimize?Recall Mode Max Max Max Max Max Max Max MaxAct Effct Green (s) 27.0 27.0 38.0 38.0Actuated g/C Ratio 0.36 0.36 0.51 0.51v/c Ratio 0.34 0.29 0.21 0.31
A - 32

Lanes, Volumes, Timings
1: Sherman Ave & Grove St 6/1/2017
Weekday PM - Existing Synchro 8 Report17-066; Evanston, IL
Lane Group EBL EBT EBR WBL WBT WBR NBL NBT NBR SBL SBT SBRControl Delay 17.9 15.3 9.9 10.7Queue Delay 0.0 0.0 0.0 0.0Total Delay 17.9 15.3 9.9 10.7LOS B B A BApproach Delay 17.9 15.3 9.9 10.7Approach LOS B B A BQueue Length 50th (ft) 56 43 36 49Queue Length 95th (ft) 105 88 70 77Internal Link Dist (ft) 1 149 87 63Turn Bay Length (ft)Base Capacity (vph) 554 564 800 1303Starvation Cap Reductn 0 0 0 0Spillback Cap Reductn 0 0 0 0Storage Cap Reductn 0 0 0 0Reduced v/c Ratio 0.34 0.29 0.21 0.31
Intersection SummaryArea Type: OtherCycle Length: 75Actuated Cycle Length: 75Offset: 0 (0%), Referenced to phase 2:NBTL and 6:SBTL, Start of GreenNatural Cycle: 45Control Type: PretimedMaximum v/c Ratio: 0.34Intersection Signal Delay: 12.8 Intersection LOS: BIntersection Capacity Utilization 57.1% ICU Level of Service BAnalysis Period (min) 15
Splits and Phases: 1: Sherman Ave & Grove St
A - 33

HCM Unsignalized Intersection Capacity Analysis
2: Sherman Ave & Lake St 6/1/2017
Weekday PM - Existing Synchro 8 Report17-066; Evanston, IL
Movement EBL EBT EBR WBL WBT WBR NBL NBT NBR SBL SBT SBRLane ConfigurationsSign Control Stop Stop Stop StopVolume (vph) 59 117 10 6 113 24 14 77 8 60 156 74Peak Hour Factor 0.89 0.89 0.89 0.89 0.89 0.89 0.89 0.89 0.89 0.89 0.89 0.89Hourly flow rate (vph) 66 131 11 7 127 27 16 87 9 67 175 83
Direction, Lane # EB 1 WB 1 WB 2 NB 1 SB 1 SB 2Volume Total (vph) 209 70 90 111 155 171Volume Left (vph) 66 7 0 16 67 0Volume Right (vph) 11 0 27 9 0 83Hadj (s) 0.06 0.06 -0.18 0.01 0.30 -0.31Departure Headway (s) 6.0 6.1 5.9 6.1 6.1 5.5Degree Utilization, x 0.35 0.12 0.15 0.19 0.26 0.26Capacity (veh/h) 566 546 569 548 564 627Control Delay (s) 12.2 8.7 8.7 10.5 10.0 9.2Approach Delay (s) 12.2 8.7 10.5 9.6Approach LOS B A B A
Intersection SummaryDelay 10.2Level of Service BIntersection Capacity Utilization 48.5% ICU Level of Service AAnalysis Period (min) 15
A - 34

HCM Unsignalized Intersection Capacity Analysis
3: Elmwood Ave & Lake St 6/1/2017
Weekday PM - Existing Synchro 8 Report17-066; Evanston, IL
Movement EBL EBT EBR WBL WBT WBR NBL NBT NBR SBL SBT SBRLane ConfigurationsSign Control Stop Stop Stop StopVolume (vph) 6 181 13 14 178 10 13 19 3 4 10 13Peak Hour Factor 0.88 0.88 0.88 0.88 0.88 0.88 0.88 0.88 0.88 0.88 0.88 0.88Hourly flow rate (vph) 7 206 15 16 202 11 15 22 3 5 11 15
Direction, Lane # EB 1 WB 1 NB 1 SB 1Volume Total (vph) 227 230 40 31Volume Left (vph) 7 16 15 5Volume Right (vph) 15 11 3 15Hadj (s) 0.01 -0.02 0.07 -0.26Departure Headway (s) 4.3 4.3 5.0 4.7Degree Utilization, x 0.27 0.27 0.06 0.04Capacity (veh/h) 811 808 650 683Control Delay (s) 8.9 8.9 8.3 7.9Approach Delay (s) 8.9 8.9 8.3 7.9Approach LOS A A A A
Intersection SummaryDelay 8.8Level of Service AIntersection Capacity Utilization 33.5% ICU Level of Service AAnalysis Period (min) 15
A - 35

HCM Unsignalized Intersection Capacity Analysis
4: Elmwood Ave & Grove St 6/1/2017
Weekday PM - Existing Synchro 8 Report17-066; Evanston, IL
Movement EBL EBT EBR WBL WBT WBR NBL NBT NBR SBL SBT SBRLane ConfigurationsVolume (veh/h) 7 117 9 14 213 6 17 3 14 4 0 7Sign Control Free Free Stop StopGrade 0% 0% 0% 0%Peak Hour Factor 0.90 0.90 0.90 0.90 0.90 0.90 0.90 0.90 0.90 0.90 0.90 0.90Hourly flow rate (vph) 8 130 10 16 237 7 19 3 16 4 0 8Pedestrians 11 10 55 46Lane Width (ft) 11.0 11.0 11.0 11.0Walking Speed (ft/s) 4.0 4.0 4.0 4.0Percent Blockage 1 1 4 4Right turn flare (veh)Median type None NoneMedian storage veh)Upstream signal (ft) 452pX, platoon unblockedvC, conflicting volume 289 195 495 526 200 495 528 297vC1, stage 1 conf volvC2, stage 2 conf volvCu, unblocked vol 289 195 495 526 200 495 528 297tC, single (s) 4.1 4.2 7.2 6.5 6.2 7.1 6.5 6.2tC, 2 stage (s)tF (s) 2.2 2.3 3.6 4.0 3.3 3.5 4.0 3.3p0 queue free % 99 99 95 99 98 99 100 99cM capacity (veh/h) 1239 1292 417 417 804 423 416 715
Direction, Lane # EB 1 WB 1 NB 1 SB 1Volume Total 148 259 38 12Volume Left 8 16 19 4Volume Right 10 7 16 8cSH 1239 1292 520 572Volume to Capacity 0.01 0.01 0.07 0.02Queue Length 95th (ft) 0 1 6 2Control Delay (s) 0.5 0.6 12.5 11.4Lane LOS A A B BApproach Delay (s) 0.5 0.6 12.5 11.4Approach LOS B B
Intersection SummaryAverage Delay 1.8Intersection Capacity Utilization 29.4% ICU Level of Service AAnalysis Period (min) 15
A - 36

Lanes, Volumes, Timings
1: Sherman Ave & Grove St 6/1/2017
Weekday AM - Future Synchro 8 Report17-066; Evanston, IL
Lane Group EBL EBT EBR WBL WBT WBR NBL NBT NBR SBL SBT SBRLane ConfigurationsVolume (vph) 54 66 18 10 94 49 19 187 16 44 107 37Ideal Flow (vphpl) 1900 1900 1900 1900 1900 1900 1900 1900 1900 1900 1900 1900Lane Width (ft) 11 11 11 11 11 11 11 11 11 11 11 11Grade (%) 0% 0% 0% 0%Storage Length (ft) 0 0 0 0 0 0 0 0Storage Lanes 0 0 0 0 0 0 0 0Taper Length (ft) 25 25 25 25Lane Util. Factor 1.00 1.00 1.00 1.00 1.00 1.00 1.00 1.00 1.00 0.95 0.95 0.95Ped Bike Factor 0.92 0.92 0.98 0.94Frt 0.982 0.957 0.990 0.970Flt Protected 0.981 0.997 0.996 0.989Satd. Flow (prot) 0 1639 0 0 1554 0 0 1715 0 0 3015 0Flt Permitted 0.840 0.981 0.970 0.855Satd. Flow (perm) 0 1309 0 0 1524 0 0 1651 0 0 2544 0Right Turn on Red Yes Yes Yes YesSatd. Flow (RTOR) 11 35 8 39Link Speed (mph) 25 25 25 25Link Distance (ft) 57 229 167 143Travel Time (s) 1.6 6.2 4.6 3.9Confl. Peds. (#/hr) 100 42 42 100 75 67 67 75Confl. Bikes (#/hr) 2 1 9 1Peak Hour Factor 0.95 0.95 0.95 0.95 0.95 0.95 0.95 0.95 0.95 0.95 0.95 0.95Growth Factor 100% 100% 100% 100% 100% 100% 100% 100% 100% 100% 100% 100%Heavy Vehicles (%) 8% 8% 0% 0% 5% 2% 0% 5% 0% 12% 6% 3%Bus Blockages (#/hr) 0 0 0 0 0 0 0 0 0 0 0 0Parking (#/hr) 10 10 10 10Mid-Block Traffic (%) 0% 0% 0% 0%Shared Lane Traffic (%)Lane Group Flow (vph) 0 145 0 0 162 0 0 234 0 0 198 0Turn Type Perm NA Perm NA Perm NA Perm NAProtected Phases 4 8 2 6Permitted Phases 4 8 2 6Detector Phase 4 4 8 8 2 2 6 6Switch PhaseMinimum Initial (s) 4.0 4.0 4.0 4.0 4.0 4.0 4.0 4.0Minimum Split (s) 21.0 21.0 21.0 21.0 21.0 21.0 21.0 21.0Total Split (s) 32.0 32.0 32.0 32.0 43.0 43.0 43.0 43.0Total Split (%) 42.7% 42.7% 42.7% 42.7% 57.3% 57.3% 57.3% 57.3%Yellow Time (s) 4.0 4.0 4.0 4.0 4.0 4.0 4.0 4.0All-Red Time (s) 1.0 1.0 1.0 1.0 1.0 1.0 1.0 1.0Lost Time Adjust (s) 0.0 0.0 0.0 0.0Total Lost Time (s) 5.0 5.0 5.0 5.0Lead/LagLead-Lag Optimize?Recall Mode Max Max Max Max Max Max Max MaxAct Effct Green (s) 27.0 27.0 38.0 38.0Actuated g/C Ratio 0.36 0.36 0.51 0.51v/c Ratio 0.30 0.28 0.28 0.15
A - 37

Lanes, Volumes, Timings
1: Sherman Ave & Grove St 6/1/2017
Weekday AM - Future Synchro 8 Report17-066; Evanston, IL
Lane Group EBL EBT EBR WBL WBT WBR NBL NBT NBR SBL SBT SBRControl Delay 18.1 14.9 11.4 8.2Queue Delay 0.0 0.0 0.0 0.0Total Delay 18.1 14.9 11.4 8.2LOS B B B AApproach Delay 18.1 14.9 11.4 8.2Approach LOS B B B AQueue Length 50th (ft) 44 40 56 19Queue Length 95th (ft) 87 84 99 36Internal Link Dist (ft) 1 149 87 63Turn Bay Length (ft)Base Capacity (vph) 478 571 840 1308Starvation Cap Reductn 0 0 0 0Spillback Cap Reductn 0 0 0 0Storage Cap Reductn 0 0 0 0Reduced v/c Ratio 0.30 0.28 0.28 0.15
Intersection SummaryArea Type: OtherCycle Length: 75Actuated Cycle Length: 75Offset: 0 (0%), Referenced to phase 2:NBTL and 6:SBTL, Start of GreenNatural Cycle: 45Control Type: PretimedMaximum v/c Ratio: 0.30Intersection Signal Delay: 12.6 Intersection LOS: BIntersection Capacity Utilization 60.8% ICU Level of Service BAnalysis Period (min) 15
Splits and Phases: 1: Sherman Ave & Grove St
A - 38

HCM Unsignalized Intersection Capacity Analysis
2: Sherman Ave & Lake St 6/1/2017
Weekday AM - Future Synchro 8 Report17-066; Evanston, IL
Movement EBL EBT EBR WBL WBT WBR NBL NBT NBR SBL SBT SBRLane ConfigurationsSign Control Stop Stop Stop StopVolume (vph) 69 142 18 7 108 14 12 134 14 37 82 40Peak Hour Factor 0.91 0.91 0.91 0.91 0.91 0.91 0.91 0.91 0.91 0.91 0.91 0.91Hourly flow rate (vph) 76 156 20 8 119 15 13 147 15 41 90 44
Direction, Lane # EB 1 WB 1 WB 2 NB 1 SB 1 SB 2Volume Total (vph) 252 67 75 176 86 89Volume Left (vph) 76 8 0 13 41 0Volume Right (vph) 20 0 15 15 0 44Hadj (s) 0.09 0.13 -0.05 -0.01 0.37 -0.30Departure Headway (s) 5.8 6.0 5.9 5.9 6.3 5.6Degree Utilization, x 0.41 0.11 0.12 0.29 0.15 0.14Capacity (veh/h) 586 553 570 569 531 593Control Delay (s) 12.8 8.6 8.5 11.3 9.2 8.3Approach Delay (s) 12.8 8.5 11.3 8.8Approach LOS B A B A
Intersection SummaryDelay 10.7Level of Service BIntersection Capacity Utilization 50.7% ICU Level of Service AAnalysis Period (min) 15
A - 39

HCM Unsignalized Intersection Capacity Analysis
3: Elmwood Ave & Lake St 6/1/2017
Weekday AM - Future Synchro 8 Report17-066; Evanston, IL
Movement EBL EBT EBR WBL WBT WBR NBL NBT NBR SBL SBT SBRLane ConfigurationsSign Control Stop Stop Stop StopVolume (vph) 21 205 19 9 145 7 25 20 17 6 5 6Peak Hour Factor 0.93 0.93 0.93 0.93 0.93 0.93 0.93 0.93 0.93 0.93 0.93 0.93Hourly flow rate (vph) 23 220 20 10 156 8 27 22 18 6 5 6
Direction, Lane # EB 1 WB 1 NB 1 SB 1Volume Total (vph) 263 173 67 18Volume Left (vph) 23 10 27 6Volume Right (vph) 20 8 18 6Hadj (s) 0.04 0.05 0.07 0.10Departure Headway (s) 4.4 4.5 5.0 5.1Degree Utilization, x 0.32 0.21 0.09 0.03Capacity (veh/h) 806 776 661 635Control Delay (s) 9.4 8.7 8.5 8.2Approach Delay (s) 9.4 8.7 8.5 8.2Approach LOS A A A A
Intersection SummaryDelay 9.0Level of Service AIntersection Capacity Utilization 35.5% ICU Level of Service AAnalysis Period (min) 15
A - 40

HCM Unsignalized Intersection Capacity Analysis
4: Elmwood Ave & Grove St 6/1/2017
Weekday AM - Future Synchro 8 Report17-066; Evanston, IL
Movement EBL EBT EBR WBL WBT WBR NBL NBT NBR SBL SBT SBRLane ConfigurationsVolume (veh/h) 4 196 6 5 105 5 13 5 26 3 3 13Sign Control Free Free Stop StopGrade 0% 0% 0% 0%Peak Hour Factor 0.93 0.93 0.93 0.93 0.93 0.93 0.93 0.93 0.93 0.93 0.93 0.93Hourly flow rate (vph) 4 211 6 5 113 5 14 5 28 3 3 14Pedestrians 6 5 35 26Lane Width (ft) 11.0 11.0 11.0 11.0Walking Speed (ft/s) 4.0 4.0 4.0 4.0Percent Blockage 0 0 3 2Right turn flare (veh)Median type None NoneMedian storage veh)Upstream signal (ft) 452pX, platoon unblockedvC, conflicting volume 144 252 406 413 254 411 413 148vC1, stage 1 conf volvC2, stage 2 conf volvCu, unblocked vol 144 252 406 413 254 411 413 148tC, single (s) 4.1 4.1 7.3 6.5 6.4 7.1 6.5 6.2tC, 2 stage (s)tF (s) 2.2 2.2 3.7 4.0 3.5 3.5 4.0 3.3p0 queue free % 100 100 97 99 96 99 99 98cM capacity (veh/h) 1422 1289 483 504 724 496 504 883
Direction, Lane # EB 1 WB 1 NB 1 SB 1Volume Total 222 124 47 20Volume Left 4 5 14 3Volume Right 6 5 28 14cSH 1422 1289 605 711Volume to Capacity 0.00 0.00 0.08 0.03Queue Length 95th (ft) 0 0 6 2Control Delay (s) 0.2 0.4 11.5 10.2Lane LOS A A B BApproach Delay (s) 0.2 0.4 11.5 10.2Approach LOS B B
Intersection SummaryAverage Delay 2.0Intersection Capacity Utilization 25.8% ICU Level of Service AAnalysis Period (min) 15
A - 41

HCM Unsignalized Intersection Capacity Analysis
7: Sherman Ave & Garage Exit/Proposed Access 6/1/2017
Weekday AM - Future Synchro 8 Report17-066; Evanston, IL
Movement EBL EBT EBR WBL WBT WBR NBL NBT NBR SBL SBT SBRLane ConfigurationsVolume (veh/h) 21 0 39 0 0 0 9 198 10 8 122 6Sign Control Stop Stop Free FreeGrade 0% 0% 0% 0%Peak Hour Factor 0.95 0.95 0.95 0.95 0.95 0.95 0.95 0.95 0.95 0.95 0.95 0.95Hourly flow rate (vph) 22 0 41 0 0 0 9 208 11 8 128 6Pedestrians 75 75 75Lane Width (ft) 11.0 11.0 11.0Walking Speed (ft/s) 4.0 4.0 4.0Percent Blockage 6 6 6Right turn flare (veh)Median type None NoneMedian storage veh)Upstream signal (ft) 257pX, platoon unblockedvC, conflicting volume 531 461 217 430 459 289 210 219vC1, stage 1 conf volvC2, stage 2 conf volvCu, unblocked vol 531 461 217 430 459 289 210 219tC, single (s) 7.5 6.5 6.9 7.5 6.5 6.9 4.1 4.1tC, 2 stage (s)tF (s) 3.5 4.0 3.3 3.5 4.0 3.3 2.2 2.2p0 queue free % 94 100 94 100 100 100 99 99cM capacity (veh/h) 366 465 705 432 466 673 1294 1362
Direction, Lane # EB 1 NB 1 SB 1 SB 2Volume Total 63 228 73 71Volume Left 22 9 8 0Volume Right 41 11 0 6cSH 533 1294 1362 1700Volume to Capacity 0.12 0.01 0.01 0.04Queue Length 95th (ft) 10 1 0 0Control Delay (s) 12.7 0.4 0.9 0.0Lane LOS B A AApproach Delay (s) 12.7 0.4 0.5Approach LOS B
Intersection SummaryAverage Delay 2.2Intersection Capacity Utilization 37.9% ICU Level of Service AAnalysis Period (min) 15
A - 42

Lanes, Volumes, Timings
1: Sherman Ave & Grove St 6/1/2017
Weekday PM - Future Synchro 8 Report17-066; Evanston, IL
Lane Group EBL EBT EBR WBL WBT WBR NBL NBT NBR SBL SBT SBRLane ConfigurationsVolume (vph) 41 105 37 22 92 49 20 131 28 94 258 49Ideal Flow (vphpl) 1900 1900 1900 1900 1900 1900 1900 1900 1900 1900 1900 1900Lane Width (ft) 11 11 11 11 11 11 11 11 11 11 11 11Grade (%) 0% 0% 0% 0%Storage Length (ft) 0 0 0 0 0 0 0 0Storage Lanes 0 0 0 0 0 0 0 0Taper Length (ft) 25 25 25 25Lane Util. Factor 1.00 1.00 1.00 1.00 1.00 1.00 1.00 1.00 1.00 0.95 0.95 0.95Ped Bike Factor 0.94 0.92 0.94 0.91Frt 0.973 0.959 0.979 0.982Flt Protected 0.989 0.993 0.994 0.988Satd. Flow (prot) 0 1699 0 0 1577 0 0 1679 0 0 3164 0Flt Permitted 0.907 0.949 0.938 0.833Satd. Flow (perm) 0 1505 0 0 1490 0 0 1548 0 0 2553 0Right Turn on Red Yes Yes Yes YesSatd. Flow (RTOR) 19 32 18 30Link Speed (mph) 25 25 25 25Link Distance (ft) 57 229 167 143Travel Time (s) 1.6 6.2 4.6 3.9Confl. Peds. (#/hr) 92 90 90 92 156 107 107 156Confl. Bikes (#/hr) 1 2 3 9Peak Hour Factor 0.95 0.95 0.95 0.95 0.95 0.95 0.95 0.95 0.95 0.95 0.95 0.95Growth Factor 100% 100% 100% 100% 100% 100% 100% 100% 100% 100% 100% 100%Heavy Vehicles (%) 0% 1% 3% 10% 2% 2% 0% 2% 4% 3% 2% 0%Bus Blockages (#/hr) 0 0 0 0 0 0 0 0 0 0 0 0Parking (#/hr) 10 10 10 10Mid-Block Traffic (%) 0% 0% 0% 0%Shared Lane Traffic (%)Lane Group Flow (vph) 0 193 0 0 172 0 0 188 0 0 423 0Turn Type Perm NA Perm NA Perm NA Perm NAProtected Phases 4 8 2 6Permitted Phases 4 8 2 6Detector Phase 4 4 8 8 2 2 6 6Switch PhaseMinimum Initial (s) 4.0 4.0 4.0 4.0 4.0 4.0 4.0 4.0Minimum Split (s) 21.0 21.0 21.0 21.0 21.0 21.0 21.0 21.0Total Split (s) 32.0 32.0 32.0 32.0 43.0 43.0 43.0 43.0Total Split (%) 42.7% 42.7% 42.7% 42.7% 57.3% 57.3% 57.3% 57.3%Yellow Time (s) 4.0 4.0 4.0 4.0 4.0 4.0 4.0 4.0All-Red Time (s) 1.0 1.0 1.0 1.0 1.0 1.0 1.0 1.0Lost Time Adjust (s) 0.0 0.0 0.0 0.0Total Lost Time (s) 5.0 5.0 5.0 5.0Lead/LagLead-Lag Optimize?Recall Mode Max Max Max Max Max Max Max MaxAct Effct Green (s) 27.0 27.0 38.0 38.0Actuated g/C Ratio 0.36 0.36 0.51 0.51v/c Ratio 0.35 0.31 0.24 0.32
A - 43

Lanes, Volumes, Timings
1: Sherman Ave & Grove St 6/1/2017
Weekday PM - Future Synchro 8 Report17-066; Evanston, IL
Lane Group EBL EBT EBR WBL WBT WBR NBL NBT NBR SBL SBT SBRControl Delay 18.0 15.8 10.3 10.9Queue Delay 0.0 0.0 0.0 0.0Total Delay 18.0 15.8 10.3 10.9LOS B B B BApproach Delay 18.0 15.8 10.3 10.9Approach LOS B B B BQueue Length 50th (ft) 57 45 41 52Queue Length 95th (ft) 109 91 78 82Internal Link Dist (ft) 1 149 87 63Turn Bay Length (ft)Base Capacity (vph) 553 556 793 1308Starvation Cap Reductn 0 0 0 0Spillback Cap Reductn 0 0 0 0Storage Cap Reductn 0 0 0 0Reduced v/c Ratio 0.35 0.31 0.24 0.32
Intersection SummaryArea Type: OtherCycle Length: 75Actuated Cycle Length: 75Offset: 0 (0%), Referenced to phase 2:NBTL and 6:SBTL, Start of GreenNatural Cycle: 45Control Type: PretimedMaximum v/c Ratio: 0.35Intersection Signal Delay: 13.0 Intersection LOS: BIntersection Capacity Utilization 56.6% ICU Level of Service BAnalysis Period (min) 15
Splits and Phases: 1: Sherman Ave & Grove St
A - 44

HCM Unsignalized Intersection Capacity Analysis
2: Sherman Ave & Lake St 6/1/2017
Weekday PM - Future Synchro 8 Report17-066; Evanston, IL
Movement EBL EBT EBR WBL WBT WBR NBL NBT NBR SBL SBT SBRLane ConfigurationsSign Control Stop Stop Stop StopVolume (vph) 70 118 11 7 114 35 15 102 9 67 174 81Peak Hour Factor 0.89 0.89 0.89 0.89 0.89 0.89 0.89 0.89 0.89 0.89 0.89 0.89Hourly flow rate (vph) 79 133 12 8 128 39 17 115 10 75 196 91
Direction, Lane # EB 1 WB 1 WB 2 NB 1 SB 1 SB 2Volume Total (vph) 224 72 103 142 173 189Volume Left (vph) 79 8 0 17 75 0Volume Right (vph) 12 0 39 10 0 91Hadj (s) 0.07 0.07 -0.23 0.01 0.30 -0.30Departure Headway (s) 6.3 6.4 6.1 6.3 6.3 5.7Degree Utilization, x 0.39 0.13 0.17 0.25 0.30 0.30Capacity (veh/h) 541 519 545 530 545 604Control Delay (s) 13.2 9.1 9.2 11.4 10.7 9.8Approach Delay (s) 13.2 9.2 11.4 10.3Approach LOS B A B B
Intersection SummaryDelay 10.9Level of Service BIntersection Capacity Utilization 51.0% ICU Level of Service AAnalysis Period (min) 15
A - 45

HCM Unsignalized Intersection Capacity Analysis
3: Elmwood Ave & Lake St 6/1/2017
Weekday PM - Future Synchro 8 Report17-066; Evanston, IL
Movement EBL EBT EBR WBL WBT WBR NBL NBT NBR SBL SBT SBRLane ConfigurationsSign Control Stop Stop Stop StopVolume (vph) 7 193 14 15 186 11 14 20 4 5 11 14Peak Hour Factor 0.88 0.88 0.88 0.88 0.88 0.88 0.88 0.88 0.88 0.88 0.88 0.88Hourly flow rate (vph) 8 219 16 17 211 12 16 23 5 6 12 16
Direction, Lane # EB 1 WB 1 NB 1 SB 1Volume Total (vph) 243 241 43 34Volume Left (vph) 8 17 16 6Volume Right (vph) 16 13 5 16Hadj (s) 0.01 -0.02 0.06 -0.25Departure Headway (s) 4.4 4.3 5.1 4.8Degree Utilization, x 0.29 0.29 0.06 0.05Capacity (veh/h) 803 800 640 669Control Delay (s) 9.2 9.1 8.4 8.0Approach Delay (s) 9.2 9.1 8.4 8.0Approach LOS A A A A
Intersection SummaryDelay 9.0Level of Service AIntersection Capacity Utilization 34.2% ICU Level of Service AAnalysis Period (min) 15
A - 46

HCM Unsignalized Intersection Capacity Analysis
4: Elmwood Ave & Grove St 6/1/2017
Weekday PM - Future Synchro 8 Report17-066; Evanston, IL
Movement EBL EBT EBR WBL WBT WBR NBL NBT NBR SBL SBT SBRLane ConfigurationsVolume (veh/h) 8 121 10 15 217 7 18 4 15 5 1 8Sign Control Free Free Stop StopGrade 0% 0% 0% 0%Peak Hour Factor 0.90 0.90 0.90 0.90 0.90 0.90 0.90 0.90 0.90 0.90 0.90 0.90Hourly flow rate (vph) 9 134 11 17 241 8 20 4 17 6 1 9Pedestrians 11 10 55 46Lane Width (ft) 11.0 11.0 11.0 11.0Walking Speed (ft/s) 4.0 4.0 4.0 4.0Percent Blockage 1 1 4 4Right turn flare (veh)Median type None NoneMedian storage veh)Upstream signal (ft) 452pX, platoon unblockedvC, conflicting volume 295 201 512 541 205 511 543 302vC1, stage 1 conf volvC2, stage 2 conf volvCu, unblocked vol 295 201 512 541 205 511 543 302tC, single (s) 4.1 4.2 7.2 6.5 6.2 7.1 6.5 6.2tC, 2 stage (s)tF (s) 2.2 2.3 3.6 4.0 3.3 3.5 4.0 3.3p0 queue free % 99 99 95 99 98 99 100 99cM capacity (veh/h) 1233 1286 405 408 799 411 407 710
Direction, Lane # EB 1 WB 1 NB 1 SB 1Volume Total 154 266 41 16Volume Left 9 17 20 6Volume Right 11 8 17 9cSH 1233 1286 507 541Volume to Capacity 0.01 0.01 0.08 0.03Queue Length 95th (ft) 1 1 7 2Control Delay (s) 0.5 0.6 12.7 11.9Lane LOS A A B BApproach Delay (s) 0.5 0.6 12.7 11.9Approach LOS B B
Intersection SummaryAverage Delay 2.0Intersection Capacity Utilization 29.8% ICU Level of Service AAnalysis Period (min) 15
A - 47

HCM Unsignalized Intersection Capacity Analysis
7: Sherman Ave & Garage Exit/Proposed Access 6/1/2017
Weekday PM - Future Synchro 8 Report17-066; Evanston, IL
Movement EBL EBT EBR WBL WBT WBR NBL NBT NBR SBL SBT SBRLane ConfigurationsVolume (veh/h) 15 0 28 0 0 0 44 159 4 8 301 22Sign Control Stop Stop Free FreeGrade 0% 0% 0% 0%Peak Hour Factor 0.95 0.95 0.95 0.95 0.95 0.95 0.95 0.95 0.95 0.95 0.95 0.95Hourly flow rate (vph) 16 0 29 0 0 0 46 167 4 8 317 23Pedestrians 75 75 75Lane Width (ft) 11.0 11.0 11.0Walking Speed (ft/s) 4.0 4.0 4.0Percent Blockage 6 6 6Right turn flare (veh)Median type None NoneMedian storage veh)Upstream signal (ft) 257pX, platoon unblockedvC, conflicting volume 757 684 320 542 694 244 415 172vC1, stage 1 conf volvC2, stage 2 conf volvCu, unblocked vol 757 684 320 542 694 244 415 172tC, single (s) 7.5 6.5 6.9 7.5 6.5 6.9 4.1 4.1tC, 2 stage (s)tF (s) 3.5 4.0 3.3 3.5 4.0 3.3 2.2 2.2p0 queue free % 94 100 95 100 100 100 96 99cM capacity (veh/h) 246 335 606 354 331 718 1089 1418
Direction, Lane # EB 1 NB 1 SB 1 SB 2Volume Total 45 218 167 182Volume Left 16 46 8 0Volume Right 29 4 0 23cSH 401 1089 1418 1700Volume to Capacity 0.11 0.04 0.01 0.11Queue Length 95th (ft) 9 3 0 0Control Delay (s) 15.1 2.1 0.4 0.0Lane LOS C A AApproach Delay (s) 15.1 2.1 0.2Approach LOS C
Intersection SummaryAverage Delay 2.0Intersection Capacity Utilization 46.8% ICU Level of Service AAnalysis Period (min) 15
A - 48