economic determinants of net international migration in ... · compte ici sont le pnb par habitant,...
TRANSCRIPT

European Journal of Population 19: 171–198, 2003.© 2003 Kluwer Academic Publishers. Printed in the Netherlands.
171
Economic Determinants of Net InternationalMigration in Western Europe
ROEL JENNISSENNetherlands Interdisciplinary Demographic Institute (NIDI), Lange Houtstraat 19, 2511 CVThe Hague, The Netherlands (E-mail: [email protected])
Received 13 March 2002; accepted in final form 2 October 2002
Jennissen, R.P.W., 2003. Economic Determinants of Net International Migration in Western Europe,European Journal of Population, 19: 171–198.
Abstract. This paper aims to estimate the influence of economic determinants on net internationalmigration in Western Europe in the period 1960–1998. Net migration rates (i.e., population growthminus natural increase, divided by the midyear population) constitute the dependent variable.The economic determinants used in this study are GDP per capita, unemployment, and averageeducational level (amount of human capital) of the population. Time series regression models havebeen used in country-specific analyses. In addition, a pooled cross-sectional time series analysis hasbeen made. The analyses suggest that GDP per capita has a positive effect and unemployment anegative effect on a country’s net international migration.
Key words: economic theory, international migration, time series analysis, Western Europe
Jennissen, R.P.W., 2003. Facteurs économiques des migrations internationales en Europe del’ouest, Revue Européenne de Démographie, 19: 171–198.
Résumé. Dans cet article, nous cherchons à estimer l’influence des facteurs économiquessur les migrations internationales en Europe de l’ouest dans la période 1960–1998. Les taux nets demigration (accroissement annuel de la population diminué de l’accroissement naturel et rapporté àla population moyenne) représentent la variable dépendante. Les variables économiques prises encompte ici sont le PNB par habitant, le chômage, le niveau moyen d’instruction (capital humain).Les analyses particulières à chaque pays ont été effectuées sur des séries temporelles grâce à desmodèles de régression. Par ailleurs, une analyse a été conduite transversalement sur l’ensemble desséries temporelles. Les résultats montrent un effet positif du PNB par habitant et un effet négatif duchômage sur la migration internationale nette d’un pays.
Mots clés: analyse de séries temporelles, Europe de l’ouest, migration internationale, théorieéconomique
172 ROEL JENNISSEN
1. Aim and background
The number of empirical studies on international migration in Europe is quite large.However, attempts to measure the influence of several indicators proceeding fromcompeting or coexisting theories, on international migration are rare (Massey etal., 1998). This paper aims to fill part of this gap by estimating the influenceof economic determinants on net international migration in European countrieswithout a communist past in the period 1960–1998. An economic point of viewcovers a considerable part of the theoretical background (Jennissen, 2000).
International migration in Europe in the 1960s and the early 1970s (until theeconomic recession of 1973/1974) consisted for a considerable part of labourmigration. The domestic labour force in many Western and Northern Europeancountries could not comply with the very high demand for manual labour. Manylabour migrants went from Southern European countries to Western Europe (King,1993; King and Rybaczuk, 1993). The labour exporting countries in SouthernEurope (Greece, Italy, Portugal, Spain and Yugoslavia)1 experienced considerablenet emigration in this period. This also happened with the Irish Republic andFinland, as a result of large labour flows to the UK and Sweden, respectively(Mac Laughlin, 1993; Hammar, 1995). Since the 1980s, economic factors playa less important part in explaining migration flows within Europe. The limitedconsequences of opening the international borders within the European Unionfor intra-European labour migration, for instance, have shown that the interna-tional mobility of labour within Europe is small (King, 1993). At the same time,economic indicators remain important factors behind intercontinental migrationflows to Europe and behind migration from the former communist countries inEastern Europe to EU and EFTA countries. So, although the geographical patternof migration in Europe has changed, much of the theoretical rationale for migrationremains nevertheless unchanged.
The empirical application of economic theories of international migration inthe present study is complicated by two factors. First, net migration data are used,while the theoretical considerations typically apply to immigration and emigrationseparately. Second, although economic conditions affect migration flows, migra-tion flows also have an impact on the economy. Both factors could not be avoidedin this study. They do, however, imply that the models to be estimated are more ofa descriptive than of a truly explanatory nature.
The outline of the paper is as follows. We start with the theoretical back-ground (section 2). The data are described in section 3, and the methodologyin section 4. For the empirical application, the countries in Western Europe aresplit up into two groups: the former labour importing countries and the formerlabour exporting countries. The results of country-specific time series analyses arepresented in section 5 for the former labour importing countries and in section 6 forthe former labour exporting countries. In each section, we will present the resultsfor one country in more detail, to provide a better understanding of the relevant
ECONOMIC DETERMINANTS OF NET INTERNATIONAL MIGRATION IN WESTERN EUROPE 173
mechanisms (economic, political, colonial and social) in the analyses. Finally, insection 7 we present the results of a pooled cross-sectional time series analysis forall countries simultaneously. The paper ends with some concluding remarks.
2. Theoretical background
2.1. DETERMINANTS OF NET MIGRATION
Formulating net migration hypotheses is quite complex. We have to keep in mindthat an increase in net migration (which can be either positive or negative) can bean increase in net immigration in a receiving country, but also a decrease in netemigration in a sending country.
According to neo-classical economic theory, international labour flows exist asa consequence of wage differences between countries. These international labourflows create a new international equilibrium in which real wages have the samelevel in all countries (Borjas, 1989; Massey et al., 1993, 1998; Bauer and Zimmer-mann, 1995; Öberg, 1997). In the case of two countries only, the wage differencebetween the labour importing and the labour exporting country has a negativeeffect on net international (labour) migration in the labour exporting country anda positive effect on net international migration in the labour importing country.However, with multiple countries, a country’s net migration figure is the net resultof the aggregated migration flows between this particular country and all othercountries. Therefore, these aggregated data do not allow a proper testing of neo-classical theory. However, two former labour exporting countries in our analysis(Finland and the Irish Republic) have a net migration pattern which is dominatedby (labour, family and return) migration flows to and from one country (Swedenand the UK, respectively). For these two countries, the difference in GDP per capitabetween the dominant receiving and the sending country has been used in theanalyses for these two countries. For the other countries, we have used just thecountry’s own GDP per capita. We may now formulate hypothesis 1: GDP percapita has a positive effect on net international migration (an increase in GDP percapita will decrease net emigration from labour exporting countries and increasenet immigration into labour importing countries). This hypothesis is based onthe assumption that GDP per capita is directly correlated with international wagedifferentials.
Keynesian economic theory is critical of the neo-classical view on (interna-tional) migration. In Keynesian theory, labour supply depends on the nominalwage, not on the real wage. This distinction originates in the different views on therole of money in the economy. In the neo-classical point of view money is solelya medium of exchange. The Keynesian point of view is different, because heremoney is not only a medium of exchange but also a medium of saving. Because ofthis latter function of money, potential migrants are also attracted to high nominalwage regions. In addition, intentions to re-migrate or to send remittances furtherincrease the importance of the nominal wage level compared to the real wage level.
174 ROEL JENNISSEN
As a result, a new international equilibrium, as neo-classical theory foresees, maynot exist. Nevertheless, in Keynesian theory migration is an equilibrium recoveringmechanism, too: international migration removes unemployment differences ratherthan real wage differences (Hart, 1975; Van Dijk, 1986). A different theory, thedual labour market theory, argues that international migration is mainly drivenby pull factors in the developed (i.e., migrants receiving) countries. Piore (1979)gives three possible explanations for the demand for foreign workers in modernindustrial societies: general labour shortages; the need to fill the bottom positionsin the job hierarchy; and labour shortages in the secondary segment (which ischaracterized by a labour-intensive method of production and predominantly low-skilled employment) of a dual labour market. On the basis of Keynesian theory andthe dual labour market theory we may formulate hypothesis 2: unemployment has anegative effect on net international migration (unemployment has a negative effecton net immigration into labour importing countries and a positive effect on netemigration from labour exporting countries). In Keynesian theory this hypothesisapplies to both labour exporting and labour importing countries, whereas in thedual labour market it applies to labour importing countries only.
Our third hypothesis is related to education. The dual labour market theoryargues that shortages at the bottom of the job hierarchy in labour importingcountries may exist because of motivational problems. Jobs at the bottom ofthe hierarchy are not associated with social status, and opportunities for upwardmobility are generally low (Massey et al., 1993). These motivational problems andtherefore labour shortages at the bottom of the job hierarchy will be larger, thehigher the average level of education of the country’s population. The educationallevel may also influence net migration in labour exporting countries. According tothe relative deprivation approach, the amount of inequality in a society will have apositive effect on emigration (Stark and Taylor, 1989). Educational expansion mayresult in more equal educational opportunities, as school choices and performancesat older ages are less determined by (the socio-economic status of) parents than atyounger ages (Mare, 1981). More educational equality leads to more income andstatus equality as educational attainment has a positive impact on occupationalstatus and income (Blau and Duncan, 1967; Hauser and Sewell, 1986; Van Eijck,1996). These aspects of the dual labour market theory and the relative deprivationapproach form the basis of hypothesis 3: the educational level in a country has apositive effect on net international migration (a higher educational level in a labourexporting country will decrease emigration, a higher educational level in labourimporting countries will lead to an increase in immigration).
So far the hypotheses have been based on theoretical aspects of labour migra-tion. However, also migration for other motives, such as family reunificationand formation, return migration and asylum migration, are partly determined byeconomic factors. Family migration is most likely relatively larger when the differ-ences in economic conditions between the country of destination and the countryof origin are larger. The higher the income in a receiving country, the more depend-

ECONOMIC DETERMINANTS OF NET INTERNATIONAL MIGRATION IN WESTERN EUROPE 175
ants may come over to live on one salary. Shrinking differences in wages orunemployment rates between destination and origin countries may be an incentivefor return migration. Asylum migration, finally, seems to be less determined byeconomic factors – a sincere asylum migrant has no economic motives underlyinghis decision to migrate. Nevertheless, the choice for a certain country of destina-tion can undoubtedly partly be determined by economic factors. Therefore, also inperiods of relatively low labour migration, economic prosperity will still positivelyaffect net international migration.
Economic determinants, however, are not the only factors that play a role ininternational migration. Social, cultural and political factors are also important. Ofspecial importance is the effect of migrant networks. Within a large migrant popula-tion, migrant networks may be formed, involving interpersonal linkages between(migrant) populations in origin and destination areas. The emergence of migrantnetworks may help potential migrants of the same ethnic origin, for instance, bycontributing to financing the journey, helping to find a job or appropriate accom-modation, or by giving information about education possibilities or access to socialsecurity (Esveldt et al., 1995). When international migration occurs on a large scaleit can become institutionalized. According to institutional theory, a large inflow ofinternational migrants induces profit and non-profit organizations, which can belegal as well as illegal, to provide items such as (clandestine) transport, labourcontracts, (counterfeit) documents, dwellings or legal advice (Massey et al., 1993).These organizations are often embedded in migrant networks. Considering networkand institutional theory we may formulate hypothesis 4: migrant stocks that arethe result of recent (labour) migration have a positive effect on net internationalmigration. According to this hypothesis an increase in the migrant stock will lead toadditional immigration into both labour importing and labour exporting countries.
The hypotheses are summarized in Table I. Other social, cultural and politicalfactors are important as well. These factors often refer to specific circumstancesand events in individual countries, and they have to be taken into account whenexplaining international migration trends and differences.
Within the extensive international migration literature, empirical research whichattempts to test migration theories is rather scarce. However, two recent studieson international migration in Europe support the hypotheses 1, 2 and 4. Voglerand Rotte (2000) found significant positive effects of GNP per capita (receivingcountry/sending country) and the stock of nationals of the sending country on totalimmigration and asylum migration from African and Asian countries to Germany.According to analyses by Van der Gaag and Van Wissen (1999), unemploymentturned out to be the most important economic indicator of international migrationin Germany, the Netherlands and the UK. In the empirical analyses that follow, wewill test all four hypotheses jointly and for a large number of European countriessimultaneously.

176 ROEL JENNISSEN
Table I. Hypotheses
1 GDP per capita has a positive effect on net international migration.
2 Unemployment has a negative effect on net international migration.
3 Educational level has a positive effect on net international migration.
4 Migrant stocks which are the result of recent (labour) migration have a positive
effect on net international migration.
2.2. REVERSE EFFECTS
Although this paper focuses on the effects of economic factors on internationalmigration, international migration in turn may also have an impact upon economicdevelopments. Some of these will be discussed below. They will be ignored in theempirical analysis to follow, but the fact that they exist implies that our models arenot truly explanatory.
International migration may have an impact upon the economic development ofsending countries if migrant workers remit part of their earnings home to supporttheir family. If labour outflow and consequently remittances experience great upsand downs, the economy of sending countries faces considerable adaptation diffi-culties like inflation or “Dutch disease” (Knerr, 1993). The term “Dutch disease” isused when a country’s apparent good economic fortune ultimately proves to havea net detrimental effect (O’Toole, 1998). On the other hand, apart from the “Dutchdisease” or “migrant syndrome” perspective, Taylor (1999) also distinguishes the“developmentalist” perspective, according to which remittances have a positiveeffect on economic development in sending countries.
International migration may also act upon the economy in sending countries viachanges in the demographic composition, affecting the quality and quantity of thelabour force. An outflow of relatively high skilled workers is called a “brain drain”.Miyagiwa (1991) shows that a brain drain reduces the production in a sending area.
International migration also has an impact on the economy of receiving coun-tries. International migrants eliminating labour shortages in certain branches ofindustry contribute to economic growth (Gieseck et al., 1995). With regard tohuman capital, Van Dalen (1993) argues that migration can only be favourable forreceiving countries if the saving in costs on the education of immigrants outweighsthe so-called capital dilution effect.2
International migration can also change lifestyles of populations in receivingcountries. To the extent that changing lifestyles involve changing saving andconsumer habits or changing forms of investment, this can have an impacton economic developments in receiving countries (Frey and Mammey, 1996;MaCurdy et al., 1998). Saving and consumer habits in countries of origin may beinfluenced by international migration as well. In this respect remittances, return

ECONOMIC DETERMINANTS OF NET INTERNATIONAL MIGRATION IN WESTERN EUROPE 177
migration, and the network of emigrants in the country of origin may be ofimportance (Day and Içduygu, 1999).
3. Data
Absolute net migration has been computed as population growth minus naturalincrease. Division by the midyear population yields net migration rates, whichconstitute the dependent variable (source: Council of Europe, 1999; Eurostat,2000).3
A major advantage of using net migration is that long time series are avail-able for almost all countries. Therefore, net migration patterns can be used asbasic indicator to describe migration developments over time and across coun-tries. However, using (computed) net migration data has also disadvantages. A firstdisadvantage is that we do not know anything about the size of the actual (gross)immigration and emigration flows. Low net migration figures may be the resultof a small inflow and outflow as well as the result of a large inflow and outflow.The decision to migrate takes place at the individual level. In contrast, “net migra-tion” describes a non-existing group of people: the difference between a groupof immigrants and a group of emigrants; the motives to migrate might be quitedifferent between the two groups. A second disadvantage is that peaks and fallsin net migration patterns may be the result of other factors than of real migrationmovements, for instance legalization of clandestines or administrative corrections.If observed net migration (immigration minus emigration) was available, it wascompared with computed net migration. If the differences between the two weretoo large, the data for a particular country were left out of the analysis.4
The year 1990 was a very turbulent year in European (migration) history. Netmigration from the GDR to the FRG could be international as well as internalmigration in this year. Moreover, many people from former communist Europeused their regained freedom to try to emigrate to the West. For consistency andcomparability reasons, the year 1990 was not taken into account in the analyses.
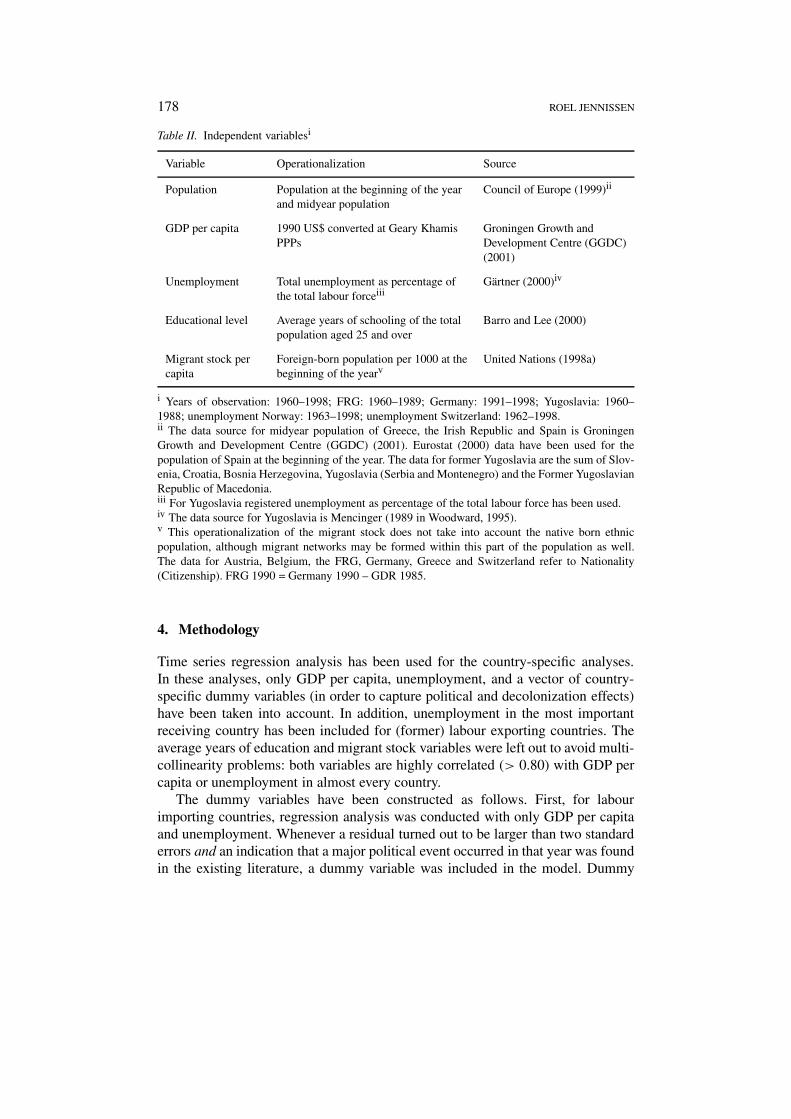
The independent variables that have been used in the analyses are: GDP percapita, unemployment, educational level, and migrant stock per capita. Table IIgives details on data sources and operationalization.
For population, GDP, and unemployment, almost complete data series are avail-able. For educational level and the migrant stock, on the other hand, comparabledata exist for a limited number of years only. Therefore, estimates had to be madeto complete these series. Barro and Lee (2000) estimated the average years ofschooling of the total population aged 25 and over with a 5-year bridge (1960,1965, . . . , 2000). A second order function was fitted to these data to obtaincomplete time series from 1960 until 1998. The Trends in Total Migrant Stockby Sex database of the United Nations (1998a) also has no complete time seriesfrom 1960 until 1998. This database contains data for 1965, 1975, 1985 and 1990.For the remaining years data have been interpolated.5
178 ROEL JENNISSEN
Table II. Independent variablesi
Variable Operationalization Source
Population Population at the beginning of the yearand midyear population
Council of Europe (1999)ii
GDP per capita 1990 US$ converted at Geary KhamisPPPs
Groningen Growth andDevelopment Centre (GGDC)(2001)
Unemployment Total unemployment as percentage ofthe total labour forceiii
Gärtner (2000)iv
Educational level Average years of schooling of the totalpopulation aged 25 and over
Barro and Lee (2000)
Migrant stock percapita
Foreign-born population per 1000 at thebeginning of the yearv
United Nations (1998a)
i Years of observation: 1960–1998; FRG: 1960–1989; Germany: 1991–1998; Yugoslavia: 1960–1988; unemployment Norway: 1963–1998; unemployment Switzerland: 1962–1998.ii The data source for midyear population of Greece, the Irish Republic and Spain is GroningenGrowth and Development Centre (GGDC) (2001). Eurostat (2000) data have been used for thepopulation of Spain at the beginning of the year. The data for former Yugoslavia are the sum of Slov-enia, Croatia, Bosnia Herzegovina, Yugoslavia (Serbia and Montenegro) and the Former YugoslavianRepublic of Macedonia.iii For Yugoslavia registered unemployment as percentage of the total labour force has been used.iv The data source for Yugoslavia is Mencinger (1989 in Woodward, 1995).v This operationalization of the migrant stock does not take into account the native born ethnicpopulation, although migrant networks may be formed within this part of the population as well.The data for Austria, Belgium, the FRG, Germany, Greece and Switzerland refer to Nationality(Citizenship). FRG 1990 = Germany 1990 – GDR 1985.
4. Methodology
Time series regression analysis has been used for the country-specific analyses.In these analyses, only GDP per capita, unemployment, and a vector of country-specific dummy variables (in order to capture political and decolonization effects)have been taken into account. In addition, unemployment in the most importantreceiving country has been included for (former) labour exporting countries. Theaverage years of education and migrant stock variables were left out to avoid multi-collinearity problems: both variables are highly correlated (> 0.80) with GDP percapita or unemployment in almost every country.
The dummy variables have been constructed as follows. First, for labourimporting countries, regression analysis was conducted with only GDP per capitaand unemployment. Whenever a residual turned out to be larger than two standarderrors and an indication that a major political event occurred in that year was foundin the existing literature, a dummy variable was included in the model. Dummy

ECONOMIC DETERMINANTS OF NET INTERNATIONAL MIGRATION IN WESTERN EUROPE 179
variables can be one-year only (e.g., when a former colony became independent)but can also refer to a structural shift (e.g., policies to stop the import of labour).
In the case of collinearity between GDP per capita and unemployment informer labour importing countries, the variable with the largest absolute t-valuewas retained; if both variables were not significant (p > 0.05, one-sided test), thevariable yielding the highest adjusted R2 was selected. For former labour exportingcountries, collinearity between the economic variables was a problem in all cases,since unemployment in the dominant receiving country correlated strongly (> 0.80in absolute terms) with unemployment or GDP per capita. If the model of a formerlabour exporting country could comprise two economic variables, the model withthe most (one or two) significant economic variables was selected. If the modelshad an equal number of significant economic variables, we selected the modelwith the highest average absolute t-value for the economic variables. If the modelcould comprise only one variable, the same method as for former labour importingcountries was used to choose the best model.
If autocorrelation was found in a model, an autoregression term (AR) of thefirst or second order was estimated. However, another (combination of) variable(s)was used if this could avoid the use of an autoregression term of the first or secondorder.
In addition to the country-specific analyses, we also conducted a pooled cross-sectional time series analysis for all Western European countries simultaneously.The aim of this analysis was to find a single effect per variable for all coun-tries. Compared to single time series regression analyses, pooled cross-sectionaltime series analyses have the advantage of more observations. Moreover, pooledcross-sectional time series analyses have the advantage of possible additional infor-mation from differences between countries. In the pooled cross-sectional timeseries no multicollinearity was found between the independent variables, so thatall hypotheses (see section 2) could be tested. The dummy variables used in thecountry-specific analyses were also included in the pooled cross-sectional timeseries analysis. Similar to the country-specific models, the pooled model was alsotested for autocorrelation.
5. Country-specific analyses for former labour importing countries
The former labour importing countries with a population of more than one millionare: Austria, Belgium, Denmark, France, the FRG, the Netherlands, Norway,Sweden, Switzerland and the UK. These countries imported labour until the reces-sion of 1973/1974. Within this group of countries, we will discuss the Dutch casestudy in some detail.

180 ROEL JENNISSEN
Figure 1. Migration pattern of the Netherlands (rates × 1000). Source: Statistics Netherlands(2001).
5.1. THE DUTCH CASE STUDY
Net migration in the Netherlands had been positive for almost the entire period1960–1998 (see Figure 1). The net migration of nationals was predominantlynegative during this period, with the exception of the years preceding the decolon-ization of New Guinea (1962) and Surinam (1970–1975) and the years 1985–1987(Penninx et al., 1994; Statistics Netherlands, 2001). The net migration of foreignershad been positive during the entire period 1960–1998. The pattern of total netmigration corresponds to the pattern of total immigration and even (except for theyears preceding the independence of Surinam) to the pattern of the immigration offoreigners.
Over the period 1960–1998 immigration into the Netherlands graduallyincreased from about 60 thousand to about 110 thousand a year in the 1990s.This increase was mainly caused by increasing immigration of foreigners, whichmore than tripled (from 23 thousand to about 75 thousand) (Eurostat, 1997). Theeconomic situation in the Netherlands improved significantly in the 1960s. Labourshortages caused an inflow from Southern European countries (especially Italy andSpain) to the Netherlands. In the second half of the 1960s, when immigration fromthese countries faded, Turks and Moroccans followed. Return migration amongItalians and Spaniards was significant, stimulated by the favourable economicdevelopment of their native countries. In contrast, return migration among Turksand Moroccans hardly occurred. Instead, they preferred family reunion in theNetherlands. After family reunification in the 1970s, the character of immigration

ECONOMIC DETERMINANTS OF NET INTERNATIONAL MIGRATION IN WESTERN EUROPE 181
of Turks and Moroccans changed again in the 1980s to family formation (marriagemigration). A special year was 1975: there was a large inflow of Surinamesetriggered by the independence of Surinam and also a regularization of clandestines,mainly affecting young Turkish and Moroccan males (De Mas and Hafmans, 1985in Lakeman, 1999). A treaty between Surinam and the Netherlands, whereby Surin-amese could choose between the Dutch and the Surinam nationality until five yearsafter independence, caused a second large inflow of Surinamese in 1979 and 1980(De Beer, 1997). Since the second half of the 1980s increasing numbers of asylumseekers were the main cause of rising immigration figures.6 The number of requestsfor asylum doubled for the years 1990–1992 in comparison with the second halfof the 1980s. This increase was mainly caused by the unstable situation in formerYugoslavia. An even stronger increase took place in 1993 and 1994. The number ofnew requests reached a peak in 1994, probably caused by stricter asylum policiesin surrounding countries (especially in Germany), but also related to the increasinginflow of Somali asylum seekers. In 1995 and 1996 the number of new requestdecreased again to about the level of 1992. This decrease was caused by stricterterms for application for asylum introduced in 1994 and by the Dayton peace-treaty (Nicolaas, 1997). After 1996 the number of new requests increased againas a result of an increase in requests of Iraqi and Afghans (Statistics Netherlands,1999).
In contrast to immigration, emigration was much more stable in the period1960–1998 (50–60 thousand per annum). More than half of the emigrants consistof nationals (30–40 thousand per year, versus 20–25 thousand foreigners) with theexception of the year 1967: the recession of 1967, which actually started in thesecond half of 1966, led already in October 1966 to policy measures of the CalsAdministration (Lakeman, 1999). Between the first of October 1966 and the endof 1967 almost half of the guestworkers in the Netherlands returned (Kayser, 1972in Lakeman, 1999).
In order to take the major political events into account, four dummy variableshave been used in the country-specific analysis for the Netherlands: conflict aboutNew Guinea (1962); policy with respect to the recession of 1967 (1967); independ-ence of Surinam (1975); and five years after the independence of Surinam (1979and 1980). In addition, an autoregressive term of the first order AR(1) was addedto correct for autocorrelation.
Table III gives the results of the time series regression analysis for the Nether-lands. In model A, GDP per capita (positive) and unemployment (negative) havethe expected significant effect on net international migration. Also, all dummyvariables have significant coefficients with the expected sign.
To check whether the dummy variables distort the estimated impact of themacroeconomic variables, we have also estimated the model without dummy vari-ables (model B). Without dummy variables, the significance of the unemploymentvariable disappears, but otherwise the effects of the economic variables hardly

182 ROEL JENNISSEN
Table III. Results of time series regression analysis to explain net migration (rates × 1000) in theNetherlands 1960–1998 (T = 36)
Model A Model B
Coefficients (t-values)
Constant –0.57 (–0.65) –0.43 (–0.36)
Economic variables GDP per capita (x 10−4) 2.22∗∗ (3.16) 2.02∗ (1.95)Unemployment –0.20∗∗ (–2.91) –0.14 (–1.35)
Country-specific Conflict about New Guinea 0.94∗ (1.78) –dummy variables Recession 1967 –1.99∗∗ (–3.75) –
Independence Surinam 3.70∗∗ (6.96) –5 years after Independence 1.74∗∗ (3.66) –Surinam
AR(1) 0.46∗∗ (3.05) 0.30∗ (1.86)
Adjusted R2 0.76 0.20Durbin-Watson statistic 1.72 1.93
∗ significant p < 0.05 (one-sided test).∗∗ significant p < 0.01 (one-sided test).
change. What does change is the adjusted R2, which is much lower in model B,illustrating the considerable effect of political shocks.
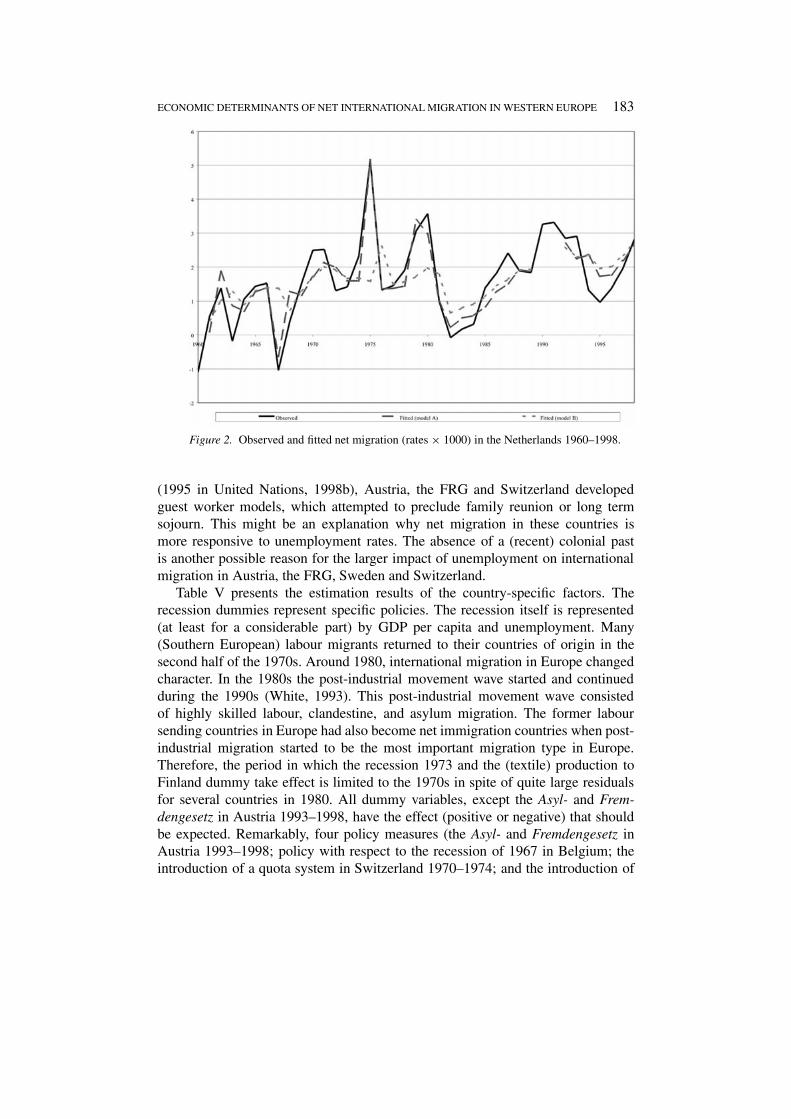
Figure 2 plots the observed and two fitted net migration trends in the Nether-lands. The figure clearly demonstrates that model A fits the migration trend quitewell. However, the model without dummies (B) has large residuals for the yearswith special events. Both curves show no systematic over- or under-estimation.
5.2. OTHER FORMER LABOUR IMPORTING COUNTRIES
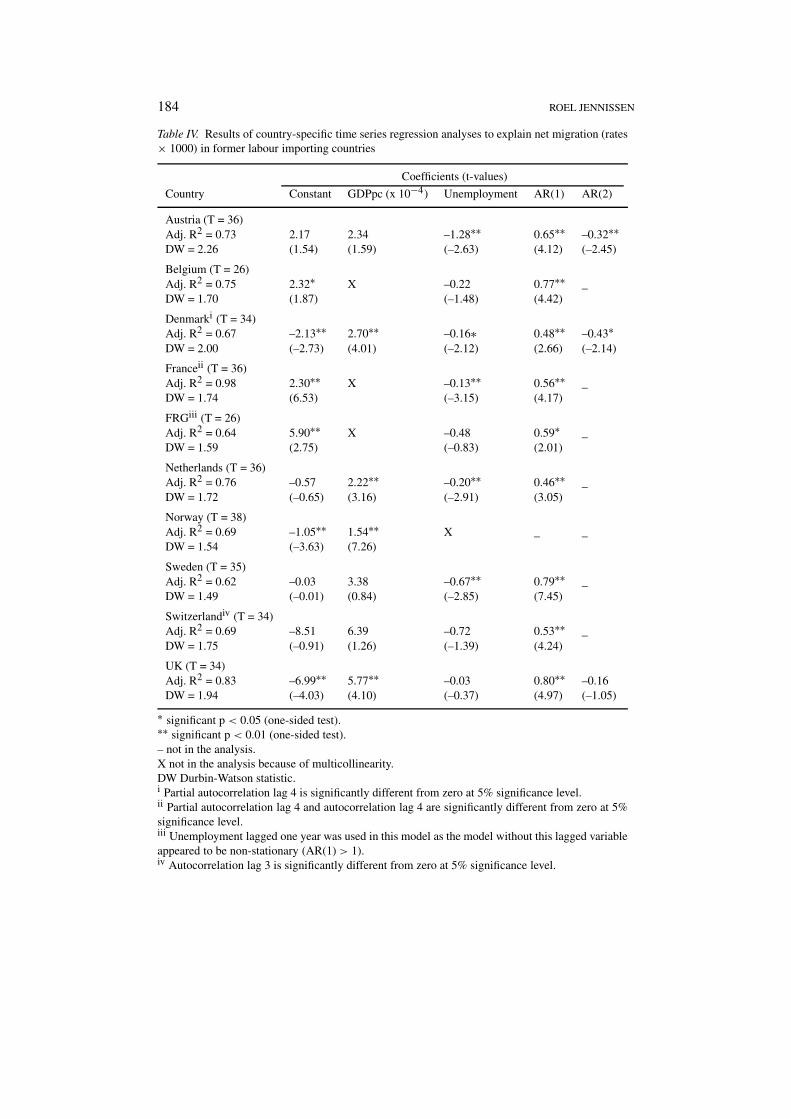
Similar analyses were conducted for the other former labour importing countries.The coefficients of GDP per capita, unemployment and autoregression terms arepresented in Table IV, whereas the country-specific dummy variables are given inTable V.
GDP per capita has a positive, significant effect in four out of seven formerlabour importing countries. The coefficients of GDP per capita in Austria, Swedenand Switzerland are not significant, although the signs are as expected. The coeffi-cients are rather similar. However, the effect of GDP per capita in Switzerland andthe UK is quite larger.
Unemployment has a negative effect on net international migration in all formerlabour importing countries. This effect is significant in Austria, Denmark, France,the Netherlands and Sweden. The impact of unemployment in Belgium, Denmark,France and the Netherlands is rather similar (between –0.10 and –0.25). The coef-ficient is larger in Austria, the FRG, Sweden and Switzerland. According to Lahav
ECONOMIC DETERMINANTS OF NET INTERNATIONAL MIGRATION IN WESTERN EUROPE 183
Figure 2. Observed and fitted net migration (rates × 1000) in the Netherlands 1960–1998.
(1995 in United Nations, 1998b), Austria, the FRG and Switzerland developedguest worker models, which attempted to preclude family reunion or long termsojourn. This might be an explanation why net migration in these countries ismore responsive to unemployment rates. The absence of a (recent) colonial pastis another possible reason for the larger impact of unemployment on internationalmigration in Austria, the FRG, Sweden and Switzerland.
Table V presents the estimation results of the country-specific factors. Therecession dummies represent specific policies. The recession itself is represented(at least for a considerable part) by GDP per capita and unemployment. Many(Southern European) labour migrants returned to their countries of origin in thesecond half of the 1970s. Around 1980, international migration in Europe changedcharacter. In the 1980s the post-industrial movement wave started and continuedduring the 1990s (White, 1993). This post-industrial movement wave consistedof highly skilled labour, clandestine, and asylum migration. The former laboursending countries in Europe had also become net immigration countries when post-industrial migration started to be the most important migration type in Europe.Therefore, the period in which the recession 1973 and the (textile) production toFinland dummy take effect is limited to the 1970s in spite of quite large residualsfor several countries in 1980. All dummy variables, except the Asyl- and Frem-dengesetz in Austria 1993–1998, have the effect (positive or negative) that shouldbe expected. Remarkably, four policy measures (the Asyl- and Fremdengesetz inAustria 1993–1998; policy with respect to the recession of 1967 in Belgium; theintroduction of a quota system in Switzerland 1970–1974; and the introduction of
184 ROEL JENNISSEN
Table IV. Results of country-specific time series regression analyses to explain net migration (rates× 1000) in former labour importing countries
Coefficients (t-values)
Country Constant GDPpc (x 10−4) Unemployment AR(1) AR(2)
Austria (T = 36)Adj. R2 = 0.73 2.17 2.34 –1.28∗∗ 0.65∗∗ –0.32∗∗DW = 2.26 (1.54) (1.59) (–2.63) (4.12) (–2.45)
Belgium (T = 26)Adj. R2 = 0.75 2.32∗ X –0.22 0.77∗∗ _DW = 1.70 (1.87) (–1.48) (4.42)
Denmarki (T = 34)Adj. R2 = 0.67 –2.13∗∗ 2.70∗∗ –0.16∗ 0.48∗∗ –0.43∗DW = 2.00 (–2.73) (4.01) (–2.12) (2.66) (–2.14)
Franceii (T = 36)Adj. R2 = 0.98 2.30∗∗ X –0.13∗∗ 0.56∗∗ _DW = 1.74 (6.53) (–3.15) (4.17)
FRGiii (T = 26)Adj. R2 = 0.64 5.90∗∗ X –0.48 0.59∗ _DW = 1.59 (2.75) (–0.83) (2.01)
Netherlands (T = 36)Adj. R2 = 0.76 –0.57 2.22∗∗ –0.20∗∗ 0.46∗∗ _DW = 1.72 (–0.65) (3.16) (–2.91) (3.05)
Norway (T = 38)Adj. R2 = 0.69 –1.05∗∗ 1.54∗∗ X _ _DW = 1.54 (–3.63) (7.26)
Sweden (T = 35)Adj. R2 = 0.62 –0.03 3.38 –0.67∗∗ 0.79∗∗ _DW = 1.49 (–0.01) (0.84) (–2.85) (7.45)
Switzerlandiv (T = 34)Adj. R2 = 0.69 –8.51 6.39 –0.72 0.53∗∗ _DW = 1.75 (–0.91) (1.26) (–1.39) (4.24)
UK (T = 34)Adj. R2 = 0.83 –6.99∗∗ 5.77∗∗ –0.03 0.80∗∗ –0.16DW = 1.94 (–4.03) (4.10) (–0.37) (4.97) (–1.05)
∗ significant p < 0.05 (one-sided test).∗∗ significant p < 0.01 (one-sided test).– not in the analysis.X not in the analysis because of multicollinearity.DW Durbin-Watson statistic.i Partial autocorrelation lag 4 is significantly different from zero at 5% significance level.ii Partial autocorrelation lag 4 and autocorrelation lag 4 are significantly different from zero at 5%significance level.iii Unemployment lagged one year was used in this model as the model without this lagged variableappeared to be non-stationary (AR(1) > 1).iv Autocorrelation lag 3 is significantly different from zero at 5% significance level.

ECONOMIC DETERMINANTS OF NET INTERNATIONAL MIGRATION IN WESTERN EUROPE 185
Table V. Country-specific effects in time series regression analyses to explain net migration (rates× 1000) in former labour importing countries
Country Year Dummy Source Effect (t-value)
Austria 1968 Recession 1967 United Nations (1998b) –2.47∗∗ (–2.59)
1974–1979 Recession 1973 United Nations (1998b) –3.37∗∗ (–4.17)
1981 Polish asylum seekers Te Brake (1993) 3.01∗ (2.49)
1982 Return/transit Polish Te Brake (1993) –3.23∗∗ (–2.72)asylum seekers
1989 Fall iron curtain 4.39∗∗ (3.46)(Hungary)
1993–1998 Asyl- und Fremdengesetz ICMPD (1994) 0.71 (0.59)
Belgium 1964 Recruitment agreement Abadan-Unat (1995), 1.76∗∗ (3.04)with Turkey and Obdeijn (1993)Morocco
1968 Recession 1967 –0.58 (–1.02)
Denmark 1968 Recession 1967 –1.20∗ (–1.78)
1974–1979 Recession 1973 Pedersen (1999) –0.77∗ (–1.90)
1995 Refugees from Bosnia Pedersen (1999) 2.98∗∗ (4.39)
France 1960–1961 Turmoil in Algeria Barbour (1969) 2.59∗ (2.64)
1962 Independence Algeria Barbour (1969) 16.87∗∗ (24.81)
1963–1964 French troops in Algeriai Barbour (1969) 1.63∗∗ (3.64)
1974–1979 Recession 1973 Seifert (1997) –0.95∗∗ (–3.12)
FRG 1966–1967 Recession 1967 –5.87∗∗ (–2.70)
1974–1979 Recession 1973 Bretz (1996) –3.95∗ (–2.11)(Anwerbestop)
1989 Fall iron curtain 9.82∗∗ (2.88)
Netherlands 1962 Conflict about Penninx et al. (1994) 0.94∗ (1.78)New Guinea
1967 Recession 1967 Lakeman (1999) –1.99∗∗ (–3.75)
1975 Independence Surinam Penninx et al. (1994) 3.70∗∗ (6.96)
1979–1980 5 years after the De Beer (1997) 1.74∗∗ (3.66)independence ofSurinam
Norway 1987 Refugees from 2.09∗∗ (3.60)Sri Lanka and Iran
1993 Refugees from Council of Europe 1.17∗ (2.00)Bosnia (1995)

186 ROEL JENNISSEN
Table V. Continued
Country Year Dummy Source Effect (t-value)
Sweden 1967–1968 Recession 1967 –3.11∗∗ (–3.49)
1971–1979 (textile) production Hammar (1995) –2.17∗∗ (–2.56)to Finlandii
1989 Refugees from 1.20 (1.00)Iraq and Chile
1993–1994 Refugees from former 4.61∗∗ (4.20)Yugoslavia
Switzerland 1970–1974 Quota system United Nations (1998b) –2.46 (–1.47)
1975–1979 Recession 1973 –6.39∗∗ (–3.41)
UK 1987–1998 Visas making family Morris (1998) –0.75 (–1.29)migration difficultiii
∗ significant p < 0.05 (one-sided test).∗∗ significant p < 0.01 (one-sided test).i French troops protecting French citizens in Algeria did not withdraw until 1964 (Barbour,1969). Hence, French citizens had two years time to leave Algeria after the independence.ii From around 1970 the Finnish government started a policy programme to stop the loss ofpopulation and income to Sweden. One policy measure was to encourage Swedish textile indus-tries to start production in Finland in stead of employing Finnish labour in Sweden (Hammar,1995). The results of multivariate regression analyses to explain migration from Sweden toFinland in the period 1963–1975, conducted by Hietala (1978), demonstrate that the encourage-ment of direct investments in Finland by Swedish enterprises was the most effective economicpolicy to stimulate (return) migration from Sweden to Finland.iii The correlation between GDP per capita in the UK and the policy dummy Visas making familymigration difficult is 0.84.
visas for citizens of India, Bangladesh, Ghana, Nigeria and Pakistan in the UK1987–1998) are not significant. This may be an indication that migration policiescould be influenced by or coincide with the economic situation. The dummy vari-able “Refugees from Iraq and Chile” (Sweden 1989) was also not significant. Thisis not surprising as Gustafsson et al. (1990, in Lundh and Ohlsson, 1994) founda clear economic relationship between the Swedish business cycle and familyand asylum immigration of Chileans. The very large and very significant dummy“Algerian independence” (1962) caused a very high adjusted R2 in the model forFrance. The adjusted R2 decreases to 0.78 if the year 1962 is excluded.
6. Country-specific analyses for former labour exporting countries
The former labour exporting countries with a population of more than one millionare: Finland, Greece, the Irish Republic, Italy, Portugal, Spain and Yugoslavia.These countries exported labour until the recession of 1973/1974. Similar to

ECONOMIC DETERMINANTS OF NET INTERNATIONAL MIGRATION IN WESTERN EUROPE 187
Table VI. The dominant receiving countries of former labour exporting countries
Former labour exporting country Dominant receiving country
Finland Sweden
Greece Germany
Irish Republic UK
Italy Switzerlandi
Portugal France
Spain France
Yugoslavia Germany
i The stock of Italian nationals in Switzerland was larger than the stock of Italiannationals in Germany in the 1960s (Schmid, 1983). The stock of Italian nationalsin Germany is larger since 1971 (Council of Europe, 1999; Haug, 2000). However,the increase in the Italian stock in Germany in comparison with the stock inSwitzerland is mainly caused by a larger extent of family migration in Germany.
the analysis of the labour importing countries, in the models for former labourexporting countries only GDP per capita, unemployment and political and colonialdummy variables have been taken into account. The difference in GDP per capitawith Sweden and the UK was also included in the analyses for Finland and the IrishRepublic, respectively. In addition, we also looked at the effect of unemploymentin the dominant receiving countries, listed in Table VI.
6.1. THE SPANISH CASE STUDY
Net migration in Spain was negative until 1974, caused by a large outflow ofSpanish labour migrants. Many former labour migrants returned after the reces-sion of 1973/1974 leading to a positive net migration figure in 1975–1978. In the1980s Spain experienced low net emigration figures. After 1990 net migration waspositive again, when labour immigrants and asylum seekers started to enter Spainon a large scale.
The policies of the early Franco regime were aimed at autarky. This resulted inlow emigration figures in the period after the Second World War until 1959. Thestabilization plan of 1959 liberalized international traffic of physical and humancapital. Emigration to Western Europe was not only allowed, the government evenstimulated it. The Instituto Español de Emigratión (IEE) was founded to encourageemigration. In the peak years (1964, 1969, 1971 and 1972) recorded emigration toEurope exceeded 100 thousand persons. In this period also a considerable numberof emigrants went to America. However, this emigration decreased very fast inthe 1960s and 1970s. After the recession of 1973/1974 emigration decreased to alevel of less than 20 thousand (Spanish) emigrants a year (Dirección General deMigraciones, 1993 in Mansvelt Beck, 1993). In addition to the economic recessionin Western Europe, the fast economic developments in Spain in the first half of the

188 ROEL JENNISSEN
Table VII. Results of time series regression analysis to explain net migration (rates × 1000) inSpain 1960–1998 (T = 33)
Coefficient t-value
Constant –4.52∗∗ –10.67
Economic variable GDP per capita (x 10−7) 3.99∗∗ 9.50
Country-specific variables Stabilization plan –1.51∗ –2.19Recruitment stop 1974 in labour 1.55∗∗ 5.07importing countries
Adjusted R2 0.83Durbin-Watson statistic 1.64
∗ significant p < 0.05 (one-sided test).∗∗ significant p < 0.01 (one-sided test).
1970s (the “Spanish miracle”) contributed to this decrease as well (Mansvelt Beck,1993).
Spanish labour migration to Western Europe appeared to be temporary. Manyformer labour emigrants returned in the period 1975–1978. After the peak year1975, when almost 112 thousand recorded emigrants returned, this flow decreased.In the period 1980–1992 only 220 thousand recorded return migrants enteredSpain. One fourth of these migrants returned from Latin-America (Source: Direc-ción General de Migraciones, 1993 in Mansvelt Beck, 1993). Starting in the secondhalf of the 1970s Spain had to deal with new types of migration. A modest flowof pensioners from Northern and Western Europe migrated to Spain. Moreover,Spain received (mainly young) immigrants from Northern and Western Europewho wanted to work in the tourist industry. Spain joined the European Union in1986. The effects of the integration of Spain in the European Union appearedto be limited (Van der Gaag and Van Wissen, 1999). At the end of the 1980slabour immigrants and asylum seekers appeared at the Spanish border. Most nonEU-12 foreigners came from Morocco, Venezuela and the Philippines. Also forPortuguese Spain was a source of higher wages and better job opportunities (Kingand Rybaczuk, 1993).
The potential independent variables in the Spanish model are GDP per capita,unemployment in Spain, and unemployment in France. All potential independentvariables correlate more than 0.80 in absolute terms with each other. This meansthat the three variables can only separately be estimated. The best model appearedto be the model with GDP per capita. In addition, the Spanish model includestwo dummy variables: the stabilization plan (1960) and the recruitment stop informer labour importing countries after the economic recession of 1973/1974,which materialized in the period 1975–1979. The model needs no autoregressionterm (see Table VII).
ECONOMIC DETERMINANTS OF NET INTERNATIONAL MIGRATION IN WESTERN EUROPE 189
Figure 3. Observed and fitted net migration (rates × 1000) in Spain 1960–1998.
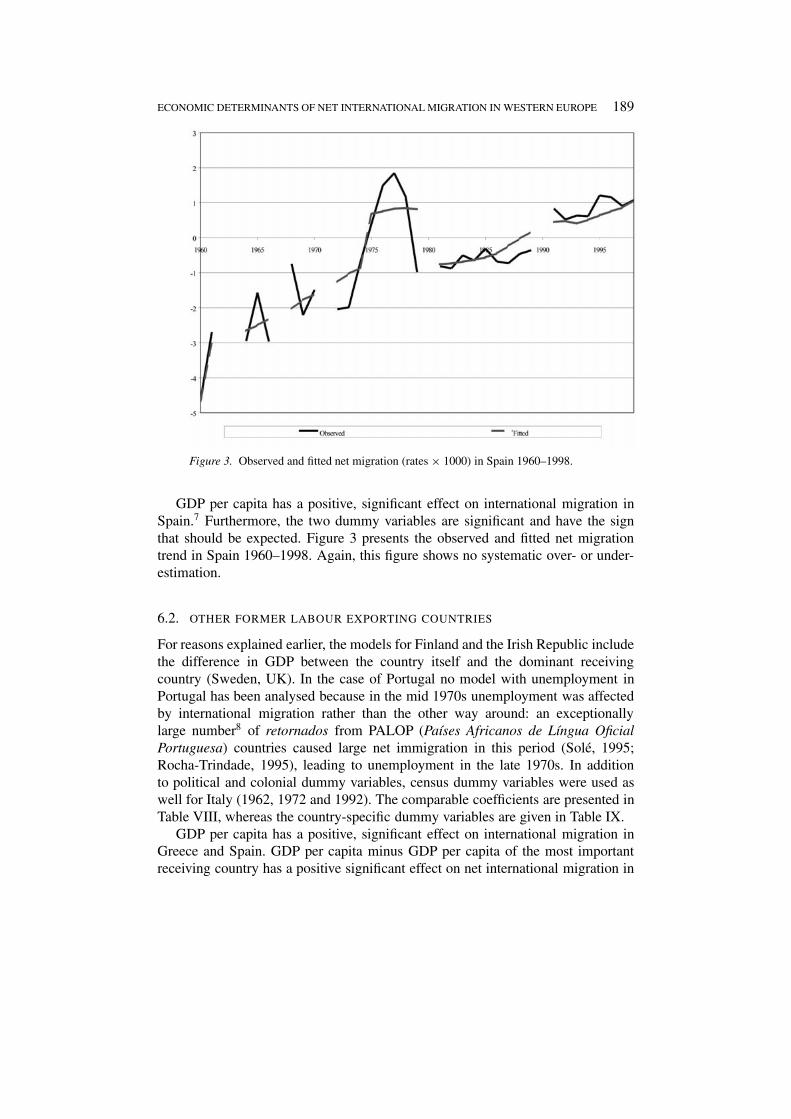
GDP per capita has a positive, significant effect on international migration inSpain.7 Furthermore, the two dummy variables are significant and have the signthat should be expected. Figure 3 presents the observed and fitted net migrationtrend in Spain 1960–1998. Again, this figure shows no systematic over- or under-estimation.
6.2. OTHER FORMER LABOUR EXPORTING COUNTRIES
For reasons explained earlier, the models for Finland and the Irish Republic includethe difference in GDP between the country itself and the dominant receivingcountry (Sweden, UK). In the case of Portugal no model with unemployment inPortugal has been analysed because in the mid 1970s unemployment was affectedby international migration rather than the other way around: an exceptionallylarge number8 of retornados from PALOP (Países Africanos de Língua OficialPortuguesa) countries caused large net immigration in this period (Solé, 1995;Rocha-Trindade, 1995), leading to unemployment in the late 1970s. In additionto political and colonial dummy variables, census dummy variables were used aswell for Italy (1962, 1972 and 1992). The comparable coefficients are presented inTable VIII, whereas the country-specific dummy variables are given in Table IX.
GDP per capita has a positive, significant effect on international migration inGreece and Spain. GDP per capita minus GDP per capita of the most importantreceiving country has a positive significant effect on net international migration in

190 ROEL JENNISSEN
Table VIII. Results of country-specific time series regression analyses to explain net migration(rates × 1000) in former labour exporting countries 1960–1998
Coefficients (t-values)
Country Constant GDPpc (x 10−4) Unempl. Unempl. RC AR(1)
Finland (T = 35) [Fin-Swe]
Adj. R2 = 0.82 3.15∗ 14.71∗∗ –0.04 X 0.65∗∗DW = 1.81 (2.04) (2.88) (–0.36) (4.45)
Greece (T = 38)
Adj. R2 = 0.63 –8.82∗∗ 15.36∗∗ –0.55∗ X 0.30∗DW = 2.12 (–3.75) (5.09) (–1.94) (1.88)
Irish R.i (T = 36) [IR-UK]
Adj. R2 = 0.81 12.56∗∗ 17.34∗∗ –0.60∗ X 0.74∗∗DW = 1.98 (3.54) (2.48) (–1.89) (9.00)
Italy (T = 34) [Switzerland]
Adj. R2 = 0.86 –1.95 1.00 X 0.63∗∗ 0.70∗∗DW = 1.65 (–1.26) (0.80) (3.63) (4.85)
Portugal (T = 36) [France]
Adj. R2 = 0.89 –16.03∗∗ X _ 1.55∗ 0.79∗∗DW = 2.20 (–2.80) (2.43) (7.04)
Spain (T = 33)
Adj. R2 = 0.83 –4.52∗∗ 3.99∗∗ X X _
DW = 1.64 (–10.67) (9.50)
Yugoslavia (T = 27) [FRG]
Adj. R2 = 0.77 –0.52 X X 0.14 0.58∗∗DW = 2.11 (–1.07) (1.21) (4.15)
∗ significant p < 0.05 (one-sided test).∗∗ significant p < 0.01 (one-sided test).– not in the analysis.X not in the analysis because of multicollinearity.DW Durbin-Watson statistic.RC dominant receiving country.i Partial autocorrelation lag 4 is significantly different from zero at 5% significance level.
Finland and the Irish Republic. The coefficients of Finland and the Irish Republicare rather similar, but the coefficients of Greece, Italy and Spain differ considerably.
Unemployment has a significant, negative effect on net international migrationin Greece and the Irish Republic. Unemployment in the most important receivingcountry has a positive, significant effect for Italy and Portugal, and a positive butnon-significant effect for Yugoslavia.

ECONOMIC DETERMINANTS OF NET INTERNATIONAL MIGRATION IN WESTERN EUROPE 191
Table IX. Country-specific effects in time series regression analyses to explain net migration (rates× 1000) in former labour exporting countries
Country Year Dummy Source Effect (t-value)
Finland 1969–1970 Pool after recession 1967 in –7.32∗∗ (–7.30)
labour importing countries
1971–1979 (textile) prod. to Finland Hammar (1995) 1.31 (1.46)
Greece 1969 Pool after recession 1967 in –3.69 (–1.45)
labour importing countries
Italyi 1972 Census 1972 1.56∗∗ (3.21)
1992 Census 1992 1.78∗∗ (3.83)
Portugal 1969 Pool after recession 1967 in –8.90∗∗ (–5.26)
labour importing countries
1974–1975 Independence PALOP Rocha-Trindade (1995) 33.90∗∗ (11.49)
countries
Spain 1960 Stabilization plan Mansvelt Beck (1993) –1.51∗ (–2.19)
1975–1979 Recruitment stop in labour Mansvelt Beck (1993) 1.55∗∗ (5.07)
importing countries
Yugoslavia 1968–1969 Labour agreement with Bretz (1996) –4.09∗∗ (–7.53)
Germany
∗ significant p < 0.05 (one-sided test).∗∗ significant p < 0.01 (one-sided test).i The dummy variable Census 1962 was not in the analysis as unemployment in Switzerland in 1961was not available and the model comprised an autoregression term of the first order.
Similar to the model for former labour importing countries, all dummy variableshave the sign that should be expected. Again most of the dummy variables aresignificant.
7. A pooled model for Western Europe
Two pooled cross-sectional time series models have been estimated: a cross-sectionally heteroskedastic and a cross-sectionally correlated model. The expectederror term in a cross-sectionally heteroskedastic model may vary between cross-sections. Countries with very large net immigration or emigration are expected tohave relatively larger error terms than countries with less extreme net migration.If we assume that general mechanisms underlie international migration processesin countries in a certain area, we may expect that a seemingly unrelated regression(SUR) model, which is a cross-sectionally correlated model, is the most appropriatemodel. Heteroskedasticity is a characteristic of this model too. The differencebetween the two models is that, in contrast to a cross-sectionally heteroskedastic

192 ROEL JENNISSEN
model, a cross-sectionally correlated model assumes that the cross-sectional unitsare mutually dependent (Kmenta, 1986; Judge et al., 1988). However, the empi-rical results show that a seemingly unrelated regression model proved to be abetter model than a cross-sectionally heteroskedastic model (three in stead of twosignificant variables).
Table X present the results for the pooled cross-sectional time series analysis9
for all Western European countries simultaneously, including both former labourimporting and exporting countries. No multicollinearity could be detected inthis model. Therefore, all variables, and thus all hypotheses could be testedsimultaneously.
As we can see in Table X the pooled cross-sectional time series analysis sup-ports the hypotheses 2, 3 and 4: unemployment has a significantly negative effecton net international migration; educational level and the migrant stock have asignificantly positive effect on net international migration. On the other hand, thereis no strong support for hypothesis 1: GDP per capita does have a positive effect onnet international migration, but this effect is not significant. All dummy variablesin the pooled model for Western Europe (except visas making family migrationdifficult in the UK in 1987 and the recruitment stop in labour importing countries inSpain in 1974) have the sign that should be expected. The fact that the latter dummyhas a (very small) negative effect is quite remarkable as this dummy variable hasa significantly positive effect in the country-specific analysis for Spain. All policydummy variables are significant, with only two exceptions (the already mentioneddummy for the UK in 1987–1998 and the immigration restrictions in Germany1993–1998).
8. Conclusions
The aim of this paper was to estimate the influence of economic determinantson net international migration in Western Europe in the period 1960–1998. Theeconomic determinants used are GDP per capita, unemployment and educationallevel. Moreover, the effect of the migrant stock was also taken into account.Country-specific information was included as well, to control for policy and otherinterventions. Not all the effects are significant, but the country-specific and pooledanalyses demonstrate that GDP per capita has a positive effect and unemploymenta negative effect on net international migration. The analyses for Finland and theIrish Republic show that the difference in GDP per capita between a sendingand a receiving country has a positive effect on net international migration in thesending country. The pooled analysis for Western Europe supports the hypothesesthat educational level and migrant stock have a positive effect on net internationalmigration.
Many dummy variables have been used in the analyses to control for country-specific effects. Several of these policy dummy variables are not significant

ECONOMIC DETERMINANTS OF NET INTERNATIONAL MIGRATION IN WESTERN EUROPE 193
Table X. Results of pooled time series regression analysis to explain net migration (rates × 1000)in Western Europe 1960–1998 (N × T = 575)
Country Year Variable Coefficient t-value
Constant –1.23∗ –2.07
GDP per capita (x 10−8) 7.32 1.50
Unemployment –0.08∗∗ –3.92
Years of education 0.26∗∗ 3.98
Migrant stock (x 10−3) 9.57∗∗ 2.59
1 1 Recession 1967 –1.87∗∗ –9.03
2 2 Recession 1973 –0.73∗∗ –3.40
3 3 Pool after recession 1967 in labour –4.11∗∗ –8.05importing countries
4 4 Fall iron curtain 7.85∗∗ 8.11
5 5 Refugees from former Yugoslavia 2.20∗∗ 9.02
Austria 1981 Polish asylum seekers 1.82∗ 2.05
1982 Return/transit Polish asylum seekers –4.87∗∗ –5.52
1993–1998 Asyl- and Fremdengesetz –2.23∗∗ –2.47
Belgium 1964 Recruitment agreement with Turkey and 1.73∗∗ 3.74Morocco
France 1962 Independence Algeria 15.64∗∗ 52.43
1963–1964 French troops in Algeria 1.35∗∗ 4.94
United Germany 1993–1998 Immigration restrictions –1.85 –1.31
Netherlands 1962 Conflict about New Guinea 1.07∗∗ 2.81
1975 Independence Surinam 3.98∗∗ 10.28
1979–1980 5 years after independence Surinam 2.39∗∗ 6.39
Norway 1987 Refugees from Sri Lanka and Iran 2.42∗∗ 6.36
Sweden 1971–1979 (textile) production to Finland –1.46∗∗ –2.73
1989 Refugees from Iraq and Chile 3.01∗∗ 4.11
Switzerland 1970–1974 Quota system –2.29∗ –1.86
UK 1987–1998 Visas making family migration difficult 0.01 0.02
Finland 1971–1979 (textile) production to Finland 1.86∗∗ 3.35
Italy 1962 Census 1962 0.53 1.07
1972 Census 1972 1.70∗∗ 3.72
1992 Census 1992 1.68∗∗ 3.69

194 ROEL JENNISSEN
Table X. Continued
Country Year Variable Coefficient t-value
Portugal 1974–1975 Independence PALOP countries 36.35∗∗ 16.62
Spain 1975–1979 Recruitment stop in labour importing countries –0.04 –0.08
Yugoslavia 1968–1969 Labour agreement with Germany –3.70∗∗ –9.38
AR(1) 0.76∗∗ 31.16
Adjusted R2 0.79
Durbin-Watson statistic 1.89
∗ significant p < 0.05 (one-sided test).∗∗ significant p < 0.01 (one-sided test).1 Austria, 1968; Belgium, 1968; Denmark, 1968; FRG, 1966–1967; the Netherlands, 1967 andSweden, 1967–1968.2 Austria, 1974–1979; Denmark, 1974–1979; France, 1974–1979; FRG, 1974–1979 and Switzer-land, 1975–1979.3 Finland, 1969–1970; Greece, 1969 and Portugal, 1969.4 Austria, 1989 and FRG, 1989.5 Denmark, 1995; Norway, 1993 and Sweden, 1993–1994.
(especially in the country-specific analyses). This might be an indication thateconomic determinants often have an effect on or coincide with migration policies.
A seemingly unrelated regression model of pooled time series of Europeancountries, which assumes that the cross-sectional units are mutually dependent,was the best model to estimate economic determinants of net international migra-tion in Western Europe. Therefore, we may conclude that countries cannot be seenas independent units with respect to international migration. Common unmeasuredunderlying mechanisms may affect international migration in Western Europeancountries. Examples of such underlying mechanisms are the economic positionof Western Europe in relation to the rest of the world or hot spots, which causerefugee flows to Western Europe. In addition, (economic) developments in certainEuropean countries may affect international migration in other European countries.Unemployment in Switzerland, for instance, has a positive, significant effect on netinternational migration in Italy. A similar relation exists between unemployment inFrance and net international migration in Portugal. Furthermore, we saw that thedifference in GDP per capita between the country itself and its most importantreceiving country has a positive, significant effect on net international migration inthe Irish Republic and Finland. In order to study the interrelations between WesternEuropean countries more comprehensively, net migration figures are not appro-priate. Instead a migration matrix of flows to and from each Western Europeancountry, as well as to and from the outside world should be used. Unfortunately,

ECONOMIC DETERMINANTS OF NET INTERNATIONAL MIGRATION IN WESTERN EUROPE 195
international migration data do not (yet) provide the information to construct acomplete table.
Acknowledgements
The author thanks Nicole van der Gaag, Leo van Wissen, Evert van Imhoff, and theanonymous referees for their helpful suggestions and comments. An earlier versionof this paper has been presented at the European Population Conference, Helsinki,June 2001.
Notes1 Yugoslavia did not maintain the communist “rule” of full employment. In response to unemploy-ment, the Yugoslav authorities allowed Yugoslav workers to work abroad.2 The capital dilution effect denotes the detrimental effect of population growth operating via adecrease in the capital/labour ratio, resulting in lower production and consumption per capita.3 For Greece, the Irish Republic, Spain and the UK, Eurostat data have been used, as the Councilof Europe data for these countries are not complete. Recent values for non-register (census) coun-tries are often estimates. The data for former Yugoslavia are the sum of Slovenia, Croatia, BosniaHerzegovina, Yugoslavia (Serbia and Montenegro) and the Former Yugoslavian Republic of Mace-donia.4 The data for Belgium 1961, 1970, 1981, 1988 and 1995, Spain 1962, 1963, 1967 and 1971, Sweden1960 and Yugoslavia 1962 were left out of the analyses for this reason. In addition, the data for theFRG 1970 and Spain 1980 are inexplicably high in comparison with surrounding years and were alsoleft out.5 The difference in the migrant stock between two observations has been distributed over the yearsbetween these observations proportional to the net migration in the period between these observationsfor labour importing countries (except Belgium 1975–1985, Norway 1960–1975 and the UK 1960–1984), Finland 1985–1998, and Greece 1985–1998. The values before 1965 and after 1990 havebeen estimated using the migration stock in 1965 and 1975, and 1985 and 1990, respectively, andnet migration 1965–1975 and 1985-1990, respectively. In case of missing net migration data, theaverage of the four surrounding years (if available) has been used. Net migration rates for Switzerlandbefore 1965 have been divided by two as the migrant stock in 1960 and 1961 became negative. Theintermediate values for former labour exporting countries (except Finland and Greece after 1985),Belgium 1975–1985, Norway 1960–1975 and the UK 1960-1985 are linear estimates between thetwo fixed values. Before 1965 and after 1990 the linear trend between 1965–1975 and 1985–1990,respectively has been extrapolated.6 The relationship between the inflow of asylum seekers and registered immigration is rathercomplex in the Netherlands and far from being one-to-one. An asylum seeker is counted as animmigrant only when he/she registers with the municipal population register, which might neverhappen or only after a considerable time lag.7 The models with unemployment in Spain and unemployment in France also provided a coefficientwhich is significant and has the sign that should be expected. However, the average absolute t-valueis lower in the models with unemployment. Moreover, the model with unemployment in Spain needsan autoregression term of the first order to correct for autocorrelation.8 According to computed net migration figures, Portugal experienced a net migration of 619 thou-sand in the period 1974–1979. This is about 7.2% of the total population in 1974.9 An autoregression term of the first order had to be used to rid the model of autocorrelation.

196 ROEL JENNISSEN
References
Abadan-Unat, N., 1995. ‘Turkish migration to Europe’, in R. Cohen (ed), The Cambridge Survey ofWorld Migration pp. 279–284. Cambridge: Cambridge University Press.
Barbour, N., 1969. ‘Algeria’, in C. Legum, (ed), Africa Handbook pp. 17–37. Harmondsworth:Penguin Books.
Barro, R. J. and Lee, J.-W., 2000. Human Capital Updated Files. Cambridge, MA: CID.Bauer, T. and Zimmermann, K. F., 1995. ‘Modelling international migration: economic and econo-
metric issues’, in R. Van der Erf and L. Heering (eds), Causes of International Migrationpp. 95–115. Luxembourg: Office for Official Publications of the European Communities.
Blau, P. M. and Duncan, O. D., 1967. The American Occupational Structure. New York: The FreePress.
Borjas, G. J. 1989. ‘Economic theory and international migration’, International Migration Review23(3): 457–485.
Bretz, M., 1996. ‘Migration statistics in Germany: sources, concepts and selected results’, Espace,Populations, Sociétés 1996(2/3): 247–256.
Council of Europe, 1995. Recent Demographic Developments in Europe. Strasbourg: Council ofEurope.
Council of Europe, 1999. Recent Demographic Developments in Europe. Strasbourg: Council ofEurope.
Day, L. H. and Içduygu A., 1999. ‘Does international migration encourage consumerism in thecountry of origin? – A Turkish study’, Population and Environment 20(6): 503–526.
De Beer, J., 1997. ‘Internationale migratie: recente ontwikkelingen, achtergronden en veronder-stellingen over de toekomst’, Maandstatistiek van de Bevolking 45(3): 12–29.
De Mas, P. and Hafmans, M. A. F., 1985. De Gezinshereniging van Marokkanen in Nederland, 1968–1984: Een Onderzoek naar de Omvang, de Aard en de Gebieden van Herkomst en Vestiging. DenHaag: Ministerie van Sociale Zaken en Werkgelegenheid.
Dirección General de Migraciones, 1993. Annuario de Migraciones. Madrid: DGM.Esveldt, I., Kulu-Glasgow, I., Schoorl, J. J. and Van Solinge, H., 1995. Migratiemotieven, Migratien-
etwerken en Partnerkeuze van Turken en Marokkanen in Nederland. The Hague: NIDI.Eurostat, 1997. Migration Statistics 1996. Luxembourg: Office for Official Publications of the
European Communities.Eurostat, 2000. NewCronos Database. Luxembourg: Eurostat.Frey, M. and Mammey, U., 1996. Impact of Migration in the Receiving Countries: Germany. Geneva:
International Organisation for Migration.Gärtner, M., 2000. EUR Macro Data. St. Gallen: University of St. Gallen.Gieseck, A., Heilemann, U. and Von Loeffelholz, H., 1995. ‘Economic implications of migration into
the Federal Republic of Germany, 1988–1992’, International Migration Review 29(3): 693–710.Groningen Growth and Development Centre, 2001. GGDC Total Economy Database. Groningen:
GGDC.Gustafsson, B., Zamanian-B, M. M. and Aguilar, R., 1990. Invandring och Försörjning. Uddevalla:
Daidalos.Hammar, T., 1995. ‘Labour migration to Sweden: the Finnish case’, in R. Cohen (ed), The Cambridge
Survey of World Migration pp. 297–301. Cambridge: University Press.Hart, R. A., 1975. ‘Interregional economic migration: some theoretical considerations (Part I)’,
Journal of Regional Science 15(2): 127–138.Haug, S., 2000. Soziales Kapital und Kettenmigration: Italienische Migranten in Deutschland.
Opladen: Leske und Budrich.Hauser, R. M. and Sewell, W. H., 1986. ‘Family effects in simple models of education, occupational
status, and earnings: findings from the Wisconsin and Kalamazoo studies’, Journal of LabourEconomics 4 (supplement): 83–115.

ECONOMIC DETERMINANTS OF NET INTERNATIONAL MIGRATION IN WESTERN EUROPE 197
Hietala, K., 1978. Migration Flows between the Nordic Countries in 1963–1975: An EconometricAnalysis of the Factors behind Them. Paper Presented at the IUSSP Conference on ‘Economicand Demographic Change: Issues for the 1980s’, Helsinki, 28 August–1 September 1978.
International Centre for Migration Policy Development, 1994. The Key to Europe: A ComparativeAnalysis of Entry and Asylum Policies in Western Countries. Stockholm: Swedish Ministry ofCulture.
Jennissen, R. P. W., 2000. Can Economic Determinants Improve the Theoretical Background forInternational Migration Hypotheses? The Hague: NIDI.
Judge, G. G., Hill, R. C., Griffiths, W. E., Lütkepohl, H. and Lee, T.-C., 1988. Introduction to theTheory and Practice of Econometrics: Second Edition. New York: Wiley.
Kayser, B., 1972. Cyclically Determined Homeward Flows of Migrant Workers. Paris: OECD.King, R., 1993. ‘European international migration 1945–1990: a statistical and geographical over-
view’, in R. King (ed), Mass Migration in Europe: The Legacy and the Future pp. 19–39. London:Belhaven.
King, R. and Rybaczuk, K., 1993. ‘Southern Europe and the international division of labour: fromemigration to immigration’, in R. King (ed), The New Geography of European Migrationspp. 175–206. London: Belhaven.
Kmenta, J., 1986. Elements of Econometrics. New York: Macmillan.Knerr, B., 1993. ‘International labour migration: economic implications for the population in the
source country’, in IUSSP, International Population Conference Montreal 1993 pp. 625–650.Liège: IUSSP.
Lahav, G., 1995. Old Values and Changing Frontiers in the European Union: A Study of Attitudes ofMembers of the European Parliament towards Immigration. New York: City University of NewYork.
Lakeman, P., 1999. Binnen Zonder Kloppen: Nederlandse Immigratiepolitiek en de EconomischeGevolgen. Amsterdam: Meulenhoff.
Lundh, C. and Ohlsson, R., 1994. ‘Immigration and economic change’, in T. Bengtsson (ed),Population, Economy, and Welfare in Sweden pp. 87–108. Berlin: Springer-Verlag.
Mac Laughlin, J., 1993. ‘Ireland: an “emigrant nursery” in the world economy’, InternationalMigration 31(1): 149–170.
MaCurdy, T., Nechyba, T. and Bhattacharya, J., 1998. ‘An economic framework for assessingthe fiscal impacts of immigration’, in J. P. Smith and B. Edmonston (eds), The ImmigrationDebate: Studies on the Economic, Demographic and Fiscal Effects of Immigration pp. 13–65.Washington, D.C.: National Academy Press.
Mansvelt Beck, J., 1993. ‘Spanje, van emigratie- naar immigratieland’, Migrantenstudies 9(4): 7–22.Mare, R. D., 1981. ‘Change and stability in educational stratification’, American Sociological Review
46(1): 72–87.Massey, D. S., Arango, J., Hugo, G., Kouaouci, A., Pellegrino, A. and Taylor, J. E., 1993. ‘Theories
of international migration: a review and appraisal’, Population and Development Review 19(3):431–466.
Massey, D. S., Arango, J., Hugo, G., Kouaouci, A., Pellegrino, A. and Taylor, J. E., 1998. Worlds inMotion: Understanding International Migration at the End of the Millennium. Oxford: ClarendonPress.
Mencinger, J., 1989. ‘Privredna reforma i nezaposlenost’, Privredna Kretanja Jugoslavije 1989(3):23–39.
Miyagiwa, K., 1991. ‘Scale economies in education and the brain drain problem’, InternationalEconomic Review 32(3): 743–759.
Morris, L., 1998. ‘Governing at a distance: the elaboration of controls in British Immigration’,International Migration Review 32(4): 949–973.
Nicolaas, H., 1997. ‘Daling van het aantal asielverzoeken zet door in 1996’, Maandstatistiek van deBevolking 45(6): 12–18.
198 ROEL JENNISSEN
Obdeijn, H. L. M., 1993. ‘ “Op weg naar werk ver van huis”: Marokkaanse emigratie in historischperspectief’, Migrantenstudies 9(4): 34–47.
Öberg, S., 1997. ‘Theories on inter-regional migration: an overview’, in H. H. Blotevogel and A. J.Fielding (eds), People, Jobs and Mobility in the New Europe pp. 3–22. Chichester: Wiley.
O’Toole, R., 1998. ‘The Dutch disease’, Student Economic Review 12(4): 1–6.Pedersen, S., 1999. ‘Migration to and from Denmark during the period 1960–1997’, in D. A.
Coleman and E. Wadensjö (eds), Immigration to Denmark: International and National Perspec-tives pp. 148–190. Aarhus: Aarhus University Press.
Penninx, R., Schoorl, J. J. and Van Praag, C., 1994. The Impact of International Migration onReceiving Countries: The Case of the Netherlands. Den Haag: NIDI.
Piore, M. J., 1979. Birds of Passage: Migrant Labour in Industrial Societies. Cambridge: CambridgeUniversity Press.
Rocha-Trindade, M. B., 1995. ‘The repatriation of Portuguese from Africa’, in R. Cohen (ed), TheCambridge Survey of World Migration pp. 337–341. Cambridge: Cambridge University Press.
Seifert, W., 1997. ‘Admission policy, patterns of migration and integration: the German and Frenchcase compared’, New Community 23(4): 441–460.
Schmid, C., 1983. ‘Gastarbeiter in West Germany and Switzerland: an assessment of host society-immigrant relations’, Population Research and Policy Review 2(3): 233–252.
Solé, C., 1995. ‘Portugal and Spain: from exporters to importers of labour’, in R. Cohen (ed), TheCambridge Survey of World Migration pp. 316–320. Cambridge: Cambridge University Press.
Stark, O. and Taylor, J. E., 1989. ‘Relative deprivation and international migration’, Demography26(1): 1–14.
Statistics Netherlands (CBS), 1999. ‘Maandcijfers augustus 1999’, Maandstatistiek van de Bevolking47(11): 87–108.
Statistics Netherlands (CBS), 2001. Statline: The Statistical Database of the Netherlands. Voorburg:CBS.
Taylor, J. E., 1999. ‘The new economics of labour migration and the role of remittances in themigration process’, International Migration 37(1): 63–88.
Te Brake, A. Th. J., 1993. Buitenlanders in Oostenrijk. Den Haag: Ministerie van BuitenlandseZaken.
United Nations, 1998a. Trends in Total Migrant Stock by Sex. New York: United Nations.United Nations, 1998b. International Migration Policies. New York: United Nations.Van Dalen, H. P., 1993, ‘International migration, economic policy and human capital accumulation:
a simulation study’, Economic Modelling 10(4): 417–429.Van der Gaag, N. L. and Van Wissen, L. J. G., 1999. Analysis and Forecasting of International
Migration by Gender, Age, and Major Groups. Part II. Luxembourg: Eurostat.Van Dijk, J., 1986. Migratie en Arbeidsmarkt. Assen/Maastricht: Van Gorcum.Van Eijck, K., 1996. Family and Opportunity: A Sibling Analysis of the Impact of Family Background
on Education, Occupation, and Consumption. Tilburg: Tilburg University Press.Vogler, M. and Rotte, R., 2000. ‘The effects of development on migration: theoretical issues and new
empirical evidence’, Journal of Population Economics 13(3): 485–508.White, P. E., 1993. ‘The social geography of immigrants in European cities: the geography of arrival’,
in R. King (ed), The New Geography of European Migrations pp. 47–66. London: Belhaven.Woodward, S. L., 1995. Socialist Unemployment: The Political Economy of Yugoslavia 1945–1990.
Princeton: Princeton University Press.